Submitted:
12 May 2025
Posted:
13 May 2025
You are already at the latest version
Abstract
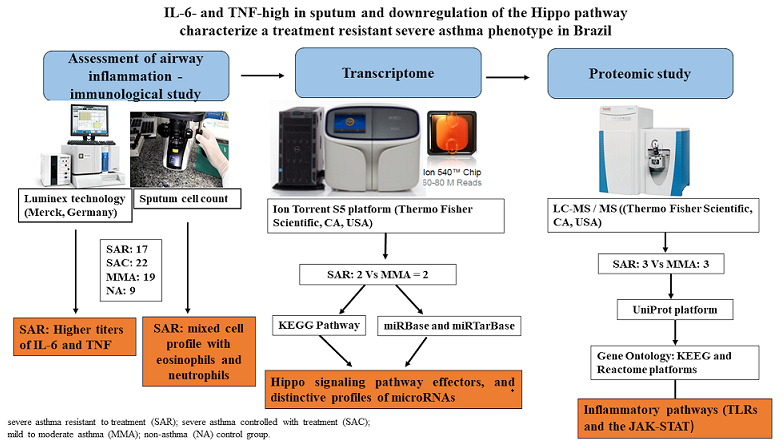
Severe asthma is a heterogeneous condition often resistant to conventional corticosteroid therapy, necessitating the identification of novel biomarkers and therapeutic targets. This study investigates immunological, transcriptional, and proteomic biomarkers in severe asthma patients from the Brazilian ProAR cohort. Cytokines were measured using a multiplex technology (Luminex, Merck) and the differential sputum cell count was performed by cytospin preparations. Sputum transcriptomics was performed by RNA-seq using Ion S5 next-generation sequencing platform (ThermoFisher). The proteomic study of sputum was done by liquid chromatography-tandem mass spectrometry (LC-MS/MS) using Q Exactive Orbitrap technology (ThermoFisher). Compared to mild-to-moderate asthma (MMA) and treatment-controlled severe asthma (SAC), the treatment-resistant severe asthma (SAR) group exhibited increased sputum neutrophilia, eosinophilia, and elevated IL-6 and TNF levels, correlating with impaired lung function. Transcriptomic and proteomic analyses revealed a Th2-independent molecular signature characterized by downregulation of the Hippo signaling pathway and upregulation of JAK-STAT inflammatory cascades. Distinctive microRNA profiles suggest regulatory involvement in inflammatory and proliferative processes. These findings align with prior studies, reinforcing the presence of an IL-6 and TNF-high severe asthma phenotype across diverse populations. Our results highlight key inflammatory pathways that may underlie corticosteroid resistance, offering potential targets for personalized therapeutic interventions in severe asthma.
Keywords:
severe asthma
; sputum induced
; omics
; IL-6
; TNF
; Hippo pathway
; JAK-STAT cascade
; mi-RNAs
; eosinophils
; neutrophils
1. Introduction
Asthma affects approximately 300 million people worldwide, has numerous phenotypes, and is characterized according to clinical profiles, lung function, inflammatory conditions and predominance of immune response [1,2,3]. Severe asthma is a clinical phenotype of asthma that requires treatment with high doses of inhaled corticosteroids in addition to at least one other controller medication (long-acting ß2 agonist, montelukast, or theophylline or oral corticosteroids for longer than 6 months/year) [4,5]; however, control is still suboptimal, exacerbations are frequent and morbidity and health costs are high [6]. Previous studies have suggested the existence of three major severe asthma endotypes: T2-high, T2-low, and a mixed T2/T1/T17. The T2-low and mixed profiles are associated with impaired response to treatment, justifying the search for new biomarkers and new therapeutic targets [7,8]. The Unbiased Biomarkers for the Prediction of Respiratory Disease Outcomes (U-BIOPRED) consortium (European Union) recently suggested that epithelial IL-6 production was associated with a new inflammatory phenotype of treatment-resistant severe asthma [9]. Furthermore, sputum IL-6 showed a positive correlation with TNF-α, IFN-γ, IL-17A, IL-8, and a deficiency of mucosa-associated invariant T (MAIT) cells [10]. Clinical phenotypic similarities have been described when comparing cohorts of the Program for Control of Asthma in Bahia (ProAR) (Brazil) and U-BIOPRED (Europe) cohorts, despite significant ethnic, economic, and environmental differences between the populations of the two studies [2]. In the present study, we describe immunological and transcriptional sputum biomarkers of treatment resistance in severe asthmatic patients followed by ProAR cohort, in Salvador-Bahia, Brazil.
2. Materials and Methods
2.1. Study Design and Sample Selection
This is an evaluation of a subgroup of patients who took part in a case-control study of patients of the severe asthma cohort of the Program for Control of Asthma in Bahia (ProAR), Brazil, which aimed to identify previous exposures and assess current conditions associated with the risk of severe asthma, described elsewhere in detail [2]. The case group was composed of patients with severe asthma, which could be [treatment-resistant severe asthma (SAR) or treatment-controlled severe asthma (SAC)], and two control groups: (i) mild-to-moderate asthma (MMA) and non-asthma group (NA). Patients with severe asthma followed longitudinally at ProAR since 2003 and classified according to the NIH-NHBLI Guidelines for the Diagnosis and Management of Asthma, 1997 [11] and previous definitions of Global Initiative for Asthma [1,12]. The participants with mild to moderate asthma (GINA classification) [13] and the non-asthma were recruited within the community through publicity in the media, in public areas, and in public transportation. The study participants of the control groups were pre-screened by a phone call, according to the inclusion and exclusion criteria. The present study included a subsample of 67 individuals: a) 36 patients with severe asthma; among these, 17 subjects had treatment-resistant severe asthma (SAR) and 19 were patients with treatment-controlled severe asthma (SAC); b) 22 patients with mild-to-moderate asthma (MMA); and c) 9 non-asthma (NA) subjects.
2.2. Ethical and Confidentiality Considerations
This project was approved by the Human Research Ethics Committee of MCO - Faculty of Medicine of Bahia, UFBA (case # 099/2009, additive # 032/2014), as well as by the National Commission for Ethics in Research (case # 450/2010). The study volunteers were informed about the project, the potentials risks and the absence of immediate individual benefits, before they signed a consent. As a social return from the study, the volunteers benefited from the eventual diagnosis of various diseases assessed during their evaluation and were referred for treatment at the public health system (SUS) and outpatient services of the Federal University of Bahia.
2.3. Spirometry - Pulmonary Function Test
The spirometric tests were performed by a trained and qualified physiotherapist certified by the Brazilian Society of Pulmonology and Physiology (SBPT) using a KOKO spirometer (PDS Instrumentation Inc., Louisville, CO, USA), according to the American Thoracic Society (ATS). The procedure followed normality standards specific to Brazilians, following previous publications by the ProAR group [14]. Reversibility to bronchodilator (salbutamol spray 400mcg) inhalation was considered positive when FEV1 increased at least 200 ml and 12% of the prebronchodilator (preBD) values. The choice of the best maneuver was performed manually, only when the test presented quality A or B [14].
2.4. Definition of Atopy (SPT and sIgE)
Skin prick tests (SPTs) were performed on each subject's forearm with puncture sites separated by 2 cm. The antigens tested were extracts of: Alternaria alternata, Aspergillus flavus, Aspergillus niger, Aspergillus fumigatus, Cladosporium herbarum, Dermatophagoides pteronyssinus, Dermatophagoides farinae, Blomia tropicalis, German cockroach, American cockroach, Cat and Dog epithelia, Paspalum notatum, Cynodon dactilon (GREER® Labs, EUA) and (FDA Allergenics, Brazil). Saline and histamine solution were used as negative and positive controls, respectively. The reactions were read after 15 minutes and positive reactions were considered when the mean papule diameter size was at least 3 mm larger than the negative control [14]. Specific IgE (sIgE) concentrations were determined using the ImmunoCAP assay [Phadia Top (Phadia Diagnostics AB, Thermo Fisher Uppsala, Sweden)] for the following aerolergens: Blomia tropicalis (d201) and Dermatophagoides pteronissinus (d1). The results were expressed in kU/L (1 KU/L corresponds to 2.4 ng/ml) obtained using a standard curve produced by serial dilutions of human IgE against a World Health Organization (WHO) standard IgE serum. The individuals who had a mean papule diameter ≥ 3mm than the negative control or a specific IgE ≥0.70 kU/L for an aeroallergen tested were defined as atopic. The established cutoff point of sIgE ≥0.70 kU/L, to assist in defining atopy, followed criteria and parameters established in previous publication by this research group [15].
2.5. Assessment of Airway Inflammation
2.5.1. Sputum Induction and Preparation for Differential Cytology
Sputum induction was performed by nebulization with hypertonic saline according to previous recommendations [16,17]. The procedure was started 10 minutes after administration by inhalation of 200 µg of inhaled salbutamol. Subsequently, a saline aerosol at increasing concentrations of 0.9%, 3%, 4% and 5%, each inhaled for 3 and 4 consecutive minutes until sufficient sputum was obtained for analysis, or until there was a 20% decrease in forced expiratory volume in one second (FEV1) from baseline. Sputum samples were processed and analyzed within the first two hours of collection for the study of molecular markers. The induced sputum was selected by inspection and liquefied in a solution of 5M NaCl (Cath No. S6546; Sigma/Aldrick, Merck KGaA, Darmstadt, Germany) in distilled water, containing ≥ 98% (HPLC), ≥ 99% (titration) 1, 4 DTT - Dithioerythritol (Cath. Nº. D8255; Sigma-Aldrick, Merck KGaA, Darmstadt, Germany) and 1M Herpes (Cat No. BE 17-737E; Lonza, Basel, Switzerland), by centrifugations (400 x G at 4°C for 10 minutes). After centrifugation, the supernatants were collected and cryopreserved at -70ºC for cytokines assays. The cell pellets were diluted, the total cellularity counted in a hemocytometer and the differential cytology obtained in cytospin slides after Wright-Giemsa stainning. Induced sputa were considered appropriated for the study when they had cell viability greater than 50% and oropharyngeal squamous cell contamination less than 20% and the cell count was sufficient to allow differential cytology with a number ≥ 400 cells [17].
2.5.2. Dosage of Cytokines and Chemokines
The measurements of cytokines and chemokines in the induced sputum were performed by Luminex (The MILLIPLEX® Human Cytokine/Chemokine, Merck KGaA; Darmstadt, Germany) according to the manufacturer's guidelines (Merck KGaA; Darmstadt, Germany). The tests were read using Luminex 200 (Total System with the xPONENT 4.2 software). The cytokine and chemokine panel included: eotaxin, rantes, MIP1-α, IL-1β, IL1RA, IL-6, TNF-alpha, Th1 type cytokines (IFN-γ; IL12p40), Th2 (IL-4, IL- 5 and IL-13), Th17 (IL-17A) and regulatory (IL-10) and a cytokine of the IFN-I family (IFN-α2).
2.6. Statistical Analyses
Statistical analyses and graphics production were performed using R software Version for R-3.5.0 for Macintosh and Graphpad Prism V for Windows (Graphpad Software Inc., San Diego, CA, USA). Clinical data, cellularity and dosage of cytokines and chemokines of the induced sputum were analyzed using the nonparametric Kruskal-Wallis test, with Dunn's posttest and Mann–Whitney U-test when appropriate. Correlations were analyzed with the Pearson and Spearman tests. Normality was analyzed prior to between group analyses by Shapiro–Wilk test. A difference was considered significant when P-value ≤ 0.05. PCA (Principal Component Analysis) and t-SNE (t-Distributed Stochastic Neighbor Embedding) analyses were performed with the aim of assessing whether the pattern of cellularity and cytokine production could distinguish groups of individuals according to their different profiles of asthma. After TNF production was detected in the study groups, an analysis was carried out between TNF production and pulmonary function.
2.7. Transcriptome of Induced Sputum
2.7.1. Total RNA Extractions and Sequencing Using Ion Torrent Technology
Total RNA extraction was performed using the RNeasy Mini Kit (Qiagen, Germantown Road, USA) according to the manufacturer's recommendations. Quantitation of total extracted RNA was performed by fluorimetry using Qubit equipment (Life Technologies, Thermo Fisher Scientific, Camarillo, CA, USA). Libraries were generated using Ion Total RNA-Seq Kit v2 (Catalog Number: 4475936, Life Technologies, Thermo Fisher Scientific, Camarillo, CA, USA) as recommended by the manufacturer. The library was amplified in emulsified medium using polymerase and deoxynucleotides in the presence of microspheres that have a universal primer attached to their surface. After amplification, ready-to-prepare templates for sequencing chip preparation and loading (the Ion 540 ™ Chip Kit - Catalog Number: A27766, Life Technologies, Thermo Fisher Scientific, Camarillo, CA, USA) were inserted into the Ion Torrent Technology Platform.
2.7.2. Functional Annotation of Genes and miRNAs
The genome annotation, and gene ontology sets for Homo sapiens were obtained from the ensemble database (https://www.ensembl.org), version GRCh38. Gene ontologies were separated by ontology domains. Data on metabolic pathway annotations were obtained from the KEGG PATHWAY database (https://www.genome.jp/kegg/pathway.html). Gene ontology and metabolic pathway data have been formatted as required to be used as input data for analysis in the GSEA tool [18] and are available as the go_gene_sets and kegg_gene_sets objects in the aaegdata package. Mature microRNA and precursor sequences were obtained from the miRBase database (http://www.mirbase.org/) version 22.1.
2.7.3. Differential Expression Analysis of Genes and miRNAs
The gene expression quantification data generated by Salmon were imported into the R analysis environment using tximport [19]. Gene expression was estimated by considering the total transcription of each gene or precursor miRNAs. Differentially expressed genes and miRNAs were determined by fitting the fragment count data to a generalized linear model, GLM, of the negative binomial distribution, considering a significance level of 5% for the Wald test basically as implemented in the DESeq2 tool [20]. The significance value was corrected by the false positive discovery method by multiple comparison test with a 20% false positive discovery rate. The functions of differentially expressed miRNAs were studied through the website (https://mpd.bioinf.uni-sb.de/).
2.7.4. Gene Set Enrichment Analysis
Using the ranking by the fold value1 of the differential expression of genes in each population, the gene pool enrichment analysis was performed according to Subramanian et al. 2005 [18], and implemented by the fgsea package. The results were selected considering the gene set enrichment and significance.
2.8. Proteomic Study of Induced Sputum
2.8.1. In Solution Analysis of Induced Sputum
Induced sputa were digested with the ProteoExtract All-in-One Trypsin Digestion Kit (EMD Millipore, Billerica, MA, USA) and desalted using C18ZipTips (EMD Millipore, Billerica, MA, USA). Peptides were separated by reverse-phase nano-HPLC (Dionex Ultimate 3000, Thermo Fisher Scientific, Bremen, Germany, column: PepSwift Monolithic Nano Column, 100 μM x 25 cm, Dionex). The column was developed with an acetonitrile gradient (Solvent A: 0.1% (v/v) FA/0.01% (v/v) TFA/5% (v/v) ACN; solvent B: 0.1% (v/v) FA/0.01% (v/v) TFA/90% (v/v) ACN; 5–45% B in 60 min) at a flow rate of 1 μl/min at 55°C). The HPLC was directly coupled via nano electrospray to a Q Exactive Orbitrap mass spectrometer (Thermo Fisher Scientific). Capillary voltage was 2 kV. For peptide assignment, a top 12 MS/MS method was used with the normalized fragmentation energy set to 27%.
2.8.2. Identification, Functional Classification, and Data Analyses of Induced Sputum
The generated MS/MS data were analyzed with PEAKS Studio X+ (Bioinformatics Solutions, Waterloo, ON, Canada). Searches were done with the human sequence subset of UniProt (www.uniprot.org), FDR was set to 0.5%. Data are available via ProteomeXchange with identifier PXD020576. Search of total protein content and analyses of Biological process, Molecular function and Cellular localization. The second analysis was performed to identify the differentially enriched pathways between the two asthma groups. The website tools used were: UniProt (https://www.uniprot.org/uploadlists/) to acquire the identifier gene and the Gene Ontology - gProfiler (https://biit.cs.ut.ee/gprofiler/gost) for performs functional enrichment analysis. Each group analyzed was composed of three samples with proteomes carried out individually. The pathway enrichment analysis used the following statistical parameters: only annotated genes, threshold (P = 0.05) and subsequent Bonferroni correction. The data sources were the KEEG and Reactome platforms.
3. Results and Discussion
3.1. Phenotypic Characterization of the Studied Population
We analyzed a subsample of a case-control study (n = 67) followed by ProAR, Brazil. The main characteristics of the studied population have been published elsewhere [2,21]. First, in 2020, a study was released presenting the clinical characteristics of the ProAr and U-BRIOPRED cohorts [2]. More recently, a new study was published, including two additional severe asthma cohorts: the Severe Asthma Research Program (SARP) in the United States and the Cohort for Reality and Evolution of Adult Asthma in Korea (COREA) [21]. The clinical characteristics of the subsample that constitutes the four studied groups (SAR = 17, SAC = 22, MMA = 19, and NA = 9) are presented in Table 1. The study population was predominantly composed by female non-smoker subjects. No significant differences were observed regarding age at onset of symptoms and presence of atopy, when comparing asthma groups (SAR, SAC, MMA) and control without asthma (NA) (Table 1). Pulmonary function, in turn, was significantly more impaired in the severe asthma profiles (SAR and SAC) when compared to both MMA and NA groups (Table 1).
Groups - SAR: treatment-resistant severe asthma; SAC: treatment-controlled severe asthma; MMA: mild-to-moderate asthma; NA: non-asthma control group. Smoking (C: current smoker, E: ex-smoker, N: never smoker). Pulmonary Function: FVC - forced vital capacity; FEV1 - forced expiratory volume in 1s; FEF forced expiratory flow. Allergy status was assessed by skin prick test or immunoCAP test for aeroallergens. The variables age at onset of symptoms and spirometry data from the pulmonary function test were presented as mean and standard deviation (mean ±SD). Clinical data, pulmonary function test data, and cellularity of the induced sputum were analyzed using the nonparametric Kruskal-Wallis tests and Dunn's posttest. *P ≤ 0.05; ##P ≤ 0.01; ***P ≤ 0.001. The cellularity of the induced sputum was not performed in four patients (SAC: two; SAR: two) and one of the control subject.
The induced sputa of subjects in the group with SAR showed lower percentages of macrophages and higher percentages of neutrophils as compared with individuals with mild to moderate asthma (MMA) (P = 0.0152; P= 0.0138, respectively) (Figure 1A,B; Table 1); additionally, a significantly higher percentage of eosinophils in sputum was observed in SAR, when compared to NA (P = 0.0125) (Figure 1A,B). We evaluated the production of fifteen cytokines and chemokines in the induced sputum of all studied subjects, using Luminex multiplex technology. The complete cytokine and chemokine profiling for all individuals is presented in Table S1. Overall, we found that individuals with SAR have significantly higher TNF and IL-6 productions when compared to phenotype of SAC (P-values = 0.0154 and 0.0262, respectively) and MMA group (P-values = 0.001 and 0.0476, respectively) (Figure 1C,D). Noteworthy, there is a high positive correlation between IL-6 and TNF (r= 0.81, P= 5.7e-16) (Figure 1E) and of these cytokines with IL-1β: IL-6 and IL-1β (r=0.66, P= 5e-9); TNF and IL-1β (r = 0.62; P= 5e-08) (Figures S1 and S2).
Additionally, cluster analysis of the different groups based on the profile of sputum cellularity and productions of cytokines and chemokines, shows distinctive groupings for SAR patients in comparison to all other studied groups (SAC, MMA, NA), either by principal component analysis (PCA) or t-Distributed Stochastic Neighbor Embedding (t-SNE) (Figure 2A,B respectively). A high production of proinflammatory cytokines in the sputum seems to be an unifying characteristics of the individuals in the SAR phenotype, whereas the proportions of predominant cell types (eosinophils or macrophages) is an important component contributing for differentiation within the group (Figure 2A). The observed grouping of individuals in the SAC and MMA asthma types with individuals in the NA group might be partially explained by the control of the inflammatory response and symptoms with corticosteroids (Figure 2A,B).
In our study, individuals with high TNF and IL-6 detected in sputum showed worse lung function before and after the use of bronchodilators (Figures S3–S5). Britt et al. (2019) using an airway smooth muscle (ASM) model, observed that the presence of TNF-α/IFN-γ increased the chemokines secretion, expression of NF-κB subunit (p65) and Stat1 phosphorylation and the effect persisted in the presence of fluticasone propionate [22]. In the U-BIOPRED study, asthma patients with high IL-6TS expression had frequent exacerbations, eosinophilia, inflammation, and markers of airway remodeling [9]. Furthermore, the severe asthma phenotype had molecular markers associated with innate immune response and absence of the typical Th2 gene expression signatures [9,10].
3.2. Molecular Signature of Severe Treatment-Resistant Asthma
To characterize the molecular signatures associated with the IL-6 high / TNF-high phenotype in our study, we performed transcriptome analysis by next generation sequencing (RNA-seq) of total RNA extracted from sputum of a sub sample of patients in the severe asthma resistant group (SAR=2), in comparison to the mild to moderate asthma group (MMA=2) (Figure 3A– D). It is noticeable that gene signatures previously shown to be associated with Th2-molecular phenotypes of asthma [23] are not significantly up-regulated in our samples (Figure 3A), similarly to the molecular profiling of IL-6TS high subset in the European U-BIOPRED cohort study [9]; our finding corroborates the hypothesis that the severe asthma phenotype in the IL6- and TNF-high patients in our study is also Th2-independent. Gene set enrichment analysis showed distinctive “pathway signatures” of the severe asthma resistant when compared to mild-to-moderate asthma (Figure 3B). These included over-representation of genes involved in Toll-like receptors signaling pathways and vascular smooth muscle contraction, besides significant under-representation of the Hippo signaling pathway effectors (Figure 3B). Canonical signaling through the Hippo pathway requires phosphorylation of the MST1/2 or MAP4Ks kinase modules and activation of the LATS1/2 kinases, responsible for phosphorylation-based inhibition of YAP/TAZ co-activators, promoting cytoplasmic sequestration or proteasomal degradation [24,25] (Figure 4). However, if the Hippo pathway is down-regulated, the hypo-phosphorylated YAP/TAZ shifts to the nucleus and activates mechanisms of cell proliferation, survival, cell plasticity, proinflammatory cytokine production (including IL-6, TNF, and IL1-β) and tissue regeneration [26,27,28,29]. Indeed, we noticed positive regulation of pathways related to the production of proinflammatory cytokines and chemokines in patients with SAR phenotype (Figure 3B).
Highly distinctive miRNA profiles were also observed when comparing small non-coding RNAs of the SAR and MMA groups (Figure 3C). Particularly, two microRNAs (hsa-mir-4508 and hsa-mir-3945), were significantly up-regulated in the SAR group (Table S3), whereas other five miRNAs (hsa-let-7b, hsa-mir-451a, hsa-mir-6891, hsa-mir-486 and hsa-mir-181b-2) were significantly down-regulated in this group (Table S3). These latter microRNAs are key modulators of important inflammatory mechanisms (see Table S3), and a decreased expression in subjects with severe asthma, in particular four of these miRNAs (hsa-let-7b, hsa-mir-451a, hsa-mir-6891, hsa-mir-486), may contribute to modulation of the Hippo signaling pathway and regulatory cascades, such as TGF-β, p53, FoxO (forkhead box O), and MAPK (mitogen-activated protein kinase) [30,31] (Table S3). Indeed, analysis of genes controlled by the miRNAs differently expressed between the asthma groups showed highly significant enrichment to many of these cascades endorsing their involvement on the observed profiles (Figure 3D). Finally, shotgun proteomic analysis of the induced sputa of these patient sub-samples reinforced the transcriptional findings, as fewer proteins associated with the Hippo cascade were detected in sputum of SAR patients in comparison to MMA, whereas inflammatory cascades associated with the JAK-STAT signaling pathway and also with autoimmune responses appeared more enriched in severe asthma patients (Figure 3E; Table S3). Corroborating our findings, previous studies suggested the mechanistic involvement of the Hippo cascade in the transformation of CD4+ cells, as well as the association of the molecule with YAP and increased susceptibility to asthma in mouse model [32,33,34]. Furthermore, many studies in animal models for airway inflammation/asthma have shown that the modulating action on the JAK/STAT cascade reduces infiltration into lung tissue and suppresses cell differentiation towards Th1, Th2, Th17 profiles, resulting in improved inflammatory conditions [35,36,37].
In summary, observations among subjects of a Brazilian cohort of severe asthma strongly corroborates recent findings of other asthma cohort studies in the northern hemisphere and Asia, concerning the existence of an IL-6-high severe asthma phenotype, with eosinophilia and neutrophilia in sputum, besides reduced expression of genes and immune biomarkers associated with a typical Th2-signature [9,10]. It is important to emphasize that Brazil is a tropical country, with an admixed population with significant African genetic ancestry, unlike European and Asian populations. In addition, the ProAR severe asthma cohort is composed of individuals from underprivileged communities, which differ from the individuals evaluated by U-BIOPRED. In conclusion, our findings corroborate the existence of a severe asthma phenotype with high levels of IL6 and TNF, resistant to corticosteroid therapy, with a low Th2 profile, downregulation of the Hippo pathway in the lung epithelium, and high activity of the JAK-STAT inflammatory cascade.
Supplementary Materials
The following supporting information can be downloaded at the website of this paper posted on Preprints.org.
Author Contributions
N.M.A.-N., L.G.C.P., Á.A.C. and E.M.M.A.B. contributed to the design and planning of the study. Á.A.C. led the implementation of the cohort and P.C.A. coordinated the collection and processing of samples. E.M.M.A.B., P.C.A., F.A.S., E.S.S., D.J.P.G.R., J.M., C.S.P., P.B., F.F., Á.A.C., L.G.C.P., and N.M.A.-N. were involved in the design and/or execution of the immunological and omics assays. L.G.C.P., ERGRA, E.M.M.A.B., C.S.P. and L.R.Q. contributed to the planning and/or execution of the statistical and bioinformatics analyses. N.M.A.-N., L.G.C.P., E.R.G.R.A., and E.M.M.A.B. participated in drafting the manuscript. The study was conducted under the supervision of N.M.A.-N. and L.G.C.P. All authors have read and agreed to the published version of the manuscript.
Funding
This research was funded by CNPq - ProAR CNPq – Grant # 471057/2014-2 (to A. Cruz), Universal CNPq - 431731/2016-0 (to N. Alcantara-Neves).
Institutional Review Board Statement
This project was approved by the Human Research Ethics Committee of MCO - Faculty of Medicine of Bahia, UFBA (case # 099/2009, additive # 032/2014), as well as by the National Commission for Ethics in Research (case # 450/2010).
Informed Consent Statement
Informed consent was obtained from all subjects involved in the study. The study volunteers were informed about the project, the potentials risks and the absence of immediate individual benefits, before they signed a consent.
Data Availability Statement
Details on the availability of transcriptome and proteome data from our study samples are described in the materials and methods section.
Acknowledgments
The authors want to thank the Brazilian agencies (FAPESB, CNPq, CAPES and FINEP/CT-INFRA), ProAR Foundation as well as the University of Salzburg’s Priority Program Allergy-Cancer-BioNano Research Centre that supported this work and all the individuals and parents or tutors who have agreed to participate in this work. We acknowledge the technical support from the Núcleo de Genômica e Proteômica aplicadas à Saúde (NGP-Saúde, UFBA). Á.A.C., L.G.C.P. and N.M.A.-N. are recipients of research fellowships from CNPq.
Conflicts of Interest
The authors declare that they have no relevant conflicts of interest. The funders had no role in the design of the study; in the collection, analyses, or interpretation of data; in the writing of the manuscript; or in the decision to publish the results.
References
- Bateman, E.D.; Hurd, S.S.; Barnes, P.J.; Bousquet, J.; Drazen, J.M.; FitzGerald, M.; Gibson, P.; Ohta, K.; O'Byrne, P.; Pedersen, S.E.; et al. Global strategy for asthma management and prevention: GINA executive summary. Eur. Respir. J. 2008, 31, 143–178. [Google Scholar] [CrossRef] [PubMed]
- Cruz, A.A.; Riley, J.H.; Bansal, A.T.; Ponte, E.V.; Souza-Machado, A.; Almeida, P.C.; Biao-Lima, V.; Davis, M.; Bates, S.; Adcock, I.M.; et al. Asthma similarities across ProAR (Brazil) and U-BIOPRED (Europe) adult cohorts of contrasting locations, ethnicity and socioeconomic status. Respir. Med. 2020, 161, 105817. [Google Scholar] [CrossRef] [PubMed]
- Rajvanshi, N.; Kumar, P.; Goyal, J.P. Global Initiative for Asthma Guidelines 2024: An Update. Indian Pediatr. 2024, 61, 781–786. [Google Scholar] [CrossRef]
- Chung, K.F.; Wenzel, S.E.; Brozek, J.L.; Bush, A.; Castro, M.; Sterk, P.J.; Adcock, I.M.; Bateman, E.D.; Bel, E.H.; Bleecker, E.R.; et al. International ERS/ATS guidelines on definition, evaluation and treatment of severe asthma. Eur. Respir. J. 2014, 43, 343–373. [Google Scholar] [CrossRef] [PubMed]
- Lommatzsch, M.; Virchow, J.C. Severe asthma: definition, diagnosis and treatment. Dtsch Arztebl Int 2014, 111, 847–855. [Google Scholar]
- Agache, I. Severe asthma phenotypes and endotypes. Semin. Immunol. 2019, 46, 101301. [Google Scholar] [CrossRef]
- Agache, I.; Strasser, D.S.; Pierlot, G.M.; Farine, H.; Izuhara, K.; Akdis, C.A. Monitoring inflammatory heterogeneity with multiple biomarkers for multidimensional endotyping of asthma. J. Allergy Clin. Immunol. 2018, 141, 442–445. [Google Scholar] [CrossRef]
- Peters, M.C.; Ringel, L.; Dyjack, N.; Herrin, R.; Woodruff, P.G.; Rios, C.; O’connor, B.; Fahy, J.V.; Seibold, M.A. A Transcriptomic Method to Determine Airway Immune Dysfunction in T2-High and T2-Low Asthma. Am. J. Respir. Crit. Care Med. 2019, 199, 465–477. [Google Scholar] [CrossRef]
- Jevnikar, Z.; Östling, J.; Ax, E.; Calvén, J.; Thörn, K.; Israelsson, E.; Öberg, L.; Singhania, A.; Lau, L.C.; Wilson, S.J.; et al. Epithelial IL-6 trans-signaling defines a new asthma phenotype with increased airway inflammation. J. Allergy Clin. Immunol. 2019, 143, 577–590. [Google Scholar] [CrossRef]
- Chen, Q.; Nian, S.; Ye, Y.; Liu, D.; Yu, H.; Xiong, H.; Pan, B.; Xiao, L.; Fan, C.; Yuan, Q. The Emerging Roles of T Helper Cell Subsets and Cytokines in Severe Neutrophilic Asthma. Inflammation 2022, 45, 1007–1022. [Google Scholar] [CrossRef]
- National Asthma, E.; Prevention, P. Expert Panel Report 3 (EPR-3): Guidelines for the Diagnosis and Management of Asthma-Summary Report 2007. J Allergy Clin Immunol 2007, 120 (Suppl. 5), S94–138. [Google Scholar]
- Kroegel, C. Global Initiative for Asthma Management and Prevention--GINA 2006. Pneumologie 2007, 61, 295–304. [Google Scholar] [CrossRef] [PubMed]
- Boulet, L.-P.; FitzGerald, J.M.; Levy, M.L.; Cruz, A.A.; Pedersen, S.; Haahtela, T.; Bateman, E.D. A guide to the translation of the Global Initiative for Asthma (GINA) strategy into improved care. Eur. Respir. J. 2012, 39, 1220–1229. [Google Scholar] [CrossRef]
- Almeida, P.C.A.; Ponte, E.V.; Souza-Machado, A.; Cruz, A.A. Longitudinal trends in clinical characteristics and lung function of patients with severe asthma under treatment in Brazil. BMC Pulm. Med. 2016, 16, 1–9. [Google Scholar] [CrossRef] [PubMed]
- Mendonça, L.R.; Veiga, R.V.; Dattoli, V.C.C.; Figueiredo, C.A.; Fiaccone, R.; Santos, J.; Cruz, Á.A.; Rodrigues, L.C.; Cooper, P.J.; Pontes-De-Carvalho, L.C.; et al. Toxocara seropositivity, atopy and wheezing in children living in poor neighbourhoods in urban Latin American. PLOS Neglected Trop. Dis. 2012, 6, e1886. [Google Scholar] [CrossRef]
- Pizzichini, E. , et al. Safety of sputum induction. Eur Respir J Suppl 2002, 37, 9s–18s. [Google Scholar]
- Moritz, P. , et al. Determination of the inflammatory component of airway diseases by induced sputum cell counts: use in clinical practice. J. Bras. Pneumol. 2008, 34, 913–21. [Google Scholar] [CrossRef]
- Subramanian, A.; Tamayo, P.; Mootha, V.K.; Mukherjee, S.; Ebert, B.L.; Gillette, M.A.; Paulovich, A.; Pomeroy, S.L.; Golub, T.R.; Lander, E.S.; et al. Gene set enrichment analysis: A knowledge-based approach for interpreting genome-wide expression profiles. Proc. Natl. Acad. Sci. USA 2005, 102, 15545–15550. [Google Scholar] [CrossRef]
- Soneson, C.; Love, M.I.; Robinson, M.D. Differential analyses for RNA-seq: transcript-level estimates improve gene-level inferences. F1000Res 2015, 4, 1521. [Google Scholar] [CrossRef]
- Love, M.I.; Huber, W.; Anders, S. Moderated estimation of fold change and dispersion for RNA-seq data with DESeq2. Genome Biol 2014, 15, 550. [Google Scholar] [CrossRef]
- Park, S.-Y.; Fowler, S.; Shaw, D.E.; Adcock, I.M.; Sousa, A.R.; Djukanovic, R.; Dahlen, S.-E.; Sterk, P.J.; Kermani, N.Z.; Calhoun, W.; et al. Comparison of Asthma Phenotypes in Severe Asthma Cohorts (SARP, U-BIOPRED, ProAR and COREA) From 4 Continents. Allergy Asthma Immunol. Res. 2024, 16, 338–352. [Google Scholar] [CrossRef] [PubMed]
- Britt, R.D.; Thompson, M.A.; Sasse, S.K.; Pabelick, C.M.; Gerber, A.N.; Prakash, Y.S. Th1 cytokines TNF-α and IFN-γ promote corticosteroid resistance in developing human airway smooth muscle. Am. J. Physiol. Cell. Mol. Physiol. 2019, 316, L71–L81. [Google Scholar] [CrossRef] [PubMed]
- Kuo, C.-H.S.; Pavlidis, S.; Loza, M.; Baribaud, F.; Rowe, A.; Pandis, I.; Hoda, U.; Rossios, C.; Sousa, A.; Wilson, S.J.; et al. A Transcriptome-driven Analysis of Epithelial Brushings and Bronchial Biopsies to Define Asthma Phenotypes in U-BIOPRED. Am. J. Respir. Crit. Care Med. 2017, 195, 443–455. [Google Scholar] [CrossRef] [PubMed]
- Oceandy, D.; Amanda, B.; Ashari, F.Y.; Faizah, Z.; Aziz, M.A.; Stafford, N. The Cross-Talk Between the TNF-α and RASSF-Hippo Signalling Pathways. Int. J. Mol. Sci. 2019, 20, 2346. [Google Scholar] [CrossRef]
- Yamauchi, T.; Moroishi, T. Hippo Pathway in Mammalian Adaptive Immune System. Cells 2019, 8, 398. [Google Scholar] [CrossRef]
- Lu, L.; Li, Y.; Kim, S.M.; Bossuyt, W.; Liu, P.; Qiu, Q.; Wang, Y.; Halder, G.; Finegold, M.J.; Lee, J.-S.; et al. Hippo signaling is a potent in vivo growth and tumor suppressor pathway in the mammalian liver. Proc. Natl. Acad. Sci. 2010, 107, 1437–1442. [Google Scholar] [CrossRef]
- Fodor, L.E.; Gézsi, A.; Ungvári, L.; Semsei, Á.F.; Gál, Z.; Nagy, A.; Gálffy, G.; Tamási, L.; Kiss, A.; Antal, P.; et al. Investigation of the Possible Role of the Hippo/YAP1 Pathway in Asthma and Allergy. Allergy, Asthma Immunol. Res. 2017, 9, 247–256. [Google Scholar] [CrossRef]
- Choi, H.-J.; Kim, N.-E.; Kim, B.M.; Seo, M.; Heo, J.H. TNF-α-Induced YAP/TAZ Activity Mediates Leukocyte-Endothelial Adhesion by Regulating VCAM1 Expression in Endothelial Cells. Int. J. Mol. Sci. 2018, 19, 3428. [Google Scholar] [CrossRef]
- Fu, M.; Hu, Y.; Lan, T.; Guan, K.-L.; Luo, T.; Luo, M. Correction: The Hippo signalling pathway and its implications in human health and diseases. Signal Transduct. Target. Ther. 2024, 9, 5. [Google Scholar] [CrossRef]
- Zhu, J.; Zeng, Y.; Xu, C.; Qin, H.; Lei, Z.; Shen, D.; Liu, Z.; Huang, J.-A. Expression profile analysis of microRNAs and downregulated miR-486-5p and miR-30a-5p in non-small cell lung cancer. Oncol. Rep. 2015, 34, 1779–1786. [Google Scholar] [CrossRef]
- Ren, H.; Yu, X.; Shen, G.; Zhang, Z.; Shang, Q.; Zhao, W.; Huang, J.; Yu, P.; Zhan, M.; Lu, Y.; et al. miRNA-seq analysis of human vertebrae provides insight into the mechanism underlying GIOP. Bone 2019, 120, 371–386. [Google Scholar] [CrossRef] [PubMed]
- Hammad, H.; Lambrecht, B.N. Wnt and Hippo pathways in regulatory T cells: a NOTCH above in asthma. Nat. Immunol. 2020, 21, 1313–1314. [Google Scholar] [CrossRef]
- Zhou, J.; Xu, F.; Yu, J.J.; Zhang, W. YAP is up-regulated in the bronchial airway smooth muscle of the chronic asthma mouse model. Int J Clin Exp Pathol. 2015, 8, 11132–9. [Google Scholar] [PubMed]
- Tang, W.; Li, M.; Yangzhong, X.; Zhang, X.; Zu, A.; Hou, Y.; Li, L.; Sun, S. Hippo signaling pathway and respiratory diseases. Cell Death Discov. 2022, 8, 213. [Google Scholar] [CrossRef] [PubMed]
- Lyu, X. , et al. Anti-inflammatory effects of reticuline on the JAK2/STAT3/SOCS3 and p38 MAPK/NF-kappaB signaling pathway in a mouse model of obesity-associated asthma. Clin Respir J 2024, 18, e13729. [Google Scholar] [CrossRef]
- Min, Z.; Zhou, J.; Mao, R.; Cui, B.; Cheng, Y.; Chen, Z. Pyrroloquinoline Quinone Administration Alleviates Allergic Airway Inflammation in Mice by Regulating the JAK-STAT Signaling Pathway. Mediat. Inflamm. 2022, 2022, 1267841. [Google Scholar] [CrossRef]
- Chen, X.; Yue, R.; Li, X.; Ye, W.; Gu, W.; Guo, X. Surfactant protein A modulates the activities of the JAK/STAT pathway in suppressing Th1 and Th17 polarization in murine OVA-induced allergic asthma. Lab Invest 2021, 101, 1176–1185. [Google Scholar] [CrossRef]
Figure 1.
Phenotypic characterization of the studied population. Radar plot (A) and (B) box plots showing sputum cellularity data in asthma subgroups and non-asthma control group. (C) and (D) Cytokine production profiles of induced sputum in asthma groups. (E) Correlation analysis between IL-6 and TNF production in the three asthma subgroups and non-asthma control group. The cell count and cytokine dosage of induced sputum were analyzed using the nonparametric and parametric tests (Mann-Whitney tests; Pearson correlation respectively) was performed between groups. **P ≤ 0.01; *P ≤0.05. (see Tables 1, S1 and S2 for detailed analysis). Groups: SAR: treatment-resistant severe asthma; SAC: treatment-controlled severe asthma; MMA: mild-to-moderate asthma; NA: non-asthma control group.
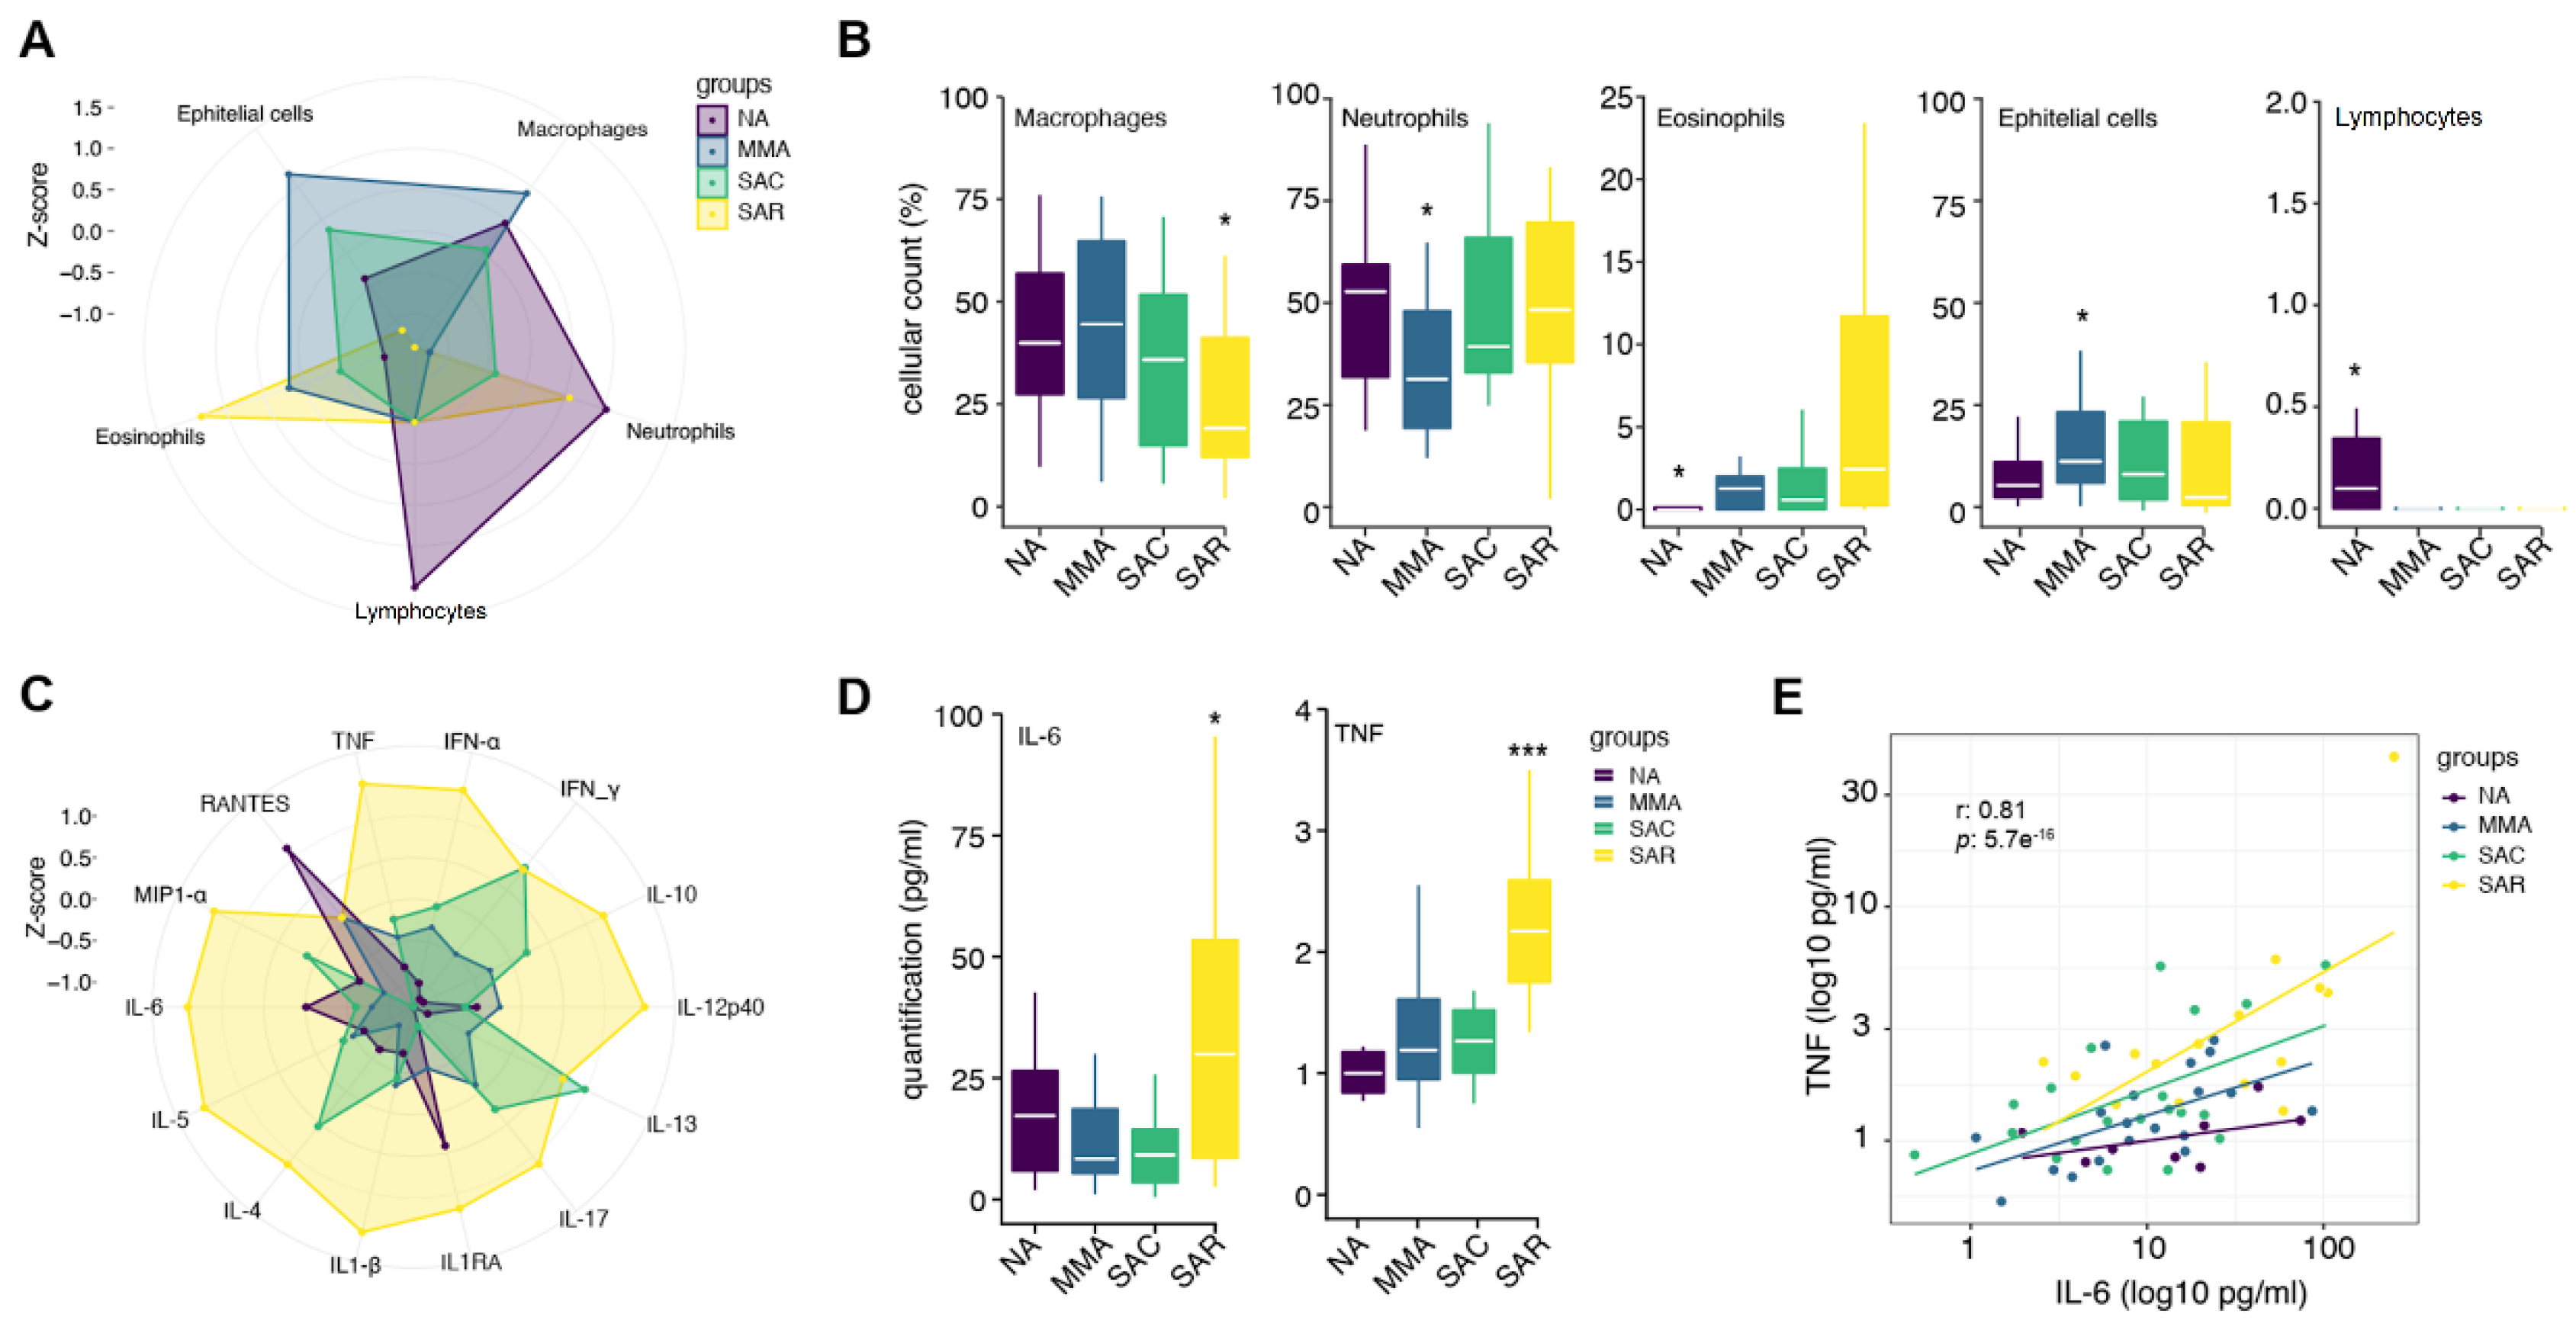
Figure 2.
(A) Principal Component Analysis (PCA) of asthma subgroup subjects and nonasthmatic controls. (B) t-Distributed Stochastic Neighbor Embedding (t-SNE) of asthma groups and no asthma control group. 62 samples were used for these analyses, because the cellularity of the induced sputum was not performed in four patients with asthma (SAC: two; SAR: two) and one of the control subject. Groups - SAR: treatment-resistant severe asthma; SAC: treatment-controlled severe asthma; MMA: mild-to-moderate asthma; NA: non-asthma control group.
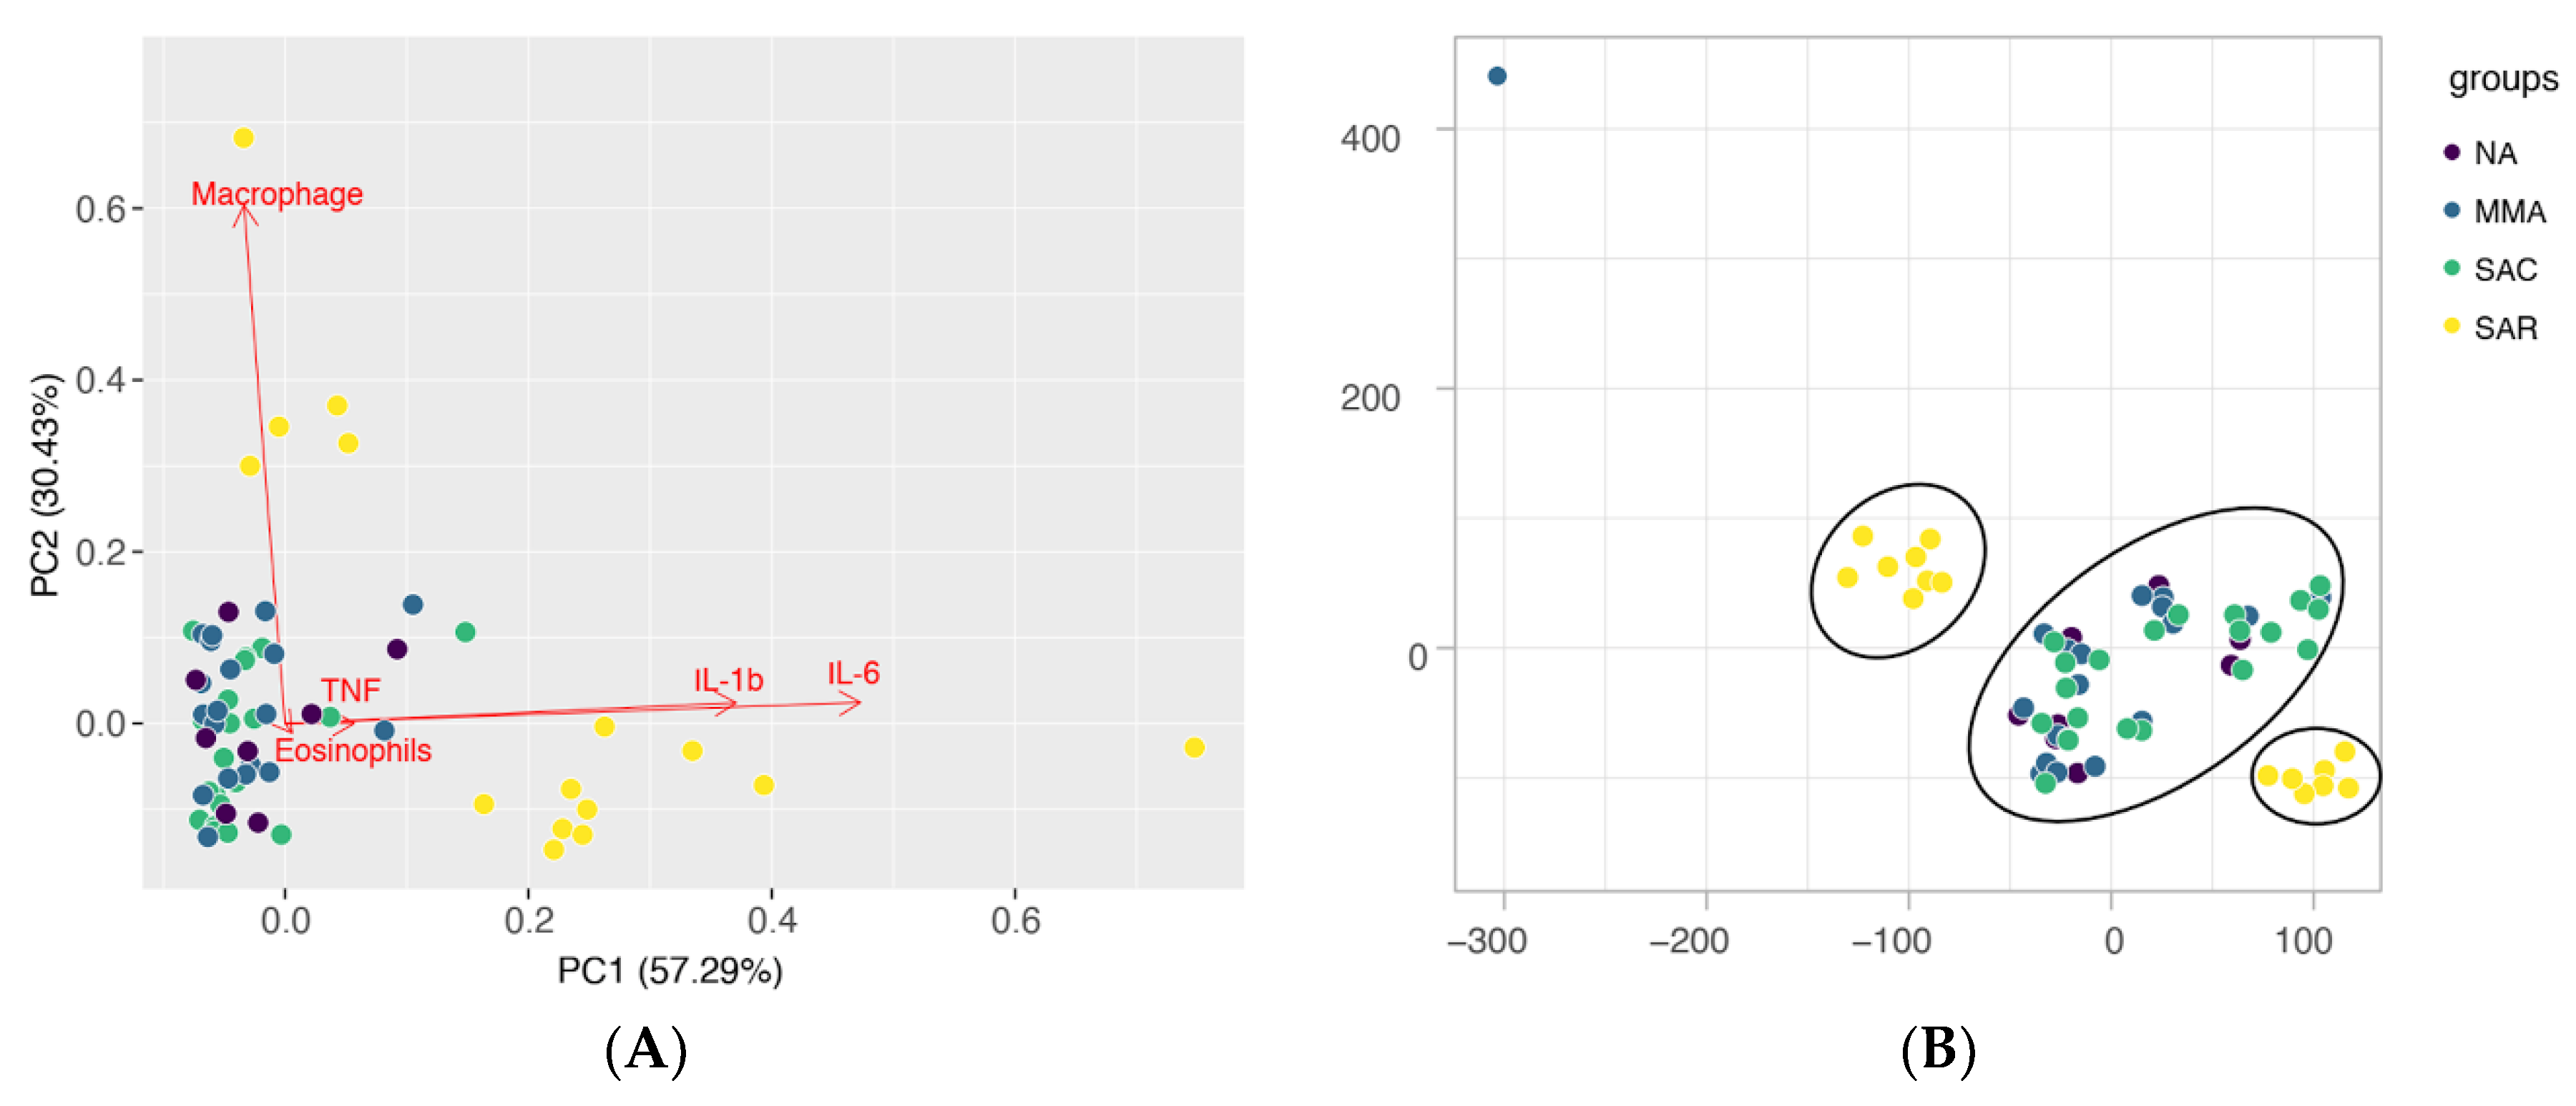
Figure 3.
Transcriptomics and shotgun proteomics of induced sputum. (A) Volcano plot presents the differently expressed genes from libraries of individuals with treatment-resistant severe asthma (SAR = 2 samples) and mild-to-moderate asthma (MMA = 2 samples). (B) Gene set enrichment analysis between the SAR (in green) and MMA (in orange) groups based on KEGG pathways. (C) Volcano plot of the miRNAs expressed between the two groups of asthmatics (Table S3 for details). Highlighted in yellow miRNAs differentially expressed with statistical significance. (D) Gene set enrichment analysis of genes regulated by the miRNAs differently expressed among asthma phenotypes. The number of cells in process (log 2) is represented by the size of the dot and the significance (P-value), by color intensity. (E) Enrichment of the cascades (KEEG and Reactome) presents the genes identified in the induced sputum proteome. In blue, cascade of genes overexpressed in SAR and MMA phenotypes. In red, the cascades with the highest gene expression in SAR in comparison to MMA (Padj: adjusted enrichment P-values in negative log10 scale). The y-axis shows the adjusted enrichment P-values in negative log10 scale. Groups - SAR: treatment-resistant severe asthma; MMA: mild-to-moderate asthma.
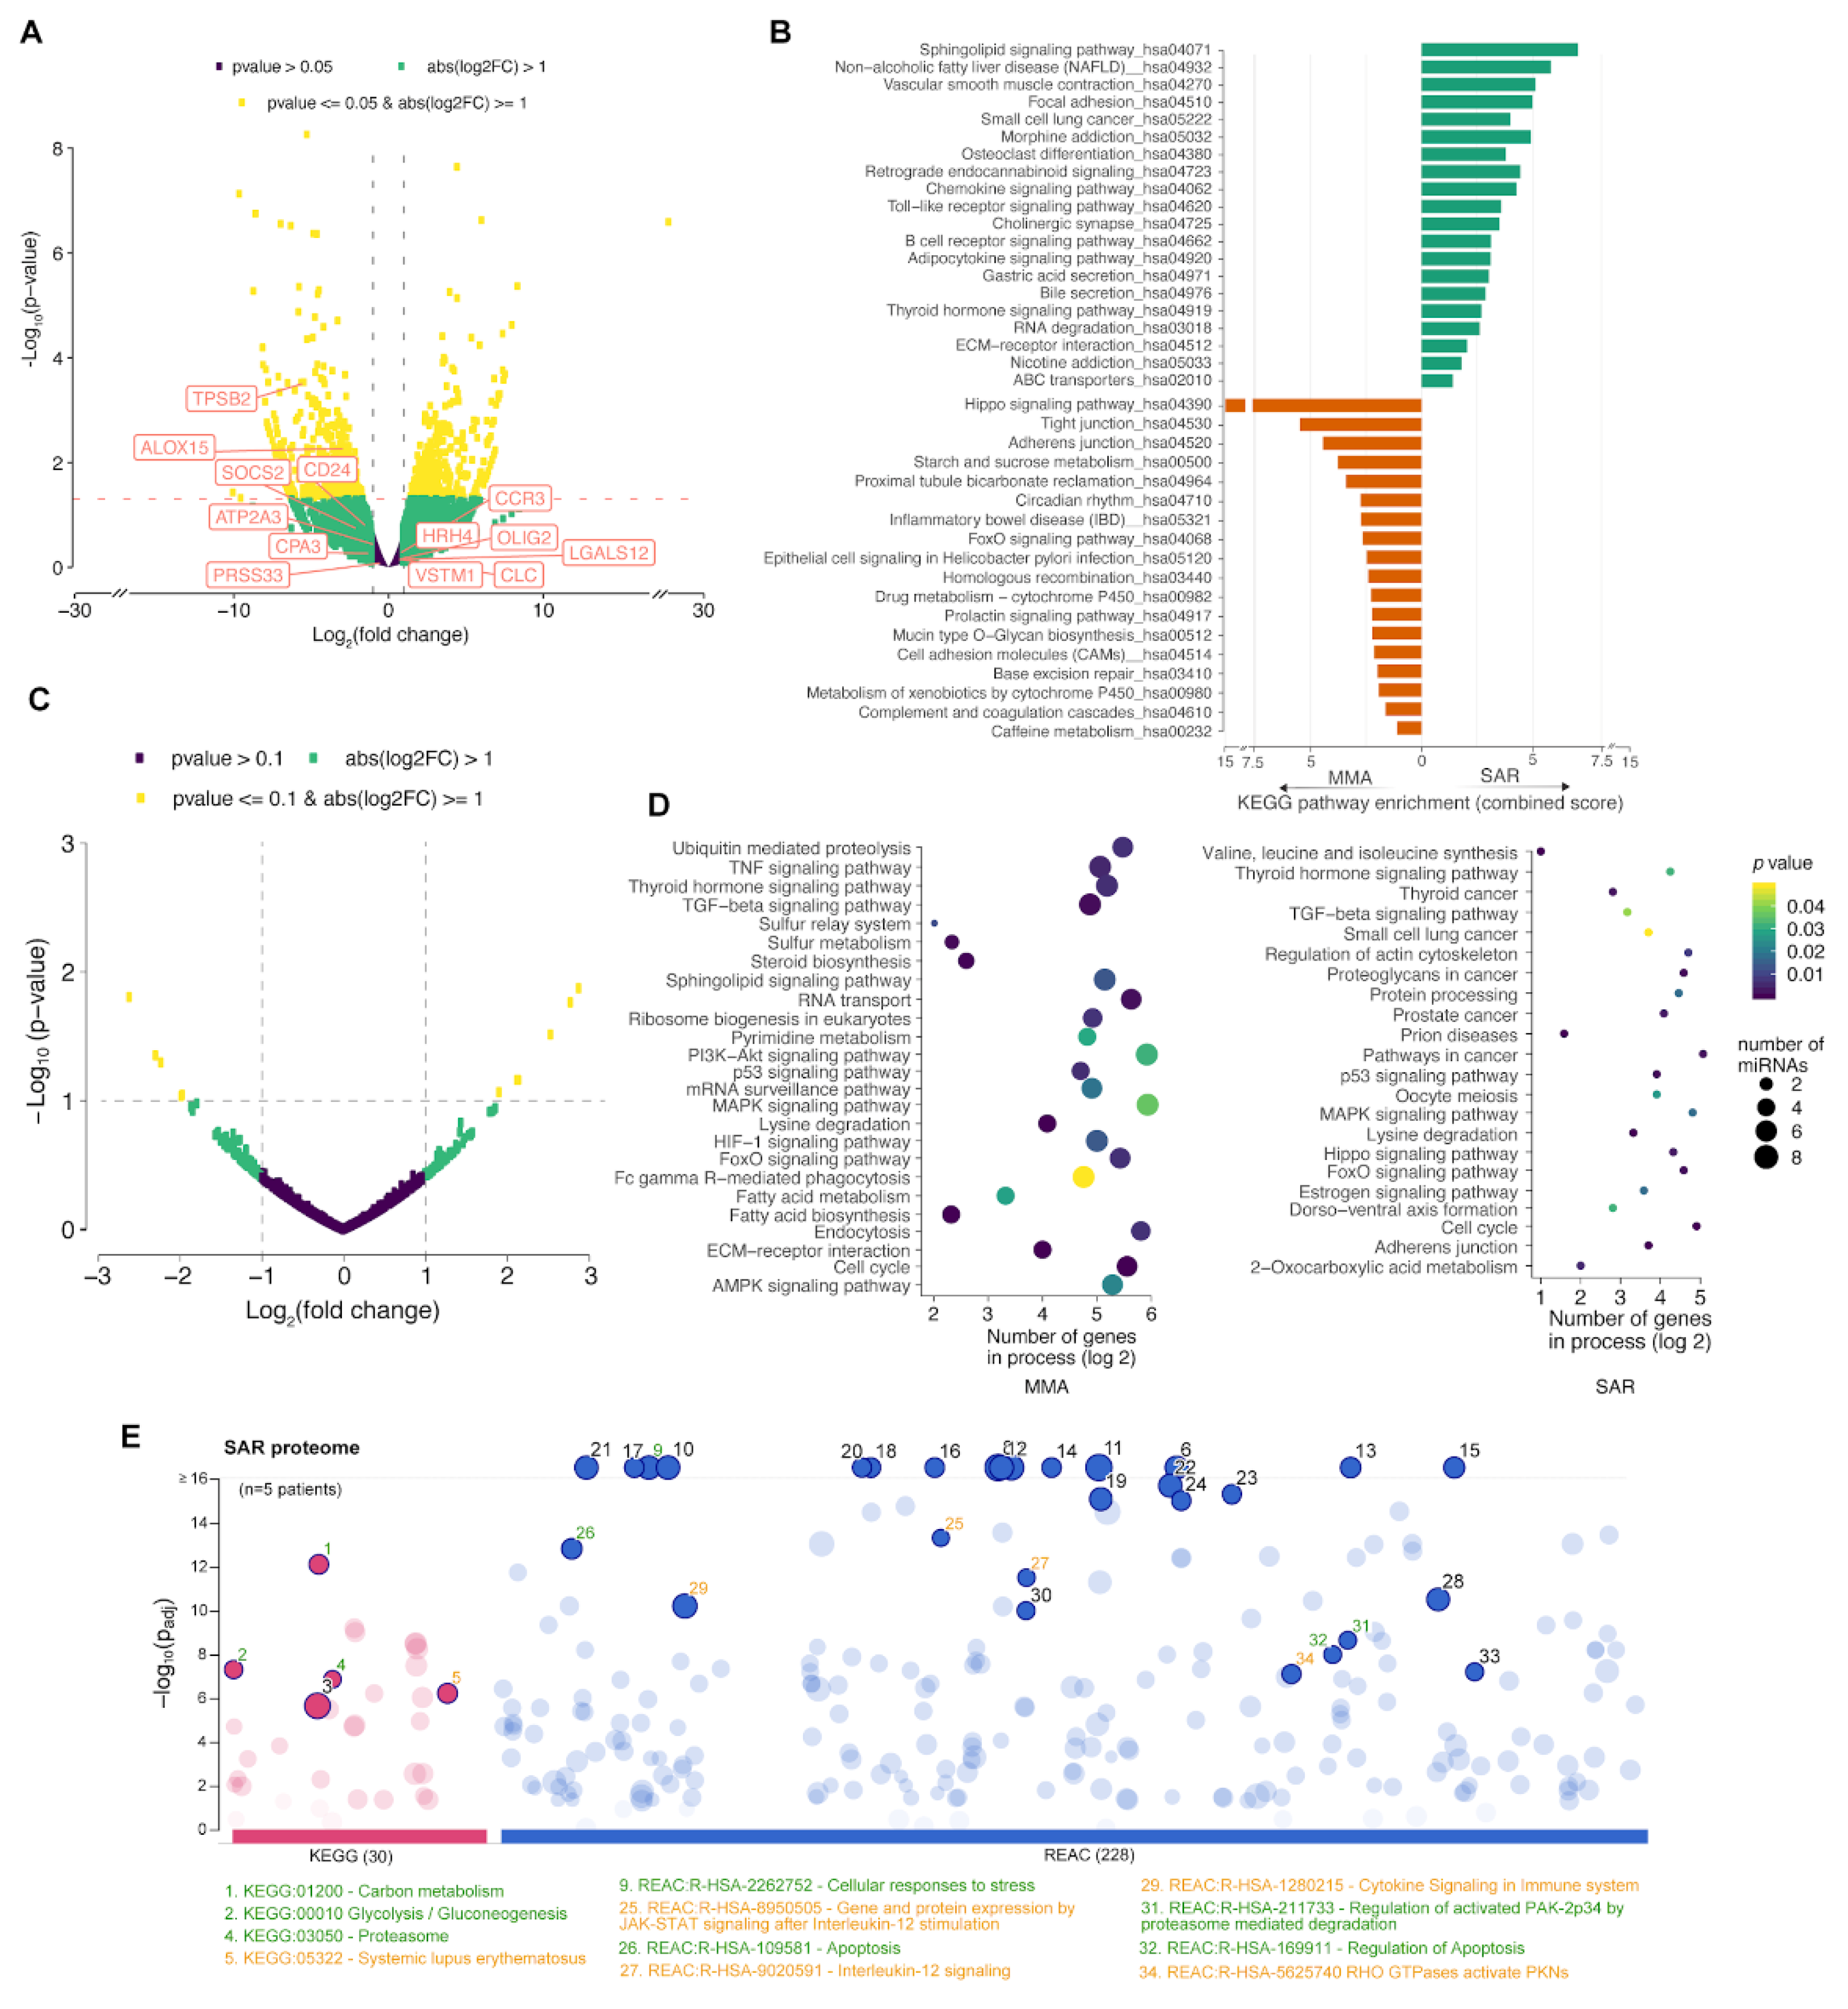
Figure 4.
Representation of the mechanism involving the reduction of gene expression in the Hippo pathway, the presence of TNF, and the increased inflammatory response in treatment-resistant severe asthma. The reduction in the expression of genes in the Hippo pathway and regulatory cascades (FoxO, P53, MAPK pathways) interfere in the regulation of the cell cycle with reduction of cell apoptosis and increased production of inflammatory cytokines. The Hippo pathway depends on the inhibitory phosphorylation of YAP/TAZ co-activators. The binding of TNF to its receptor induces innumerable intracellular mechanisms: induction of apoptosis (via caspase activation), induction of the inflammatory response (via NF-KB, for example) and reduction of YAP/TAZ phosphorylation.
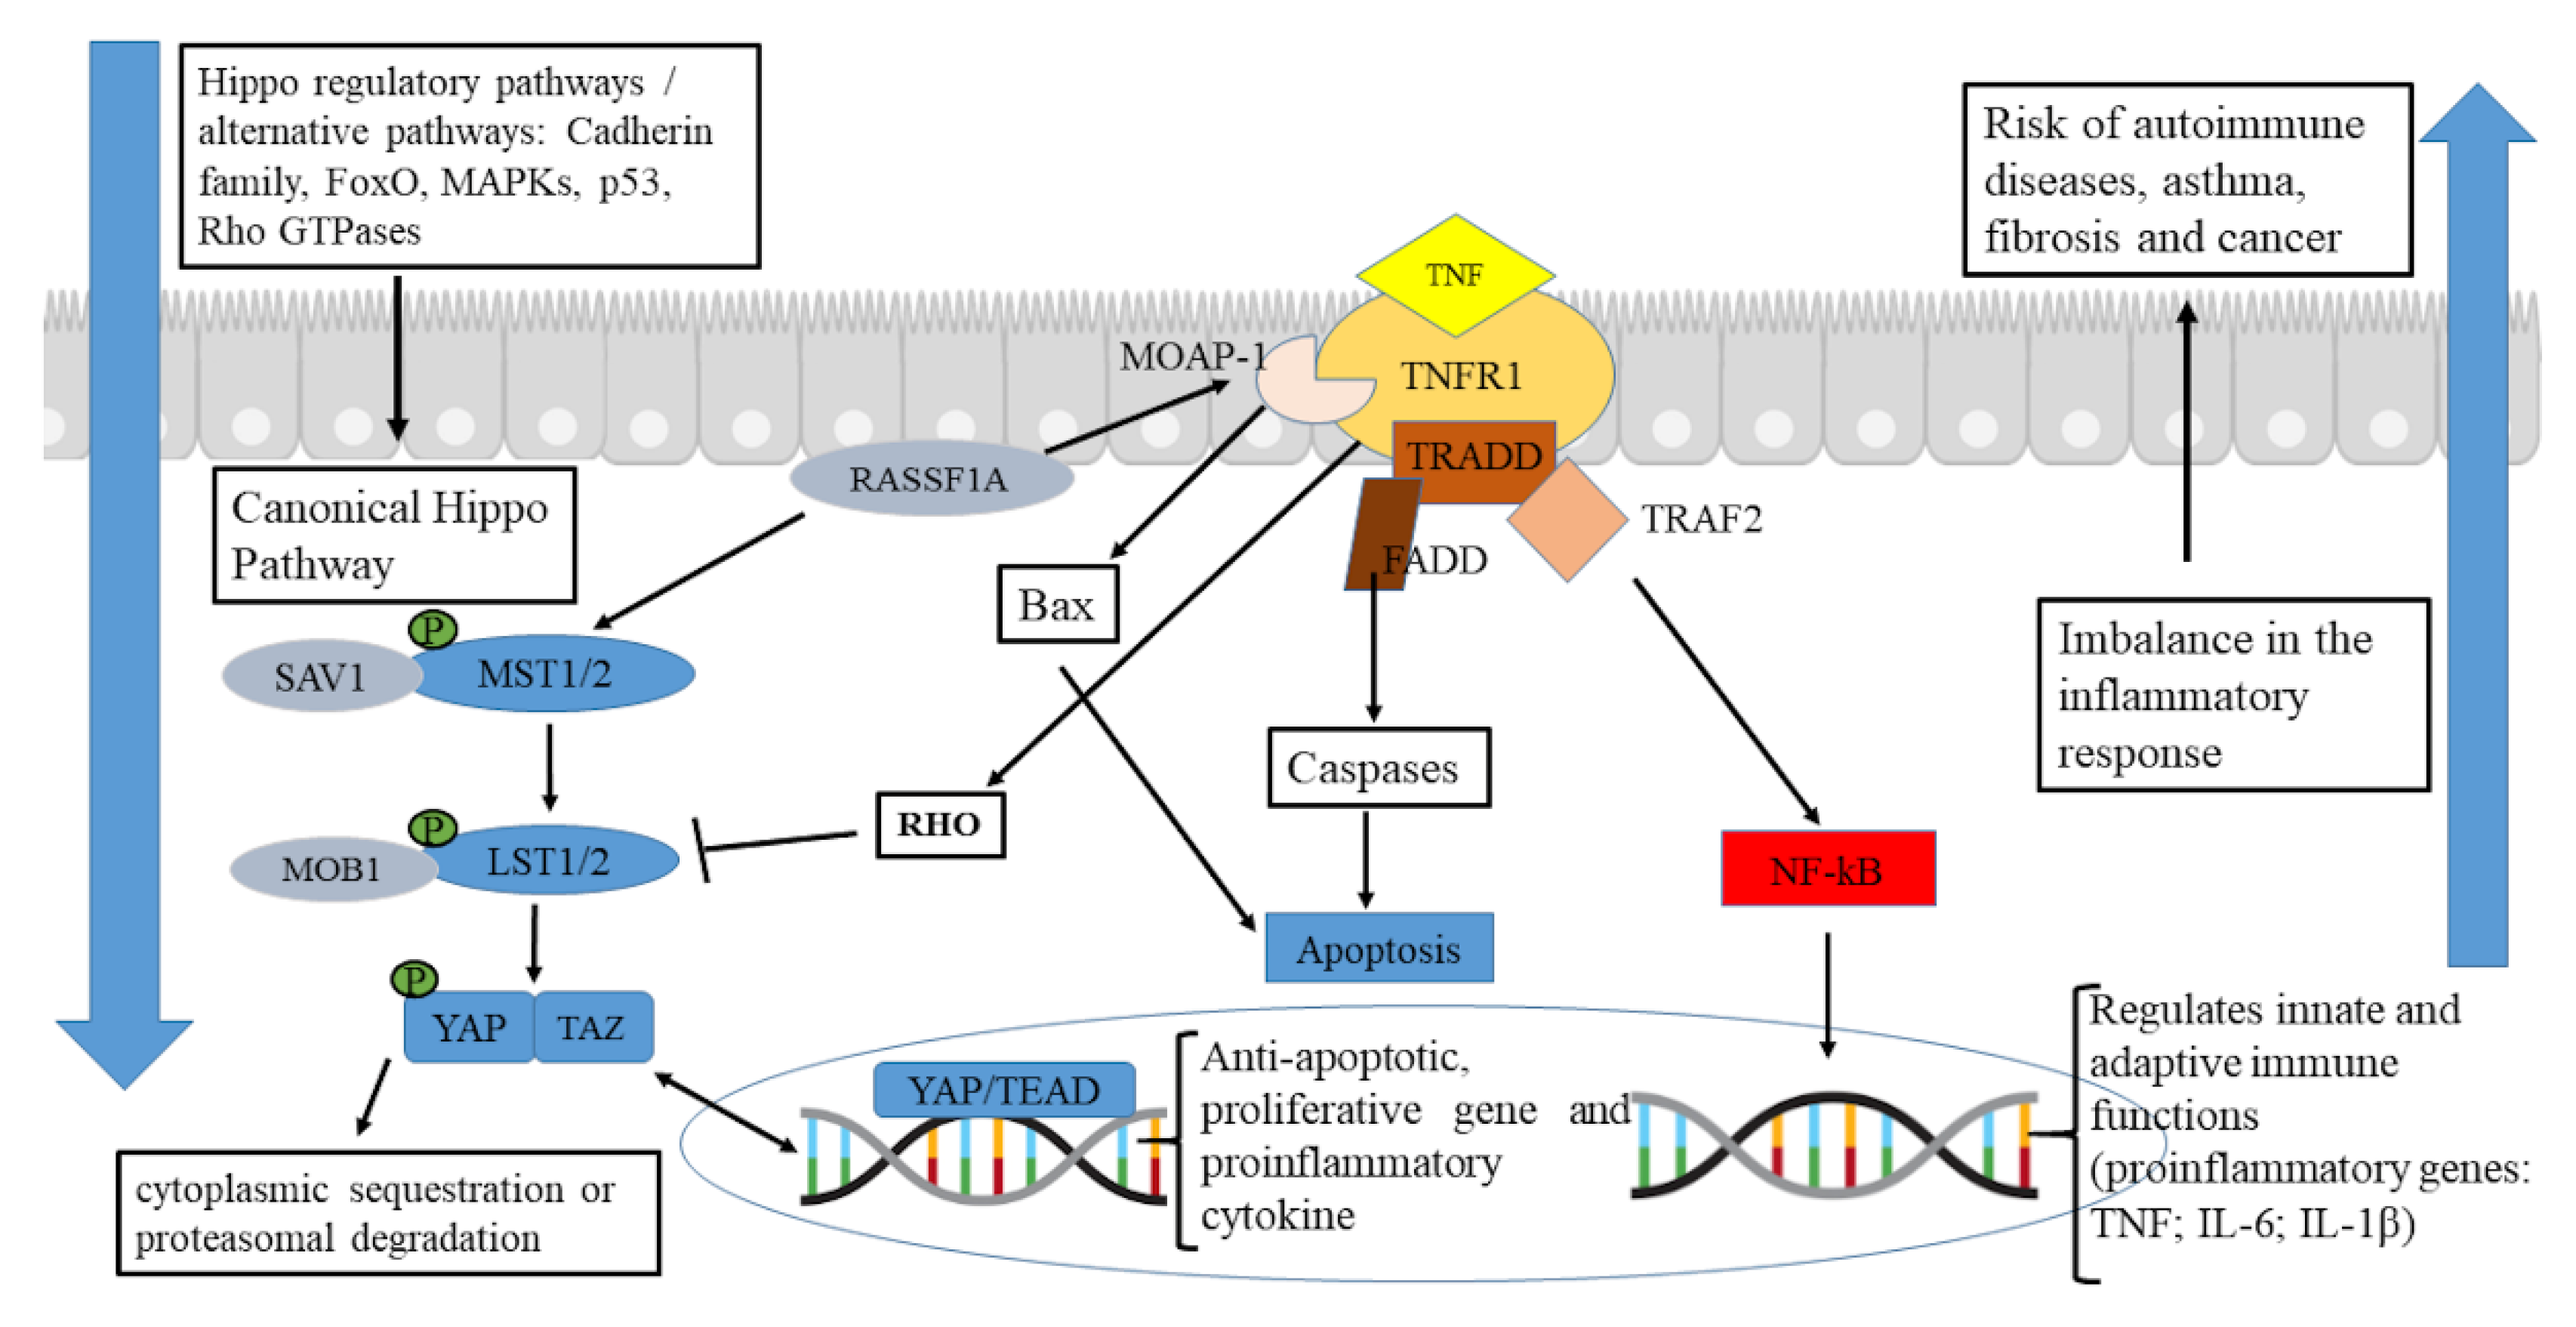

Table 1.
Clinical characteristics of the studied subjects.
| VariablesƗ | SAR(N= 17) | SAC(N=22) | MMA(N=19) | MMA(N=19) | P-value |
|---|---|---|---|---|---|
| Male/female | 3/14 | 8/14 | 5/14 | 0/9 | - |
| Age of onset of symptoms -year | 11.94 ±14.65 | 11.59 ±12.81 | 13.11 ±15.95 | - | 0.9627 |
| Atopy | (11) 64.7% | (14) 63.6% | (12) 63.2% | (3) 33.3% | - |
| Smoking(C/E/N) | 0/5/12 | 0/5/17 | 1/3/15 | 0/0/9 | - |
| FEV1% pre BD | ##66.27***±13.64 | 76.42*±15.54 | 85.14##±10.35 | *95.16***±13.99 | <0.0001 |
| FVC% pre BD | 79.18* ±12.61 | 89,46 ±11.67 | 88.22 ±11.47 | 93.21* ±12.97 | 0.0240 |
| FEV1/FVC% pre BD | ##82.60***±12.86 | ***84.97##±9.504 | ##96.65##±7.870 | ***102.3***±8.874 | <0.0001 |
| FEF 25-75% pre BD | 41.53*** ±17.29 | ***54.81*±22.25 | *78.97***±20.93 | ***111.8***±32.40 | <0.0001 |
| FEV1% post BD | ##72.73*** ±14.33 | 83.30 ±14.06 | 88.23## ±10.41 | 99.03*** ±12.14 | 0.0001 |
| FVC% post BD | 84.67 ±12.81 | 93.72 ±9.629 | 88.23 ±12.05 | 93.71 ±14.23 | 0.0801 |
| FEV1/FVC % post BD | ##86.11***±12.16 | ##88.72## ±9.422 | ##100.4##±8.405 | ##106.3**±9.230 | <0.0001 |
| FEF 25-75% post BD | ***47.24***±18.22 | *65.57***±25.70 | *94.27***±23.15 | ***139.1***±28.24 | <0.0001 |
| Sputum absolute eosinophils | 27.33 ±33.54 | 6.85 ±10.33 | 6.95 ±8.9 | 1.76 ±4.2 | 0.1067 |
| Sputum eosinophils % | 6.85* | 2.83 | 1.75 | 0.45* | 0.0375 |
| Sputum absolute neutrophils | 214 ± 81.5 | 197.7 ± 90.08 | 141.3 ± 68.26 | 200.3 ± 97.36 | 0.0631 |
| Sputum neutrophils % | 53.51 | 49.43 | 35.32 | 50.08 | 0.0636 |
| Sputum absolute macrophages | 107.3 ± 73.7 | 137.9 ± 89.13 | 183 ± 83.8 | 163.9 ± 92.15 | 0.0788 |
| Sputum macrophages% | 26.82 | 34.45 | 45.75 | 40.96 | 0.0778 |
| Sputum absolute lymphocytes | 0.33 ± 0.9 | 0.05 ± 0.22* | 0.26 ± 0.56 | 0.75 ± 0.89* | 0.0456 |
| Sputum lymphocytes % | 0.08867 | 0.0195* | 0.07632 | 0.1925* | 0.0438 |
| Absolute epithelial cells | 51 ± 49.06 | 57.6 ± 72.34 | 68.47 ± 68.91 | 33.38 ± 27.06 | 0.5323 |
| Epithelial cells % | 12.74 | 15.22 | 17.12 | 8.338 | 0.5816 |
Ɨ Data presented as number (N), percentage (%) and mean (
±
SD).
Disclaimer/Publisher’s Note: The statements, opinions and data contained in all publications are solely those of the individual author(s) and contributor(s) and not of MDPI and/or the editor(s). MDPI and/or the editor(s) disclaim responsibility for any injury to people or property resulting from any ideas, methods, instructions or products referred to in the content. |
© 2025 by the authors. Licensee MDPI, Basel, Switzerland. This article is an open access article distributed under the terms and conditions of the Creative Commons Attribution (CC BY) license (http://creativecommons.org/licenses/by/4.0/).
Copyright: This open access article is published under a Creative Commons CC BY 4.0 license, which permit the free download, distribution, and reuse, provided that the author and preprint are cited in any reuse.


