
Submitted:
09 May 2025
Posted:
13 May 2025
You are already at the latest version
Abstract
Background/Objectives: to analyse the listening effort in Usher Syndrome (USH) cases types 1 and 2 and its relation to age, genetic diagnosis, visual field, visual acuity, degree of HL, vestibular impairment and spatial orientation. Methods: it was a retrospective monocentric study. Twenty children with genetically confirmed USH (USH2 in 15/20 - 75% and USH1 in 5/20 - 25%) - age range 3-17 years (mean 9.6 ± 4.7) -underwent: Van-derbilt fatigue scale questionnaire (VFS), audiological and vestibular assessment comprehensive of Oldenburg Matrix test in Italian and video head impulse test (VHIT), sound localization test and ophthalmologic exami-nation. Results: we confirmed greater HL and worse vestibular function in USH1. They also employed signif-icant more time and head movements to localize sounds compared to USH2 and had worst visual field on eye examination. VFS was not significantly different between the two groups, except for the physical fatigue part referred by parents. Mean VFS was linearly related to age, the hearing threshold of the worse ear, data logging hours of hearing device, time and head movements of the localization test, VHIT asymmetry and balance problems referred by parents and visual field. Conclusions: listening effort in difficult environments such as school rooms in USH patients is not only associated to the hearing function but also to the spatial awareness determined in part by vestibular and visual function. Teachers should be informed and made aware of multi-ple comorbidities in order to facilitate learning.
Keywords:
Usher syndrome
; listening effort
; localization
; hearing loss
; vestibular function
; visual function
1. Introduction
Congenital sensorineural hearing loss (SNHL) is one of the most prevalent chronic conditions in children, affecting from 1 to 3 per 1000 newborns worldwide [1].
In children of primary school age, the prevalence increases, with a further increase during adolescence because of progressive, acquired or late-onset causes [2].
The improvement of universal newborn hearing screening programs made it possible to detect HL in the first days after birth in order to start early hearing rehabilitation with hearing aids or cochlear implants and consent adequate language development [3].
Advances in congenital cytomegalovirus testing, imaging modalities (CT and MRI), and genetic testing (e.g., whole exome sequencing, WES) have significantly changed the challenge of traditional clinical evaluations to arrive at an etiologic diagnosis, providing clinical and prognostic data that can guide personalized hearing rehabilitation interventions. Despite this, the lack of resources, especially in disadvantaged geographical areas, often complicate access to the optimal clinical care, hinder the etiological identification, causing them to be classified as idiopathic cases [4]. Nevertheless, the genetic causes (syndromic or not) probably account for the majority of cases and their definition helps predict possible threshold progression and identify associated conditions which assist in establishing a therapeutic alliance with the family as the child grows.
Usher syndrome (USH) is an autosomal recessive disorder characterised by hearing, visual (and sometimes vestibular) impairment due to genetic mutations affecting protein complexes involved in the signal transduction or in the cell adhesion of sensory hair cells of the inner ear and retina [5]. It is the most common cause of deaf/blindness, responsible for the 50% of cases under the age of 65 (affecting approximately 1/10.000 ~ 400,000 people worldwide) [6] and it is clinically and genetically heterogeneous. The different phenotypic traits of USH could be classified into three different types: in USH1, congenital HL (often severe to profound) is associated with early onset of retinitis pigmentosa (RP) and vestibular deficit. USH2 is characterised by moderate to severe HL, later onset of RP and non-vestibular dysfunction while USH3 has variable visual and vestibular impairment combined with progressive HL [7]. USH provokes great disability and limits social activities and spatial orientation.
The effort related to the combination of HL and visual impairment in children affected from USH could compromise mental health, socio-emotional behavior and academic achievement. Basing on the type and gravity of clinical traits, that usually progress with age, communication becomes more and more cognitive and energy consuming, restricted to near surrounding with limited access to distant information and in need of the help of other senses (tact, smell etc.).
Consequently, early genetic confirmation is of primary importance so that correct rehabilitation could start and the mode of communication customized, preventing possible psychological comorbidities [8].
The aim of the present retrospective study was to analyse the listening effort in our USH cases types 1 and 2 and its relation to age, genetic diagnosis, visual field, visual acuity, degree of HL, vestibular impairment and spatial orientation.
2. Materials and Methods
2.1. Study Sample
We performed a monocentric retrospective study approved by the Ethical Committee of Institute for Maternal and Child Health - IRCCS, “Burlo Garofolo”, Trieste, Italy, under the name and number "Ricerca Corrente 17/23". We included children (<18 years) affected by Usher Syndrome with genetic whole-exome sequencing confirmation.
We excluded patient with a follow-up period < 2 years after the diagnosis at our Service of Audiology and ENT. Attention deficit, verbal working memory or cognitive impairment represented exclusion criteria. Only children with an IQ > 85 were included in the study.
Parents received complete and comprehensible information about the tests administered and gave their written consent to their execution, in agreement with the ethical standards of the Declaration of Helsinki.
2.2. Design
2.2.1. Each Patient Enrolled Underwent:
Vanderbilt fatigue scale questionnaire (VFS) [9]: a tool that evaluates the degree of listening associated fatigue, one for the parent and one for the child. The VFS-P (Parent) is divided into two sets of questions, 7 questions for mental fatigue and 5 questions for physical fatigue. Each question receives a score between 0 and 4, with the total scores ranging between 0-28 for mental fatigue and 0-20 for the physical part. A score ≤14 in the mental section or ≤12 in the physical one indicates that fatigue-related issues are relatively infrequent, that can be found in normally developing children. A mental and physical score respectively between 15-24 or 13-17 indicate that listening-related fatigue is relatively common for the child and may deserve attention. A score between 25-28 or 18-20 respectively indicate that fatigue is very common and can severely impact the child’s life. It was administered for parents of children > 3 years old.
The VFS-C (Child) is designed to assess listening-related fatigue in children between 6 and 17 years of age. It’s composed of 10 questions with a score of 0-4, for a total score ranging from 0 to 40. A score of 0-26 indicates that listening-related fatigue is infrequent. A final score 27-36 that fatigue is relatively common, while a score of 37-40 that listening-related fatigue is very common and impact the child’s life. It was administered in children ≥ 6 years old.
Tonal Audiometry and Speech discrimination in quiet: we measured pure tone average (PTA) (average of hearing threshold levels at 500, 1000, 2000, and 4000 Hz) for both sides with and without hearing devices (hearing aids/cochlear implants). Speech discrimination of disyllabic words in quiet was also calculated considering the percentage of words the patient could recognize at 50 dB, 65 dB and 80 dB with their hearing devices. We considered the worse ear to compare patients.
Oldenburg Matrix test in Italian: speech intelligibility in noise was evaluated with the use of Sentence Matrix test in Italian [10] in children ≥ 6 years old. It is a test in which the patient is asked to repeat sentences of 5 words that are presented together with a disturbing noise (more correctly called "competition"). After each patient response, the software automatically makes the next sentence "easier" or "harder" to understand, based on that response, increasing the intensity of noise. The patient seats one meter in front of a speaker that send the signal at a fixed intensity of 65 dB HL. We performed the test sending signals and noise from the same in front of the patient (0°- S0N0). The test converges to a precise volume of words and a precise volume of noise for which the patient understands about 50% of the words presented. The result of this test is a value, called Signal Reception Threshold (SRT) which represents the difference between the volume of the words and that of the noise at which the patient guesses half of the words presented. Consequently, the result is much better the lower the number. The average value for the Italian population is -7.3+0.2 dB [9]. However, patients with hearing loss may have higher SRTs, even above zero.
We used the version for children in case of age < 10 years, otherwise the version for adults.
Localization test: The test took place in a room that contains several rings of speakers at different heights [11] for children ≥ 6 years old. The patients were asked to sit in the middle of the room while wearing VR goggles (Oculus quest 2) and to hold a joystick in each of their hands. The test included 48 trials, during which a pulsating pink-noise was played by six speakers at 15°, 45° and 75° on both the right and the left of the individual. Each patient had to point the joysticks towards where they heard the sound coming from. The purpose of the test was to determine their ability to correctly locate where a sound is coming from (sound spatial orientation), calculating: 1) their absolute mean error (in angular degrees - °) in localizing the sound with standard deviation; 2) how many seconds (s) it would take to complete the test; 3) how much (in meters – m) they would move their heads in the act of looking for the sound.
Vestibular examination: For each patient, we considered:
-the age they first started walking in months
-a questionnaire to verify the presence of balance and instability issues (balance questionnaire – BQ). The survey included 10 questions, each one investigating the presence of balance problems in 10 different areas: running; riding a bike; roller-skating; walking in the dark; walking on uneven surfaces; walking on sand; carsickness; gymnastics and physical activity; turning their head right and left as they ride a bike; keeping balance under the shower. Each question should be answered with “yes” (1 point), “no” (0 point) or “don’t know” (0 point), obtaining a total score from 0 to 10. It was administered to parents.
-Clinical examination to assess the presence of spontaneous and/or positional nystagmus, positivity of head-shaking test (HST) and clinical head impulse test (HIT).
-Video Head Impulse Test (VHIT) [12] using a VOG device (ICS Impulse, GN Otometrics) able to measure the gain of VOR (Vestibular-Oculomotor Reflex) in the both sides. We evaluated only the horizontal canals with the patient sitting upright and fixating a visual target in front of him. Clinicians standing behind the patient generated head impulses by moving it abruptly and unpredictably in the horizontal plane. VOR gain was automatically calculated by the system as the ratio of head to eye velocity. We considered normal: VOR gain >0.8 for each side and gain asymmetry between the two sides <20%.
2.2.2. Ophthalmologic Examination:
-best corrected visual acuity (BCVA)
-automated static perimetry (ZEISS, Humphrey Visual Field HFA 750, Germany) with SITA Fast 30-2 protocol used to investigate the visual field sensitivity investigating retinal sensitivity presenting light spots of different luminance. We calculated the mean of the four quadrants (nasal inferior, nasal superior, temporal inferior, temporal superior) for each eye. We considered the worse eye to compare patients.
-tomographic retinal evaluation using Optical Coherence Tomography (OCT Optovue AngioVue, Visionix, USAt in cooperative patients, and OCT Optovue iVue 80, for evaluations under sedation). The foveal margin can be typically seen as a ring-like reflection of the internal limiting membrane that measures around 1500 μm in diameter and a normal thickness of about 239 μm [13]. The parafovea is a belt that surrounds the foveal margin and measures around 0,5 mm in thickness, while perifovea surrounds the parafovea and is 1,5 mm wide.
-finally, we used fundus photography and autofluorescence to highlight alterations of the pigmented epithelium and accumulations or dispersions of lipofuscin. Fundus photography uses a series of mirrors and lenses to focus a donut-shaped light beam that enters the eye through the cornea, taking a picture of it. Fundus autofluorescence is a non-invasive exam that does not require to administer exogenous dyes, instead relies on the presence of naturally fluorescent substances in the retina, such as lipofuscin, to create an image. Abnormalities in FAF are defined as any pattern that differs from the classic appearance [14].
2.3. Statistical Analysis
Statistical analysis was done using Excel for Windows software. The sample was described in its clinical and demographic features using descriptive statistics techniques. Continues values with normal distribution, such as the scores obtained with questionnaires, were expressed as mean ± standard deviation (SD). Qualitative variables were summarized with absolute and percentage frequency tables.
Study main objective was achieved calculating for each patient the mean scores of VFS in the total sample. Student T-test was used to compare groups. Pearson’s correlation test was used to investigate the relationship between listening effort and age, genetic diagnosis, visual field, visual acuity and retinal involvement, degree of HL, vestibular impairment and spatial orientation.
The results were considered significant for p values < 0.05.
3. Results
3.1. Patients
Twenty children with genetically confirmed Usher Syndrome (USH) were included in our study - age range 3-17 years (mean 9.6 ± 4.7) - 10/20 (50%) M and 10/20 (50%) F – 19/20 (95%) Caucasian and 1/20 (5%) Asian.
Genetic test confirmed a diagnosis of USH2 in 15/20 (75%) and USH1 in 5/20 (25%). Details about genetic diagnosis are described in Table 1.
3.2. Audiological Assessment
Mean age for diagnosis of hearing loss (HL) was 11.4 ± 20.3 months. It was statistically different (p=0.019) between USH 1 (mean 0 months, first identification with the neonatal hearing screening in all cases) and USH 2 (15.2 ± 22.3 months) because of 6 cases with diagnostic delay (men 38 months), 3 of them with a negative hearing screening test. The genetic diagnosis was confirmed at 6.9 ± 4.5 years, without difference between the two groups (p>0.05).
Hearing threshold of the worst ear at diagnosis and last follow-up appointment was higher in USH 1 (101 dB HL and 109 dB HL respectively) compared to USH 2 (56.9 dB HL and 60.6 dB HL, p< 0.001) without a significative progression in both groups. In any case, three USH2 patients had a severe to profound HL at the diagnosis.
19/20 – 95% patients used hearing devices (7/19 – 36.8% cochlear implants, 100% of USH1 and 13% of USH2, and 12/19 – 63.2% hearing aids, 0% of USH1 and 87% of USH2). Mean age of first HAs use was 30 ± 23 months, statistically different (p=0.019) between the two groups (15.2 ± 9.8 USH1 and 35.4 ± 24.1 USH2).
The best Hearing threshold with their hearing devices was slightly better in USH1 (24.6 dB HL vs. 32.5 dB HL, p>0.05) and we didn’t observe significant difference on the results of the speech audiometry in quiet (p>0.05). However, the difference between the Matrix test SRT was at the limit of statistical significance (-3.4 ± 0.5 USH1 vs. -1.7 ± 2.7 USH2, p=0.051).
3.3. Localization Test
Mean absolute error was 17.08 ± 15.9°, it was not different between USH1 and USH2 patients. However, we found a significant difference in the time of test (1029 ± 537 s vs. 565.6 ± 224.2 s, p=0.043) and (93.6 ± 68.7 m vs. 14.5 ± 10.2 m, p=0.035), meaning that USH1 patients were more uncertain in their spatial sound orientation.
3.4. Vestibular Examination
Mean walking age was statistically different between the two groups of children (13.7 ± 4.7 months for USH2 and 21.75 ± 3.6 months for USH1, p=0.035).
At the same time the balance questionnaire score (BQ) was higher in USH1 group but it was not significant (2.7 ± 1.3 vs. 6 ± 4.5, p>0.05).
Only one patient USH1 had a positive head shaking test and a positional horizontal nystagmus at the clinical observation. For what concern VHIT, 3/5 (60%) patients USH1 and 3/15 (20%) USH2 had a pathologic gain, but the most relevant data was that USH1 had a mean asymmetry percentage of 46 ± 31.5 % and USH2 11 ± 8.5 % (p=0.04). Consequently, VHIT proved to be a sensitive test for differentiating USH type 1 and type 2 on the base of the vestibular function, as previously demonstrated by other authors [15].
3.5. Ophthalmologic Examination
Mean BCVA was 0.89 ± 0.16 for the worse eye and it was not significantly different between the two groups (p>0.05).
OCT foveal thickness of the worse eye was on average 245 ± 83.6 µm and it was not statistically different between USH1 and USH2 patients (p>0.05).
Mean visual field was reduced in USH1 patients 7.5 ± 6.6 compared to USH2 24.7 ± 6, p=0.039.
3.6. Vanderbilt Fatigue Scale
Mean VFS-C was 14.7 ± 9.2 and it was not different in the two groups (p>0.05).
Total score of VFS-P was 15.1 ± 11.1 (7.9 ± 6.4 for mental score, 7.2 ± 5.5 for physical score)
The physical score of VFS-P was statistically different between USH1 (10 ± 5.2) and USH2 (6.4 ± 6.5) patients (p=0.043).
To calculate the relation between listening effort measured with the questionnaire and the other factors, we used the mean score (VSF-M) between the VFS-C and VFS-P.
VSF-M was slightly but significantly related to the age of patients, with higher values for older (Pearson’s R=0.33, p<0.05). It was not related to the age of diagnosis or the age of first use of hearing aids.
It was significantly related to the hearing threshold of the worse ear at the last follow-up visit (R=0.43, p<0.05), but not with the best aided hearing curve. Hours counted on the data logging of the hearing device was also a related factor (R=-0.68, p<0.05).
The reported fatigue was not significantly related to the results of the Matrix test (R=0.19, p>0.05).
For what concern localization, the m-VFS was related to the time of the test (R =0.52, p<0.05) and to the performed meters with head movements (R=0.40, p<0.05), demonstrating that these two parameters of the localization test, which express the child's uncertainty in locating sounds, go hand in hand with hearing fatigue reported in difficult environments, such as school, by parents and their children.
Vestibular function measured with the VHIT asymmetry (R=0.32, p<0.05) and balance problems reported by parents (R=0.51, p<0.05) were also related to listening fatigue.
Surprisingly, we found a strong inverse relationship between visual field and m-VFS (<retinal sensitivity, > fatigue), probably because in USH patients the impaired visual function, added to the hearing function, has a significant impact on the children’s fatigue in difficult environments (R=0.78, p<0.05). Results are depicted in Figure 2.
4. Discussion
Overall, our results about clinical characteristics of USH patients confirmed previous literature data [5,6,7]. In fact, USH1 patients had profound HL respect to USH2 patients mostly affected by moderate HL. Nevertheless, two USH2 children were candidate to cochlear implantation because of a rapidly progressive form of hearing loss.
Surprisingly, three USH2 cases had a negative hearing screening result, with a significative diagnostic retardation. In our opinion it was a very interesting data because, the milder ciliary damage of the hair cell’s structure and function observed in animal models of USH2 compared to USH1 [16], could suggest a possible late onset of HL, which would explain the late detection of hearing damage. The hypothesis deserves a confirmation on a larger series of cases; future studies may provide insights about the relationships between genotypes and phenotypes, characterizing the progression of disease and providing the knowledge necessary to detect early Usher Syndrome in affected patients to start an effective and personalized rehabilitation program.
All patients needed an early hearing rehabilitation in childhood, except for one case of USH2 because of mild HL and the opposition from parents.
Despite the profound HL in USH1 patients, all had an early diagnosis and rehabilitation start with cochlear implant, reaching comparable results respect to USH2 patients about speech intelligibility in noisy environment, as detected with the Matrix test (p>0.05). Consequently, type 1 patients didn’t show a significantly higher listening effort measured with the Vanderbilt fatigue scale questionnaire, except for the physical fatigue part reported by patients (p<0.05).
The linear significant relationship between the subjectively experienced fatigue and the hearing threshold, visual and vestibular impairment could explain this result.
In fact, USH1 patients demonstrated a higher asymmetry percentage detected with the use of VHIT on horizontal plane and a worst visual field, that could affect their spatial awareness and sound localization.
It was demonstrated that chronic unilateral or bilateral vestibular impairment could affect spatial memory and cognitive functions related to the body awareness and the imagination of the surrounding space [17], which are essential process to localize sounds, especially in difficult environments such as noisy school rooms. At the same time, the visual impairment and the progressive restriction of the visual field (“tunnel vision”) that characterize the syndrome [18] contribute to worsening spatial localization.
In our results, USH1 patient had longer test time localizing sounds on the horizontal plane and higher head movements (p<0.05) which welly give an idea of their level of difficulty in perceiving sounds in the surrounding space. Both factors are linearly related to the reported listening fatigue in the correlation analysis (Figure 1) as the vestibular and visual impairment in the total sample.
In conclusion, our results demonstrated that listening fatigue in syndromic patients is not only referred to the hearing threshold or to the recovery of hearing functions with hearing devices, but to the integrated hearing, vestibular and visual functions which together contribute to the complex cognitive network that guide the sound localization in the space and in difficult situations.
This suggests the necessity of a multimodal rehabilitation and a multidisciplinary care in Usher Syndrome patients. Results should be also considered to support hearing impaired children, especially in case of multiple comorbidities, to improve the school environments, teachers’ awareness, and promote learning.
Author Contributions
Orzan E., Di Cesare T. Michieletto P. and Bonati M.T. conceived of the presented idea and planned the experiments. Di Cesare T., Michieletto P., Cossu P. and De Caro F. carried out the tests and contributed to sample preparation. Orzan E. and Bonati M.T. contributed to the interpretation of the results. Di Cesare T. and Orzan E. took the lead in writing the manuscript. All authors provided critical feedback and helped shape the research, analysis and manuscript.
Funding
This research received no external funding.
Institutional Review Board Statement
the study was approved by the Ethical Committee of Institute for Maternal and Child Health - IRCCS, “Burlo Garofolo”, Trieste, Italy, under the name and number "Ricerca Corrente 17/23"
Informed Consent Statement
Informed consent was obtained from parents of all subjects involved in the study.
Data Availability Statement
The data presented in this study are available on request from the corresponding author.
Acknowledgments
We acknowledge the service of Genetics of the Institute for Maternal and Child Health - IRCCS, “Burlo Garofolo”, Trieste, Italy for their support and collaboration. We also acknowledge the families of the patients included.
Conflicts of Interest
The authors declare no conflicts of interest.
References
- Lieu, J. E. C., Kenna, M., Anne, S., & Davidson, L. (2020). Hearing Loss in Children: A Review. JAMA, 324(21), 2195–2205. [CrossRef]
- Watkin P, Baldwin M. The longitudinal follow up of a universal neonatal hearing screen: the implications for confirming deafness in childhood. Int J Audiol. 2012;51:519–28. [CrossRef]
- Wroblewska-Seniuk, K. E., Dabrowski, P., Szyfter, W., & Mazela, J. (2017). Universal newborn hearing screening: methods and results, obstacles, and benefits. Pediatric research, 81(3), 415–422. [CrossRef]
- Li MM, Tayoun AA, DiStefano M, Pandya A, Rehm HL, Robin NH, Schaefer AM, Yoshinaga-Itano C; ACMG Professional Practice and Guidelines Committee. Electronic address: documents@acmg.net. Clinical evaluation and etiologic diagnosis of hearing loss: A clinical practice resource of the American College of Medical Genetics and Genomics (ACMG). Genet Med. 2022 Jul;24(7):1392-1406. [CrossRef]
- Reiners J, Nagel-Wolfrum K, Jürgens K, Märker T, Wolfrum U. Molecular basis of human Usher syndrome: deciphering the meshes of the Usher protein network provides insights into the pathomechanisms of the Usher disease. Exp Eye Res. 2006 Jul;83(1):97-119. [CrossRef]
- Delmaghani S, El-Amraoui A. The genetic and phenotypic landscapes of Usher syndrome: from disease mechanisms to a new classification. Hum Genet. 2022 Apr;141(3-4):709-735. [CrossRef]
- Castiglione A, Möller C. Usher Syndrome. Audiol Res. 2022 Jan 11;12(1):42-65. [CrossRef]
- Wahlqvist M, Möller C, Möller K, Danermark B. Similarities and Differences in Health, Social Trust, and Financial Situation in People With Usher Syndrome, a Bio-Psychosocial Perspective. Front Psychol. 2020 Aug 28;11:1760. [CrossRef]
- Hornsby BWY, Camarata S, Cho SJ, Davis H, McGarrigle R, Bess FH. Development and Evaluation of Pediatric Versions of the Vanderbilt Fatigue Scale for Children With Hearing Loss. J Speech Lang Hear Res. 2022 Jun 8;65(6):2343-2363. [CrossRef]
- Puglisi, G. E., Warzybok, A., Hochmuth, S., Visentin, C., Astolfi, A., Prodi, N., & Kollmeier, B. (2015). An Italian matrix sentence test for the evaluation of speech intelligibility in noise. International journal of audiology, 54 Suppl 2, 44–50. [CrossRef]
- Gulli, A., Fontana F., Aruffo A., Orzan E., and Muzzi E. ‘Previous Binaural Experience Supports Compensatory Strategies in Hearing- Impaired Children’s Auditory Horizontal Localization’. PloS One 19, no. 12 (2024): e0312073. [CrossRef]
- Halmagyi GM, Chen L, MacDougall HG, Weber KP, McGarvie LA, Curthoys IS. The Video Head Impulse Test. Front Neurol. 2017 Jun 9;8:258. [CrossRef]
- Oderinlo O, Bogunjoko T, Hassan AO, Idris O, Dalley A, Oshunkoya L, Odubela T. Normal central foveal thickness in a thousand eyes of healthy patients in sub Saharan Africa using fourier domain optical coherence tomography. Niger J Clin Pract. 2023 Mar;26(3):331-335. [CrossRef]
- Pole C, Ameri H. Fundus Autofluorescence and Clinical Applications. J Ophthalmic Vis Res. 2021 Jul 29;16(3):432-461. [CrossRef]
- Amorim AM, Ramada AB, Lopes AC, Duarte Silva E, Lemos J, Ribeiro JC. Vestibulo-ocular reflex dynamics with head-impulses discriminates Usher patients type 1 and 2. Sci Rep. 2024 Feb 14;14(1):3701. [CrossRef]
- Yao L, Zhang L, Qi LS, Liu W, An J, Wang B, Xue JH, Zhang ZM. The Time Course of Deafness and Retinal Degeneration in a Kunming Mouse Model for Usher Syndrome. PLoS One. 2016 May 17;11(5):e0155619. [CrossRef]
- Guidetti G, Guidetti R, Manfredi M, Manfredi M. Vestibular pathology and spatial working memory. Acta Otorhinolaryngol Ital. 2020 Feb;40(1):72-78. [CrossRef]
- Stingl K, Kurtenbach A, Hahn G, Kernstock C, Hipp S, Zobor D, Kohl S, Bonnet C, Mohand-Saïd S, Audo I, Fakin A, Hawlina M, Testa F, Simonelli F, Petit C, Sahel JA, Zrenner E. Full-field electroretinography, visual acuity and visual fields in Usher syndrome: a multicentre European study. Doc Ophthalmol. 2019 Oct;139(2):151-160. [CrossRef]
Figure 1.
Correlation analysis for mean Vanderbilt fatigue scale questionnaire (m-VFS).
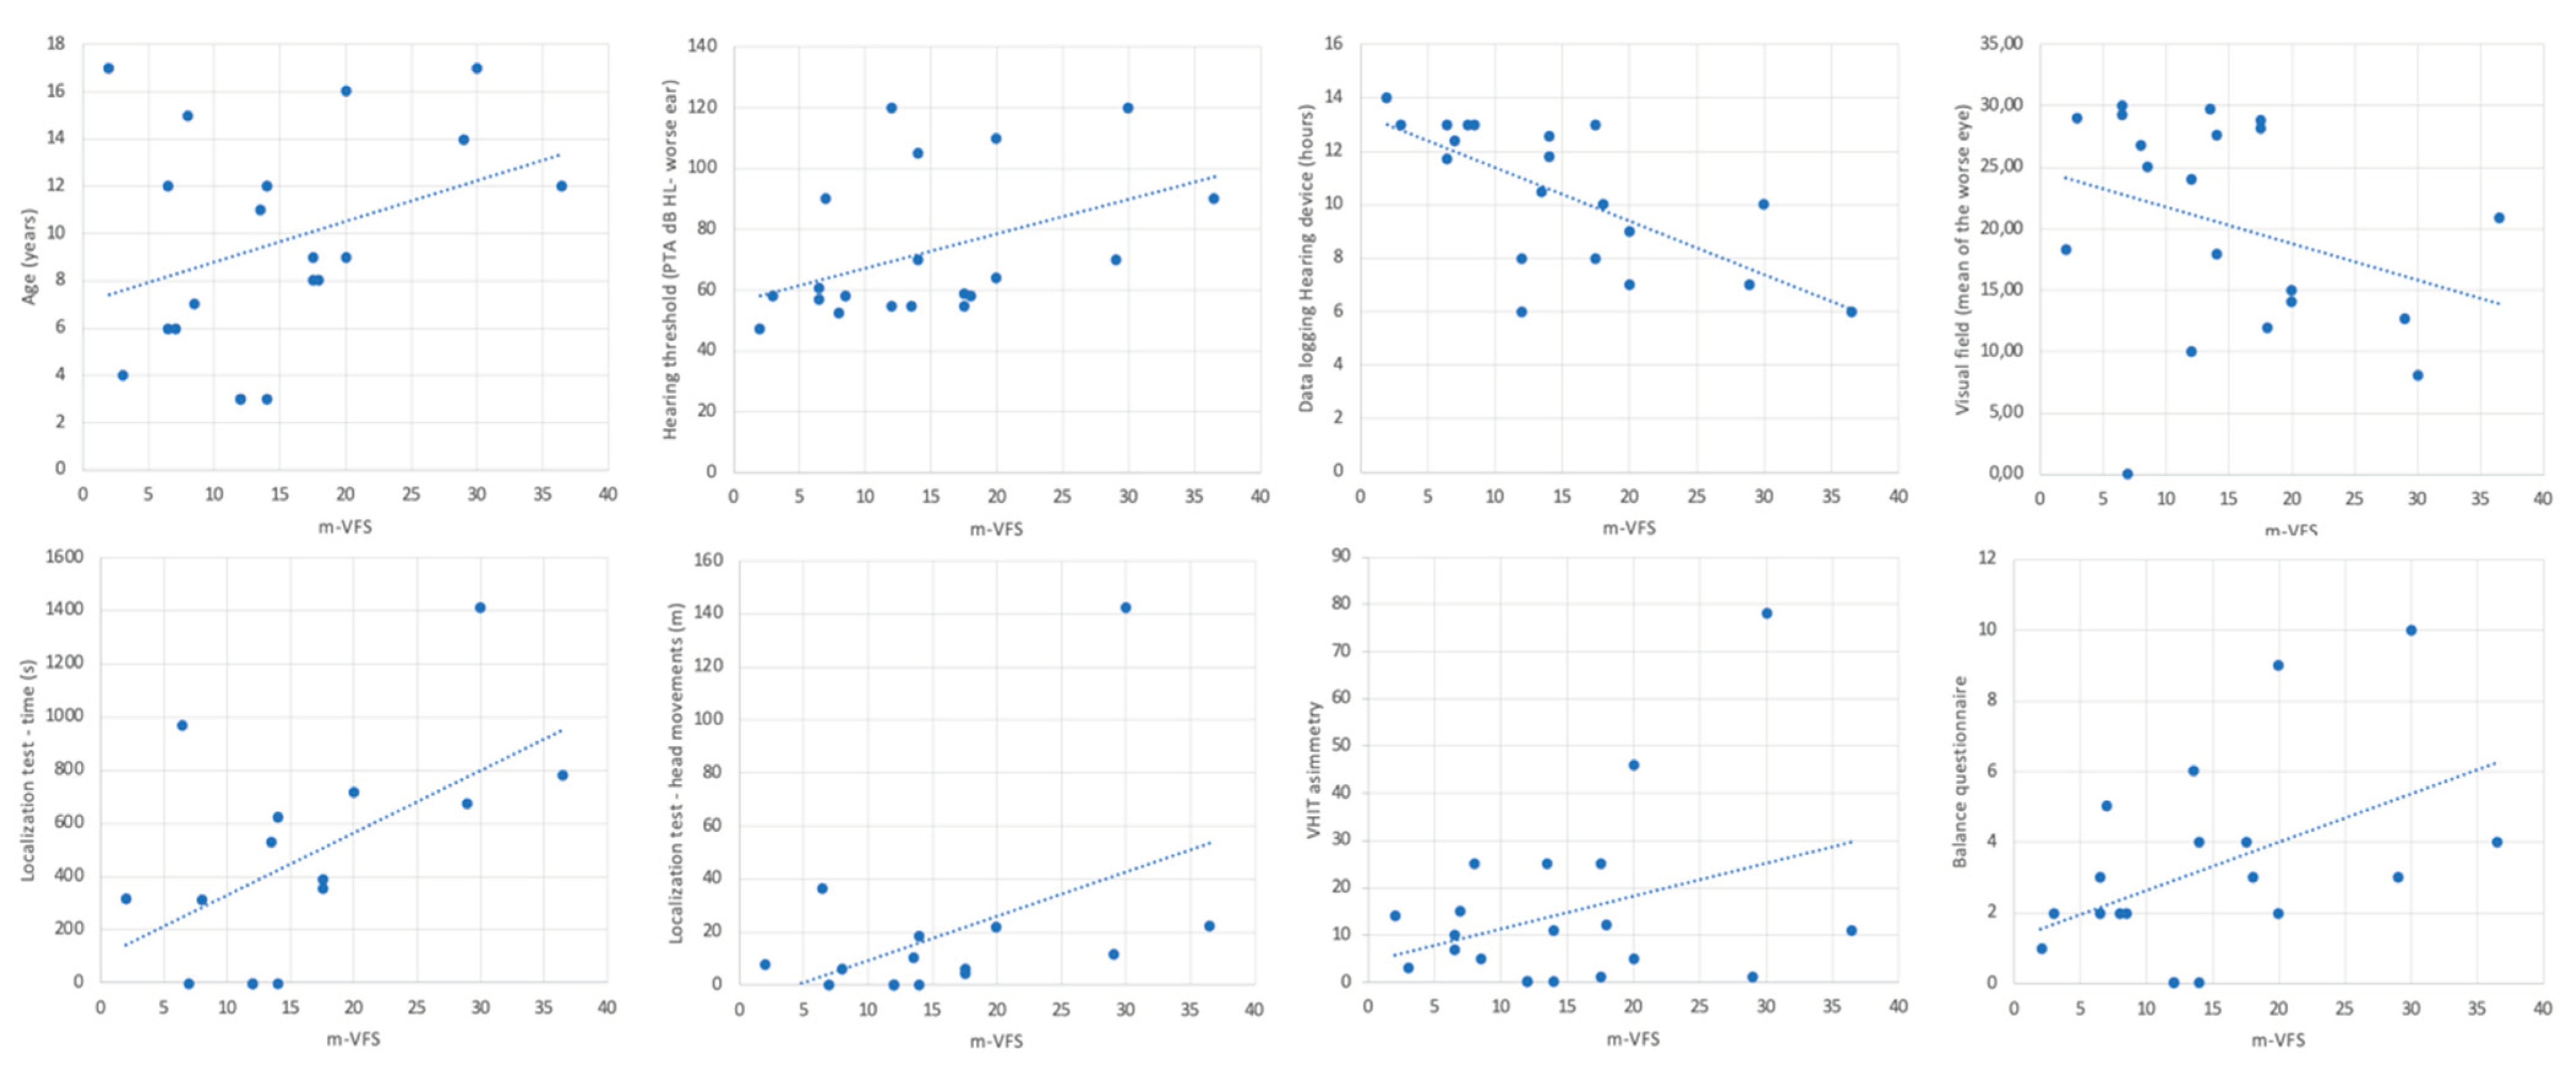

Table 1.
demographic characteristics of patients and their genetic diagnosis.
| Patient | Age | Sex | Diagnosis | Gene | Mutation |
|---|---|---|---|---|---|
| N1 | 12 | M | USH2C | ADGRV1 (NM_032119.4) | c.13655dupT |
| N2 | 6 | M | USH1 | CDH23 (NM_022124.6) | c.9433C>T |
| N3 | 14 | M | USH2A | USH2A (NM_206933.4) | c.11864G>A |
| N4 | 12 | M | USH2A | USH2A (NM_206933.4) | c.11864G>A |
| N5 | 7 | F | USH2A | USH2A (NM_206933.2) | c.2276G>T |
| N6 | 6 | F | USH2A | USH2A (NM_206933.4) | del of exons 5-->10 |
| N7 | 16 | F | USH1B | MYO7A (NM_000260.4) | c.3719G>A |
| N8 | 8 | F | USH2C | ADGRV1 (NM_032119.4) | c.10084C>T |
| N9 | 3 | F | USH1D | CDH23 (NM_022124.6) | c.3646_3647delCT |
| N10 | 17 | M | USH2A | USH2A (NM_206933.4) | c.11864G>A |
| N11 | 15 | M | USH2A | USH2A (NM_206933.4) | c.11864G>A |
| N12 | 4 | F | USH2A | USH2A (NM_206933.4) | c.232T>G |
| N13 | 3 | F | USH2A | USH2A (NM_206933.4) | c.5199delATATGTTTCAT |
| N14 | 9 | M | USH2A | USH2A (NM_206933.4) | c.5199delATATGTTTCAT |
| N15 | 11 | F | USH2A | USH2A (NM_206933.4) | c.9270C>A |
| N16 | 9 | M | USH2A | USH2A (NM_206933.4) | c.2099_2120delGGACAGTGGATGGAGATATTAC |
| N17 | 3 | F | USH1C | USH1C (NM_005709.4) | c.711delT |
| N18 | 17 | M | USH1D | CDH23 (NM_022124.6) | c.5985C>A |
| N19 | 12 | F | USH2C | ADGRV1 (NM_032119.3) | c.13655dupT |
| N20 | 8 | M | USH2A | USH2A (NM_206933.4) | c.1055C>T |
Disclaimer/Publisher’s Note: The statements, opinions and data contained in all publications are solely those of the individual author(s) and contributor(s) and not of MDPI and/or the editor(s). MDPI and/or the editor(s) disclaim responsibility for any injury to people or property resulting from any ideas, methods, instructions or products referred to in the content. |
© 2025 by the authors. Licensee MDPI, Basel, Switzerland. This article is an open access article distributed under the terms and conditions of the Creative Commons Attribution (CC BY) license (http://creativecommons.org/licenses/by/4.0/).
Copyright: This open access article is published under a Creative Commons CC BY 4.0 license, which permit the free download, distribution, and reuse, provided that the author and preprint are cited in any reuse.


