Submitted:
10 May 2025
Posted:
12 May 2025
You are already at the latest version
Abstract
This paper introduces the Knowledge Retention Score (KRS) as a novel performance metric to evaluate the effectiveness of Knowledge Distillation (KD) across diverse tasks including image classification, object detection, and image segmentation. Unlike conventional metrics that solely rely on accuracy, mean Average Precision (mAP), or Intersection over Union (IoU), KRS captures both feature similarity and output agreement between the teacher and student networks, offering a more nuanced measure of knowledge transfer. A total of 36 experiments were conducted using various KD methods—Vanilla KD, SKD, FitNet, ART, UET, GKD, GLD, and CRCD—across multiple datasets and architectures. The results showed that KRS is strongly correlated with conventional metrics, validating its reliability. Moreover, ablation studies confirmed KRS's sensitivity in reflecting the knowledge gained post-distillation. The paper also ranked KD methods by performance gain, revealing that techniques like UET and GLD consistently outperform others. Lastly, the architectural generalization analysis demonstrated KRS's robustness across different teacher–student pairs. These findings establish KRS as a comprehensive and interpretable metric, capable of guiding KD method selection and providing deeper insight into knowledge transfer beyond standard performance measures.
Keywords:
knowledge distillation
; model compression
; knowledge retention score
; deep neural network
; performance evaluation metric
; artificial intelligence
; advanced computing
; image classification
; object detection
; image segmentation
1. Introduction
In recent years, deep neural networks (DNNs) have become indispensable in a wide range of applications, from image classification and object detection [1,2,3] to natural language processing [4]. However, the deployment of these models in real-world scenarios often encounters limitations due to their substantial computational and memory requirements, making them challenging to use on resource-constrained devices such as mobile phones, embedded systems, and edge devices [5]. This has driven the demand for effective model compression techniques that retain the accuracy and performance of large models while reducing their complexity. Knowledge Distillation (KD) has emerged as a prominent paradigm to address this challenge by training a smaller, lightweight model (student) to replicate the behavior of a larger, high-capacity model (teacher). KD not only compresses the model but also maintains efficiency, making it well-suited for real-time applications where latency, power efficiency, and memory usage are critical constraints. to natural language processing.
Originally proposed by [6], KD has evolved significantly and now encompasses a variety of approaches, broadly categorized as response-based, feature-based, and relation-based methods [7]. While response-based KD focuses on transferring the teacher’s output probabilities (logits) to the student, feature-based KD leverages intermediate feature representations to pass richer knowledge, and relation-based KD captures relationships between data points or features within the teacher model. Each approach brings unique advantages, with feature-based KD, in particular, demonstrating potential for visual tasks where preserving fine-grained information is crucial [8]. This diversity in KD techniques, however, has led to inconsistencies in how these methods are evaluated. Studies often use different datasets, architectures, and training conditions, making it difficult to perform direct comparisons and draw reliable conclusions about each technique’s effectiveness.
Despite these advancements, the field of KD faces a critical challenge: the lack of consistent and universal metrics for evaluating the effectiveness of KD techniques across diverse tasks, datasets, and model architectures. Current evaluations of KD methods are often inconsistent, with each study using different datasets, teacher-student configurations, and evaluation metrics, making it difficult to compare methods directly [9]. Additionally, existing evaluations tend to focus narrowly on accuracy improvements, often overlooking other crucial aspects of model performance, such as knowledge retention, computational efficiency, generalizability, and prediction confidence.
Knowledge Retention is a particularly important aspect of KD, reflecting the student model’s ability to inherit and replicate the knowledge embedded in the teacher model [10,11]. However, there is currently no standardized way to measure knowledge retention, and it is often implicitly inferred from accuracy metrics alone. Given the diversity of KD methods and the complexity of tasks they are applied to, a more nuanced and universal approach to measuring knowledge retention is necessary. A well-designed knowledge retention metric would not only help in comparing KD methods objectively but would also provide insights into the quality of knowledge transfer beyond simple accuracy.
This study aims to address this gap by proposing a universal knowledge retention metric that can evaluate KD models consistently across different datasets, tasks, and teacher-student configurations. The proposed metric, which combines feature similarity and output agreement, captures the degree to which the student model retains the learned representations and decision boundaries of the teacher model. By considering both feature-level and output-level agreement, this metric offers a comprehensive view of knowledge retention that accounts for the richness and structure of the teacher’s knowledge, regardless of model architecture or dataset complexity.
Through this work, we seek to advance KD evaluation practices by introducing a metric that facilitates objective, standardized comparisons of KD methods. This universal knowledge retention metric has the potential to serve as a foundation for future research, guiding the development of more effective KD techniques that balance accuracy, efficiency, and robustness. By offering a unified framework for evaluating KD performance, this study aims to support the continued progress of KD as a viable solution for deploying high-performing, compact models in a wide range of practical applications.
2. Literature Review
Knowledge Distillation (KD) has evolved to encompass a range of techniques that differ in how they transfer knowledge from the teacher model to the student model. These approaches can generally be categorized into three main types: response-based, feature-based, and relation-based KD.
Response-Based KD is the foundational approach and was the method initially introduced by [6]. This technique transfers knowledge by using the softmax output probabilities (or logits) from the teacher model as “soft labels” for the student model. By learning from these soft labels, the student model can capture not only the correct classes but also the confidence distribution across all classes, which carries valuable information about the teacher’s understanding of the data. However, while response-based KD is simple and effective, it primarily focuses on the output layer of the teacher model, limiting its ability to capture the rich hierarchical representations embedded within the intermediate layers [12]. This constraint has motivated researchers to explore more complex forms of knowledge transfer that incorporate deeper levels of the teacher model.
Feature-Based KD addresses this limitation by leveraging the intermediate feature representations of the teacher model. Rather than focusing solely on the final output, feature-based methods enable the student model to learn from the teacher’s feature maps at various stages. This approach captures the spatial and semantic information that the teacher has learned, making it particularly useful for tasks that rely heavily on detailed feature hierarchies, such as image classification and object detection. A notable example of feature-based KD is the FitNets approach [8], where the student model is guided by intermediate layers from the teacher to refine its internal feature representations. Another significant technique, Attention Transfer (AT), uses spatial attention maps from the teacher to guide the student, ensuring alignment in the regions of the image that are most important for task performance [13]. Feature-based KD has shown to improve the student model’s ability to generalize complex patterns from data, making it an increasingly popular choice in the field.
Relation-Based KD takes knowledge transfer a step further by capturing relational knowledge between data points, features, or even layers within the teacher model. Instead of transferring individual output values or feature maps, relation-based methods focus on the relationships and dependencies that the teacher model has learned. This category of KD is particularly valuable in scenarios where understanding the context or structure among elements is essential, such as relational reasoning tasks. For instance, Relational Knowledge Distillation (RKD) captures the distance relationships between pairs of data points in the feature space, allowing the student to learn not only the representations but also the structural relationships that the teacher has identified [14]. This category of KD provides an additional layer of abstraction, enabling the student to mimic not just the representations but also the interconnections present in the teacher’s learned features.
Most studies on KD rely heavily on accuracy improvements in the student model as the primary metric for evaluating the effectiveness of KD methods, as depicted in the review of [5,7,15]. Typically, the success of KD is determined by how closely the student model’s performance approaches that of the teacher model, measured through accuracy on a target task, such as classification or object detection. While accuracy is a fundamental indicator of a model’s ability to generalize on unseen data, using it as the sole metric in KD evaluation has limitations. Accuracy alone does not account for the nuanced process of knowledge transfer from the teacher to the student, nor does it reveal how well the student model has absorbed the hierarchical feature representations, patterns, or complex relationships learned by the teacher.
Reliance on accuracy as the primary measure of KD success overlooks several crucial aspects of the KD process. Accuracy does not capture feature-level retention, meaning that while the student may produce correct predictions, it might not have retained the underlying knowledge embedded in the teacher’s intermediate representations [16]. This can be problematic in applications that require the model to make decisions based on intricate patterns, spatial dependencies, or contextual cues that go beyond simple classification.
Moreover, accuracy fails to reflect interpretability or explainability in KD [17]. Interpretability is becoming increasingly important in fields like healthcare [18] and finance [19], where understanding the rationale behind predictions is critical. Without metrics that assess the alignment between the teacher and student in terms of decision-making processes, it is difficult to determine if the student model truly mirrors the teacher’s knowledge or simply arrives at the same conclusions by different means.
Finally, accuracy does not account for model efficiency, which is a key reason for employing KD in the first place. Many KD studies focus on compressing the teacher model into a lighter student model to reduce computational and memory costs for deployment. However, accuracy-only evaluations overlook the balance between performance and efficiency, potentially favoring methods that yield marginally higher accuracy at a substantial computational cost, which might be unsuitable for real-world applications.
Knowledge retention, the extent to which the student model internalizes and preserves the patterns, representations, and relational understanding of the teacher model could serve as the universal metric that KD research has been seeking. Unlike traditional evaluation metrics that focus only on final outputs, such as accuracy, knowledge retention goes deeper by assessing how well the student model captures the quality of knowledge transferred from the teacher [20]. This makes it a versatile and comprehensive tool for comparing KD methods, regardless of task, architecture, or dataset, as it directly measures the depth of knowledge transfer rather than just surface-level performance.
Currently, knowledge retention is usually inferred indirectly through intermediate feature comparisons and output agreement. Common methods include feature map similarity to measure the alignment between teacher and student representations at different layers, and output agreement to assess how closely the student replicates the teacher’s output distribution.
To effectively measure knowledge retention in KD, it is essential to evaluate both feature similarity and output agreement between the teacher and student models. Feature similarity approaches, such as cosine similarity [21], mean squared error (MSE) [22], and Centered Kernel Alignment (CKA) [23], assess the alignment of intermediate representations, providing insight into how well the student model captures the teacher’s learned features at various layers. These methods are particularly relevant for KD, as they allow for a deeper understanding of the transferred hierarchical and spatial patterns that contribute to task performance.
Similarly, output agreement metrics, such as KL Divergence [22], mutual information [24], and Top-N agreement [25], focus on the final predictions of the models. These metrics gauge how closely the student model mimics the teacher’s output distribution, reflecting the fidelity of the student’s decision boundaries to those of the teacher. Both feature similarity and output agreement provide valuable but distinct insights into knowledge retention.
Combining feature similarity and output agreement into a composite metric could yield a more comprehensive evaluation of knowledge retention [26], capturing both the intermediate knowledge and output fidelity of the student model. Such a metric would offer a holistic view of KD effectiveness, ensuring that the student retains both internal representations and final predictions, providing a richer, more nuanced assessment of knowledge transfer.
3. Materials and Methods
This section focuses on developing and validating the Knowledge Retention Score (KRS) as a universal metric for Knowledge Distillation (KD).
3.1. Developing the Knowledge Retention Score (KRS)
KRS is a composite metric designed to measure the effectiveness of knowledge transfer from a teacher model to a student model in Knowledge Distillation (KD). Unlike traditional metrics that focus on final outputs, KRS evaluates both intermediate feature alignment and final output consistency, offering a more holistic view of the student’s retention of the teacher’s knowledge. KRS combines two key components: (a) feature similarity; and (b) output agreement. By integrating feature similarity and output agreement, KRS provides a comprehensive measure of knowledge retention, making it applicable across tasks, datasets, and model architectures. This combined metric allows for objective, standardized comparisons of KD methods, ensuring that both feature-level and output-level knowledge transfer are effectively captured in the evaluation.
3.1.1. Feature Similarity Calculation
Feature similarity calculation is a crucial component of the KRS as it measures the alignment between the intermediate representations of the teacher and student models. This alignment reflects the student model’s ability to capture and replicate the hierarchical features learned by the teacher, which is essential for effective knowledge transfer, especially in complex tasks where spatial patterns and semantic information play key roles. To calculate feature similarity, we focus on extracting and comparing feature maps from corresponding layers in the teacher and student models.
For this study, we use Centered Kernel Alignment (CKA) as the primary method for feature similarity calculation due to its robustness and effectiveness in comparing high-dimensional feature space.
Given the feature maps of the teacher and student models at a particular layer , represented as and for input , we calculate CKA by computing first the Centered Gram Matrices, and , for the teacher and student network, respectively using:
where is the number of elements in the feature map and 1 is an matrix of ones. This Centered Gram Matrices measure the similarity between data points in a high-dimensional space, adjusted to focus on relative patterns rather than absolute values. Using also equation 1, we compute for .
Next, we can now calculate the CKA similarity using:
where is the trace of the matrix, which is defined as the sum of elements along its main diagonal. Equation 2 will yield a scalar value ranging from 0 to 1. A CKA score of 1 indicates perfect alignment between the feature maps of the teacher and the student, and a score of 0 is the opposite.
For a comprehensive feature similarity score, we average the CKA similarity values across multiple layers and inputs in the dataset using Layer-Wise Averaging shown in equation 3:
where is the dataset used. This yields an average similarity score for each layer, reflecting how well the student replicates the teacher’s feature representations at that level.
To obtain a single feature similarity score, we further average across all selected layers:
This aggregated score represents the feature similarity component of the KRS, providing a comprehensive measure of feature alignment across the model.
3.1.2. Output Agreement Calculation
The Output Agreement Calculation component of the KRS measures the alignment between the output predictions of the teacher and student models. This alignment indicates how closely the student model mimics the teacher's decision boundaries, going beyond feature-level alignment to assess the final outputs. Output agreement reflects the student model's fidelity in producing predictions similar to the teacher’s, providing insights into the quality of knowledge transfer at the output level.
To calculate output agreement, we use KL Divergence (Kullback-Leibler Divergence) as the primary metric, as it is a widely accepted measure of the similarity between two probability distributions. In knowledge distillation, KL Divergence quantifies the difference between the output probability distributions of the teacher and student models, assessing how well the student replicates the teacher's probabilistic predictions.
Let represent the probability distribution over classes produced by the teacher model for input , and represent the corresponding probability distribution produced by the student model. For each input the KL Divergence between the teacher’s and student’s output distributions is given by:
where and are the predicted probabilities for the -th class class from the teacher and student, respectively. KL Divergence is minimized when the student’s output distribution closely matches that of the teacher, indicating high agreement. Since lower KL Divergence values indicate higher similarity, we convert KL Divergence into an Output Agreement Score by normalizing the KL Divergence by dividing it by and then subtracting it from 1. In this case, we set the value of to the maximum computed KL in the validation phase. Hence, for every input , the output agreement score is calculated as:
This transformation ensures that higher values represent better agreement between teacher and student outputs.
To obtain an overall output agreement score across the dataset, we average the output agreement scores over all inputs :
where is the number of samples in the dataset . This aggregated score reflects the alignment between teacher and student outputs across the dataset, forming the output agreement component of the KRS.
3.1.3. Combining Feature and Output Components
To obtain KRS, we combine the feature similarity and output agreement components, as these together capture both intermediate and output-level alignment between the teacher and student models. This combined metric ensures that the evaluation reflects how well the student model retains the teacher’s knowledge across both learned representations and final predictions.
The overall KRS is then defined as:
where and are weights assigned to the feature similarity and output agreement components, respectively, with . The values of and can be adjusted based on the importance of feature retention versus output alignment for a given application or task.
The choice of weights allows flexibility in emphasizing different aspects of knowledge retention depending on the task requirements. Assigning more weight to the feature similarity score is appropriate for tasks where intermediate feature alignment is crucial, such as tasks that rely heavily on spatial relationships or semantic hierarchies within the data. A greater emphasis on output agreement is suitable for tasks where output consistency between teacher and student models is more critical, like classification tasks where the final prediction probabilities are paramount.
3.1.4. Interpreting the KRS
The final KRS is a single scalar value representing the overall knowledge retention of the student model. Ranging from 0 to 1, a KRS of 1 indicates perfect knowledge retention by the student, while a score of 0 signifies minimal or no retention.
3.1.5. KRS for Image Segmentation Tasks
The KRS defined in equation 8 is designed for object detection and classification tasks only. While this formulation is effective for tasks where outputs are vector-based predictions, it does not provide an optimal measure for segmentation tasks, where predictions are pixel-wise and require spatial alignment.
In segmentation, output agreement must capture the similarity of segmentation masks between the teacher and student models, reflecting accurate spatial and class overlap. Thus, for image segmentation, we replace KL Divergence with Intersection over Union (IoU), a metric that directly evaluates the overlap between the teacher’s and student’s segmentation maps.
So, for every image in the test set, let represent the segmentation mask output from the student model and epresent the segmentation mask from the teacher model. The IoU for output agreement is calculated as:
where is the number of pixels where the teacher and student segmentation masks overlap (agree on the segmentation), and is the total number of pixels in either mask. This IoU score provides a pixel-wise evaluation of agreement, specifically assessing how accurately the student replicates the teacher’s spatial segmentation.
To obtain the overall Output Agreement Score for the dataset, we average the IoU values across all validation or test samples:
This average IoU represents the degree of alignment between teacher and student across the entire segmentation task, ensuring that spatial and class overlap is consistently maintained.
The KRS for segmentation tasks combines the Feature Similarity Score (CKA) of equation 4 and the Average Output Agreement (IoU) in equation 10, and is defined as:
By adjusting the output agreement component to use IoU, this formulation of KRS accurately evaluates knowledge retention for segmentation tasks, where spatial fidelity and pixel-level agreement are crucial for performance.
3.2. Experimental Setup
The experimental setup involves selecting appropriate datasets, teacher-student model pairs, and KD techniques to rigorously evaluate the Knowledge Retention Score (KRS). This setup ensures that KRS can be tested across different architectures and tasks, validating its robustness and generalizability.
3.2.1. Dataset
To evaluate KRS effectively, we use a variety of datasets that cover different types of tasks. For image classification, a well-known classification dataset such as CIFAR-100 and Tiny ImageNet is used. These datasets contain labeled images of objects and allow us to assess KRS in a standard classification task. For object detection task, a dataset like COCO (Common Objects in Context) [27], Pascal VOC [28], and Oxford IIIT Pet is used. Object detection datasets introduce additional complexity with multi-object scenarios, enabling the evaluation of KRS in more complex feature extraction and prediction contexts. By using datasets with different characteristics (e.g., classification vs. detection, simple vs. complex images), we can evaluate the versatility of KRS across various types of tasks.
Each dataset is then split into training, validation, and test sets, as shown in Table 1. The training set is used to train the student network using KD, while the test set is used to compute the final KRS, ensuring that KRS reflects generalizable knowledge retention.
3.2.2. Teacher-Student Model Pairs
We select several teacher-student model pairs to test KRS across varying architecture complexities and parameter sizes. For instance, we will use ResNet-101/ResNet-18 to assess knowledge transfer across models with similar architectures but different capacities. Another pair is the VGG-19/AlexNet, which showcases two different architectures. Variants like WRN-40-2/WRN-16-1 are included to assess knowledge retention across wide network architectures. EfficientNet-B7/EfficientNet-Lite pair assesses KRS in the context of highly optimized, efficient models.
In Table 2, we summarized the compression rate of the abovementioned teacher-student pair used in this study.
3.2.3. Dataset-Model Pairing Strategy
The dataset-model pairing strategy for validating KRS involves carefully selecting combinations of teacher-student model pairs and datasets that cover a range of computer vision tasks. This approach ensures that KRS can be evaluated across different types of knowledge distillation (KD) tasks, demonstrating its versatility and reliability as a universal metric. For image classification tasks, datasets such as CIFAR-100, Tiny ImageNet, and Oxford-IIIT Pet will be paired with model pairs like ResNet-101/ResNet-18 and VGG-19/AlexNet. These combinations are chosen for their balance between architectural complexity and relevance to classification, allowing for a thorough assessment of how KRS captures knowledge retention in models of varying sizes and designs.
For object detection, we will use more complex and robust datasets like COCO and PASCAL VOC, which pose unique challenges due to the multi-object nature and rich annotations. These datasets will be paired with teacher-student model configurations such as WRN-40-2/WRN-16-1 and EfficientNet-B7/EfficientNet-Lite. The selected pairs are chosen to reflect modern, efficient architectures that can test whether KRS effectively evaluates knowledge retention in models that prioritize parameter and computational efficiency.
To extend the validation of KRS to image segmentation, we will use the Oxford-IIIT Pet dataset, adapted for segmentation tasks. This will involve evaluating segmentation-specific outputs using IoU as the output agreement measure while maintaining CKA for feature similarity. The models paired for segmentation will help assess whether KRS can accurately reflect pixel-level knowledge retention, a critical aspect of segmentation.
3.2.4. Knowledge Distillation Techniques
In Table 3, we outline the comprehensive pairing of the datasets used in this study, alongside the corresponding teacher-student network pairs and the KD methods implemented to validate the KRS. This table provides a clear overview of how each dataset is matched with appropriate model architectures and the specific KD techniques replicated to assess the robustness and applicability of KRS across different tasks.
For the image classification task, we implemented Vanilla KD as it represents the foundational KD approach specifically designed for image classification. Additionally, SKD (Student-friendly KD) was selected due to the clear implementation guidelines provided by its authors and its demonstrated promising results in prior studies. This combination allows for a thorough evaluation of KRS using both a classic and an advanced response-based KD method.
For the object detection task, we implemented FitNet, the earliest feature-based KD model, to serve as a benchmark. Alongside FitNet, we incorporated two modern KD techniques: ART (Ambiguity-aware Teacher KD) and UET (Uncertainty Estimation-Discriminative Knowledge Extraction-Knowledge Transfer). Both ART and UET introduce uncertainty awareness into the KD process and have reported improved performance in recent studies. By using KRS, we aim to assess whether these newer methods genuinely enhance knowledge retention compared to FitNet, providing a more comprehensive evaluation of their effectiveness.
For the image segmentation task, we implemented GKD (Graph-based Knowledge Distillation), the first relation-based KD method, as a foundational benchmark. In addition, we included GLD (Global and Local Logits Densely Connected Relations) due to its significant impact and recognition within the research community. We also consider Complementary Relation Constrastive Distillation (CRCD) for its impact and replicability. This combination allows us to evaluate KRS's effectiveness in assessing knowledge retention across both pioneering and influential relation-based KD techniques.
3.3. Implementation Strategy
To reduce bias in the experiment, it is essential to follow the same steps and procedures for each teacher-student model pair, dataset, and KD technique to ensure consistency and fairness in the evaluation process. This section outlines our implementation strategies.
3.3.1. Image Augmentation
In this study, image augmentation is employed during the training phase to enhance the generalization and robustness of both the teacher and student models. Various techniques, including random cropping, flipping, and brightness adjustments, are used to generate a diverse set of training examples, helping to prevent overfitting and improve performance on new data.
3.3.2. Training Process
The training process in this study consists of two distinct phases. In the first phase, we build both the teacher and student networks from scratch and train them on the datasets listed in Table 3. We then conduct hyperparameter tuning on both networks using Random Search, chosen for its balance between effectiveness and efficiency. Baseline performance is measured on the validation dataset, using accuracy (A) for image classification, mean average precision (mAP) for object detection, and Intersection over Union (IoU) for segmentation. Also, we compute the KRS between the teacher and the student network to baseline its performance. This will help us observe the effect of KD process in the knowledge retention of the student. The second phase, involving the KD-based training of the student model, is discussed in the next subsection.
3.3.3. Knowledge Distillation
In the second phase of training, we implement the KD model to transfer knowledge from the teacher network to the student, as specified in Table 3. Each KD method is meticulously replicated according to the original procedures outlined by the respective authors to ensure methodological fidelity. To maintain consistency across all teacher-student pairs listed in Table 3, the teacher network remains in inference mode throughout the knowledge transfer process. As in the first phase, we calculate accuracy (A), mean average precision (mAP), and Intersection over Union (IoU), depending on the task being performed.
3.3.4. Evaluation of Student’s Performance Using KRS
Upon completing the KD process, both the teacher and student networks are set to inference mode to evaluate their accuracy (A), mean average precision (mAP), and Intersection over Union (IoU) on the test dataset. To determine the KRS for the student model, intermediate features must be captured from both the teacher and student networks at various levels of abstraction. Figure 1 provides an example of these feature maps taken from different layers in the ResNet-101 and ResNet-18 models, specifically from the outputs of Conv2_x, Conv3_x, Conv4_x, and Conv5_x. For other teacher-student network pairs used in this study, Table 4 lists the layers from which feature maps are extracted.
4. Results and Discussion
In total, we conducted 36 experiments in this study, based on the combinations outlined in Table 3. To streamline our analysis and simplify our graphical representations, each experiment has been assigned a unique ID, as shown in Table 5. This system not only enhances the clarity of our graphs but also facilitates a more concise discussion by allowing us to refer to experiments by their ID.
4.1. Performance Improvement Before and After KD
4.1.1. Analysis Using Conventional Performance Metrics
In Figure 2, it is evident that across all experiments, the performance of the student network improves after applying KD, regardless of the dataset, KD model, or evaluation metric. This consistent improvement highlights the effectiveness of KD in enhancing the student network’s capability to generalize better. Specifically, in Figure 2(a), the accuracy gains after KD are most pronounced in the Oxford-IIIT Pet dataset, while they are relatively lower for Tiny ImageNet. This discrepancy could be attributed to the differing complexity and inter-class variability of these datasets. The Oxford-IIIT Pet dataset, with fewer classes and more distinct visual features, likely allows for easier knowledge transfer, resulting in higher accuracy improvements. In contrast, Tiny ImageNet, with its large number of classes and high similarity between images, presents a more challenging learning environment, making knowledge transfer less effective and resulting in comparatively lower accuracy gains. These findings suggest that KD’s impact can vary significantly depending on the dataset’s complexity and characteristics. Additionally, Figure 2(a) shows that ResNet-18 consistently outperforms AlexNet both before and after KD. This difference in performance can be attributed to the architectural strengths of ResNet-18, which incorporates skip connections, allowing for deeper and more effective feature extraction compared to the shallower AlexNet. The skip connections in ResNet-18 mitigate the vanishing gradient problem, enabling the model to learn more complex patterns, which is particularly beneficial in image classification tasks. Consequently, ResNet-18's ability to retain and leverage knowledge from the teacher network in the KD process results in a more substantial performance boost compared to AlexNet. This reinforces the effectiveness of ResNet-18 as a student network in KD settings, especially when handling more intricate datasets.
In Figure 2(b), the mean average precision (mAP) for the student models is slightly higher on the PASCAL VOC dataset compared to COCO. This can be attributed to the greater complexity and diversity of the COCO dataset, which includes more varied objects, categories, and challenging backgrounds, making the detection task inherently more difficult. Consequently, the models perform slightly better on PASCAL VOC, which has a more straightforward set of categories and typically less complex scenes. In terms of student model performance, EfficientNet-Lite consistently outperforms WRN-16-1. This difference can be attributed to the architecture of EfficientNet-Lite, which is optimized for better parameter efficiency and feature extraction capabilities, allowing it to capture and represent more nuanced information. EfficientNet’s design leverages compound scaling, which balances network depth, width, and resolution, providing a more robust foundation for complex tasks such as object detection.
In Figure 2(c), which presents the results of the image segmentation task on the Oxford-IIIT Pet dataset, we observe an increase in IoU scores across all student models after applying KD. Notably, the student model derived from EfficientNet consistently achieves the highest IoU, both before and after KD, highlighting its superior feature extraction capabilities and architectural efficiency for segmentation tasks. EfficientNet's compound scaling strategy enables it to maintain high-resolution feature maps and capture finer details essential for accurate segmentation. Following EfficientNet, ResNet-based students show a moderate increase in IoU, benefiting from the depth and residual connections that facilitate the learning of complex patterns. WRN-16-1 performs reasonably well but lags behind due to its comparatively simpler architecture. AlexNet demonstrates the lowest IoU performance, reflecting its older design and limited depth, which constrains its ability to capture detailed spatial information necessary for precise segmentation. This ranking underscores the importance of modern, optimized architectures like EfficientNet for high-precision segmentation tasks.
While Figure 2(a–c) highlight clear improvements in student network performance post-KD across various datasets and tasks, these conventional metrics alone—accuracy, mAP, and IoU—are insufficient to capture the full scope of knowledge transfer effectiveness. Traditional metrics provide only a surface-level understanding of KD's impact, focusing primarily on output accuracy and precision but failing to assess how well the student model retains critical knowledge from the teacher. This limitation becomes particularly evident in complex tasks and datasets where nuances in feature retention and relational learning are essential. Hence, a more comprehensive metric like the KRS is necessary. KRS goes beyond surface performance to evaluate how effectively the student internalizes and utilizes knowledge from the teacher, offering a more holistic measure of KD’s success. This underscores the need for KRS as a complementary metric to conventional evaluations, providing a deeper insight into the true effectiveness of KD methods.
4.1.2. Student Model Performance Using KRS Before and After KD
After analyzing the performance of the KD models we chose using conventional performance metrics, our next goal is to analyze the baseline KRS between the student and teacher model before applying KD techniques. As depicted in equation 8, KRS is composed of the Feature Similarity Score (FSS) and Average Output Agreement (AOA) weighted by hyperparameters and , respectively. For the image classification tasks where logit-based KD is used in the experiments, the KRS was configured with an alpha value of 0.3 and a beta value of 0.7, reflecting the balance between the hard labels and the softened teacher logits during training. For the object detection and image segmentation tasks, an alpha value of 0.7 and a beta value of 0.3 were used to prioritize the alignment of intermediate features over the softened teacher logits. This configuration ensures that the student model effectively captures the spatial and structural information necessary for these tasks, where feature-level guidance plays a more critical role.
The graph showing the results for experiment ID no. 1 to 12 of Table 5 is presented in Figure 3, which underscores the pivotal role of KD in enhancing the KRS for both ResNet-18 and AlexNet across all datasets. However, the extent of these improvements varies substantially based on the KD technique employed, student architecture, and the complexity of the dataset. ResNet-18 consistently outperforms AlexNet, exhibiting higher baseline KRS values and larger gains after KD. For instance, on CIFAR-100, ResNet-18’s KRS increases from 42.5 before KD to 57.7 after Vanilla KD and 69.8 after SKD, representing a total improvement of 27.3 points. In comparison, AlexNet’s KRS rises from 34.4 to 48.0 with Vanilla KD and 51.5 with SKD, yielding a smaller overall improvement of 17.1 points. These trends are replicated across Tiny ImageNet and Oxford-IIIT Pet, affirming ResNet-18’s superior knowledge retention capabilities.
The superior performance of SKD over Vanilla KD is consistent across both networks and datasets. SKD leverages a student-friendly mechanism that simplifies the teacher’s outputs, aligning them with the student’s learning capacity. This tailored approach enhances the interpretability and utility of the teacher’s knowledge for the student model, as evidenced by SKD’s larger KRS improvements, particularly on datasets with more complex features. For instance, on Tiny ImageNet, AlexNet’s KRS increases by 6.5 points with SKD compared to 4.8 points with Vanilla KD, while ResNet-18 achieves a 18.4-point gain with SKD versus 13.2 points with Vanilla KD. This demonstrates SKD’s ability to effectively address the limitations of smaller and less complex architectures, such as AlexNet.
The results highlight the significant impact of the teacher-student architecture on knowledge retention. ResNet-18, with its deeper architecture and residual connections, is better equipped to learn and retain complex patterns compared to AlexNet. The residual connections facilitate efficient gradient flow and mitigate vanishing gradient issues, enabling ResNet-18 to optimize better during both baseline training and KD. Conversely, AlexNet’s simpler architecture, characterized by fewer layers and parameters, inherently limits its capacity to extract and retain the nuanced knowledge transferred from the teacher. This is evident in AlexNet’s smaller KRS gains across all datasets, reinforcing the importance of sophisticated model architectures in achieving effective knowledge retention.
The data also shows a general trend of higher KRS improvements for simpler datasets, such as Oxford-IIIT Pet, compared to more complex ones like CIFAR-100 and Tiny ImageNet. For instance, AlexNet achieves a 21.8-point KRS improvement on Oxford-IIIT Pet with SKD, compared to 13.2 points on CIFAR-100 and 11.3 points on Tiny ImageNet. However, a notable exception is observed for ResNet-18 with SKD on CIFAR-100, where the KRS improvement of 27.3 points surpasses the 23.2-point improvement on Oxford-IIIT Pet. This anomaly can be attributed to CIFAR-100’s greater feature complexity and inter-class variability, which provide more opportunities for the student model to benefit from SKD’s tailored knowledge transfer. ResNet-18’s residual connections allow it to better leverage the teacher’s superior representations in such complex datasets. On simpler datasets like Oxford-IIIT Pet, the student model’s baseline performance is already higher, leaving less room for improvement. Thus, while simpler datasets generally result in higher KRS gains due to reduced complexity, the broader feature space in more complex datasets like CIFAR-100 can sometimes amplify the benefits of SKD, especially for architectures capable of deeper learning.
Next, we analyze the results for experiment ID numbers 13 to 24, where the primary task is object detection. Across all experiments, as shown in Figure 4, UET consistently demonstrates the highest improvements in KRS, followed by ART and then FitNet. For instance, in Experiment 15, UET achieves a remarkable KRS improvement of 31.3 points on COCO, compared to ART, which delivers a KRS improvement of 19 points. Similar trends are observed in Experiment 21 on PASCAL VOC, where UET outperforms ART and FitNet, achieving a KRS gain of 29.2 points. These results underscore UET's ability to integrate uncertainty estimation effectively, enhancing feature alignment and output consistency between teacher and student networks.
EfficientNet models further highlight UET's superiority. In Experiment 24, UET achieves a substantial KRS improvement of 38.1 points on PASCAL VOC, outperforming ART (24.9 points KRS) and FitNet (16.8 points KRS). Notably, UET's ability to maximize KRS improvements is evident across both datasets and architectures, as it consistently outperforms its counterparts, demonstrating its robustness in facilitating effective knowledge transfer.
Like in the image classification task, the complexity of the dataset significantly influences KRS improvements. The simpler dataset, PASCAL VOC, shows higher increases in KRS compared to the more complex and diverse COCO. While COCO’s rich feature space and intricate inter-class relationships provide opportunities for extensive knowledge transfer, these same complexities may also present challenges for the student model to fully assimilate the teacher's knowledge. In contrast, the relatively straightforward nature of PASCAL VOC facilitates a more effective alignment of features and outputs, resulting in greater KRS improvements. This observation highlights the nuanced relationship between dataset complexity and the efficacy of knowledge distillation methods, emphasizing the importance of tailoring KD strategies to the characteristics of the dataset.
Another observation is the steady yet comparatively smaller gains achieved by FitNet across all experiments. For instance, in Experiment 19 on PASCAL VOC, FitNet increases KRS by 13.2 points, lagging behind UET's gains of 29.2 points in KRS. This highlights FitNet's limited ability to fully leverage the teacher’s knowledge, especially in more complex scenarios.
Overall, the results underscore the effectiveness of advanced KD techniques, particularly UET, in improving KRS and task performance. The consistent patterns across COCO and PASCAL VOC, coupled with the varying improvements in KRS and mAP, highlight the interplay between KD methods, teacher-student architectures, and dataset complexity in achieving optimal knowledge transfer.
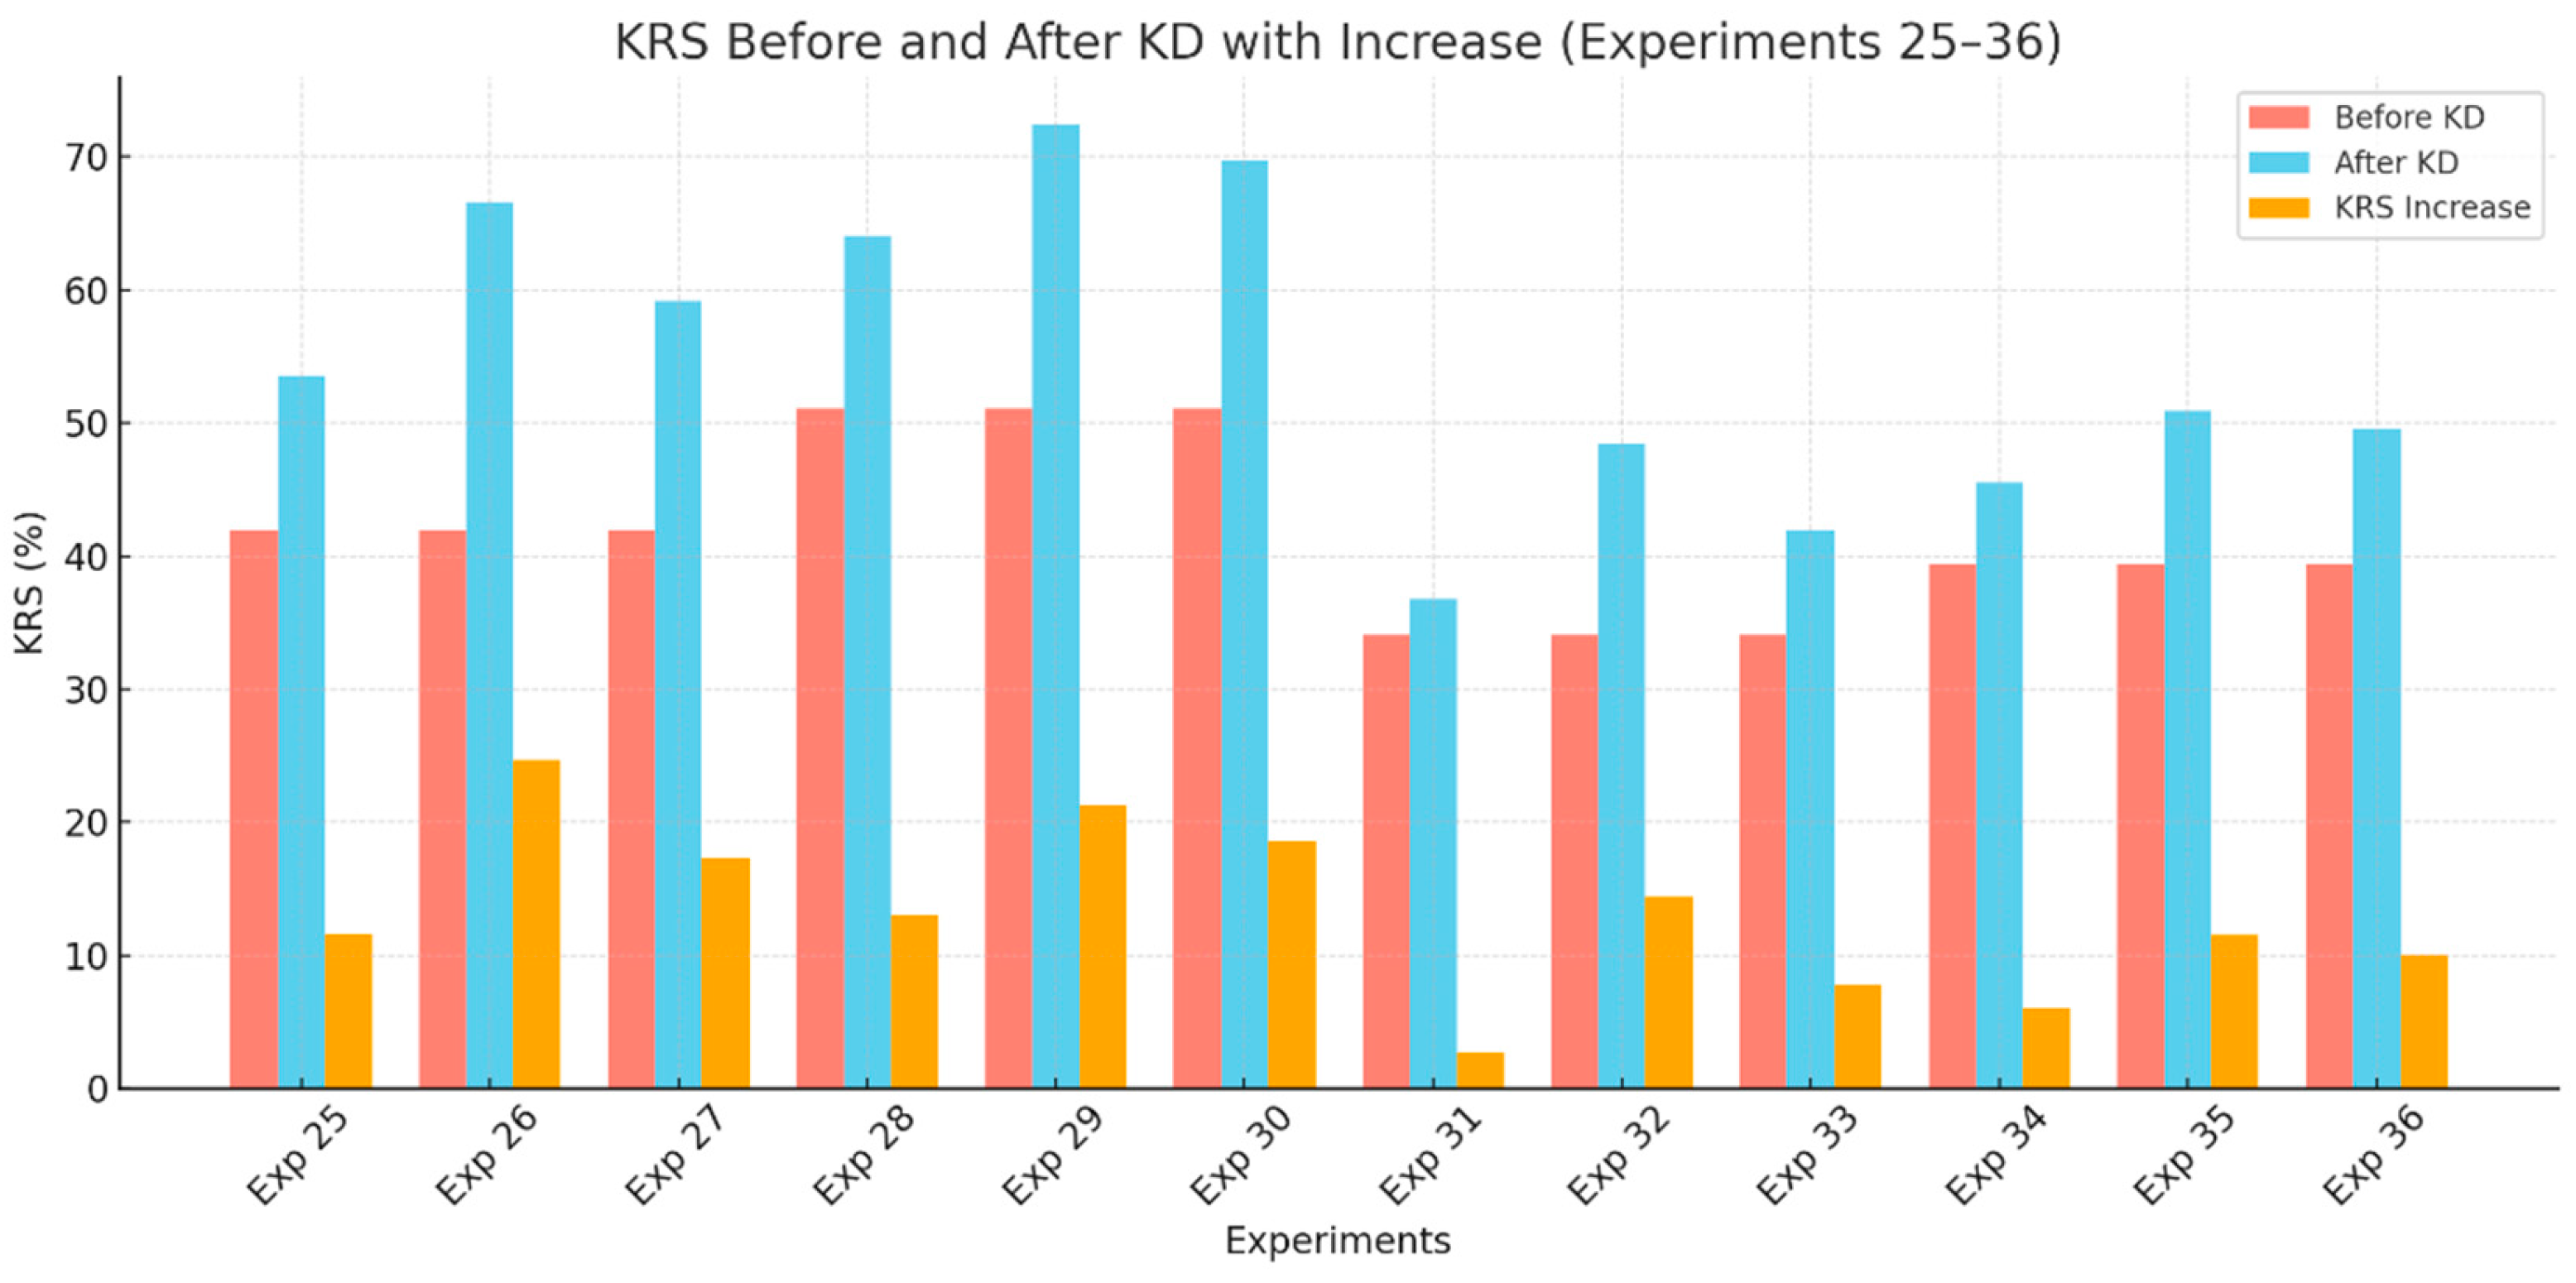
Finally, we examine the KRS of the student model used in experiments 25 to 36. A notable trend is the significant improvement in KRS after applying any KD technique, with GLD consistently achieving the highest increases, followed by CRCD and then GKD, as shown in Figure 5.
In the ResNet-101/ResNet-18 pair, GLD achieves the largest KRS improvement of 24.7 points, demonstrating its superior ability to transfer both global and local knowledge effectively. This is followed by CRCD, which achieves a KRS gain of 17.3 points, and GKD, with a modest increase of 11.6 points. Similarly, the EfficientNet-B7/EfficientNet-Lite pair exhibits the same hierarchy of effectiveness, with GLD achieving the highest KRS gain of 21.3 points, significantly surpassing CRCD (18.6 points) and GKD (13 points). These findings underscore the effectiveness of GLD in maximizing knowledge transfer, likely due to its ability to model and align global relationships more comprehensively.
Interestingly, in the VGG-19/AlexNet pair, the KRS improvements are comparatively smaller across all KD methods. GLD still demonstrates the highest increase in KRS (14.4 points), while CRCD and GKD achieve gains of 7.8 and 2.7 points, respectively. This reflects the inherent limitations of AlexNet’s simpler architecture, which restricts its capacity to fully leverage the teacher’s knowledge, regardless of the KD method employed.
For the WRN-40-2/WRN-16-1 pair, the improvements in KRS follow a similar pattern, with GLD leading with an increase of 11.5 points, followed by CRCD (10.1 points) and GKD (6.1 points). The relatively moderate KRS gains in this pair highlight the architectural alignment between the teacher and student, which provides a more stable baseline for knowledge transfer.
Overall, the results emphasize the superior performance of GLD in enhancing KRS, attributed to its robust approach to transferring comprehensive knowledge. CRCD emerges as an effective alternative, particularly for network pairs with higher capacities, while GKD demonstrates limited but consistent improvements, reflecting its relatively simpler methodology. These observations highlight the critical role of the KD method in determining the effectiveness of knowledge transfer and retention in image segmentation tasks.
4.2. Validation of the KRS Metric
This section presents the results of multiple validation strategies conducted to assess the effectiveness and reliability of the proposed KRS metric as a performance indicator for knowledge distillation models.
4.2.1. Correlation Between KRS and Standard Performance Metrics
To validate the reliability of the proposed KRS metric, we first examined its correlation with established performance metrics across different tasks. For image classification (Experiments 1 to 12), we computed the Pearson correlation between KRS and the student model’s accuracy after knowledge distillation. The results revealed a strong positive correlation (r = 0.943, p = 0.000005), indicating that KRS is highly aligned with the conventional accuracy metric in classification tasks.
For object detection (Experiments 13 to 24), we analyzed the relationship between KRS and mAP. The computed correlation was also strong (r = 0.884, p = 0.0001), suggesting that KRS effectively reflects model performance in detection tasks.
Lastly, for image segmentation (Experiments 25 to 36), the correlation between KRS and IoU was found to be exceptionally high (r = 0.968, p = 0.00000025), demonstrating that KRS closely tracks the performance of student models in segmentation scenarios. These results collectively support the validity of KRS as a robust and task-agnostic metric for evaluating knowledge distillation outcomes.
4.2.2. Ablation Study: Decomposing KRS Before and After KD
To better understand how KRS captures knowledge transfer effectiveness, we performed an ablation analysis using its two core components: Feature Similarity Score (FSS) and Average Output Agreement (AOAg), before and after knowledge distillation. Across experiments 1 to 12, notable improvements were observed in both components after KD, validating the KRS’s sensitivity to actual knowledge transfer. The SKD method consistently resulted in higher increases in both FSS and AOAg compared to Vanilla KD. For instance, ResNet-18 trained on CIFAR-100 improved its FSS from 32 to 39 and AOAg from 47 to 83 under SKD, leading to a substantial KRS gain. In contrast, Vanilla KD yielded smaller gains across these components. Additionally, student models with deeper architecture (e.g., ResNet-18) showed greater KRS improvements compared to shallower models like AlexNet, reaffirming the role of network capacity in knowledge retention. This component-wise analysis supports the validity of using KRS as a composite metric and highlights how specific KD techniques and model architectures contribute to effective knowledge transfer. The resulf for the ablation study for experiments 1 to 12 is plotted in a bar graph shown in Figure 5.
The ablation analysis for Experiments 13 to 24 demonstrates a consistent increase in KRS after the application of KD across all object detection settings. This reinforces the reliability of KRS in capturing the improvements in student models brought about by various KD techniques.
Across both COCO and PASCAL VOC datasets, the three KD strategies—FitNet, ART, and UET—showed progressive improvements in KRS, with UET consistently achieving the highest post-distillation scores. For instance, student models distilled with UET showed greater KRS gains compared to their FitNet and ART counterparts under the same teacher-student configurations. This trend was evident regardless of dataset complexity, indicating that KRS can reflect nuanced differences in the effectiveness of KD methods.
Moreover, the increase in KRS is not uniform across all setups. Models with more compact architectures or trained on more challenging datasets (e.g., COCO) exhibited larger gains, suggesting that the distillation process yields more pronounced benefits where the student’s baseline capacity is limited or where the learning task is more complex. For example, WRN-16-1 distilled using UET on COCO yielded a higher relative improvement than when the same student was trained on PASCAL VOC using simpler methods like FitNet.
These findings validate the sensitivity of KRS in measuring knowledge transfer success. By effectively capturing shifts in feature similarity (FSS) and output agreement (AOAg), KRS reflects not only performance gains in terms of accuracy or mAP but also structural learning enhancements in the student model. As such, the ablation results strengthen the position of KRS as a robust and interpretable metric for evaluating the impact of knowledge distillation in object detection. Summary of ablation study data is presented in Figure 6.
Lastly, experiments 25 to 36, focusing on image segmentation, demonstrate consistent KRS improvements across all KD methods, confirming KRS as a reliable metric for evaluating knowledge transfer in dense prediction tasks. Among the methods, Global Logit Distillation (GLD) produced the highest KRS gains, indicating its strength in transferring holistic output information essential for segmentation. CRCD also performed well, particularly in deeper networks, benefiting from its dense relational guidance. In contrast, GKD yielded the least improvement, suggesting its graph-based alignment may be less effective in segmentation or with simpler students. Notably, networks like AlexNet showed limited KRS gains across methods, reflecting their reduced capacity to absorb transferred knowledge. Overall, the results validate KRS’s sensitivity to KD effectiveness and highlight the interplay between method complexity and student architecture.
Figure 7.
KRS ablation study before and after KD for experients 25 to 36.
4.2.3. Sensitivity to KD Quality
To further evaluate the reliability of KRS, we examined its sensitivity to the quality of KD methods applied across different tasks. In this context, KD quality refers to the extent to which each method improves the performance and knowledge retention of the student model. A reliable metric should consistently reflect higher gains when stronger KD strategies are employed. We first rank the performance of the KD methods used in this study depending on the average improvement of the student in terms of the conventional metrics used. Then, we also rank each KD method based on the average increase in the KRS. Finally, we compare the two rankings as shown in Table 6.
The table offers a dual perspective on how different KD strategies perform in enhancing both traditional task-based metrics and the proposed KRS, which captures retained knowledge more holistically. Across both rankings, Vanilla KD consistently appears as the least effective method, suggesting that while it offers basic improvements, it lacks the sophistication of more modern techniques in transferring knowledge. FitNet follows closely, indicating only moderate gains in both traditional metrics and knowledge retention. In contrast, UET emerges as the top-performing method in both categories. Its superior placement suggests that UET not only maximizes conventional performance outcomes but also enables the student model to internalize a substantial amount of the teacher’s knowledge, as reflected in the high KRS gains. Similarly, GLD and ART show consistently strong performance, placing them among the top-tier KD techniques across both evaluation dimensions. Interestingly, the parallelism in both columns of Table 6 highlights a strong alignment between conventional metrics and KRS as evaluation tools. This convergence strengthens the case for adopting KRS as a reliable complementary metric to traditional measures. It demonstrates that methods yielding higher KRS also tend to perform well in standard evaluations, thus reinforcing KRS's validity and practical utility in assessing KD quality.
4.2.4. Architectural Generalization
Architectural generalization assesses how consistently a KD method performs across varying teacher-student network combinations. In the context of this study, it also serves as a validation mechanism for the KRS—determining whether KRS remains a reliable metric when applied to diverse model architectures.
Our findings reveal that high-performing KD methods such as UET, GLD, and ART yield substantial improvements in KRS across a wide range of architectural pairings. These include deep-to-shallow (e.g., ResNet-101 to ResNet-18), resource-constrained (e.g., EfficientNet-B9 to EfficientNet-Lite), and structurally different networks (e.g., VGG-19 to AlexNet). The consistency in KRS improvements across these combinations confirms its adaptability and reliability, regardless of the architectural design.
Furthermore, methods like Vanilla KD and FitNet, which are more sensitive to teacher-student alignment, demonstrated lower KRS gains especially in less compatible pairs—reinforcing that KRS can also capture limitations in knowledge transfer. This sensitivity strengthens the argument that KRS effectively reflects the internal learning dynamics of the student model beyond surface-level metrics like accuracy or mAP.
In summary, the alignment between KRS trends and architectural variations validates KRS not only as a universal performance indicator but also as a metric that generalizes well across heterogeneous model configurations. It provides nuanced insight into the effectiveness of KD methods in real-world applications where model structures are rarely standardized.
5. Conclusions and Future Work
In this study, we introduced the Knowledge Retention Score (KRS), a universal and task-agnostic metric designed to measure the effectiveness of Knowledge Distillation (KD) methods across diverse datasets, tasks, and teacher-student architectures. By integrating feature similarity and output agreement, KRS offers a more comprehensive evaluation of the knowledge transfer process than conventional performance metrics alone. Our experiments, spanning 36 diverse KD setups, consistently demonstrate that KRS aligns well with traditional evaluation metrics such as accuracy, mAP, and IoU. Moreover, the KRS successfully captures nuanced insights into the quality of knowledge transfer, the sensitivity to KD method effectiveness, and the architectural generalizability of student models.
We validated the reliability of KRS using correlation analyses and ablation studies, showing that it accurately reflects the underlying dynamics of feature and output alignment between teacher and student models. KRS was further proven to be sensitive to KD quality and consistent across different network architectures, underscoring its robustness and utility for evaluating KD strategies. These findings establish KRS as a credible complementary metric for assessing KD models beyond surface-level accuracy gains.
Future work can explore extending KRS to non-vision tasks such as NLP or speech recognition, validating its universality in broader domains. Additionally, we envision refining the metric by incorporating model uncertainty, calibration scores, or explainability metrics to capture more dimensions of knowledge retention. Automated KRS-based benchmarking tools and integration into NAS (Neural Architecture Search) pipelines also present promising directions for further research and practical deployment.
Author Contributions
Writing—original draftA.R.A.; Writing—review & editing, J.F.V. All authors have read and agreed to the published version of the manuscript.
Funding
This research was funded by Southeast Southeast Asian Regional Center for Graduate Study and Research in Agriculture (SEARCA).
Institutional Review Board Statement
Not applicable.
Informed Consent Statement
Not applicable.
Data Availability Statement
The data presented in this study are available on request from the corresponding author.
Conflicts of Interest
The authors declare no conflict of interest.
References
- Rawat, W.; Wang, Z. Deep Convolutional Neural Networks for Image Classification: A Comprehensive Review. Neural Comput 2017, 29, 2352–2449. [Google Scholar] [CrossRef] [PubMed]
- Zhao, Z.Q.; Zheng, P.; Xu, S.T.; Wu, X. Object Detection with Deep Learning: A Review. IEEE Trans Neural Netw Learn Syst 2018, 30, 3212–3232. [Google Scholar] [CrossRef]
- Guo, Y.; Liu, Y.; Georgiou, T.; Lew, M.S. A Review of Semantic Segmentation Using Deep Neural Networks. Int J Multimed Inf Retr 2018, 7, 87–93. [Google Scholar] [CrossRef]
- Otter, D.W.; Medina, J.R.; Kalita, J.K. A Survey of the Usages of Deep Learning for Natural Language Processing. IEEE Trans Neural Netw Learn Syst 2021, 32, 604–624. [Google Scholar] [CrossRef]
- Gou, J.; Yu, B.; Maybank, S.J.; Tao, D. Knowledge Distillation: A Survey. Int J Comput Vis 2021, 129, 1789–1819. [Google Scholar] [CrossRef]
- Hinton, G.; Vinyals, O.; Dean, J. Distilling the Knowledge in a Neural Network. 2015.
- Yang, C.; Yu, X.; An, Z.; Xu, Y. Categories of Response-Based, Feature-Based, and Relation-Based Knowledge Distillation. Advancements in Knowledge Distillation: Towards New Horizons of Intelligent Systems, Studies in Computational Intelligence 2023, 1100, 10–41. [Google Scholar]
- Romero, A.; Ballas, N.; Kahou, S.E.; Chassang, A.; Gatta, C.; Bengio, Y. FitNets: Hints for Thin Deep Nets. 2014.
- Alkhulaifi, A.; Alsahli, F.; Ahmad, I. Knowledge Distillation in Deep Learning and Its Applications. PeerJ Comput Sci 2021, 7, 1–24. [Google Scholar] [CrossRef] [PubMed]
- Patel, G.; Reddy Mopuri, K.; Qiu, Q. Learning to Retain While Acquiring: Combating Distribution-Shift in Adversarial Data-Free Knowledge Distillation.
- Singh, P.; Mazumder, P.; Rai, P.; Namboodiri, V.P. Rectification-Based Knowledge Retention for Continual Learning.
- Hu, C.; Li, X.; Liu, D.; Wu, H.; Chen, X.; Wang, J.; Liu, X. Teacher-Student Architecture for Knowledge Distillation: A Survey. 2023.
- Ji, M.; Heo, B.; Park, S. Show, Attend and Distill:Knowledge Distillation via Attention-Based Feature Matching. 35th AAAI Conference on Artificial Intelligence, AAAI 2021 2021, 9B, 7945–7952. [Google Scholar] [CrossRef]
- Park, W.; Kim, D.; Lu, Y.; Cho, M. Relational Knowledge Distillation. Proceedings of the IEEE Computer Society Conference on Computer Vision and Pattern Recognition 2019, 2019-June, 3962–3971. [CrossRef]
- Wang, L.; Yoon, K.-J. Knowledge Distillation and Student-Teacher Learning for Visual Intelligence: A Review and New Outlooks.
- Zagoruyko, S.; Komodakis, N. Paying More Attention to Attention: Improving the Performance of Convolutional Neural Networks via Attention Transfer. 2016.
- Sun, T.; Chen, H.; Hu, G.; Zhao, C. Explainability-Based Knowledge Distillation. Pattern Recognit 2024, 111095. [Google Scholar] [CrossRef]
- Mi, J.; Wang, L.F.; Liu, Y.; Zhang, J. KDE-GAN: A Multimodal Medical Image-Fusion Model Based on Knowledge Distillation and Explainable AI Modules. Comput Biol Med 2022, 151. [Google Scholar] [CrossRef] [PubMed]
- Franciscus, B.; Vosters, C.; Sebastian, J.; Jauregui, O.; Hendrix, P. Knowledge Distillation to Improve Model Performance and Explainability: A Decision-Critical Scenario Analysis. 2020.
- Ojha, U.; Li, Y.; Rajan, A.S.; Liang, Y.; Lee, Y.J. What Knowledge Gets Distilled in Knowledge Distillation? 2022.
- Park, S.; Kang, D.; Paik, J. Cosine Similarity-Guided Knowledge Distillation for Robust Object Detectors. Sci Rep 2024, 14. [Google Scholar] [CrossRef] [PubMed]
- Kim, T.; Oh, J.; Kim, N.Y.; Cho, S.; Yun, S.Y. Comparing Kullback-Leibler Divergence and Mean Squared Error Loss in Knowledge Distillation. IJCAI International Joint Conference on Artificial Intelligence 2021, 2628–2635. [Google Scholar] [CrossRef]
- Saha, A.; Bialkowski, A.; Khalifa, S. SAHA, BIALKOWSKI, KHALIFA: REPRESENTATION DISTILLATION USING CKA Distilling Representational Similarity Using Centered Kernel Alignment (CKA). 2022.
- Shrivastava, A.; Qi, Y.; Ordonez, V. Estimating and Maximizing Mutual Information for Knowledge Distillation.
- Lee, J.-W.; Choi, M.; Lee, J.; Shim, H. Collaborative Distillation for Top-N Recommendation.
- Alba, A.R.; Villaverde, J.F. PERFORMANCE ASSESSMENT OF KNOWLEDGE DISTILLATION MODELS USING THE KNOWLEDGE RETENTION SCORE. In Proceedings of the IET Conference Proceedings; Institution of Engineering and Technology, 2024; Vol. 2024, pp. 372–379. [Google Scholar]
- Lin, T.Y.; Maire, M.; Belongie, S.; Hays, J.; Perona, P.; Ramanan, D.; Dollár, P.; Zitnick, C.L. Microsoft COCO: Common Objects in Context. European Conference on Computer Vision 2014, 8693 LNCS, 740–755. [Google Scholar] [CrossRef]
- Everingham, M.; Eslami, S.M.A.; Van Gool, L.; Williams, C.K.I.; Winn, J.; Zisserman, A. The Pascal Visual Object Classes Challenge: A Retrospective. Int J Comput Vis 2015, 111, 98–136. [Google Scholar] [CrossRef]
- Yuan, M.; Lang, B.; Quan, F. Student-Friendly Knowledge Distillation. Knowl Based Syst 2024, 296. [Google Scholar] [CrossRef]
- Cho, Y.; Ham, G.; Lee, J.H.; Kim, D. Ambiguity-Aware Robust Teacher (ART): Enhanced Self-Knowledge Distillation Framework with Pruned Teacher Network. Pattern Recognit 2023, 140. [Google Scholar] [CrossRef]
- Yi, J.; Mao, J.; Liu, T.; Li, M.; Gu, H.; Zhang, H.; Chang, X.; Wang, Y. Teaching with Uncertainty: Unleashing the Potential of Knowledge Distillation in Object Detection. 2024.
- Lee, S.; Song, B.C. Graph-Based Knowledge Distillation by Multi-Head Attention Network. 2019.
- Kim, Y.; Park, J.; Jang, Y.H.; Ali, M.; Oh, T.H.; Bae, S.H. Distilling Global and Local Logits with Densely Connected Relations. Proceedings of the IEEE International Conference on Computer Vision 2021, 6270–6280. [Google Scholar] [CrossRef]
- Zhu, J.; Tang, S.; Chen, D.; Yu, S.; Liu, Y.; Rong, M.; Yang, A.; Wang, X. Complementary Relation Contrastive Distillation. Proceedings of the IEEE Computer Society Conference on Computer Vision and Pattern Recognition 2021, 9256–9265. [Google Scholar] [CrossRef]
Figure 1.
Example of teacher-student network pair with layer selection by which intermediate features will be extracted.
Figure 1.
Example of teacher-student network pair with layer selection by which intermediate features will be extracted.
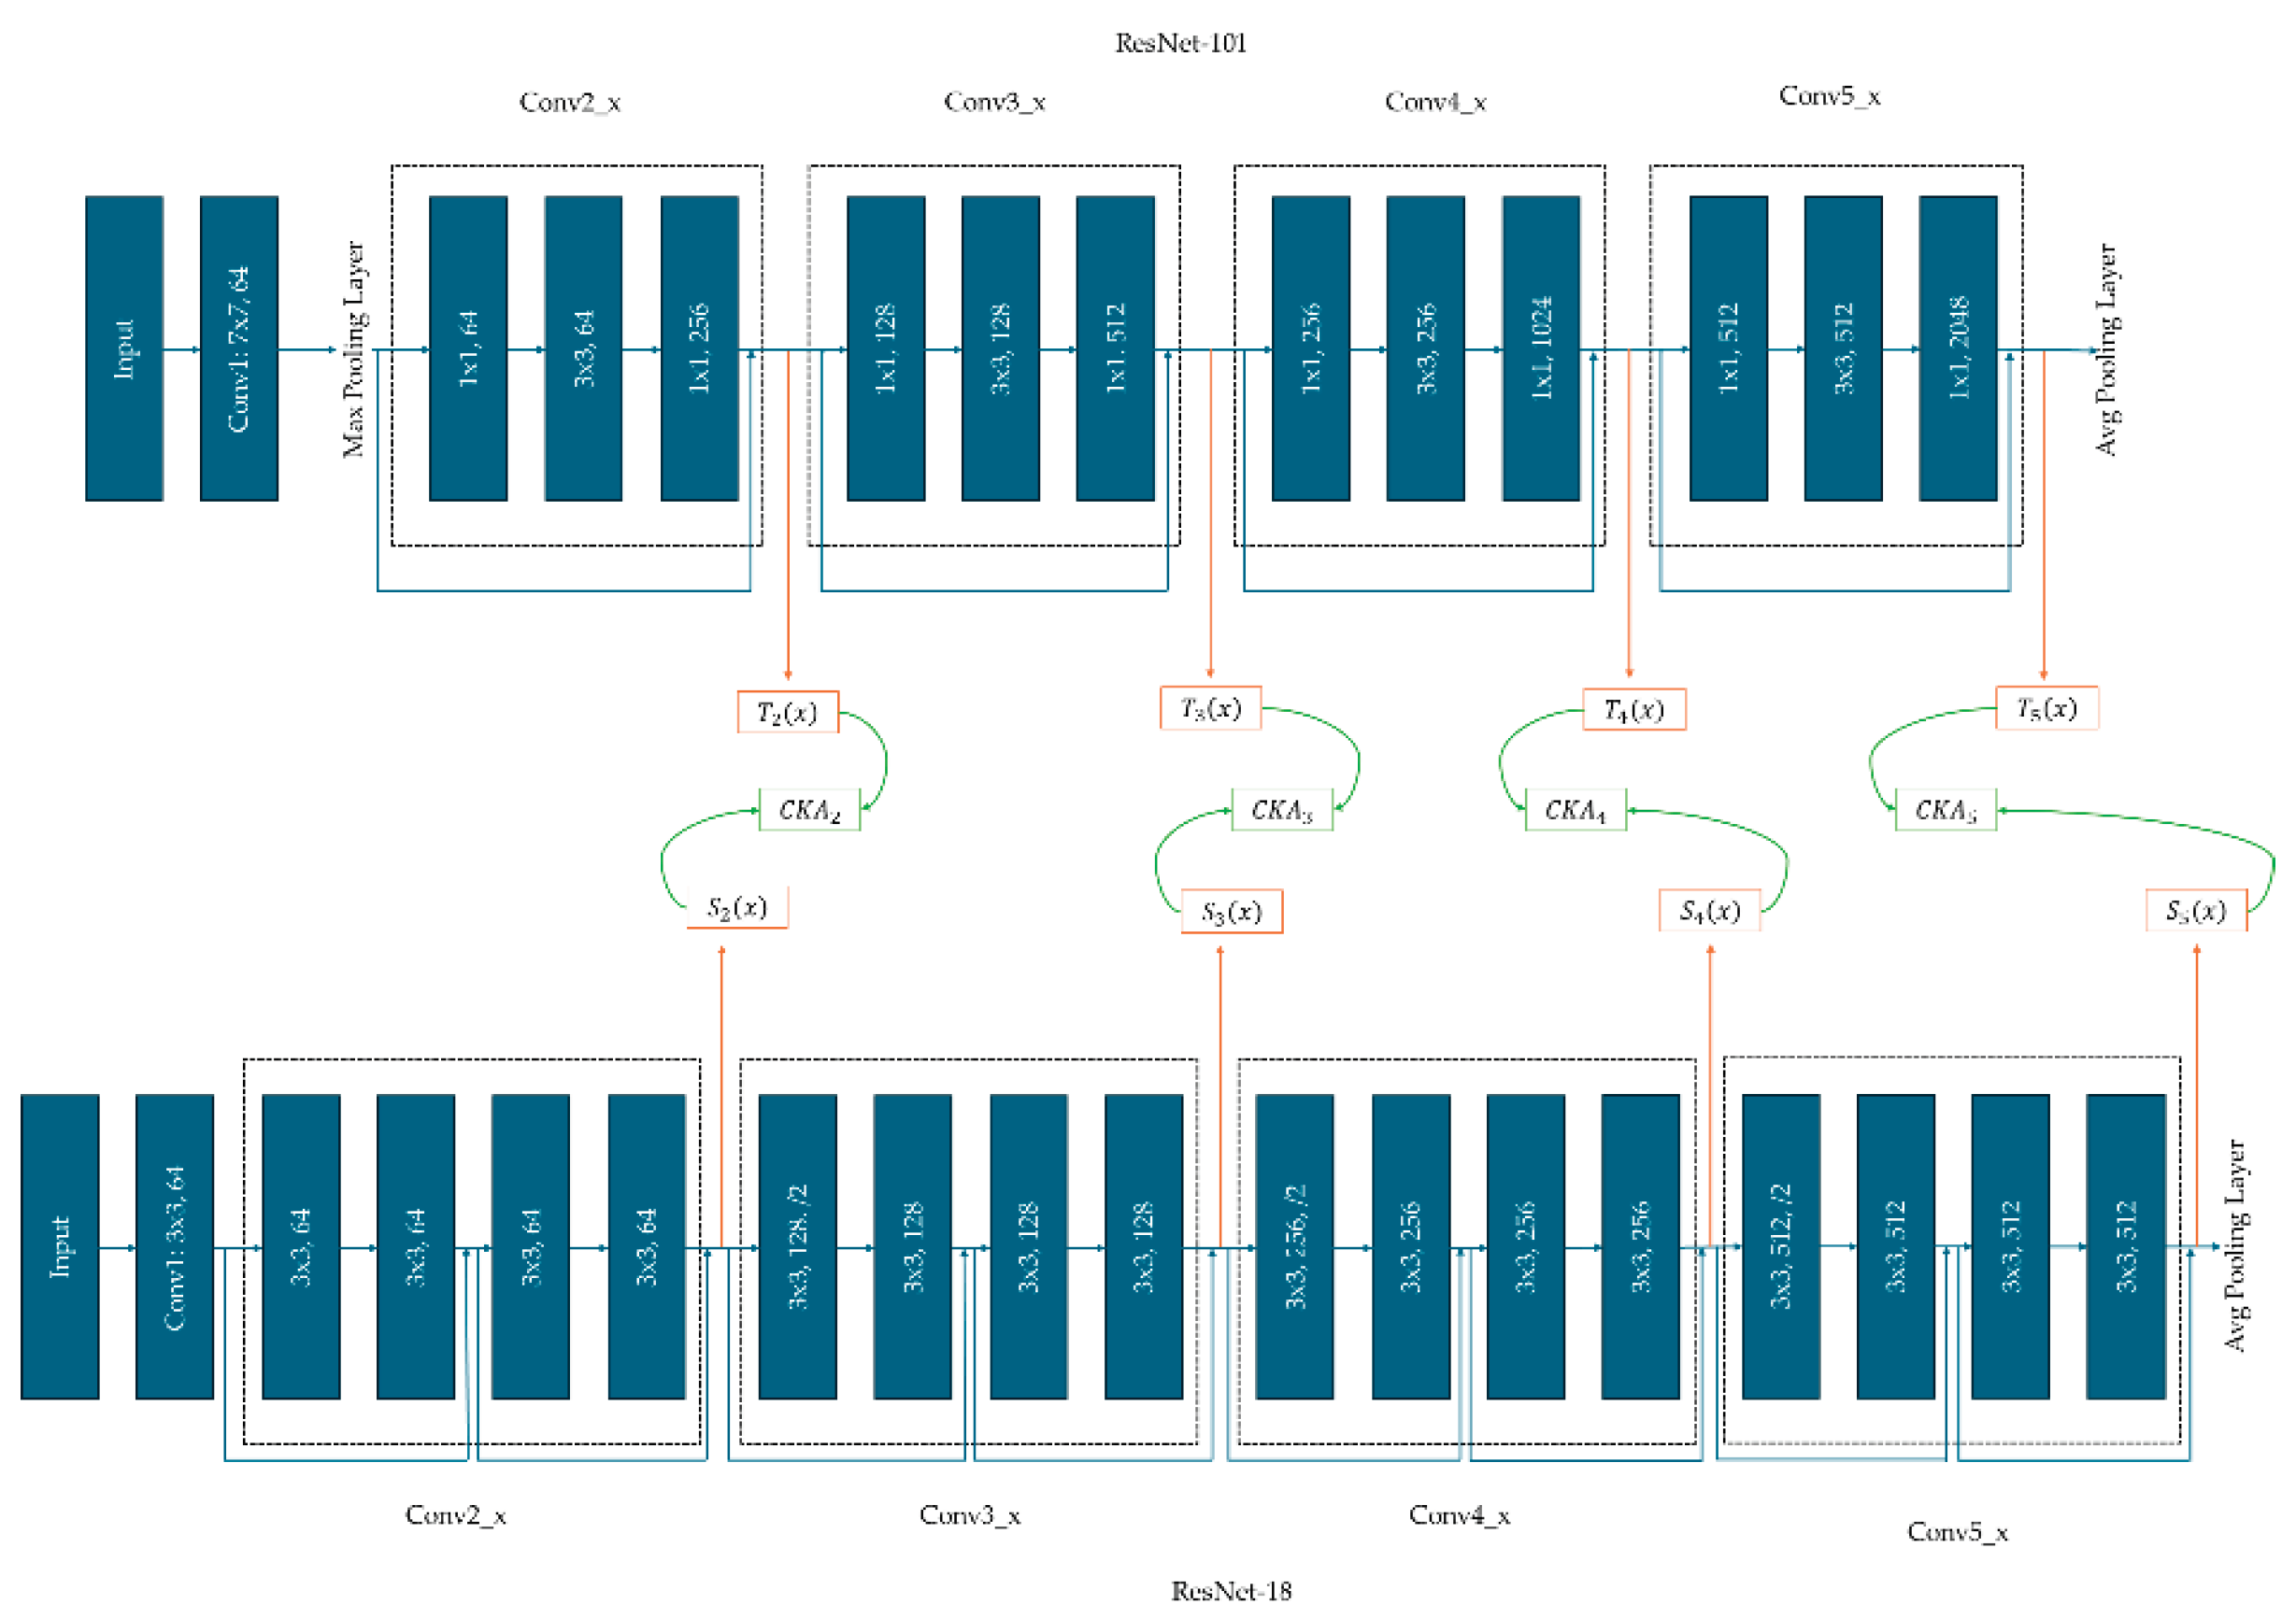
Figure 2.
The figure shows the performance of the student model pre and post-KD. (a) represents experiment ID no. 1-12; (b) experiment 13-24; and (c) experiment 25-36.
Figure 2.
The figure shows the performance of the student model pre and post-KD. (a) represents experiment ID no. 1-12; (b) experiment 13-24; and (c) experiment 25-36.
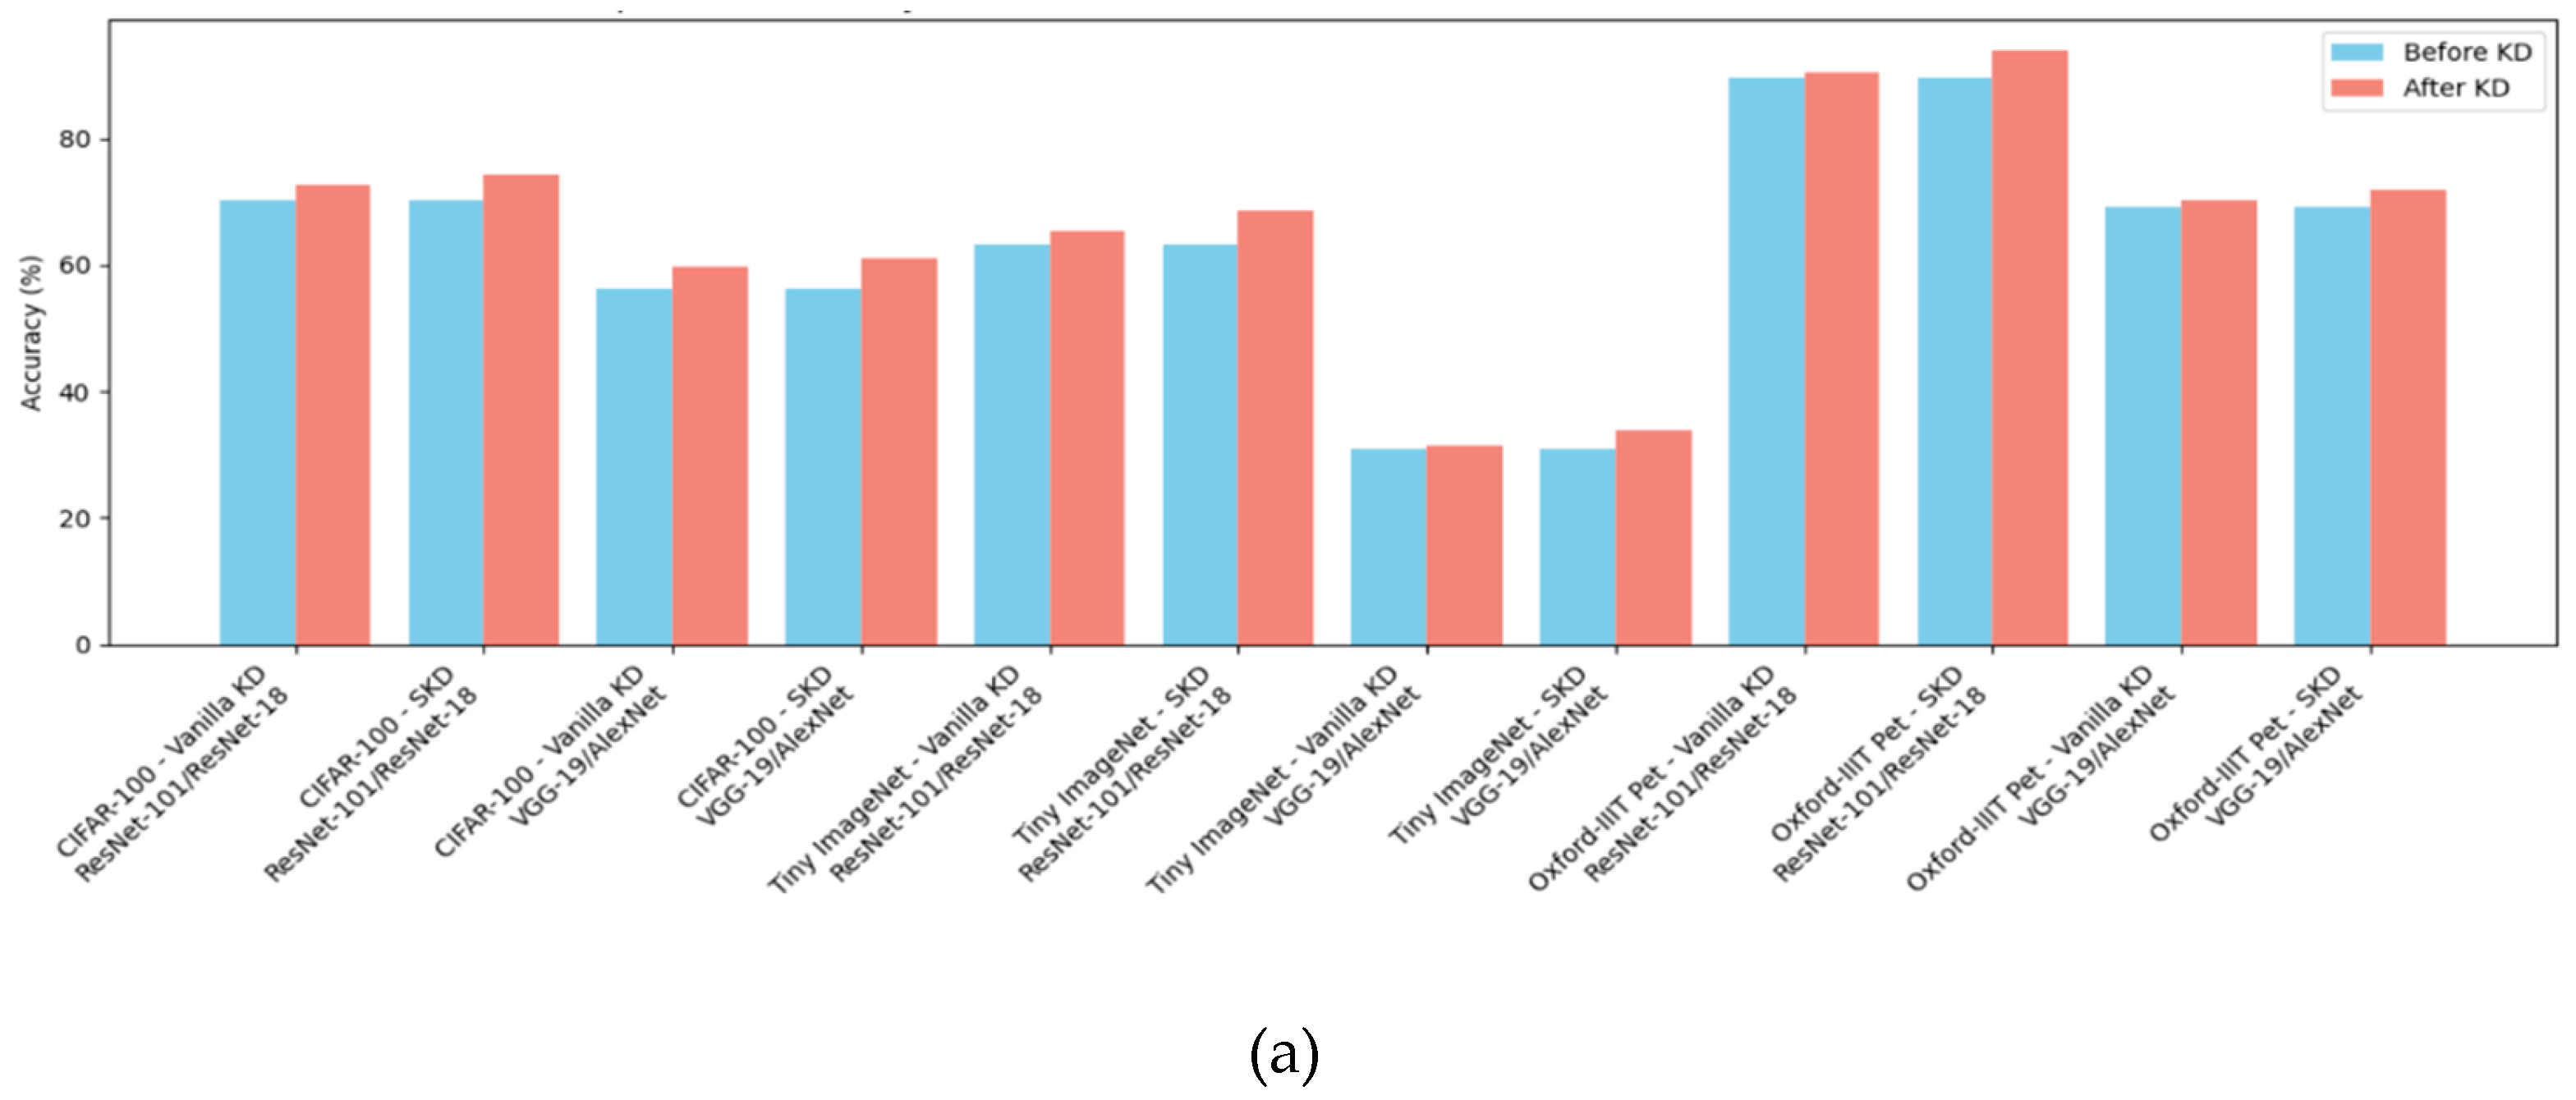
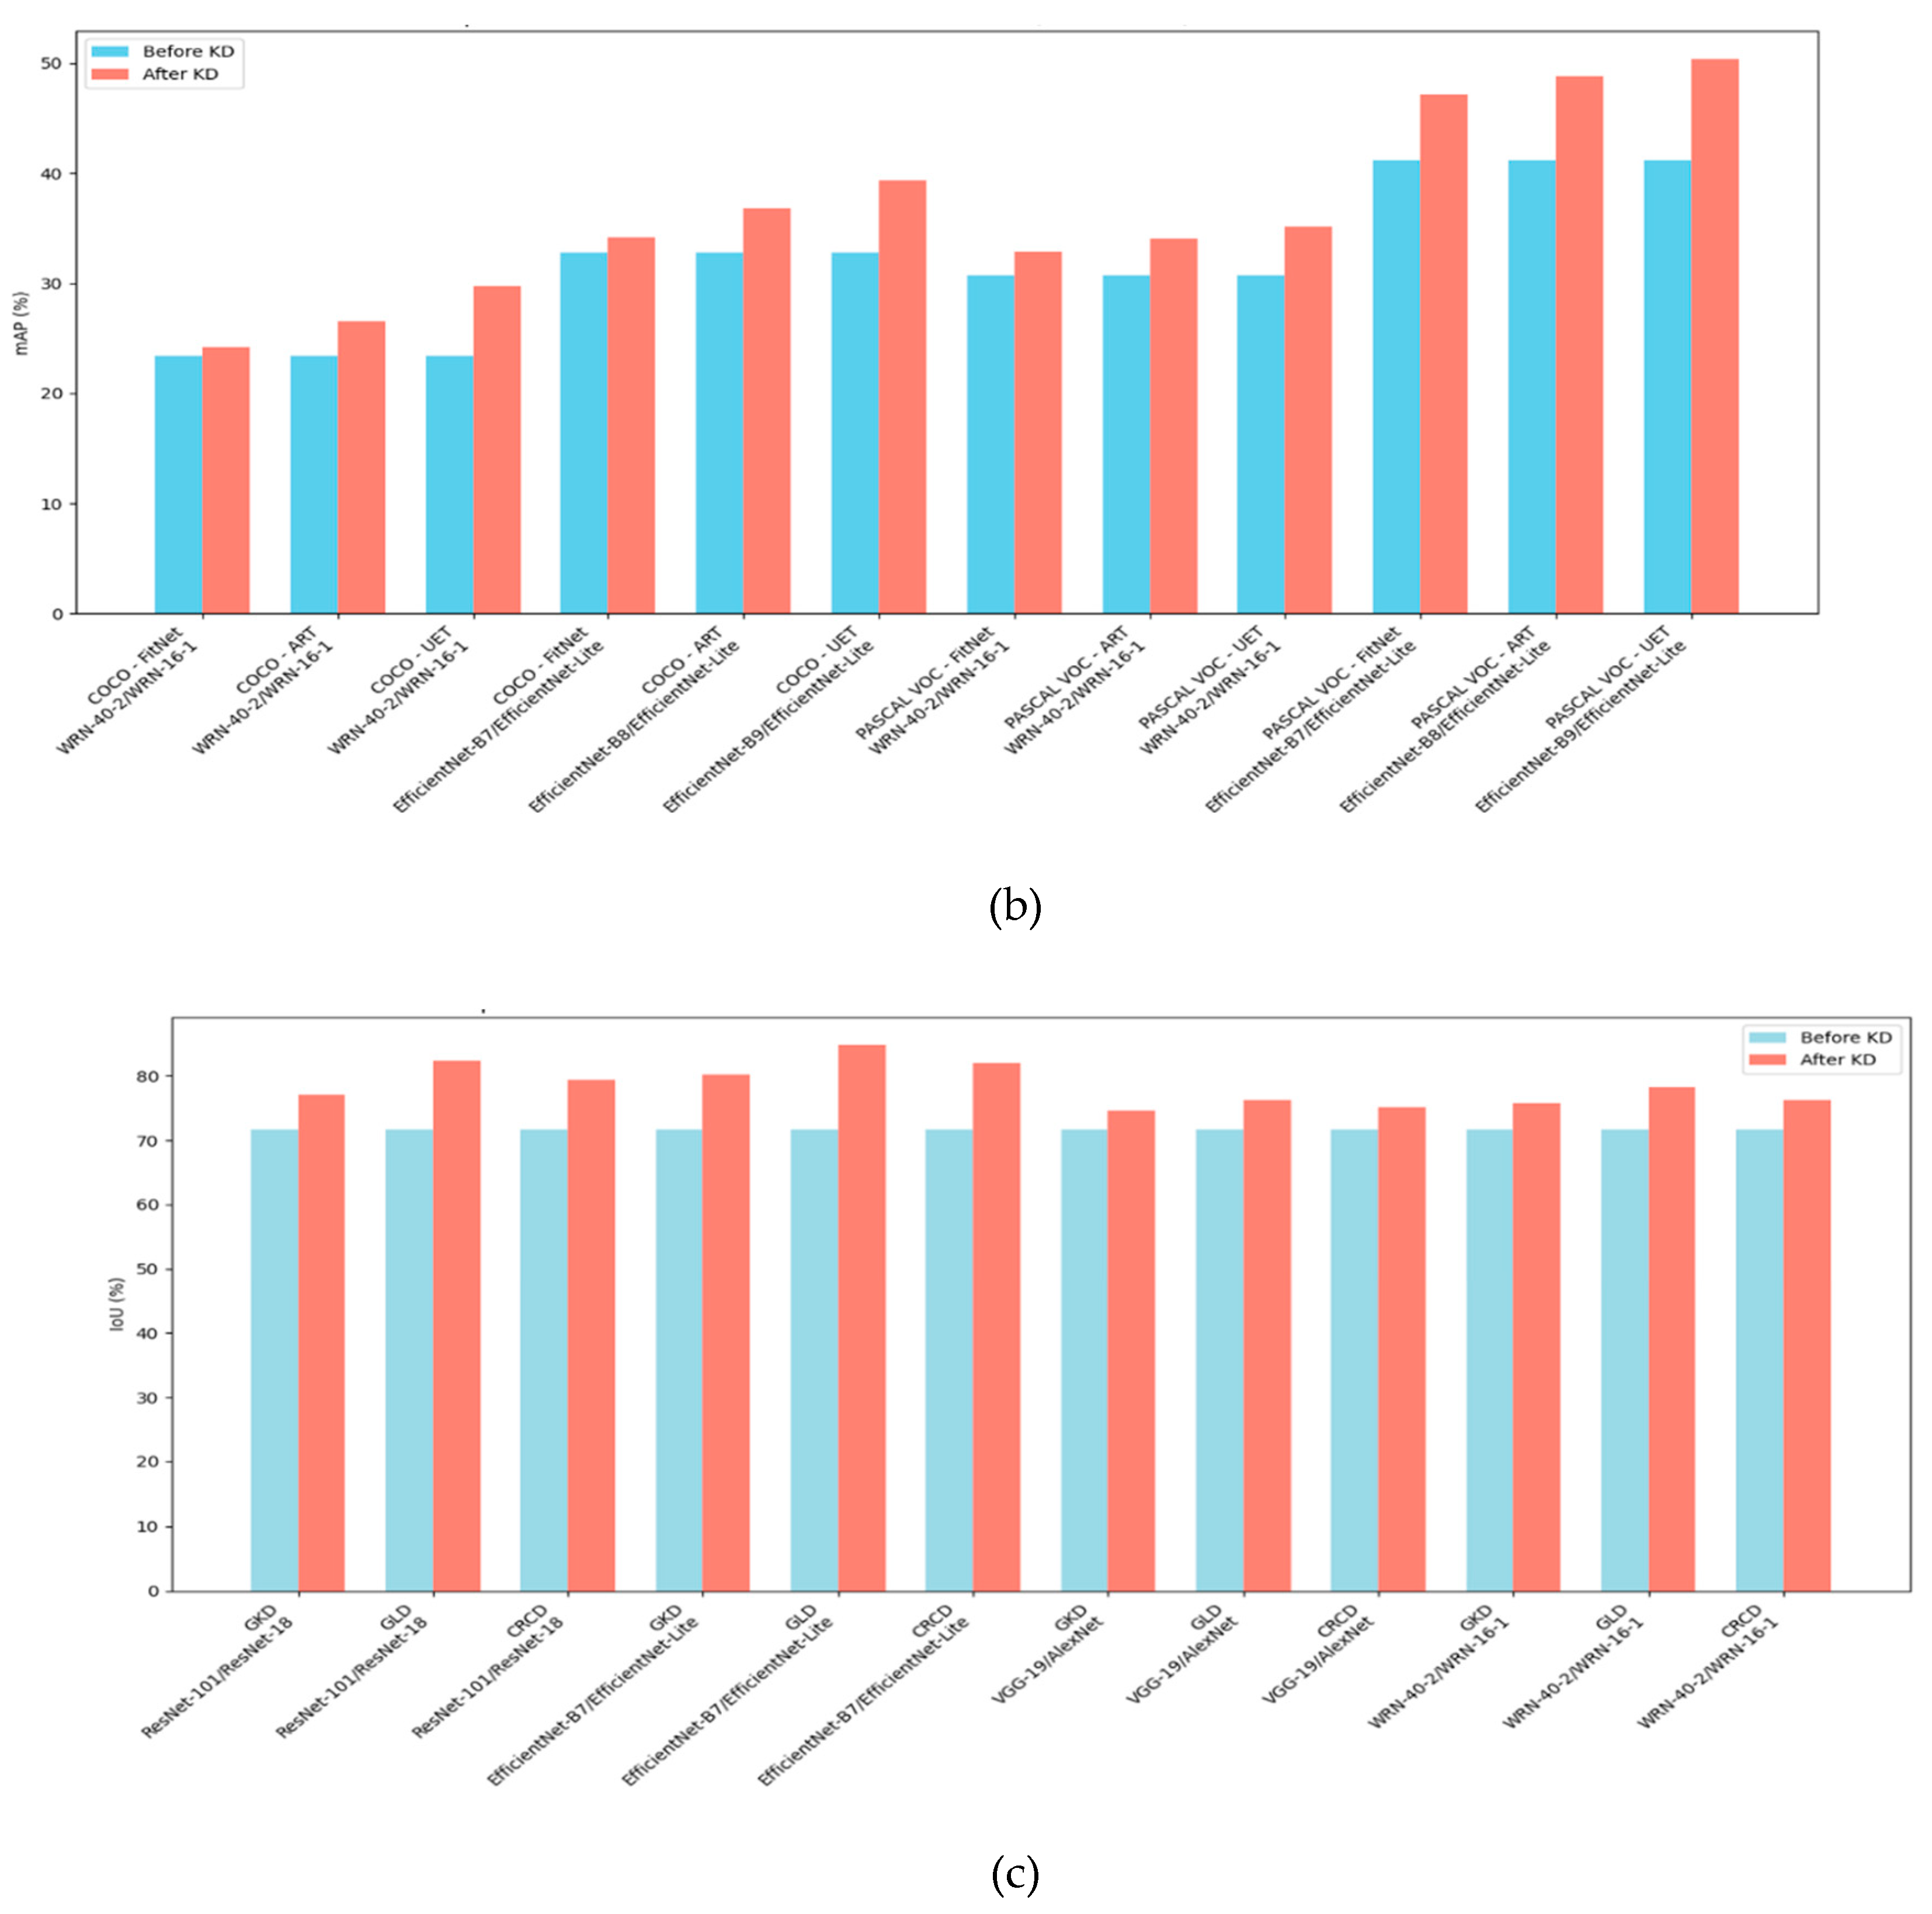
Figure 3.
The figure shows the performance of the student model (i.e. ResNet-18 and AlexNet) across datasets before and after KD process.
Figure 3.
The figure shows the performance of the student model (i.e. ResNet-18 and AlexNet) across datasets before and after KD process.
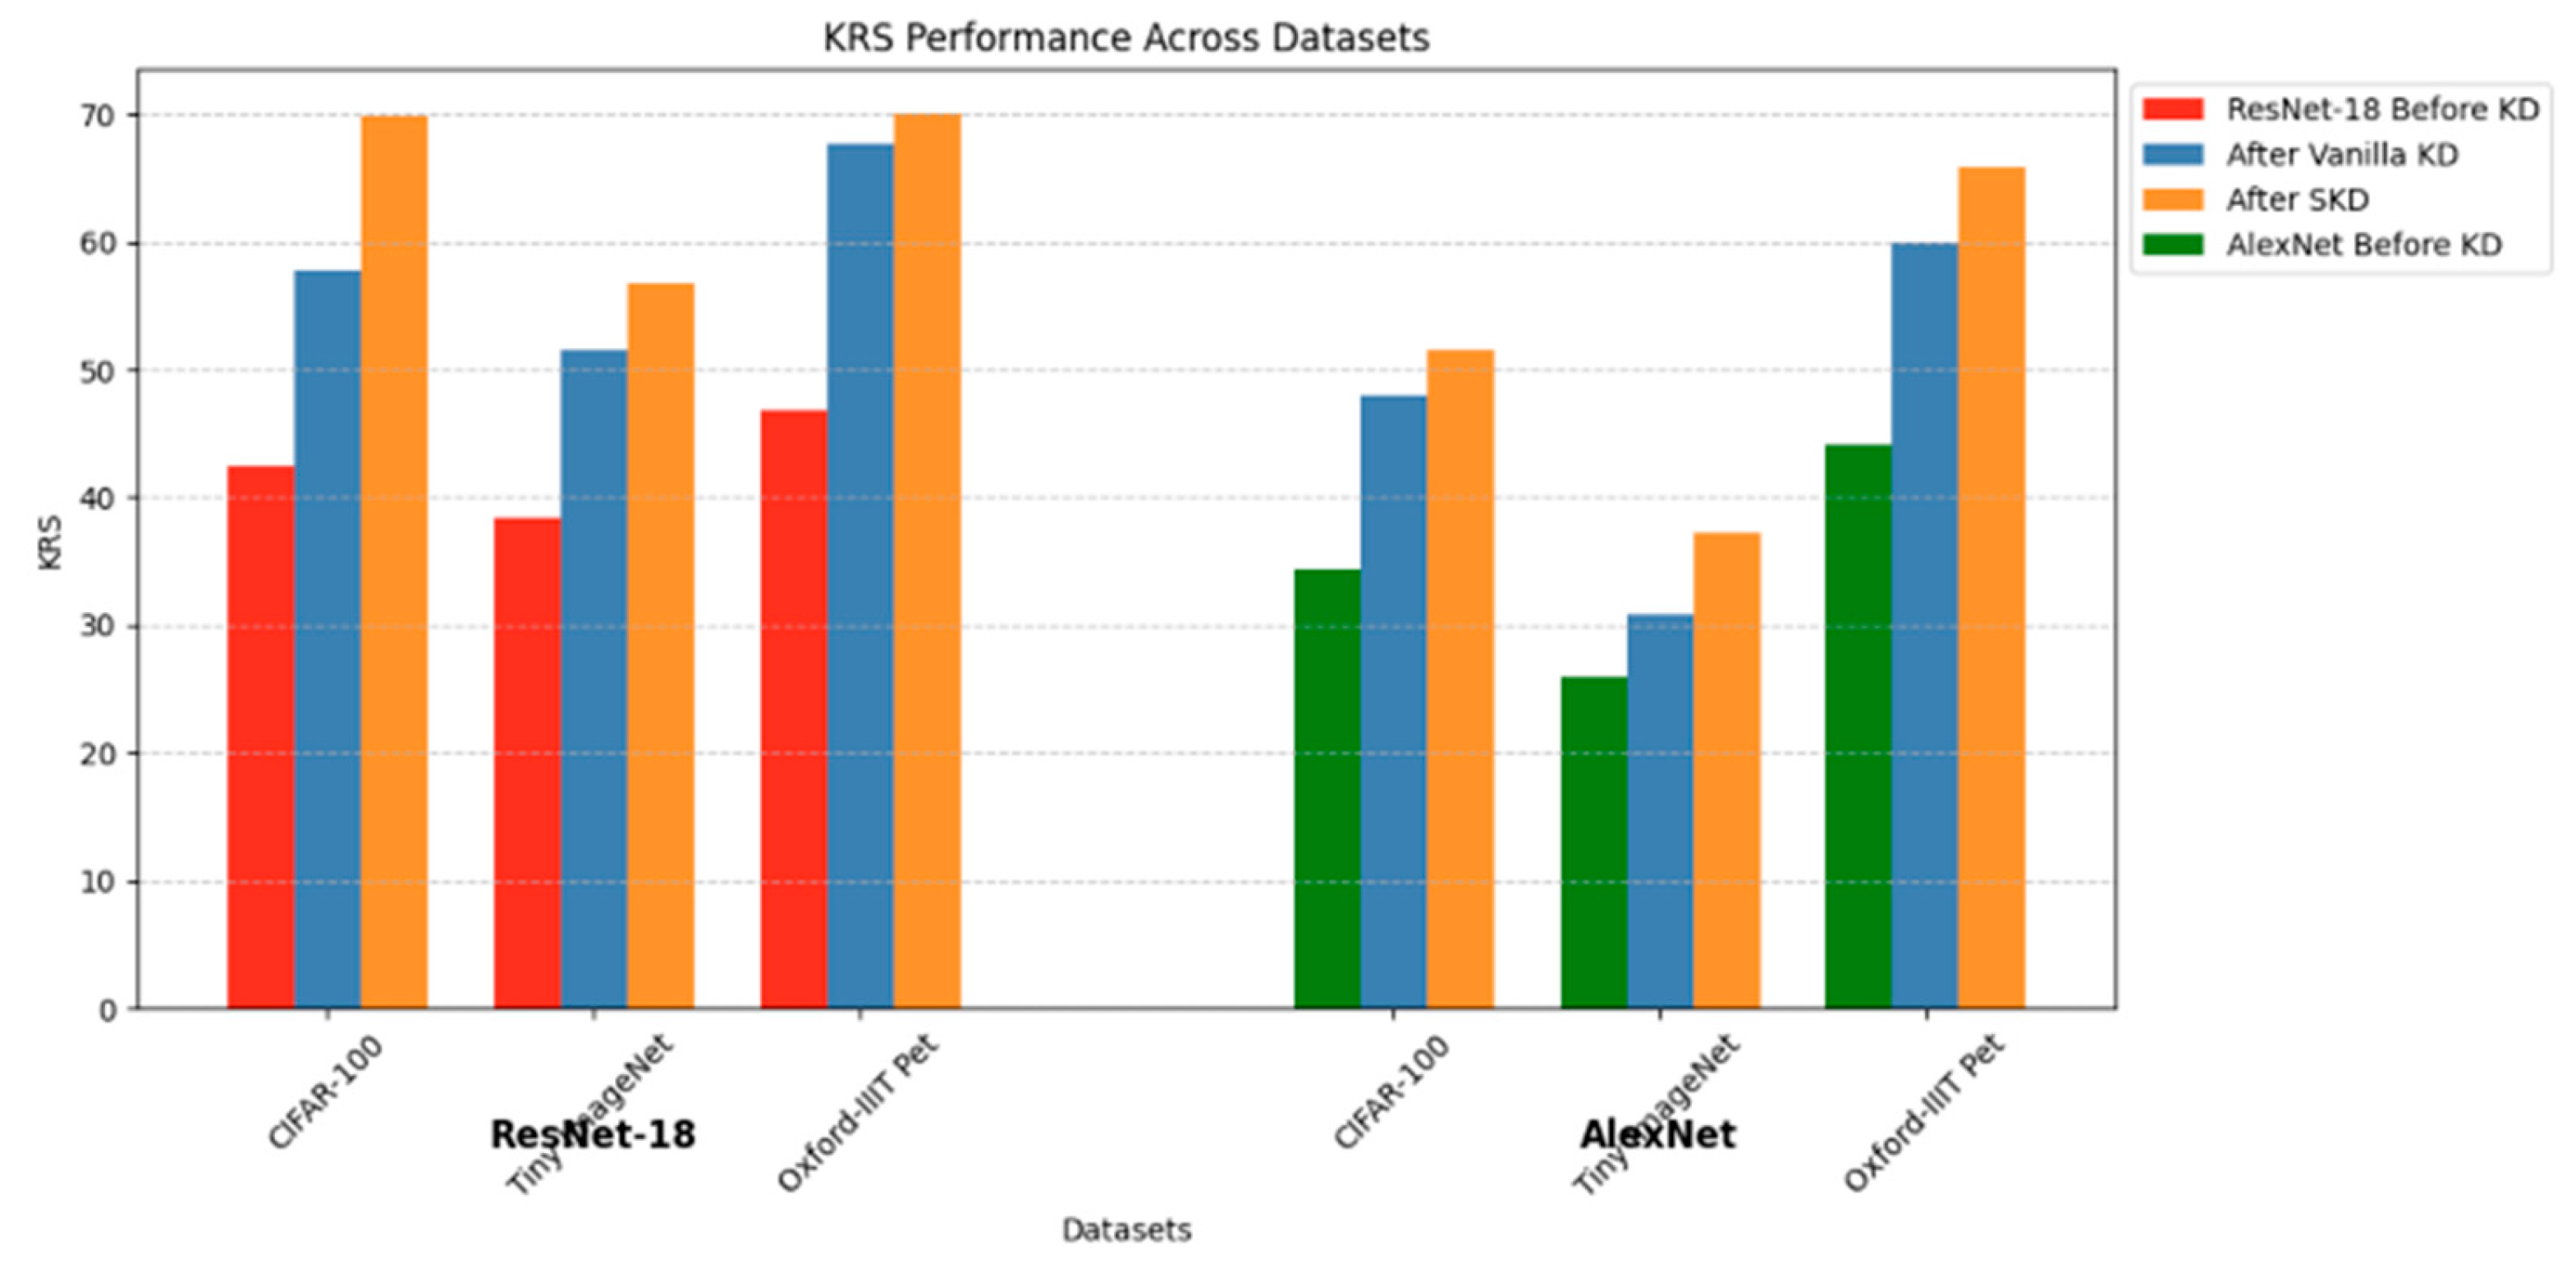
Figure 4.
Performance of WRN-16-1 and EfficientNet-Lite using the KRS in various datasets before and after selected KD method.
Figure 4.
Performance of WRN-16-1 and EfficientNet-Lite using the KRS in various datasets before and after selected KD method.
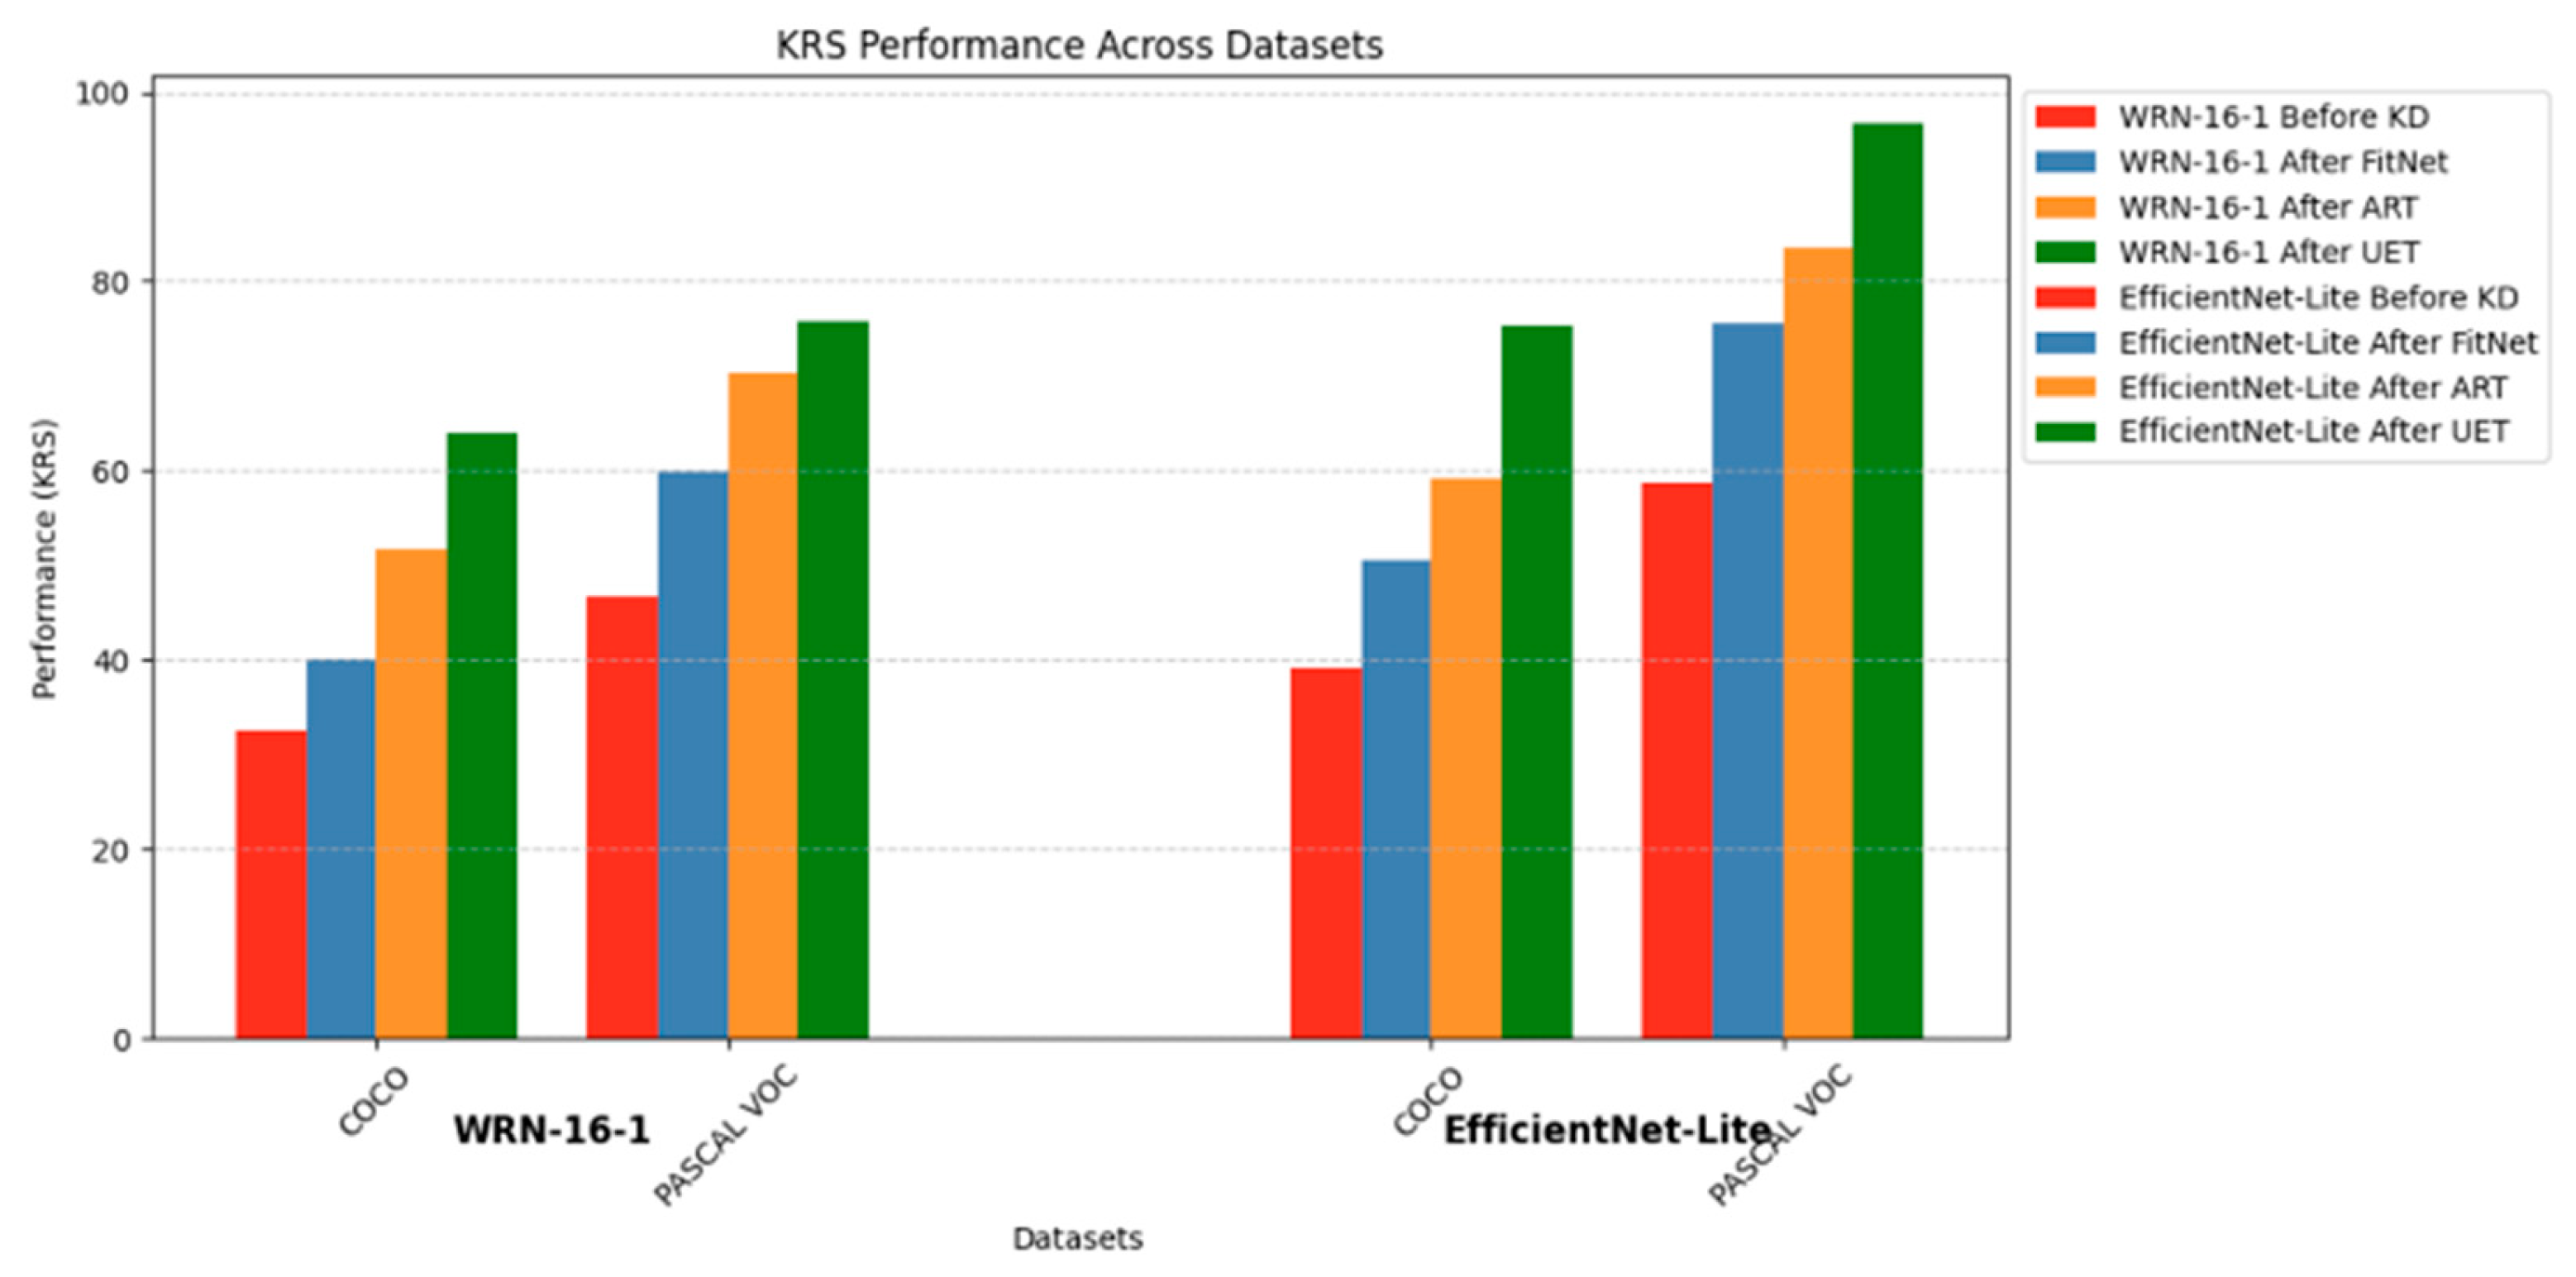
Figure 5.
KRS ablation study before and after KD for experients 1 to 12.
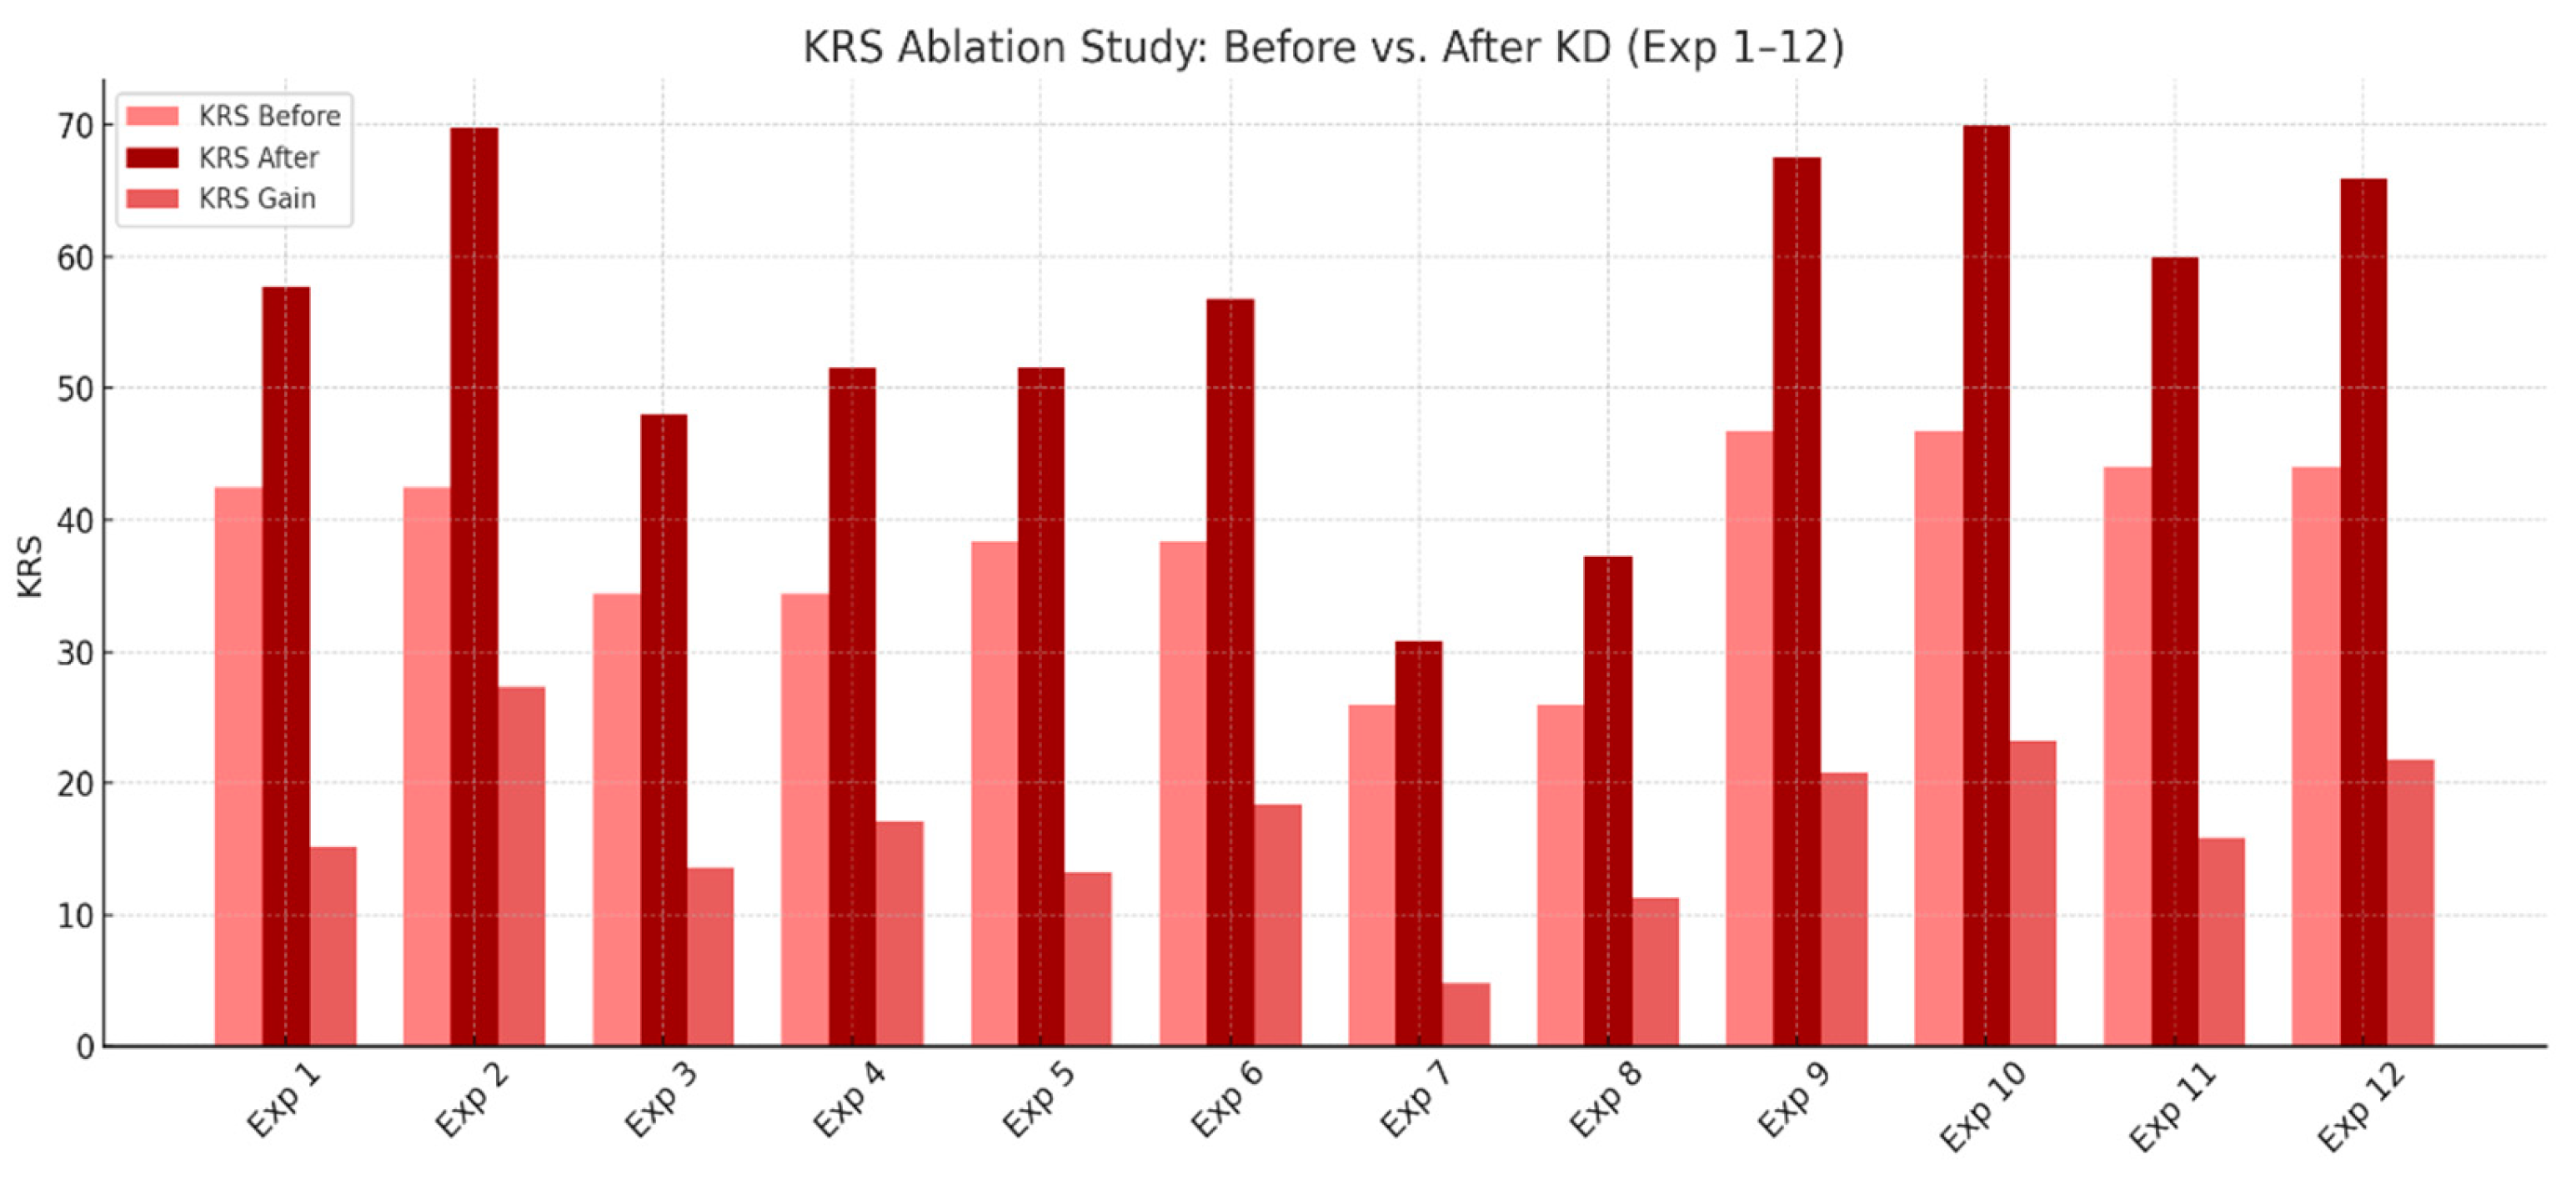
Figure 6.
KRS ablation study before and after KD for experients 13 to 24.
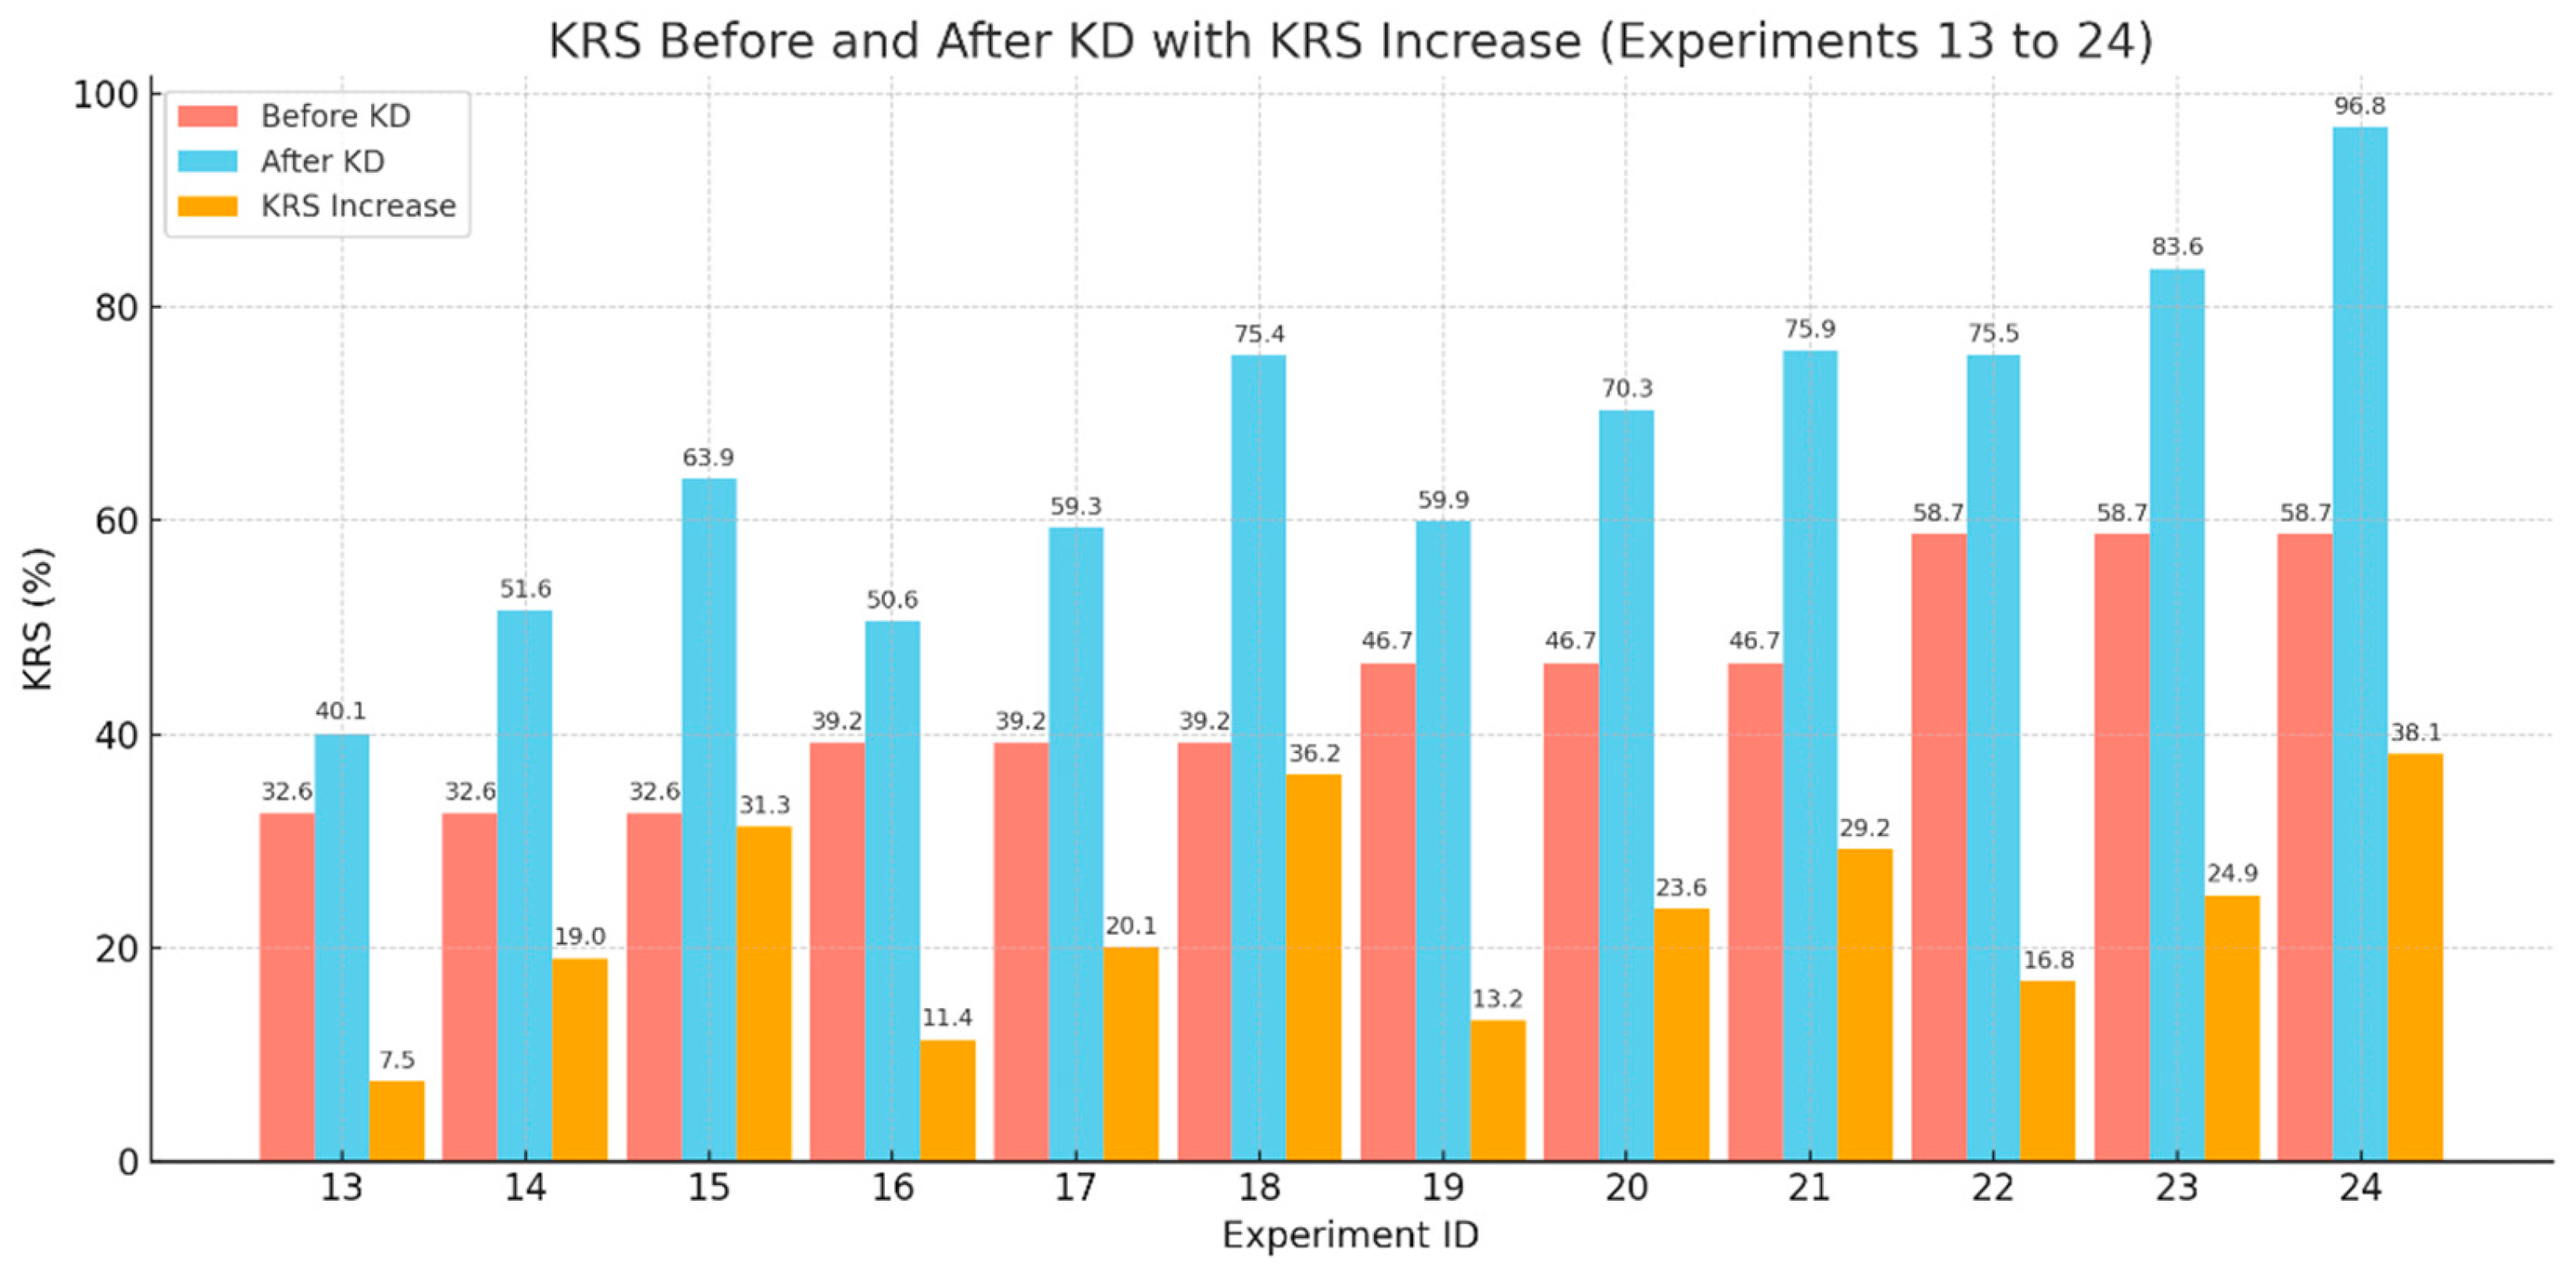

Table 1.
Data split of various datasets used in this study.
| Title 1 | Total Images | Training Set | Validation Set | Test Set | |
|---|---|---|---|---|---|
| CIFAR-100 | 60,000 | 50,000 | 5,000 | 10,000 | |
| Tiny ImageNet | 120,000 | 100,000 | 10,000 | 10,000 | |
| COCO | 164,000 | 118,000 | 5,000 | 41,000 | |
| PASCAL VOC | 11,540 | 8,078 | 1,731 | 1,731 | |
| Oxford IIIT Pet | 7,349 | 5,239 | 1,105 | 1,105 |
Table 2.
Parameter compression rate of the teacher-student pair used in this study.
| Teacher Model/Student Model | Compression Rate (%) | |
|---|---|---|
| ResNet-101/ResNet-18 | 73.71 | |
| VGG-19/AlexNet | 57.34 | |
| WRN-40-2/WRN-16-1 | 92.60 | |
| EfficientNet-B7/EfficientNet-Lite | 91.97 |
Table 3.
Overall summary of the datasets, teacher-student pairs, and KD methods used in this study per CV task.
Table 3.
Overall summary of the datasets, teacher-student pairs, and KD methods used in this study per CV task.
| Task | Dataset | Teacher/Student | KD Method |
|---|---|---|---|
| Image Classification | CIFAR-100 Tiny ImageNet Oxford-IIIT Pet |
ResNet-101/ResNet-18 VGG-19/AlexNet |
Vanilla KD [6], SKD [29] |
| Object Detection | COCO PASCAL VOC |
WRN-40-2/WRN-16-1 EfficientNet-B7/EfficientNet-Lite |
FitNet [8], ART [30], UET [31] |
| Image Segmentation | Oxford-IIIT Pet | ResNet-101/ResNet-18 EfficientNet-B7/EfficientNet-Lite VGG-19/AlexNet WRN-40-2/WRN-16-1 |
GKD [32], GLD [33], CRCD [34] |
Table 4.
Summary of layers to where feature map will be extracted.
| Teacher/Student | Layers to Capture from the Teacher | Layers to Capture from the Student |
|---|---|---|
| ResNet-101/ResNet-18 | Conv2_x, Conv3_x, Conv4_x, Conv5_x |
Conv2_x, Conv3_x, Conv4_x, Conv5_x |
| VGG-19/AlexNet | Conv1_2, Conv2_2, Conv3_4, Conv4_4, Conv5_4 | Conv1, Conv2, Conv3, Conv4, Conv5 |
| WRN-40-2/WRN-16-1 | Block 2, Block 3, Block 4 | Block 2, Block 3, Final Block |
| EfficientNet-B7/ EfficientNet-Lite |
MBConv2_1, MBConv3_3, MBConv4_5, | Corresponding MBConv blocks |
Table 5.
ID No. of the different experiments conducted in this study.
| ID No. | Task | Dataset | Teacher Network | Student Network | KD Model |
|---|---|---|---|---|---|
| 1 | Image Classification | CIFAR-100 | ResNet-101 | ResNet-18 | Vanilla KD |
| 2 | Image Classification | CIFAR-100 | ResNet-101 | ResNet-18 | SKD |
| 3 | Image Classification | CIFAR-100 | VGG-19 | AlexNet | Vanilla KD |
| 4 | Image Classification | CIFAR-100 | VGG-19 | AlexNet | SKD |
| 5 | Image Classification | Tiny ImageNet | ResNet-101 | ResNet-18 | Vanilla KD |
| 6 | Image Classification | Tiny ImageNet | ResNet-101 | ResNet-18 | SKD |
| 7 | Image Classification | Tiny ImageNet | VGG-19 | AlexNet | Vanilla KD |
| 8 | Image Classification | Tiny ImageNet | VGG-19 | AlexNet | SKD |
| 9 | Image Classification | Oxford-IIT Pet | ResNet-101 | ResNet-18 | Vanilla KD |
| 10 | Image Classification | Oxford-IIT Pet | ResNet-101 | ResNet-18 | SKD |
| 11 | Image Classification | Oxford-IIT Pet | VGG-19 | AlexNet | Vanilla KD |
| 12 | Image Classification | Oxford-IIT Pet | VGG-19 | AlexNet | SKD |
| 13 | Object Detection | COCO | WRN-40-2 | WRN-16-1 | FitNet |
| 14 | Object Detection | COCO | WRN-40-2 | WRN-16-1 | ART |
| 15 | Object Detection | COCO | WRN-40-2 | WRN-16-1 | UET |
| 16 | Object Detection | COCO | EfficientNet-B7 | EfficientNet-Lite | FitNet |
| 17 | Object Detection | COCO | EfficientNet-B8 | EfficientNet-Lite | ART |
| 18 | Object Detection | COCO | EfficientNet-B9 | EfficientNet-Lite | UET |
| 19 | Object Detection | PASCAL VOC | WRN-40-2 | WRN-16-1 | FitNet |
| 20 | Object Detection | PASCAL VOC | WRN-40-2 | WRN-16-1 | ART |
| 21 | Object Detection | PASCAL VOC | WRN-40-2 | WRN-16-1 | UET |
| 22 | Object Detection | PASCAL VOC | EfficientNet-B7 | EfficientNet-Lite | FitNet |
| 23 | Object Detection | PASCAL VOC | EfficientNet-B8 | EfficientNet-Lite | ART |
| 24 | Object Detection | PASCAL VOC | EfficientNet-B9 | EfficientNet-Lite | UET |
| 25 | Image Segmentation | Oxford-IIT Pet | ResNet-101 | ResNet-18 | GKD |
| 26 | Image Segmentation | Oxford-IIT Pet | ResNet-101 | ResNet-18 | GLD |
| 27 | Image Segmentation | Oxford-IIT Pet | ResNet-101 | ResNet-18 | CRCD |
| 28 | Image Segmentation | Oxford-IIT Pet | EfficientNet-B7 | EfficientNet-Lite | GKD |
| 29 | Image Segmentation | Oxford-IIT Pet | EfficientNet-B7 | EfficientNet-Lite | GLD |
| 30 | Image Segmentation | Oxford-IIT Pet | EfficientNet-B7 | EfficientNet-Lite | CRCD |
| 31 | Image Segmentation | Oxford-IIT Pet | VGG-19 | AlexNet | GKD |
| 32 | Image Segmentation | Oxford-IIT Pet | VGG-19 | AlexNet | GLD |
| 33 | Image Segmentation | Oxford-IIT Pet | VGG-19 | AlexNet | CRCD |
| 34 | Image Segmentation | Oxford-IIT Pet | WRN-40-2 | WRN-16-1 | GKD |
| 35 | Image Segmentation | Oxford-IIT Pet | WRN-40-2 | WRN-16-1 | GLD |
| 36 | Image Segmentation | Oxford-IIT Pet | WRN-40-2 | WRN-16-1 | CRCD |
Table 6.
Comparison of KD methods based on gains in conventional metrics and KRS.
| Lowest to Highest Ranking of KD Methods by Conventional Metrics Gain | Lowest to Highest KRS Gainers |
|---|---|
| Vanilla KD | Vanilla KD |
| FitNet | FitNet |
| GKD | GKD |
| CRCD | CRCD |
| ART | ART |
| GLD | GLD |
| UET | UET |
Disclaimer/Publisher’s Note: The statements, opinions and data contained in all publications are solely those of the individual author(s) and contributor(s) and not of MDPI and/or the editor(s). MDPI and/or the editor(s) disclaim responsibility for any injury to people or property resulting from any ideas, methods, instructions or products referred to in the content. |
© 2025 by the authors. Licensee MDPI, Basel, Switzerland. This article is an open access article distributed under the terms and conditions of the Creative Commons Attribution (CC BY) license (http://creativecommons.org/licenses/by/4.0/).
Copyright: This open access article is published under a Creative Commons CC BY 4.0 license, which permit the free download, distribution, and reuse, provided that the author and preprint are cited in any reuse.


