
Submitted:
08 May 2025
Posted:
09 May 2025
You are already at the latest version
Abstract
Phosphorus compromises seed productivity and quality, highlighting the need for studies that define the nutritional requirements for organic cultivation. Thus, the objective of this study was to determine the dry mass and macronutrient accumulation curve in lettuce for seed production, aiming at cultivation in an organic system. The treatments consisted of two phosphorus doses (320 and 800 kg ha-1 of P2O5, Yoorin® thermophosphate source). The crisp lettuce plants, cultivar Solaris, were collected at eight stages (0, 14, 28, 42, 56, 70, 84 and 98 days after transplanting - DAT) for analysis of the proposed characteristics. The results demonstrated continuous plant growth, accompanied by a gradual increase in dry matter throughout the experimental period, regardless of the phosphorus dose studied. The dose of 800 kg ha-1 of P2O5, the lettuce plant accumulated 1527.7, 308.2, 2922.6, 1658.4, 416.0 and 197.6 mg per plant of N, P, K, Ca, Mg and S, respectively. The dose of 320 kg ha-1 of P2O5, the lettuce plant accumulated 1743.1, 256.9, 2575.7, 1210.2, 358.8 and 185.5 mg per plant of N, P, K, Ca, Mg and S, respectively. The greatest demand for nutrients in the plant occurred between 55 and 88 DAT.
Keywords:
Lactuca sativa L.
; organic fertilization
; protected cultivation
; plant nutrition
; phosphorus
1. Introduction
The production of lettuce (Lactuca sativa L.) under organic systems has been gaining increasing interest, mainly due to the growing demand for healthy and environmentally sustainable food. One of the key factors for the success of this cultivation system is the proper management of nutrients, since the use of synthetic fertilizers is not allowed, and efficient use of natural resources is essential.
In this context, understanding the dynamics of nutrient uptake and accumulation at different growth stages of the plant allows the identification of periods of greater demand for essential elements and the correction of possible deficiencies throughout the crop cycle [1]. Thus, the plant growth curve stands out as an essential tool in developing an efficient fertilization program, directly impacting production and the sustainability of agroecosystems.
In some vegetable species, the crop cycle is extended when the goal is seed production, and nutrient demand tends to increase as a result of flowering and fruiting, especially in species where the vegetable product is harvested before flowering, such as herbaceous vegetables [2,3].
Although scarce, there are some studies on fertilization and nutrient uptake in lettuce seed production, but most have been conducted using inorganic fertilizers under conventional systems. Due to the increasing consumer demand for organically produced goods worldwide, there is a greater need for research and techniques that enable vegetable and seed production with minimal or no use of mineral fertilizers and pesticides [4].
Despite the significant market presence of organically grown vegetables, the production of lettuce seeds under ecological-based systems is still underexplored. As a result, producers are often forced to use seeds from conventional systems [5], highlighting the need for more information on nutrient accumulation aimed at seed production under organic management. Organic seed production of lettuce represents a significant step toward more sustainable and responsible agriculture, as well as full certification of the production process.
Phosphate fertilization plays a crucial role in lettuce seed production, since phosphorus (P) is an essential nutrient for several metabolic functions that directly impact growth and production. Although there is information on the nutritional requirements of lettuce, little research has focused on productivity and seed quality in relation to phosphorus doses and sources. The main sources of phosphorus in fertilization are simple and triple superphosphates. However, these cannot be used in the organic system. Among the phosphate fertilizer options allowed in the organic system is thermophosphate, which has the characteristic of slower P dissolution in relation to soluble phosphate sources [6], and may be a good option for the production of lettuce seeds, with release throughout the cycle.
Therefore, the objective of this study was to determine the dry matter and macronutrient accumulation curve in lettuce for seed production under organic cultivation with two doses of phosphorus.
2. Materials and Methods
2.1. Experimental Site and Treatments
The research was carried out at the Experimental Farm of São Paulo State University (UNESP), located in the municipality of São Manuel, São Paulo, Brazil (22°46′04.9″S, 48°34′19.4″W, and 709 m altitude), from September 29, 2023, to February 2, 2024. According to the Köppen classification, the region’s climate is tropical (Aw type), with a rainy summer and dry winter [7].
The experiment was conducted in a protected environment, in an arch greenhouse, with a ceiling height of 2.5 m, measuring 7 m in width and 20 m in length, covered with high-density polyethylene film (150 µm) and sides closed with anti-aphid screen. During the experimental period, the external average maximum, mean, and minimum temperatures were 30.3 °C, 23.7 °C, and 18.9 °C, respectively; the relative humidity averaged 69.1%, and the daily average rainfall was 4.6 mm.
The soil was classified as a Typic Dystrophic Red Latosol. Soil samples were collected before and after the experiment and sent to the Department of Forest Science, Soil, and Environment at São Paulo State University (UNESP), for chemical analysis (Table 1). Soil correction was performed based on the analysis results to raise base saturation to 80%, following the recommendation by Trani [8].
Two phosphorus doses were evaluated (320 and 800 kg ha−1 of P2O5), supplied through a source permitted in organic systems: Yoorin® thermophosphate. The doses were defined according to Kano et al. (9) for seed production (800 kg ha−1 of P2O5) and the fertilization recommendation for lettuce grown for fresh consumption (320 kg ha−1 of P2O5) in the state of São Paulo [8].
Eight plant samplings were performed throughout the crop cycle, at 0, 14, 28, 42, 56, 70, 84, and 98 days after transplanting (DAT), with three replications and one plant per plot at each sampling point, except on the transplanting day (0 DAT), when 120 seedlings were sampled. Solaris cultivar seedlings were produced in 200-cell trays using Carolina substrate and transplanted on October 27, 2023, into 8 L pots. Pots were spaced 1.0 m between rows and 0.5 m between plants.

Table 1.
Soil analysis before and after the experiment.
| pH(CaCl2) | OM* | Pres | SB | K+ | Ca2+ | Mg2+ | CTC | V | ||
| g dm−3 | mg dm−3 | % | ||||||||
| Before soil correction | 4.6 | 2 | 13 | 27 | 1.1 | 20 | 6 | 45 | 59 | |
| After soil correction | 5.8 | 6 | 13 | 50 | 1.3 | 36 | 12 | 62 | 80 | |
| Dose (kg ha−1 of P2O5) | ||||||||||
| 320 | 6.5 | 7 | 48 | 71 | 0.7 | 52 | 18 | 82 | 86 | |
| 800 | 6.8 | 10 | 157 | 90 | 2.0 | 60 | 28 | 98 | 91 | |
* Organic matter.
Planting and supplemental fertilization were carried out based on the soil analysis and according to the recommendations by Trani [8]. except for phosphorus, which followed the experimental phosphorus doses. The planting fertilization supplied 0.16 g of nitrogen (N) and 0.48 g of potassium (K2O) per plant, using castor bean cake and potassium sulfate, respectively. Additionally, 80 g of chicken manure per plant was applied as a source of organic matter. Phosphorus fertilization was done using Yoorin® thermophosphate, at rates of 17.8 and 7.1 g per plant, corresponding to 800 and 320 kg ha−1 of P2O5, respectively.
In supplemental fertilization, N, P2O5, and K2O were supplied at doses of 0.18, 0.06, and 0.12 g per plant, respectively, using the same sources as in the planting fertilization. Fertilization was performed weekly until one week before seed harvest. The chemical analysis of the fertilizers was carried out according to the Official Analytical Methods Manual for Fertilizers and Soil Amendments [10], and is shown in Table 2. Considering that, in addition to Yoorin® thermophosphate, other organic sources containing phosphorus were used during planting, the actual applied dose was higher than the one described in the treatments. However, since these additional sources were applied to all plants, the phosphorus dose from Yoorin® thermophosphate was used to define the treatments.
Table 3 presents the estimated amounts of macronutrients potentially supplied per hectare during pre-planting, topdressing, and cumulatively, based on the application of organic fertilizers throughout the crop cycle.
Weed management was conducted manually to minimize competition. At 70 days after transplanting (DAT), plants were supported with bamboo stakes to prevent lodging caused by the increased biomass associated with seed development. Irrigation was carried out using a localized drip system, with water applied in three daily intervals to ensure adequate soil moisture.
2.2. Evaluated Characteristics
For every sampling interval, plants were harvested by cutting at the base of the stem, at soil level. The following measurements were taken: plant height, stem diameter, and number of leaves. The harvested plants were separated into vegetative parts (leaves and stem) and reproductive parts (from 56 days after transplanting—DAT) and washed with running water followed by distilled water. In the final sampling, at 98 DAT, seeds were separated from the remaining reproductive structures. Seed harvest was performed when approximately 70% of the achenes exhibited white pappus bristles on the inflorescence.
After washing, at each sampling point, the leaves, stem, and reproductive parts were placed separately in Kraft paper bags and dried in a forced-air circulation oven at 65 ± 0.5 °C until reaching constant weight. The material was then weighed using a precision balance (± 0.01 g) to determine dry mass, with results expressed in g plant−1.
The dried samples were ground in a stainless steel Willey-type mill, stored in paper bags, and sent to the Plant Analysis Laboratory of the Department of Forest Science, Soil and Environment at FCA/UNESP for macronutrient determination in leaves, stem, and reproductive parts. Nutrient analyses were conducted following the procedures described by Malavolta [11], using sulfuric acid digestion for nitrogen and nitric-perchloric acid digestion for phosphorus, potassium, calcium, magnesium, and sulfur. The results were expressed in g kg-1 of dry matter and were used to calculate macronutrient accumulation.
Accumulated nutrient quantities were obtained by multiplying the concentration of each nutrient by the corresponding dry mass of the sample, with results expressed in mg plant-1.
Daily accumulation rates for the vegetative, reproductive, and total parts were calculated based on the estimated accumulation of each nutrient by subtracting the values of two consecutive sampling days. This calculation was performed across the entire crop cycle, resulting in daily accumulation values expressed in mg plant−1 day−1 for each macronutrient.
2.3. Statistical Analysis
To estimate growth and macronutrient accumulation, the Origin software was used. A nonlinear sigmoid regression curve with three parameters was fitted according to the following model:
where: y = mean value of the evaluated trait; a = asymptotic maximum value of the curve; k = adjustment parameter; xc = inflection point.
y = a / [1 + e−k(x − xc)],
3. Results
This section may be divided by subheadings. It should provide a concise and precise description of the experimental results, their interpretation, as well as the experimental conclusions that can be drawn.
3.1. Agronomic Characteristics
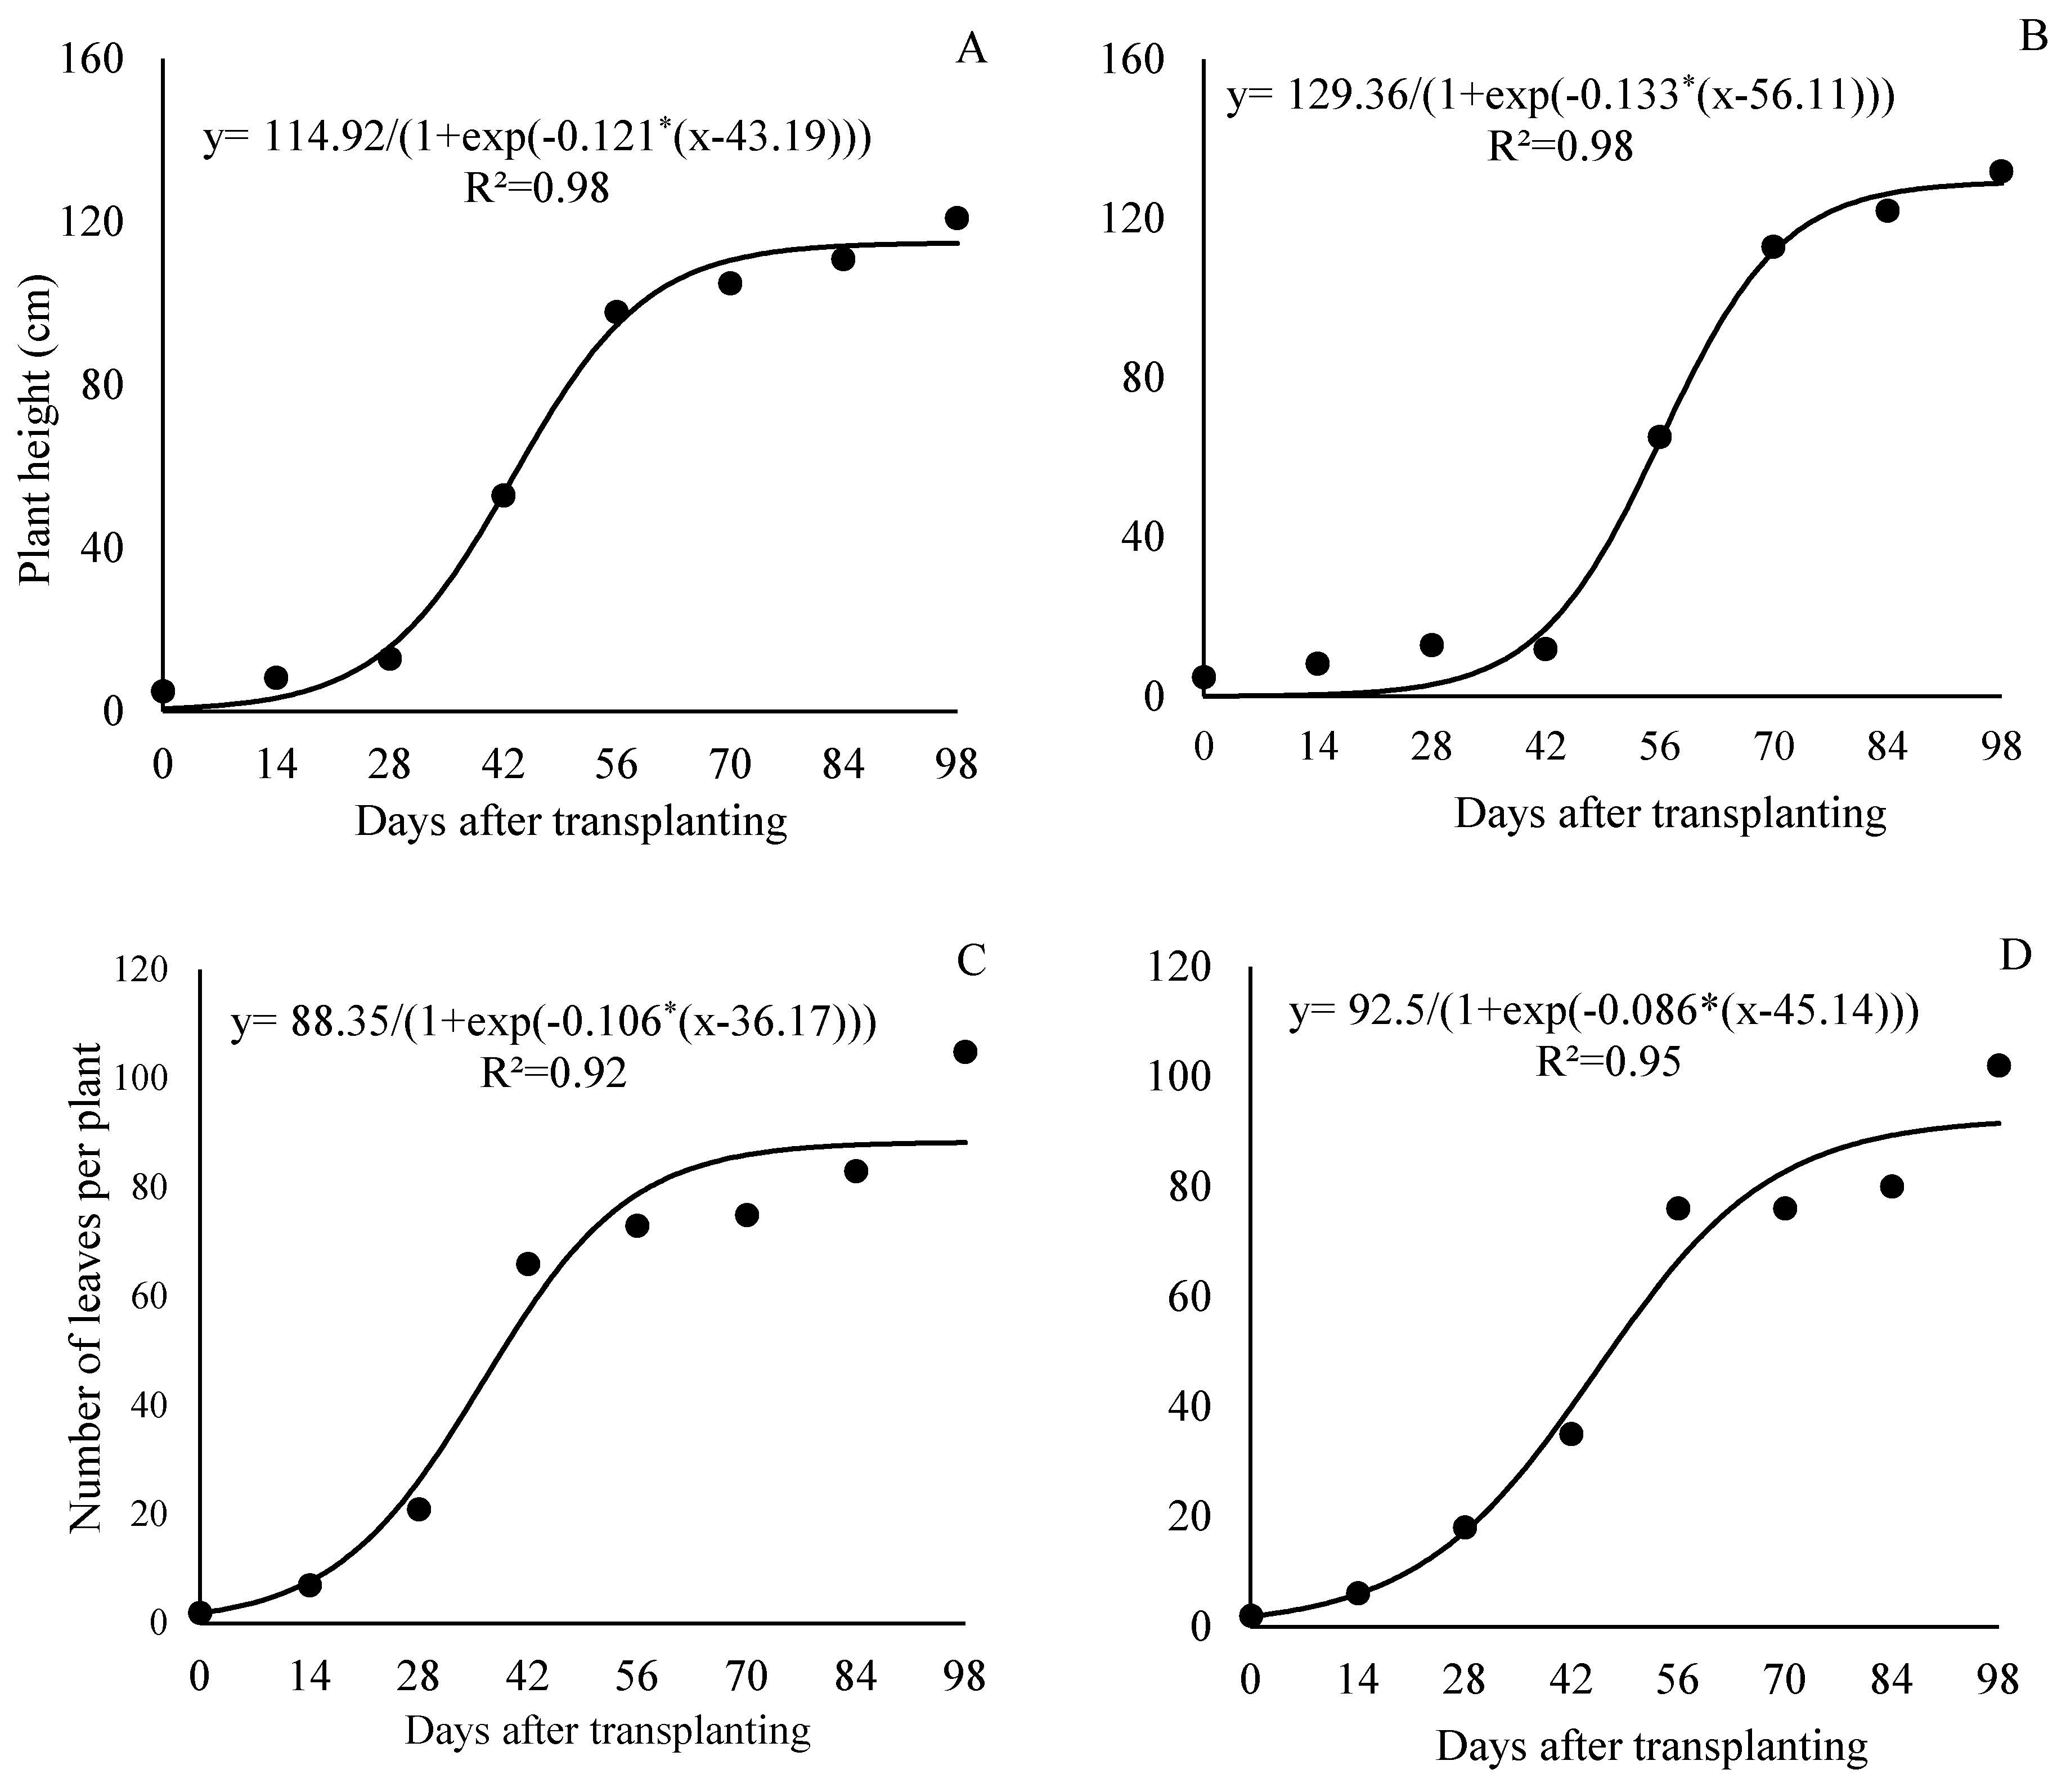
The growth cycle of curly lettuce cv. Solaris lasted 98 days from transplanting to seed harvest (or 126 days after sowing—DAS), and the growth curve followed a sigmoidal model. The duration of the lettuce cycle for seed production was approximately 2.5 times longer than that of the crop cultivated for fresh consumption, in which the harvest point occurs around 35 DAT. The emergence of the first flower buds began at 56 DAT (or 84 DAS), flowering started at 70 DAT (98 DAS), and the opening of flowers in most plants occurred around 84 DAT (112 DAS).
Lettuce plants exhibited three distinct growth stages. The most significant increases in plant height and stem diameter were observed after 42 DAT, coinciding with the onset of stem elongation. Regarding leaf number, there was a sharp increase between 28 and 56 DAT under the 800 kg ha−1 P2O5 treatment, and between 28 and 70 DAT under the 320 kg ha−1 P2O5 treatment, with the leaf emission rate decreasing thereafter (Figure 3C, Figure 3D, respectively). At the fresh market harvest point (35 DAT), plants had an average of 41 and 27 leaves under the respective treatments.
At the end of the cycle, lettuce plants reached 114.7 cm in height (Figure 3A), an average of 88 leaves per plant (Figure 3C), and a stem diameter of 33.4 mm (Figure 3E) with the 800 kg ha−1 P2O5 dose; and 128.8 cm (Figure 3B), 91.5 leaves (Figure 3D), and 31.7 mm (Figure 3F) with the 320 kg ha−1 P2O5 dose.
Figure 3.
Plant height, number of leaves per plant, and stem diameter of lettuce plants under organic fertilization management with doses of 800 kg ha−1 of P2O5 (A, C, and E) and 320 kg ha−1 of P2O5 (B, D, and F).
Figure 3.
Plant height, number of leaves per plant, and stem diameter of lettuce plants under organic fertilization management with doses of 800 kg ha−1 of P2O5 (A, C, and E) and 320 kg ha−1 of P2O5 (B, D, and F).
3.2. Dry Matter Accumulation
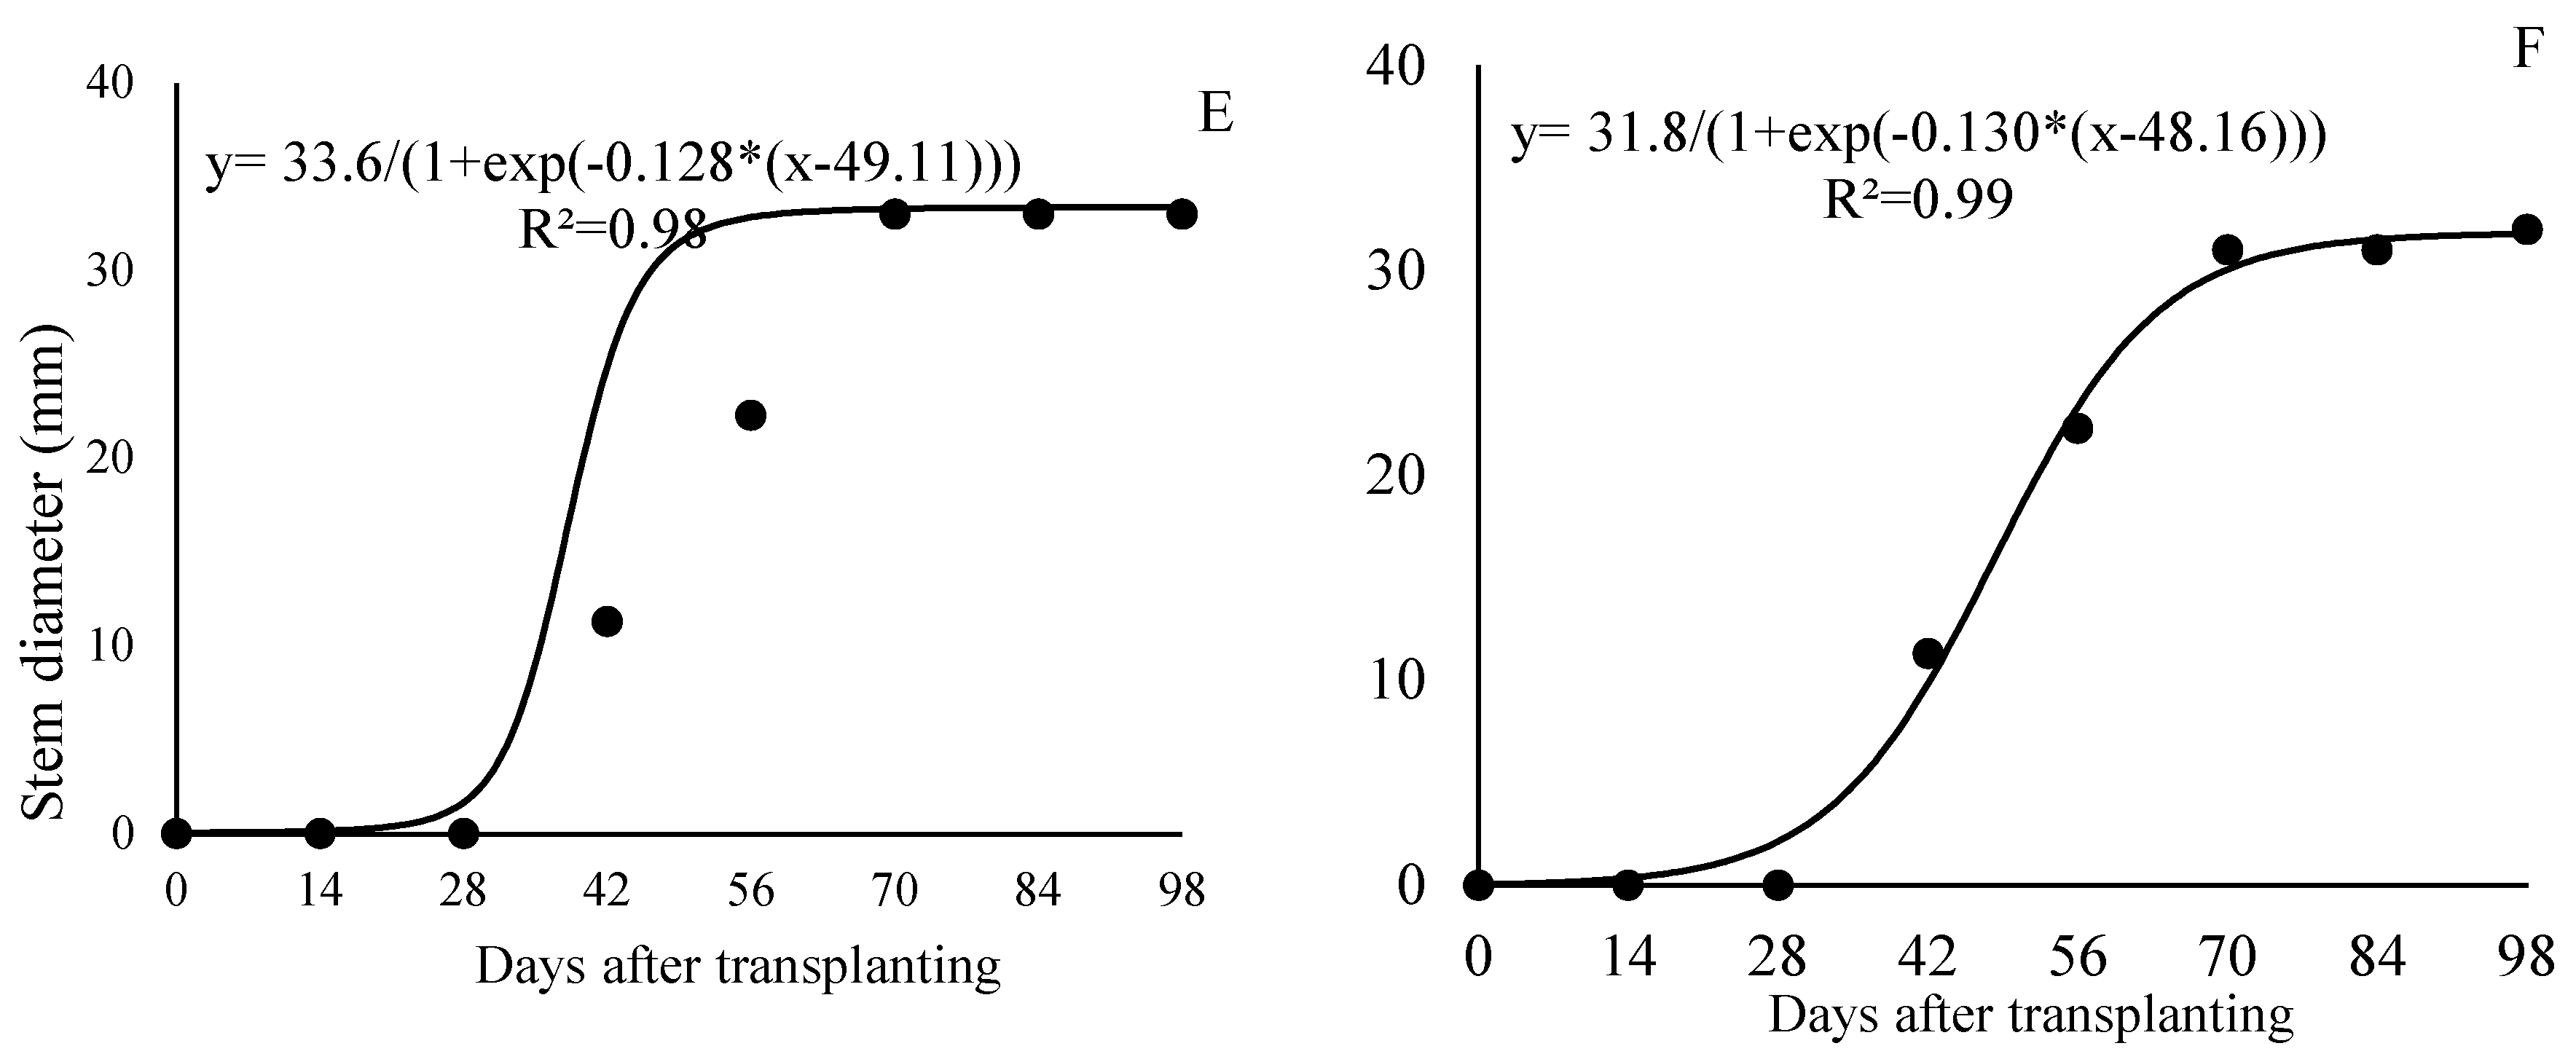
Total dry matter accumulation in lettuce plants grown for seed production was continuous throughout the crop cycle and could be divided into two distinct stages: the first from transplanting to 28 days after transplanting (DAT), and the second from 29 DAT to seed harvest (98 DAT), for both phosphorus doses 800 kg ha−1 of P2O5 (Figure 2A) and 320 kg ha−1 of P2O5 (Figure 2B).
The first stage (0 to 28 DAT) was characterized by low dry matter accumulation, with an average of 5.27 g plant−1 under the 320 kg ha−1 P2O5 treatment, representing 4.8% of the total accumulated by the end of the cycle (109.8 g plant−1); and 13.05 g plant−1 under the 800 kg ha−1 P2O5 treatment, corresponding to 10.8% of the final accumulated total of 120.8 g plant−1 at 98 DAT.
Figure 2.
Dry matter accumulation in the leaves, stem, reproductive organs, and total of lettuce plants under organic fertilization management and phosphorus doses of 800 (A) and 320 (B) kg ha−1 of P2O5.
Figure 2.
Dry matter accumulation in the leaves, stem, reproductive organs, and total of lettuce plants under organic fertilization management and phosphorus doses of 800 (A) and 320 (B) kg ha−1 of P2O5.
In the leaves and stem, under the dose of 800 kg ha−1 of P2O5, dry matter accumulation followed three stages, the first stage occurred from 0 to 28 DAT, the second from 29 to 56 DAT, and the third from 57 to 98 DAT. In the first stage, the plants accumulated 9.37 and 3.02 g plant−1 of dry matter in the leaves and stem, which represented 22.7% and 8.8% of the total dry matter accumulated by 98 DAT, respectively. During the second stage, dry matter accumulation was more pronounced, with the plants accumulating 38.4 and 23.3 g plant-1 in the leaves and stem, accounting for approximately 70% and 60% of the total accumulation, respectively. In the third stage, plants accumulated 2.9 and 10.9 g plant-1 of dry matter (7% and 31.7% of the total accumulated by 98 DAT), respectively.
Under the dose of 320 kg ha−1 of P2O5, dry matter accumulation in leaves and stem also followed three stages, with the first stage occurring from 0 to 28 DAT (leaves) and 0 to 42 DAT (stem), the second from 28 to 56 DAT (leaves) and 43 to 70 DAT (stem), and the third from 57 to 98 DAT (leaves) and 71 to 98 DAT (stem). In the first stage, the plants accumulated 5.0 and 0.8 g plant−1 in the leaves and stem (15.65% and 2.42% of the total accumulated by 98 DAT), respectively. In the second stage, the plants accumulated approximately 23.8 and 28.7 g plant−1 in the leaves and stem, representing 74% and 91% of the total accumulated, respectively.
At the harvest point for fresh consumption, i.e., at 35 DAT, plants had accumulated 11.1 and 24.9 g plant−1 of dry matter, corresponding to 10.1% and 20.6% of the total dry matter accumulated at the doses of 320 and 800 kg ha−1 of P2O5, respectively.
3.3. Macronutrients Accumulation
At the dose of 800 kg ha−1 of P2O5, nitrogen accumulation in the leaves occurred sharply during the first 42 days after transplanting (DAT) and then stabilized. The stem showed a more gradual nitrogen accumulation compared to the leaves during the first 42 DAT, followed by a more pronounced increase after 42 DAT, coinciding with stem elongation due to the formation of the reproductive stalk. In the reproductive part, nitrogen accumulation was more intense and almost linear from 56 DAT onward, at the time of floral bud emergence (Figure 4A).
At the dose of 320 kg ha−1 of P2O5, nitrogen accumulation in the leaves and stem increased throughout the cycle, although it was less intense after 70 DAT and did not reach stabilization as observed with the higher dose and in the dry matter data (Figure 2). In the reproductive part, accumulation became more pronounced after 70 DAT (Figure 4B).
Figure 4.
Nitrogen accumulation in different parts of lettuce plants grown for seed production under organic fertilization with 800 (A) and 320 (B) kg ha−1 of P2O5.
Figure 4.
Nitrogen accumulation in different parts of lettuce plants grown for seed production under organic fertilization with 800 (A) and 320 (B) kg ha−1 of P2O5.
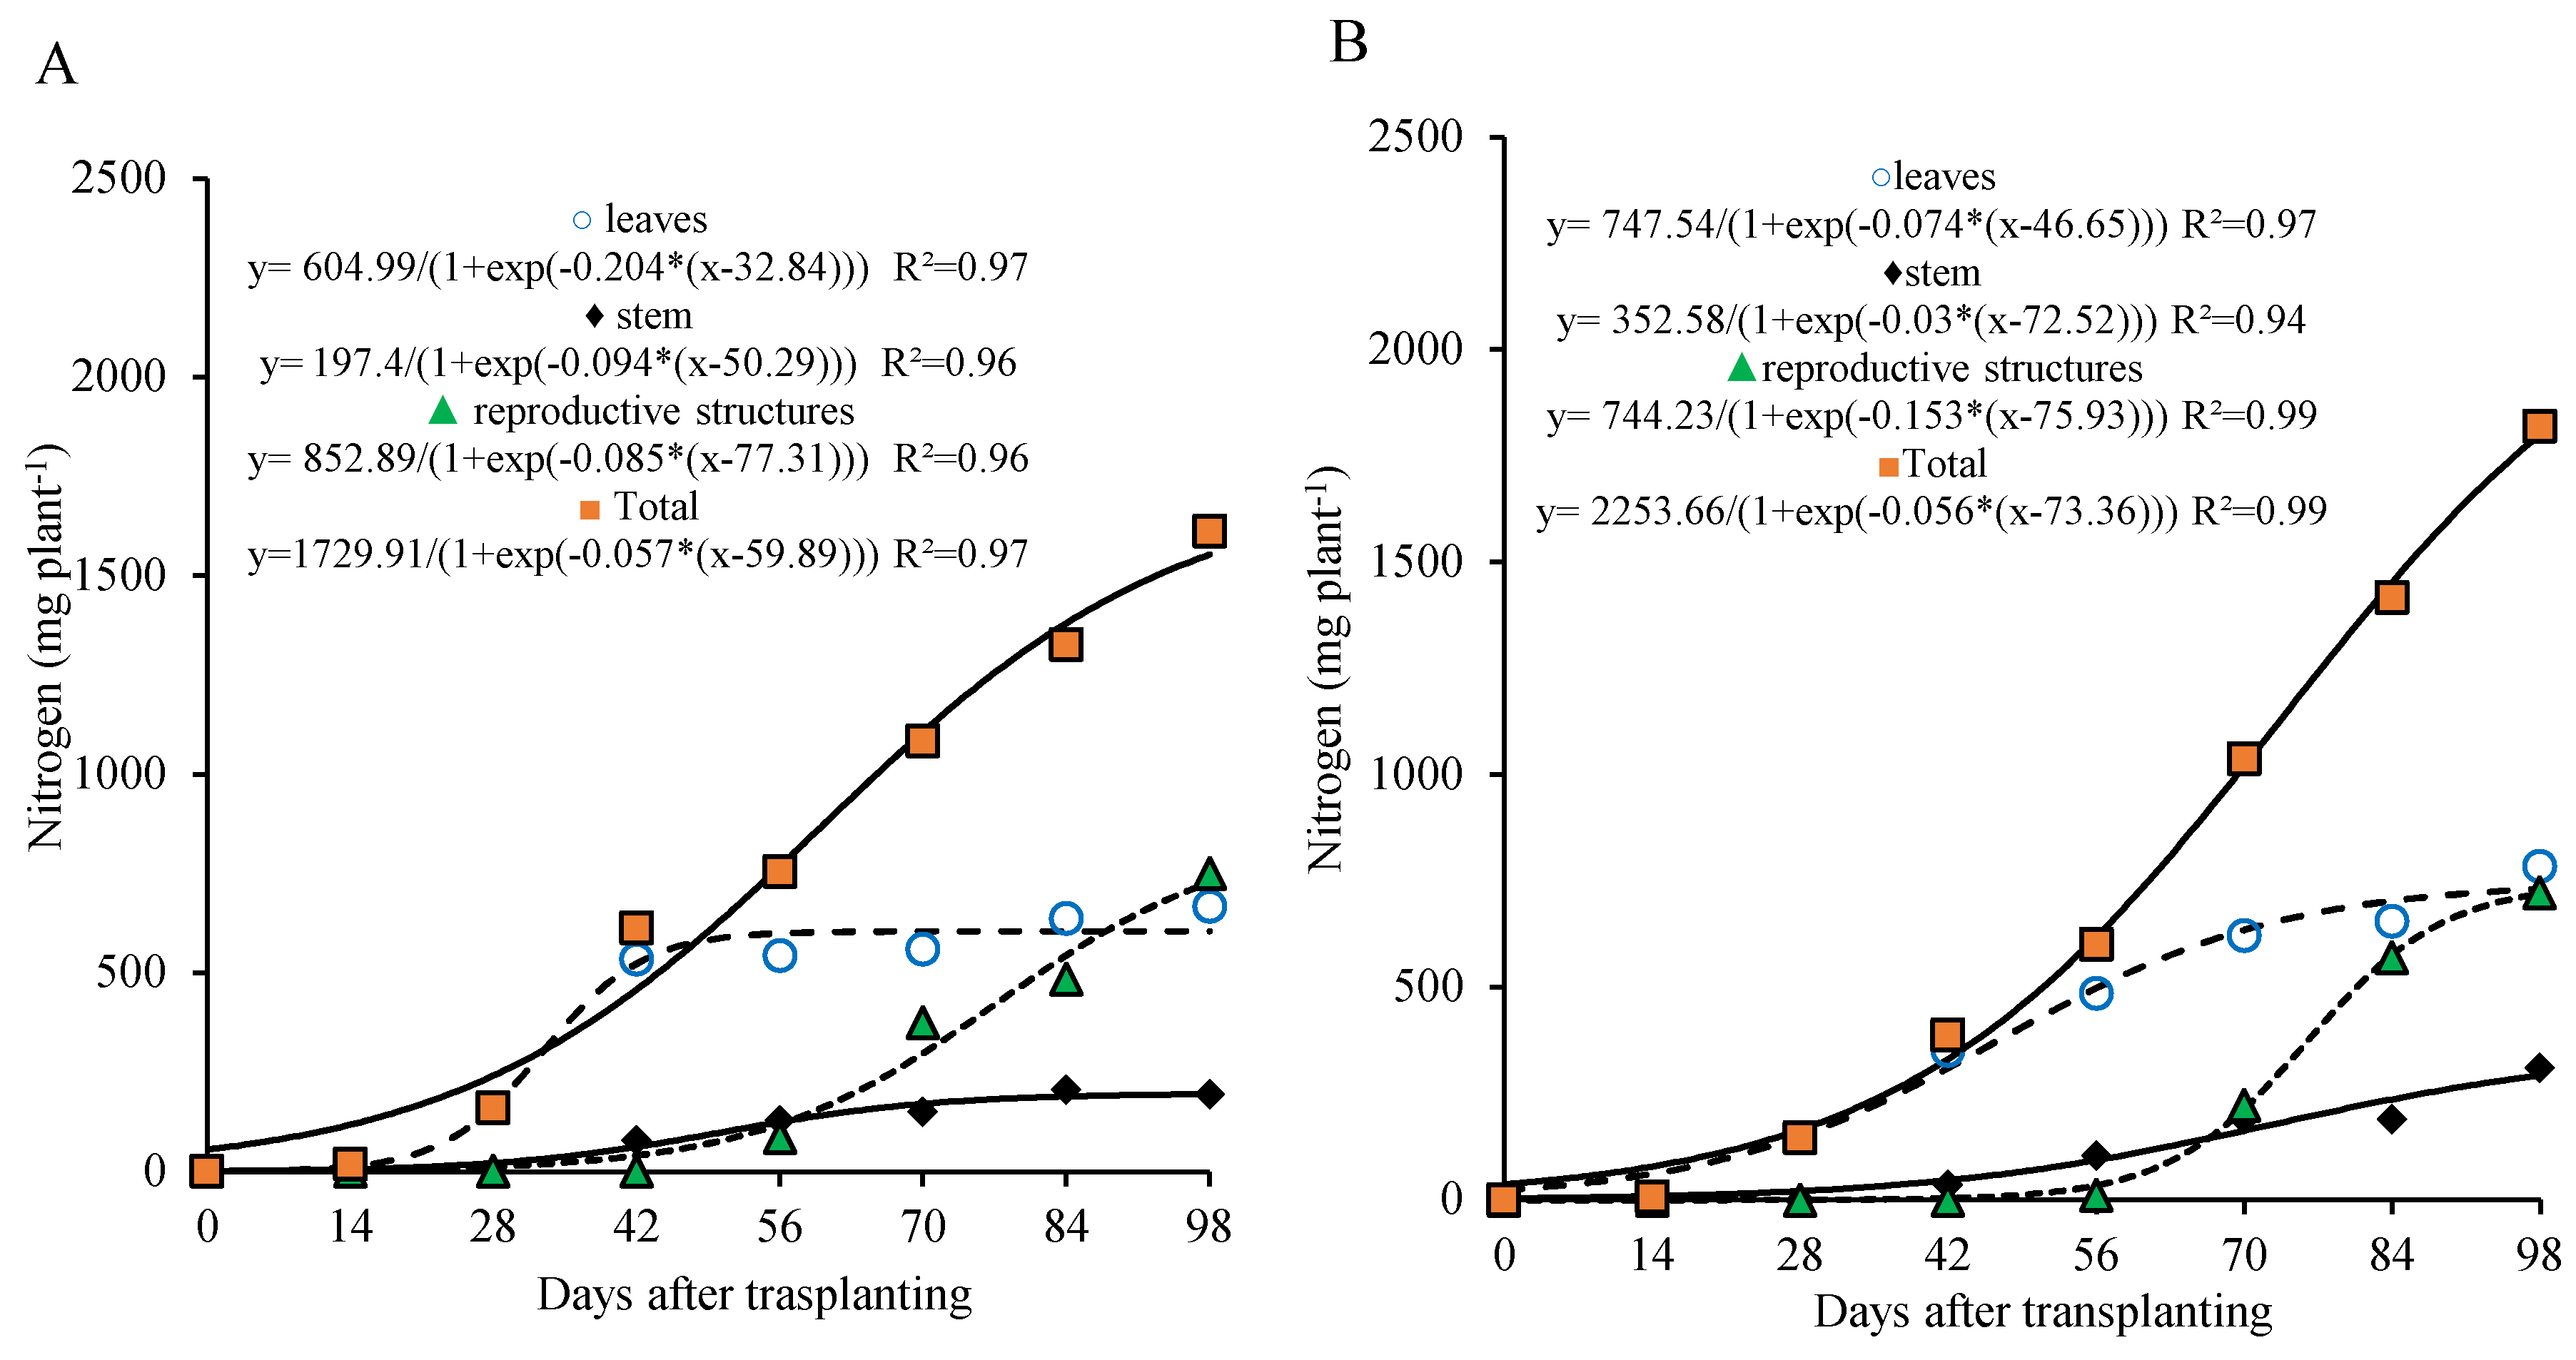
Nitrogen accumulation in the plant (total) followed a continuous growth pattern up to 98 days after transplanting (DAT), fitting a sigmoidal curve. This accumulation could be divided into two distinct stages for both phosphorus doses, similarly to the dry matter accumulation pattern. The first stage occurred from 0 to 28 DAT, during which nitrogen accumulation reached 198.5 and 171.7 mg per plant—representing approximately 13% and 9.8% of the total at the end of the cycle—for the 800 and 320 kg ha−1 doses, respectively. The daily accumulation rate during this phase averaged 7.0 and 6.1 mg per plant per day.
From 29 to 98 DAT, nitrogen uptake intensified considerably. During this second stage, plants accumulated 1329.2 and 1571.5 mg per plant—equivalent to 87.0% and 90.2% of the total nitrogen content—for the 800 and 320 kg ha−1 doses, respectively. The average daily accumulation rates in this phase were 19.0 and 22.45 mg per plant per day (Figure 4A,B).
At the end of the cycle, total nitrogen accumulation for the 800 kg ha−1 dose reached 1527.7 mg per plant, with 40% allocated to the leaves, 13% to the stem, and 48% to the reproductive structures. A similar distribution was observed under the 320 kg ha−1 dose, with total nitrogen accumulation of 1743.17 mg per plant, 42% in the leaves, 17% in the stem, and 41% in the reproductive part (Figure 4A,B).
The overall nitrogen accumulation pattern was similar to that of total dry matter accumulation, with limited uptake before 28 DAT and most of the nitrogen being absorbed between 29 and 98 DAT under both phosphorus treatments (Figure 2A,B).
Interestingly, even though the reproductive structures represented only 37% (Figure 2A) and 34% (Figure 2B) of total dry mass at 98 DAT for the 800 and 320 kg ha−1 doses, respectively, they accounted for a significant proportion of total nitrogen accumulation, 48% and 41%, respectively.
Phosphorus accumulation exhibited a pattern similar to that of nitrogen in the different parts of the plant, with faster accumulation in the leaves and a more gradual increase in the stem during the first weeks after transplanting. This accumulation tended to stabilize from 42 and 56 days after transplanting (DAT), respectively, and became more intense in the reproductive structures from 70 DAT onward (Figure 5A,B).
For total phosphorus in the plant, two growth stages were also observed for the 800 kg ha−1 P2O5 dose: the first between 0 and 28 DAT, and the second from 29 to 98 DAT. In the first stage, the plant accumulated approximately 12.0% of the total phosphorus (35.7 mg plant−1), with an average of 1.3 mg plant−1 day−1. In the second stage, phosphorus accumulation was more pronounced, reaching 272.2 mg plant−1 by the end of the period (about 88.4% of the total accumulated), with an average of 3.8 mg plant−1 day−1. At the end of the cycle, total accumulation reached 308.2 mg plant−1, distributed among leaves, stem, and reproductive parts in proportions of 30%, 18%, and 52%, respectively (Figure 5A).
For the 320 kg ha−1 P2O5 dose, two growth stages were also observed, with the first occurring between 0 and 42 DAT and the second from 43 to 98 DAT. In the first stage, the plant accumulated about 16.9% of the total phosphorus (43.4 mg plant−1), with an average of 1.03 mg plant−1 day−1. In the second stage, phosphorus accumulation became more pronounced, reaching 213.3 mg plant−1 by the end of the period (approximately 83.1% of the total accumulated), with an average of 3.8 mg plant−1 day−1. At the end of the cycle, total phosphorus accumulation was 256.9 mg plant−1, distributed among leaves, stem, and reproductive parts in proportions of 25%, 25%, and 50%, respectively (Figure 5B).
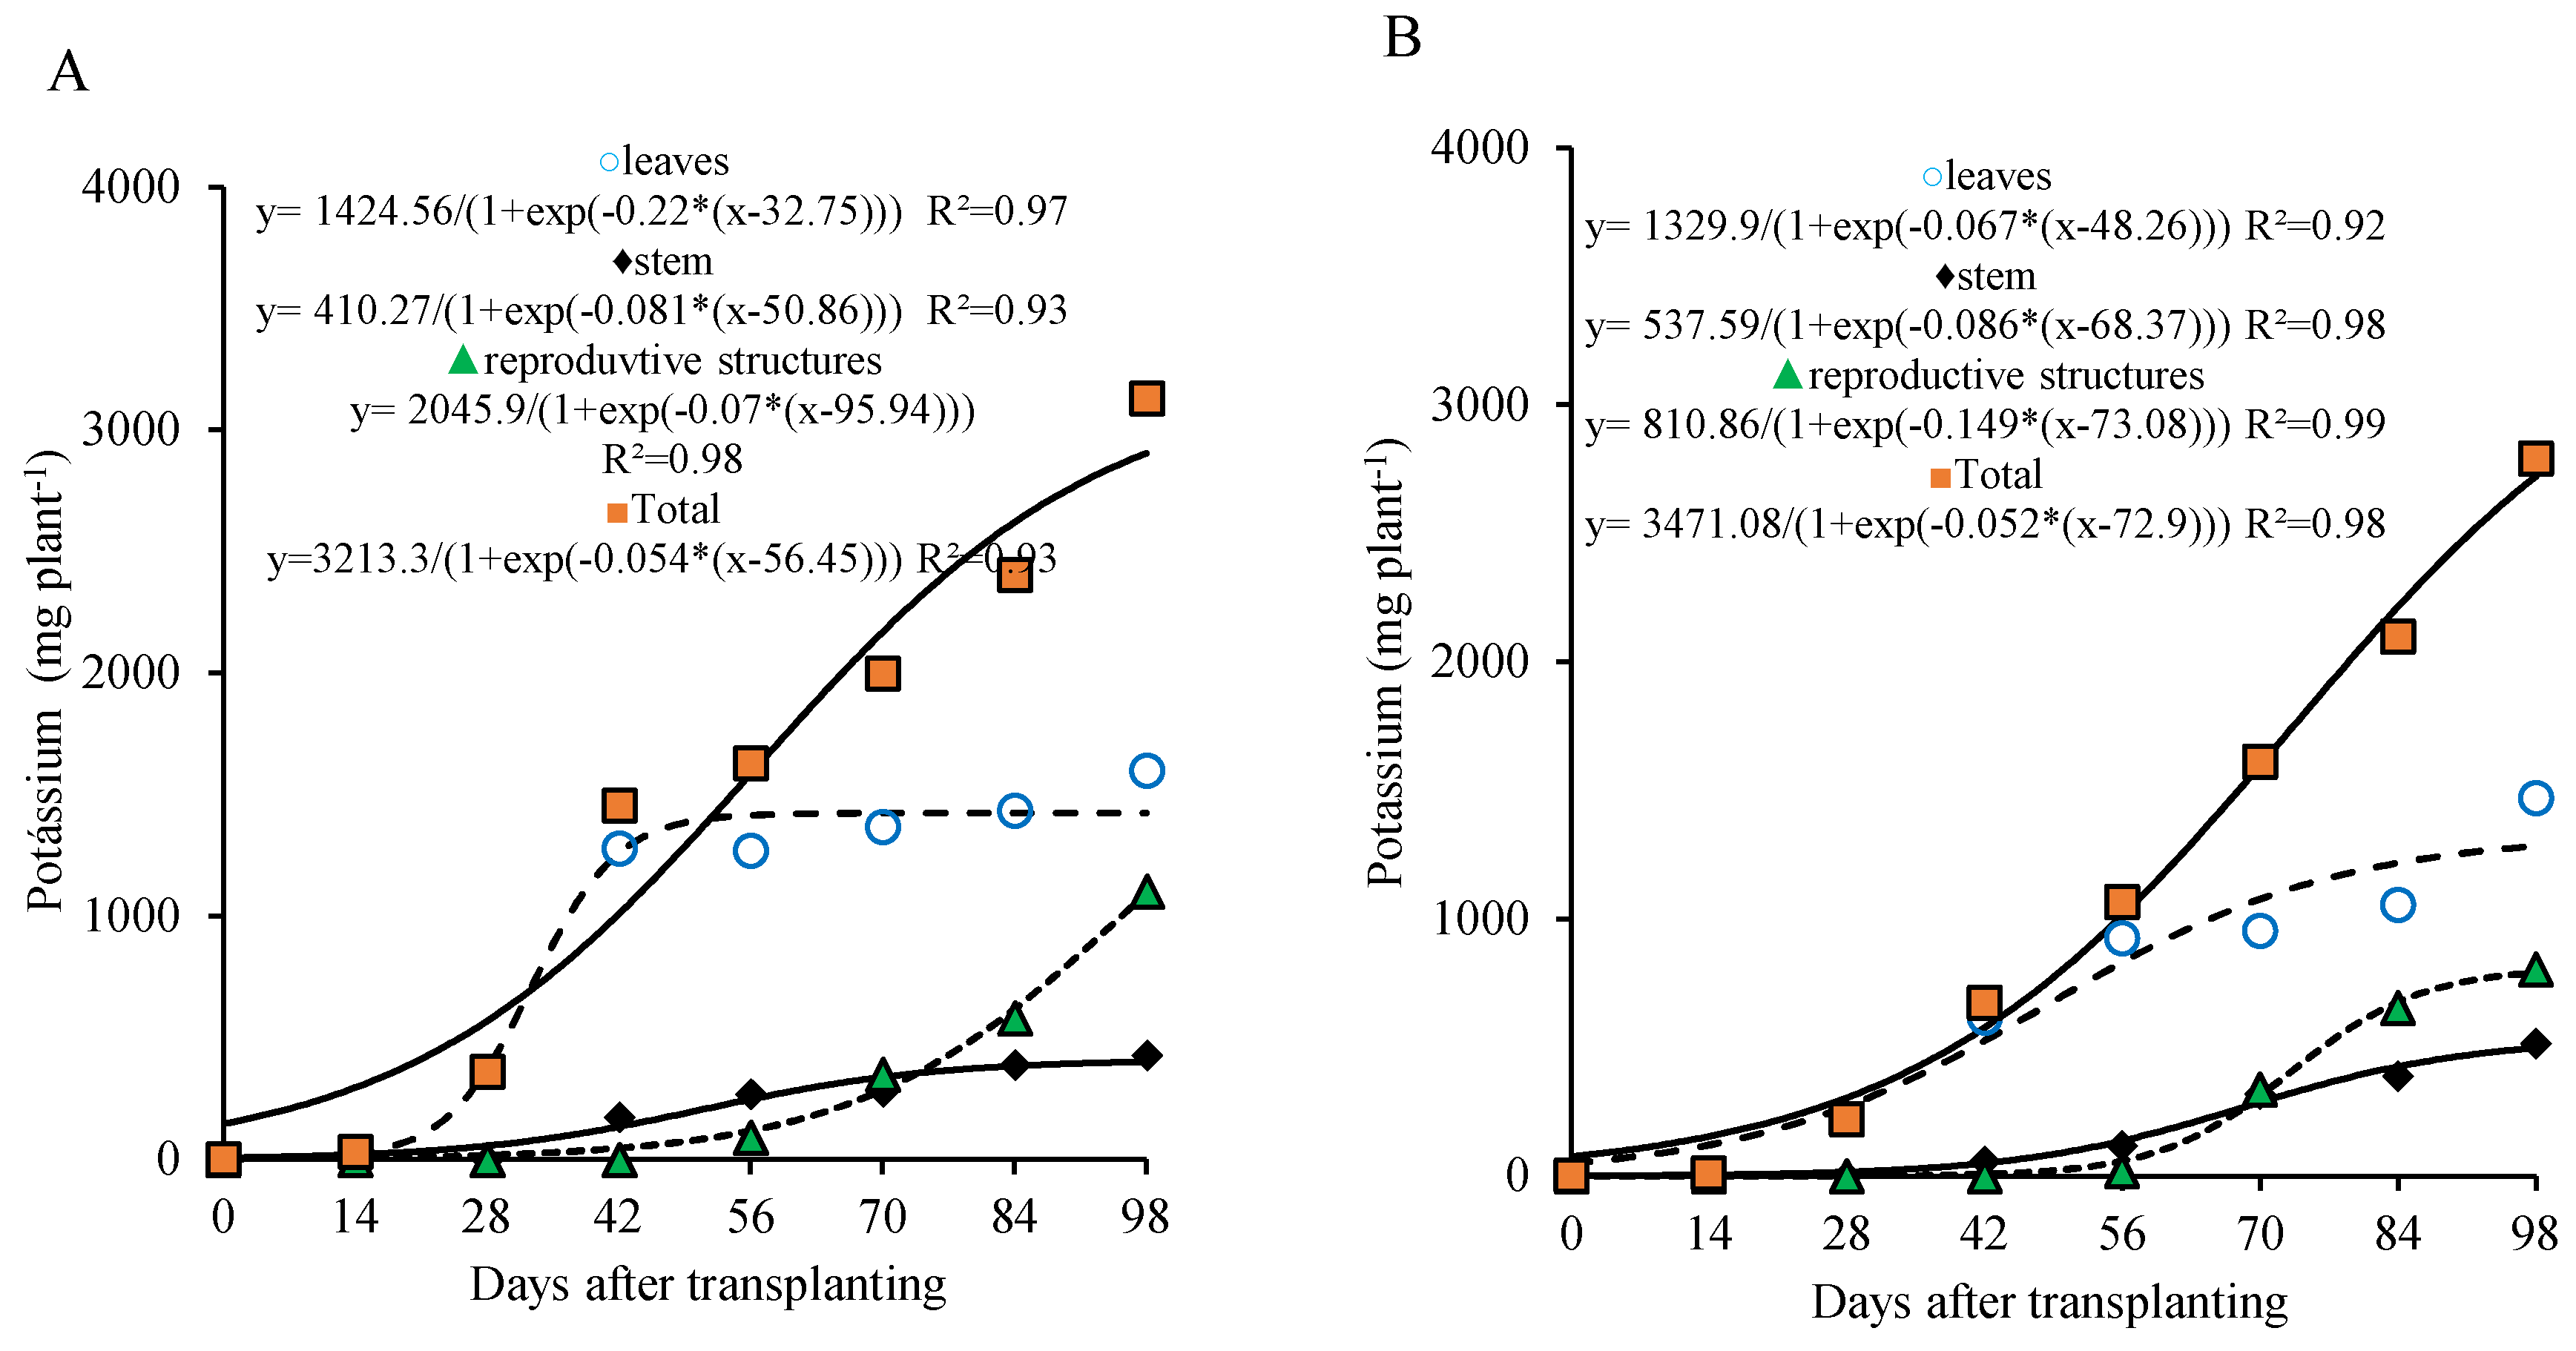
For the 800 kg ha−1 P2O5 dose, potassium accumulation in the leaves was pronounced, with the highest increase occurring around 56 DAT, followed by stabilization thereafter. The stem showed a more gradual potassium accumulation, with growth leveling off after 70 DAT. On the other hand, potassium accumulation in the reproductive part began to intensify from 70 DAT onward, increasing almost steadily until the end of the cycle (Figure 6A).
For the 320 kg ha−1 P2O5 dose, the sigmoid curve shows a continuous and gradual accumulation of potassium in the leaves and stem until the end of the cycle (98 DAT), although less intense during the last two sampling dates. Potassium accumulation in the reproductive part began later, from 70 DAT, reaching a maximum of 791.54 mg plant−1 by the end of the cycle (Figure 6B).
The curve of total potassium accumulation in the plant shows continuous and significant increase around 98 DAT and can be divided into two stages, the first from 0 to 28 DAT and the second from 29 to 98 DAT for both doses studied. In the first stage, the plant accumulated 443.8 and 289.3 mg plant−1 (about 15.2% and 11.2% of the total accumulated by the end of the cycle), with averages of 15.8 and 10.3 mg plant−1 day−1 at 800 and 320 kg ha−1 of P2O5, respectively. In the second stage, an accumulation of 2478.8 and 2284.9 mg plant−1 was recorded (84.8% and 88.8% of the total accumulated by the end of the cycle), with averages of 38.2 and 32.6 mg plant−1 day−1, respectively.
Figure 6.
Potassium accumulation in different parts of lettuce plants grown for seed production under organic fertilization with 800 (A) and 320 (B) kg ha−1 of P2O5.
Figure 6.
Potassium accumulation in different parts of lettuce plants grown for seed production under organic fertilization with 800 (A) and 320 (B) kg ha−1 of P2O5.
Calcium showed a marked accumulation in the leaves up to 56 DAT and a gradual increase in the stem throughout the lettuce growth cycle. In the reproductive part, calcium accumulation became more pronounced from 70 DAT onward, with 66.6% (800 kg ha−1 of P2O5) and 83.05% (320 kg ha−1 of P2O5) of the total calcium in these parts accumulating after this period (Figure 7A,B).
The total calcium accumulation curve shows a continuous increase up to 98 DAT, with a more marked rate between 28 and 70 DAT, during which the plant accumulated about 64.1% of the total calcium (1,063.9 and 776.7 mg plant-1), with an average of 25.3 and 18.5 mg plant−1 day−1 at the doses of 800 and 320 kg ha−1 of P2O5, respectively. After 70 DAT, the plant accumulated approximately 24.2% and 30.7% of the total calcium, and the average daily accumulation dropped to 14.4 and 13.3 mg plant−1 day−1 until the end of the cycle, for the doses of 800 and 320 kg ha−1 of P2O5, respectively.
At 98 DAT, under the 800 kg ha−1 P2O5 dose, the total calcium accumulation was 1,658.4 mg plant−1, with approximately 77.0% found in the vegetative part and 23.0% in the reproductive part. Under the 320 kg ha−1 P2O5 dose, total calcium accumulation was 1,210.2 mg plant−1, with 72.4% in the vegetative part and 27.6% in the reproductive part.
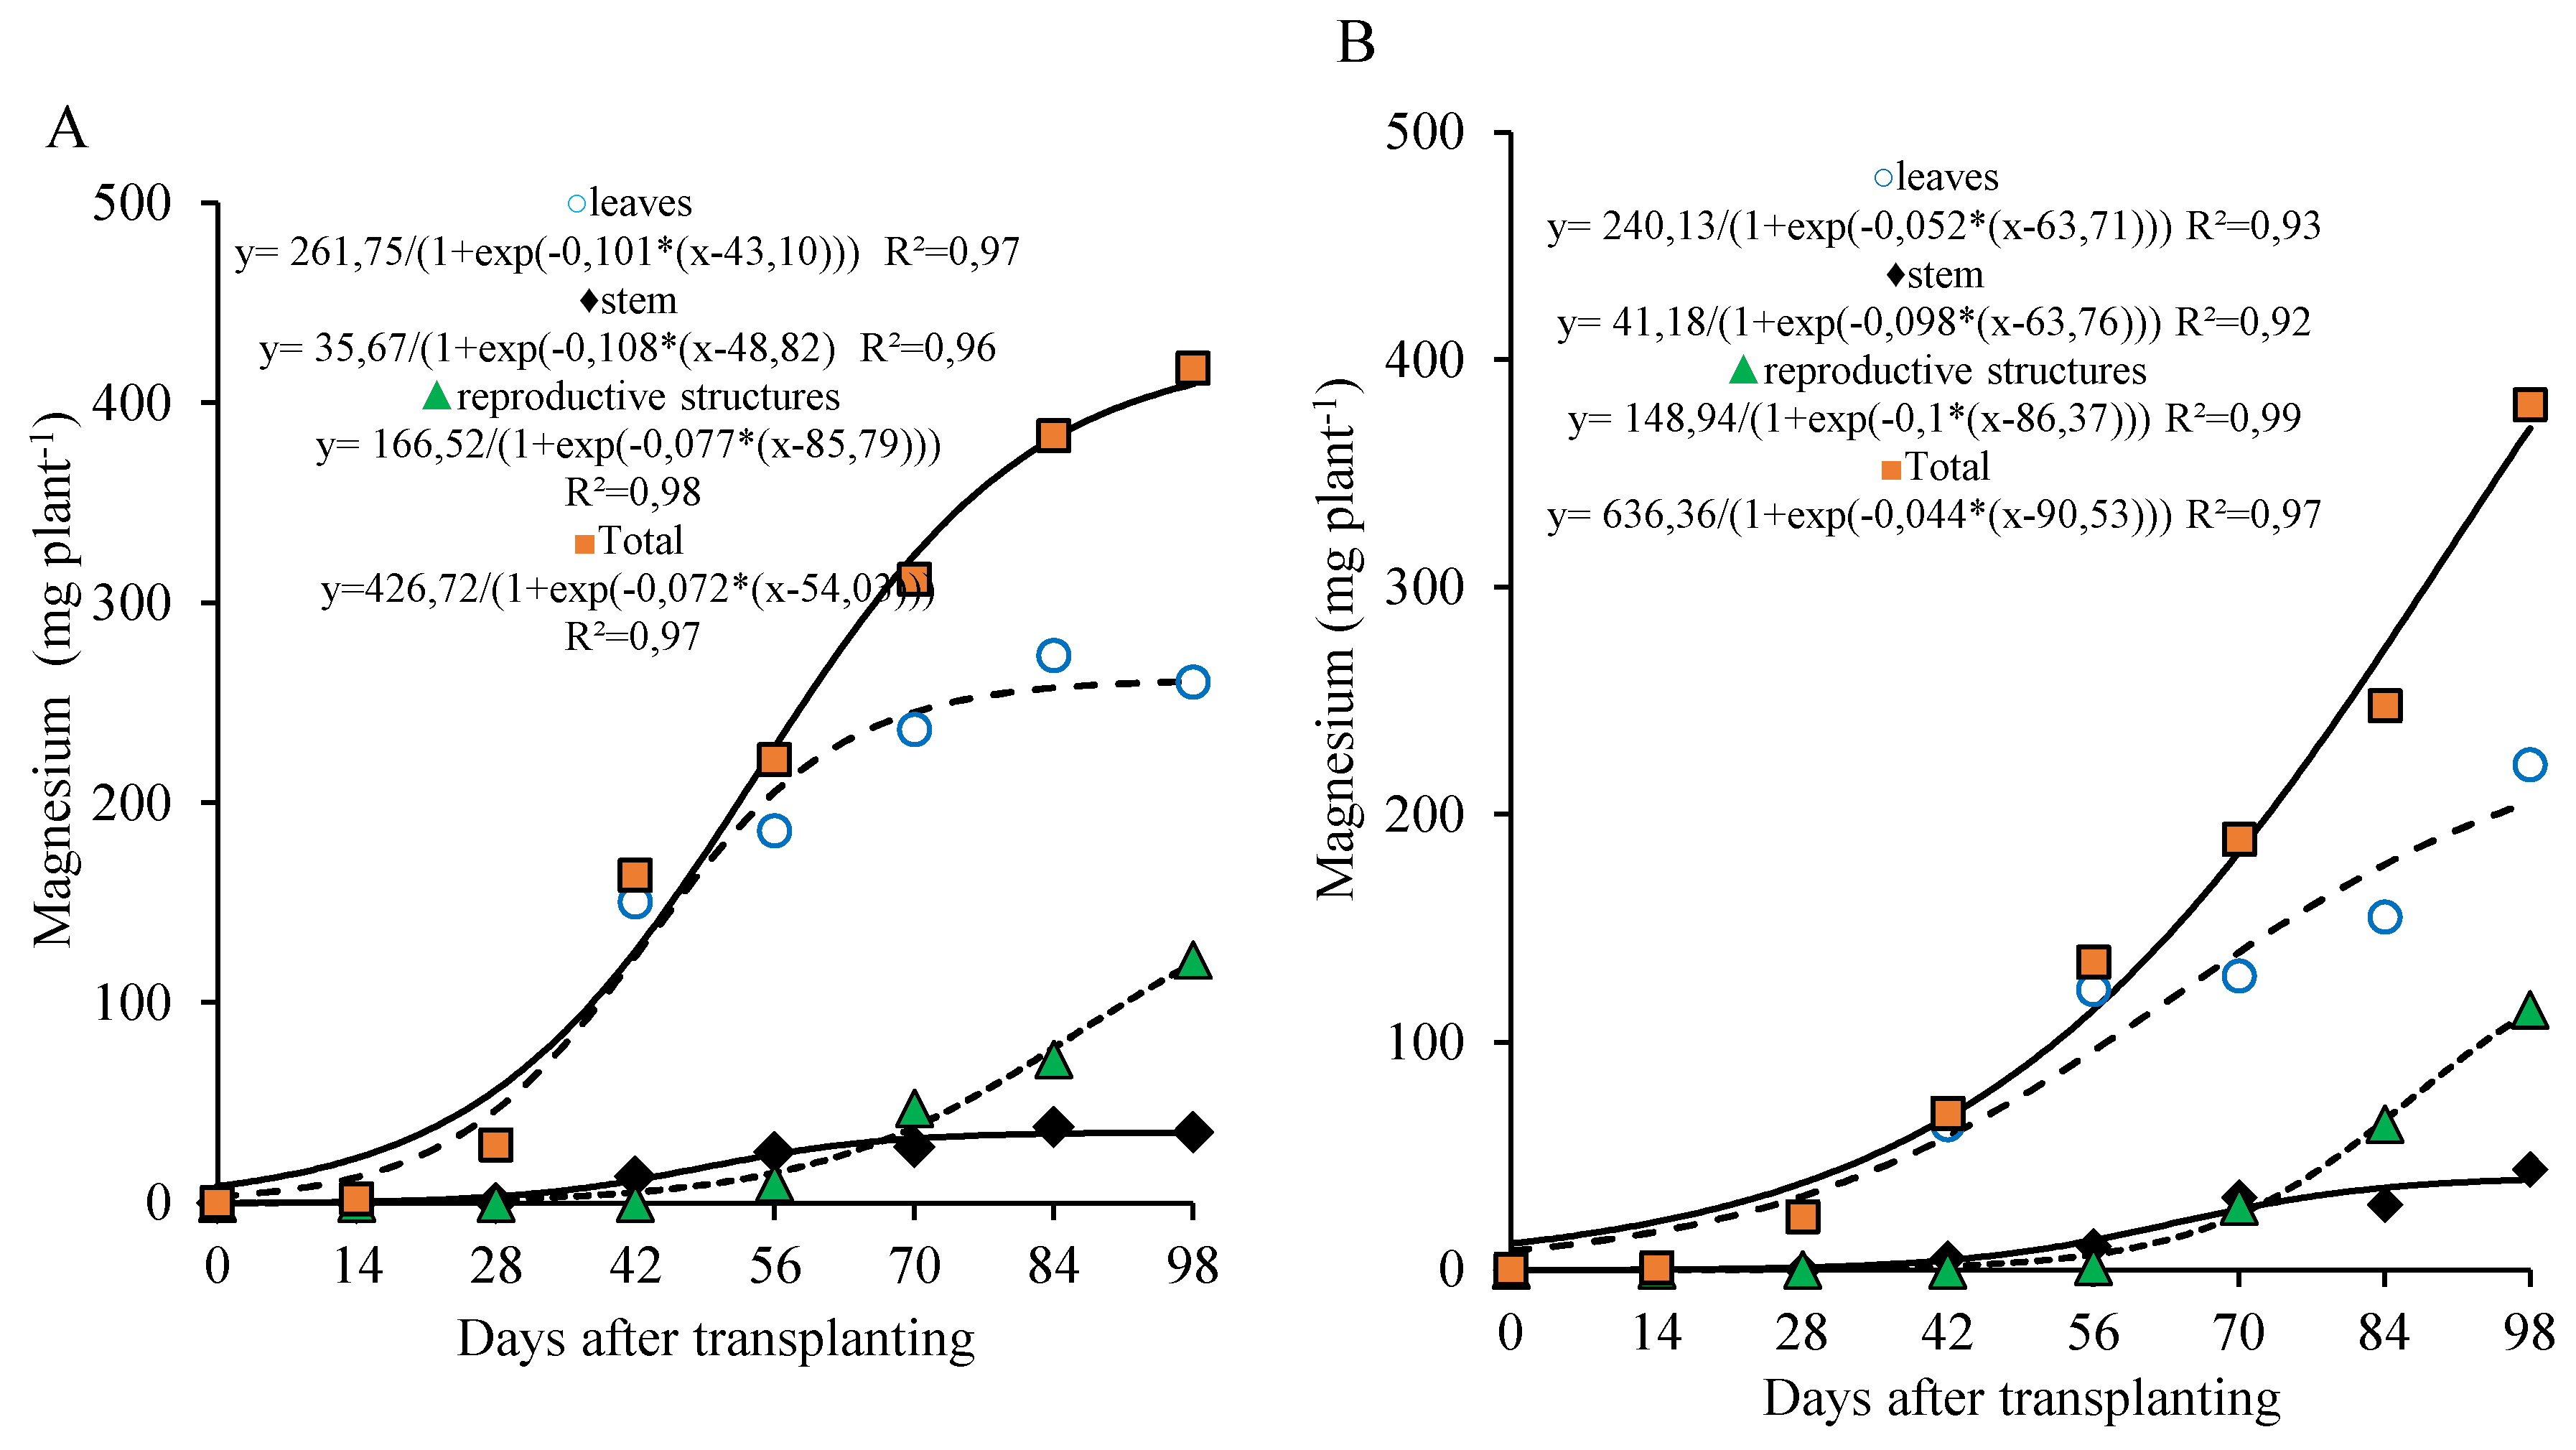
The magnesium accumulation curve for the 800 kg ha−1 P2O5 dose in the leaves and stem followed a pattern similar to that of calcium, with more pronounced values in the leaves until 56 DAT and a gradual accumulation in the stem, which reached its maximum at the end of the cycle. In the reproductive part, magnesium accumulation became more intense after 70 DAT, with approximately 68.2% of the total magnesium in these organs being accumulated after this period. Total magnesium accumulation was slow from transplanting to 28 DAT, with an average of 1.86 mg plant−1 day−1. From 29 to 98 DAT, the average accumulation rose to 5.14 mg plant−1 day−1, during which about 87.5% of the total magnesium was accumulated. At 98 DAT, total magnesium accumulation reached 416 mg plant−1, with 63% in the leaves, 9% in the stem, and 29% in the reproductive part (Figure 8A).
At the 320 kg ha−1 P2O5 dose, the trend of total magnesium accumulation was continuous and nearly linear, showing a low initial accumulation, with an average of 1.2 mg plant−1 day−1 until 28 DAT, increasing to 4.6 mg plant−1 day−1 between 29 and 98 DAT. During this second period, 90.5% of the total accumulated magnesium was recorded. At 98 DAT, the total magnesium accumulation was 358.8 mg plant−1, with 57% in the leaves, 11% in the stem, and 32% in the reproductive part (Figure 8B).
Figure 8.
Magnesium accumulation in different parts of lettuce plants grown for seed production under organic fertilization with 800 (A) and 320 (B) kg ha−1 of P2O5.
Figure 8.
Magnesium accumulation in different parts of lettuce plants grown for seed production under organic fertilization with 800 (A) and 320 (B) kg ha−1 of P2O5.
At the 800 kg ha−1 P2O5 dose, sulfur accumulation in the leaves was more prominent from 0 to 56 DAT, with approximately 73.7% of the maximum accumulated in this organ occurring during this period (55.4 mg plant-1). In the stem, sulfur accumulation tended to stabilize after 70 DAT, with a slower rate from 70 to 98 DAT, reaching a maximum of 31.4 mg plant−1. In the reproductive part, accumulation became more marked after 70 DAT, with about 69.3% of the total sulfur in this organ being accumulated during that period, ending the cycle with 91.0 mg plant−1 (Figure 9A).
On the other hand, under the 320 kg ha−1 P2O5 dose, sulfur accumulation in the leaves was more evident between 28 and 70 DAT, with 76.7% of the maximum accumulated during this interval (50.7 mg plant−1). In the stem, sulfur accumulation also tended to stabilize after 70 DAT, with a slower accumulation until 98 DAT, when a maximum of 37.0 mg plant-1 was observed. In the reproductive part, accumulation became more expressive after 70 DAT, with approximately 67.4% of the sulfur being accumulated in this period, ending the cycle with 82.0 mg plant−1 (Figure 9B).
Figure 9.
Sulfur accumulation in different parts of lettuce plants grown for seed production under organic fertilization with 800 (A) and 320 (B) kg ha−1 of P2O5.
Figure 9.
Sulfur accumulation in different parts of lettuce plants grown for seed production under organic fertilization with 800 (A) and 320 (B) kg ha−1 of P2O5.
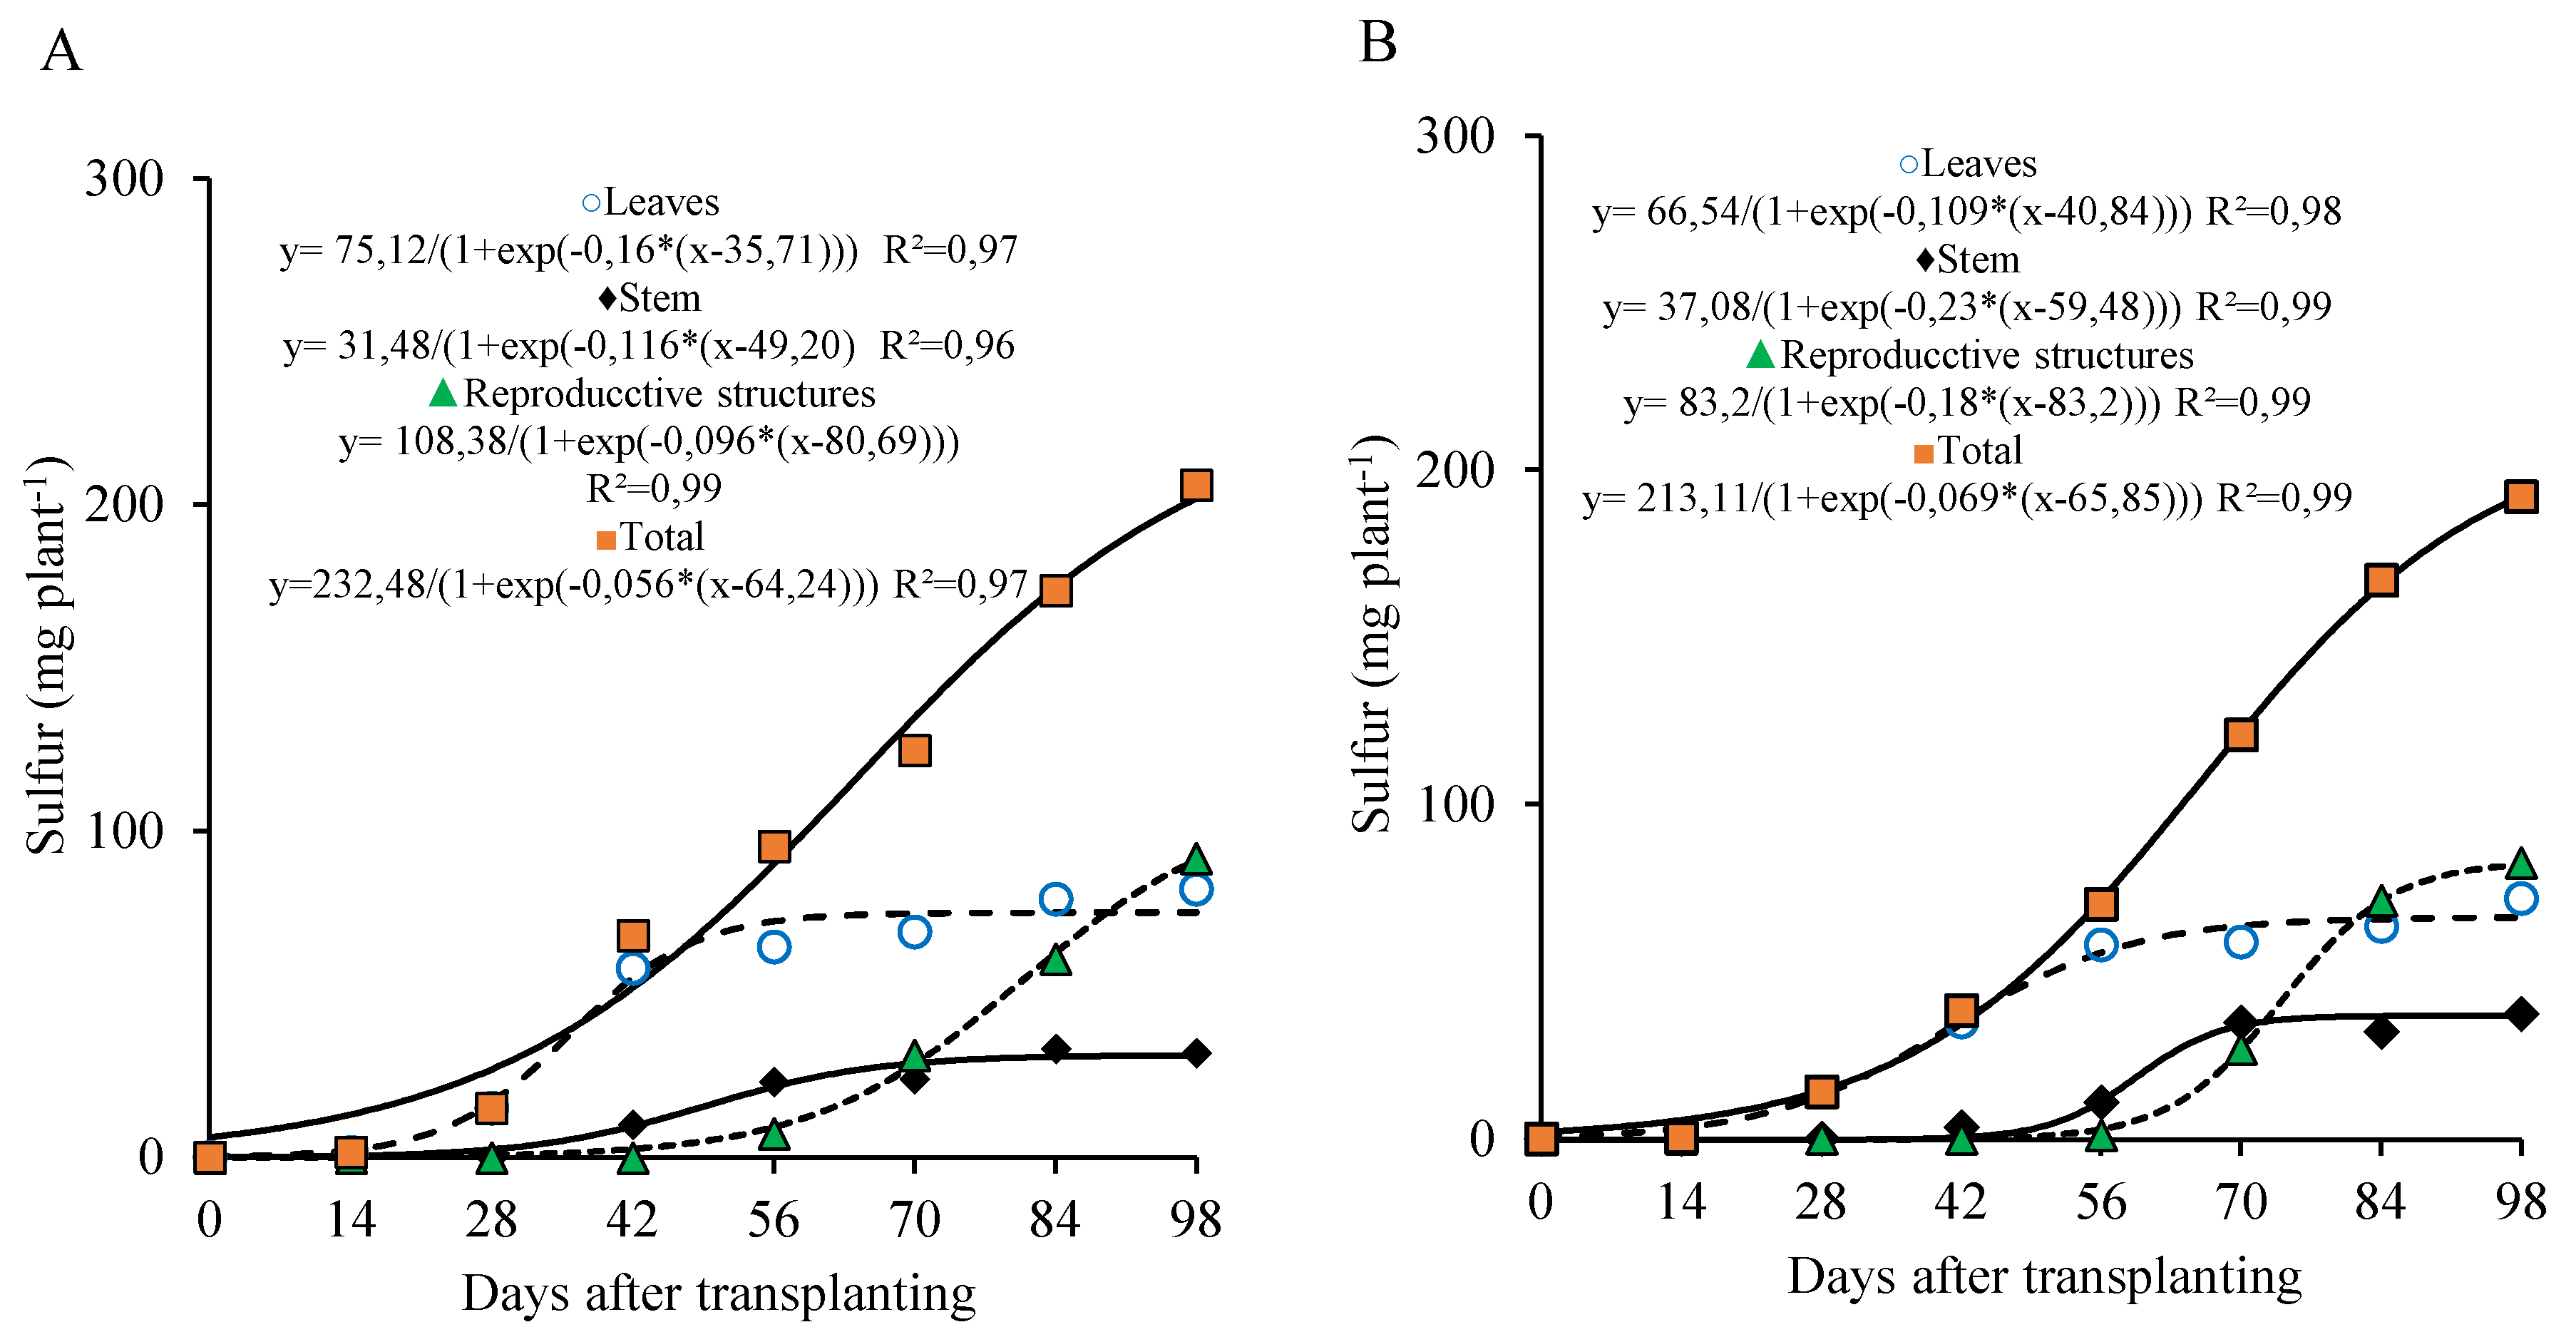
Similar to nitrogen, the total sulfur accumulation curve followed the dry matter accumulation pattern, with the highest accumulation occurring from 28 to 98 DAT. During this period, 177.5 and 172.4 mg plant-1 of sulfur were accumulated (representing 89.8% and 93.2% of the total sulfur accumulated by the end of the cycle), with an average of 2.53 and 2.46 mg plant−1 day−1 under the 800 and 320 kg ha−1 P2O5 doses, respectively. As observed for the other macronutrients, the sulfur accumulation curve showed a continuous upward trend until 98 DAT, with total accumulations of 197.6 and 185.5 mg plant−1 recorded at the end of the cycle. These values were distributed among the plant organs as follows: 38% and 36% in the leaves, 16% and 20% in the stem, and 46% and 44% in the reproductive parts, for the 800 and 320 kg ha−1 P2O5 doses, respectively (Figure 9A,B).
3.4. Daily Accumulation Rate
Analyzing the nutritional demand of lettuce plants over the days after transplanting (Figure 10), under fertilization with 800 kg ha−1 of P2O5, a rise in the daily accumulation rate was observed throughout the cultivation cycle, reaching a peak—known as the maximum daily accumulation rate (MDAR)—followed by a decline until the end of the cycle. This pattern was evident for all plant parts (leaves, stem, reproductive structures, and total plant) and for nearly all nutrients. However, in the reproductive parts, the daily accumulation rate of potassium continued to increase, with its maximum observed close to harvest.
For the plant as a whole, the MDAR occurred between 55 and 65 days after transplanting (DAT). The maximum daily accumulation rates were: 24.6 mg plant-1 day-1 for nitrogen at 60 DAT; 5.0 and 3.2 mg plant−1 day−1 for phosphorus and sulfur, respectively, at 65 DAT; 43.4 and 31.8 mg plant−1 day−1 for potassium and calcium at 57 DAT; and 7.7 mg plant-1 day-1 for magnesium at 55 DAT. These results highlight the periods of greatest nutritional demand throughout the plant’s development cycle (Figure 10A).
In the stem, maximum daily accumulation rates occurred between 43 and 56 DAT. Nitrogen, magnesium, and sulfur peaked at 4.6, 1.0, and 0.9 mg plant−1 day−1 at 48 DAT, respectively. Phosphorus reached 1.8 mg plant−1 day−1 at 43 DAT, potassium reached 8.3 mg plant−1 day−1 at 50 DAT, and calcium reached 3.4 mg plant−1 day−1 at 56 DAT (Figure 10B).
In the leaves, the highest daily accumulation rates for nitrogen, phosphorus, and potassium were 30.8, 4.8, and 78.2 mg plant−1 day−1, respectively, reached at 33 DAT. Calcium reached its peak later, at 25 mg plant−1 day−1 on 50 DAT. Magnesium peaked at 6.6 mg plant−1 day−1 at 44 DAT, and sulfur had the lowest peak at 3.0 mg plant−1 day−1 at 36 DAT (Figure 10C).
In the reproductive structures (Figure 10D), the maximum daily accumulation rate occurred between 69 and 87 DAT for most nutrients. The peak values were 18.1, 4.1, and 13.2 plant−1 day−1 for nitrogen, phosphorus, and calcium, respectively, at 77 DAT; 3.2 mg plant-1 day-1 for magnesium at 83 DAT; and 2.6 mg plant−1 day−1 for sulfur at 79 DAT. For potassium, demand remained continuous throughout the cycle, with the maximum value of 35.8 mg plant−1 day−1 reached at 97 DAT.
Analyzing the nutritional demand of the plants as a function of days after transplanting at the dose of 320 kg ha−1 of P2O5 (Figure 11), a similar pattern was observed for all plant parts (leaves, stem, reproductive part, and total) for almost all nutrients. On the other hand, for the reproductive part, the daily accumulation rate of calcium showed a continuous increase, with the peak occurring close to harvest (Figure 11A).
In the stem, the maximum rate occurred between 61 and 75 DAT, with peaks of 5.5 mg plant−1 day−1 at 72 DAT for nitrogen, 2.5, 5.2, 1.0, and 2.1 mg plant−1 day−1 at 61 DAT for phosphorus, calcium, magnesium, and sulfur, respectively. For potassium, the maximum rate was 11.5 mg plant−1 day−1 at 67 DAT (Figure 11B).
The maximum daily accumulation rate in the leaves occurred between 38 and 59 DAT. For nitrogen, potassium, and calcium, maximum values of 13.8, 22.7, and 20.6 mg plant−1 day−1 were recorded at 49 DAT. Phosphorus and sulfur reached a rate of 1.8 mg plant−1 day−1 at 38 DAT, while magnesium, the slowest nutrient, reached a rate of 3.1 mg plant−1 day−1 at 59 DAT (Figure 11C).
Figure 10.
Daily accumulation rate of macronutrients in the whole plant (A), stem (B), leave (C), and reproductive structure (D) of lettuce plants fertilized with 800 kg ha−1 of P2O5, as a function of days after transplanting.
Figure 10.
Daily accumulation rate of macronutrients in the whole plant (A), stem (B), leave (C), and reproductive structure (D) of lettuce plants fertilized with 800 kg ha−1 of P2O5, as a function of days after transplanting.
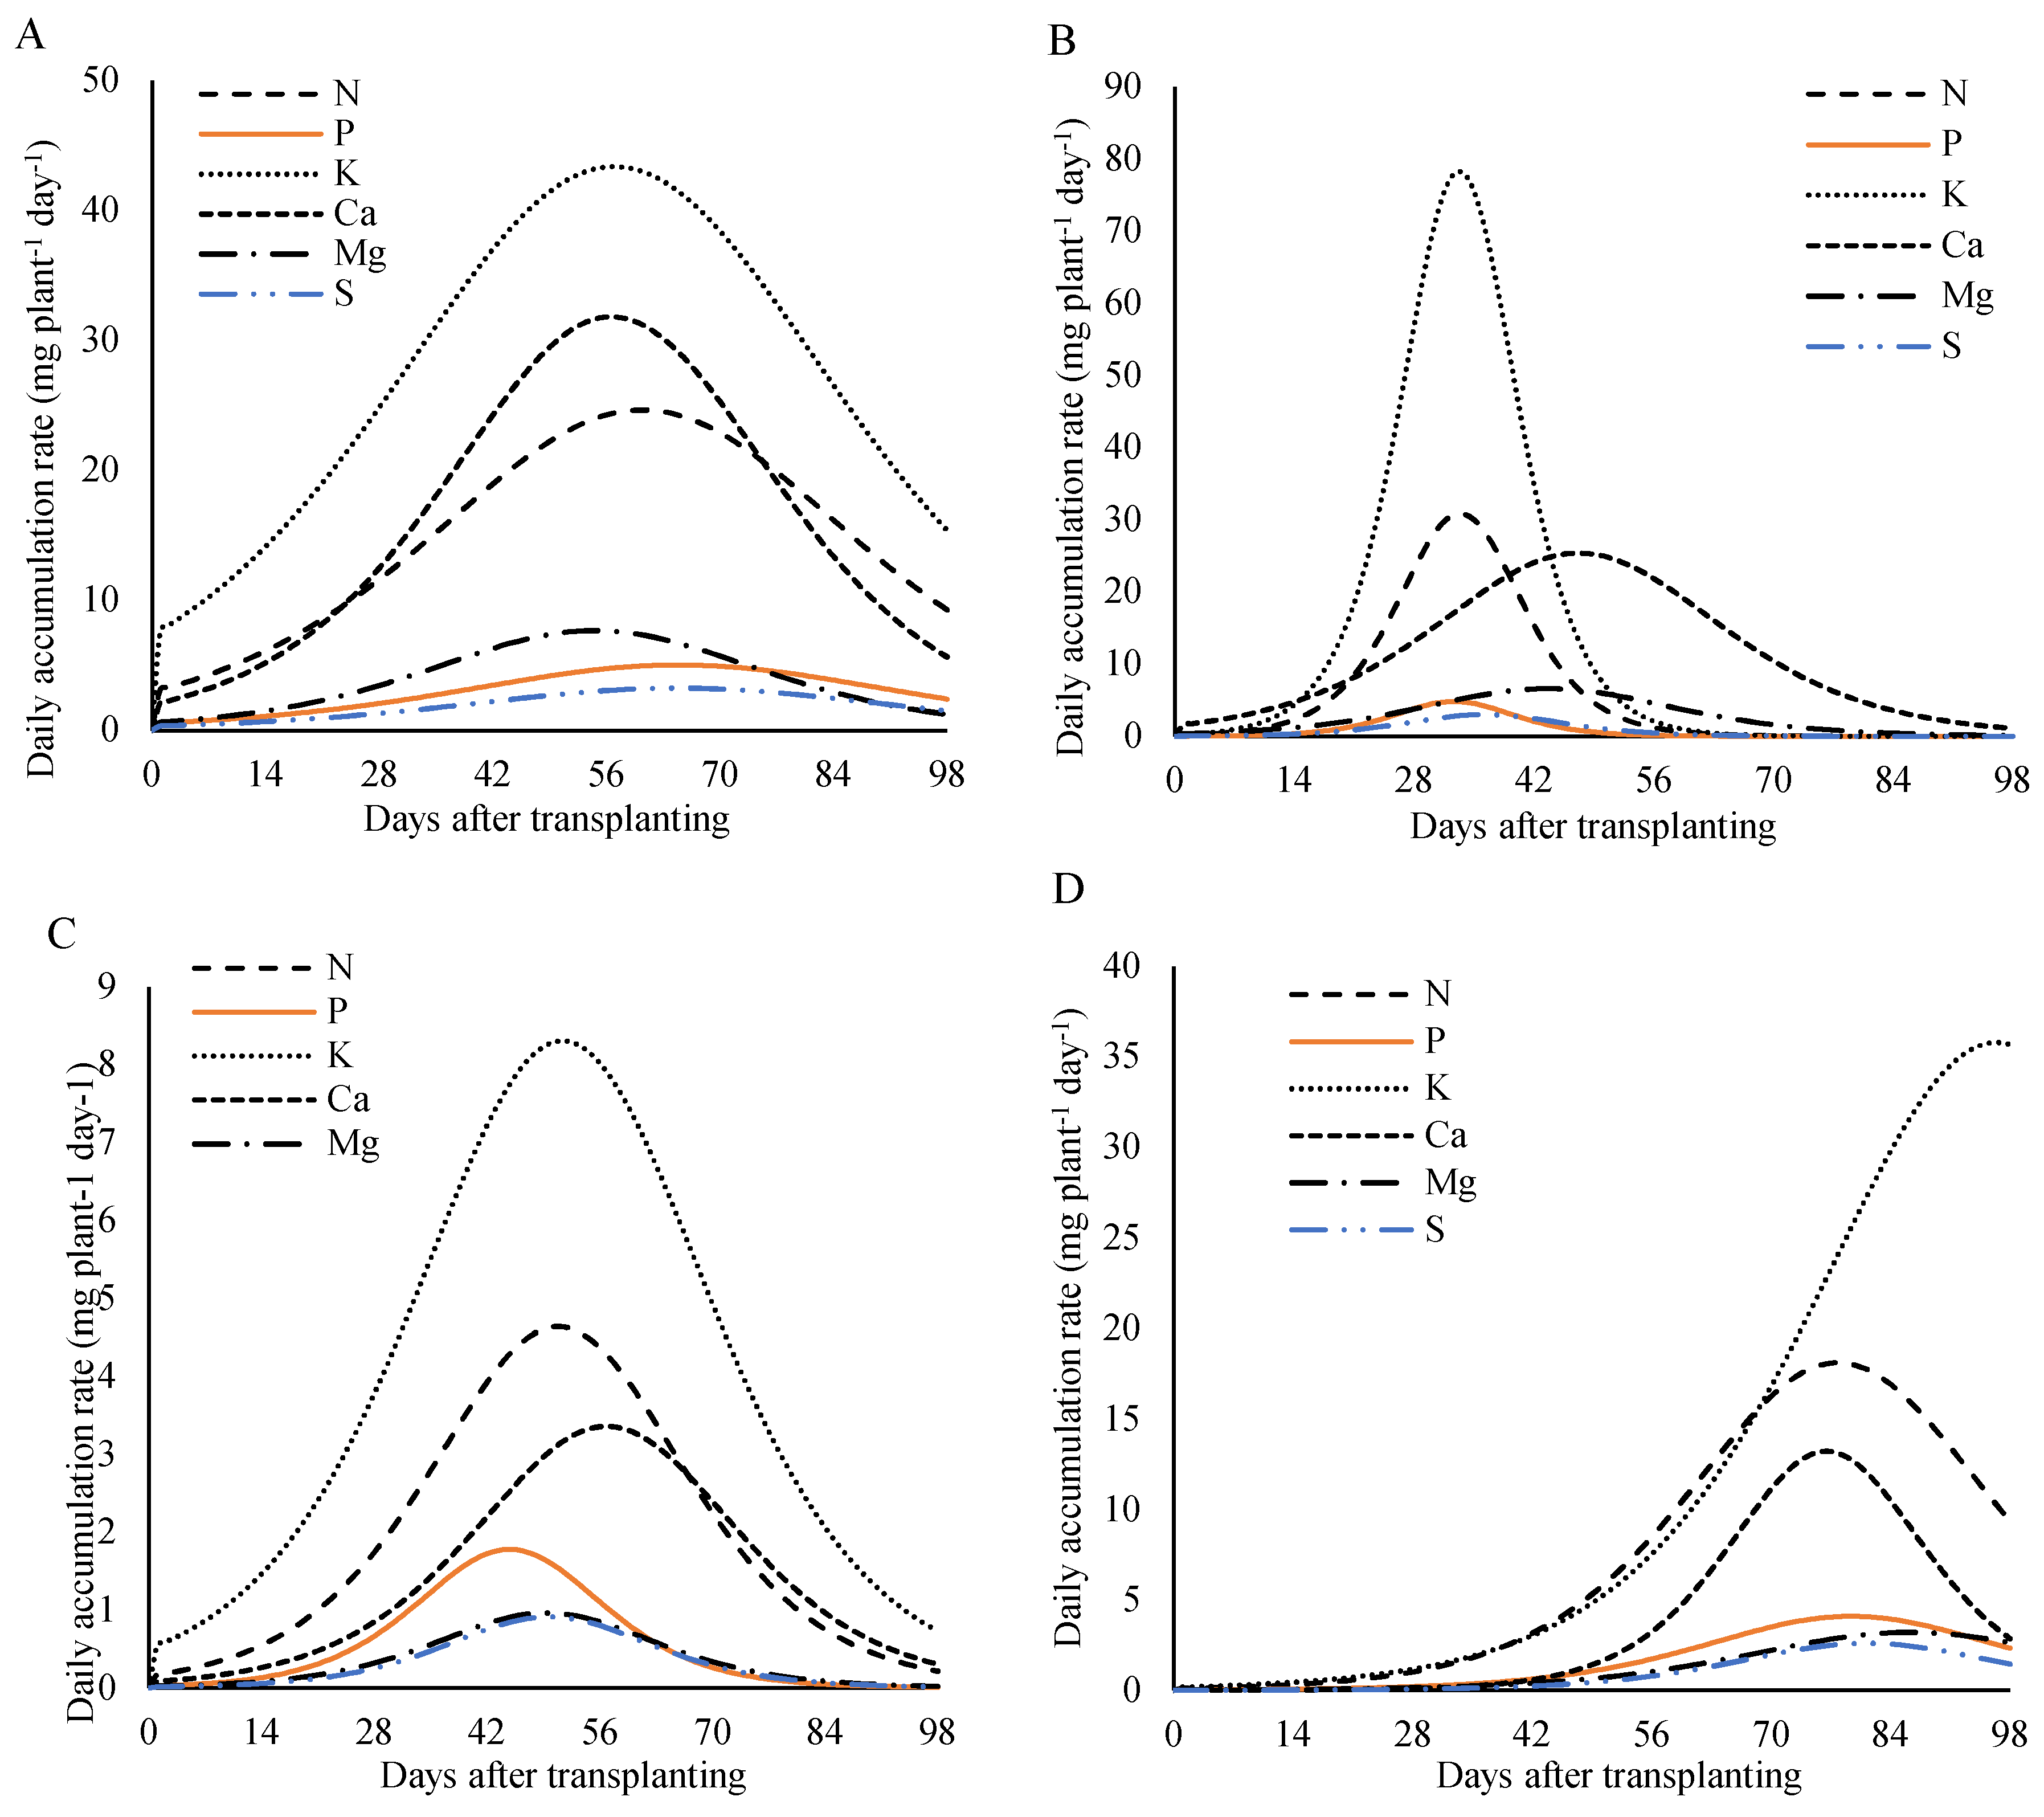
Figure 11.
Daily accumulation rate of macronutrients in the in the whole plant (A), leaves (B), stem (C), and reproductive part (D) of lettuce plants fertilized with 320 kg ha−1 of P2O5, as a function of days after transplanting.
Figure 11.
Daily accumulation rate of macronutrients in the in the whole plant (A), leaves (B), stem (C), and reproductive part (D) of lettuce plants fertilized with 320 kg ha−1 of P2O5, as a function of days after transplanting.
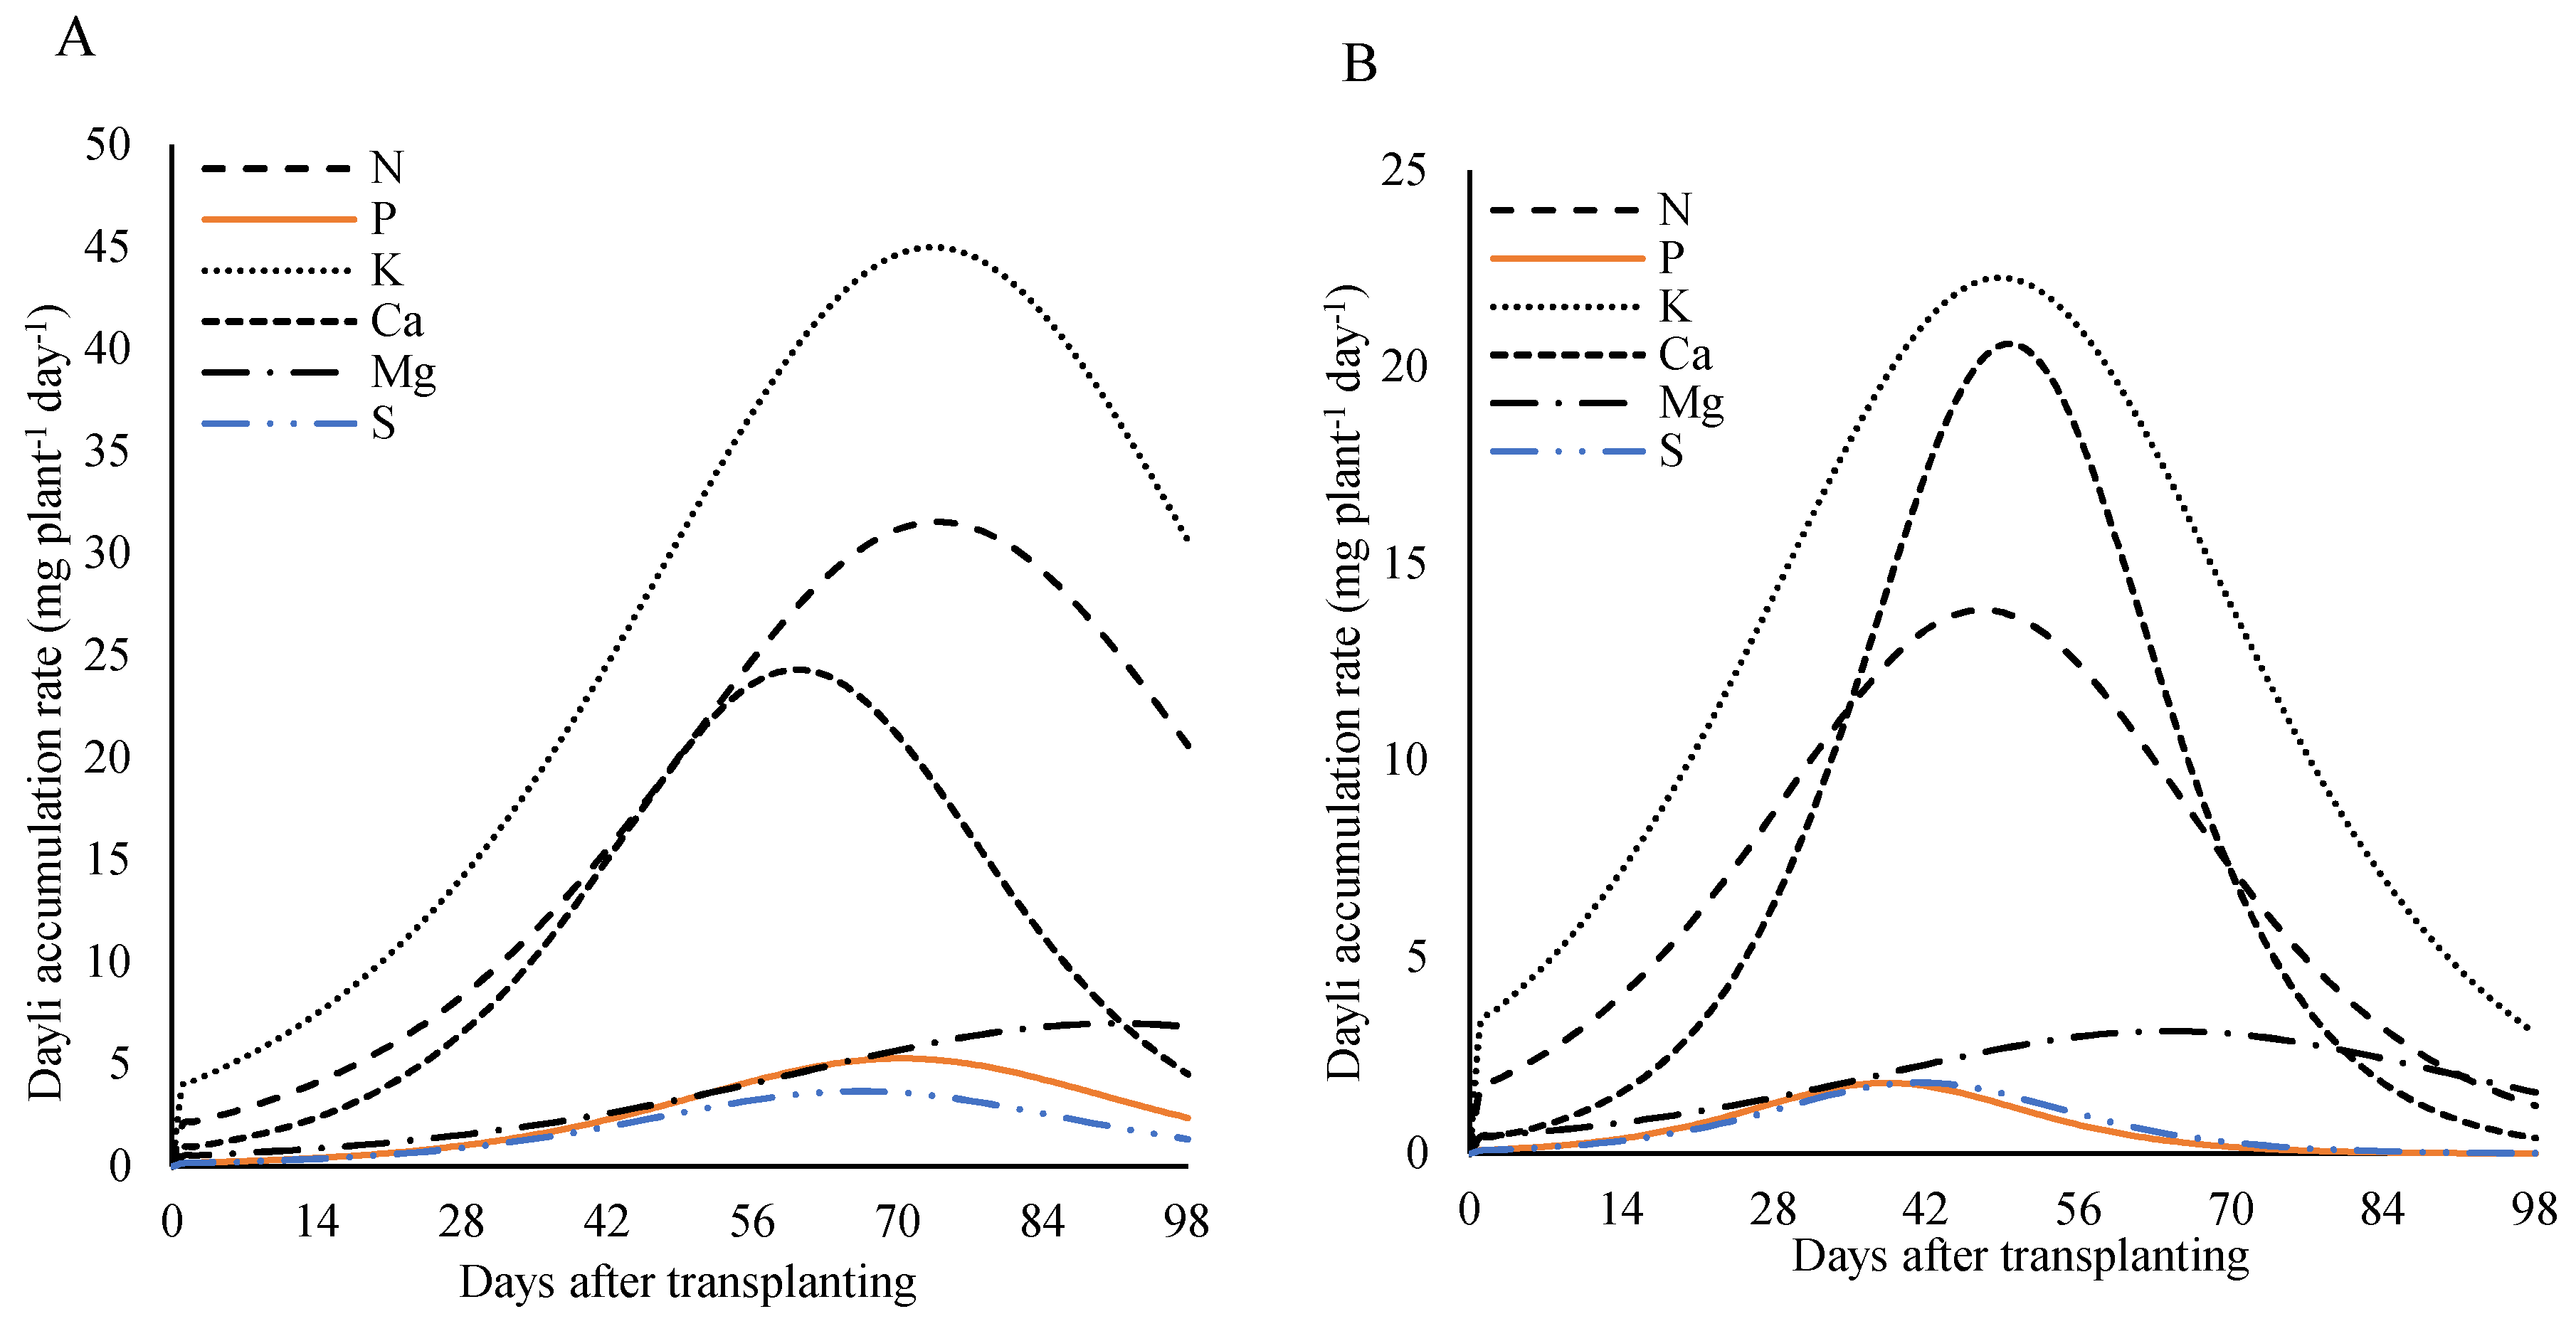
In the reproductive part, the demand for nutrients was highest between 74 and 95 DAT. For nitrogen and phosphorus, the maximum rate was 28.4 and 4.3 mg plant−1 day−1 at 76 DAT, potassium and sulfur reached 30.2 and 3.7 mg plant−1 day−1 at 74 DAT, respectively, and calcium reached 13.1 mg plant−1 day−1 at 95 DAT (Figure 11D).
4. Discussion
Nascimento [5], studying seed production in different lettuce genotypes, observed that the developmental stages after sowing occurred, on average, at 85 days for bolting, 93 days for flowering, 103 days for anthesis, 120 days for seed formation, and 127 days for harvest, values quite similar to those observed in this study.
Regarding the number of leaves per plant, the values observed in this study were higher than those reported by Gasti Filho [12] for the curly lettuce cultivar Simpson, which had an average of 23 leaves per plant. Similarly, stem diameter showed more pronounced growth between 42 and 70 days after transplanting (DAT), tending to stabilize toward the end of the cycle (Figure 3E,F). These results also exceeded those reported by Kano [13] who, when working with the Verônica cultivar under a planting dose of 800 kg ha−1 of P2O5, found an average of 62 leaves and a height of 99.1 cm.
For these vegetative traits, lettuce plants clearly exhibited the three growth phases described by Di Crescenzo [14] an initial slow-growth phase, followed by an exponential growth phase, and concluding with a stabilization phase.
Regarding dry matter accumulation, at the highest dose, the initial accumulation was more intense, reaching 10.8% of the total accumulated by the end of the cycle. This result indicates that applying higher amounts of phosphorus for seed production also significantly benefits the vegetative growth of lettuce plants, as reported Kano [13]. This effect can be explained by the improved phosphorus availability in the soil: initially classified as low (13 mg dm−3), the content increased to a medium level (48 mg dm−3) with the lower dose and to a very high level (157 mg dm−3) with the highest dose by the end of the cycle. Phosphorus is an essential nutrient in the formation of nucleic acids and phospholipids, and it also plays a key role in regulating fundamental physiological processes such as photosynthesis, respiration, and root system development [15], especially during the early stages of the plant cycle.
However, despite the importance of phosphorus in the early phase, it was observed that dry matter accumulation between 0 and 28 DAT represented only 4.8 to 10.8% of the total dry matter at the end of the cycle. This indicates that, for lettuce intended for seed production, it is not feasible to extrapolate biomass accumulation data based solely on studies that consider only the vegetative phase. After this initial period, the accumulation of dry matter becomes more intense, thereby increasing nutrient demand as well [16].
Plant biomass growth is influenced by a number of specific factors, processes, and relationships [17] and generally follows three distinct phases: an initial slow-growth phase, followed by an exponential growth phase, and ending with a stabilization phase, in which the growth rate slows down [14]. In the present study, although the total biomass accumulation of the plant did not show a clearly defined stabilization phase (Figure 2), these three phases were clearly observed for leaves and stems. For the reproductive part, which began developing at 56 DAT, growth was continuous until the end of the cycle, which explains the near absence of stabilization in the overall accumulation.
Supporting these findings, Tamelini [6], when evaluating different organic phosphorus sources and doses in lettuce production, observed an increase in dry mass as the phosphorus dose increased, with an average value of 13.3 g per plant at a dose of 800 kg ha−1 of P2O5 using the cultivar Scarlet. Similarly, Kano [13] also observed increased biomass accumulation in the Verônica cultivar, obtaining 11.0 g per plant with the same dose. Therefore, the values obtained in this study with the cultivar Solaris, especially at the highest dose, were considerably higher than those reported in the literature, reinforcing both the potential of this cultivar and the benefits of phosphate fertilization for seed production.
Kano [16], while studying nutrient accumulation in lettuce grown for seed production, also observed a sigmoidal curve, with low nutritional demand at the beginning of the cycle, a sharp increase after the onset of bolting, and a decrease during the final stage of development.
In the present study, by the end of the cycle, the reproductive part of the plant had accumulated 47.6% of the total nitrogen at the highest P2O5 dose and 41% at the lowest dose. These findings are consistent with those reported by Kano [16], who attributed this pattern to leaf senescence and the subsequent redistribution of nitrogen to the reproductive organs. Nitrogen is highly mobile within the plant, being transported through the phloem from older tissues to younger ones, or toward fruits and seeds [18].
The high phosphorus accumulation in the reproductive structures, to the detriment of vegetative tissues, was also observed in this study and can be explained by the high demand for this nutrient by seeds, as similarly reported by Kano [16]. Phosphorus tends to accumulate in seeds to a greater extent than in any other plant part, which is favored by its high mobility and the ability to be redistributed from vegetative to reproductive tissues [2,11].
Additionally, phosphorus is an essential component of nucleic acids and phospholipids and is directly involved in regulating key physiological processes such as photosynthesis and respiration. Its role in energy metabolism is emphasized by its presence in molecules such as ATP, ADP, AMP, GTP, UTP, CTP, and pyrophosphate [18]. Therefore, adequate phosphorus supply from the early stages of vegetative development is crucial for the formation and full development of reproductive structures [15,18].
Among the macronutrients evaluated, potassium showed the highest accumulation throughout the cycle, reaching 2,922.6 mg plant−1 at the 800 kg ha−1 P2O5 dose, with 49% in the leaves, 14% in the stem, and 37% in the reproductive part. At the 320 kg ha−1 dose, accumulation reached 2,575.2 mg plant−1, with 50% in the leaves, 19% in the stem, and 31% in the reproductive structures. Despite being a highly mobile element in plants [15], potassium did not predominantly accumulate in the reproductive part, indicating its greater functional importance in the leaves and other vegetative tissues.
Potassium is essential for plant development, even though it does not form part of plant structures. Its importance lies in osmotic regulation, stomatal opening control, enzyme activation, protein synthesis, carbohydrate transport, and various other vital functions [18].
As for calcium, its low accumulation in reproductive organs can be explained by its poor mobility within the plant [19,20]. Therefore, it is essential that calcium be available in the soil throughout the entire growth cycle, especially during the reproductive stage, along with adequate irrigation and a favorable cation balance to facilitate uptake [21]. Calcium absorption occurs predominantly through the xylem, driven by water flow and transpiration, which reinforces its limitation in being redistributed to other plant parts. Nevertheless, calcium is vital for the integrity of cell membranes and cell walls, acting in the formation of calcium pectates in the middle lamella and in the regulation of ion transport and exchange [22].
Regarding magnesium, its higher accumulation in leaves compared to reproductive organs can be attributed to its close association with the chlorophyll molecule, making it essential for the photosynthetic process [23].
Finally, sulfur—essential for the formation of amino acids and proteins—also displayed a pattern similar to nitrogen, with greater accumulation starting in the reproductive stage, particularly in seed-producing organs. This nutrient is also important for photosynthesis and is associated with cold resistance [18], reinforcing its relevance throughout all stages of plant development.
4.1. Dayli Accumulation Rate
According to Bezerra [20], shortly before the emergence of flower buds—around the formation of reproductive organs—there is a peak demand for macronutrients to support the development of vegetative parts. Proper vegetative development is essential to meet the plant’s needs during the reproductive phase, which includes seed formation and maturation. Following this peak in daily nutrient accumulation, there is a significant decrease in uptake rate, along with the stabilization of dry mass in the vegetative parts. On the other hand, after flowering, a noticeable accumulation of dry matter begins in the reproductive parts and continues until seed maturation is complete.
This pattern was also confirmed in the present study, with the highest nutrient demand observed in the vegetative parts before 56 DAT, while peak nutrient demand in the reproductive parts occurred after this period. These findings highlight the importance of nutrient availability throughout the entire production cycle, which, in the case of lettuce seed production, extended up to 98 DAT. In this context, it is advantageous to grow crops in soils rich in organic matter, complemented by slow-release organic fertilizers, to ensure adequate plant nutrition throughout the cycle [20].
5. Conclusions
The vegetative part of the lettuce plant grown for seed production under organic cultivation shows slow initial growth, followed by acceleration up to the beginning of flowering (70 DAS), and stabilization after this period.
The reproductive part of the lettuce plant begins to grow from 56 DAS, increasing the daily nutrient demand until the end of seed maturation and harvest at 98 DAT (112 DAS).
The descending order of nutrient accumulation in the plant, at the doses of 800 and 320 kg ha−1, was: K (2,922.6) > Ca (1,658.8) > N (1,527.7) > Mg (416.0) > P (308.1) > S (197.6), and K (2,574.2) > N (1,743.2) > Ca (1,210.2) > Mg (358.8) > P (256.8) > S (185.5), respectively.
The highest nutrient demand in the plant occurred between 55 and 88 DAT.
Author Contributions
Conceptualization, J.M.S and A.I.I.C.; methodology, J.M.S., D.S.S., J.A., J.R.C. and E.P.S.; software, J.M.S., A.I.I.C.; validation, J.M.S., A.I.I.C.; formal analysis, J.M.S. and E.P.S.; investigation, J.M.S., D.S.S., J.A., J.R.C., E.P.S.; resources, J.M.S. and A.I.I.C.; data curation, J.M.S. and E.P.S.; writing—original draft preparation, J.M.S.; writing—review and editing, J.M.S., A.I.I.C. and P.G.N.F; visualization, A.I.I.C. and P.G.N.F; supervision, J.M.S and A.I.I.C.; project administration, A.I.I.C. All authors have read and agreed to the published version of the manuscript.
Funding
This research received no external funding.
Data Availability Statement
The data will not yet be shared because it has not yet been published, for security reasons and for the protection of research data.
Conflicts of Interest
The authors declare no conflicts of interest.
References
- Alves, A.U.; Prado, R.M.; Correia, M.A.R.; Gondim, A.R.O.; Cecílio Filho, A.B.; Politi, L.S. Couve-flor cultivada em substrato: Marcha de absorção de macronutrientes e micronutrientes. Ciênc Agrotec. 2011, 35, 45–55. [Google Scholar] [CrossRef]
- Cardoso, A.I.I. Nutrição e adubação em campos de produção de sementes de hortaliças. In Hortaliças: Tecnologia de produção de sementes; Nascimento, W.M., Ed.; Embrapa Hortaliças: Brasília, 2011; pp. 109–134. [Google Scholar]
- Cardoso, A.I.I.; Claudio, M.T.R.; Nakada-Freitas, P.G.; Magro, F.O.; Tavares, A.E.B. Phosphate fertilization over the accumulation of macronutrients in cauliflower seed production. Hortic Bras. 2016, 34, 196–201. [Google Scholar] [CrossRef]
- Lima, S.K.; Galiza, M.; Valadares, A.; Alves, F. Produção e consumo de produtos orgânicos no mundo e no Brasil: Texto para discussão; Instituto de Pesquisa Econômica Aplicada: Brasília, 2020; 52p. [Google Scholar]
- Nascimento, W.M.; Vidal, M.C.; Resende, F.V. Produção de sementes de hortaliças em sistema orgânico; Embrapa Hortaliças: Brasília, 2012. [Google Scholar]
- Tamelini, B.R.; Souza, E.P.D.; Alves, T.N.; Cardoso, A.I.I. Sources and doses of phosphorus in the production of red-leaf lettuce in an organic farming system. Braz Arch Biol Technol. 2024, 67, e24230761. [Google Scholar] [CrossRef]
- Franco, J.R.; Dal Pai, E.; Calça, M.V.C.; Raniero, M.R.; Dal Pai, A.; Sarnighausen, V.C.R.; et al. Atualização da normal climatológica e classificação climática de Köppen para o município de Botucatu-SP. Irriga 2023, 28, 77–92. [Google Scholar] [CrossRef]
- Trani, P.E.; Raij, B.V.; Cantarella, H.; Figueiredo, G.J.B. Hortaliças. In Recomendações de adubação e calagem para o Estado de São Paulo; Cantarella, H., et al., Eds.; IAC: Campinas, 2023; pp. 339–424. [Google Scholar]
- Kano, C.; Cardoso, A.I.I.; Bôas, R.L.V. Doses de fósforo na produção e qualidade de sementes de alface. Hortic Bras. 2012, 30, 695–698. [Google Scholar] [CrossRef]
- Ministério da Agricultura, Pecuária e Abastecimento (MAPA). Manual de métodos analíticos oficiais para fertilizantes e corretivos; MAPA: Brasília, 2017; 240p. [Google Scholar]
- Malavolta, E.; Vitti, G.C.; Oliveira, S.A. Princípios, métodos e técnicas de avaliação do estado nutricional. In Avaliação do estado nutricional das plantas: Princípios e aplicações, 2nd ed.; Malavolta, E., Vitti, G.C., Oliveira, S.A., Eds.; Potafós: Piracicaba, 1997; pp. 115–230. [Google Scholar]
- Gasti Filho, J.; Resende, M.A.; Ferreira, I.; Martins, I.S.; Piva, H.T. Desempenho agronômico de alface orgânica em função da cobertura do solo. Agroecossistemas 2020, 12, 51–68. [Google Scholar] [CrossRef]
- Kano, C. Doses de fósforo no acúmulo de nutrientes, na produção e na qualidade de sementes de alface [tese]; Universidade Estadual Paulista Júlio de Mesquita Filho: Botucatu, 2006; 121 f. [Google Scholar]
- Di Crescenzo, A.; Paraggio, P.; Román-Román, P.; Torres-Ruiz, F. Applications of the multi-sigmoidal deterministic and stochastic logistic models for plant dynamics. Appl Math Model. 2021, 92, 884–904. [Google Scholar] [CrossRef]
- Malavolta, E. Manual de nutrição mineral de plantas; Agronômica Ceres: São Paulo, 2006. [Google Scholar]
- Kano, C.; Cardoso, A.I.I.; Villas Bôas, R.L. Acúmulo de nutrientes pela alface à produção de sementes. Hortic Bras. 2011, 29, 70–77. [Google Scholar] [CrossRef]
- Cao, L.; Shi, P.J.; Li, L.; Chen, G. A new flexible sigmoidal growth model. Symmetry 2019, 11, 204. [Google Scholar] [CrossRef]
- Taiz, L.; Zeiger, E.; Moller, I.M.; Murphy, A. Fisiologia e desenvolvimento vegetal; Artmed: Porto Alegre, 2017; 858p. [Google Scholar]
- Nakada-Freitas, P.G.; Santos, J.T.; Hidalgo, G.F.; Anjos, L.V.S.; Souza, E.P.; Martins, I.R.; et al. Calcium in the production and quality of cauliflower seeds. Res Soc Dev. 2021, 10, e44710212763. [Google Scholar] [CrossRef]
- Bezerra, S.R.B.; Marques, I.B.; Bardiviesso, E.M.; Pelvine, R.A.; Aguilar, A.S.; Cardoso, A.I.I. Application of calcium and boron directed to inflorescences in production, quality and nutrient accumulation in lettuce seeds. Hortic Bras. 2023, 41, e2427. [Google Scholar] [CrossRef]
- Gilliham, M.; Dayod, M.; Hocking, B.J.; Xu, B.; Conn, S.J.; Kaiser, B.N.; et al. Calcium delivery and storage in plant leaves: Exploring the link with water flow. J Exp Bot. 2011, 62, 2233–2250. [Google Scholar] [CrossRef] [PubMed]
- Hadi, M.R.; Karimi, N. The role of calcium in plants’ salt tolerance. J Plant Nutr. 2012, 35, 2037–2054. [Google Scholar] [CrossRef]
- Castro, C.; Oliveira Júnior, A.; Oliveira, F.A.; Firmano, R.F.; Zancanaro, L.; Klepker, D.; et al. Magnésio: Manejo para o equilíbrio nutricional da soja (Documentos, n. 430); Embrapa: Londrina, 2020; 54p. [Google Scholar]
Figure 5.
Phosphorus accumulation in different parts of lettuce plants grown for seed production under organic fertilization with 800 (A) and 320 (B) kg ha−1 of P2O5.
Figure 5.
Phosphorus accumulation in different parts of lettuce plants grown for seed production under organic fertilization with 800 (A) and 320 (B) kg ha−1 of P2O5.
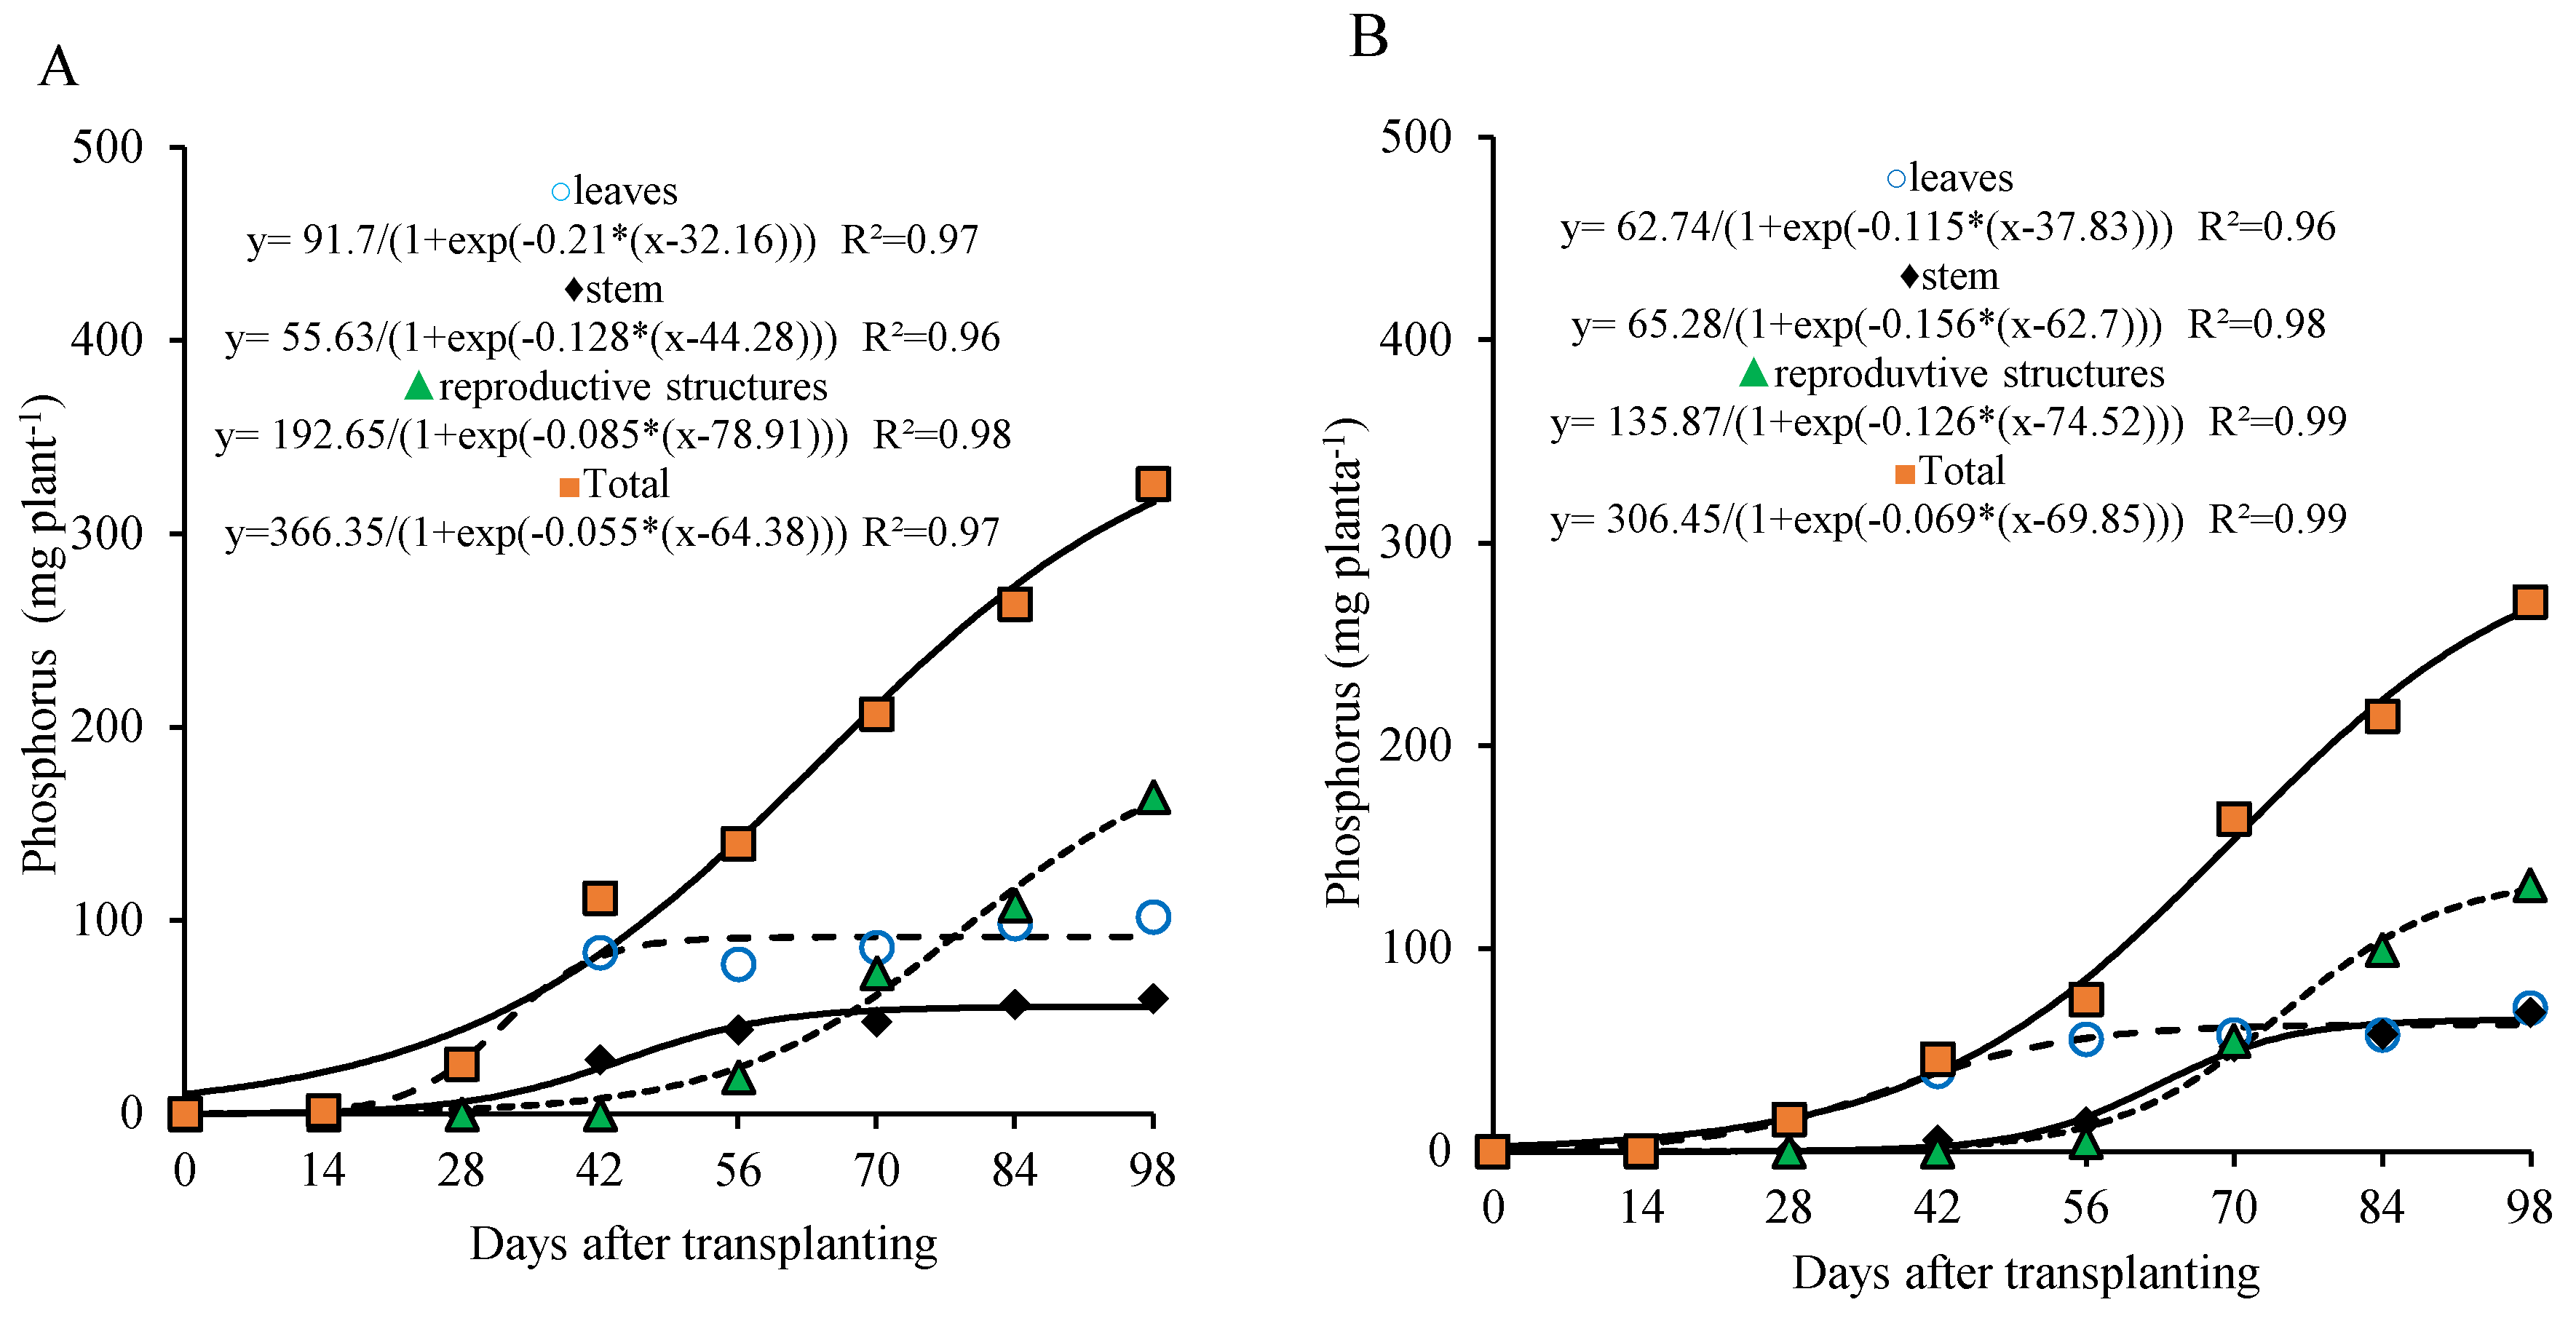
Figure 7.
Calcium accumulation in different parts of lettuce plants grown for seed production under organic fertilization with 800 (A) and 320 (B) kg ha−1 of P2O5.
Figure 7.
Calcium accumulation in different parts of lettuce plants grown for seed production under organic fertilization with 800 (A) and 320 (B) kg ha−1 of P2O5.
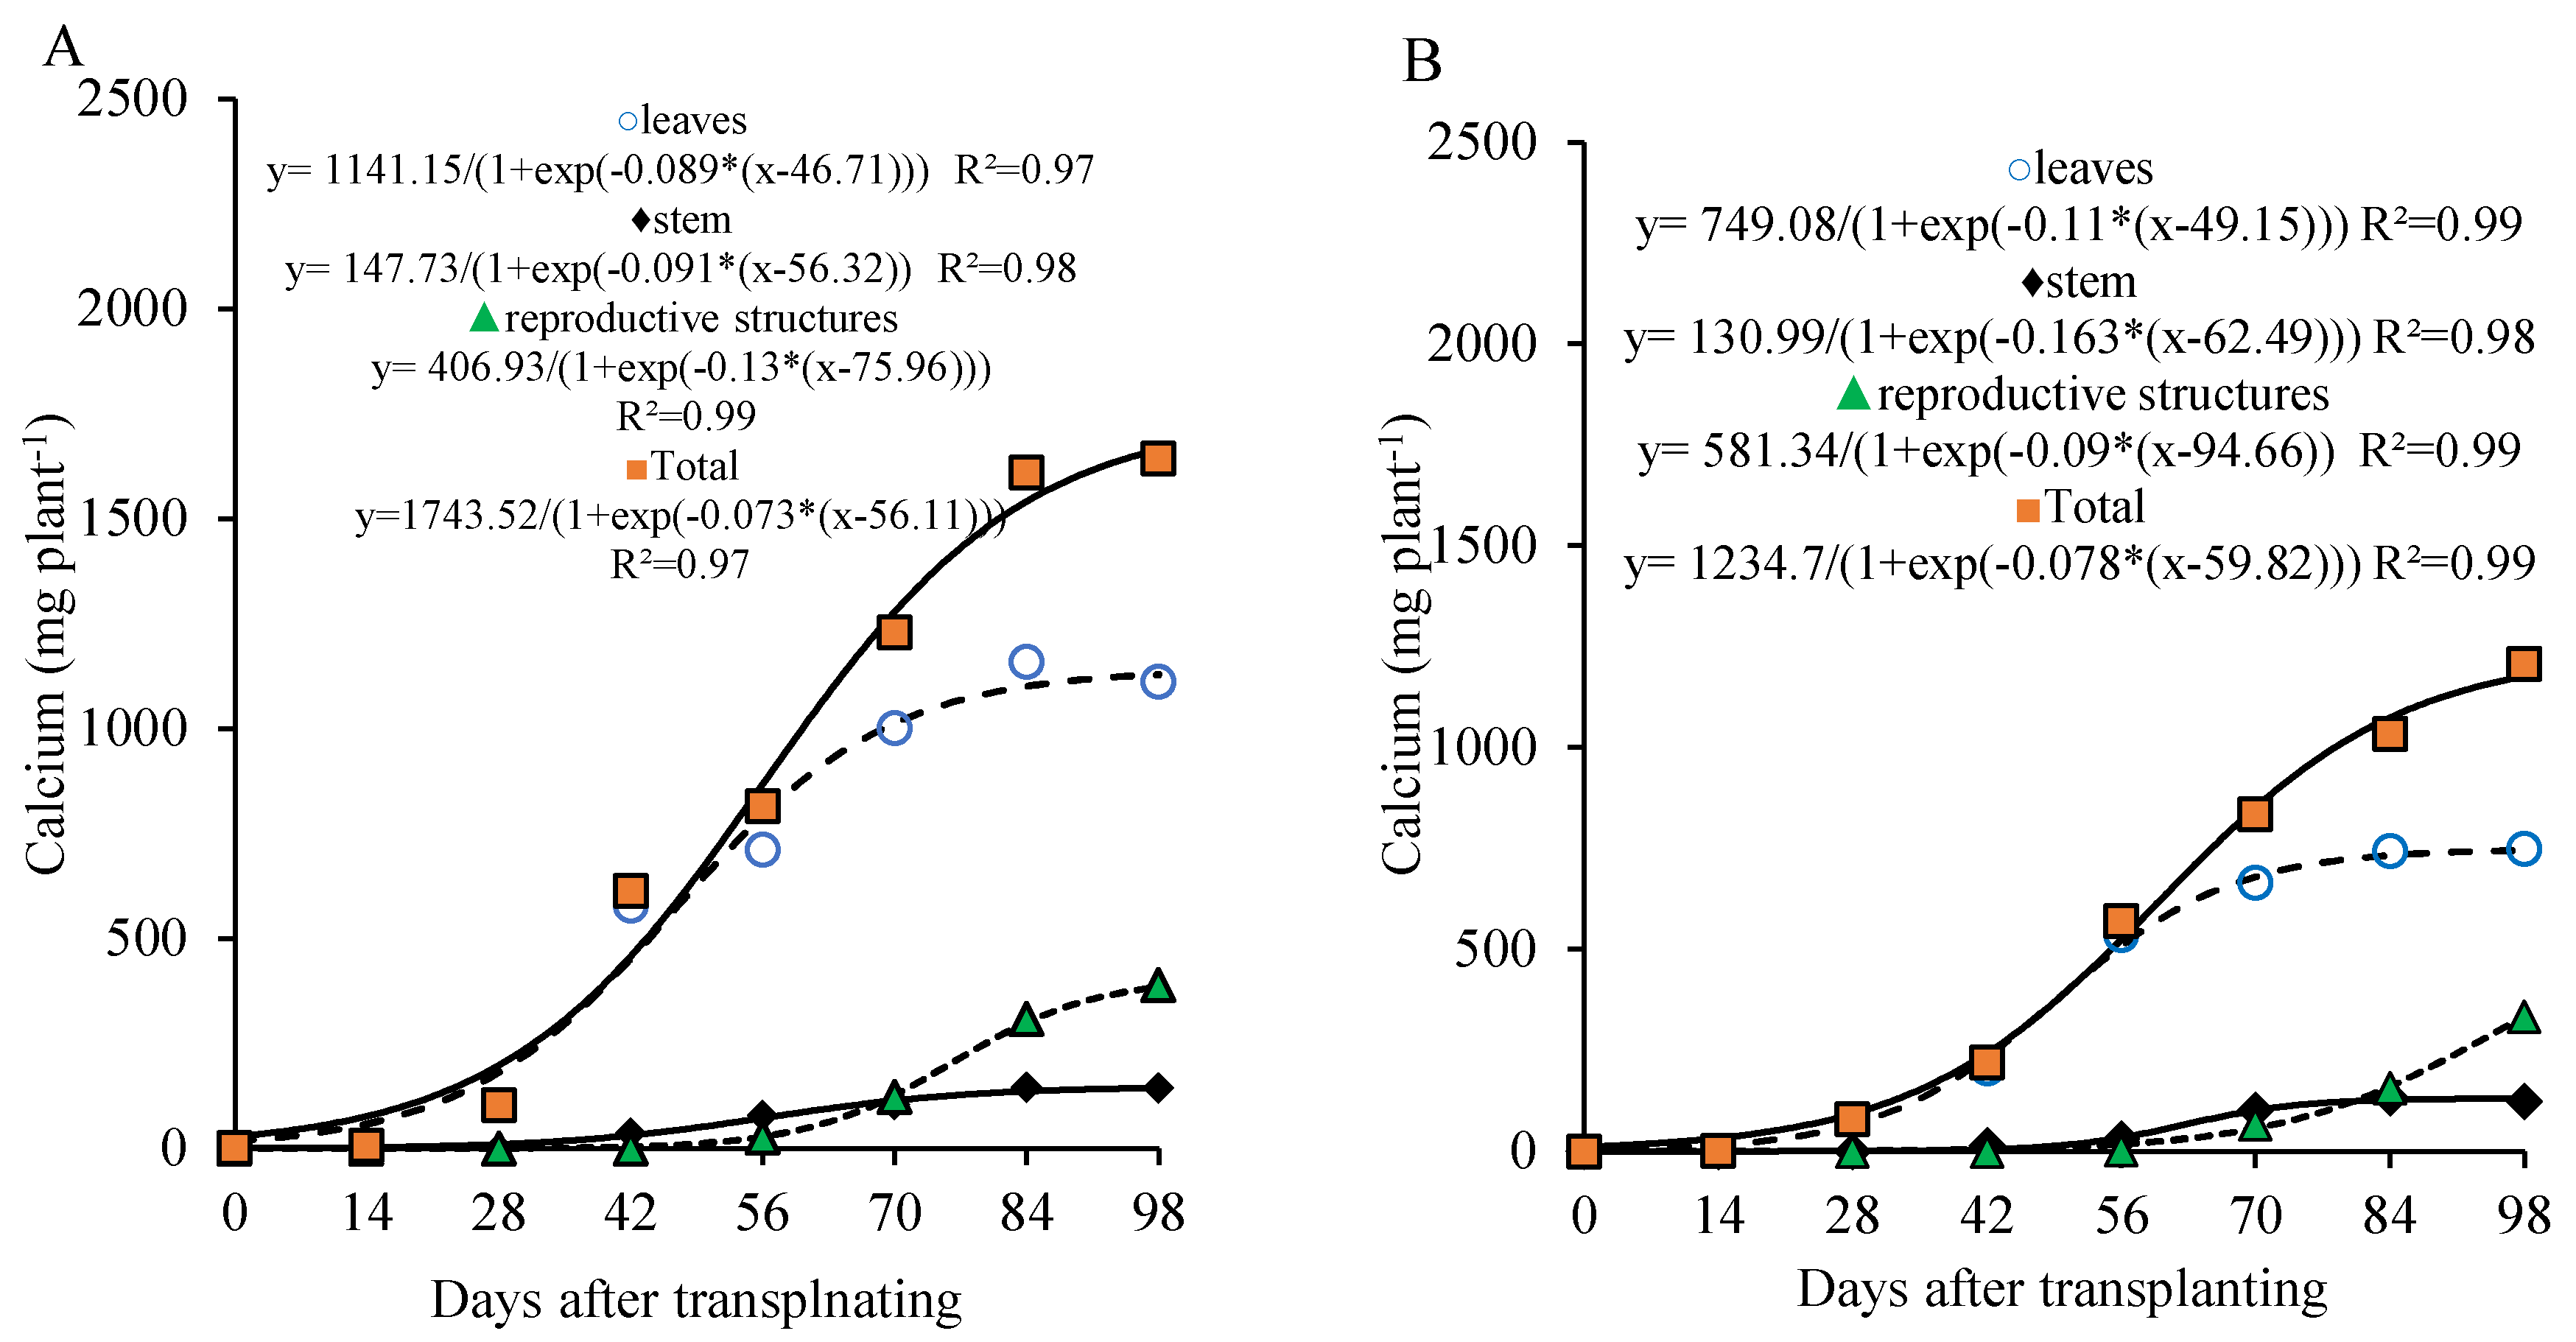
Table 2.
Results of the chemical analysis of the fertilizers: Yoorin® thermophosphate (YT), castor bean cake (CBC), and chicken manure (CM).
Table 2.
Results of the chemical analysis of the fertilizers: Yoorin® thermophosphate (YT), castor bean cake (CBC), and chicken manure (CM).
| Sources | N | P2O5Total | K2O | S | Ca | Mg | Cu | Fe | Mn | Zn | C/N ratio |
| ------------------------ % (Fresh*) ---------------------------- | -----mg kg (Fresh) ----- | ||||||||||
| YT | - | 18 | ND** | ND | - | - | - | - | - | - | - |
| CBC | 5.38 | 1.10 | 0.73 | 0.16 | 0.84 | 0.41 | 33 | 1501 | 101 | 114 | 08/jan |
| CM | 1.15 | 1.30 | 1.57 | 0.20 | 1.14 | 0.47 | 150 | 9790 | 324 | 137 | - |
* Total contents; ** Not detected.
Table 3.
Amount of macronutrients potentially supplied per hectare before planting, during topdressing, and in total for the treatments with organic fertilizers.
Table 3.
Amount of macronutrients potentially supplied per hectare before planting, during topdressing, and in total for the treatments with organic fertilizers.
| Dose | N | K2O | P2O5 | Ca | Mg | S |
| kg ha−1 de P2O5 | kg ha−1 | |||||
| Before planting | ||||||
| 320 | 270 | 439.4 | 589.0 | 234.2 | 97.3 | 77.2 |
| 800 | 270 | 439.4 | 1069.0 | 234.2 | 97.3 | 77.2 |
| Supplemental fertilization | ||||||
| 320 | 630 | 420 | 210 | 60.0 | 30.0 | 126.0 |
| 800 | 630 | 420 | 210 | 60.0 | 30.0 | 126.0 |
| Total | ||||||
| 320 | 900 | 859.4 | 799.0 | 294.2 | 127.3 | 203.2 |
| 800 | 900 | 859.4 | 1279.0 | 294.2 | 127.3 | 203.2 |
Disclaimer/Publisher’s Note: The statements, opinions and data contained in all publications are solely those of the individual author(s) and contributor(s) and not of MDPI and/or the editor(s). MDPI and/or the editor(s) disclaim responsibility for any injury to people or property resulting from any ideas, methods, instructions or products referred to in the content. |
© 2025 by the authors. Licensee MDPI, Basel, Switzerland. This article is an open access article distributed under the terms and conditions of the Creative Commons Attribution (CC BY) license (http://creativecommons.org/licenses/by/4.0/).
Copyright: This open access article is published under a Creative Commons CC BY 4.0 license, which permit the free download, distribution, and reuse, provided that the author and preprint are cited in any reuse.


