Submitted:
30 April 2025
Posted:
07 May 2025
You are already at the latest version
Abstract
Senegal, like many West African countries reliant on natural resources and agriculture, faces severe impacts from climate change. This study provides analysis undertaken by the United States Agency for International Development (USAID) under the Senegal Water Resources Management Activity, investigating historical and projected rainfall extremes to assess potential risks to water resources under future climate scenarios. Using bias-corrected CMIP6 data validated against the Enhancing National Climate Services (ENACTS) dataset for 1995–2014, we assess model performance through time series analysis, spatial distribution, and Taylor diagrams. We examine changes across three time periods—1995–2014 (historical), 2021–2040 (near future), and 2041–2060 (distant future)—focusing on nine key rainfall indices relevant to agriculture and water security. Results indicate that CMIP6 models capture historical rainfall patterns well. Spatial analysis reveals prolonged dry periods in the north and heavier rainfall in the south. Under SSP585, the near future shows an increase in consecutive dry days (CDD) and a decline in extreme rainfall events in northern Senegal, whereas the distant future projects a reversal with intensified rainfall (Rx5day). The south shows contrasting patterns, with increasing rainfall intensities in the long term. These findings highlight shifts in rainfall regimes and underscore the urgency of integrating future climate scenarios into adaptation planning. The study recommends extending analysis to temperature extremes due to their implications for agriculture and public health.
Keywords:
Climate change
; Rainfall indices
; ENACTS
; CMIP6
; Senegal
1. Introduction
Climate change is one of the most significant environmental challenges of the 21st century, affecting crucial development sectors such as agriculture, health, infrastructure, energy, transport, and water resources [1]. Increasing concentrations of greenhouse gases in the atmosphere have led to a concerning rise in global temperatures and disruptions in rainfall patterns. These climate-induced phenomena contribute to extreme weather events such as droughts, heat waves, and extreme rainfall, all of which have devastating impacts [2]. In a world where populations are increasingly vulnerable to natural hazards and significant climate variability, weather risk assessment has become a critical social concern.
This issue is particularly pronounced in West Africa, a region highly susceptible to climate variability and change. According to the latest IPCC report [3], surface temperature increases in Africa have outpaced the global average, leading to consequences such as more frequent heat extremes, fewer cold extremes, and rising sea levels around the continent. These factors contribute to more frequent coastal flooding and erosion along sandy coasts. Projections also suggest an increase in the frequency and intensity of heavy rainfall events, alongside prolonged drought periods [4].
Senegal, like many other West African countries, depends heavily on natural resources and agriculture for its survival and is experiencing severe consequences from climate change [5]. This structural vulnerability was further aggravated in the late 20th century, as reduced rainfall led to declining agricultural productivity and increased urban flooding. These climatic variations can have devastating impacts on human life and health, often resulting in post-event health crises [6].
Studying climate change is essential for understanding its impact on key economic sectors like agriculture in Senegal. Research conducted in various West African regions, including Senegal, has evaluated trends in extreme rainfall. These studies often focus on climate extremes by analyzing exceedance thresholds to assess the occurrence and intensity of extreme rainfall events [6,7].
Several studies have analyzed the behavior of extreme rainfall in Senegal using comparative evaluation methods, such as assessing drought sequences with the Standardized Precipitation Index (SPI) [8]. More recent research has focused on analyzing trends and return levels of extreme rainfall in Senegal during the period 1951–2005 [9].
This study investigates extreme hydrological events—namely droughts and heavy rainfall—using historical records and future rainfall projections in Senegal to evaluate potential risks to the country’s water resources. Eight extreme rainfall climate indices, as defined by the Expert Team on Climate Change Detection and Indices (ETCCDI), were selected for this analysis, as detailed in the data and methods section. These indices have been widely used to examine observed and modeled climate variability globally [10].
2. Data and Methods
2.1. Study Area
This study focuses on Senegal (Figure 1), located between 12°–17°N latitude and 18°-11°W longitude in the Sahelian region of West Africa. The country experiences a Sudano-Sahelian climate, characterized by two distinct seasons: a dry season and a rainy season. The rainy season, occurring from June to September, is strongly influenced by the West African Monsoon [11]. Annual precipitation varies significantly, ranging from approximately 1,500 mm in the southern regions to less than 300 mm in the northern parts of the country [12]. Temperature fluctuates between 25–27°C during the dry season and 27–29°C in the rainy season. Due to its geographical position, which is identified as one of the “highest hotspots” of climate change [13], Senegal is highly vulnerable to climate change impacts. The country frequently experiences climatic hazards such as floods, droughts, and heat waves, which are projected to intensify in the coming decades [14].
2.2. Validation Data
The Enhancing National Climate Services (ENACTS) dataset was used to assess the performance of the NEX-GDDP-CMIP6 bias-corrected precipitation data. Developed by the International Research Institute for Climate and Society (IRI), ENACTS provides high-resolution, station-satellite merged daily climate data for African countries. It delivers robust products tailored for decision-making [6]. Details of the ENACTS product are presented in Table 1, and the ENACTS network is shown in Figure 2.
2.3. NEX-GDDP-CMIP6 Bias-Corrected Datasets
This study utilizes fifteen (15) statistically downscaled CMIP6 datasets from the NASA Earth Exchange Global Daily Downscaled Projections (NEX-GDDP) project [16] to assess projected rainfall events in Senegal (see Table 2). The NEX-GDDP dataset provides bias-corrected climate projections at a high spatial resolution of approximately 0.25°×0.25° and includes daily climate variables such as temperature (mean, maximum, and minimum), precipitation, relative humidity, wind speed, and wind direction. The statistical downscaling technique employed in NEX-GDDP is the Bias-Correction Spatial Disaggregation (BCSD) method, developed by Wood et al. [17]. BCSD corrects systematic biases in raw Global Climate Model (GCM) outputs and improves the spatial representation of projected climate variables [17,18]. Specifically, BCSD addresses biases related to mean discrepancies, variability, and spatial misalignments by adjusting monthly climate trends from GCM simulations. These trends are then calibrated using historical observations to ensure better alignment with real-world conditions before being spatially interpolated to a finer resolution [19]. The NEX-GDDP dataset is a valuable resource for assessing climate change impacts across multiple sectors, including agriculture, water resources, and energy production. The data cover the period 1960–2100, with 1960–2014 representing the historical period and 2015–2100 the future period under four Shared Socio-economic Pathways (SSP1-2.6, SSP2-4.5, SSP3-7.0, and SSP5-8.5).
2.4. Methods
This study covers the period 1985–2100, where 1985–2014 represents the reference period and 2015–2100 the future period under two Shared Socio-economic Pathways (SSP2-4.5 and SSP5-8.5). A special focus was placed on two horizons: 2021–2040 (near future) and 2041–2060 (mid future), aligning with the Emerging Senegal Plan and the country's Sustainable Development Goals (SDGs), with two SSPs (SSP2-4.5 and SSP5-8.5) representing moderate mitigation and worst-case socio-economic pathways, respectively [20].
The reference period is used to evaluate the performance of the bias-corrected CMIP6 models against the ENACTS dataset. For the validation part, we focus solely on the precipitation variable and analyze each individual NEX-GDDP-CMIP6 model, as well as their multi-model ensemble mean (hereafter ENSMEAN) along the reference observational data. For future projections, we rely exclusively on the ENSMEAN to minimize uncertainties and enhance reliability [21]. Future extreme changes are analyzed by comparing the multi-annual mean values for the periods 2021–2040 and 2041–2060 against the reference period (1985–2014).
This study examines projected changes in extreme precipitation events in Senegal for two future climate periods under two SSP scenarios. Nine extreme rainfall indices (Table 3) from the Expert Team on Climate Change Detection and Indices (ETCCDI) [22] are employed. These indices are computed from daily precipitation data during the monsoon season (June to September). Previous studies have demonstrated that these indices are effective for detecting, attributing, and projecting climate extremes [23]. A full description of these indices is provided in Table 3.
3. Results
3.1. Evaluation of CMIP6 Models Against Observations
Figure 3a depicts the annual rainfall cycle from ENACTS observation and each of the CMIP6 models for the reference period 1985–2014. We can see that both ENACTS data and all CMIP6 models were able to capture the annual cycle characterized by a single rainy season from May to October and peak rainfall in August. However, we notice that most of the models used tend to overestimate the annual amount of rainfall.
When comparing interannual variability (Figure 3b), it is notable that rainfall exhibits a sawtooth pattern over the historical period 1985–2014. This variability highlights years with higher rainfall amounts alternating with years of lower rainfall. This dynamic may have significant implications for ecosystems, agriculture, and other aspects dependent on rainfall regimes [24]. A substantial discrepancy between the ENACTS reference data and the CMIP6 models is observed, particularly regarding interannual variability, as illustrated in Figure 3b. This disparity can be attributed to various factors such as differences in the representation of climate processes and errors in modeling.
3.2. Spatial Representation of Seasonal Rainfall Patterns
Figure 4 presents the spatial distribution of rainfall during the historical period from 1985 to 2014 from ENACTS data, each individual NEX-GDDP-CMIP6 model, as well as ENSMEAN. By looking at the different panels of the figure, an assessment of the similarities and differences in the spatial distribution of rainfall between the climate models is revealed. A latitudinal gradient is particularly noticeable on the rainfall maps, illustrating a decrease in isohyets from south to north. The southern regions, under the influence of the summer monsoon and other meteorological systems, generally have higher levels of rainfall. In contrast, the northern regions of West Africa are more often characterized by arid or semi-arid climate, with significantly lower rainfall levels. The central regions lie between these two extremes, receiving intermediate amounts of rainfall [25].
This in-depth analysis not only highlights general trends in the spatial distribution of rainfall but also allows a detailed comparison between observed data and projections from different climate models, thus providing a solid basis for understanding regional weather dynamics. It is significant to note that the magnitude of the seasonal accumulation of precipitation is underestimated in the north by climate models and overestimated in the south.
3.3. Statistical Assessment Using Taylor Diagram
Figure 5 presents a Taylor diagram comparing the bias-corrected outputs of 15 CMIP6 models with ENACTS climate reference data. The diagram simultaneously displays three precipitation statistics: centered Root Mean Square Error (RMSE), correlation coefficient (r), and normalized standard deviation (STD), providing a concise visual summary of model performance [26].
Along the correlation axis, most models show a correlation coefficient approaching 0.8, indicating a strong ability of the CMIP6 models to reproduce the reference dataset and supporting their use for future climate analyses. The concentric semicircles centered on the point (1,1) represent the RMSE, where closer proximity to this point denotes lower error and better agreement with observations. The normalized standard deviation axis highlights a spread among models, with values ranging from 1 to 1.25, reflecting challenges in accurately capturing rainfall variability over Senegal.
Figure 5 thus summarizes the relative performance of the 15 CMIP6 models in simulating rainfall compared to ENACTS observations. The black dot represents the multi-model ensemble mean (ENSMEAN), while each colored dot corresponds to an individual model. Models that lie closer to the reference point (correlation = 1; standard deviation = 1) exhibit stronger agreement with observed data.
3.4. Historical and Projected Spatial Patterns of Rainfall Indices
Figure 6, showing the spatial distribution of indices of duration, frequency and intensity of precipitation extremes (CDD, CWD, RR1, SDII, Rx5day, R95pTOT, R10mm, R20mm and PRCPTOT) over the historical period 1985–2014, reveals key climatic characteristics. The CDD index (Figure 6a) is higher in the north, indicating longer periods without rainfall, particularly in the Saint-Louis, Louga, and Matam regions. The CWD index is low in the north, which reflects an absence of precipitation, unlike in the south where the index is higher, and average in the center (Figure 6b). The south-eastern part records the greatest number of rainy days shown by the RR1 index (Figure 6c). The daily precipitation given by the SDII index is much higher in the south, which weakens towards the north (Figure 6d). The cumulative precipitation studied with the Rx5day and R95pTOT indices show a low intensity of rainfall almost throughout the territory except the south-west part and the coast.
The R10mm (Figure 6g) and R20mm (Figure 6h) indicators show high frequencies in the south, particularly in the Ziguinchor, Sedhiou, and Kolda regions, suggesting a concentration of heavy rainfall in these areas. By projecting these indicators (R10mm and R20mm) over the future periods (2021–2040 and 2041–2060) under SSP585, the southern regions continue to be among the high-intensity areas with high rainfall frequencies (Figure 7g–h and Figure 8g–h).
The analysis of climate indices offers interesting perspectives, especially regarding the regions of the south and the north. Intensity and frequency indices are higher in the south, particularly in the Ziguinchor, Sedhiou, and Kolda regions. In the north, under the SSP585 scenario, the near future (2021–2040) shows an increase in dry days with a rising trend in the CDD signal (Figure 7a) and a decrease in rainfall events, illustrated by a decline in Rx5day (Figure 7e). In the far future (2041–2060), under the SSP585 scenario, opposite trends are observed, with a decrease in dry days and a significant increase in Rx5day (Figure 8e), highlighting important changes in rainfall patterns.
Under SSP585, the near future indicates an increase in dry days, with a slight rise in the CWD signal (Figure 7b) and a decrease in the SDII signal (Figure 7d), suggesting a reduction in daily rainfall. For the far future, the SSP585 scenario shows a significant increase in the wet day signal, accompanied by a notable decrease in CWD (Figure 8b) and an increase in Rx5day (Figure 8e), highlighting significant variations in the region's climate patterns.
3.5. Temporal Trends in Rainfall Indices Under SSP585 Scenario
To explore the temporal evolution of rainfall extremes in Senegal, spatial trends of intensity and frequency indices were calculated for two future periods—2021–2040 (near future) and 2041–2060 (distant future)—under the high-emission SSP585 scenario. These trends are depicted in Figure 9 and Figure 10 and provide critical insights into projected shifts in rainfall characteristics across the country.
In the near future (2021–2040), several indices reveal significant changes. As shown in Figure 9, the maximum number of wet days (CWD) (Figure 9b), the mean daily rainfall intensity (SDII), the maximum 5-day rainfall accumulation (Rx5day) (Figure 9e), and the frequencies of heavy rainfall events (R10mm and R20mm) (Figure 9g–h) show declining trends, particularly across northern Senegal. For instance, SDII is projected to decrease by approximately 15%, while CWD may decline by up to 50% in some northern areas. In contrast, the R95pTOT and PRCPTOT indices (Figure 9f,i) show positive trends, with increases of about 18% and 8%, respectively, suggesting a growing contribution of extreme events to total rainfall.
This paradoxical result—where total rainfall may remain stable or even rise, despite a reduction in rainy days—underscores a key dynamic of climate change: the simultaneous intensification of dry spells and extreme rainfall events. While the number of dry days (CDD) (Figure 9a) decreases by up to 30% in the north, southwestern Senegal shows a potential increase of up to 30%, with the exception of the Kedougou, Kolda, Sedhiou, and Ziguinchor regions. These variations have significant implications for water resource management and the planning of agricultural activities. Meanwhile, the total number of rainy days (RR1) (Figure 9c) is projected to decline over most of the country, including parts of the south, whereas some areas in the north may see increases of up to 40%.
Looking ahead to the distant future (2041–2060), new spatial dynamics emerge. As illustrated in Figure 10, declining trends in CWD, RR1, SDII, and R10mm are projected to intensify in the southern and central parts of the country. However, increases in these indices are observed in the north, indicating a shift in rainfall regimes. Notably, Rx5day, R95pTOT, and R20mm exhibit widespread upward trends, particularly in the western and central regions, suggesting that very intense rainfall events will become more common, even as average daily or seasonal rainfall declines. The increase in R20mm is especially apparent across much of the territory, except along the western coast.
These contrasting trends suggest a potential intensification of climate extremes, marked by more erratic rainfall patterns, longer dry periods, and more concentrated heavy rainfall events. Such conditions could severely impact agriculture, water supply, and the resilience of ecosystems and local communities.
In summary, the analysis of CMIP6 ensemble projections under SSP585 indicates a general drying trend across Senegal during the JJAS season in the coming decades. The long-term period (2041–2060) is particularly critical, as it exhibits the most pronounced reductions in seasonal rainfall and the strongest increases in the frequency and intensity of extreme rainfall events.
3.6. Temporals Trends in Rainfall Indices Anomalies
Figure 11 presents the temporal evolution of rainfall indices anomalies over Senegal from 1995 to 2100, expressed as percentage deviations from the historical reference period (1995–2014). The analysis focuses on the core rainy season (JJAS), which is vital for agricultural and water resource planning. The results reveal a succession of positive and negative anomalies in all indices throughout the historical period, generally ranging between −10% and +10%, reflecting natural year-to-year variability.
However, projections under the SSP585 scenario indicate a significant amplification of these anomalies in the future, with values potentially fluctuating between −30% and +30% by the end of the century. This projected increase in interannual variability underscores the likelihood of more erratic and extreme rainfall patterns as global temperatures rise and greenhouse gas concentrations intensify.
Among the indices, a marked increase in consecutive dry days (CDD) is evident under SSP585, particularly after 2050 (Figure 11b). This suggests a shift toward prolonged dry periods, with potentially severe implications for agriculture and drought risk. Conversely, indices such as consecutive wet days (CWD), frequency of wet days (RR1), and moderate rainfall events (R10mm) show a clear downward trend (Figure 11c,d,f), indicating fewer and shorter wet spells in the future.
For more extreme indices—including very heavy rainfall days (R20mm), maximum 5-day precipitation (Rx5day), and daily intensity index (SDII)—the projections reveal slight but less consistent downward trends (Figure 11e,g,h). While these changes are more moderate, they still suggest a reduction in the intensity and frequency of heavy rainfall events, especially in the latter half of the 21st century.
Overall, this long-term time series analysis highlights an intensification of rainfall variability in Senegal under SSP585. The trends point toward more frequent dry spells, fewer wet days, and a potential decline in both moderate and extreme rainfall events. These findings reinforce the urgency of integrating future climate variability into national planning frameworks, particularly for agriculture, food security, and water resource management.
3.7. Uncertainties in Rainfall Modeling in West Africa
This section addresses the uncertainties associated with climate model projections of rainfall in West Africa, with a focus on Senegal. Using outputs from CMIP6 models, the study analyzes interannual rainfall trends under the high-emission socio-economic pathway SSP585, providing insight into the range and direction of potential future climate scenarios. Two projection horizons are considered: the near future (2021–2040) and the distant future (2041–2060).
Figure 12a presents model-based linear trends in annual rainfall for the period 2021–2040. The results reveal considerable divergence among models: 29% project a positive trend (increased rainfall), while 71% project a negative trend (reduced rainfall). This majority consensus around declining rainfall suggests a strong signal of drying for the Senegal River Valley and adjacent regions in the near-term future, even as inter-model variability persists.
In contrast, Figure 12b highlights trends for the distant future period (2041–2060) under the SSP585 scenario. Here, uncertainty decreases in terms of direction, with 86% of models indicating a negative trend and only 14% projecting an increase in rainfall. This shift suggests a growing convergence among models toward a drying scenario as emissions rise and climate change intensifies. These results highlight the importance of emission pathways in shaping long-term rainfall projections.
The implications of these projections are significant, particularly for water-dependent sectors such as agriculture and hydrology. A persistent decline in rainfall may lead to heightened water scarcity, reduced agricultural productivity, and increased vulnerability to climate shocks. For policymakers and planners, these findings emphasize the need for anticipatory adaptation strategies that account for both the potential magnitude and the uncertainty of future climate conditions in the region.
4. Discussion
The spatial and temporal analysis of rainfall indices reveals a marked heterogeneity in precipitation patterns across Senegal, with significant regional disparities. All indices—except for the maximum number of consecutive dry days (CDD)—indicate higher values in the southern part of the country, followed by the central and then northern regions. These findings are consistent with previous research conducted in Senegal by [27] and at the broader Sahel scale by [7]. This south–north gradient is primarily driven by the influence of the West African Monsoon, which enhances precipitation in the south, while the north is more affected by arid atmospheric circulation regimes.
Projections for the distant future period (2041–2060) under the SSP585 scenario point to a likely intensification of drought conditions in the north and an increase in extreme rainfall events in the south. These trends support earlier conclusions by [26], who projected a long-term reduction in precipitation due to a weakening in rainfall intensity. This is particularly evident through the projected decline in the number of very wet days [28]. At the same time, several studies [29,30,31] have documented a rising frequency of intense precipitation events and a reduction in the duration of wet spells across the Sahel region, further confirming the trend towards more erratic and extreme rainfall.
In the near future (2021–2040), however, model projections are more divergent. Some indices suggest an increase in wet conditions in the north—reflected in reduced dry days (CDD) and more frequent rainy days (CWD, RR1)—while a simultaneous decline in these indicators is projected for the southern regions. This spatial and temporal variability aligns with the findings of [23,30], who reported global-scale shifts in rainfall patterns, including an increase in the frequency of heavy rainfall events and a concurrent decline in prolonged dry spells.
Importantly, the observed changes in rainfall indices appear to follow a latitudinal propagation, with early signals emerging in the northern (Sahelian) zone, later extending to the central (Sudano-Sahelian), and finally affecting the southern (Sudanese) region of Senegal. This pattern is corroborated by the work of [8], who identified a similar spatial progression of climate anomalies across the Sahel-Sudanese transect [33].
Despite these insights, the analysis also reveals substantial uncertainties among CMIP6 models, particularly in their projections of interannual rainfall trends. The discrepancies between models underscore the influence of model-specific sensitivities, differences in the representation of physical processes, and the complex interplay of regional climate dynamics. These uncertainties call for cautious interpretation of the results and reinforce the importance of using ensemble means and multiple scenarios in climate impact assessments.
Further research is essential to better understand the drivers´ variability of rainfall in West Africa. This includes advancing knowledge on inter- and intra-annual oscillations, regional atmospheric circulation patterns, and their representation within CMIP6 models. As recommended by [31], future work should aim to improve the representation of local climatic processes and feedback mechanisms to reduce uncertainty in model outputs. Additionally, investigating the sources of bias in CMIP6 and comparing them with CMIP5—as highlighted by [32,33]—could help refine climate projections and enhance the robustness of scenario-based planning for the region.
5. Conclusions
This study assessed historical and projected rainfall variability across Senegal using nine standardized precipitation indices defined by the Expert Team on Climate Change Detection and Indices (ETCCDI). These indices capture the intensity (PRCPTOT, R95pTOT, Rx5day, SDII, RR1), frequency (R10mm, R20mm), and duration (CDD, CWD) of precipitation extremes, providing valuable insight into climate-related risks to water resources and agricultural systems.
The analysis reveals notable spatio-temporal contrasts in rainfall dynamics. In northern Senegal, under the SSP585 scenario, the near future (2021–2040) is projected to experience a 3% increase in dry days (CDD) and a 5% reduction in intense rainfall events (Rx5day). However, in the distant future (2041–2060), opposite trends emerge, with dry days decreasing by 5% and Rx5day increasing by 15%, indicating a possible shift toward more intense but less frequent rainfall events.
In the southern regions, near-future projections under SSP585 show a 13% increase in dry days, a marginal 1% increase in CWD, and a 3% reduction in SDII, suggesting both a drying trend and declining rainfall intensity. By contrast, the distant future reveals a 24% increase in rainy days, accompanied by a 6% decrease in CWD and a substantial 22% rise in Rx5day, pointing to a growing intensity of extreme rainfall events.
Overall, the findings indicate a trend toward drier conditions in the north and more variable and intense rainfall in the south, reinforcing concerns about increasing climate extremes and their implications for water availability, agriculture, and disaster risk management. These projected changes emphasize the urgent need for robust climate adaptation strategies grounded in scientific projections and local context.
While CMIP6 models offer powerful tools for exploring future climate scenarios, the inherent uncertainties—especially regarding regional rainfall processes—must be acknowledged. These uncertainties call for cautious interpretation of model outputs, and emphasize the importance of using ensemble means, refining downscaling techniques, and enhancing the representation of local and regional climate dynamics. Future research should also explore the socio-economic implications of these trends and promote integrative approaches that combine climate science, local knowledge, and stakeholder engagement.
This work, based on rainfall indices of particular relevance to agriculture in Senegal, provides a foundational step for future studies. Complementary analyses focusing on temperature extremes—which are equally critical for agriculture and public health—should be conducted to further understand evolving climate risks. Expanding the range of climate models and scenarios used will also enhance the robustness of future projections and support more resilient and adaptive planning for sustainable development across Senegal.
Author Contributions
Conceptualization, I.D. and P.F.; methodology, I.D.; software, P.F.; validation, I.D., A.F. and S.D.; formal analysis, I.D.; investigation, I.D.; resources, I.D.; data curation, P.F.; writing—original draft preparation, I.D.; writing—review and editing, I.D., A.F., S.D., A.K.D. and M.B.B.; visualization, I.D.; supervision, A.B., A.S; project administration, I.D.; funding acquisition, A.B and A.S. All authors have read and agreed to the published version of the manuscript.
Funding
This research received no external funding.
Data Availability Statement
The data supporting the findings of this study are publicly available. The NEX-GDDP-CMIP6 dataset can be accessed through https://registry.opendata.aws/nex-gddp-cmip6, and the ENACTS data are accessible through ANACIM upon request.
Acknowledgments
The authors thank the International Research Institute for Climate and Society (IRI) for providing access to the ENACTS dataset and NASA for the NEX-GDDP-CMIP6 projections. Technical support from the LPAO-SF team and contributions from all research partners involved in field discussions are greatly appreciated.
Conflicts of Interest
The authors declare no conflicts of interest. The funders had no role in the design of the study; in the collection, analysis, or interpretation of data; in the writing of the manuscript; or in the decision to publish the results.
Abbreviations
The following abbreviations are used in this manuscript:
| CMIP6 | Coupled Model Intercomparison Project Phase 6 |
| SSP | Shared Socioeconomic Pathway |
| ENACTS | Enhancing National Climate Services |
| ETCCDI | Expert Team on Climate Change Detection and Indices |
| CDD | Consecutive Dry Days |
| CWD | Consecutive Wet Days |
| RR1 | Number of Rainy Days (≥1 mm) |
| SDII | Simple Daily Intensity Index |
| Rx5day | Maximum 5-Day Consecutive Rainfall |
| R10mm | Number of Days with Precipitation ≥10 mm |
| R20mm | Number of Days with Precipitation ≥20 mm |
| R95pTOT | Annual Total Precipitation from Very Wet Days (above 95th percentile) |
| PRCPTOT | Total Seasonal Precipitation (≥1 mm) |
| JJAS | June–July–August–September (Core Rainy Season in West Africa) |
| NEX-GDDP | NASA Earth Exchange Global Daily Downscaled Projections |
| RMSE | Root Mean Square Error |
| STD | Standard Deviation |
| MDPI | Multidisciplinary Digital Publishing Institute |
References
- Praveen, B.; Sharma, P. A review of literature on climate change and its impacts on agriculture productivity. J. Public Aff. 2019, 19, e1960. [Google Scholar] [CrossRef]
- Clarke, B.; Otto, F.; Stuart-Smith, R.; Harrington, L. Extreme weather impacts of climate change: An attribution perspective. Environ. Res. Clim. 2022, 1, 012001. [Google Scholar] [CrossRef]
- Ajayi, V.O.; Ilori, B. Projected changes in precipitation and drought characteristics over West Africa under global warming. Clim. Dyn. 2020, 55, 1163–1177. [Google Scholar]
- Giorgi, F.; Raffaele, F.; Coppola, E. Response of precipitation characteristics to global warming in time-dependent regional climate models. J. Geophys. Res. 2019, 124, 1393–1415. [Google Scholar]
- Dinku, T.; Faniriantsoa, R.; Islam, S.; Nsengiyumva, G.; Grossi, A. The Climate Data Tool: Enhancing climate services across Africa. Front. Clim. 2022, 3, 787519. [Google Scholar] [CrossRef]
- Crétat, J.; Vizy, E.K.; Cook, K.H. The relationship between African easterly waves and West African precipitation. Clim. Dyn. 2011, 36, 705–722. [Google Scholar]
- Mouhamed, L.; Traore, S.B.; Alhassane, A.; Sarr, B. Evolution of some observed climate extremes in the West African Sahel. Weather Clim. Extremes 2013, 1, 19–25. [Google Scholar] [CrossRef]
- Sarr, M.A.; Zoromé, M.; Seidou, O.; Bryant, C.R.; Gachon, P. Recent trends in selected extreme precipitation indices in Senegal—A changepoint approach. J. Hydrol. 2013, 505, 326–334. [Google Scholar] [CrossRef]
- Faye, C. Sécheresse pluviométrique au Sénégal: Analyse fréquentielle et modélisation par la méthode de Gumbel. J. Afr. Sci. 2018, 10, 345–360. [Google Scholar]
- Faye, C.; Tall, M.; Diop, A.; Dione, C.K. Analyse fréquentielle des pluies extrêmes au Sénégal. Rev. CAMES-Sci. Technol. 2017, 5, 85–95. [Google Scholar]
- Bhattacharya, S. Analyzing rainfall extremes in India using ETCCDI indices. Clim. Dyn. 2019, 53, 1667–1685. [Google Scholar]
- Faye, A.; Akinsanola, A.A. Evaluation of CMIP6 models for precipitation extremes over West Africa. Clim. 2022, 10, 84. [Google Scholar] [CrossRef]
- de Medeiros, J.; de Oliveira, F.; Ferreira, J.; dos Santos, C.; Guimarães, R. Recent rainfall trends and climate extremes in Brazil using ETCCDI indices. Atmos. 2022, 13, 1501. [Google Scholar] [CrossRef]
- Sillmann, J.; Kharin, V.V.; Zhang, X.; Zwiers, F.W.; Bronaugh, D. Climate extremes indices in the CMIP5 multimodel ensemble: Part 1. Model evaluation in the present climate. J. Geophys. Res. Atmos. 2013, 118, 1716–1733. [Google Scholar] [CrossRef]
- Eyring, V.; Bony, S.; Meehl, G.A.; Senior, C.A.; Stevens, B.; Stouffer, R.J.; Taylor, K.E. Overview of the Coupled Model Intercomparison Project Phase 6 (CMIP6) experimental design and organization. Geosci. Model Dev. 2016, 9, 1937–1958. [Google Scholar] [CrossRef]
- Thrasher, B.; Maurer, E.P.; McKellar, C.; Duffy, P.B. Technical Note: Bias correcting climate model simulated daily temperature extremes with quantile mapping. Hydrol. Earth Syst. Sci. 2022, 26, 5093–5106. [Google Scholar] [CrossRef]
- Wood, A.W.; Leung, L.R.; Sridhar, V.; Lettenmaier, D.P. Hydrologic implications of dynamical and statistical approaches to downscaling climate model outputs. Clim. Change 2004, 62, 189–216. [Google Scholar] [CrossRef]
- Maurer, E.P.; Brekke, L.; Pruitt, T.; Duffy, P.B. Fine-resolution climate projections enhance regional climate change impact studies. Eos Trans. AGU 2008, 89, 93–94. [Google Scholar] [CrossRef]
- Zhang, X.; Alexander, L.; Hegerl, G.; Jones, P.; Tank, A.K.; Peterson, T.; Trewin, B.; Zwiers, F. Indices for monitoring climate extremes: Guidelines for implementation. WMO World Clim. Prog. 2011, WCDMP-No. 47. [Google Scholar]
- Taylor, K.E. Summarizing multiple aspects of model performance in a single diagram. J. Geophys. Res. Atmos. 2001, 106, 7183–7192. [Google Scholar] [CrossRef]
- Sultan, B.; Janicot, S.; Diedhiou, A. The West African Monsoon dynamics. Part I: Documentation of intraseasonal variability. J. Clim. 2003, 16, 3389–3406. [Google Scholar]
- Karl, T.R.; Nicholls, N.; Ghazi, A. CLIVAR/GCOS/WMO Workshop on Indices and Indicators for Climate Extremes. Weather Clim. Extremes 1999, 1, 3–7. [Google Scholar]
- Donat, M.G.; Alexander, L.V.; Yang, H.; Durre, I.; Vose, R.; Dunn, R.J.H.; et al. Updated analyses of temperature and precipitation extreme indices since the beginning of the twentieth century: The HadEX2 dataset. J. Geophys. Res. Atmos. 2013, 118, 2098–2118. [Google Scholar] [CrossRef]
- Nouaceur, Z. La reprise des pluies et la recrudescence des inondations en Afrique de l’Ouest sahélienne. Physio-Géo 2020, 15. [CrossRef]
- Sultan, B.; Janicot, S. The West African Monsoon dynamics. Part II: The “Preonset” and “Onset” of the summer monsoon. J. Clim. 2003, 16, 3407–3427. [Google Scholar] [CrossRef]
- Sarr, A.B.; Camara, M. Évolution des indices pluviométriques extrêmes par l’analyse de modèles climatiques régionaux du programme CORDEX: Les projections climatiques sur le Sénégal. Eur. Sci. J. 2017, 13, 206–220. [Google Scholar] [CrossRef]
- Diba, I.; Moctar, C.; Jules, B.; Hamady, S.; Arona, D. Variabilité interannuelle des extrêmes pluviométriques au Sénégal: Climat présent. Manuscrit non publié, 2021.
- Descroix, L.; Niang, A.D.; Panthou, G.; Bodian, A.; Sane, Y.; Dacosta, H.; et al. Évolution récente de la pluviométrie en Afrique de l’Ouest à travers deux régions: La Sénégambie et le bassin du Niger moyen. Climatologie 2015, 12, 25–43. [Google Scholar] [CrossRef]
- Gbode, I.E.; Adeyeri, O.E.; Menang, K.P.; Intsiful, J.D.K.; Ajayi, V.O.; Omotosho, J.A.; Akinsanola, A.A. Observed changes in climate extremes in Nigeria. Meteorol. Appl. 2019, 26, 642–654. [Google Scholar] [CrossRef]
- Sacré Régis, M.D.; et al. Using the CHIRPS dataset to investigate historical changes in precipitation extremes in West Africa. Clim. 2020, 8, 84. [Google Scholar] [CrossRef]
- Akinsanola, A. A., Ajayi, V. O., Adejare, A. T., Adeyeri, O. E., Gbode, I. E., Ogunjobi, K. O., … Abolude, A. T. (2018). Evaluation of rainfall simulations over West Africa in dynamically downscaled CMIP5 global circulation models. Theoretical and Applied Climatology, 132, 437–450.
- Dosio, A.; Panitz, H.J.; Schubert-Frisius, M.; Lüthi, D. Dynamical downscaling of CMIP5 global circulation models over CORDEX-Africa with COSMO-CLM. Clim. Dyn. 2015, 44(9–10), 2637–2661. [CrossRef]
- Dosio, A.; et al. Projected future daily characteristics of African precipitation based on global (CMIP5, CMIP6) and regional (CORDEX, CORDEX-CORE) climate models. Clim. Dyn. 2021, 57, 3135–3158. [Google Scholar] [CrossRef]
Figure 1.
Agro-ecological zones of Senegal, classified according to climatic conditions and land use characteristics. The map delineates five main zones: the Niayes zone, the Senegal River Valley, the Groundnut Basin, Eastern Senegal, the Sylvo-Pastoral zone, and Casamance. Isohyets (1981–2010) are shown to illustrate mean annual rainfall gradients across the country, ranging from 250 mm in the north to over 1,200 mm in the south. Regional capitals and soil monitoring sites are also indicated. Source: [15].
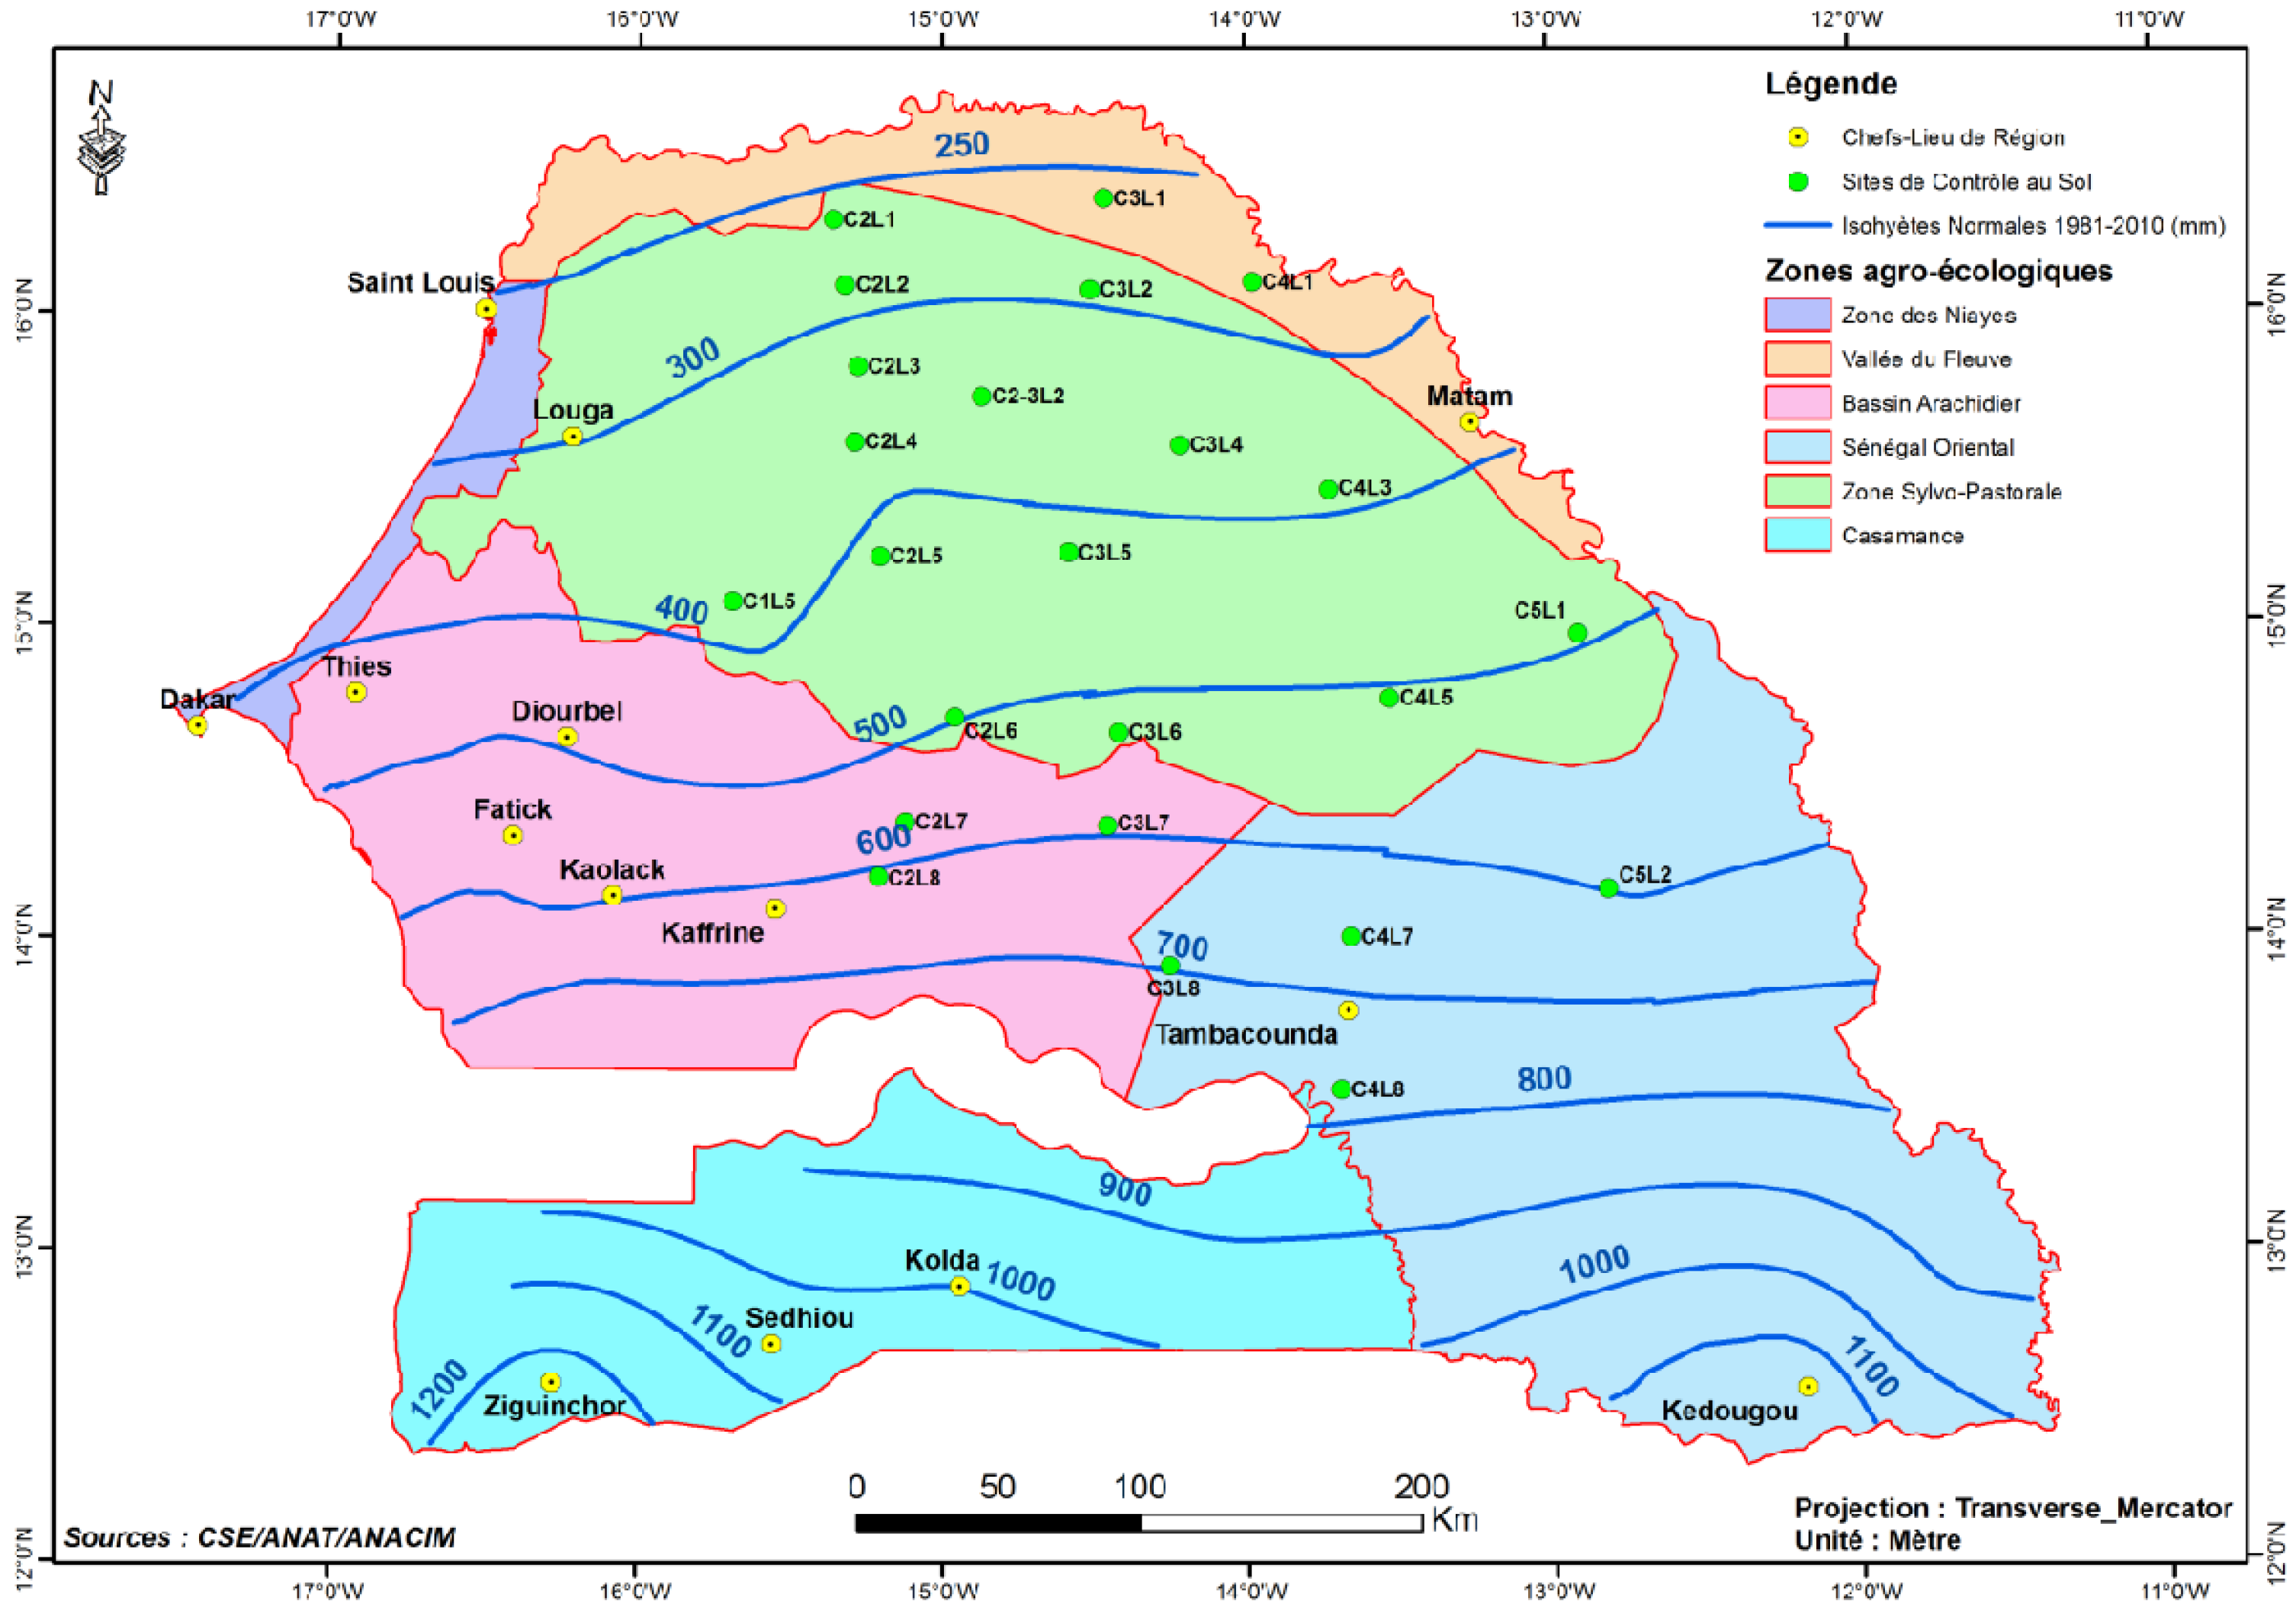
Figure 2.
Geographic coverage of the ENACTS data network across Africa. Countries are categorized by the scope of implementation: national level (orange), regional level (purple), and both national and regional levels (peach). The ENACTS initiative aims to improve climate data availability and use for decision-making by integrating quality-controlled station data with satellite and reanalysis products. Source: International Research Institute for Climate and Society (IRI), Columbia University (ENACTS | columbia.edu).
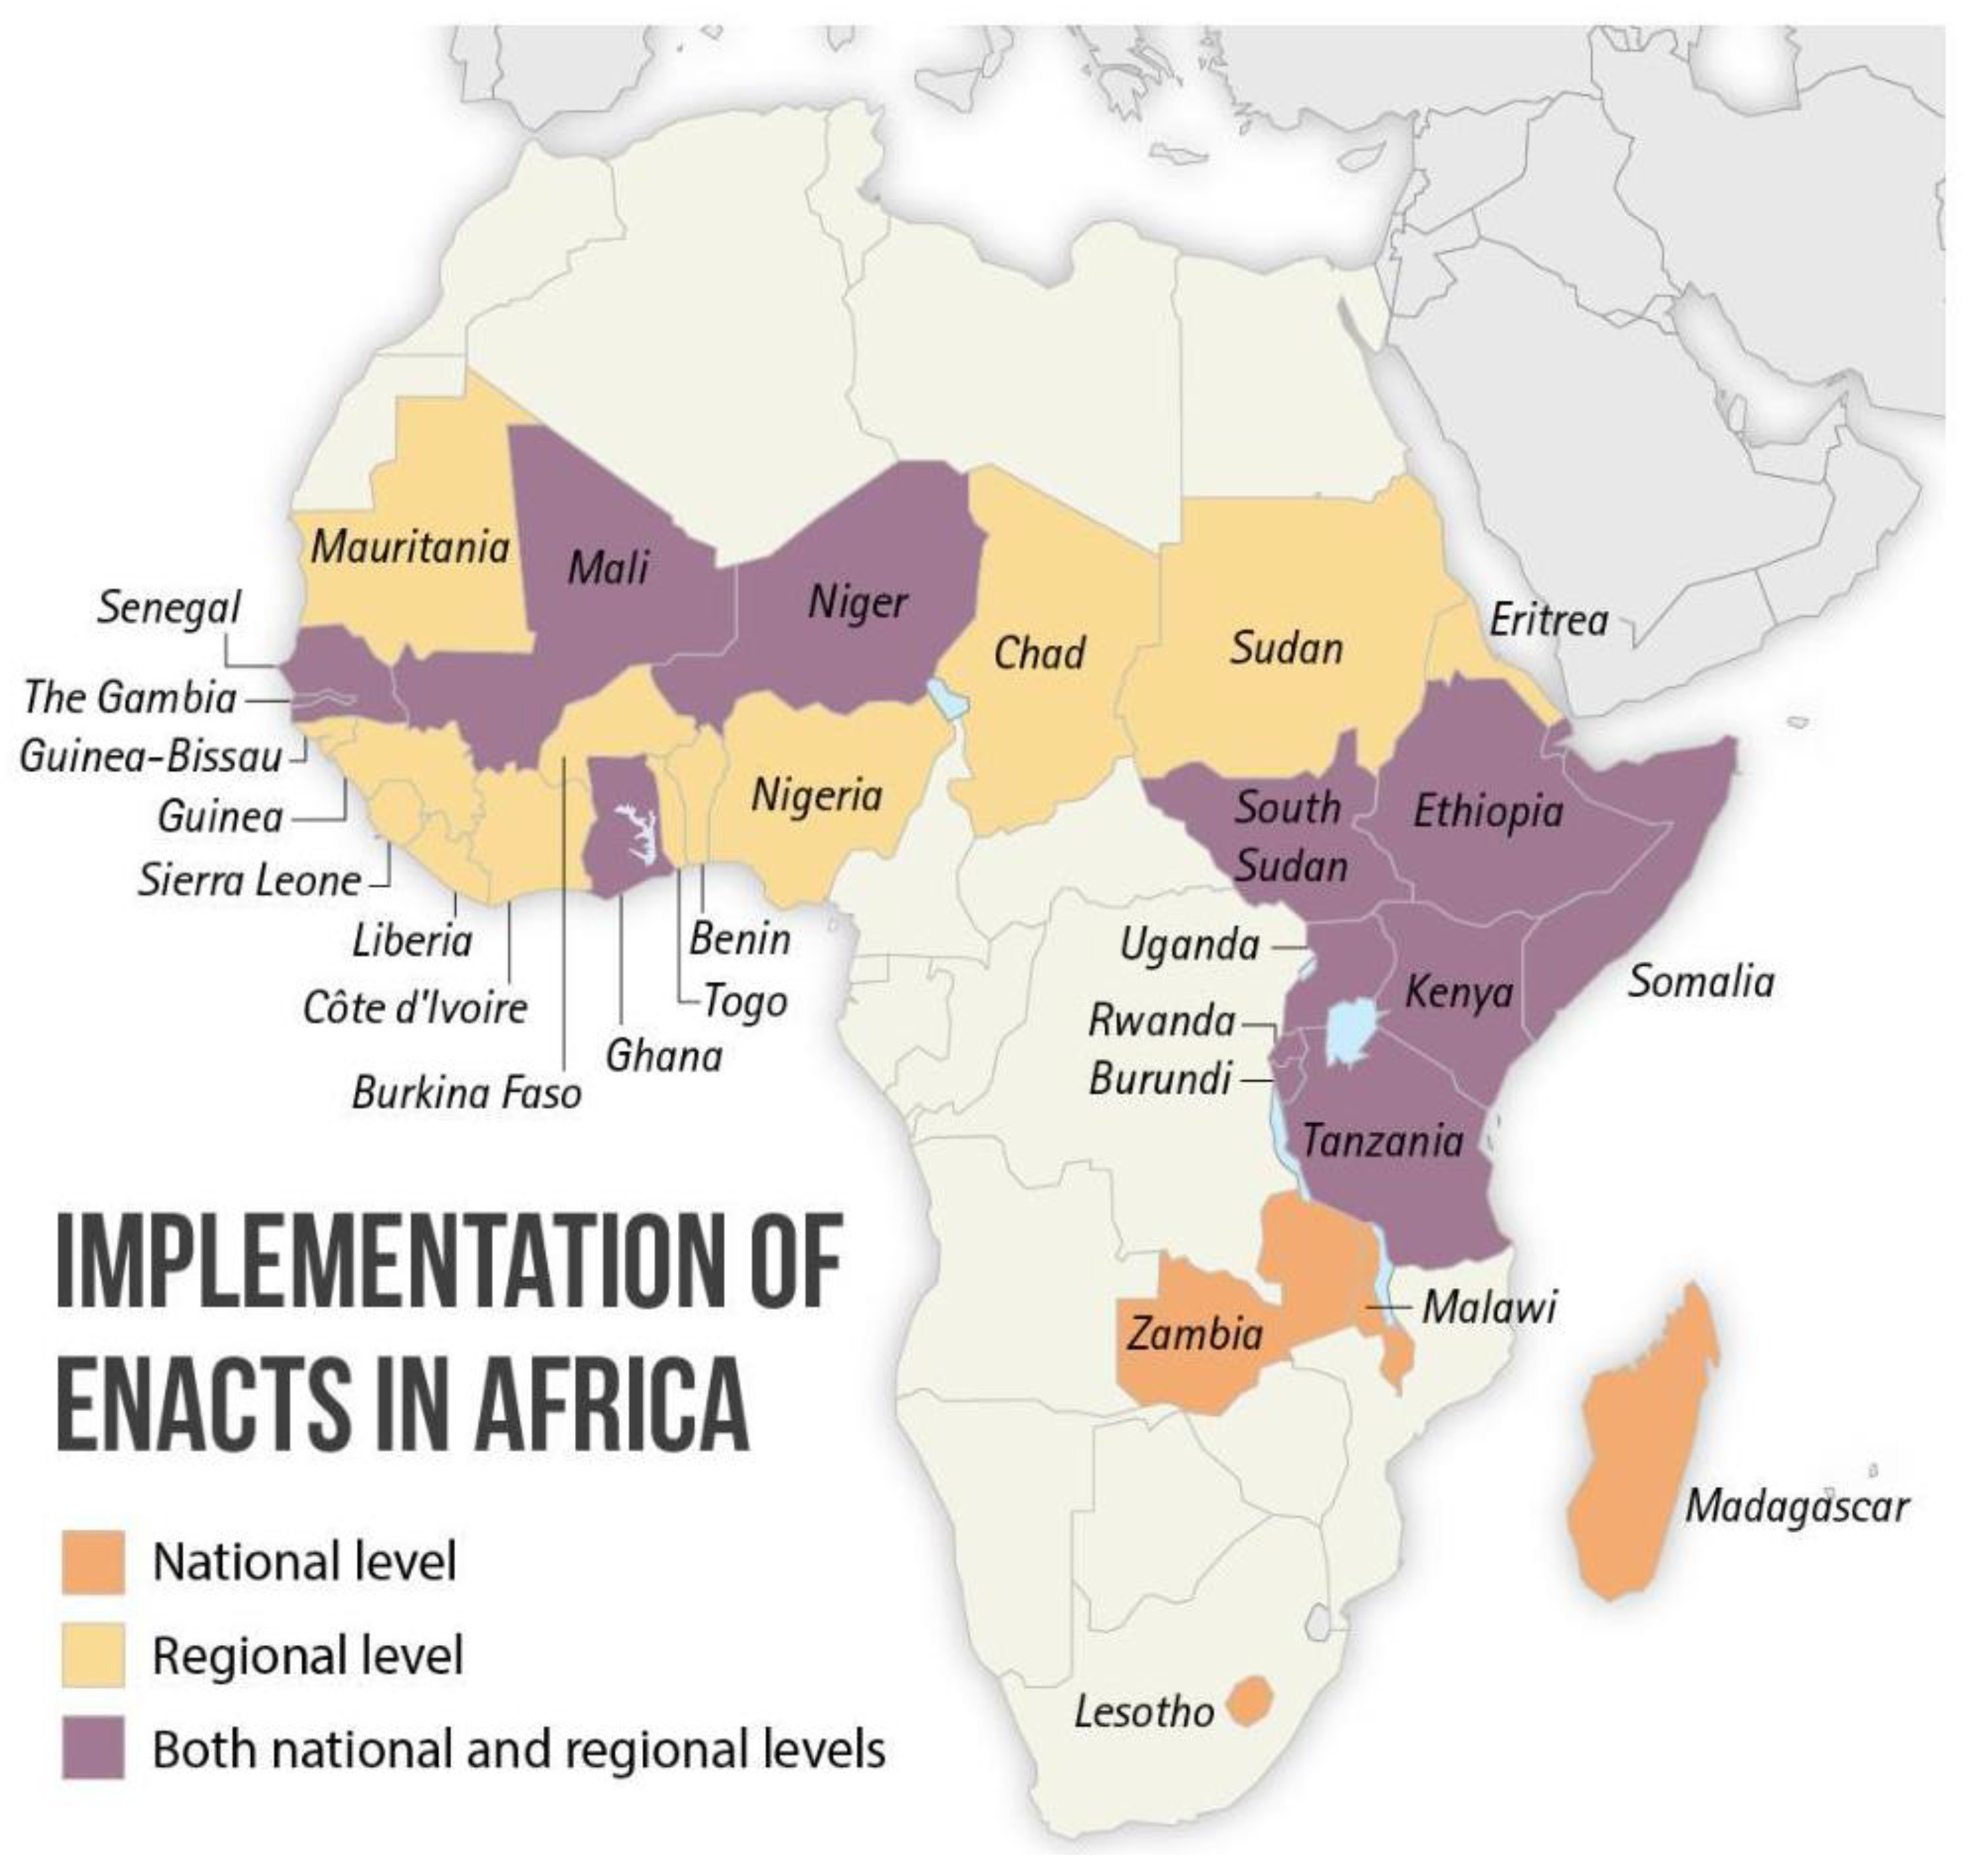
Figure 3.
Comparison of ENACTS data with CMIP6 models for rainfall patterns over the period 1995–2014. (a) Annual cycle of rainfall (in mm), showing the monthly distribution and peak rainfall during the core rainy season. (b) Interannual variability of annual rainfall totals (in mm), illustrating the year-to-year fluctuations captured by ENACTS and various CMIP6 models. The analysis highlights differences in model performance in reproducing observed seasonal and interannual rainfall dynamics.
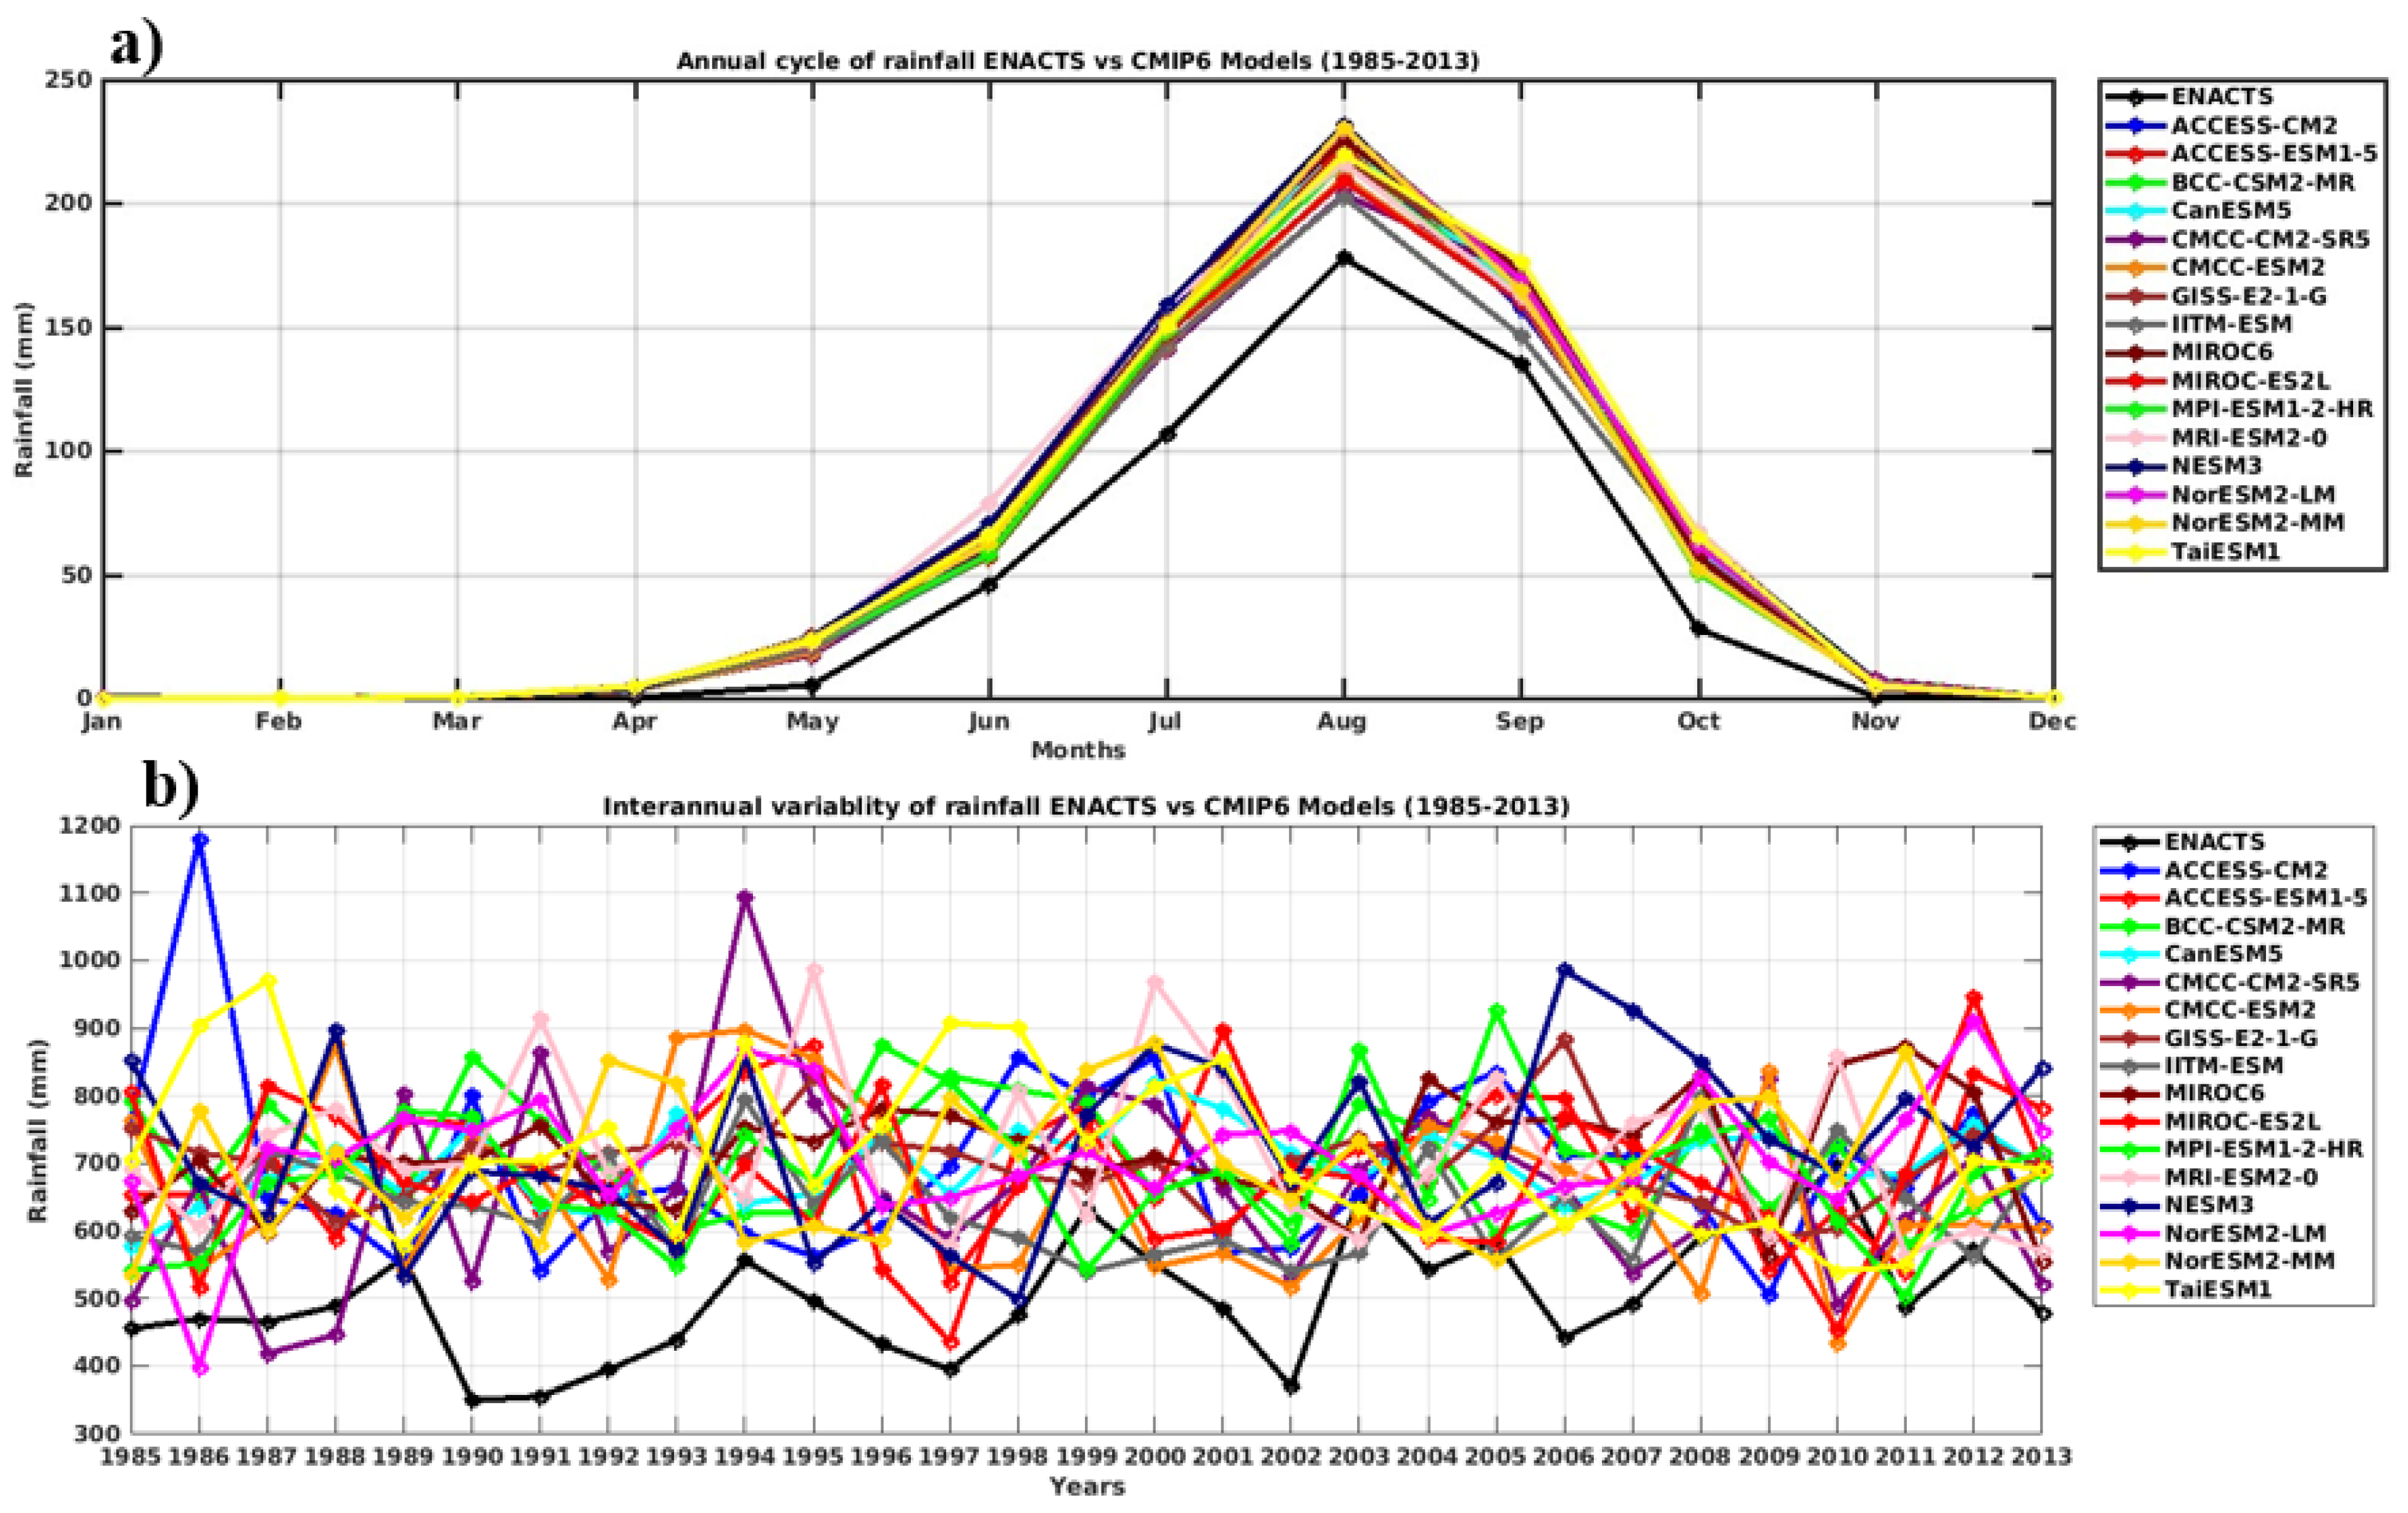
Figure 4.
Mean JJAS (June–September) rainfall (in mm) over Senegal during the historical period 1995–2014. Panel (a) shows observations from the ENACTS dataset, while panels (b–o) display simulations from 15 individual CMIP6 models. Panel (p) presents the multi-model ensemble mean. Light green and dark green contours highlight the agro-planning zones of the Senegal River Valley and the Casamance region, respectively. This comparison illustrates the spatial distribution and variability of rainfall across models and against observed data.
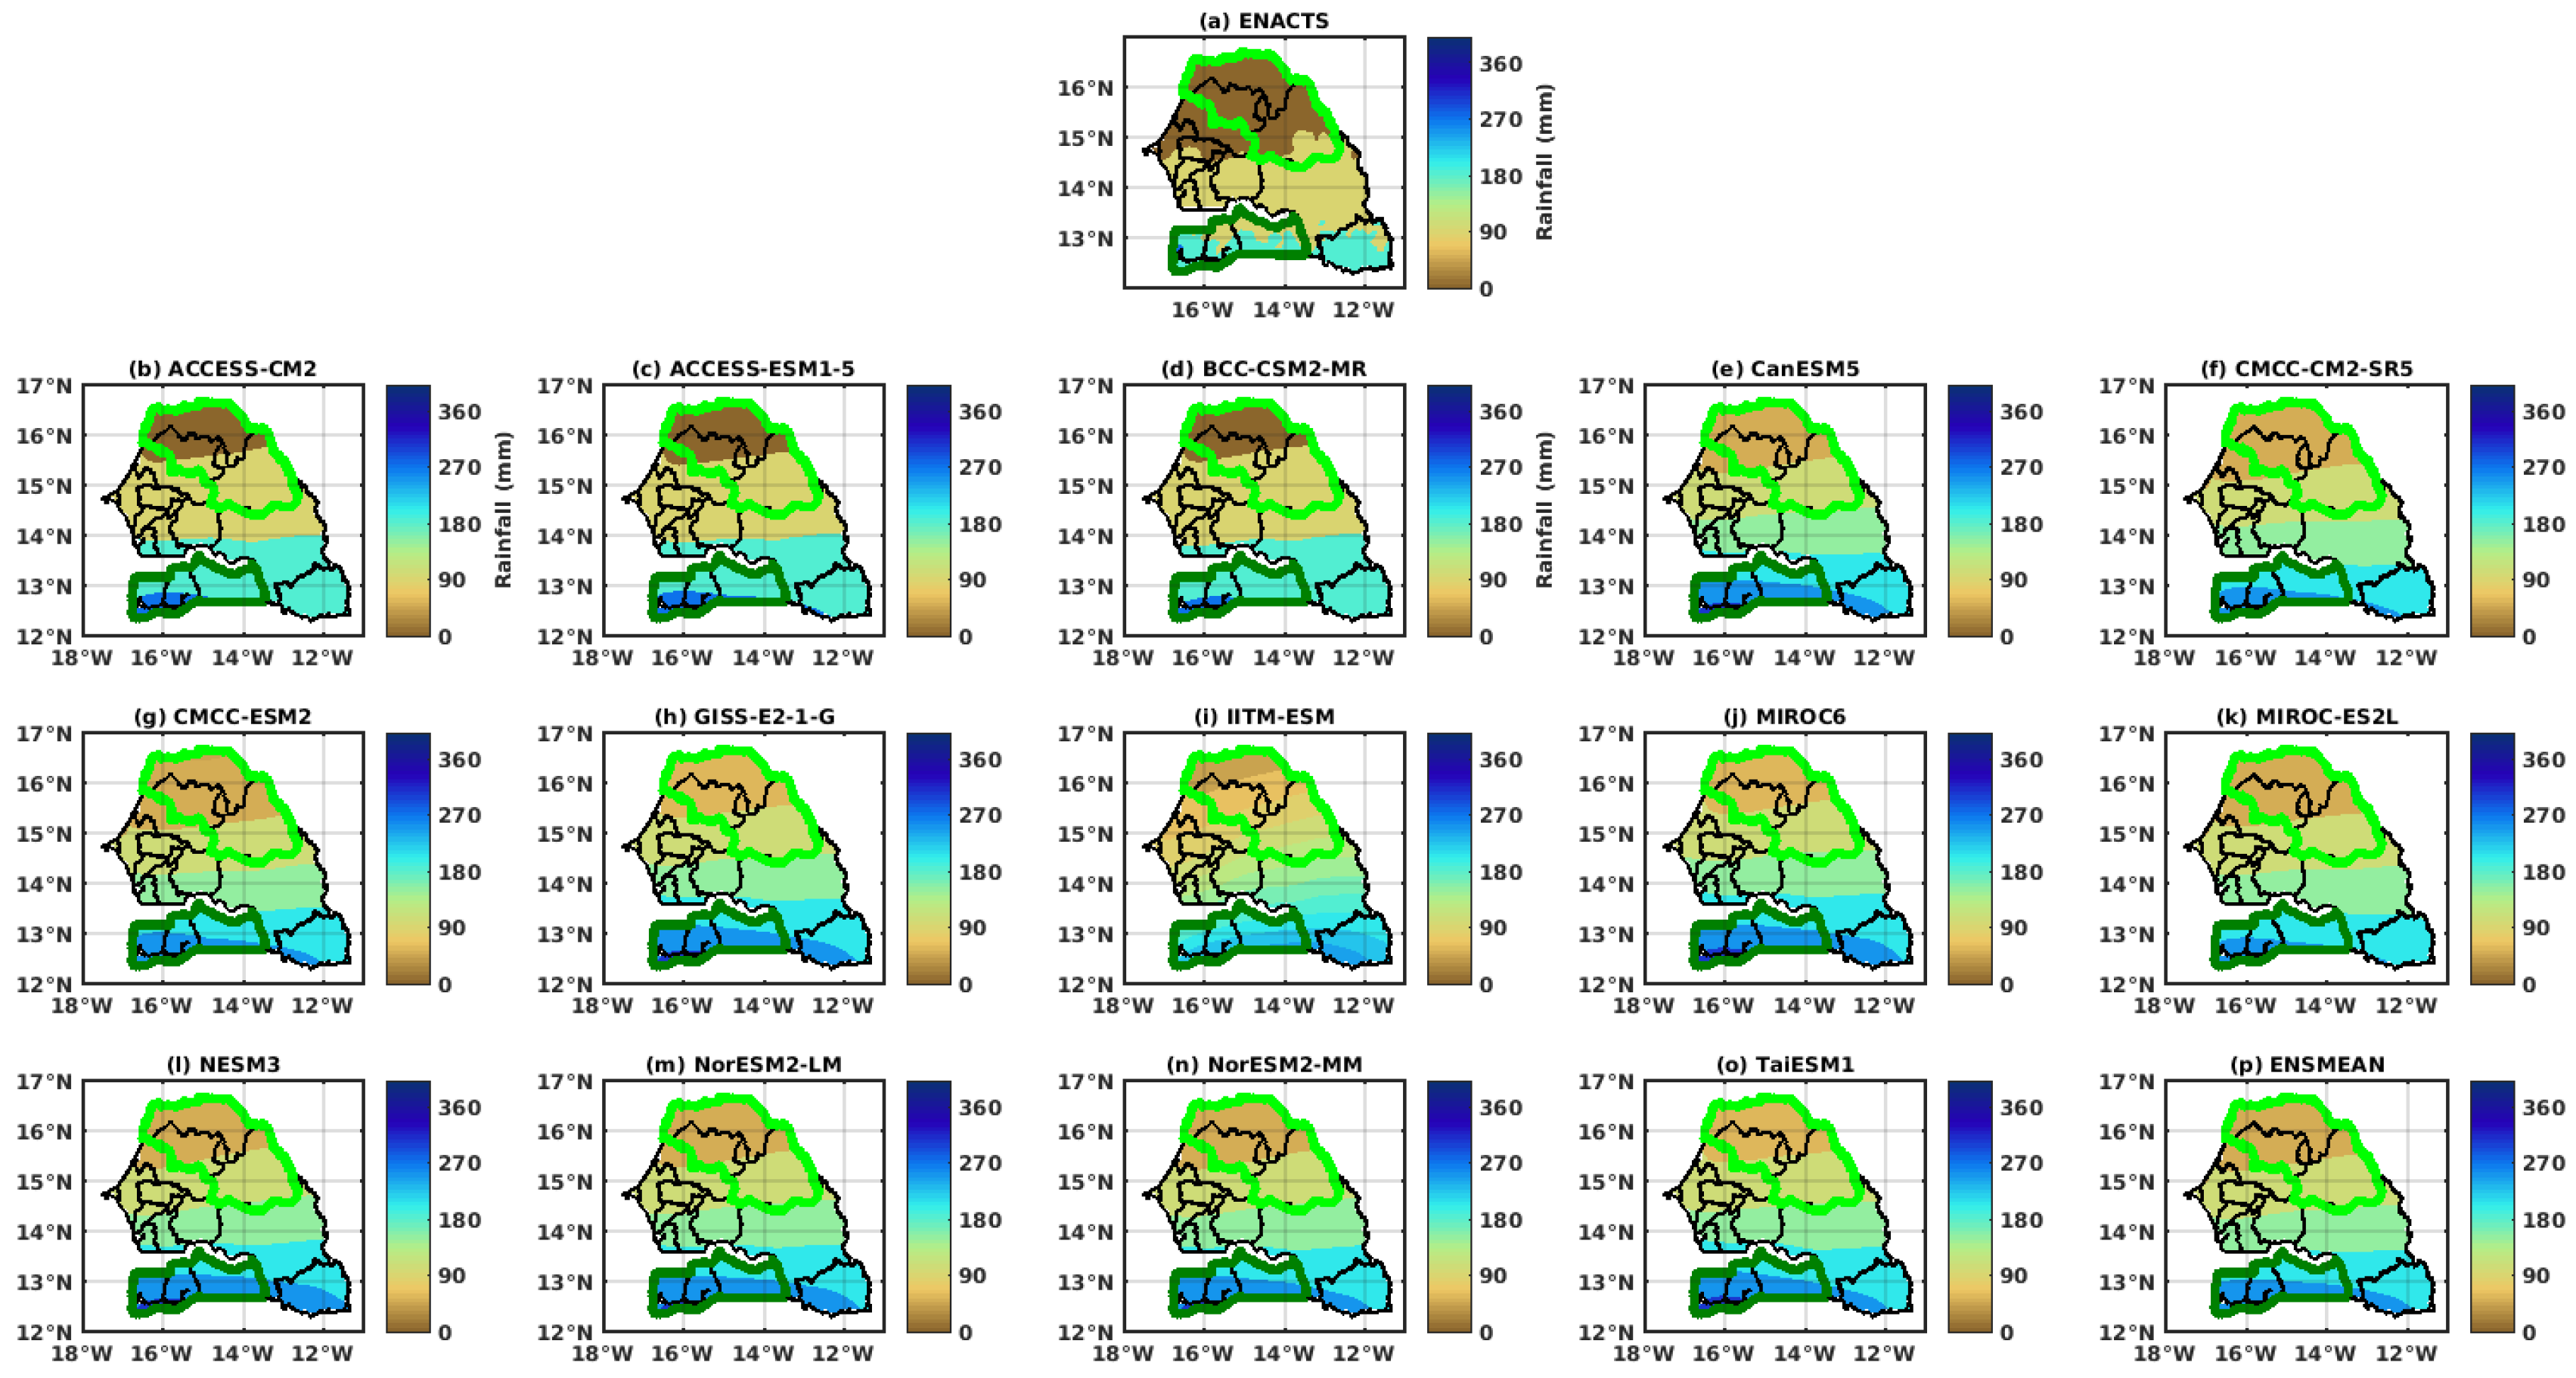
Figure 5.
Taylor diagram summarizing the performance of 15 CMIP6 models in simulating rainfall over Senegal compared to ENACTS observations. The diagram displays the spatial correlation coefficient, normalized standard deviation, and centered root mean square error (RMSE) for each model. The black dot represents the multi-model ensemble mean (ENSMEAN), and each colored point corresponds to an individual model. Models closer to the reference point (1 on the x-axis, standard deviation = 1) exhibit better agreement with observations.
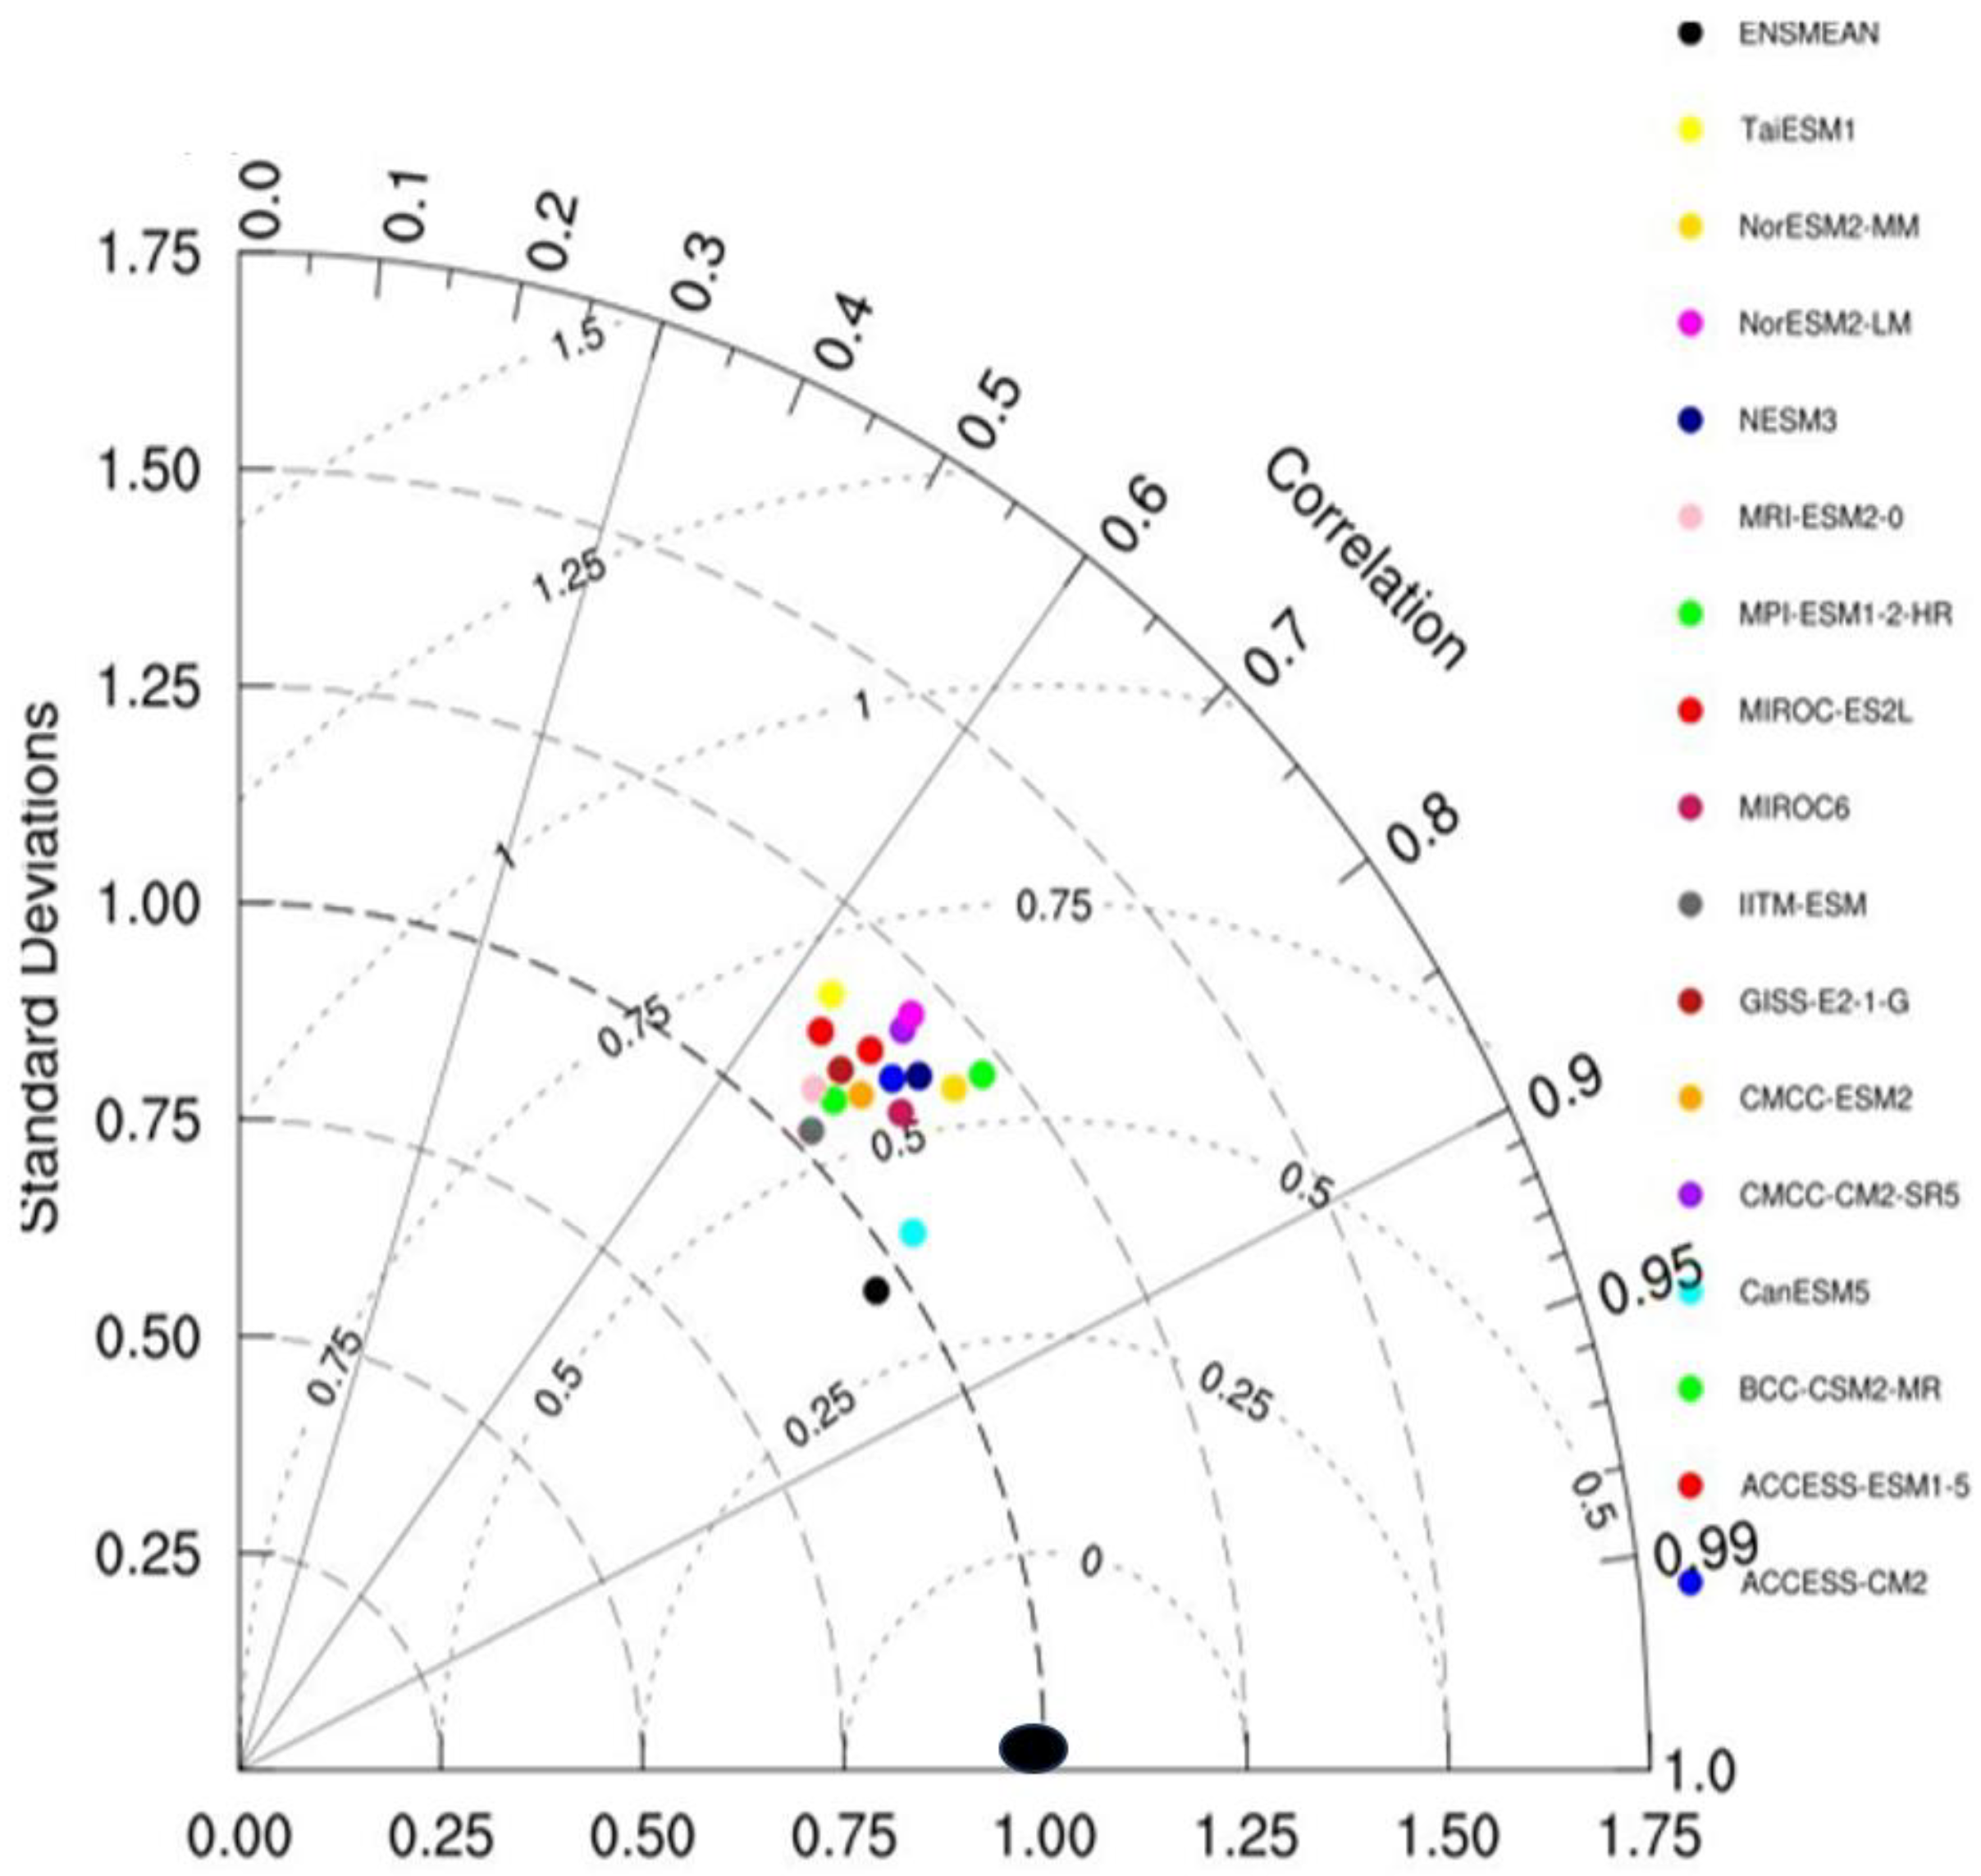
Figure 6.
Spatial distribution of rainfall indices over Senegal for the historical period (1995–2014) during the JJAS (June–September) season. Each panel represents different rainfall-related indices, including dry and wet spell durations, precipitation extremes, and total rainfall. The light green and dark green contours delineate the planning zones of the Senegal River Valley and the Casamance region, respectively.
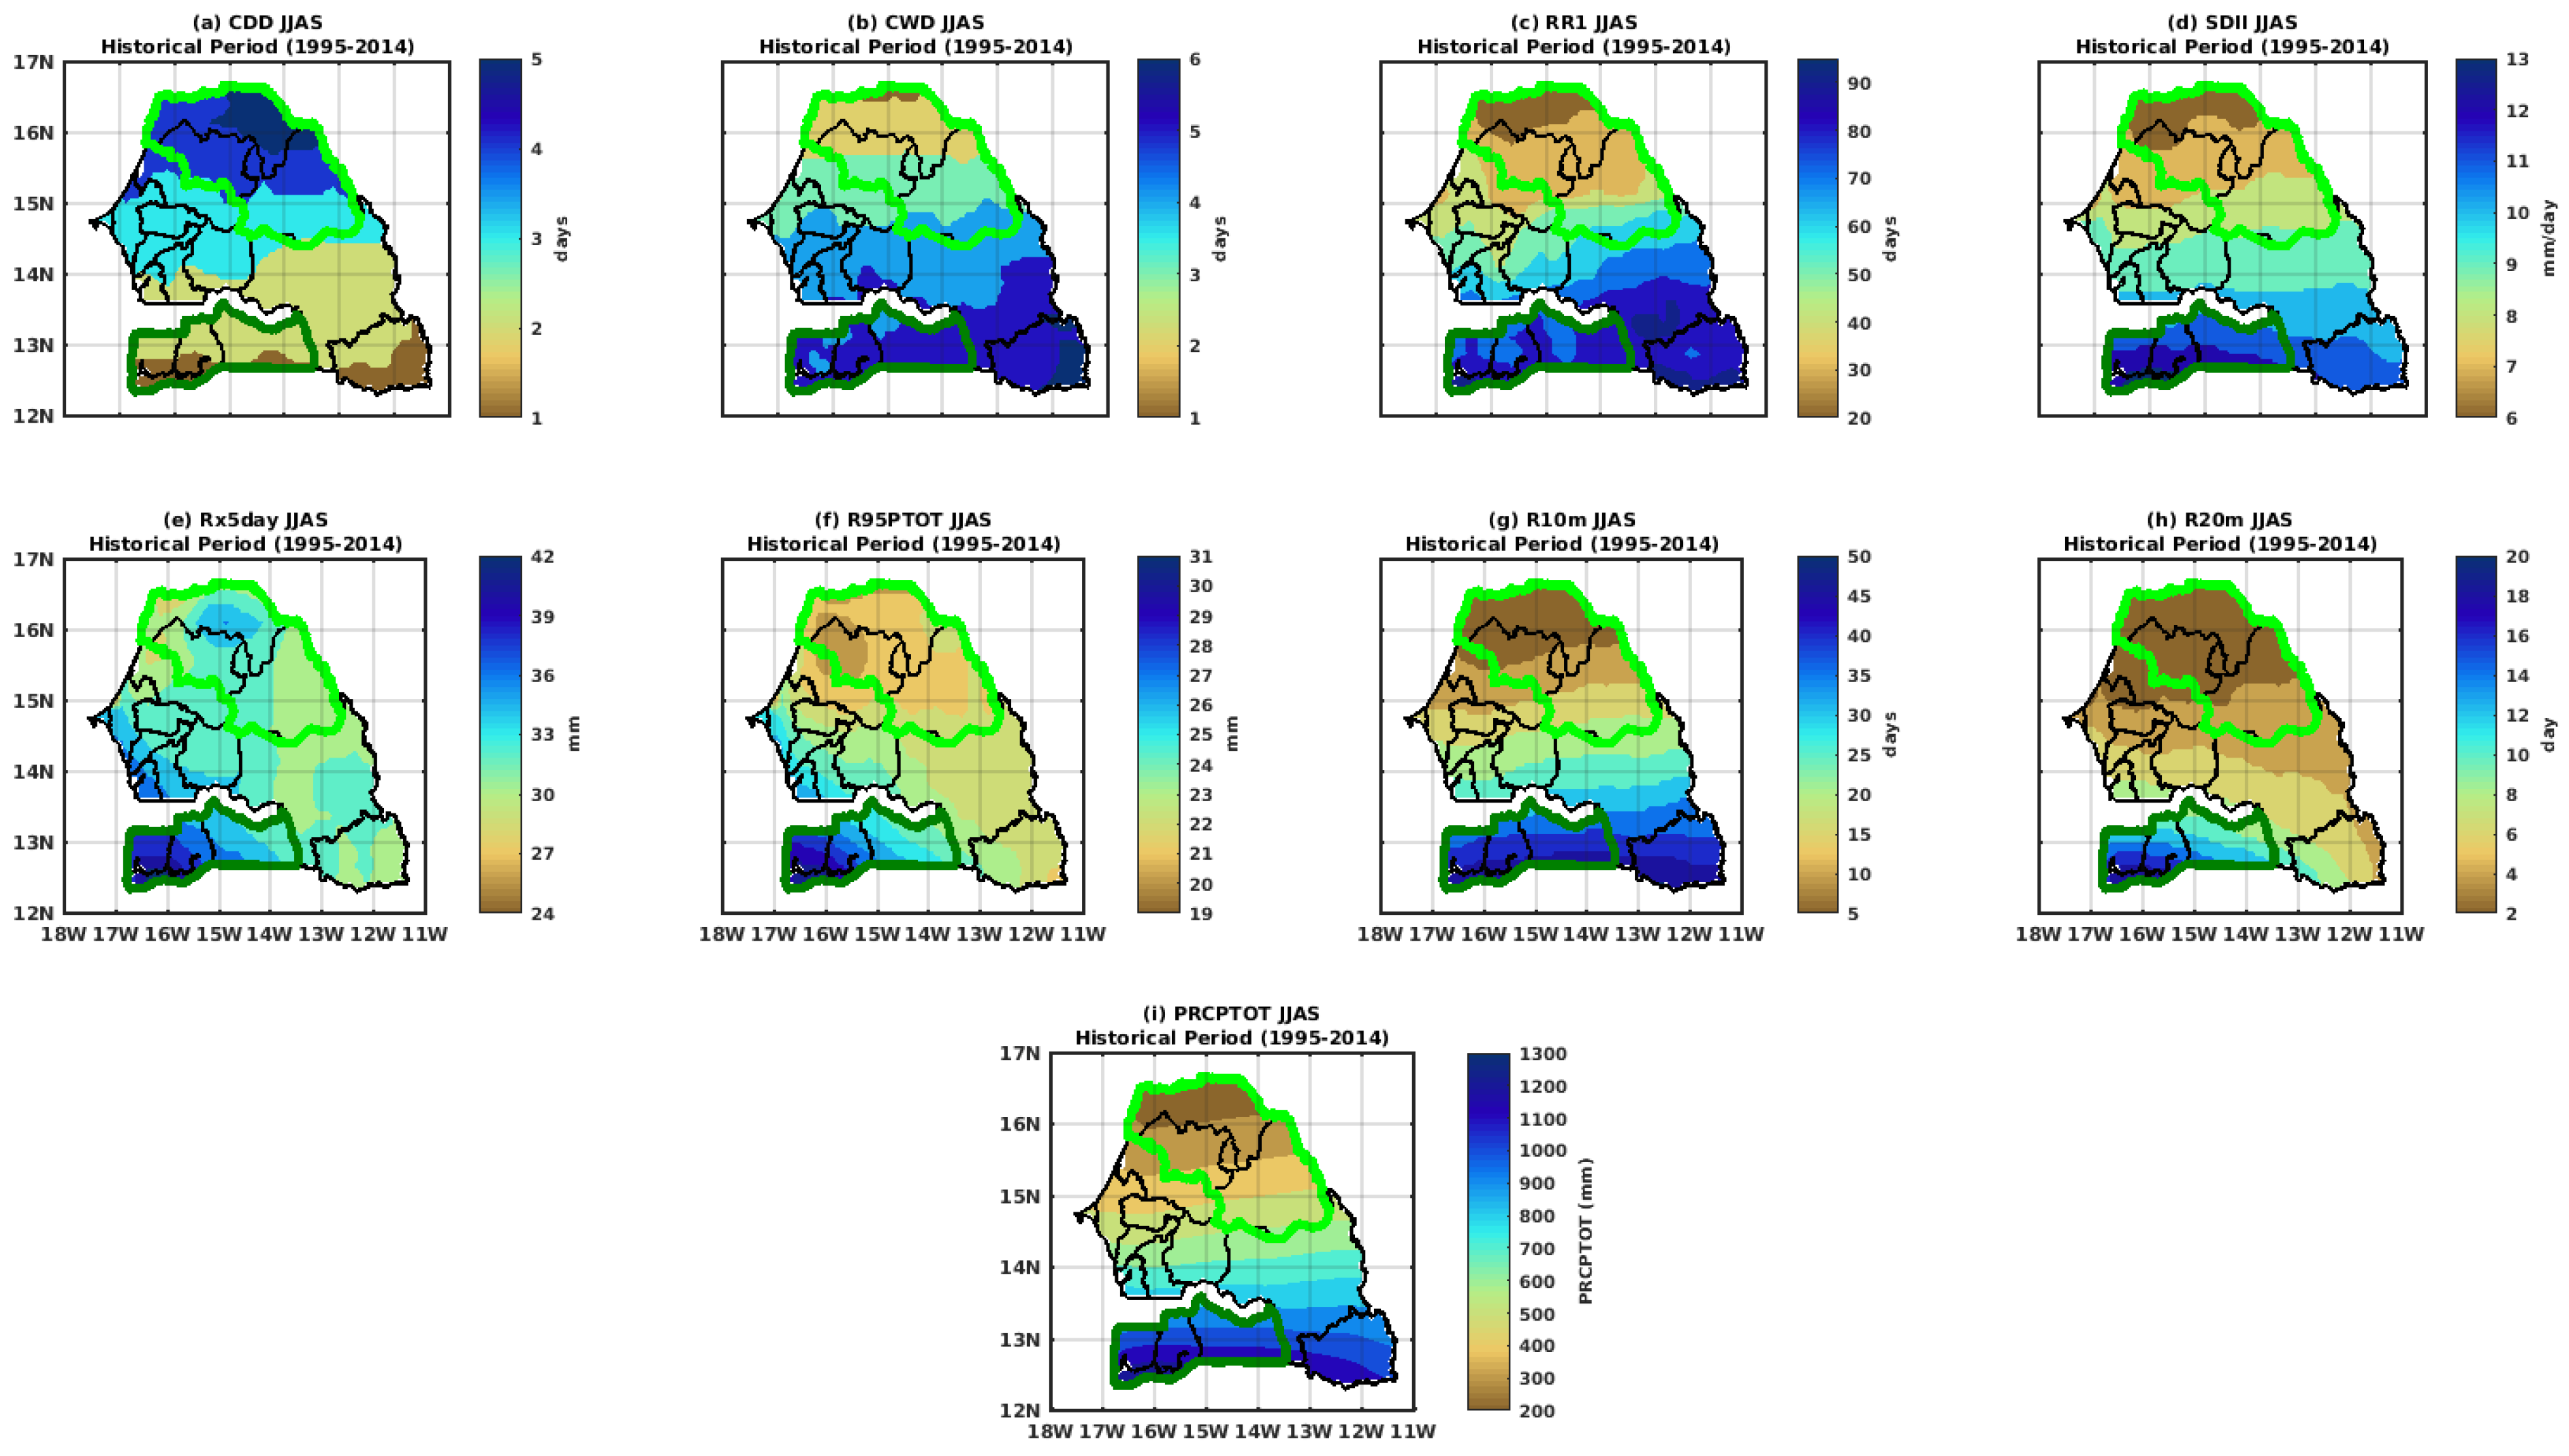
Figure 7.
Projected spatial distribution of rainfall indices over Senegal for the near-future period (2021–2040) during the JJAS (June–September) season under the CMIP6 SSP2-4.5 scenario. The panels represent different rainfall indices, including dry and wet spell duration, precipitation extremes, and total rainfall. The light green and dark green contours delineate the planning zones of the Senegal River Valley and the Casamance region, respectively.
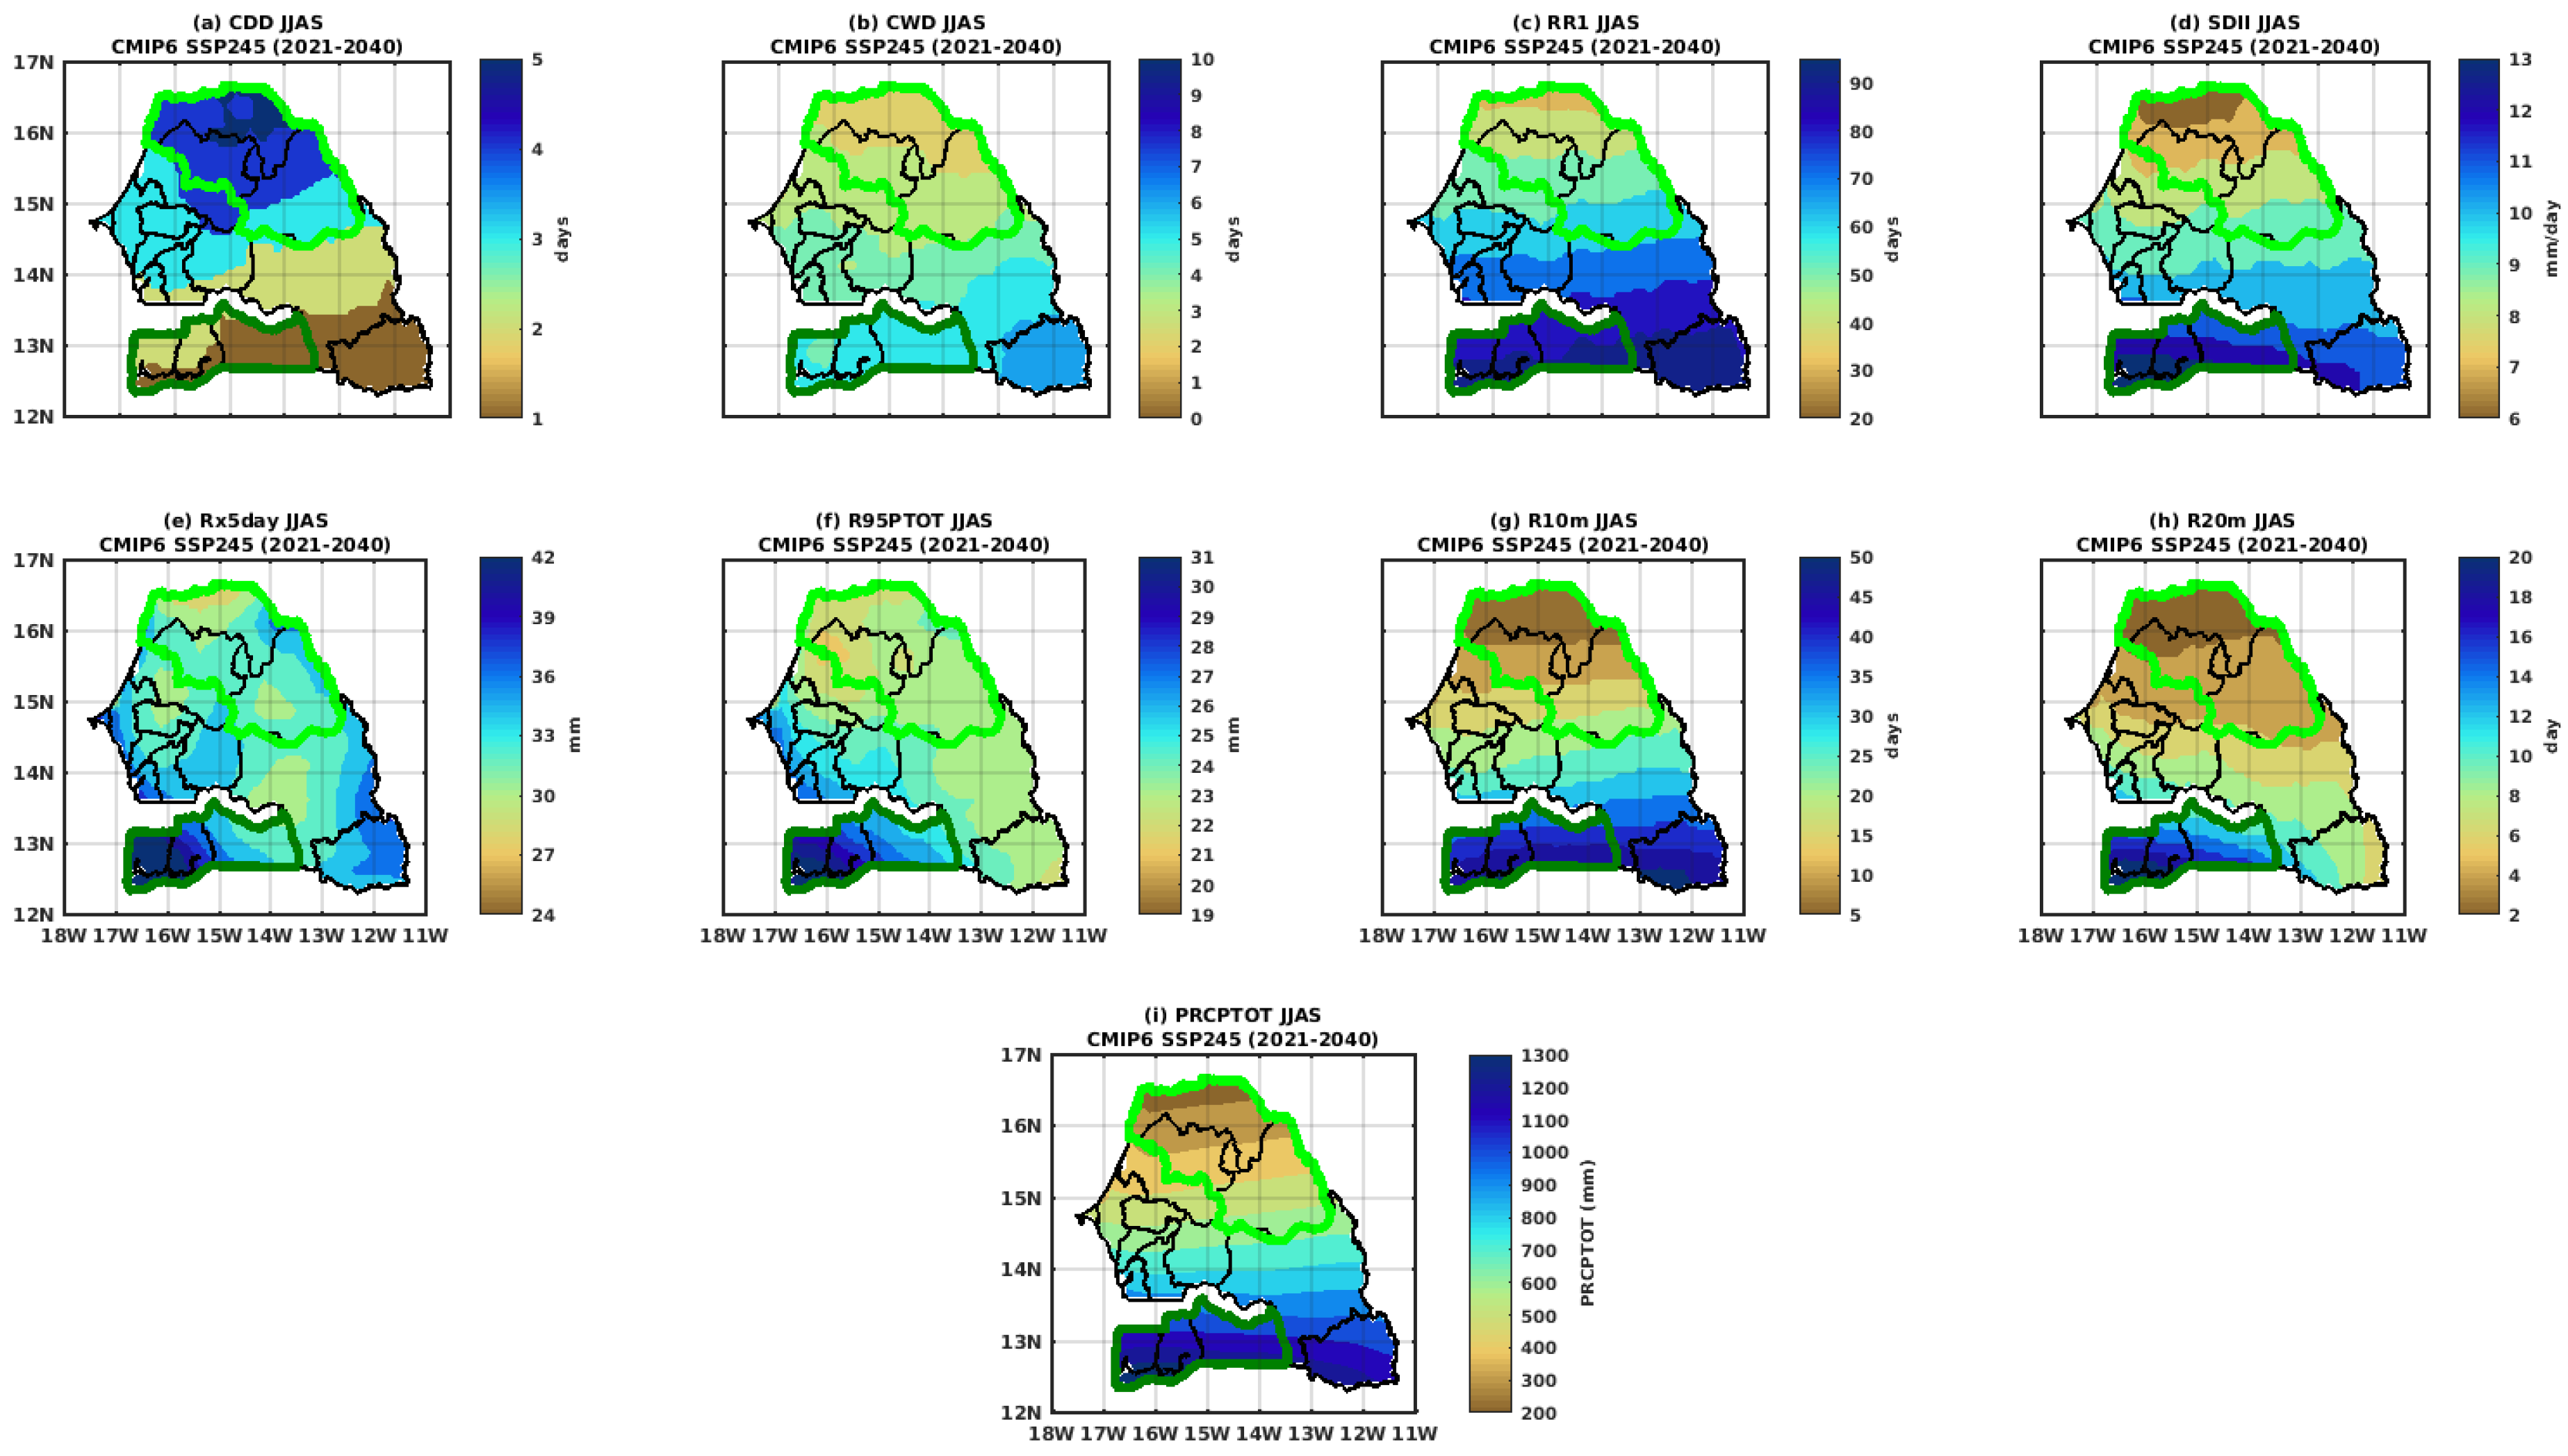
Figure 8.
Projected spatial distribution of rainfall indices over Senegal for the near-future period (2021–2040) during the JJAS (June–September) season under the CMIP6 SSP2-4.5 scenario. The panels represent different rainfall indices, including dry and wet spell duration, precipitation extremes, and total rainfall. The light green and dark green contours delineate the planning zones of the Senegal River Valley and the Casamance region, respectively.
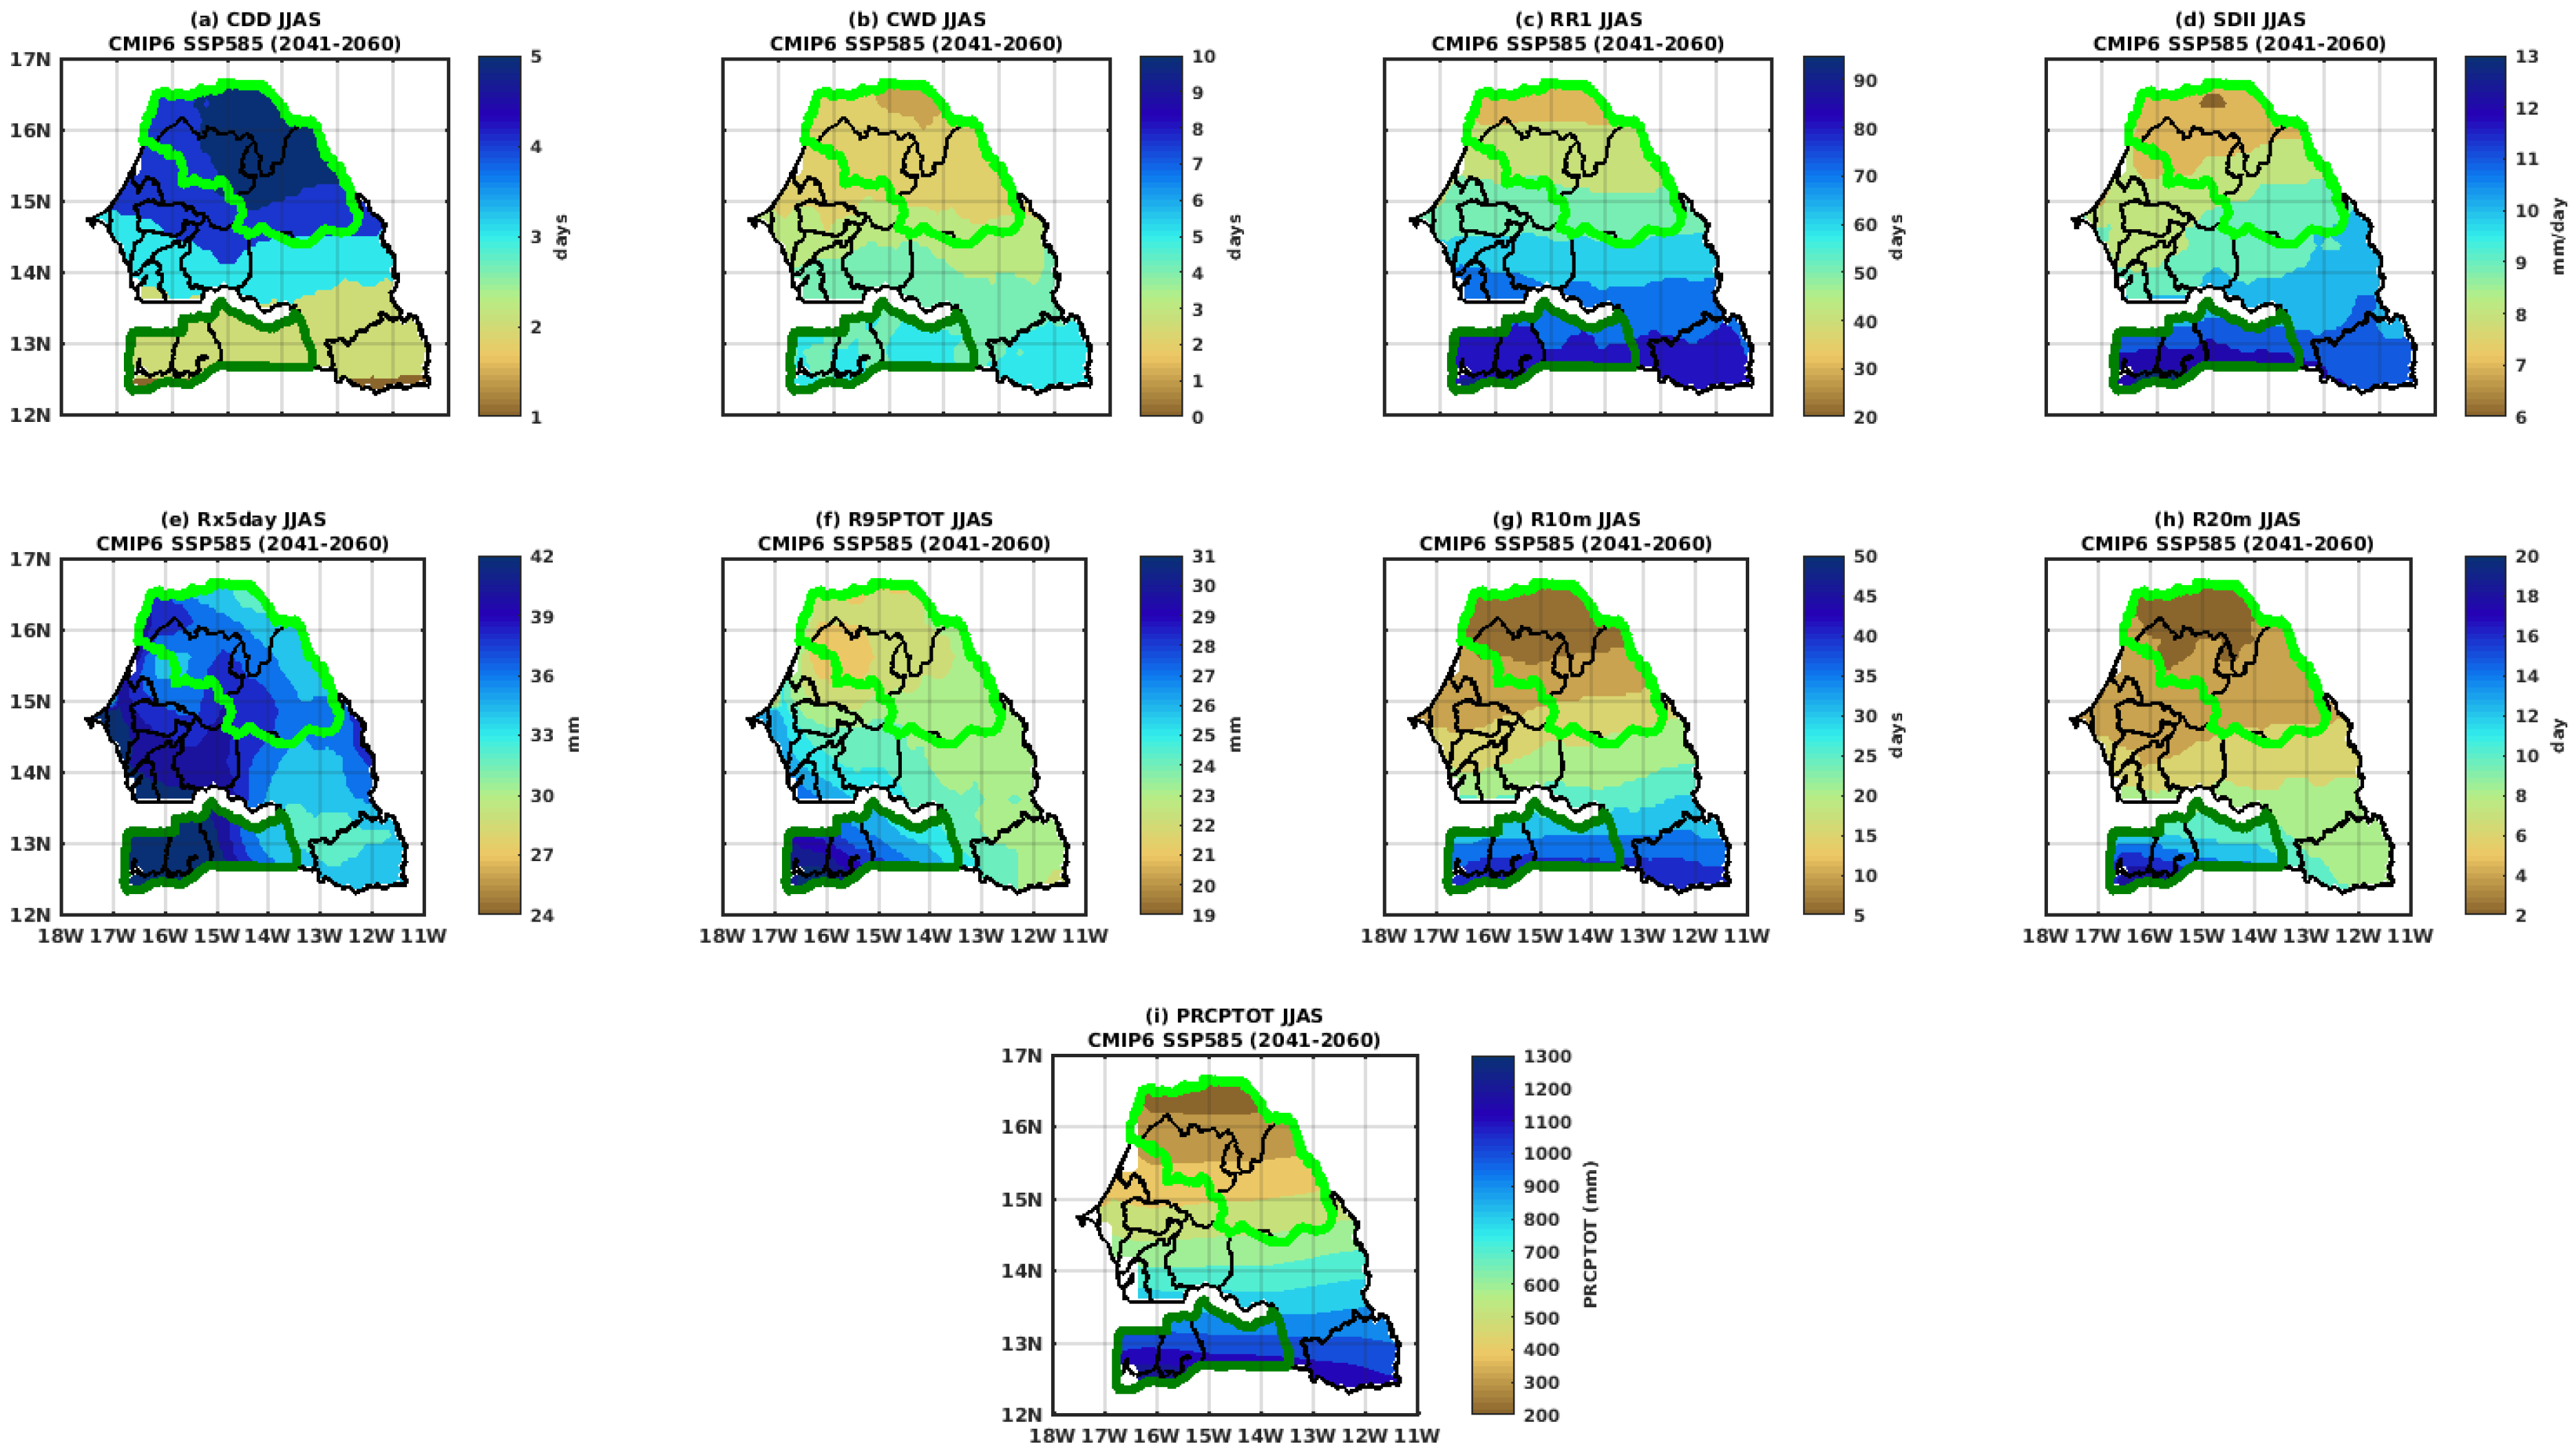
Figure 9.
Spatial distribution of changes (%) in rainfall indices over Senegal for the near future period (2021–2040) relative to the historical baseline (1995–2014), under the CMIP6 SSP585 scenario during the JJAS season. Panels illustrate projected changes in: (a) CDD, (b) CWD, (c) RR1, (d) SDII, (e) Rx5day, (f) R95pTOT, (g) R10mm, (h) R20mm, and (i) PRCPTOT. The light green and dark green contours delineate the planning zones of the Senegal River Valley and the Casamance region, respectively.
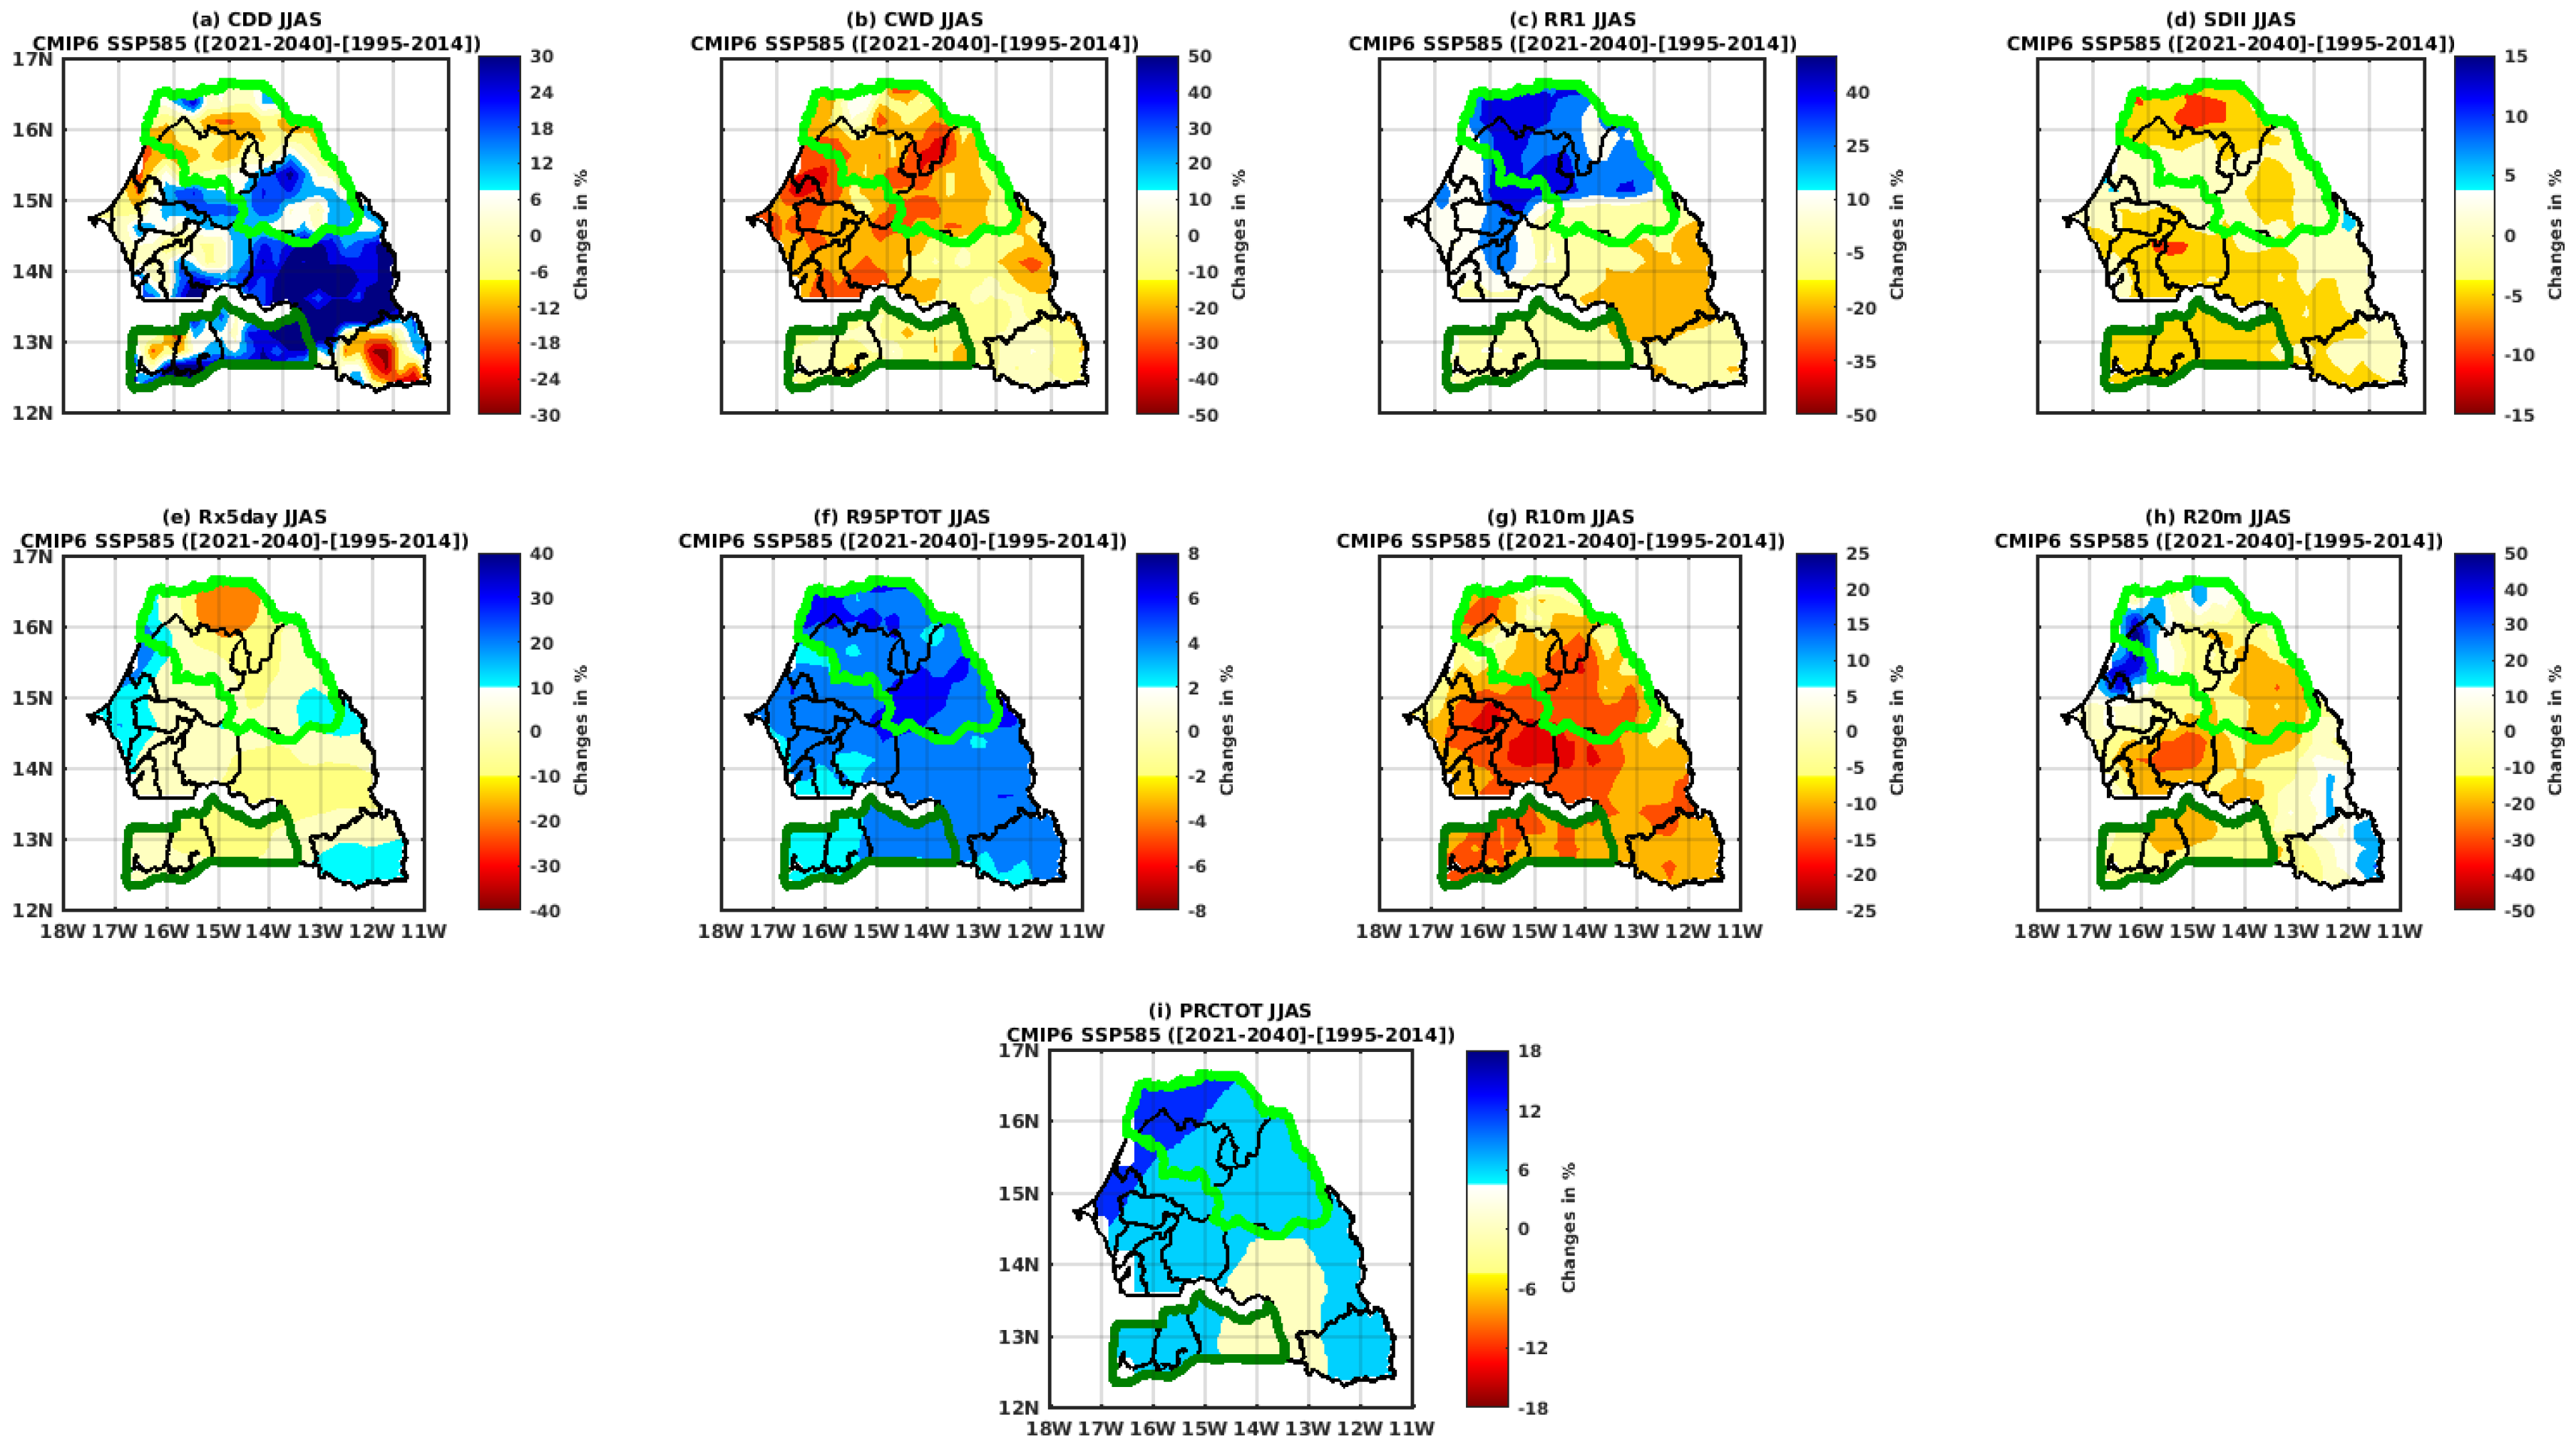
Figure 10.
Spatial distribution of changes (%) in rainfall indices over Senegal for the distant future period (2041–2060) relative to the historical baseline (1995–2014), under the CMIP6 SSP585 scenario during the JJAS season. Panels illustrate projected changes in: (a) CDD, (b) CWD, (c) RR1, (d) SDII, (e) Rx5day, (f) R95pTOT, (g) R10mm, (h) R20mm, and (i) PRCPTOT. The light green and dark green contours delineate the planning zones of the Senegal River Valley and the Casamance region, respectively.
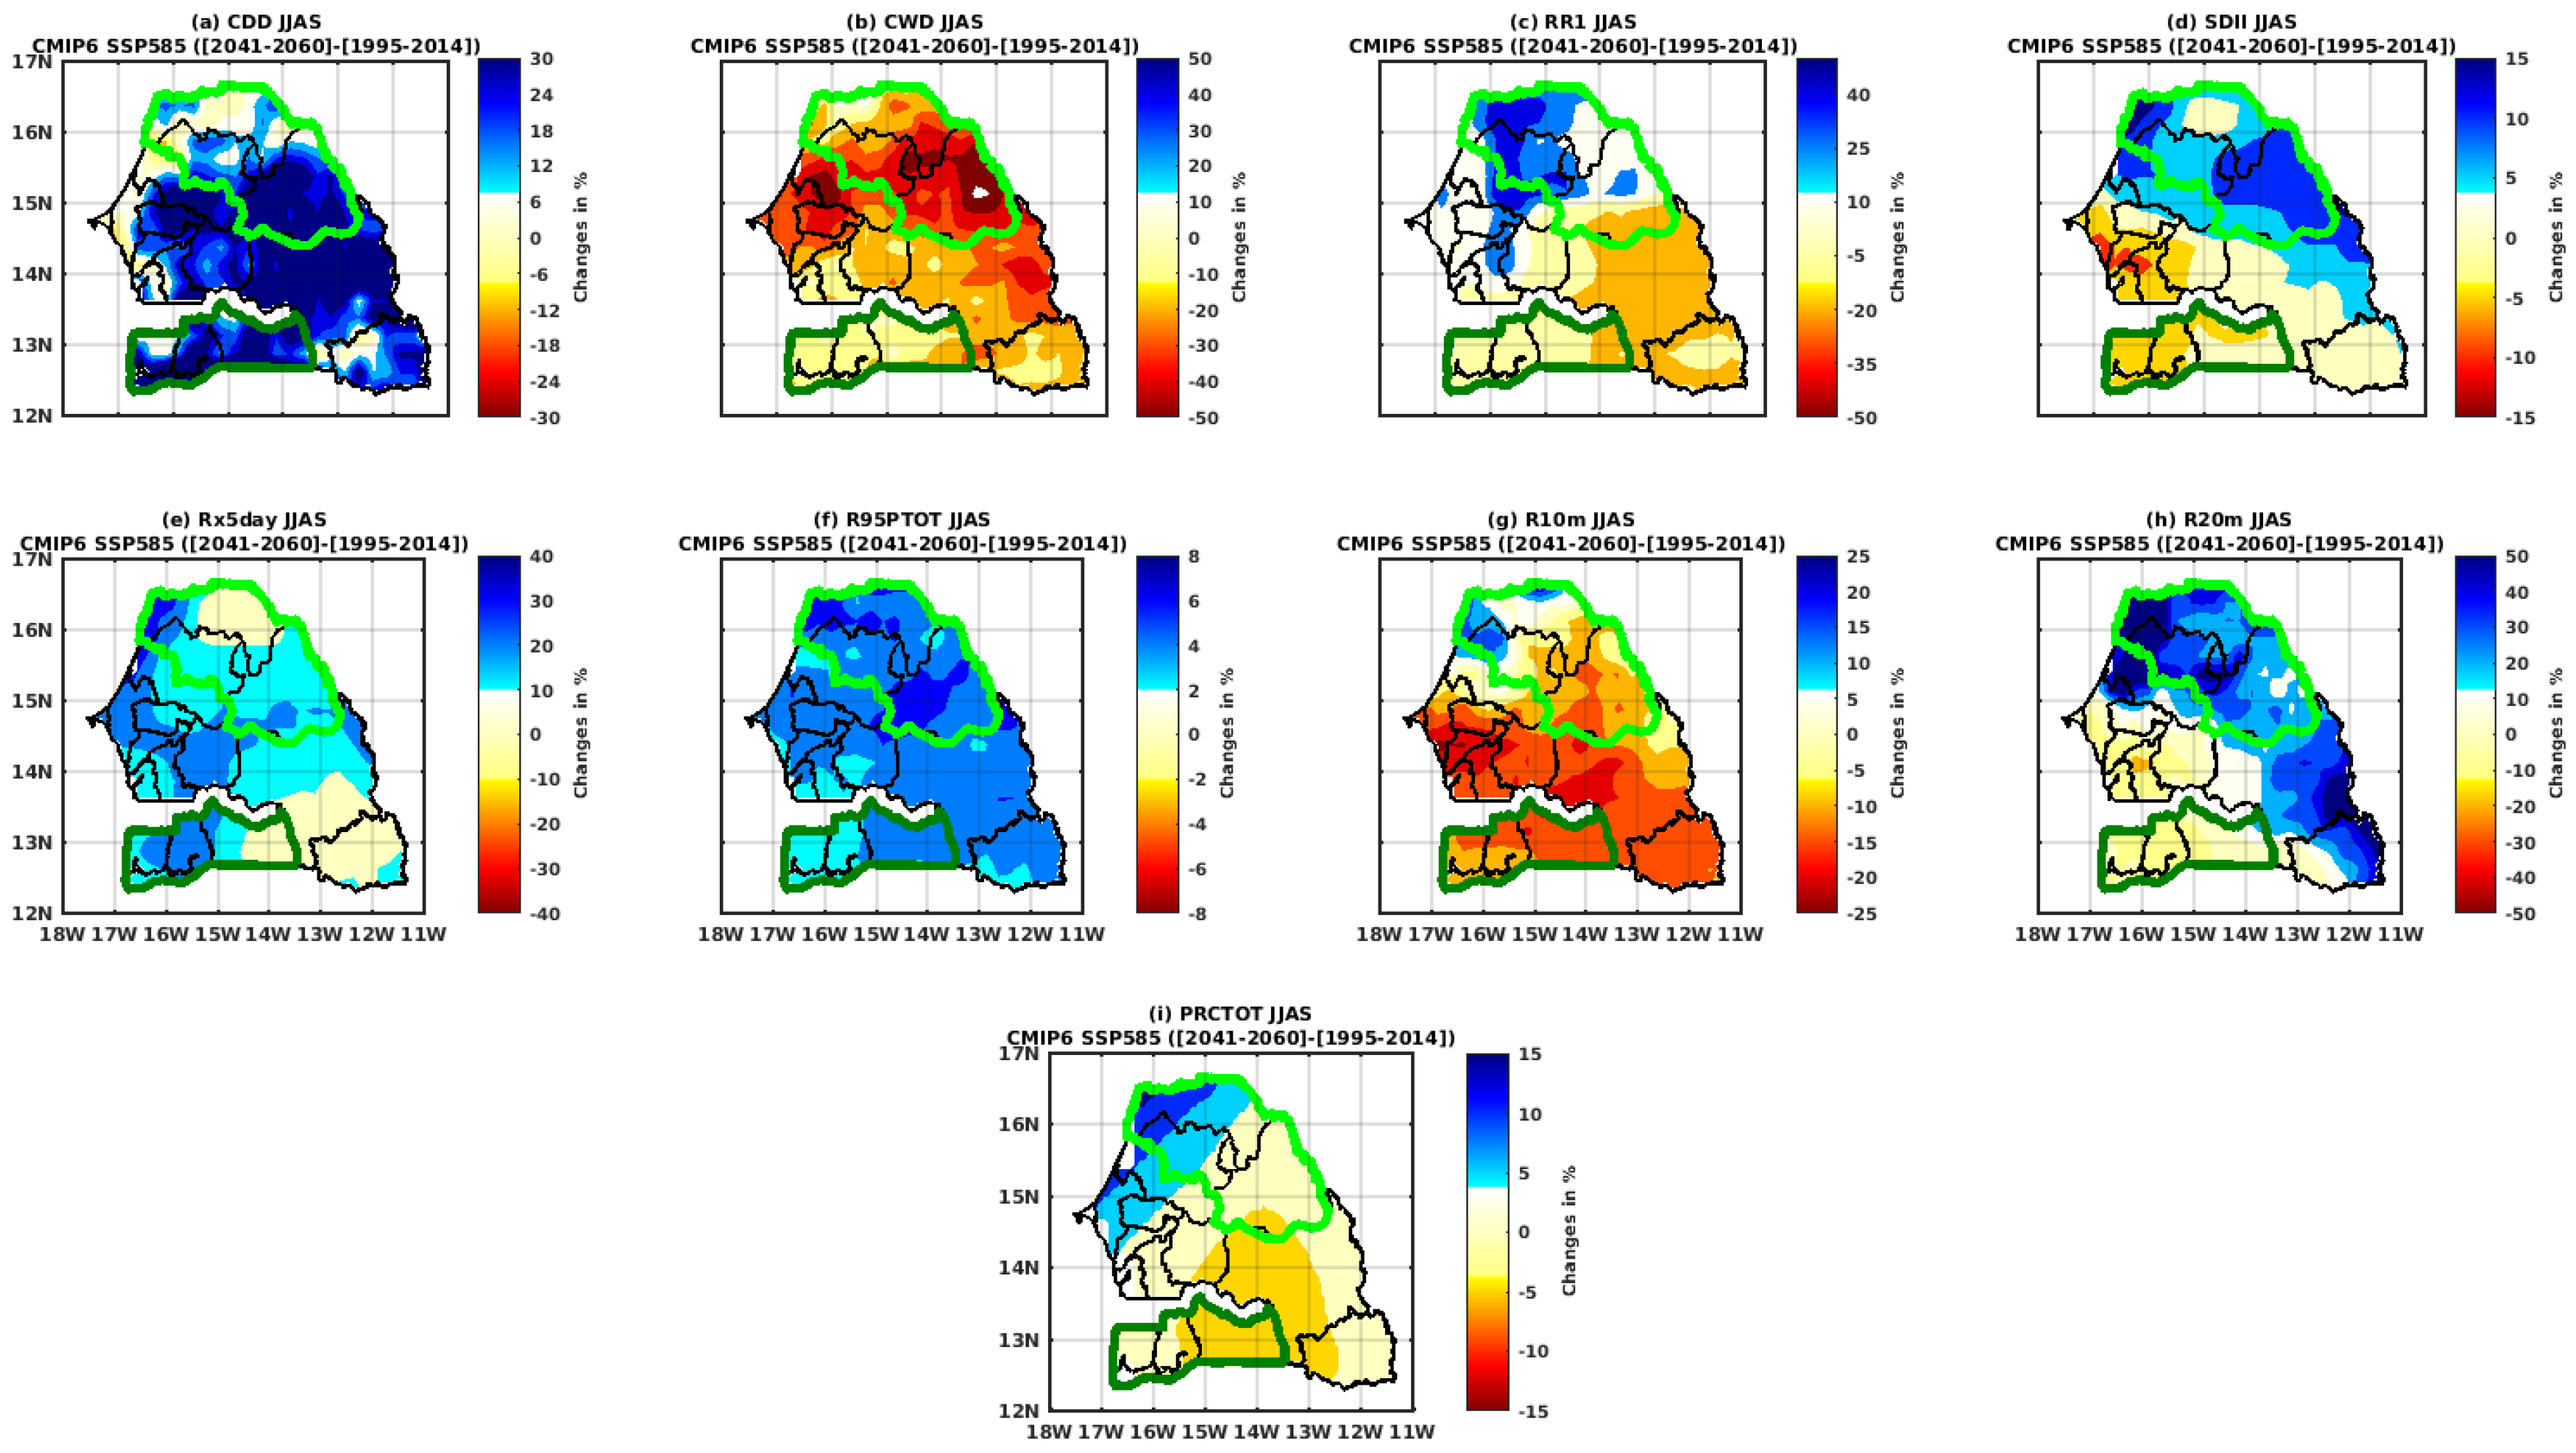
Figure 11.
Time series of anomalies (%) in rainfall indices over Senegal from 1995 to 2100, showing historical values (in blue) and future projections under the SSP585 scenario (in red). The indices include: (a) total precipitation (PRCPTOT), (b) consecutive dry days (CDD), (c) consecutive wet days (CWD), (d) number of heavy precipitation days (R10mm), (e) very heavy precipitation days (R20mm), (f) number of wet days (RR1), (g) maximum 5-day precipitation (Rx5day), and (h) simple daily intensity index (SDII). Anomalies are computed relative to the 1995–2014 baseline.
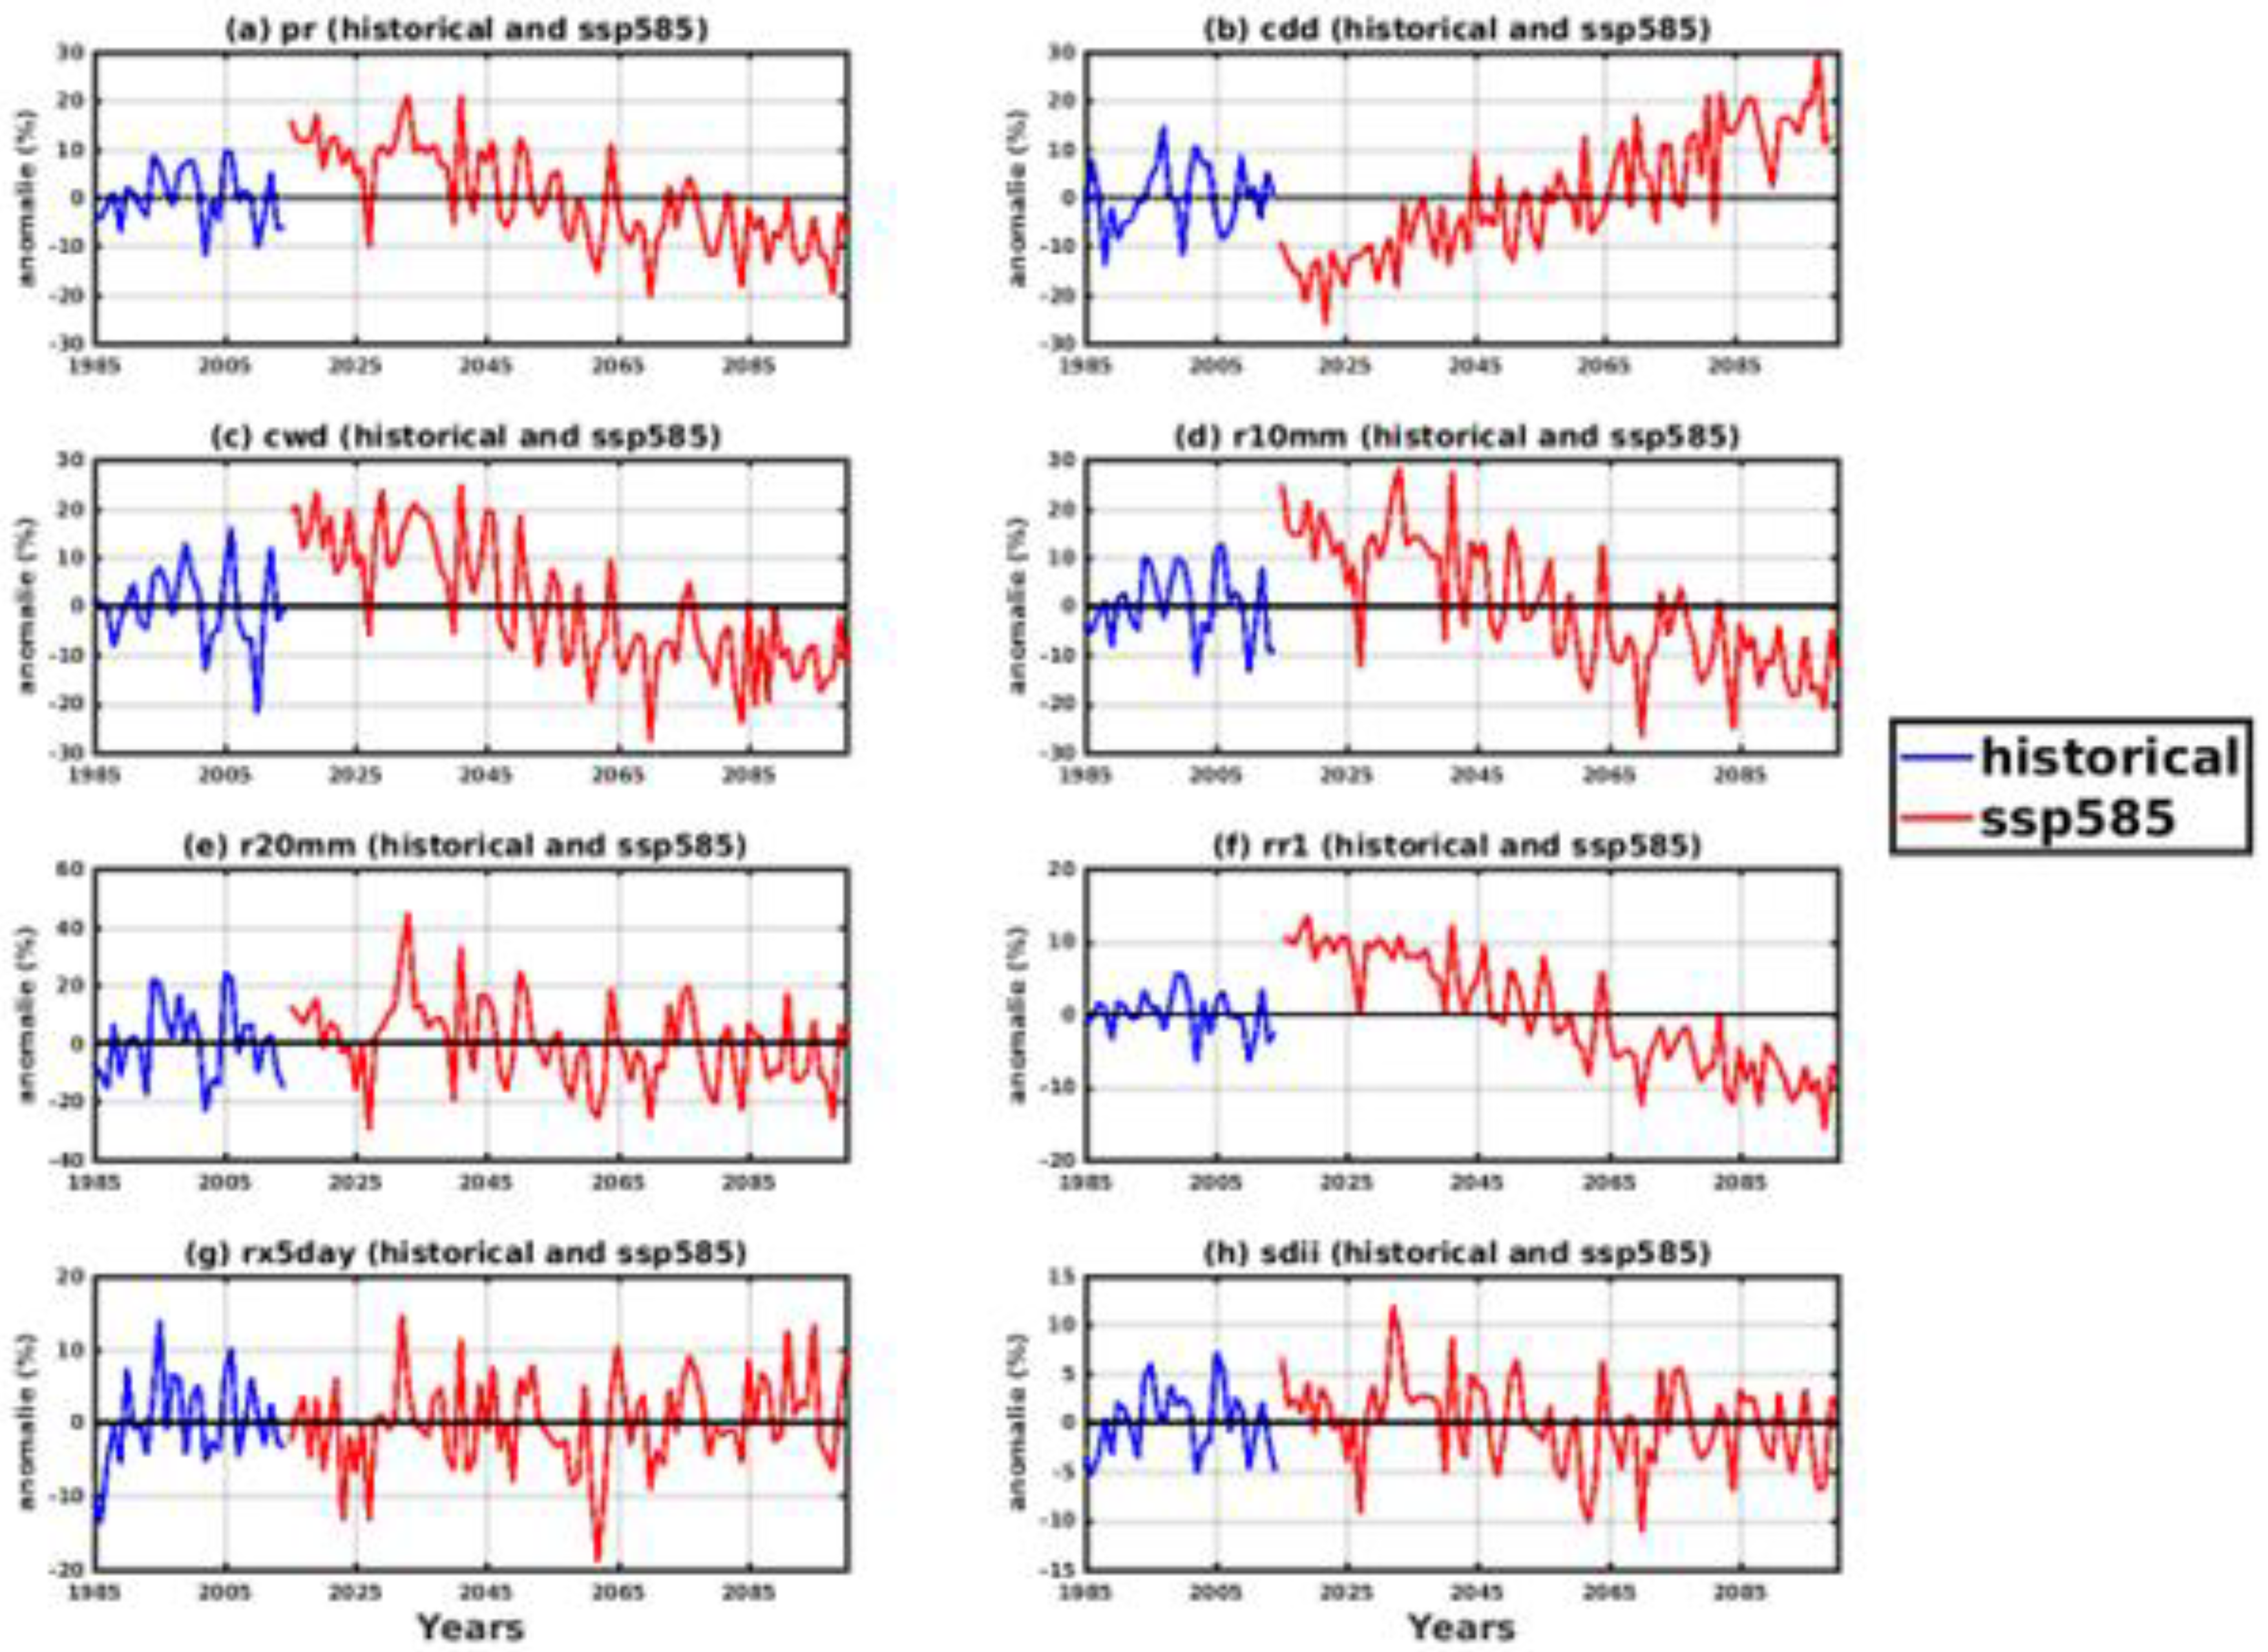
Figure 12.
Interannual trends in annual rainfall over Senegal under the CMIP6 SSP585 scenario for: (a) the near future (2021–2040) and (b) the distant future (2041–2060). Each colored line represents the linear trend from a single climate model. In panel (a), 29% of models show a positive trend and 71% a negative trend. In panel (b), only 14% of models project an increase, while 86% indicate a decrease, reflecting a broad consensus toward drying conditions in future projections.
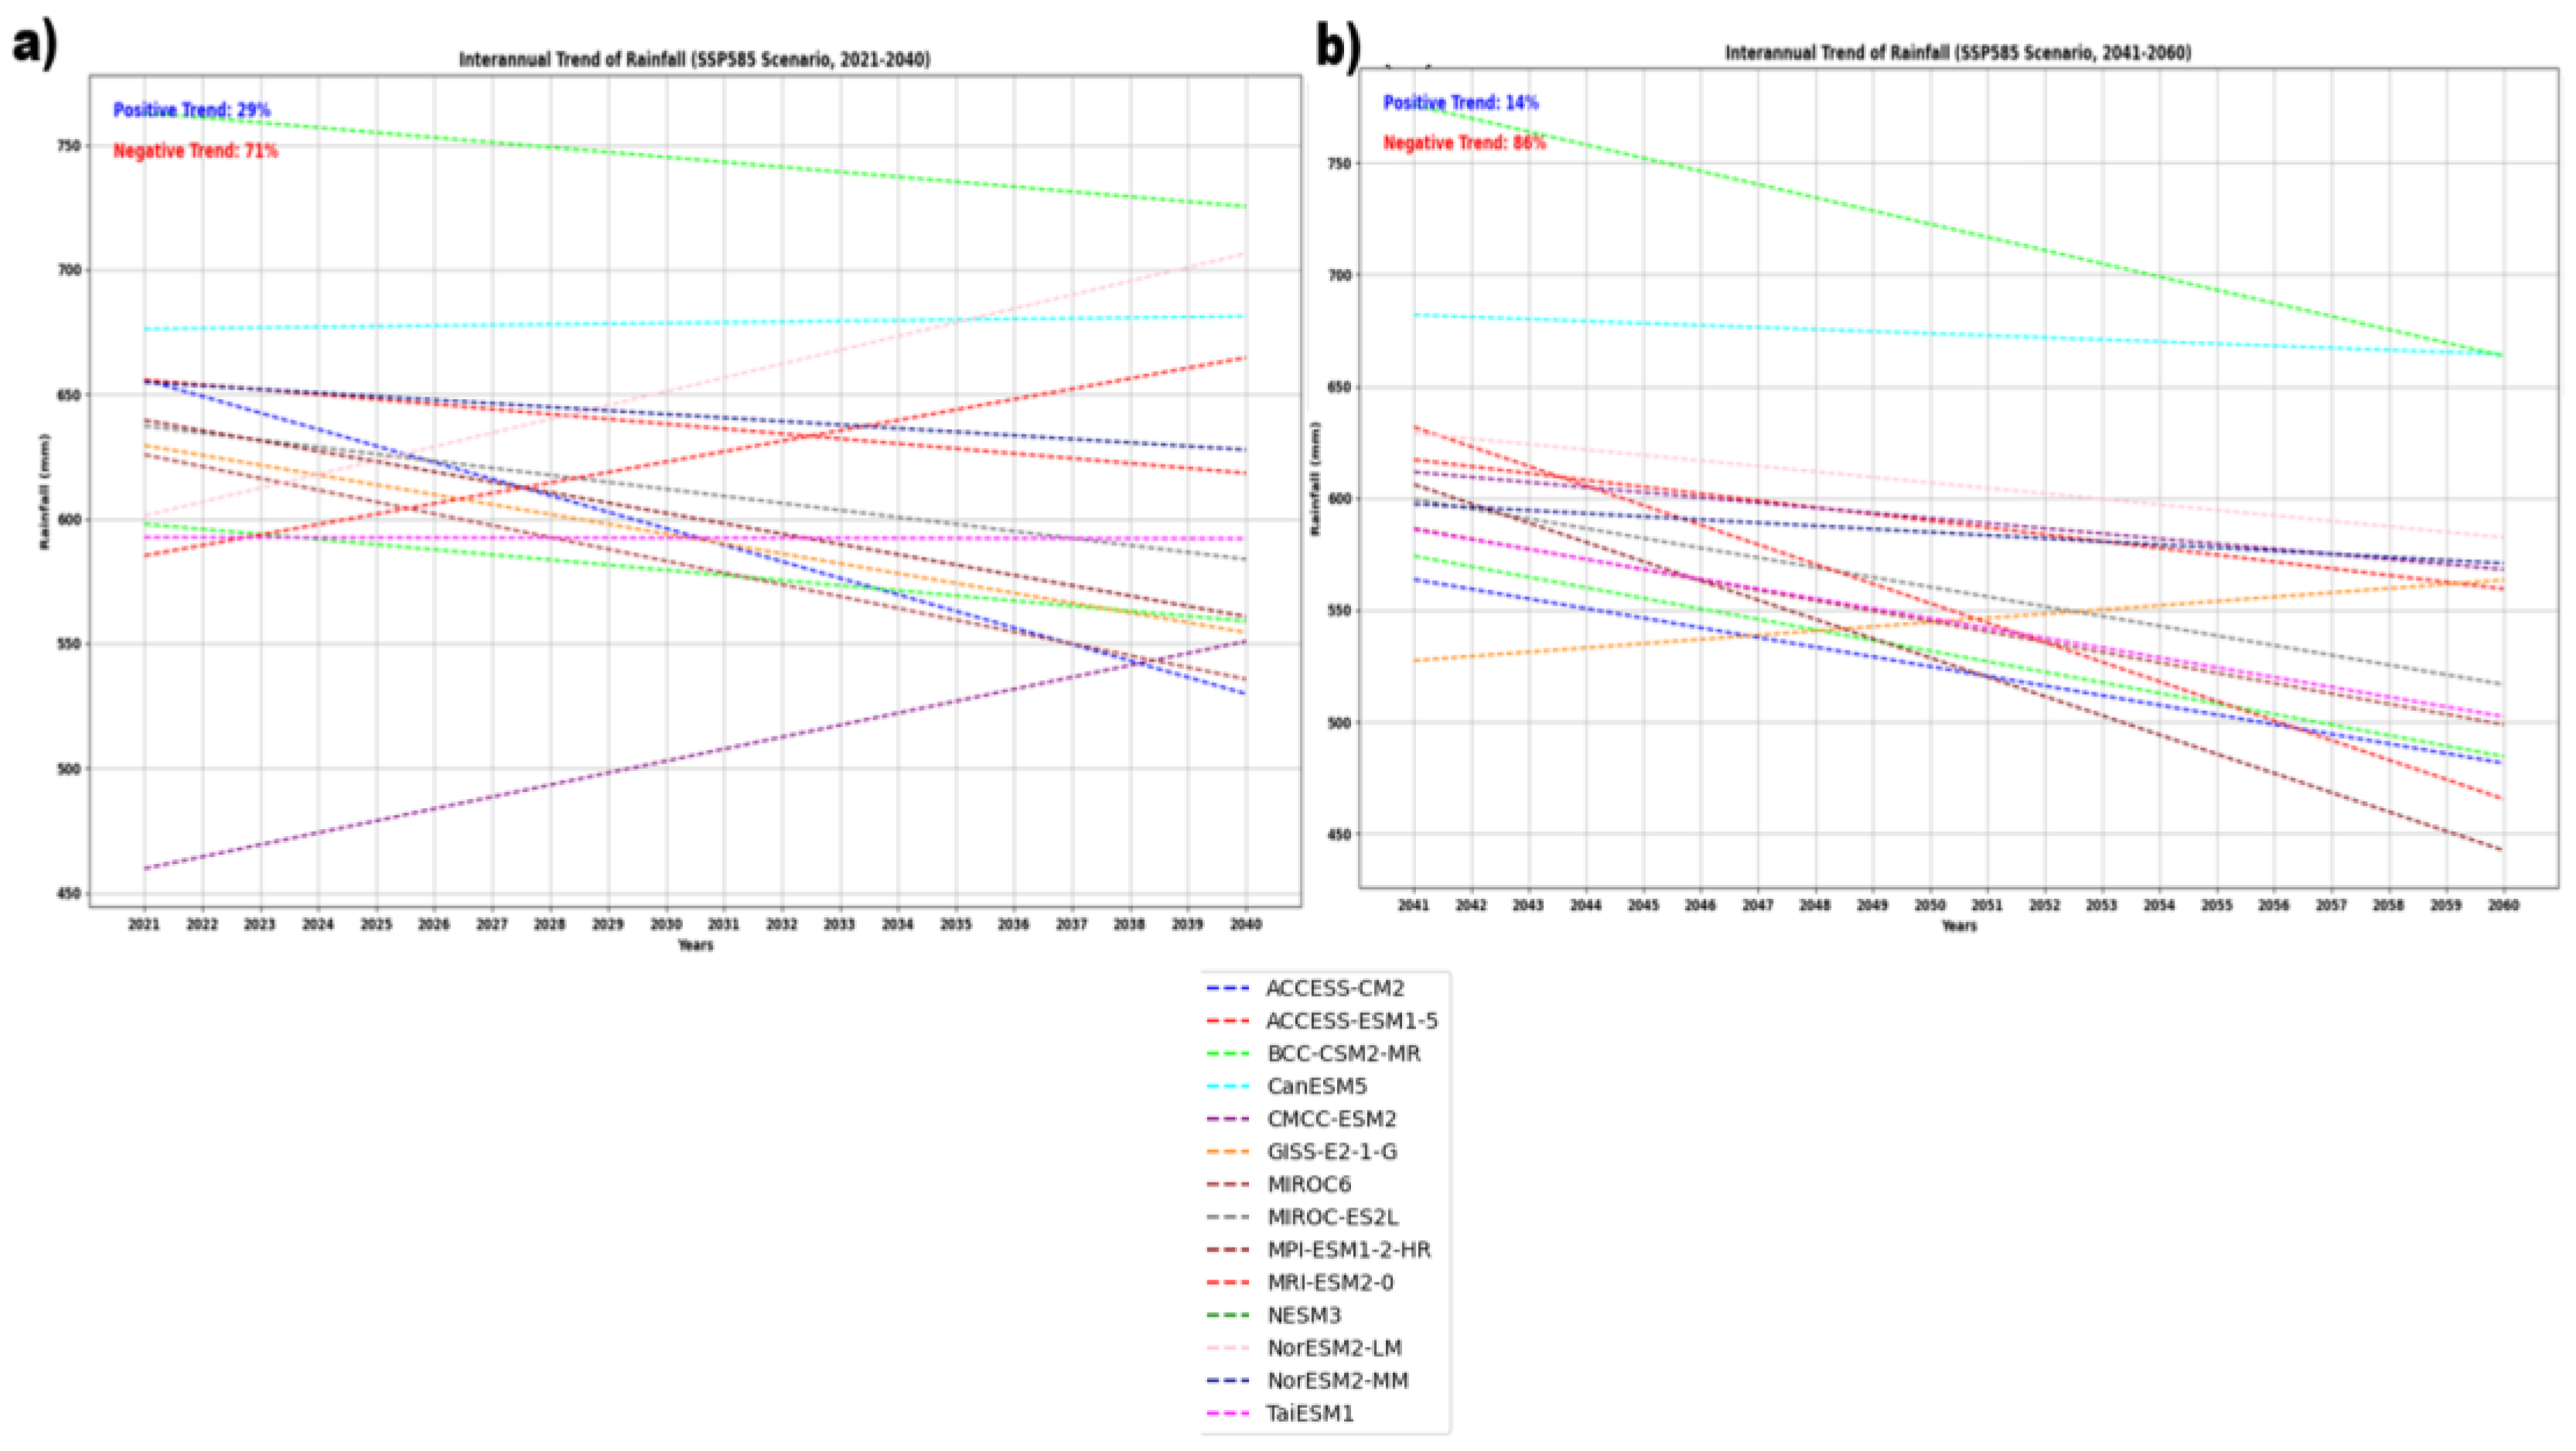

Table 1.
Description of the ENACTS rainfall product used for validation. The table summarizes key characteristics including data sources, product type (combination of station and satellite data), spatial and temporal resolution, and the period of coverage. The dataset is developed by ANACIM as part of the ENACTS initiative. Source: [6].
| Data Set | Full Product Name | Data Sources | Product Type | Period | Spatial Resolution | Temporal Resolution | Reference |
| ENACTS (ANACIM) | Enhancing National Climate Services | Open Source | Stations + Satellites | 1995–2014 | 0.0375° (~4 km) | Daily | (Dinku et al., 2022) |
Table 2.
NEX-GDDP-CMIP6 models, institutions, and countries of origin.
| Model Name | Institution | Country | Spatial resolution (Latitude x Longitude) |
| ACCESS-CM2 | Australian Community Climate and Earth System Simulator (ACCESS) – CM Version 2 | Australia | 1.9° x1.3° |
| ACCESS-ESM1-5 | Australian Community Climate and Earth System Simulator – Earth System Model Version 1.5 | Australia | |
| BCC-CSM2-MR | Beijing Climate Center (BCC), China Meteorological Administration (CMA) | China | 1.9°x1.3° |
| CanESM5 | Canadian Centre for Climate Modelling and Analysis | Canada | |
| CMCC-CM2-SR5 | Euro-Mediterranean Center on Climate Change (CMCC) | Italy | 1.1 x1.1 |
| GISS-ES2-1-G | NASA Goddard Institute for Space Studies (GISS) | United States | |
| IITM-ESM | Indian Institute of Tropical Meteorology (IITM) | India | 2.81º × 2.81º |
| MIROC6 | Japan Agency for Marine-Earth Science and Technology (JAMSTEC) | Japan | |
| MIROC-ES2L | Japan Agency for Marine-Earth Science and Technology (JAMSTEC) | Japan | 2.8° x 1.9° |
| MPI-ESM1-2-HR | Max Planck Institute for Meteorology | Germany | |
| MRI-ESM2 | Meteorological Research Institute (MRI) | Japan | 2° x 2.5° |
| NESM3 | Nanjing University of Information Science and Technology (NUIST) | China | |
| NorESM2-LM | Norwegian Meteorological Institute – Low-Resolution Model | Norway | 1.9 ° x 1.9° |
| NorESM2-MM | Norwegian Meteorological Institute – Medium-Resolution Model | Norway | |
| TaiESM | Research Center for Environmental Changes, Academia Sinica | Taiwan | 1.4° x 1.4° |
Table 3.
Indices calculated for the rainy season, from June to September.
| Acronym | Index Name | Description | Unit |
| CDD | Consecutive dry days | Number of consecutive days with rainfall < 1 mm | Days |
| CWD | Consecutive wet days | Number of consecutive days with rainfall ≥ 1 mm | Days |
| RR1 | Number of rainy days | Number of days with rainfall ≥ 1 mm | Days |
| SDII | Daily rainfall index | Average rainfall per wet day (≥1 mm) per year | mm/day |
| Rx5day | Max 5-day precipitation | Maximum total rainfall over 5 consecutive days | mm |
| R95pTOT | Very wet days | Total rainfall from days exceeding the 95th percentile | mm |
| R10 | Heavy precipitation days | Annual count of days with rainfall ≥ 10 mm | Days |
| R20 | Very heavy precipitation days | Annual count of days with rainfall ≥ 20 mm | Days |
| PRCPTOT | Total annual precipitation | Total rainfall on wet days (≥1 mm) during the season | mm |
Disclaimer/Publisher’s Note: The statements, opinions and data contained in all publications are solely those of the individual author(s) and contributor(s) and not of MDPI and/or the editor(s). MDPI and/or the editor(s) disclaim responsibility for any injury to people or property resulting from any ideas, methods, instructions or products referred to in the content. |
© 2025 by the authors. Licensee MDPI, Basel, Switzerland. This article is an open access article distributed under the terms and conditions of the Creative Commons Attribution (CC BY) license (http://creativecommons.org/licenses/by/4.0/).
Copyright: This open access article is published under a Creative Commons CC BY 4.0 license, which permit the free download, distribution, and reuse, provided that the author and preprint are cited in any reuse.


