
Submitted:
06 May 2025
Posted:
06 May 2025
You are already at the latest version
Abstract
Understanding cyanobacterial dominance in tropical reservoirs is crucial for water management. This study investigated water quality dynamics in the João Leite Reservoir, Brazilian Cerrado, using 30 months of monitoring data from five sites. Physical, chemical, and biological parameters, including fluorometric chlorophyll-a and phycocyanin, were analysed alongside the Trophic State Index (TSI) using multivariate statistics (PCA, CCA). Results showed temporal variations exceeded spatial differences. Cyanobacteria were dominant despite generally low nutrient levels and an oligotrophic TSI classification. Principal Component Analysis identified temperature as strongly associated with cyanobacterial density. However, Canonical Correspondence Analysis and correlastions revealed limited direct statistical influence of measured physicochemical parameters, including nutrients, on cyanobacterial abundance. Findings suggest that in this warm, tropical system, high temperatures combined with stable hydrodynamics due to long hydraulic retention (>180 days) likely facilitate cyanobacterial success, overriding direct nutrient limitation.
Keywords:
multivariate analysis
; trophic state index
; phytoplankton dynamics
; tropical reservoir
; hydraulic retention time
Introduction
Reservoirs are crucial for water supply, energy generation, and agriculture, but anthropogenic pressures are progressively compromising their water quality worldwide, resulting in problems such as eutrophication and detrimental cyanobacterial blooms [1,2]. Cyanobacteria, particularly common in tropical and subtropical environments, can produce toxins harmful to human and ecological health, deplete oxygen, and raise water treatment costs [3,4,5]. Effective reservoir management depends on knowledge of the elements that cause cyanobacterial dominance.
Tropical reservoirs, such as those in Brazil’s Cerrado biome, face challenges due to distinct wet and dry seasons, high temperatures, and long water retention times [6,7]. Although nutrient enrichment (phosphorus and nitrogen) from agricultural and urban runoff is a known driver of blooms [8,9], cyanobacteria can sometimes dominate even in systems classified as oligo- or mesotrophic, suggesting other vital roles [10, This Study]. Further research is needed on the interaction among nutrient availability, high temperatures, thermal stratification, extended water residence, and special biome features such as Cerrado [3,11,12].
Although Cerrado aquatic systems are ecologically important and vulnerable, thorough investigations on the long-term dynamics of phytoplankton communities and their environmental drivers are few [12]. Moreover, conventional monitoring techniques usually lack the temporal resolution to record the fast dynamics unique to these ecosystems [13,14]. By capturing short-term environmental fluctuations and phytoplankton responses, high-frequency monitoring employing in situ probes presents an opportunity for better knowledge [11,15,16].
Thus, the main goal of this work was to investigate the temporal dynamics of water quality and the phytoplankton community over 30 months in the João Leite Reservoir, an important water supply system in the Brazilian Cerrado. Particularly in the context of generally low ambient nutrient concentrations, we aimed to specifically (1) identify the main environmental factors (physicochemical and hydrological); (2) evaluate the interactions between environmental variables, phytoplankton community structure (cyanobacteria and other algae); and (3) assess the spatiotemporal patterns of these dynamics using multivariate statistical analysis combined with in situ sensor data.
This study clarifies the ecological dynamics of tropical reservoirs in the understudied Cerrado biome by providing insights into the resilience of cyanobacteria and the variables controlling their spread. The results are pertinent for designing more efficient water quality monitoring and control plans for comparable systems facing seasonal fluctuations and anthropogenic pressures.
Methods
Study Area
The João Leite Dam is in Goias-Brasil, the primary water source for Goiania (Figure 1). Its drainage area is approximately 765 km². The reservoir has morphometric conditions that favour complete vertical circulations of the liquid mass besides presenting irregular margin characteristics, assuming a dendritic configuration and slightly concave format. The reservoir has an area of 10.4 km² and an extension of 15 km. The average depth is around 12.4 meters, and the maximum depth is 36 meters, and it can go through natural or operational variations. It has a regularised flow of 6,23 m³/s. The total volume of the reservoir is 129 hm³, with a working volume of 117 hm³ and a dead volume of 12 hm³ [7].
Monitoring Sites and Frequency of Sampling
Five sample points, P01, P02, P03, P04, and P05, were selected and distributed throughout the reservoir. Monthly samplings, covering 30 months, were conducted from January 2015 to June 2017. The physical-chemical and biological parameters were assessed using a fluorometer and laboratory studies. The diagram (Figure 1) illustrates the arrangement of the collecting locations along the João Leite reservoir [7].
Hydrological Data
Data on air temperature, relative humidity, precipitation, evaporation, solar irradiance, and wind velocity were collected from a meteorological station 15 km from the reservoir. According to the Köppen categorization as Aw, the research region exhibits humid tropical climates with two well-defined seasons: winter drought and summer rainfall [17]. The mean annual temperature is approximately 23.87 ºC due to the impact of altitude. The minimum temperature records are typically observed during May and August. September, which commences during spring, has the highest temperatures. The mean annual precipitation is 1487.2 mm, with a minimum of 7 mm in July and a maximum of 268 mm [18]. The data was collected in the dry and rainy seasons at two stations.
Physico-Chemical and Biological Variables of Water Quality
The water samples were analysed, including water temperature, pH, turbidity, electrical conductivity (EC), dissolved oxygen (DO), total organic carbon (TOC), total phosphorus, ammoniacal nitrogen, nitrite, nitrate, total iron, manganese, sulfate, water transparency, chlorophyll-a, algae, and cyanobacteria (phycocyanin).
The protocol for gathering, preserving, conveying, and examining water samples adhered to the guidelines outlined in Standard Methods for the Examination of Water and Wastewater [19] and the accompanying manual [20].
The water samples were collected in borosilicate glass bottles that had been well-cleaned. The samples were then transported to the laboratory for analysis using a thermal box. Sub-surface water collection was conducted at a depth of 30 cm below the surface of the water slide. Phytoplankton samples were collected simultaneously with the water quality samples using a 1000 ml amber glass vial using surface sampling. These samples were meant for quantitative analysis. The samples were treated with Lugol acid solution using the Utermöhl method and measured using the sedimentation method developed by Utermöhl [19].
In situ, two YSI 6600 V2-2 multiparametric sensors were used to assess the data of dissolved oxygen, turbidity, electrical conductivity, pH, ammoniacal nitrogen, nitrate, chlorophyll-a, phycocyanin, and water temperature. The time interval between collections was modified every 5 seconds for 5 minutes at each sampling location. The vertical structure of the water column was assessed as follows: measurements were taken at intervals of 2 meters when the depth exceeded 10 meters. When the depth was less than 10 meters, the underground meter completed the profile.
Statistical Analyses
The data analysis was conducted using R. The boxplot tool was used to identify the parameters contributing to the geographical and temporal fluctuations in water quality. Afterwards, the Pearson correlation test was conducted to determine whether the associations between the parameters, points, and months analysed were statistically significant. A strong correlation is indicated by values > 0.50, both positive and negative [21].
Cluster analysis was used to confirm the similarity in dynamics of water quality metrics [22] throughout time and space [23].
Principal component analysis (PCA) is a method used for pattern recognition that reduces the number of variables in a dataset, resulting in a set of interrelated variables. It provides information on the most important parameters and can be used to assess water quality and landscape using the biplotGUI package in R [24].
Furthermore, canonical correspondence analysis (CCA) was utilised to assess the degree of association between two sets of parameters and identify the specific features responsible for the observed correlations. The methodology also assessed the relative significance of each parameter in the fluctuation of the biological community [14], utilising the phyloseq and vegan libraries.
The Trophic State Index (TSI)
The trophic status index (TSI) evaluates the trophic conditions of different aquatic ecosystems. It was initially suggested by [22] and later modified by [25]. The TSI utilises five evaluations of trophic status. These evaluations are determined by the values obtained for three variables: transparency (measured with a Secchi disk), chlorophyll-a, and total phosphorus.
The trophic state of the study environment was assessed using only two variables: chlorophyll-a and total phosphorus. The analysis excluded transparency values because they may not accurately reflect trophic states. This exclusion is justified by the significant influence of high turbidity caused by the concentration of planktonic organisms and suspended mineral matter. Suppose there is no data for total phosphorus or chlorophyll-a. In that case, the index will be calculated using the available variable and considered equivalent to the Trophic State Index (TSI) as suggested by [25]. The obtained results from the investigation were also compared with the values provided by reference [26].
Results and Discussion
Physical, Chemical, and Biological Characterization of Water
Data analysis (Figure 2 and Figure 3) revealed greater temporal than spatial variability in the surface water quality of the João Leite Reservoir during the monitored period. While the parameters assessed at the surface remained consistent across sampling locations and typically complied with regulatory limits [27], significant temporal fluctuations indicated apparent seasonality in water quality. Thermal stratification was observed, characterised by higher temperatures in the upper layers (ranging from 22-25°C in the dry period to 26-29°C in the rainy period) decreasing with depth, with the lowest values recorded near the bottom [comparable to 15]. Regarding turbidity, surface values were mainly below the 5 NTU recommended for water supply [28], although the Class II limit of 100 NTU [29] was occasionally exceeded; lower values occurred during dry months and higher values during rainy periods, peaking in December 2016 (Month 24) likely due to surface runoff, with a tendency for turbidity to increase with depth.
Surface Dissolved Oxygen (DO) levels generally complied with regulations, remaining above 5 mg/L O2 and typically ranging between 5 and 8 mg/L O2, although an exception (2.34 mg/L O2) was recorded in July 2016 at point P01. DO decrease with depth, with many points indicating anoxia near the bottom, and showed temporal variations, particularly during the dry months of June and July 2016 (Times 18 and 19). The pH values consistently fell within the 7 to 8.5 range, meeting the legal limit (6 to 9 [28]), and predominantly showed neutral characteristics with a trend towards alkalinity; slightly lower values were observed in the middle and bottom layers [comparable to 30]. Electrical Conductivity (EC) varied between 100 and 130 µS/cm, with maximum concentrations occurring predominantly in the lower section and during dry periods, decreasing during rainy seasons; notably, values exceeding 100 µS/cm were recorded in both dry and rainy periods [similar to 31].
Concentrations of nitrogenous forms met regulatory limits for surface applications. Nitrate levels were below 0.1 mg/L (with peaks at P02 and P04 between April-June 2016/2017), while nitrite and ammonia showed the lowest concentrations at the surface. However, elevated ammonia levels were observed in the middle water column at point P01. Total Phosphorus (TP) concentrations generally ranged from 0.001 to 0.025 mg/L, mostly below the legal limit for lentic environments (0.03 mg/L [cf. 29? Verify reference]), but exceptions with higher values occurred in July/August 2015 (0.031-0.102 mg/L) and May 2015 at P03 (0.059 mg/L). Boxplot analysis showed no significant difference in TP between sampling points, with peaks observed in August/September 2015. (Note: Clarification is needed regarding TP compliance, as another part of the original analysis mentioned values potentially exceeding a different limit of 0.004 mg/L).
Concerning metals, total iron concentrations at the surface frequently exceeded the legal limit (0.3 mg/L), with higher values found in the middle and bottom layers. Manganese levels generally met the guideline (0.1 mg/L), although occasional readings were above this limit.
Biological indicators showed surface chlorophyll-a concentrations ranging from 2 to 8 µg/L, within the regulatory limit (30 µg/L), with the lowest levels at P01/P02 and the highest at P04; higher concentrations were found in the central water column (P01), and levels were lower during the dry season, increasing with rainfall, contrasting with observations in [31]. High densities of cyanobacteria (10,203 to 776,835 cells/mL) were observed throughout the samples, with peak concentrations in the middle and bottom sections, especially during periods of precipitation. Algal density was generally lower than that of cyanobacteria.
Multivariate analyses provided further insights. Pearson Correlation (Figure 4) identified strong correlations between DO and pH (0.705), EC and DO (-0.624), ammonia and pH (-0.518), ammonia and DO (-0.662), iron and DO (-0.567), iron and EC (0.701), and iron and ammonia (0.759), among others, while algae, chlorophyll-a, and cyanobacteria showed low correlations with other parameters. Cluster Analysis (CA) (Figure 5) grouped the variables into four main clusters: (1) pH, DO, cyanobacteria, algae, and temperature; (2) nitrate, TOC, phosphorus, and chlorophyll-a; (3) turbidity, sulphate, and nitrite; and (4) manganese, total iron, ammonia, and EC. Principal Component Analysis (PCA) (Figure 6) explained 38% of the total variability with the first two axes (Axis 1: 28%, Axis 2: 10%). Axis 1 was positively associated with turbidity, EC, ammonia, total iron, and manganese and negatively with DO (Table 2), while temperature correlated negatively with Axis 1 components on Axis 2. Phosphorus and nitrate had similar representativeness, and biological parameters (algae, cyanobacteria, chlorophyll-a) were not significant drivers in the PCA dimensions. The PCA plot also showed points clustering by collection month, reinforcing the dominance of temporal variation. Finally, according to the Monte Carlo test, Canonical Correspondence Analysis (CCA) (Table 3, Figure 7) showed no statistically significant axes, suggesting the measured physicochemical parameters were not the primary direct drivers of biological variations in this specific analysis.
The results indicate that the João Leite Reservoir is a dynamic system primarily influenced by seasonal (temporal) variations rather than spatial differences at the surface. General compliance with water quality standards [27,28,29] is positive. Still, the presence of stratification and peaks in specific parameters, such as cyanobacteria and nutrients, requires attention from the water body’s sustainability perspective.
Typical of tropical reservoirs, the seen thermal stratification—warmer surface waters and colder bottom waters—is accentuated by different dry and rainy seasons [15]. Low DO values near the bottom indicate that this water column stability limits vertical mixing, causing oxygen depletion (anoxia) in the hypolimnion. Anorexia, in turn, favours anaerobic respiration processes and the oxidation of reducing substances in the sediments, perhaps intensifying nutrient cycling (like phosphorous) and the dissolution of metals [42], so contributing to the chemical stratification suggested by the profiles of DO, pH, EC, Fe, and Mn.
Stratification creates favourable conditions for cyanobacteria dominance [16,39,42]. The prevailing high temperatures (>25°C), especially in the epilimnion during the rainy season, favour thermotolerant species like cyanobacteria, which have higher metabolic efficiency under these conditions compared to groups such as diatoms and chlorophytes [9,15,16]. Water column stability allows cyanobacteria with physiological adaptations, like gas vacuoles, to adjust their position to optimise light and nutrient uptake [16,42].
The high cyanobacteria densities (up to >700,000 cells/mL) are a warning sign for water quality, exceeding thresholds that suggest enhanced monitoring (>10,000 cells/mL [cf. guidelines]) due to the possible risk of cyanotoxin production (e.g., microcystins, saxitoxin) [16,32]. A difficulty for sustainable reservoir management is that elevated temperatures can induce the synthesis of these toxins and extend bloom periods [16,32], transforming seasonal events into continuous ones and affecting water security and public health. The predominance of cyanobacteria (usually >80-90% of total phytoplankton in similar systems [33,34]) guarantees the sensitivity of the reservoir to blooms.
Although the CCA did not show a clear direct correlation between physicochemical and biological parameters in the examined configuration, literature and other data from this study suggest necessary interactions. Usually, the main limiting nutrient in tropical systems is phosphorus [9,15,35]. Although average TP concentrations were usually within limits, peaks were noted, particularly following dry spells, presumably related to nutrient input via surface runoff or internal release under anoxia. High phosphorus and high temperatures speed up cyanobacterial development [9,11], and nitrogen availability—even if it is not mostly limiting—can favour toxic strains [11]. The low correlation found between nutrients (N, P) and phytoplankton biomass (chlorophyll-a, cyanobacteria) in the Pearson and PCA analyses could suggest that, during the study period, other factors such as temperature [cf. 16] and the reservoir’s long hydraulic residence time (almost 180 days) were the main growth controllers, producing consistently favourable conditions [cf. 8, 36].
Agricultural activities in the watershed are likely sources of nitrogen and phosphorus [11,37], contributing to reservoir fertilisation, as suggested in other studies [37]. This is also reflected in the correlation between nitrate, TOC, phosphorus, and chlorophyll-a in Cluster 2, where chlorophyll-a indicates algal biomass stimulated by nutrients [cf. 32]. Similarly, Cluster 3 (turbidity, sulphate, nitrite) may reflect the input of materials via runoff or erosion.
Cluster 1 (pH, DO, cyanobacteria, algae, temperature) highlights the interconnection between biological activity and water chemistry. Photosynthesis increases pH and DO, while decomposition consumes DO and can lower pH [32,38]. Temperature accelerates both processes [16,37]. Cluster 4 (Mn, Fe, ammonia, EC) appears to reflect the influence of hydrogeological characteristics (Fe/Mn-rich soils) and the transport of ions and nutrients (like ammonia from fertilisers) by surface runoff, especially during rainy periods, which increases EC.
Trophic State Index (TSI)
The Total Trophic State Index (TSI) indicated that 93% of the samples were classified as ultraoligotrophic, 6% oligotrophic, and 1% mesotrophic. The reservoir was classified as oligotrophic at points P01 and P02 in 2015 and as mesotrophic at P01 in September 2015. All data points acquired over the monitoring period in the following months were classified as ultraoligotrophic Figure 8.
When comparing the values of chlorophyll-a and total phosphorus with the values suggested in [26], which also categorise the water bodies, it is evident that 49% of the samples were classified as mesotrophic, 35% as oligotrophic, and 15% as ultra-oligotrophic for chlorophyll-a. Regarding phosphorus, 38% of the samples were categorised as mesotrophic, 35% as oligotrophic, 18% as ultraoligotrophic, and 9% as eutrophic.
Based on the findings, it was noted that 93% of the samples from the TSI were classified as ultraoligotrophic, indicating low productivity and nutrient concentrations that do not significantly impact water quality. Based on the parameters suggested in [26], most samples were classified as mesotrophic and oligotrophic regarding total phosphorus and chlorophyll levels. Mesotrophic water bodies exhibit moderate productivity and may experience fluctuations in water quality. However, they remain within the permitted limitations set by legislation. Oligotrophic bodies exhibit poor production and do not induce changes in water quality due to nutrient presence. The points were classed as eutrophic only in August and September 2015, as reference [26] stated. The P03 point was certified as eutrophic in May 2015. No elevated phosphorus levels, indicative of eutrophic conditions, were recorded in the subsequent months. Therefore, based on these indicators, it can be inferred that the reservoir has acceptable productivity and nutrient concentrations. Most of the samples and indicators suggest that the risk of eutrophication is low, meaning there is a minimal chance of water use being negatively affected by the harmful effects of organic enrichment.
Variations in chlorophyll-a concentrations and cyanobacteria densities over hydrological cycles revealed phytoplankton’s seasonal dynamics. Higher chlorophyll-a levels and TSI values moving to mesotrophic conditions show that the lower water flow and longer hydraulic retention times during the dry season produced favourable conditions for cyanobacterial growth [39]. On the other hand, the rainy season saw higher turbidity and nutrient input from runoff, so it momentarily enhanced the growth of other phytoplankton groups, including green algae and diatoms, before cyanobacteria took the front stage [36].
The interaction between phytoplankton growth properties and the Trophic State Index (TSI) revealed the adaptive strategies of cyanobacteria to persist over diverse trophic states. Because of their nitrogen fixation and nutrient storage capacity, cyanobacteria have shown remarkable resilience and adaptability, keeping dominance even under ultraoligotrophic conditions. This reaction system emphasises the need to consider the ecological features of phytoplankton while interpreting TSI values [3,5].
Phytoplancton Analyses
Phytoplankton are autotrophic organisms in rivers, lakes, reservoirs, and oceans. Plants utilize sunlight, carbon dioxide, and nutrients from water to generate energy and oxygen via photosynthesis. Aquatic primary producers facilitate global oxygen production. Photosynthesis necessitates chlorophyll-a and other pigments in algae, such as Chlorophyta and Bacillariophyta. Their ideal conditions consist in a reasonable diet and enough light [40].
Algae concentrations changed without any evident pattern. Environmental factors and a thorough study of all kinds of algae may have hidden group dynamics. Algae were affected by dissolved oxygen levels in the water column and light availability; they showed lower densities than cyanobacteria [41].
Often called blue-green algae, cyanobacteria are a separate phytoplankton group distinguished by distinct physiological traits. Pigments called phycocyanin help cyanobacteria fix nitrogen. Their ideal habitat is a warm, nutrient-dense one. Because they can store phosphorous, control buoyancy through gas vacuoles, and survive in low-light conditions, cyanobacteria outcompete other phytoplankton [25].
These differences influence phytoplankton community dynamics. Under balanced nutrient levels, algae prevail, whereas cyanobacteria flourish in eutrophic settings or during temperature stratification, leading to hazardous algal blooms. Temperature, nutrient availability, and hydrodynamics influence this interaction [40].
Cyanobacteria concentrations exhibited more stability and predictability, increasing during warmer months characterised by high sunlight and temperature stratification. Natural adaptations such as nitrogen fixation and buoyancy regulation facilitated their development in these environments. Improved water circulation and less thermal stratification led to a 50% reduction in cyanobacteria levels during the cooler months. Algae and cyanobacteria exhibited greater abundance during thermal stratification, indicating their inherent association with changes in dissolved oxygen (DO). Cyanobacteria surpassed algae because of their capacity to thrive in nutrient-rich and low-oxygen environments. This behaviour underscores the necessity of monitoring cyanobacteria as an indicator of water quality and a threat to dangerous blooms.
Regional and Morphological Influences
Tropical reservoirs, such as those in Brazil, are characterised by consistently high temperatures and abundant light, which promote prolonged thermal stratification. These conditions favour the dominance of cyanobacteria as extended hydraulic retention times further stabilise the water column, reducing vertical mixing and facilitating the release of nutrients from the hypolimnion to the euphotic zone. Consequently, these reservoirs frequently experience persistent and recurrent cyanobacterial blooms, posing substantial challenges for water quality management [15,16,32].
This differs from temperate regions, where seasonal variability plays a more prominent role, and elevated temperatures during summer encourage thermal stratification and temporary cyanobacteria dominance. Wind-induced vertical mixing and the shorter duration of warm periods often restore community diversity, with diatoms and chlorophytes reemerging during transitional seasons. Additionally, seasonal overturns in autumn and spring enhance nutrient circulation, limiting the persistence of blooms compared to tropical systems [11,39,42].
Reservoirs in arid and semi-arid regions like northeastern Brazil face unique water scarcity and hydrological variability pressures. Prolonged droughts increase nutrient concentrations due to reduced water renewal, intensifying eutrophication processes. Sometimes, this occurs in Brazilian Cerrado, when there’s no rain for several months every year. Conversely, extreme rainfall contributes to nutrient loading from surrounding watersheds, often triggering short-lived but intense algal blooms [32,36].
Morphometry also plays a crucial role in phytoplankton dynamics. Deep reservoirs in mountainous regions, such as those in China, exhibit stronger thermal stratification and greater hypolimnetic anoxia, creating favourable conditions for cyanobacterial blooms. Like many in Brazil, shallow reservoirs experience more pronounced interactions between the water column and sediments, leading to faster nutrient cycling and less predictable phytoplankton dynamics [9,35]. These findings underline the importance of tailoring management strategies for regional and site-specific conditions.
Conclusions
Employing water quality analysis in the João Leite Reservoir in the Brazilian Cerrado, this study provides an understanding of the elements regulating phytoplankton, particularly cyanobacteria, in tropical water environments. This work reveals interactions among physical, chemical, and biological components that produce multiple conclusions for reservoir management.
The study found that variations in water quality and phytoplankton linked to seasons had more effect than reservoir location variations over time. Long-term observation is required to understand the trends of these systems.
The reservoir’s trophic state assessment showed a conflicting picture. The Trophic State Index (TSI) categorised the reservoir as ultraoligotrophic or low productivity. Still, looking at chlorophyll-a and total phosphorous separately suggested oligotrophic to mesotrophic conditions at times, with some phosphorous readings suggesting eutrophic conditions. This points to a system with low general output but promise for enrichment.
The cyanobacteria were consistently present and dominant throughout the study, even when nutrient levels (phosphorus and nitrogen) were low. This contrasts with expectations that low nutrients might limit cyanobacteria growth.
Principal Component Analysis (PCA) linked water temperature to cyanobacteria density. This matches the knowledge that many cyanobacteria types do well in warmer water. However, Pearson correlation and Canonical Correspondence Analysis (CCA) showed a weak or non-significant statistical connection between most measured chemicals, including nutrients, and cyanobacteria numbers.
Thus, the study contends that cyanobacteria dominance more than nutrient levels can be explained by the combination of high water temperatures and slow water replacement (hydraulic retention time over 180 days). For cyanobacteria that can regulate their position in the water, stable, warm, slow-moving water helps them succeed even in low nutrient levels.
The research supports using tools like probes with fluorometers to monitor chlorophyll-a and phycocyanin and track phytoplankton changes over time. These methods help understand responses to environmental shifts.
This research points to temperature and water movement as key factors for phytoplankton in this tropical reservoir. It shows cyanobacteria can dominate even without high nutrient levels if physical conditions are right. These findings affect water management in the Cerrado and similar areas, suggesting that plans must address physical factors and nutrient inputs, especially as climate change may alter temperature and water patterns.
References
- Rolim, Silvia Beatriz Alves et al. “Remote sensing for mapping algal blooms in freshwater lakes: A review.”. Environmental Science and Pollution Research 2023, 30, 19602–19616. [CrossRef] [PubMed]
- Chen, N. Chen, N., S. Wang, X. Zhang, and S. Yang. “A risk assessment method for remote sensing of cyanobacterial blooms in inland waters.”. Science of the Total Environment 2020, 740, 140012. [Google Scholar] [CrossRef]
- Paerl, H. W., and T. G. Otten. “Harmful Cyanobacterial Blooms: Causes, Consequences and Control.”. Microbial Ecology 2013, 65, 995–1010. [CrossRef]
- Carey, C. C., B. W. Ibelings, E. P. Hoffmann, D. P. Hamilton, and J. D. Brookes. “Eco-physiological adaptations that favour freshwater cyanobacteria in a changing climate.”. Water Research 2012, 46, 1394–1407. [CrossRef]
- Lins, R. P. M., L. G. Barbosa, A. Minillo, and B. S. O. De Ceballos. “Cyanobacteria in a eutrophicated reservoir in a semi-arid region in Brazil: dominance and microcystin events of blooms.”. Brazilian Journal of Botany 2016, 39, 905–915.
- Bittencourt-Oliveira, M. C., S. N. Dias, A. N. Moura, M. K. Cordeiro-Araújo, and E. W. Dantas. “Seasonal dynamics of cyanobacteria in a eutrophic reservoir (Arcoverde) in a semi-arid region of Brazil.”. Brazilian Journal of Biology 2012, 72, 533–544. [CrossRef]
- Gusmão, C. A. , and J. C. Valsecchi. “Projeto Básico Ambiental da Barragem e do Reservatório de Regularização e Acumulação do Ribeirão João Leite em Goiânia, Goiás - Brasil.” BVSDE. Biblioteca virtual desarrollo sostenible y salud ambiental, 2009. http://www.bvsde.paho.org/bvsAIDIS/PuertoRico29/gusma.pdf.
- Ferreira, R. D., C. C. F. Barbosa, and E. M. L. M. Novo. “Assessment of in vivo fluorescence method for chlorophyll-a estimation in optically complex waters (Curuai floodplain, Pará – Brazil).”. Acta Limnologica Brasiliensia 2012, 24, 373–386.
- Cha, Y. S. Park, K. Kim, M. Byeon, and C. A. Stow. “Probabilistic prediction of cyanobacteria abundance in a Korean reservoir using a Bayesian Poisson Model. 2014. [Google Scholar]
- Mowe, M. A. D., S. M. Mitrovic, R. P. Lim, A. Furey, and D. C. J. Yeo. “Tropical Cyanobacterial Blooms: A Review of Prevalence, Problem Taxa, Toxins and Influencing Environmental Factors.”. Journal of Limnology 2015, 74, 206–227.
- O’neil, J., T. W. Davis, M. A. Burford, and C. Gobler. “The rise of harmful cyanobacteria blooms: the potential roles of eutrophication and climate change.”. Harmful Algae 2012, 14, 313–334. [CrossRef]
- Burford, M. A., S. A. Johnson, A. J. Cook, T. V. Packer, B. M. Taylor, and E. R. Townsley. “Correlations between watershed and reservoir characteristics, and algal blooms in subtropical reservoirs.”. Water Research 2007, 41, 4105–4114. [CrossRef]
- Wang, Y., C. Xu, Q. Lin, W. Xiao, B. Huang, W. Lu, ... and J. Chen. “Modeling of algal blooms: Advances, applications, and prospects.”. Ocean & Coastal Management 2024, 255, 107250.
- Noori, R., M. S. Sabahi, A. R. Karbassi, A. Baghvand, and T. Zadeh. “Multivariate statistical analysis of surface water quality based on correlations and variations in the data set.”. Desalination 2010, 270, 129–136.
- Oliveira, F. H. P. C., A. L. S. Capela e Ara, C. H. P. Moreira, O. O. Lira, M. R. F. Padilha, and N. K. S. Shinohara. “Seasonal changes of water quality in a tropical shallow and eutrophic reservoir in the metropolitan region of Recife (Pernambuco-Brazil).”. Anais da Academia Brasileira de Ciências 2014, 86, 1863–1872.
- Davis, T. W., D. L. Berry, G. L. Boyer, and C. J. Gobler. “The effects of temperature and nutrients on the growth and dynamics of toxic and non-toxic strains of Microcystis during cyanobacteria blooms.”. Harmful Algae 2009, 8, 715–725. [CrossRef]
- Duarte, L. V., K. T. M. Formiga, and V. A. F. Costa. “Comparison of methods for filling daily and monthly rainfall missing data: statistical models or imputation of satellite retrievals?”. Water 2022, 14, 3144. [CrossRef]
- Duarte, L. V., K. T. M. Formiga, and V. A. F. Costa. “Analysis of the IMERG-GPM precipitation product analysis in Brazilian midwestern basins considering different time and spatial scales.”. Water 2022, 14, 2472. [CrossRef]
- Rice, E. W. Bridgewater, and American Public Health Association, eds. Standard Methods for the Examination of Water and Wastewater. Vol. 10. Washington, DC: American Public Health Association, 2012.
- CETESB. Guia Nacional de Coleta e Preservação de Amostra. Água, sedimento, comunidade aquáticas e efluentes líquidos. São Paulo: Companhia Estadual de Tecnologia de Saneamento Ambiental do Estado de São Paulo, 2011.
- Oliveira, F. A. D., T. S. R. Pereira, A. K. Soares, and K. T. M. Formiga. “Using hydrodynamic model for flow calculation from level measurements.”. Revista Brasileira de Recursos Hídricos 2016, 21, 707–718.
- Carlson, R. E. “A trophic state index for lakes. ” Limnology and Oceanography 1977, 22, 361–380. [Google Scholar] [CrossRef]
- Zhou, F., Y. Liu, and H. Guo. “Application of Multivariate Statistical Methods to Water Quality Assessment of the Watercourses in Northwestern New Territories, Hong Kong.”. Environmental Monitoring and Assessment 2007, 132, 1–13. [CrossRef]
- Da Silva, E. P. R. A. Filho, J. Pereira, and K. T. Martins Formiga. “Temporal variation and risk assessment of heavy metals and nutrients from water and sediment in a stormwater pond, Brazil.” Water Supply 23, no. 1 (2023): 206-221.
- Lamparelli, M. C. “Graus de trofia em corpos d’água do estado de São Paulo: avaliação dos métodos de monitoramento.” Thesis, Universidade de São Paulo, 2004.
- OECD. The OECD Cooperative Programme on Eutrophication. Canadian Contribution. Prepared by L. L. Janus and R. A. Vollenweider. Ottawa: Environment Canada, National Water Research Institute, Inland Waters Directorate, 1981.
- Li, Yuanrui et al. “Research trends in the remote sensing of phytoplankton blooms: results from bibliometrics.”. Remote Sensing 2021, 13, 4414. [CrossRef]
- Brasil, Ministério da Saúde. Portaria nº29/14 de 12/12/2011. Dispõe sobre os procedimentos de controle e de vigilância da qualidade da água para consumo humano e seu padrão de potabilidade. 2011.
- Brasil. Conselho Nacional do Meio Ambiente - Conama. Resolução Conama N° 357, de março de 2005. Dispõe sobre a classificação dos corpos de água e diretrizes ambientais para o seu enquadramento. (URL original inválida).
- Fernandes, V. O., B. Cavati, L. B. Oliveira, and B. D. Souza. “Ecologia de cianobactérias: fatores promotores e consequências das florações.”. Oecologia Brasiliensis 2009, 13, 247–258.
- Buzeli, G. M., and M. B. Cunha-Santino. “Análise e diagnóstico da qualidade da água e estado trófico do reservatório de Barra Bonita, SP.”. Ambi-Água 2013, 8, 186–205.
- Adloff, C. T., C. C. Bem, G. Reichert, and J. C. R. Azevedo. “Análise da comunidade fitoplanctônica com ênfase em cianobactérias em quatro reservatórios em sistema de cascata do rio Iguaçu, Paraná, Brasil.”. Revista Brasileira de Recursos Hídricos 2018, 23, e6.
- Graham, L. E., J. M. Graham, L. W. Wilcox, and M. E. Cook. Algae. 3rd ed. Dubuque: LJLM Press, 2016.
- Bellém, F., S. Nunes, and M. Morais. “Toxicidade a Cianobactérias: Impacte Potencial na Saúde Pública em populações de Portugal e Brasil.” In XIV Encontro da Rede Luso-Brasileira de Estudos Ambientais, Recife, Brasil, 2011.
- Cunha, D. G. F., and M. C. Calijuri. “Variação sazonal dos grupos funcionais fitoplanctônicos em braços de um reservatório tropical de usos múltiplos no estado de São Paulo (Brasil).”. Acta Botanica Brasilica 2011, 25, 822–831. [CrossRef]
- Burford, M. A., S. A. Johnson, A. J. Cook, T. V. Packer, B. M. Taylor, and E. R. Townsley. “Correlations between watershed and reservoir characteristics, and algal blooms in subtropical reservoirs.”. Water Research 2007, 41, 4105–4114. [CrossRef]
- Malheiros, C. H. L. Hardoim, Z. M. Lima, and R. S. S. Amorim. “Qualidade da água de uma represa localizada em área agrícola (Campo Verde, MT, Brasil).” Ambi-Água 7, no. 2 (2012). [CrossRef]
- Jardim, B. F. M. “Variação dos Parâmetros Físicos e Químicos das Águas Superficiais da Bacia do Rio das Velhas-MG e sua Associação com as Florações de Cianobactérias.” Masters dissertation, Universidade Federal de Minas Gerais, 2011.
- Figueredo, C. C., R. M. Pinto-Coelho, A. M. M. B. Lopes, P. H. O. Lima, B. Gücker, and A. Giani. “From Intermittent to Persistent Cyanobacterial Blooms: Identifying the Main Drivers in an Urban Tropical Reservoir.”. Journal of Limnology 2016, 75, 540–550.
- Cha, Y., S. S. Park, K. Kim, M. Byeon, and C. A. Stow. “Probabilistic prediction of cyanobacteria abundance in a Korean reservoir using a Bayesian Poisson Model.” Water Resources Research 50 (2014). (Número/Páginas ausentes na lista original).
- Paerl, H. W., and J. Huisman. “Blooms like it hot.”. Science 2008, 320, 57–58. [CrossRef]
- Shi, J., Wang, L., Yang, Y., Huang, T. A case study of thermal and chemical stratification in a drinking water reservoir. Science of The Total Environment. Volume 848, 20 November 2022.
Figure 1.
Sampling points were placed along the longitudinal axis of the João Leite Dam.
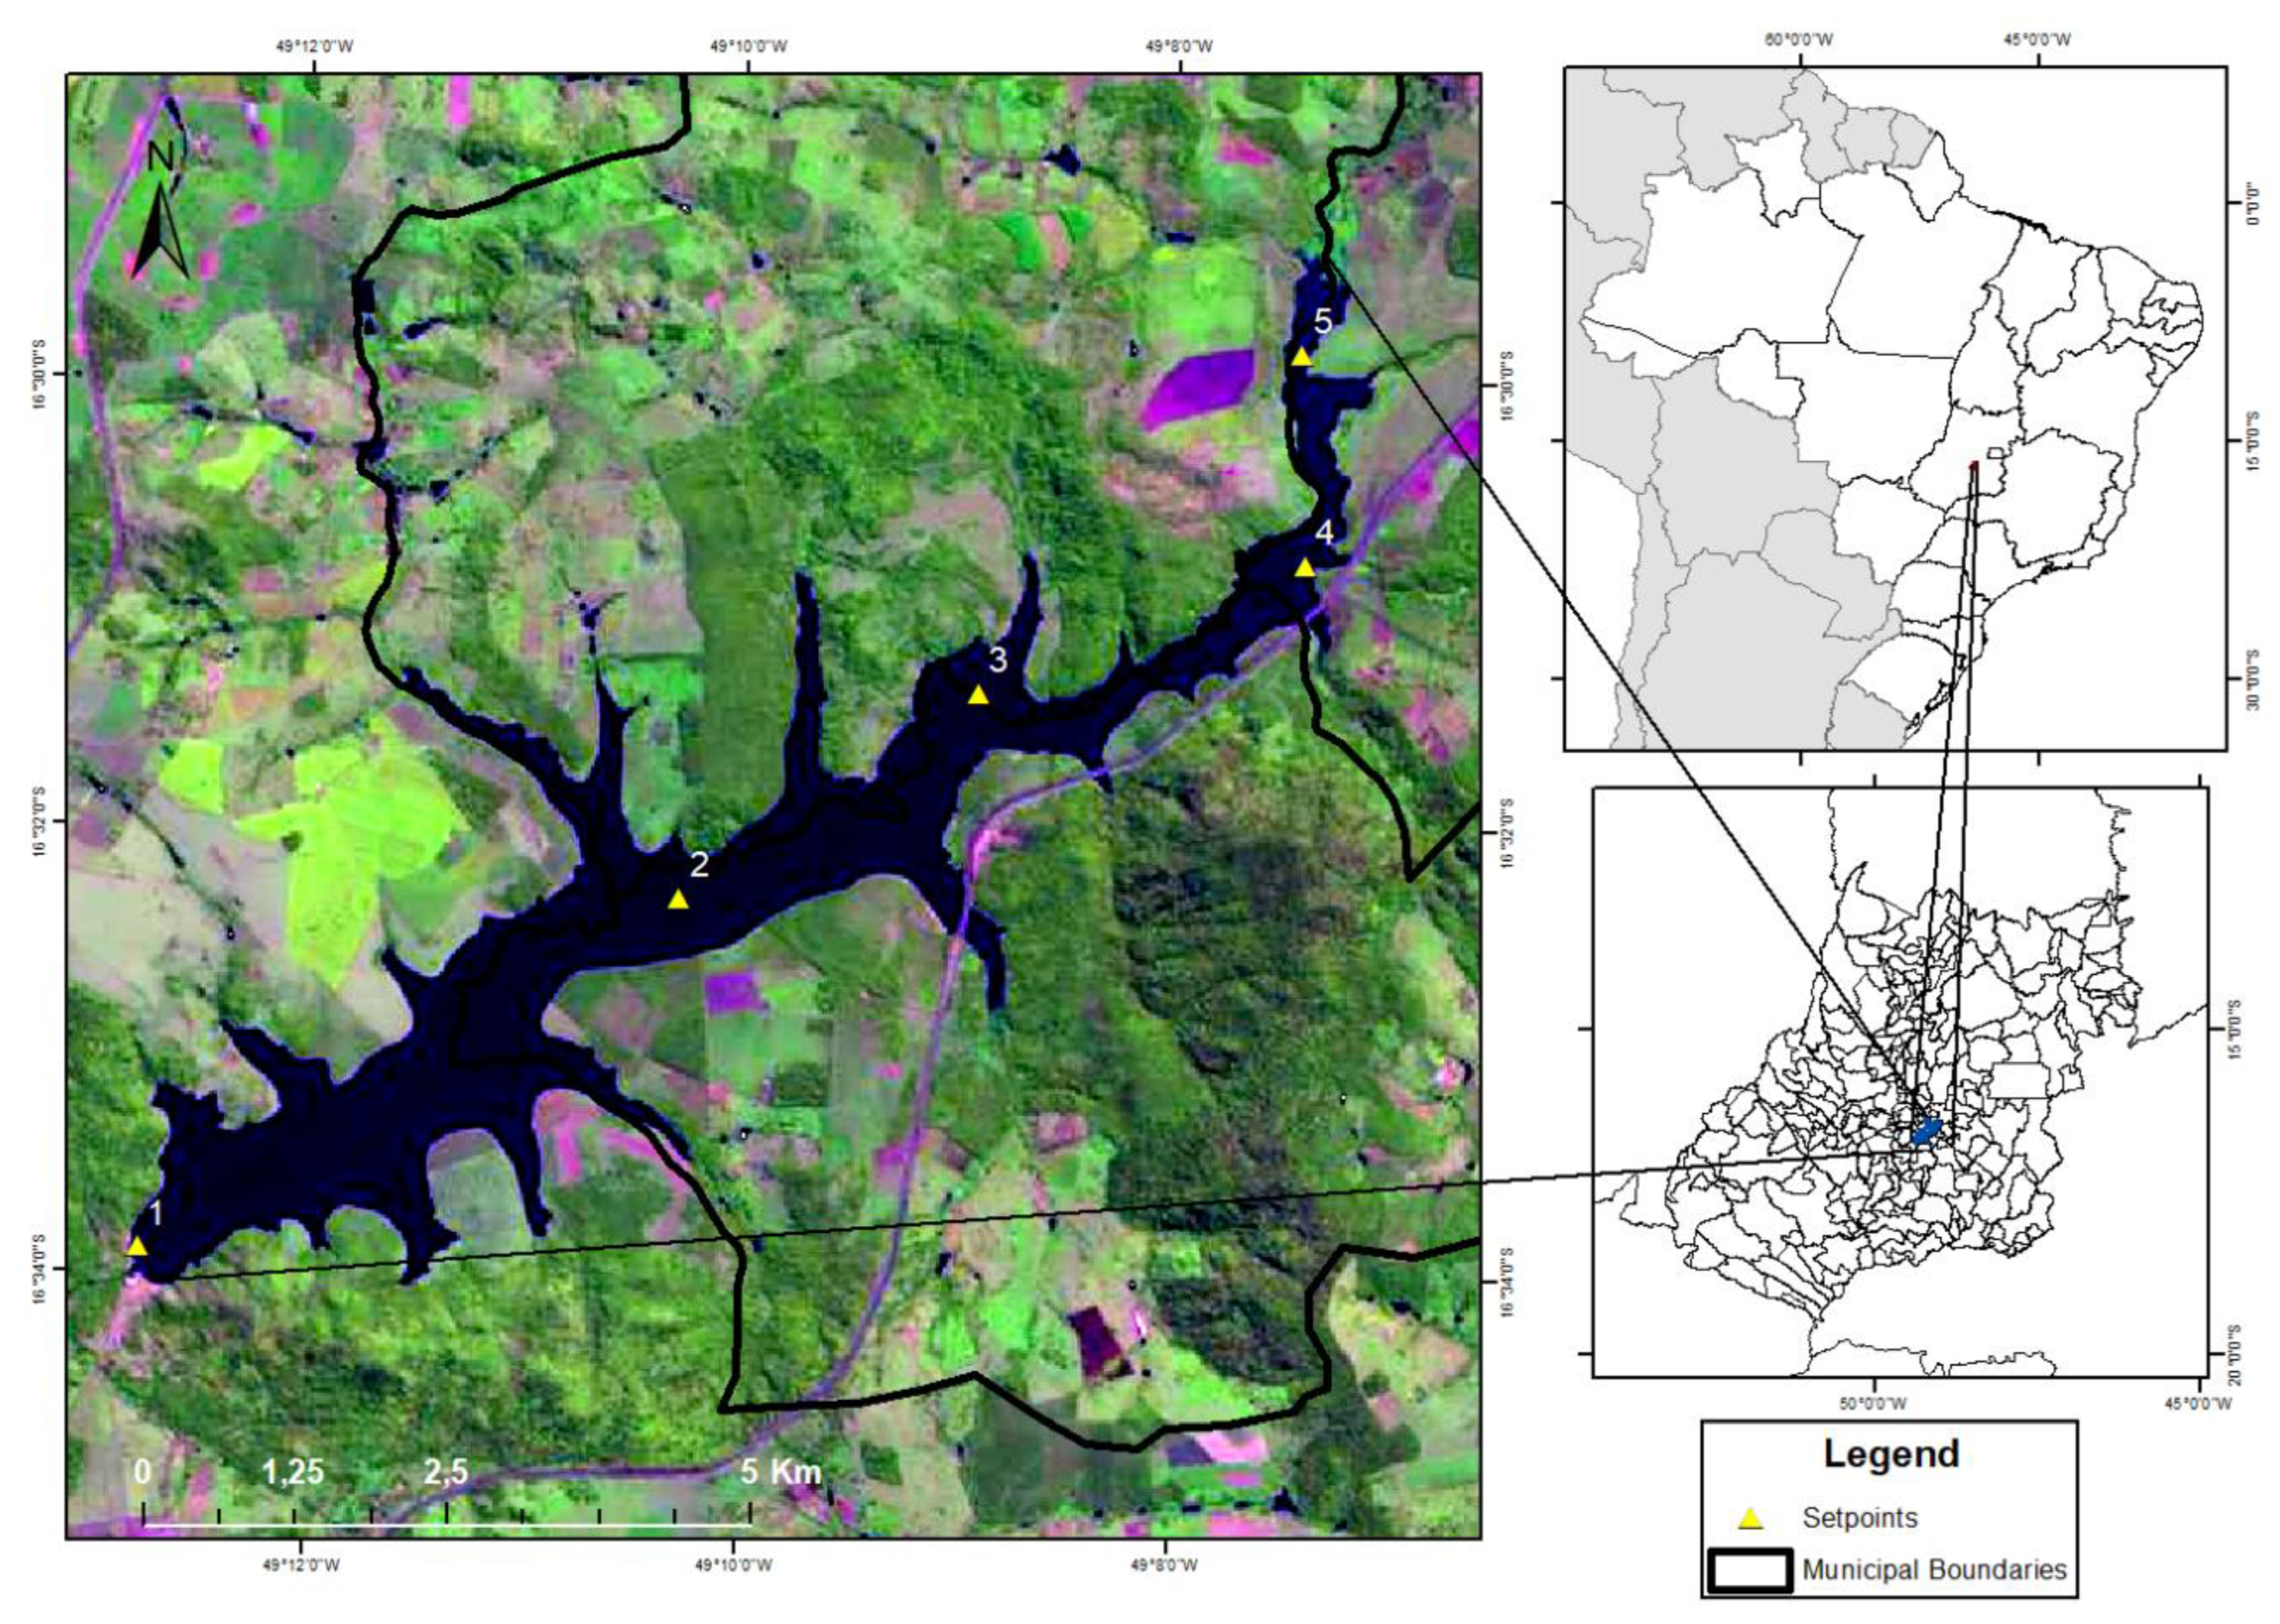
Figure 2.
Boxplot of the parameters in all evaluated months contemplating the points monitored in the water surface (P01 to P05).
Figure 2.
Boxplot of the parameters in all evaluated months contemplating the points monitored in the water surface (P01 to P05).
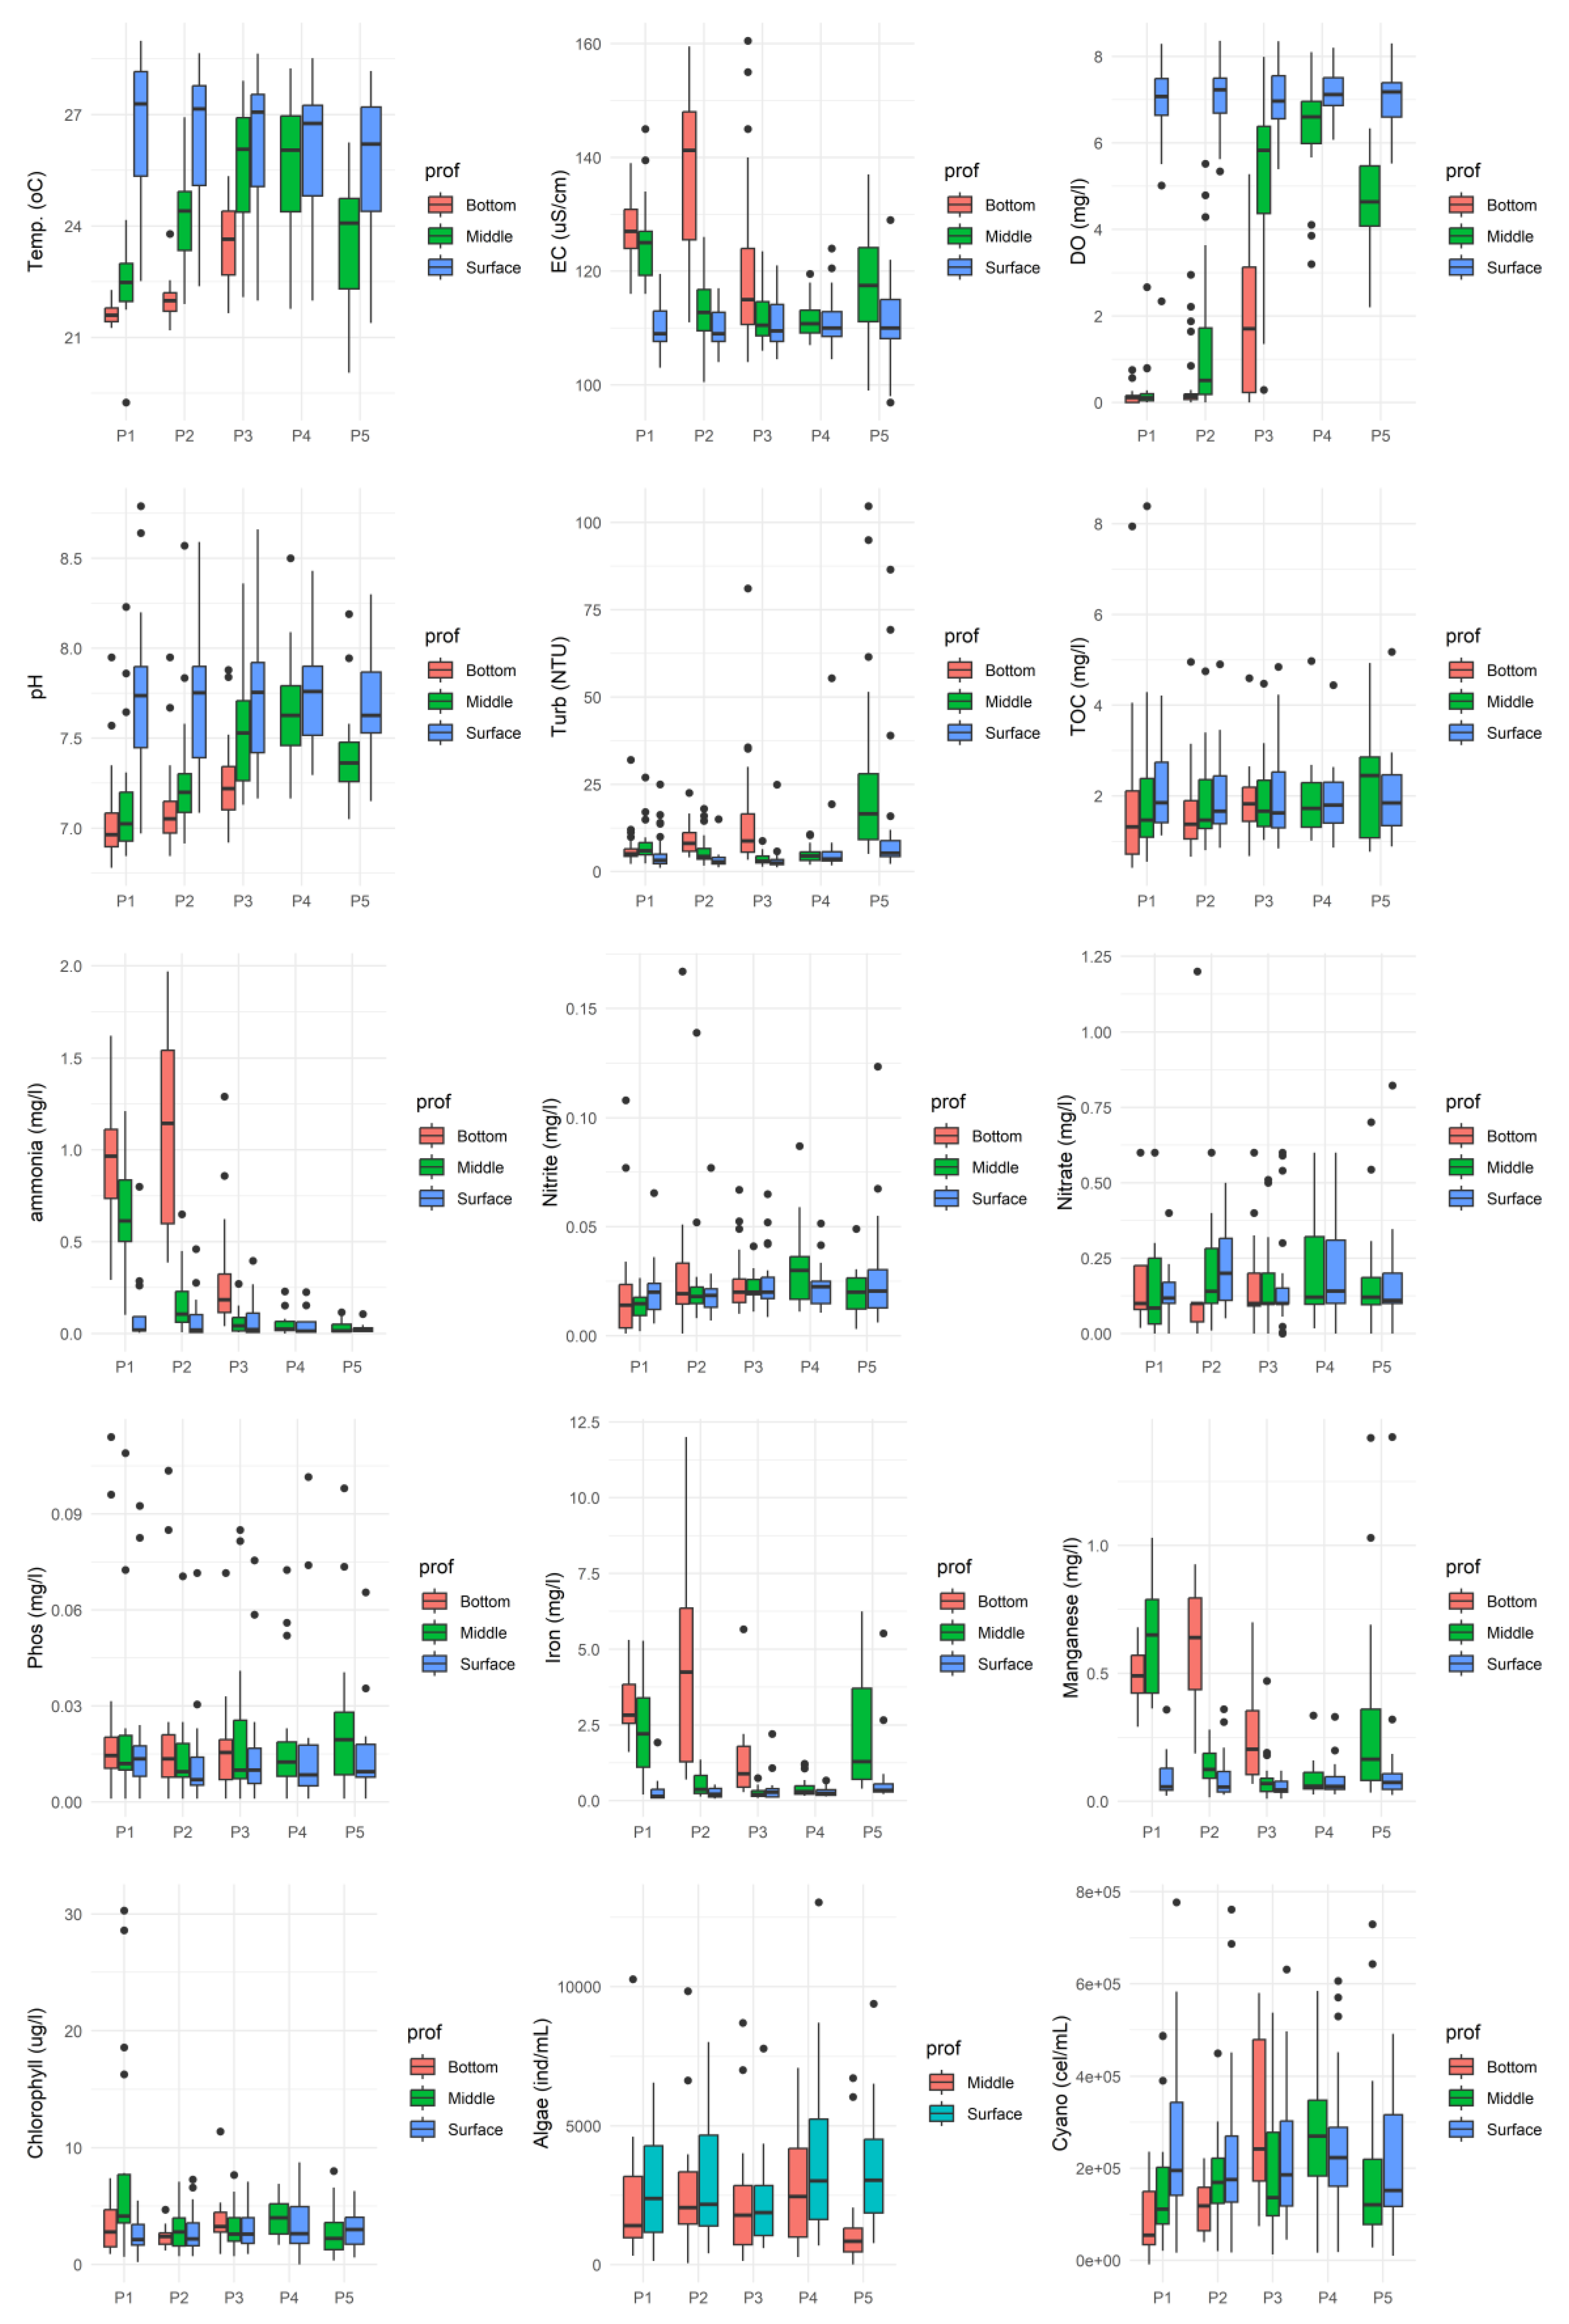
Figure 3.
Boxplot of the parameters in all the evaluated months contemplating the times monitored on the surface of the water column (P01 to P05).
Figure 3.
Boxplot of the parameters in all the evaluated months contemplating the times monitored on the surface of the water column (P01 to P05).
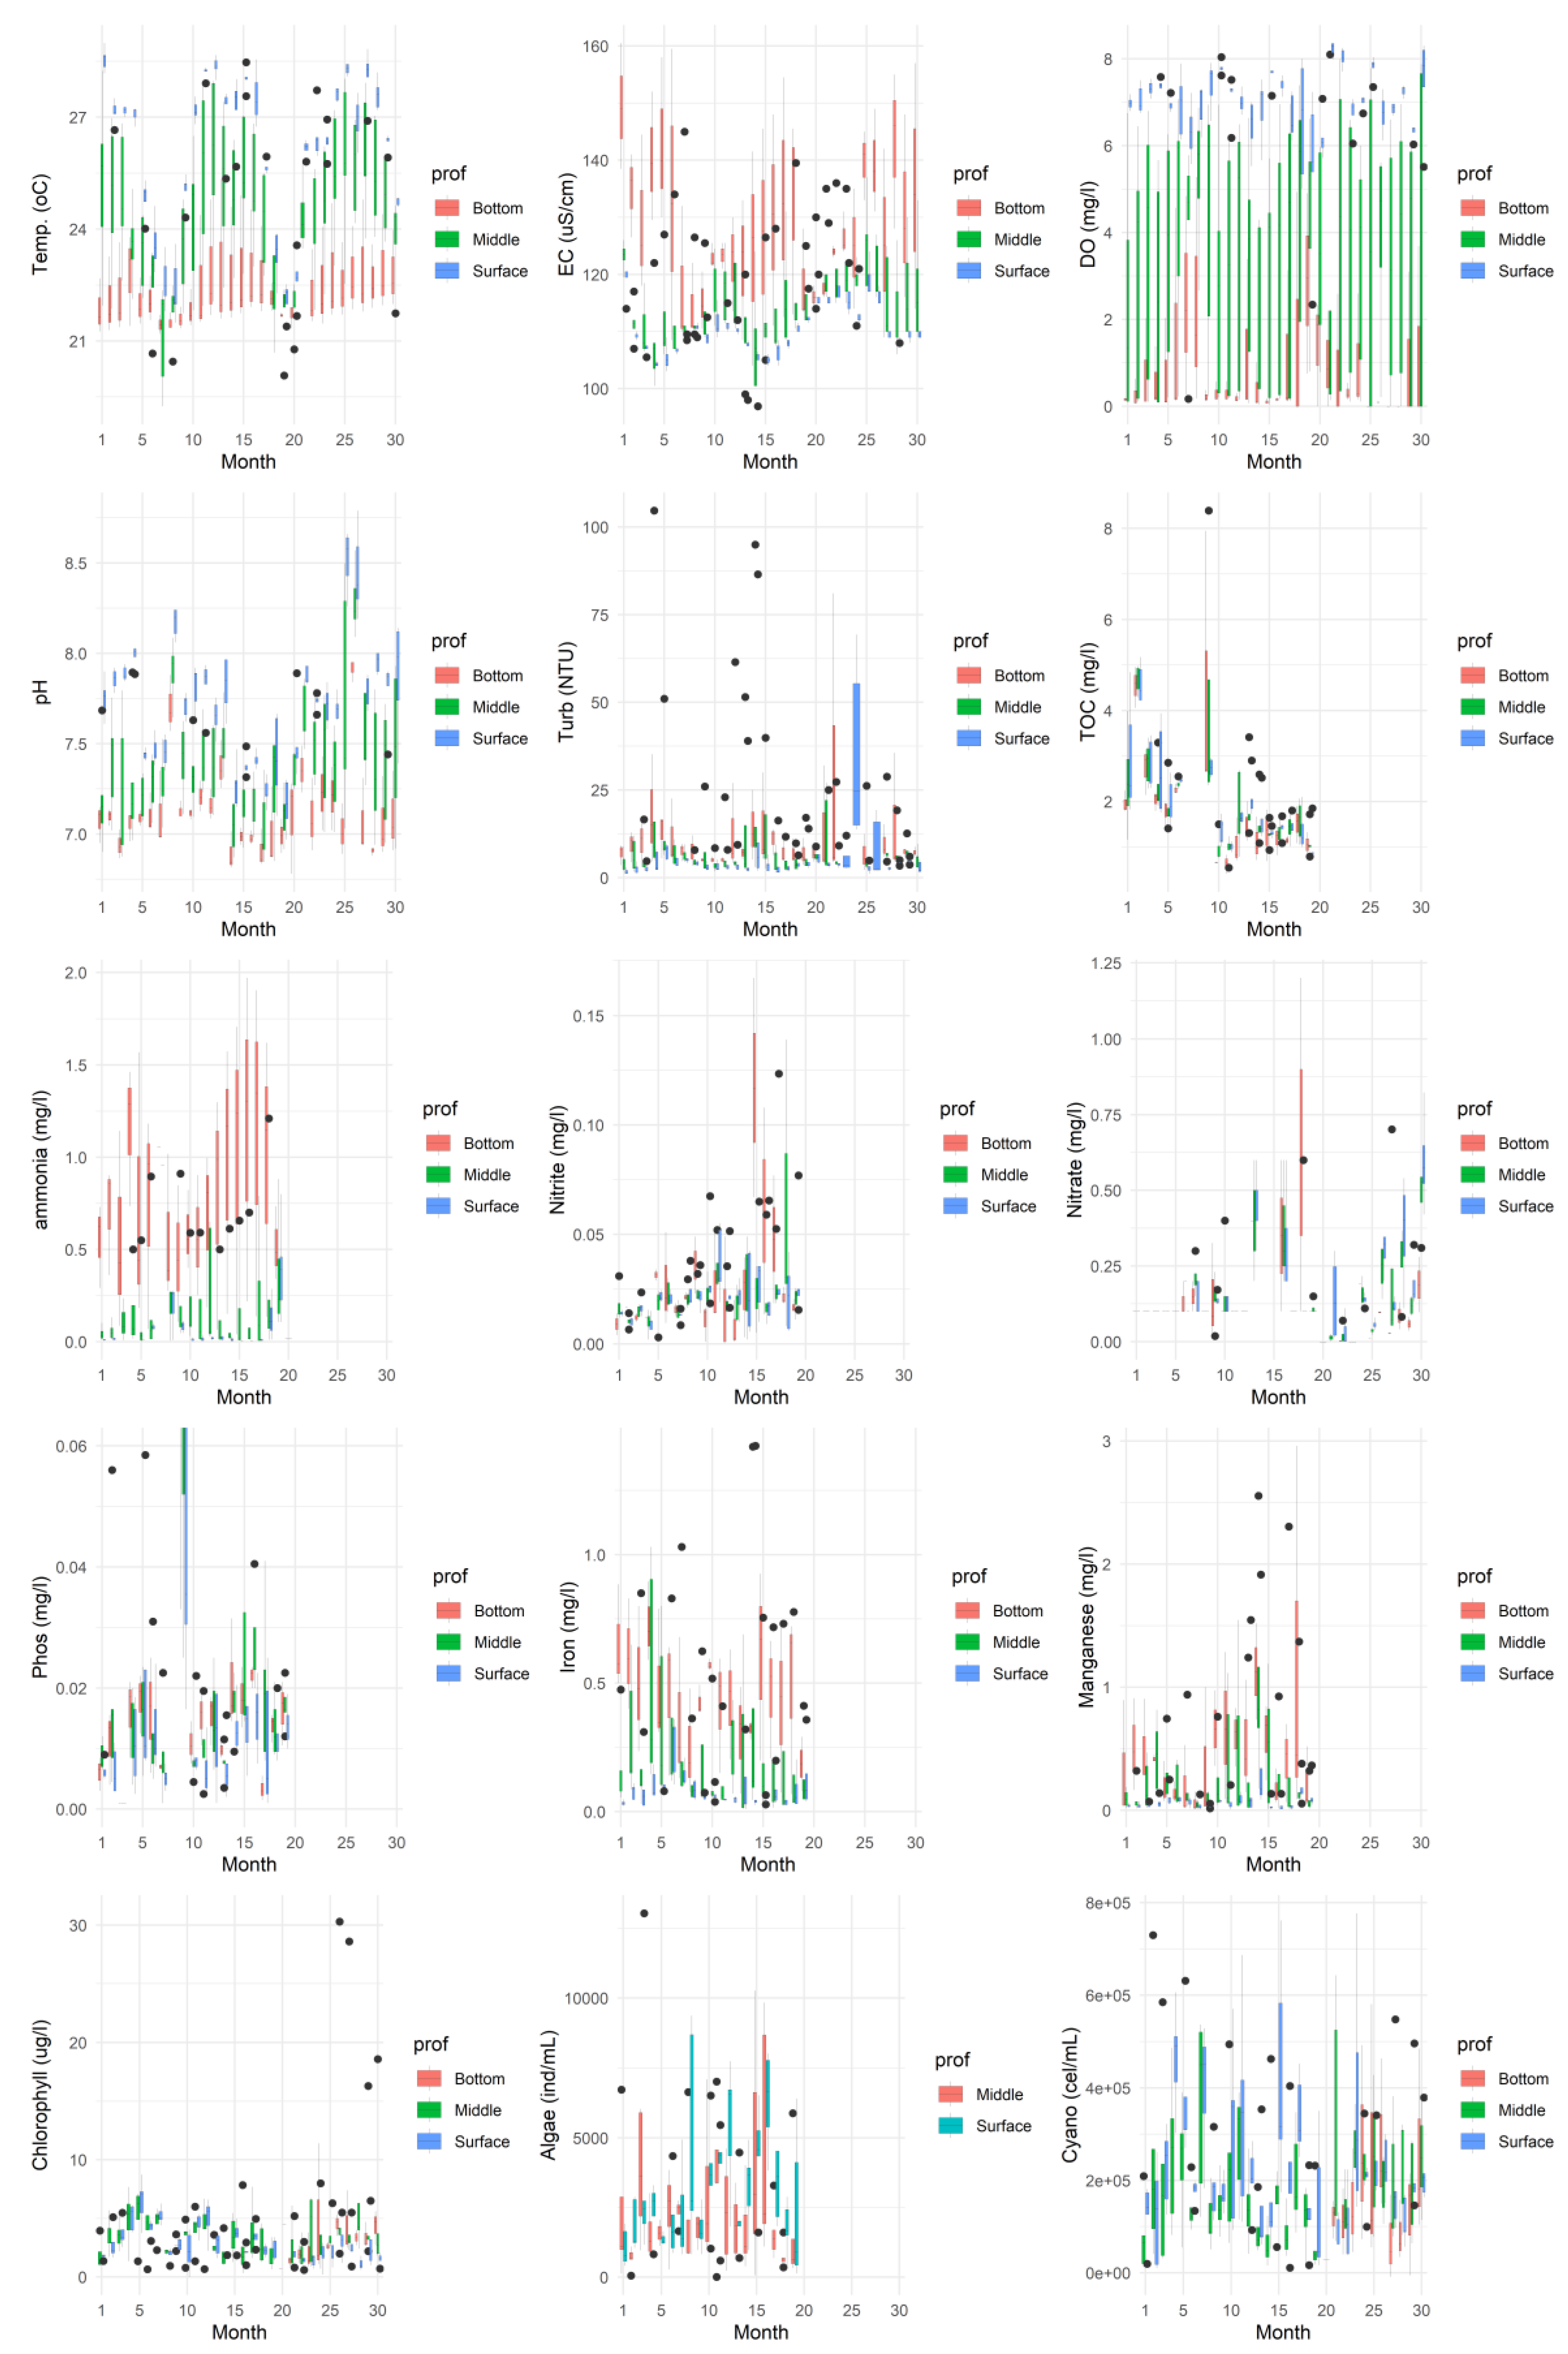
Figure 4.
Results of the Pearson correlation test for the physical and chemical parameters in the João Leite Reservoir.
Figure 4.
Results of the Pearson correlation test for the physical and chemical parameters in the João Leite Reservoir.
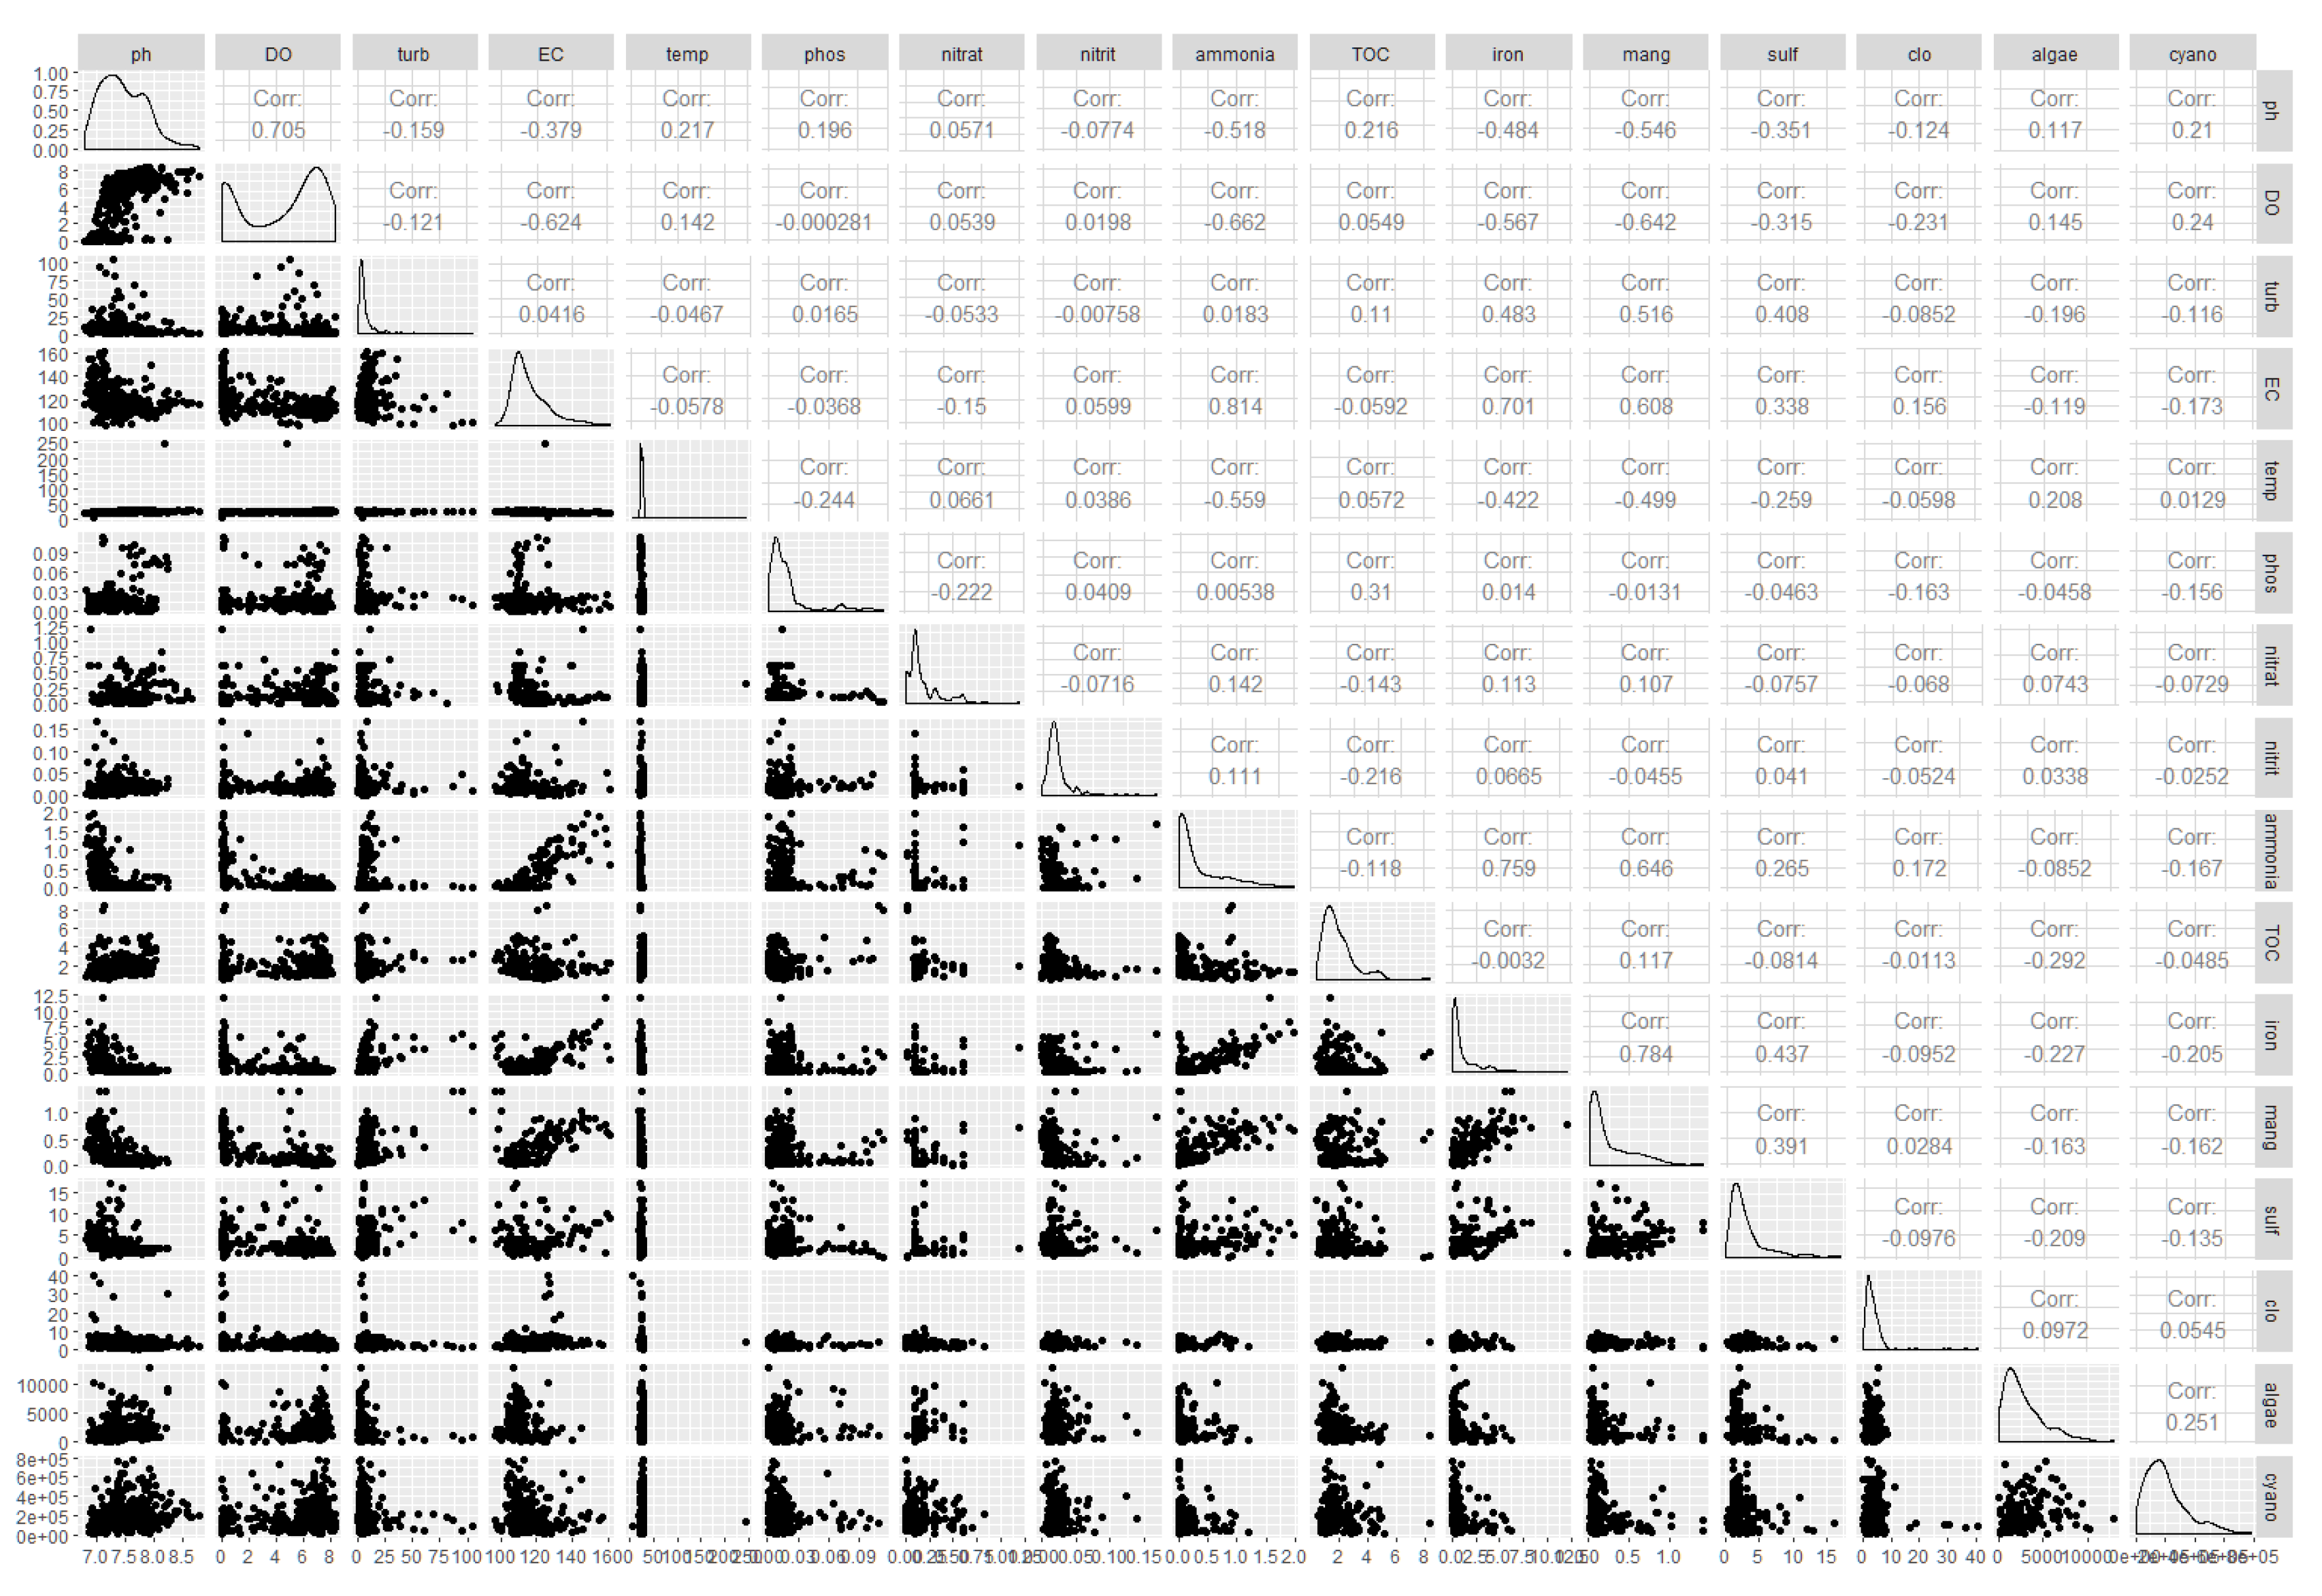
Figure 5.
Cluster analysis for physical and chemical parameters in the João Leite Reservoir.
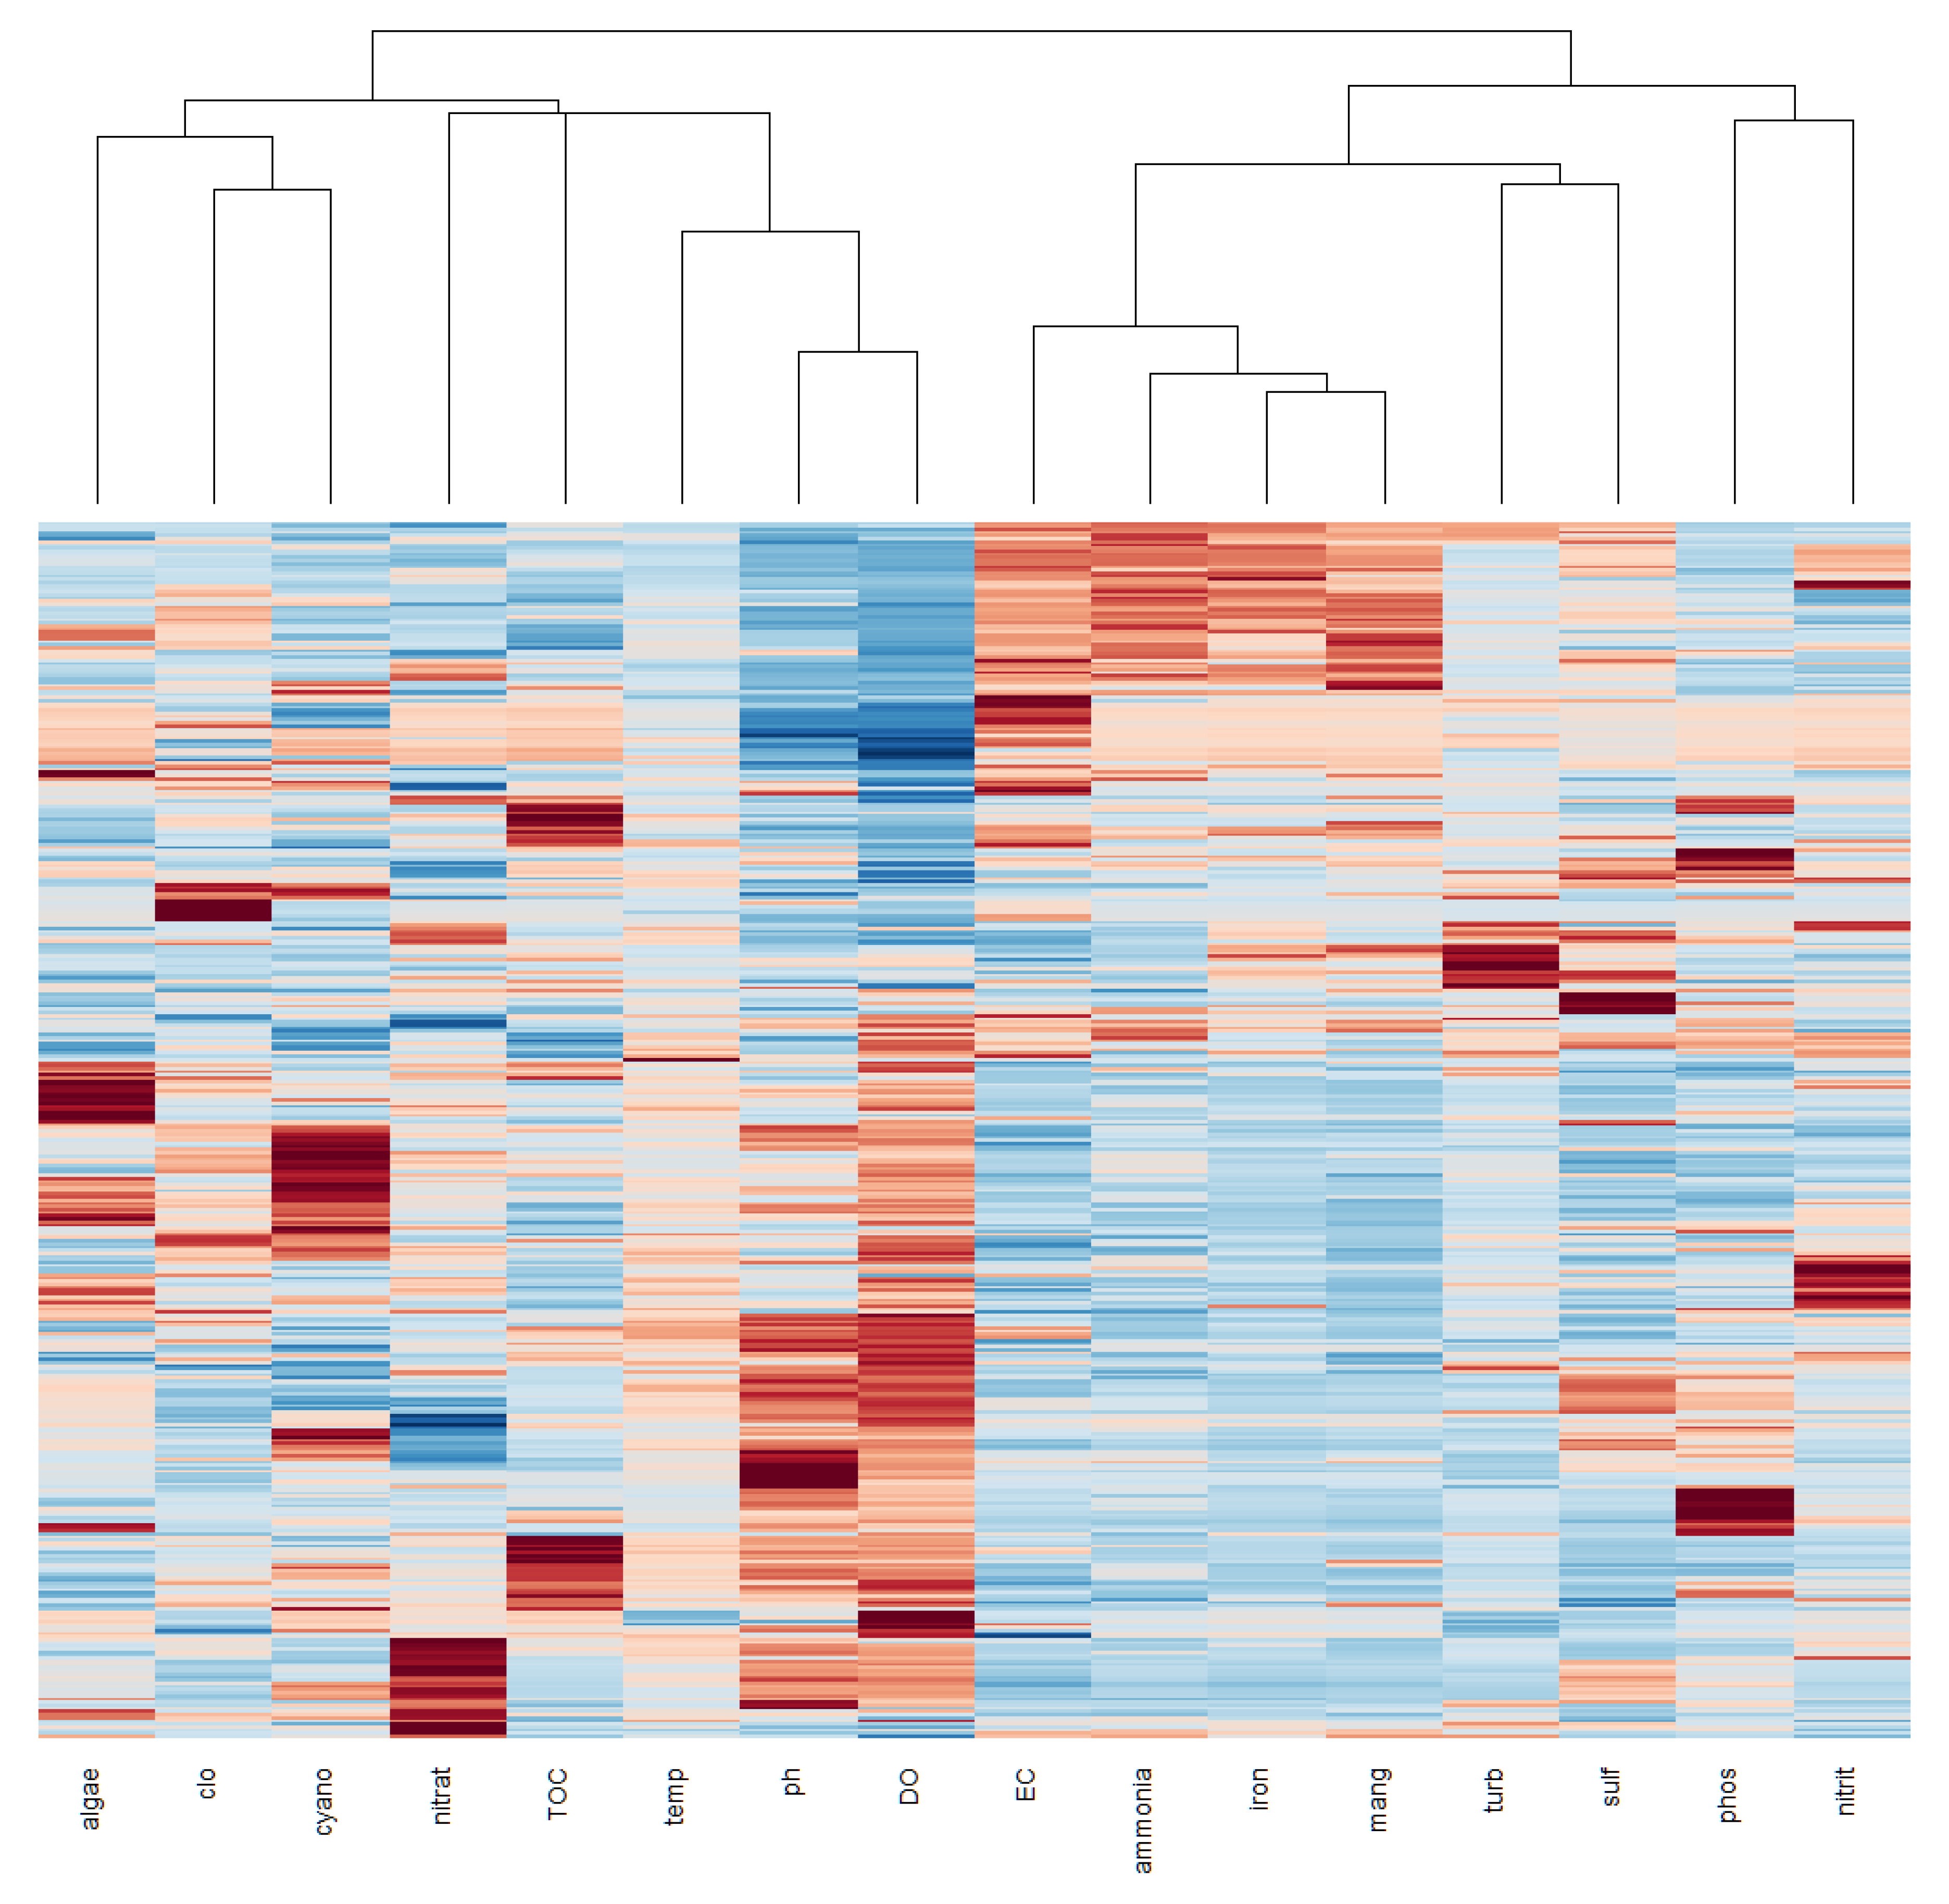
Figure 6.
a)- variance explained in the axes resulting from PCA b) graphical representation of the Principal Component Analysis (PCA) for the physical and chemical parameters.
Figure 6.
a)- variance explained in the axes resulting from PCA b) graphical representation of the Principal Component Analysis (PCA) for the physical and chemical parameters.
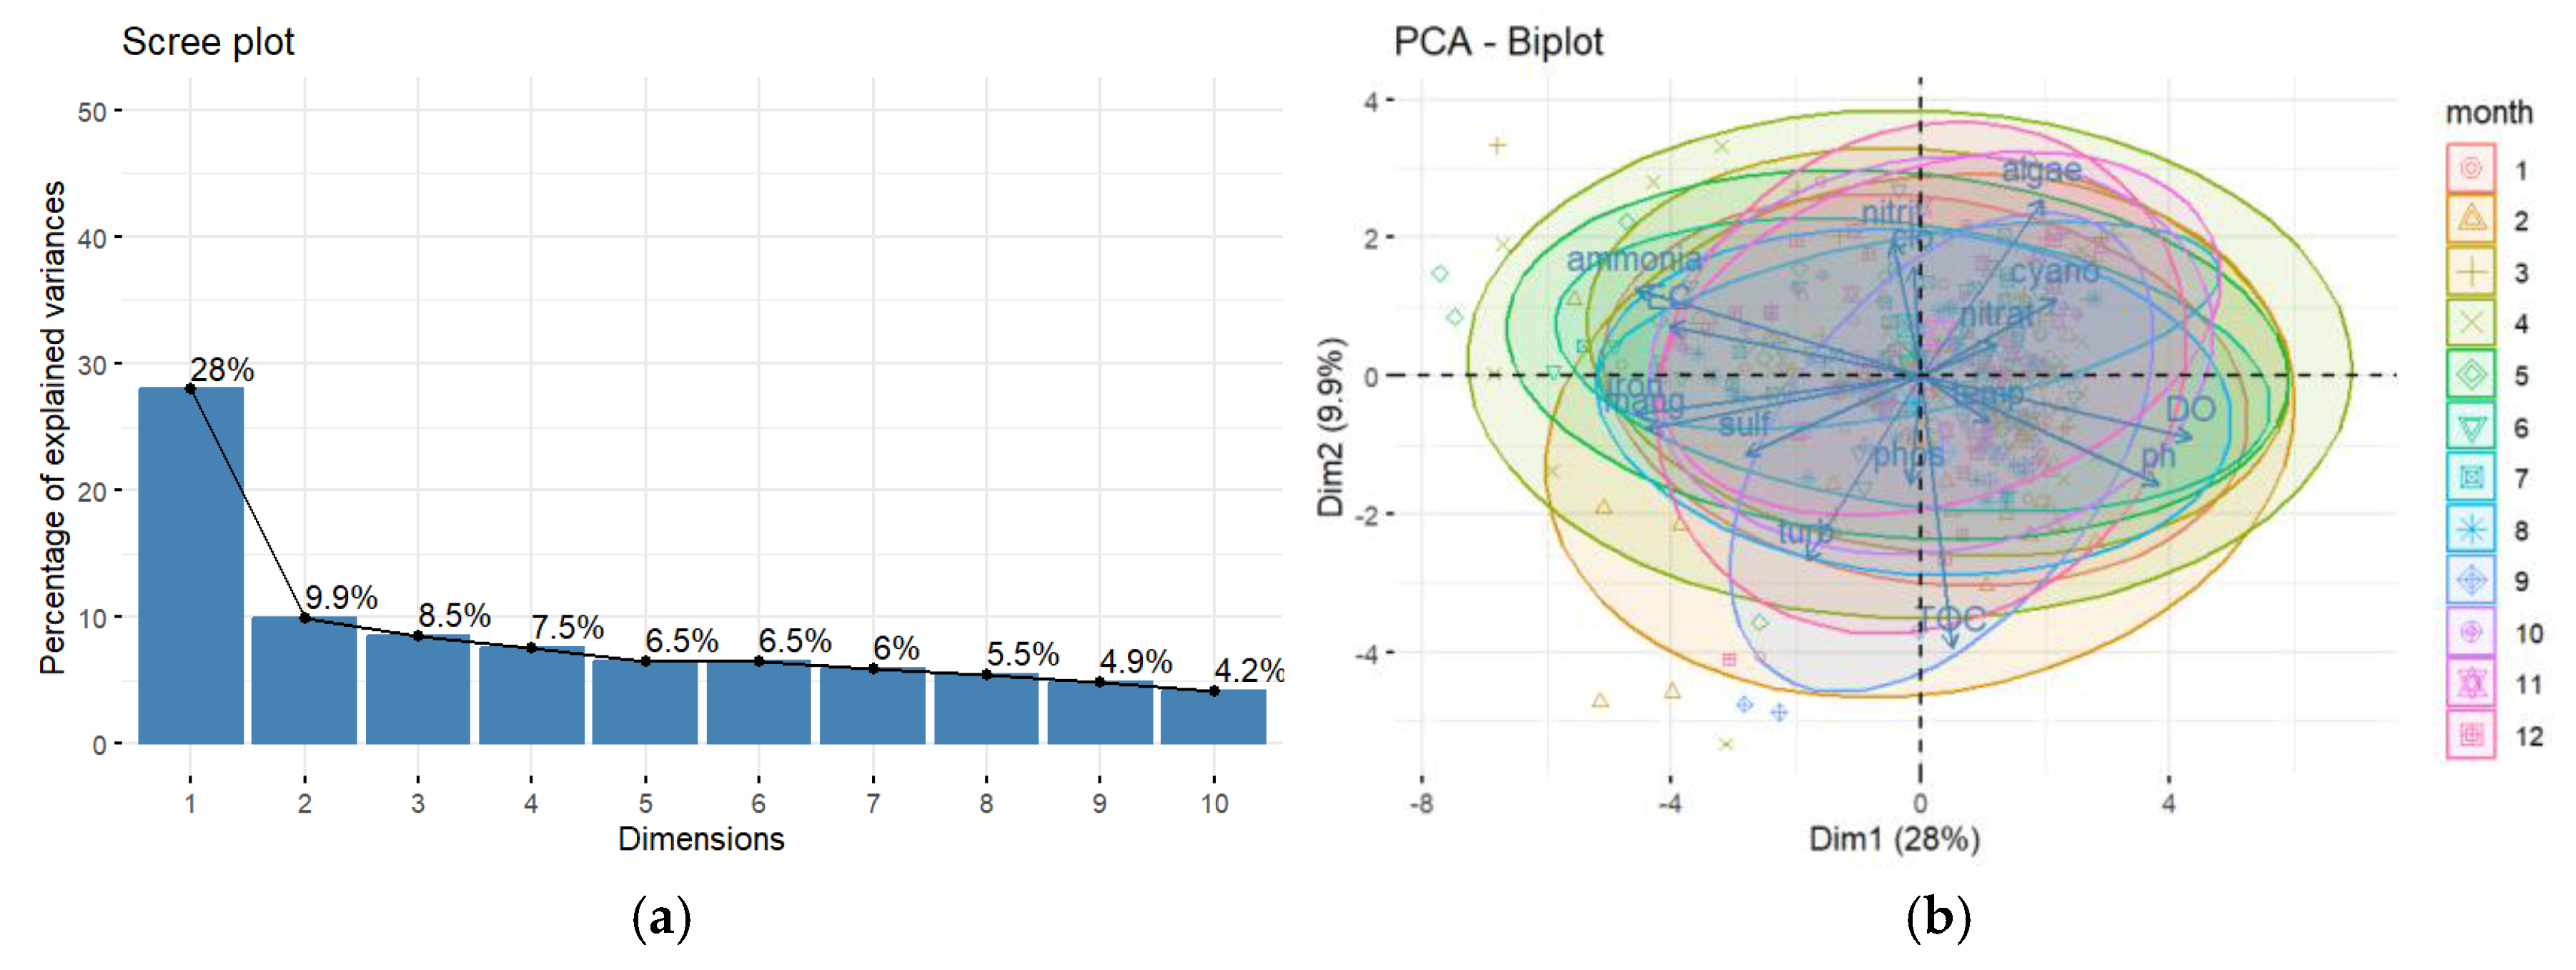
Figure 7.
a) Graphical representation of the predictive axes of the Principal Component Analysis (PCA) for the physical and chemical parameters. b) ordering of Canonical Correspondence Analysis (CCA) axes for physical and chemical parameters.
Figure 7.
a) Graphical representation of the predictive axes of the Principal Component Analysis (PCA) for the physical and chemical parameters. b) ordering of Canonical Correspondence Analysis (CCA) axes for physical and chemical parameters.
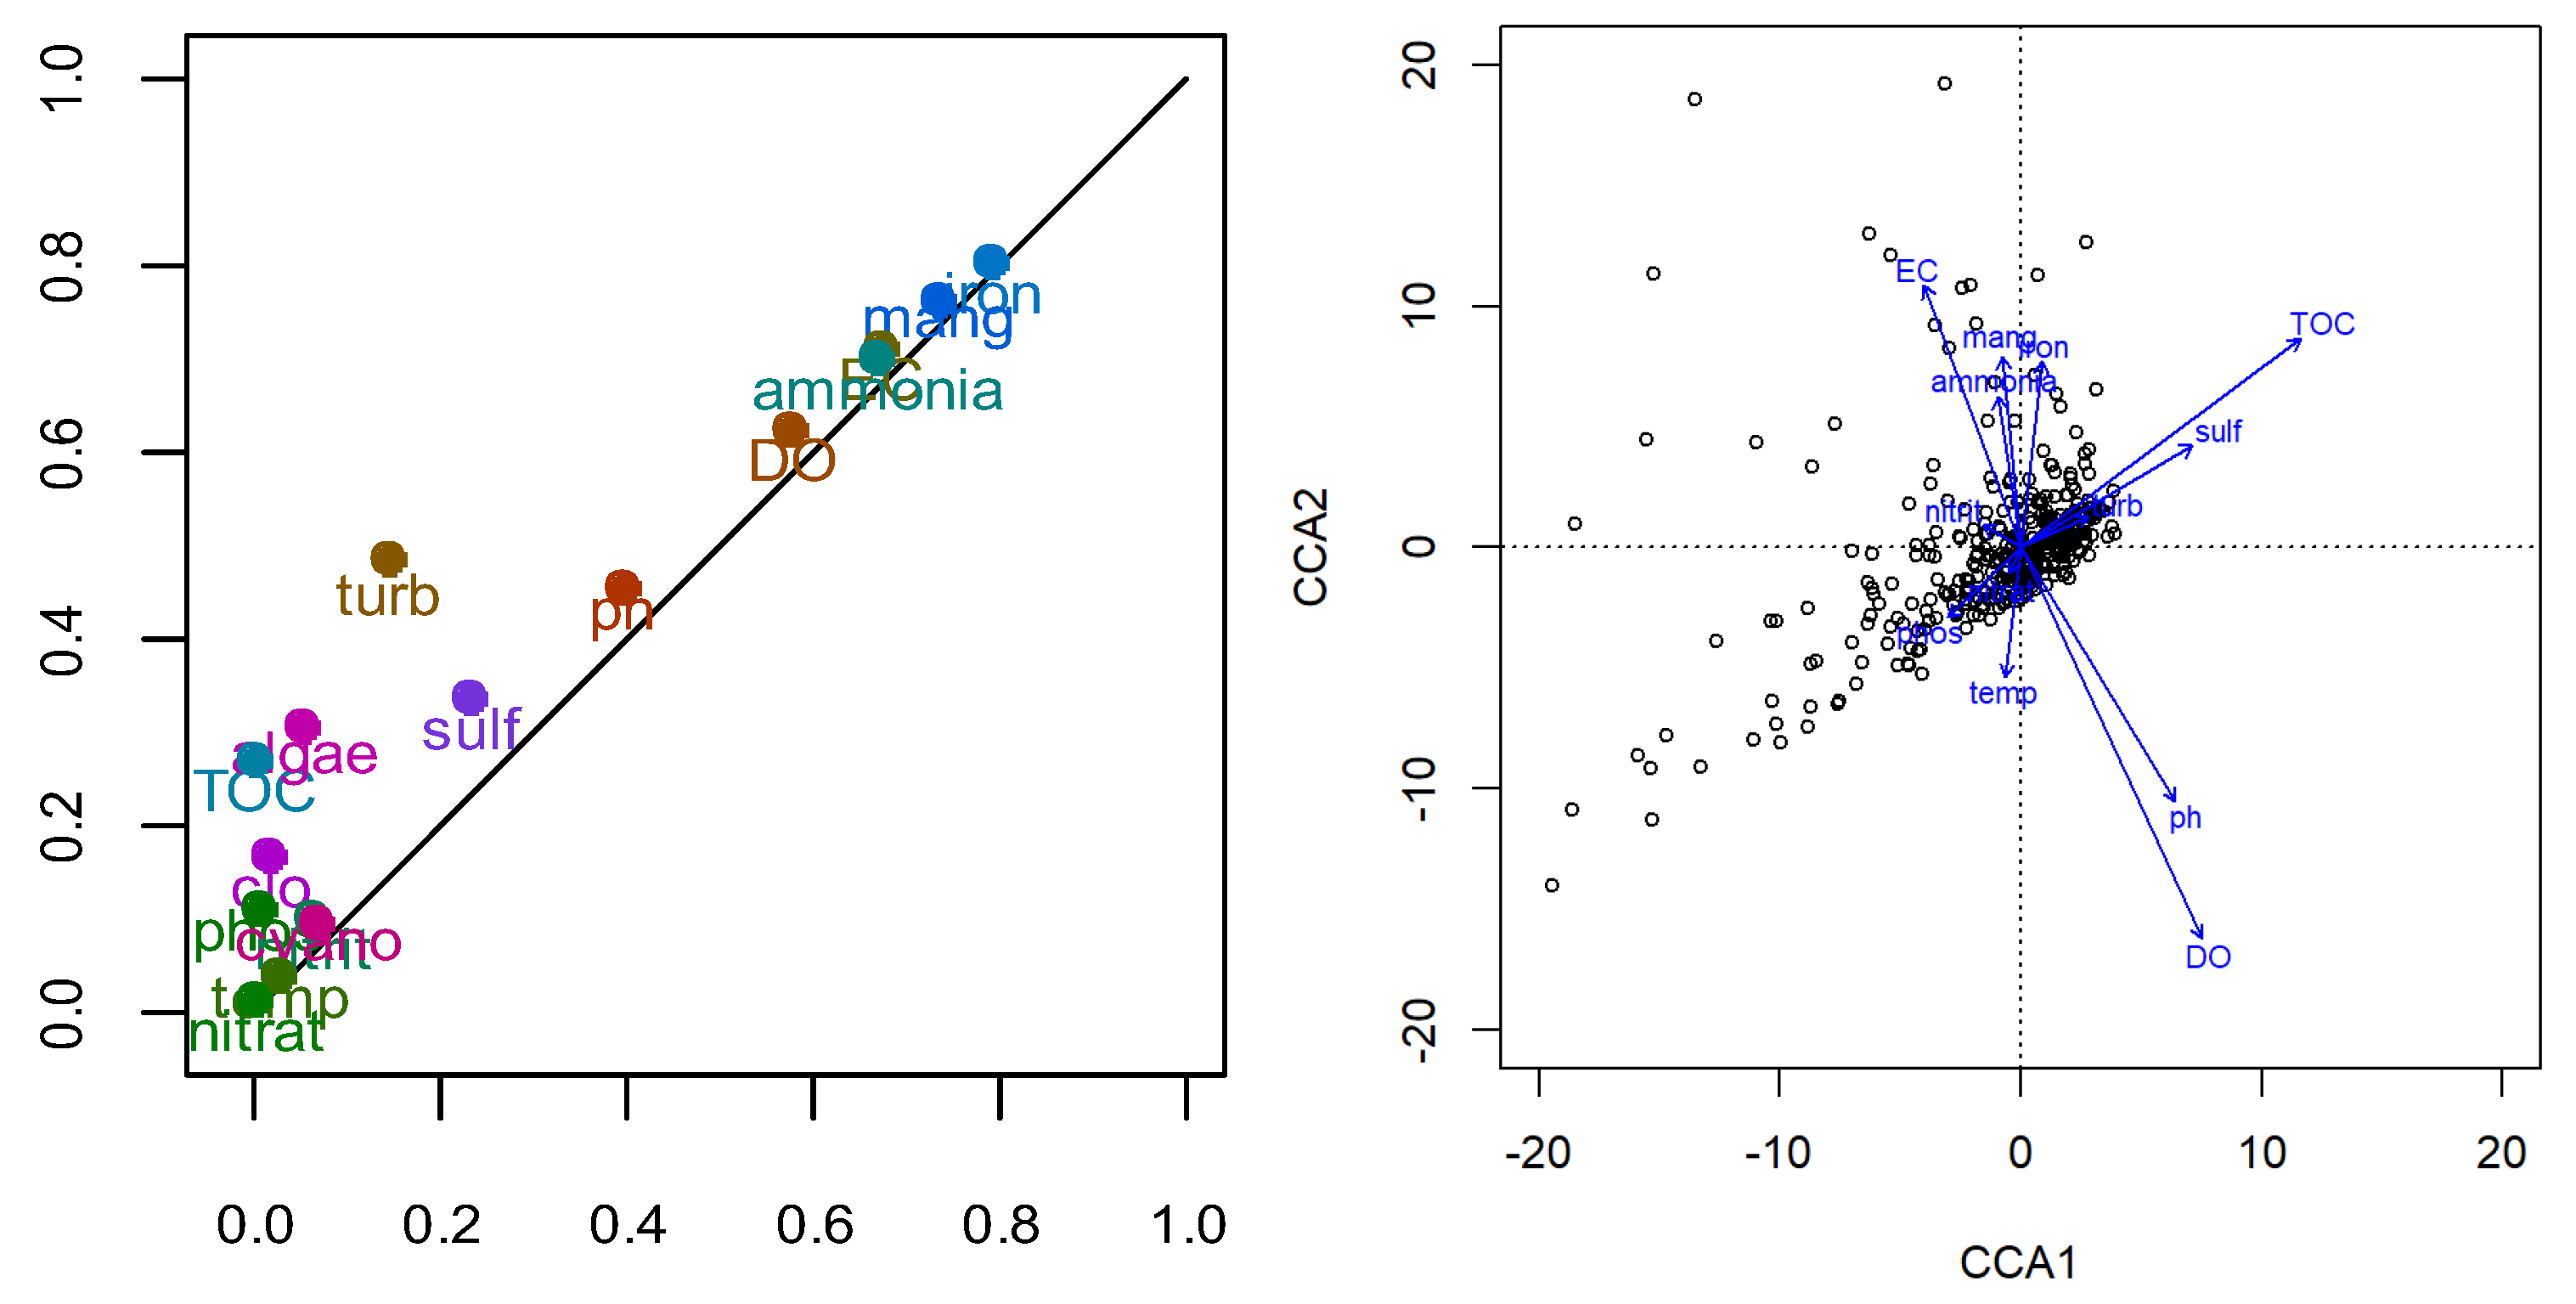
Figure 8.
Graphical representation of the TSI for the five sample points along the João Leite Reservoir.
Figure 8.
Graphical representation of the TSI for the five sample points along the João Leite Reservoir.
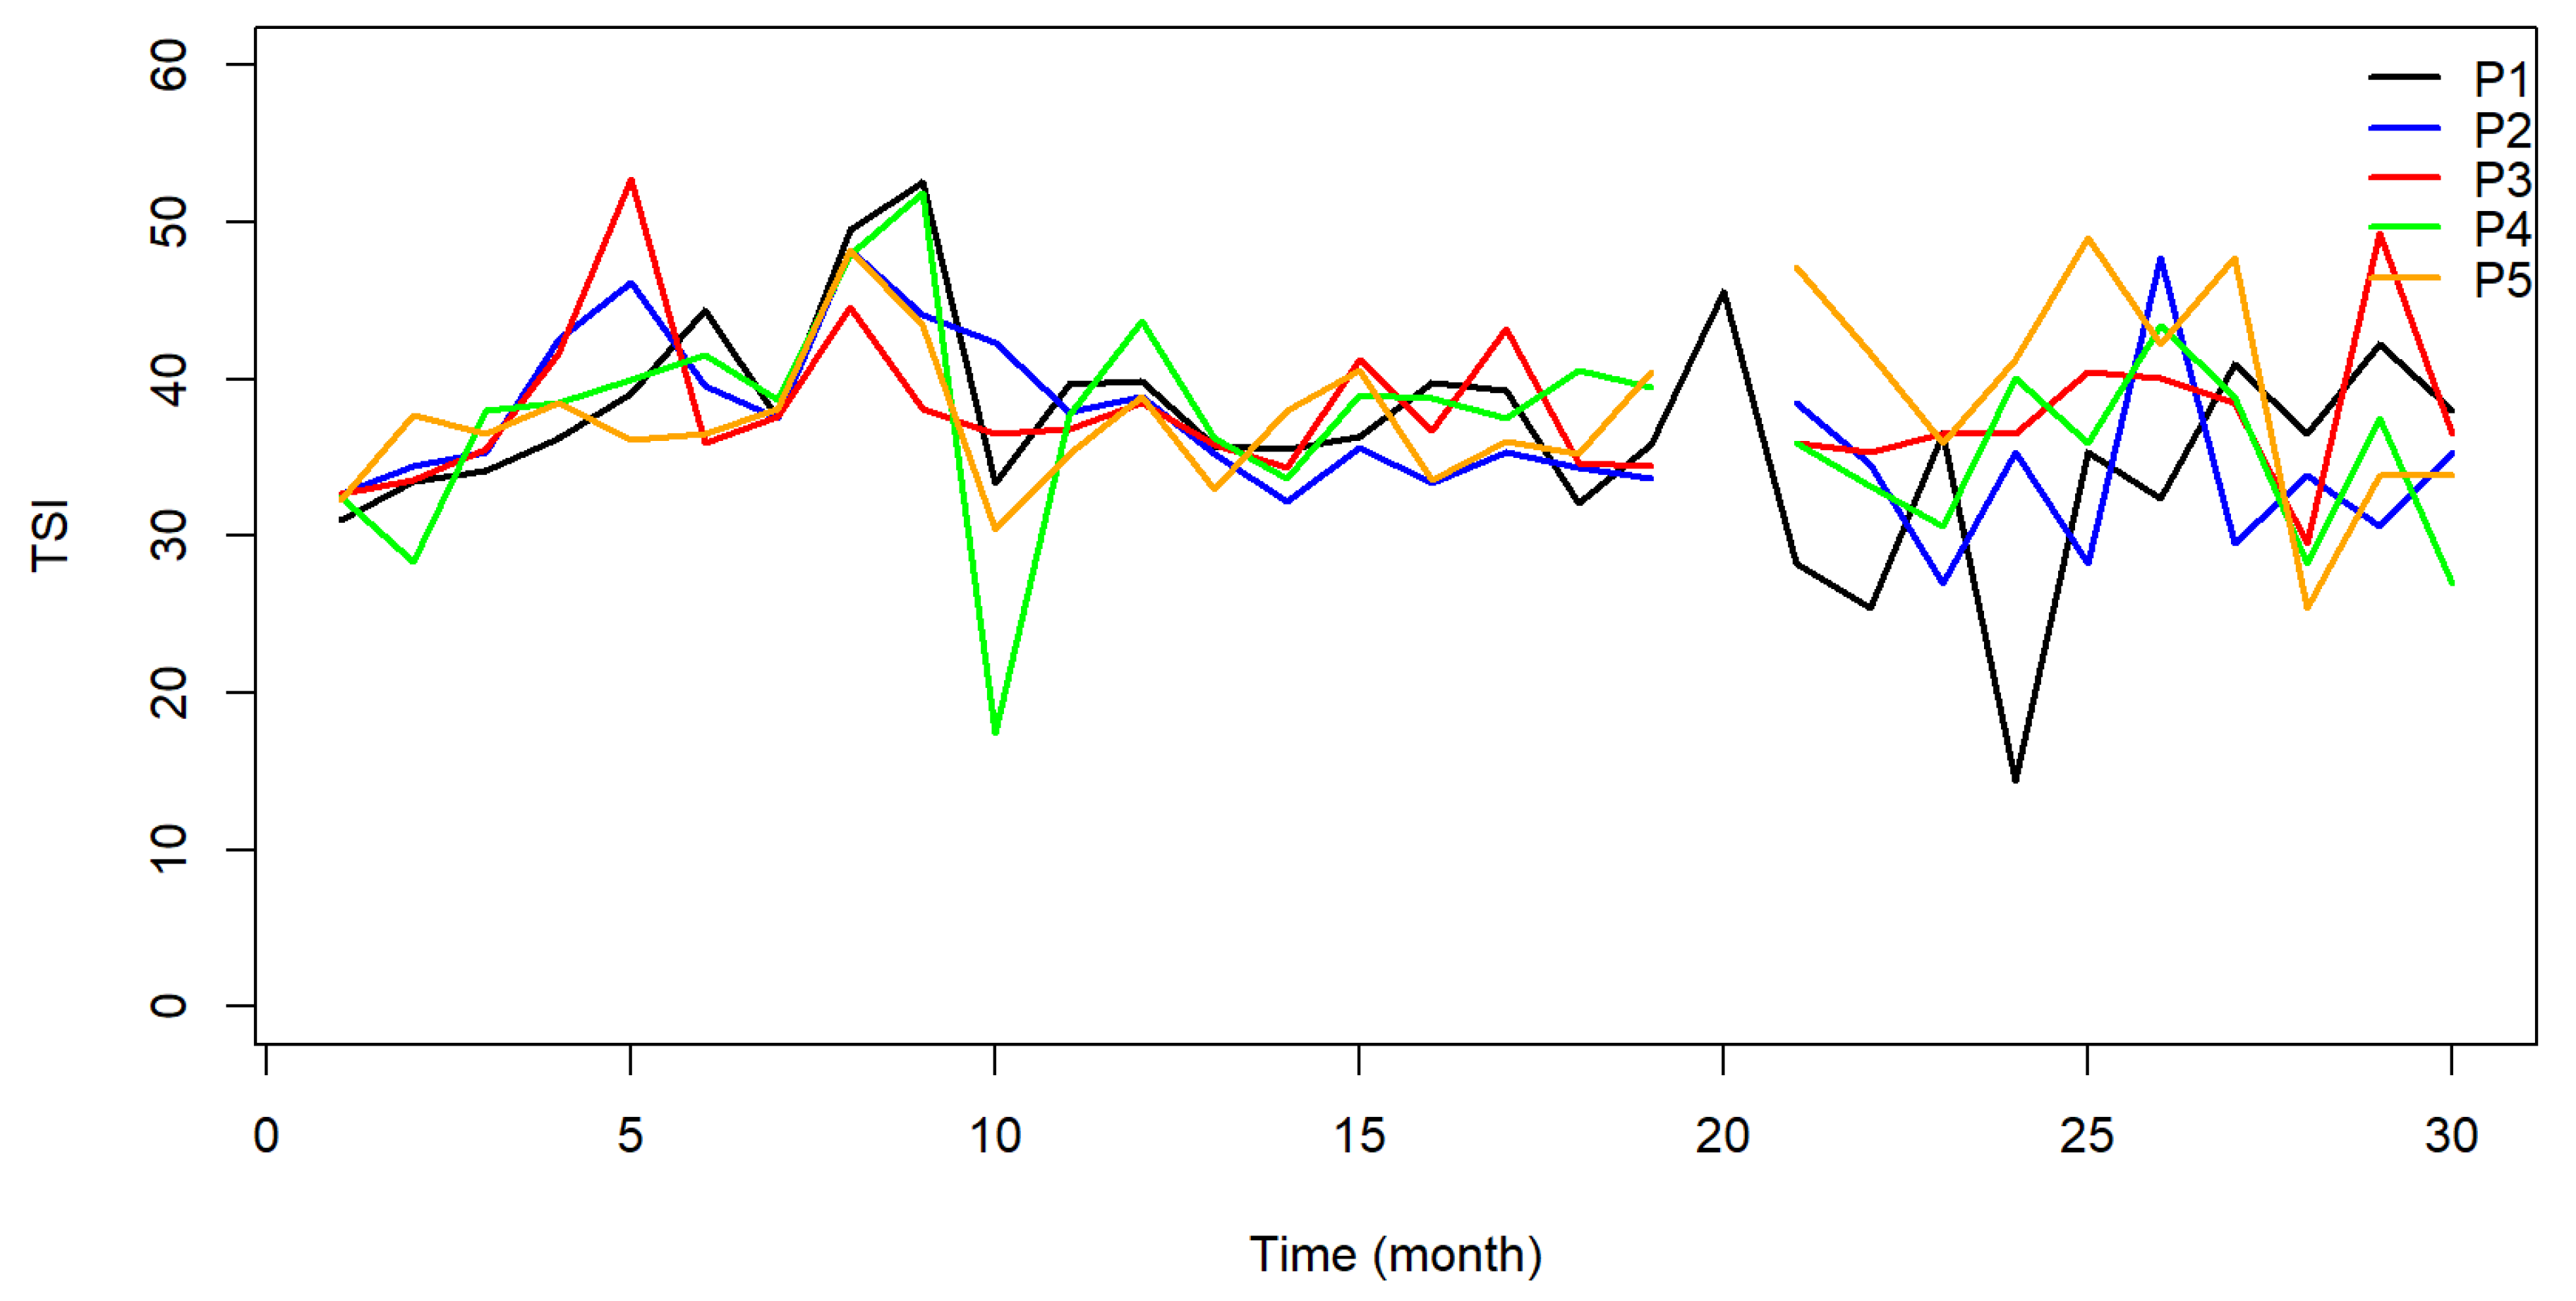

Table 2.
The percentage of total variance is explained by the principal components (Axis 1 and Axis 2), as well as the correlation of the parameters.
Table 2.
The percentage of total variance is explained by the principal components (Axis 1 and Axis 2), as well as the correlation of the parameters.
| Variance | Axis 1 | Axis 2 |
|---|---|---|
| 28,0% | 9,9% | |
| pH | 0.3295 | -0.2285 |
| DO | 0.3749 | -0.1314 |
| Turbidity (turb) | -0.1576 | -0.3888 |
| Electrical Cond. (EC) | -0.3474 | 0.1034 |
| Water temperature (temp) | 0.0957 | -0.0977 |
| Total phosphorus (phosp) | -0.0135 | -0.2267 |
| Nitrate | 0.1064 | 0.0665 |
| Nitrite | -0.0378 | 0.2807 |
| Ammonia | -0.3956 | 0.1823 |
| Total organic carbon (TOC) | 0.0429 | -0.5733 |
| Total iron (iron) | -0.3962 | -0.0820 |
| Manganese (mang) | -0.3802 | -0.1126 |
| Sulfate | -0.2427 | -0.1645 |
| Chlorophyll-a | -0.0107 | 0.2305 |
| Algae | 0.1695 | 0.3710 |
| Cyanobacteria | 0.1887 | 0.1595 |
Table 3.
Results of Canonical Correspondence Analysis (ACC) for physical and chemical parameters in the João Leite Reservoir.
Table 3.
Results of Canonical Correspondence Analysis (ACC) for physical and chemical parameters in the João Leite Reservoir.
| Axis 1 | Axis 2 | |
|---|---|---|
| Eigenvalues | 0.0008694 | 2.441e-06 |
| Proportion explained | 0.9972000 | 2.800e-03 |
| Cumulative ratio | 0.9972000 | 1.000e+00 |
| Scores biological parameters | ||
| Chlorophyll-a (clo) | -0.259900 | 3.710e-01 |
| Algae | -0.255799 | -5.098e-04 |
| Cyanobacteria (ciano) | 0.003399 | 1.054e-07 |
| Biplot scores physicochemical parameters. | ||
| pH | 0.32630 | -0.53392 |
| DO | 0.38116 | -0.82202 |
| Turbidity (turb) | 0.14211 | 0.06506 |
| Electrical Conductivity (EC) | -0.20276 | 0.55114 |
| Water temperature (temp) | -0.03188 | -0.27252 |
| Total phosphorus (phosp) | -0.15281 | -0.14644 |
| Nitrate | -0.02295 | -0.05340 |
| Nitrite | -0.07925 | 0.04514 |
| Ammonia | -0.04917 | 0.31724 |
| Total organic carbon (TOC) | 0.58905 | 0.43882 |
| Total iron (iron) | 0.04512 | 0.39125 |
| Manganese (mang) | -0.03817 | 0.40098 |
| Sulfate | 0.36101 | 0.21400 |
Disclaimer/Publisher’s Note: The statements, opinions and data contained in all publications are solely those of the individual author(s) and contributor(s) and not of MDPI and/or the editor(s). MDPI and/or the editor(s) disclaim responsibility for any injury to people or property resulting from any ideas, methods, instructions or products referred to in the content. |
© 2025 by the authors. Licensee MDPI, Basel, Switzerland. This article is an open access article distributed under the terms and conditions of the Creative Commons Attribution (CC BY) license (http://creativecommons.org/licenses/by/4.0/).
Copyright: This open access article is published under a Creative Commons CC BY 4.0 license, which permit the free download, distribution, and reuse, provided that the author and preprint are cited in any reuse.


