
Submitted:
05 May 2025
Posted:
07 May 2025
You are already at the latest version
Abstract
In response to climate change, the UK government released the report ‘Net Zero Emissions and the Future of Green Finance’ in 2019, aiming to guide capital flows to low-carbon sectors and promote green transformation in the manufacturing sector through green finance policies. Taking the panel data of UK manufacturing firms from 2015-2022 as a sample, this paper constructs a quasi-natural experiment based on the 2019 policy, and analyses the causal effect of green finance policy on capital structure using a difference in difference model (DID). The study sets capital goods manufacturing firms as the experimental group (GICS code beginning with 2010) and other product manufacturing firms as the control group, and further examines the heterogeneous effects of financing constraints and firm size. The results show that the policy significantly reduces the financial leverage of capital goods firms, and the effect is more prominent for firms with high financing constraints and smaller size. Based on the results, this paper proposes policy optimisation proposals at the government, financial institution and enterprise levels to help achieve the goal of "net-zero emissions".
Keywords:
Green Financial Policies
; Capital Structure
; Difference in Difference model
; Manufacturing Firms
; Firm size
1. Introduction
Since the 21st century, global climate change has intensified due to excessive fossil fuel consumption and environmental degradation. Rising risks of extreme weather events and sea-level rise have compelled nations to accelerate low-carbon transitions. In response, the UK has progressively built an environmental governance framework since enacting the Clean Air Act and actively engaged in global climate action through international agreements such as the United Nations Framework Convention on Climate Change (UNFCCC). The 2009 Low-Carbon Transition Plan formally positioned green finance as a national strategic priority, emphasizing the financial system’s critical role in supporting a low-carbon economy (Leach et al., 2009). Subsequently, the UK established the Green Economy Council (2011) and the world’s first green investment bank (2012), leveraging policies like tax incentives and green credit to redirect capital toward sustainable sectors. These efforts laid the foundation for the 2019 report "The Future of Net Zero Emissions and Green Finance", which aims to align financial flows with climate goals.
By 2018, the UK emerged as a global leader in green finance, with private investments in clean energy surpassing £180 billion (Task Force, 2018). The government’s 2018 Green Finance Strategy further institutionalized this progress, outlining market expansion goals and policy frameworks. Critical momentum came in 2019 when Parliament legislated a binding net-zero emissions target by 2050 (Lamb, 2021). This regulatory backbone, combined with a mature multi-stakeholder system, enables coordinated action: the government sets policies and incentives (e.g., tax breaks for green bonds), financial institutions design targeted products (e.g., low-interest green loans), and institutional investors allocate capital to sustainable sectors. Such synergy has solidified the UK’s role as a laboratory for expandable green finance models.
The UK’s green transition in manufacturing has been guided by a phased strategy since 2013. The 2013 Foresight Report outlined a route map to 2050, prioritizing sustainable practices such as resource efficiency, circular production, and supply chain decarbonisation (Foresight, 2013). This vision was reinforced in the 2019 Future of Net Zero Emissions and Green Finance report, which aligned economic recovery with climate goals by advocating cross-sector coordination, green financial innovation (e.g., sustainable infrastructure financing), and targeted support for manufacturing—a sector central to achieving cost-effective net-zero transitions (Treasury Committee, 2021).
UK manufacturing output grew by 35% over the past five decades, peaking pre-2008 financial crisis (Barnett, 2014). This growth trajectory, however, intensified the sector’s environmental footprint, driving policymakers to leverage green finance as a structural reform tool. By channeling capital toward energy-efficient technologies and renewable energy adoption (Jahanger, 2023), green finance policies directly reshape manufacturing firms’ capital structures—balancing debt-equity ratios while reducing reliance on traditional bank loans. Such reallocation enables firms to fund innovation, enhance competitiveness, and align with the policy’s dual mandate: minimizing ecological harm through low-waste production cycles while maintaining economic viability (Cheng et al., 2023).
Green finance integrates environmental and climate objectives into financial activities—from green bonds to carbon trading—to redirect capital toward sustainable industries (Scholtens, 2006). This study examines how such policies reshape the capital structure of UK manufacturing firms, particularly under the 2019 Net Zero Emissions and Green Finance framework. By requiring firms to meet environmental criteria for financing access, the policy incentives debt-to-equity optimization while funding green upgrades, thereby linking corporate financial strategies directly to national climate goals.
Theoretical and practical gaps motivate this study. While prior research extensively explores capital structure determinants, green finance’s role remains less examined. This paper addresses this gap by employing a difference-in-differences (DID) model to quantify how UK green finance policies—particularly the 2019 Net Zero Emissions framework—reshape manufacturing firms debt-equity choices. Theoretically, it extends capital structure theories (e.g., trade-off and pecking order) by integrating environmental regulatory mechanisms (e.g., financing incentives/penalties), revealing how policy-driven constraints catalyze capital reallocation. Practically, the analysis provides empirical evidence on policy efficacy in reducing emissions, while heterogeneity tests (financing constraints, firm size) offer actionable insights for tailoring green financial products (e.g., bonds, loans) to diverse manufacturing needs. These findings equip policymakers and investors to better align financial markets with de-carbonization goals.
This study examines the causal impact of green finance policies on capital structure within the UK manufacturing sector, anchored in the 2019 Future of Net Zero Emissions and Green Finance report published by HM Treasury. Utilising panel data from UK-listed manufacturing firms (2015–2022), we classify firms into two cohorts: capital goods manufacturers (treatment group, GICS codes 2010-) and other product manufacturers (control group). A difference-in-differences (DID) model is employed to isolate the policy’s effect on financial leverage ratios, with a focus on two core questions:Whether the policy significantly reduces debt reliance among capital goods firms? How responses vary across firms with differing financing constraints and operational scales?
The analysis reveals the mechanisms through which green finance policies—particularly financing incentives and regulatory pressures—reshape capital allocation in manufacturing, while heterogeneity tests quantify disparities in policy effectiveness. The paper is structured into six sections: a review of capital structure theories and green finance literature (Section 2), hypothesis development (Section 3), data and methodology (Section 4), empirical findings (Section 5), and conclusions with policy implications (Section 6).
2. Literature Review
The seminal work of Modigliani and Miller (1958, 1963) laid the foundation for modern capital structure theory. Their initial proposition (MM1) posited that in perfect markets without taxes or bankruptcy costs, capital structure irrelevancy holds—firm value depends solely on operational efficiency, not financing choices. While this framework provided theoretical clarity, its assumptions (e.g., symmetric information, no transaction costs) were criticised as empirically implausible (Edim et al., 2014). The revised MM2 theory incorporated tax shields, demonstrating that debt financing enhances firm value through interest deduct, yet excessive leverage raises bankruptcy risks—a trade-off central to subsequent research. Green finance policies puts this logic into practice: tax incentives for green bonds (Wang et al., 2021) encourage sustainable debt financing, while environmental regulations implicitly raise the cost of polluting assets, effectively redefining "optimal" capital structures in manufacturing. However, macroeconomic analyses caution that tax-driven adjustments may have limited direct impact on sector-wide profitability (Driver, 2005), underscoring the need for firm-level empirical validation.
Developments in capital structure theory have emphasised the tension between the tax advantages of debt and the associated risks. Static trade-off theory suggests that firms optimise value by balancing tax advantages with the costs of bankruptcy (Stiglitz, 1974; Lewellen, 1969), but excessive leverage can undermine financial flexibility - particularly in the manufacturing sector, where fixed-asset intensity magnifies operational risk. Manufacturing's reliance on complex supply chains further complicates financing options, as information asymmetries between managers and investors tend to discourage equity issuance (Myers, 1984). The pecking order theory therefore prioritises internal financing, followed by debt and finally equity, a hierarchy that is particularly important for manufacturers seeking to manage the production cycle while avoiding disclosure costs. In addition to the theoretical framework, empirical studies have highlighted contextual factors affecting capital structure decisions, such as the regulatory environment and firm size (Huang, 2006), suggesting the need for policy sensitivity analyses in green finance research.
Government policies play a dual role in shaping corporate capital structures: they incentivise sustainable financing while imposing constraints to mitigate systemic risks. For instance, debt ceilings and equity issuance regulations aim to prevent over-leverage (Herring et al., 2000), complemented by governance frameworks like the UK Corporate Governance Code (2012), which mandates board accountability and shareholder rights protection. These measures are particularly consequential for manufacturing—a capital-intensive sector reliant on long-term debt and project financing for equipment and production line investments (Legesse et al., 2020). Unlike tech industries, manufacturers prioritise capital structure stability, often opting for leases to convert fixed costs and maintaining conservative leverage ratios to safeguard solvency. Policy interventions further amplify this dynamic: low-interest loans and R&D tax credits (Kitt, 2016) reduce financing costs, while post-Brexit trade support (Mendez-Parra, 2019) eases market expansion barriers. Collectively, such policies recalibrate manufacturing capital structures toward sustainability without compromising sector-specific operational needs.
Green finance policy emerged in response to global sustainability imperatives, formalised through frameworks like the 1992 UNFCCC (Sands, 1992). Unlike broad governmental policies targeting economic growth, green finance specifically channels capital—via instruments such as green bonds and subsidised loans—toward environmentally aligned sectors (Lee, 2020). This targeted approach creates dual incentives: for manufacturers, compliance with green standards lowers financing costs and operational risks (Zhu et al., 2020); for investors, it mitigates long-term climate liabilities while enhancing market competitiveness through eco-innovation (Schoenmaker et al., 2018). Critically, green finance’s sector-specific mechanisms (e.g., emissions-linked loan rates) differ from conventional fiscal tools (e.g., tax subsidies), as they explicitly tie capital accessibility to environmental performance, thereby reshaping industrial practices without compromising economic viability.
Green finance policies propel the UK manufacturing sector’s transition by synergising technological advancement, structural optimisation, and market efficiency. By alleviating financing constraints, these policies enable manufacturers to adopt cost-reducing innovations (Ramanathan et al., 2017), which in turn foster economies of scale and industrial restructuring (Du et al., 2015). Concurrently, capital reallocation toward sustainable production inputs enhances productivity and aligns industrial output with low-carbon demands (Rodrik, 2014). This structural shift is further supported by improved risk pricing mechanisms and investor preference, which elevate financing efficiency through better fund utilisation (He et al., 2018). Collectively, these dynamics position green finance as both a market catalyst and a structural reform tool, ensuring simultaneous progress toward economic growth and environmental sustainability.
While green finance policies are widely acknowledged for driving regional economic growth—evidenced by China’s carbon trading pilot programmes generating 4.7 billion US dollars since 2011 (Zhou et al., 2020, 2022)—their efficacy in directly reshaping corporate capital structures remains contested. Proponents argue that such policies optimise resource allocation and industrial upgrading (Shi et al., 2022), with improved environmental performance reducing information asymmetry and securing preferential financing for low-carbon manufacturers (Udeagha, 2023). Conversely, critics highlight unintended consequences: excessive subsidies may distort markets (Feng, 2022), while poorly designed incentives can entrench high-pollution industries’ credit barriers without curbing emissions (Usman, 2021). For manufacturing firms, this duality manifests in strategic adaptations—such as voluntary environmental disclosures to lower debt costs (Chen et al., 2023)—among tightening regulations that prioritise energy efficiency over short-term profitability (Ran et al., 2023). Ultimately, the success of green finance hinges on balancing structural reforms (e.g., unified international standards) with sector-specific flexibility to avoid stifling innovation.
The determinants of corporate capital structure remain debated, particularly regarding the role of firm-specific factors. While some studies suggest larger firms exhibit lower leverage due to diversified funding sources (Jordan et al., 1998), others posit a positive size-leverage correlation driven by economies of scale (Indrawan et al., 2020). This divergence underscores the sector’s heterogeneity: in manufacturing, capital intensity amplifies the importance of profitability and growth capacity, whereas non-debt tax shields show limited explanatory power (Acaravci, 2015). To isolate green finance policy effects, empirical analyses must control for these endogenous variables—such as size, profitability, and liquidity—while mitigating multi collinearity risks through careful variable selection.
Green finance policies’ dual role in enabling sustainable transitions while exacerbating sector vulnerabilities is evident across contexts. In China, such policies have reduced industrial emissions but face implementation hurdles like data limitations and post-pandemic recovery delays (Muganyi, 2021; Zhang et al., 2021). For carbon-intensive manufacturers, decarbonisation imposes acute financial strains: transitioning to low-carbon technologies requires massive capital, yet persistent information asymmetry restricts access to green financing, forcing firms to rely on debt despite heightened bankruptcy risks (Nguyen et al., 2020). This paradox aligns with trade-off theory—while debt shields against carbon taxes, over-leverage erodes resilience (Graham, 2003). Existing research predominantly examines macro-level policy design or micro-level firm behaviours in isolation, neglecting the interplay between regulatory frameworks (e.g., the UK’s 2019 Net Zero Report) and industry-specific capital restructuring. This study bridges that gap by applying a DID model to disentangle green finance’s direct and heterogeneous effects on manufacturing capital structures, offering insights absent in prior fragmented analyses.
3. Hypothesis Development
According to the report, the UK Treasury, and the Financial Market Conduct Authority (FCA) should give additional consideration to fintech challenges targeted at the development of innovative products and services to aid in the transition to a green economy and promote innovation. As noted in the preceding analysis, the allocation of credit resources by financial institutions such as banks can be viewed as a relatively exogenous source of financing that is closely related to the size of a company's liabilities during the green transition in manufacturing, is a significant source of external capital demand, and has a relatively low cost of financing. The implementation of green finance policy has a greater impact on the financing environment of manufacturing enterprises, and financing constraints have intensified, as the environmental performance of enterprises has been integrated into the risk assessment system of financial institutions like banks.
In addition, Yu et al (2021) believe that green finance policy does not appear to be able to benefit enterprises by effectively easing financing constraints, which limits the ability of enterprises to innovate in a sustainable manner, increases the difficulty of obtaining financing resources and the cost of adjusting their business models, causes the manufacturing industry to spend more time modifying its business model, and ultimately increases the operational risk of manufacturing enterprises. Based on the preceding discussion, this paper proposes the following hypothesis 1.
H1: As a result of the implementation of Net Zero and the Future of Green Finance, firms that manufacture capital goods are increasing their use of equity financing and decreasing their reliance on debt.
There are restrictions on the external financing of businesses. Moreover, according to the pecking order theory, the financing costs of internal financing and external financing are obviously distinct, with internal financing typically costing less than external financing. In addition, the dividend payout rate is closely related to retained earnings and can reflect the adequacy of the business's residual funds. When the dividend payout ratio is greater, internal capital is more abundant, and external financing is simpler. It's not just that businesses without many financial constraints can more easily obtain external finance, they're also more inclined to make use of leverage. As a result, firms with fewer financing constraints may be more susceptible to policy shocks.Based on the preceding discussion, this paper proposes the following hypothesis 2.
H2: Following the presentation of Net Zero and the Future of Green Finance, the impact of various financing constraints on manufacturing firms is heterogeneous.
Large-scale businesses typically have a stronger industry reputation and management, greater tolerance for operational risks, and more accessible financing channels. In addition, larger businesses have fewer financing restrictions, greater repayment capacity, and simpler access to financing from banks and other financial institutions. Therefore, even if the large enterprises had more debt before the policy's implementation, the policy's impact on small businesses may be greater because financial institutions provide loan resources to assure the safety of funds.Based on the preceding discussion, this paper proposes the following hypothesis 3.
H3: The impact of heterogeneity on Net Zero and the Future of Green Finance for enterprises of various sizes.
4. Data and Methodology
4.1. Data Sources
In order to examine how Net Zero and the Future of Green Finance 2019 affect the capital structure of manufacturing enterprises in the United Kingdom, this paper uses the panel data of UK-listed manufacturing enterprises from 2015 to 2022 as the research sample. In order to improve the accuracy of the regression results, the sample of enterprises with more missing variables was eliminated, leaving a total of 984 observations and 123 sample data of manufacturing enterprises. The information for this article was compiled by Wharton Research Data Services.
4.2. Variables Definition
Dependent Variable. This paper uses the enterprise financial leverage ratio (Lev) to determine the proportion of debt capital to equity capital in capital structure. The greater the debt-to-equity ratio, the greater the proportion of debt relative to shareholder equity, and the greater the financial leverage ratio. A higher financial leverage ratio may indicate a greater debt risk for the business, as debt payments and interest costs may rise, but it may also increase the business's return on capital. A low financial leverage ratio, on the other hand, indicates that a company relies less on debt, more on shareholder equity, and less on risk.
Independent Variable. As stated in the report Net Zero and the Future of Green Finance, one of the strategic goals for the development of green finance in the United Kingdom is to support government actions that align private sector financial flows with clean, environmentally sustainable, and resilient growth. In addition, it argues that green finance strategies will play a crucial role in facilitating capital flows. Consequently, capital goods manufacturers may be more receptive to green finance strategies than other manufacturing sectors. Then, this paper can distinguish the treated and control groups based on the production of capital goods and other goods.
This paper primarily interprets the variables as the difference-in-difference interaction term , where is the dummy variable of whether the green finance policy is implemented or not, and the year before Net Zero and the Future of Green Finance is published, before 2019, and the year after Net Zero and the Future of Green Finance is enacted, 2019 and beyond, . The is the dummy variable that indicates whether the intended manufacturing company produces capital goods. For the manufacturing enterprise that produces capital commodities, = 1, whereas = 0 for the manufacturing enterprise that produces other products. Consequently, the estimated coefficient represents the Net effect of the publication of the Net Zero and the Future of Green Finance report on the capital structure of manufacturing firms producing capital products. Table 1 displays the criteria for segregating the treated and control groups.
Wang (2022) examines the effect of the green finance policy on innovation performance in China's manufacturing sector, with firm size (Size) as one of the control variables. Due to their scale and greater access to financing and borrowing, larger manufacturing companies can incur more debt. And larger manufacturing companies typically have a greater number of internal sources of capital, including free cash flow, profit retention, risk dispersion, and credit rating. Consequently, a positive correlation exists between enterprise size and capital structure.Non-debt tax shield (NDTS) refers to the enterprise's other deductible tax costs during the tax process, in addition to debt interest. Nasution et al. (2017) concluded that non-debt tax shields have a negative impact on financial capital structure. However, Acaravci (2015) points out that different measures of non-debt tax shields result in a non-significant impact on capital structure.
A company's growth potential (Growth) can be viewed as an indicator of its future performance and its ability to attract investors. Margaritis (2010) notes that the effect of growth on the capital structure of a company is uncertain. Its effect on capital structure is negligible, as a company's capacity for growth is largely determined by its internal controls and intangible assets. Wang (2023) considers profitability (Roe) as a control variable in the DID model study of the effect of green finance policy on green innovation efficiency in the manufacturing industry. Profitability is one of the key factors that banks and other financial institutions use to evaluate the credit risk and financing capacity of businesses in the manufacturing sector. Higher profitability typically indicates a company's capacity to repay debt and generate sufficient profits to cover interest and the loan's principal. Moreover, in terms of market confidence and investment project selection, typically more profitable companies have a more suitable capital structure. Table 2 contains the names and definitions of the variables utilized in this paper.
4.3. Research Models
DID models are frequently employed to evaluate the influence of policies, interventions, and other processes on observational data. To estimate the effects of treatment, the model was developed to account for both time and treatment differences. Frisch et al. (1934) were the first to investigate the correlation between national economic growth and national income distribution using the DID model. Since then, the DID method has been extensively utilized in empirical studies. Notably, the validity of the DID model is contingent on the assumption of parallel trends. This implies that the treated group and the control group should have experienced a comparable time trend prior to treatment. To test the parallel-trend hypothesis, it is possible to compare the antecedent trends of the treated group and the control group to ensure that there are no significant differences before the treatment is administered. In addition to the policy, the treated group and the control group were affected by other exogenous factors in the study of policy effects guarantee.
This paper is based on the 2019 publication of the Net Zero and the Future of Green Finance Report, which is not aimed at a specific company and can thus be viewed as a quasi-natural experiment. The nature of the capital structure of manufacturing enterprises that produce capital goods explains the distinction between the capital structure of manufacturing enterprises that produce capital goods before and after the policy node. Consequently, by defining the treated group and the control group, the DID model can demonstrate the effect of green finance policy on the capital structure of manufacturing firms.
4.4. Model Setting
Using longitudinal data from the treatment group and the control group, the DID model is applied to derive a suitable counterfactual estimate of the causal effect. Using the DID model, Chen et al. (2023) enriched the research on green finance policy and provided policy recommendations for the transformation of the manufacturing sector by analysing the effect of green finance policy on the green transition process of the manufacturing industry from 2013 to 2021. Similarly, Huang et al. (2021) used data from 2011-2019 using the DID model to analyse the environmental impact of green finance policies in China and found that these policies were most beneficial in areas with the most severe environmental contamination. Based on data from 2005 to 2019, Wang (2023) investigates the impact of China's green finance policies on the efficiency of manufacturing innovation and concludes that heavy-polluting industries have a lower green innovation efficiency (GIC) than non-heavy-polluting industries.
DID models can account for this time and place heterogeneity, as policy implementation typically does not occur simultaneously in all regions and at all times. Thus, this paper uses DID model empirical analysis to investigate the impact of green finance policy on the capital structure of manufacturing enterprises, distinguishing between capital goods manufacturing enterprises and other products manufacturing enterprises, as well as comparing the capital structures of these entities before and after the policy was put into place. Based on the preceding analysis, this paper develops the following fundamental model shown below:
Where the variable is examined on the left side of the equation. The is an interactive term, is a coefficient reflecting the net effect of green finance policy on the capital structure of manufacturing enterprises, and is a virtual time variable assigned 0 prior to 2019 and 1 after 2019. As a coefficient of a time virtual variable, reflects the time effect of the policy. The stands for the virtual variables of various manufacturing companies. The enterprise value of capital commodities is 1, the enterprise value of other products is 0, and represents the individual effect of the enterprise. The is the control variable referred to in section 3.2. The , and respectively represent time fixed effect and individual fixed effect. The is the error term, which includes other factors not considered by the model, measurement error, and random noise. The model is able to effectively address the issues of endogenies and absent variables.
For hypotheses 2 and 3, data need to be analysed for heterogeneity. This paper evaluates and analyses them from the perspectives of financing constraints and firm asset scale, and establishes two dummy variables, and , for each of these factors. Consequently, the analysis of the econometric model's heterogeneity shows below:
4.5. Descriptive Statistics
In order to resolve the non-linear distribution or extreme value of some data and bring the data closer to the normal distribution or make them easier to deal with, logarithmic data processing has been performed in this paper. However, the ROE variable is not logarithmically computed because some are negative values. Simultaneously, Linear interpolation and exponential smoothing were used to augment the missing data for some years. The following table (Table 3) contains the descriptive statistics and statistical results of the data.
As shown in Table 3 above, the mean and standard deviation of the financial leverage of the dependent variables are -1.476 and 0.746, respectively, while the maximum and minimum are -9.602 and 2.004. This demonstrates that the debt levels of different businesses vary significantly when the sample's overall financial leverage meets expectations. The averages for the control variables Size, Growth, Non-debt tax shield (NDTS), and profitability were 0.854, -0.853, -2.398, and 0.030, respectively. By comparing and analysing the maximum, minimum, standard deviation, and median of each control variable, it is possible to determine that there are substantial differences in the size, growth potential, and profitability of the sampled businesses. Table 4 below depicts the changes in the average financial leverage of firms producing capital goods, and other products before and after the policy was enacted.
The results of the observation table (Table 4) indicate that the average financial leverage of capital goods enterprises is 0.466, which is 0.225 less than that of other product enterprises over the entire sample period. Before the policy was implemented, the average leverage of capital goods companies was 0.409,0.149 lower than that of other product companies. After the implementation of the policy, the disparity between the financial leverage of enterprises producing capital goods and those producing other products shows an increasing trend, with the average financial leverage of enterprises producing capital goods increasing to 0.523 and the average leverage ratio of companies producing other products increasing to -0.301.
4.6. Parallel Trend Test
To verify the applicability of the DID method, it is necessary to determine if the treated and control samples support the parallel trend hypothesis. Examining the central premise of parallel trend testing, which is that the altering trend of the experimental group and the control group should be consistent prior to the implementation of the policy, this paper employs the event study method. Prior to the implementation of the green finance policy, the capital structure time trend for the treated group and the control group are depicted in Figure 2 below.
According to the above graph, the regression coefficients were not significant prior to the implementation of the policy, indicating that there was no significant difference between the treated group and the control group for the dependent variables prior to the implementation of the policy. The effect of the policy on the dependent variable becomes significant in the first year of implementation as policy implementation advances. Thus, confirming the parallel trends hypothesis.
5. Empirical Analysis
5.1. Panel Data Regression Analysis
The panel data were regressed once the treated and control groups satisfied the parallel trend hypothesis. The outcomes of the underlying regression are displayed in Table 5 below. Among them, column (1) added only the time fixed effect, column (2) added only the individual fixed effect, and column (3) for the time individual double fixed effect.
As shown in Table 5 above, the treated group's financial leverage ratio decreased substantially under the green finance policy, with coefficients of -0.182, -0.187, and -0.187, respectively, and all three groups were significant at the 1% level of confidence.
As an illustration, the control variables were observed in the third column of Table 5 (adding time effects and individual effects). The coefficients for enterprise size (Lev), growth potential (Growth), the non-debt tax shield (NDTS), and profitability (Roe) were -0.4, 0.159, 1.049, and -0.161, respectively. Growth and Non-debt tax shield (NDTS) are both significant at 1% and have a positive effect on corporate leverage, meaning that the greater the growth opportunity, the greater the non-debt tax shield, the more indebted companies are, the more willing they are to take on debt, as companies with greater growth potential have easier access to financing from financial institutions such as banks. NDTS represents tax deductions other than interest on debt that reduce the tax liability of the business and, consequently, the amount of tax that the business must pay to the government. Companies with high growth opportunities typically require more capital to invest and expand in order to achieve their Growth and scale goals. In order to meet these capital requirements, businesses may rely on external financing, particularly debt financing, to acquire substantial capital support.
However, enterprise Size and profitability have a negative effect on enterprise leverage, which means that, under the influence of these two indicators, enterprises' access to capital may be effectively resolved by internal financing, and external financing is not sufficiently enticing. Moreover, larger or more profitable businesses typically have more internal capital and resources, making it simpler for them to finance their operations and investments with their own capital and reducing their need for external financing, particularly debt financing.
In light of the preceding analysis, the implementation of green finance policy has a significant negative impact on the capital structure of firms that manufacture capital goods. As a result, firms that manufacture capital goods increasingly rely on equity financing, thereby reducing their leverage. Therefore, hypothesis 1 is supported.
5.2. Heterogeneity Analysis
To further examine whether the financing constraints of different enterprises and differences in the scale of enterprise assets will have an effect on the implementation of green finance policies, this paper uses retained earnings as the agent variable of financing constraint and the median of assets to determine the scale of enterprise assets. The higher the retained earnings, the fewer the financing restrictions. Firms that exceed the median retained earnings are assigned a value of 1, while others are assigned a value of 0. The enterprise with assets above the median is assigned 1, indicating that it is a large business, while the enterprise with assets below the median is assigned 0, indicating that it is a small business. The heterogeneity of green finance policy on firm capital structure is studied after adding financial constraint (Fc) and firm size (Scal) to the DID model. The results of the regression are shown in Table 6.
In Table 6, column (1) represents the regression results for businesses with reduced retained earnings, and column (2) represents the regression results for businesses with higher retained earnings. According to the findings, the interaction coefficients of the two samples were -0.275 and -0.021, respectively, indicating that green finance policy has a greater impact on firms with lower retained earnings, with a significance level of 1%. In other words, the impact of green finance policy is more pronounced on businesses with higher financing constraints. This test examines the asymmetric impact of the introduction of a green finance policy on enterprises with varying degrees of financing constraints. This issue may be related to the enterprise's environmental protection capabilities and level of sustainable development. Green finance policy generally encourages and supports environmentally friendly and sustainable enterprises and may have a more positive and advantageous impact on those with a higher environmental profile, however, the impact may be relatively weak for enterprises with severe financing constraints and low environmental protection capacity.
Simultaneously, observe columns (3) and (4). Column (3) represents small businesses, while column (4) represents large companies. The coefficients of the interaction terms for the two sample groups are -0.272 and -0.088, respectively, indicating that the impact of green finance policy on enterprises with fewer assets is more pronounced and statistically significant at the 1% level of confidence. This verifies hypothesis 3, that the introduction of green finance policy has a heterogeneous effect on firms with varying asset quantities. In general, enterprises with larger assets have more internal resources and funds, making it simpler for them to take proactive measures in environmental protection and sustainable development to meet policy requirements, consequently, the policy has a limited effect on their financing requirements. Therefore, when green finance policy is implemented, market conditions that are more difficult to finance than before make it more difficult for small-scale enterprises to access external finance, that is, their capital leverage ratio will be more affected by the policy.
5.3. Placebo Test
Before utilizing the DID model for regression analysis, the parallel trend test of the experimental model was conducted to validate the data model's viability. It is necessary to validate the validity and reliability of the DID model after the baseline regression analysis is completed, therefore, researchers typically test the model with a placebo after conducting the DID model regression (Sun et al., 2023; Chen et al., 2023; Wang, 2023). In the placebo test, one thousand repeated regressions were conducted on randomly selected experimental groups, and nuclear density plots were generated to determine the presence of an intervention effect. The nuclear density figure in Figure 3 reflects the distribution of DID estimators and their respective possible confidence intervals.
As seen in the figure above, the estimated coefficients of the capital structure of manufacturing enterprises (the variable being explained) are evenly distributed around zero and fail the significance test. In other words, the DID model estimates demonstrated a significant intervention effect for the actual treatment group but did not demonstrate a similar intervention effect for the placebo treatment group; therefore, the DID model results can be considered reliable. In other words, the intervention effect in the actual treated group was not attributable to random variables, but rather to actual policy interventions. This result was consistent with the placebo test's hypotheses and confirmed the validity and dependability of the baseline regression findings.
5.4. Propensity Score Matching
Propensity Score Matching Difference-in-Differences (PSM-DID) is an analytical technique that incorporates Propensity Score Matching (PSM) and Difference-In-Difference methods (DID). It is used to address the self-selection bias in observational data in order to estimate the effect of policy intervention more precisely. Huang et al, (2021), Sun et al, (2023), and Ding et al, (2021) all tested the regression results robustly using the PSM-DID method after using the DID model. The results are shown in Figure 4 below.
The Baseline Model () was tested for DID based on the PSM matching results, the regression results are shown in Table 7 below.
As shown in Table 7 above, column (1) added only the time fixed effect, column (2) added only the individual fixed effect, and column (3) for the time individual double fixed effect. The interaction coefficients of the three groups were -0.191, -0.186, and -0.191, respectively, and were significant at the 1% confidence level. This is consistent with the results of the reference regression, demonstrating the validity of the conclusions.
6. Conclusion & Discussion
6.1. Conclusion
This paper uses the relevant data of British manufacturing enterprises from 2015 to 2022 as the research object and uses the issue of Net Zero and the Future of Green Finance in 2019 as a quasi-natural experiment. This paper discusses and tests the effect of green finance policy on the capital structure of capital goods manufacturing enterprises. The following are the conclusions:
Firstly, green finance policy has a significant impact on the capital structure of manufacturing companies. Shi et al. (2022) reached the same conclusion when examining the effect of green finance policies on the debt financing costs of highly polluting businesses. The interaction term coefficient of the difference-in-difference model reflects the net effect of the green finance policy on the capital structure of enterprises, which is statistically significant at the 1% level and greater than that of enterprises producing other commodities; the issuance of green finance policy has significantly decreased the capital leverage ratio of firms producing capital goods.
Secondly, the impact of green finance policy on enterprises with different financing constraints and asset sizes is heterogeneous the same conclusion reached by Yu et al. (2021). In terms of the degree of financing constraints, firms with greater financing constraints frequently rely more on external financing, particularly bank loans or debt financing, to meet their funding requirements. As a result, the impact of green finance policy is more pronounced on enterprises with greater financing constraints. Companies with fewer assets frequently have more urgent funding requirements, particularly when implementing green initiatives or making environmental investments. Due to their small scale, they have a more difficult time obtaining sufficient capital to support themselves than larger companies. As a consequence, these small manufacturing firms are more reliant on external funding, and green finance policies have a greater impact on smaller firms.
6.2. Limitation
This paper examines the effect of green finance policy on the capital structure of capital goods manufacturing enterprises, focusing on the capital structure of enterprises. Following data selection, model construction, and empirical analysis, this paper has identified the following deficiencies:
This paper begins by selecting the data of listed companies with GICS codes beginning with 20, with the companies that produce capital products constituting the treated group and those that produce commercial and professional services and transportation constituting the control group. For the sake of grouping simplification, the consumer discretionary category is excluded from the sample selection, leading to bias in the sample selection, and the final analysis results may not necessarily be applicable to other companies.
Secondly, the study on the effect of green finance policy on enterprise capital structure is limited to an analysis of the level of capital products, and the study on the rate of capital structure adjustment is insufficient. In future discussions, additional control variables can be incorporated to increase the paper's depth.
Thirdly, Covid-19 has a significant impact on manufacturing companies. Covid-19, according to Ardolino et al. (2022), will facilitate the digitization and greening of manufacturing companies while causing a decline in the book value of manufacturing companies. Due to the weak performance of companies during the phase of the epidemic, some of their data were excluded from the screening process, resulting in fewer observations in this study. There are methods to improve the reliability of models in future research by retaining more corporate data.
6.3. Recommendation
The state promotes the reform of the manufacturing industry while the green finance policy requires manufacturing companies to satisfy the requirements of green environmental protection and sustainable development. In addition, banks and other financial institutions are required to utilize economic and financial resources in accordance with policy directives in order to increase the number of resources allocated to green industries. With the conclusion of Covid-19 and the continuation of the policy, its efficacy, and existing problems have progressively become apparent. The purpose of this paper is to provide empirical evidence on how governments and financial institutions implement green finance policy effectively and ensure its steady advancement, as well as to provide thought leadership and direction for the transformation and upgrading of manufacturing enterprises.
At the government level, firstly, it is recommended that greater efforts be made to publicize and guide the green finance policy, so that manufacturing enterprises can completely comprehend the policy's objectives, supporting content, and application process. The government can disseminate policy information to businesses through a variety of channels, as well as provide relevant training and direction to aid businesses in seizing policy opportunities (Urwin et al., 2008). Secondly, the government should develop and enhance the green finance policy evaluation index system. To promote the standardization of policy implementation, the government should develop the corresponding evaluation and assessment mechanism through the unification of enterprise green evaluation standards (Wang et al., 2021). Thirdly, the government should strengthen international cooperation and study the practices and experiences of other nations in the field of green finance. Simultaneously, the government can participate actively in international green finance cooperation mechanisms to attract foreign investment and technical assistance.
The first recommendation at the level of financial institutions is for financial institutions to develop more green financial products and services for manufacturing enterprises, such as low-interest green loans, and green bonds (Wang et al., 2023). In order to meet the financial needs of enterprises in green transformation and environmental protection investment. In addition, it was suggested that financial institutions could simplify the loan approval procedure and increase the availability of financing for environmentally friendly projects. Secondly, given the heterogeneity of financing constraints and enterprise size, banks and other financial institutions should develop differentiated risk management requirements and financial evaluation systems, enhance personalized, differentiated green financial products and services, and lessen the asymmetry of policy effects (Wang, 2022).
At the enterprise level, encourage industrial linkage and cooperation between manufacturing enterprises to cooperatively promote green transformation and environmental protection projects (Chen et al., 2023). Simultaneously, adhering to the policy-oriented, innovation and upgrading can continue to develop, take advantage of the opportunities presented by green finance policy, and strengthen the notion of green development.
References
- Acaravci, S.K. The determinants of capital structure: Evidence from the Turkish manufacturing sector. International journal of economics and financial issues 2015, 5, 158–171. [Google Scholar]
- Ardolino, M.; Bacchetti, A.; Dolgui, A.; Franchini, G.; Ivanov, D.; Nair, A. The Impacts of digital technologies on coping with the COVID-19 pandemic in the manufacturing industry: a systematic literature review. International Journal of Production Research 2022, 1–24. [Google Scholar] [CrossRef]
- Barnett, A.; Batten, S.; Chiu, A.; Franklin, J.; Sebastia-Barriel, M. The UK productivity puzzle. Bank of England Quarterly Bulletin 2014, Q2. [Google Scholar]
- Chen, M.; Song, L.; Zhu, X.; Zhu, Y.; Liu, C. Does Green Finance Promote the Green Transformation of China’s Manufacturing Industry? Sustainability 2023, 15, 6614. [Google Scholar] [CrossRef]
- Chen, Y.; Ma, X.; Ma, X.; Shen, M.; Chen, J. Does green transformation trigger green premiums? Evidence from Chinese listed manufacturing firms. Journal of Cleaner Production 2023, 407, 136858. [Google Scholar] [CrossRef]
- Chen, Y.; Xu, Z.; Wang, X.; Yang, Y. How does green credit policy improve corporate social responsibility in China? An analysis based on carbon-intensive listed firms. Corporate Social Responsibility and Environmental Management 2023, 30, 889–904. [Google Scholar] [CrossRef]
- Cheng, Z.; Kai, Z.; Zhu, S. Does green finance regulation improve renewable energy utilization? Evidence from energy consumption efficiency. Renewable Energy 2023, 208, 63–75. [Google Scholar] [CrossRef]
- Council, F.R. The UK corporate governance code. London, September, 2012. [Google Scholar]
- Ding, N.; Ren, Y.N.; Zuo, Y. Do the losses of the green-credit policy outweigh the gains? A PSM-DID Cost-efficiency analysis based on resource allocation. J. Financ. Res 2020, 4, 112–130. [Google Scholar]
- Driver, C.; Temple, P.; Urga, G. Profitability, capacity, and uncertainty: a model of UK manufacturing investment. Oxford Economic Papers 2005, 57, 120–141. [Google Scholar] [CrossRef]
- Du, J.; Temouri, Y. High-growth firms and productivity: evidence from the United Kingdom. Small business economics 2015, 44, 123–143. [Google Scholar] [CrossRef]
- Edim, N.O.; Atseye, F.A.; Eke, F.A. Relationship between capital structure and firm’s performance: Theoretical review. Journal of Economics and Sustainable Development 2014, 5, 72–76. [Google Scholar]
- Feng, H.; Liu, Z.; Wu, J.; Iqbal, W.; Ahmad, W.; Marie, M. Nexus between government spending’s and green economic performance: role of green finance and structure effect. Environmental Technology & Innovation 2022, 27, 102461. [Google Scholar]
- Foresight, U.K. The future of manufacturing: a new era of opportunity challenge for the, U.K. Summary Report, The Government Office for Science, London, 20, 2013. [Google Scholar]
- Frisch, R. Statistical confluence analysis by means of complete regression systems. (No Title). 1934.
- Graham, J.R. Taxes and corporate finance: A review. The Review of Financial Studies 2003, 16, 1075–1129. [Google Scholar] [CrossRef]
- He, L.Y.; Liu, L. Stand by or follow? Responsibility diffusion effects and green credit. Emerging Markets Finance and Trade 2018, 54, 1740–1760. [Google Scholar] [CrossRef]
- Herring, R.J.; Chatusripitak, N. The case of the missing market: the bond market and why it matters for financial development, 2000; 01–08.
- Huang, G. The determinants of capital structure: Evidence from China. China economic review 2006, 17, 14–36. [Google Scholar] [CrossRef]
- Huang, H.; Zhang, J. Research on the environmental effect of green finance policy based on the analysis of pilot zones for green finance reform and innovations. Sustainability 2021, 13, 3754. [Google Scholar] [CrossRef]
- Indrawan, A.S.; Damayanthi, I.G.A.E. The effect of profitability, company size, and financial leverage of income smoothing. American Journal of Humanities and Social Sciences Research 2020, 4, 9–13. [Google Scholar]
- Jahanger, A.; Ozturk, I.; Onwe, J.C.; Joseph, T.E.; Hossain, M.R. Do technology and renewable energy contribute to energy efficiency and carbon neutrality? Evidence from top ten manufacturing countries. Sustainable Energy Technologies and Assessments 2023, 56, 103084. [Google Scholar] [CrossRef]
- Jordan, J.; Lowe, J.; Taylor, P. Strategy and financial policy in UK small firms. Journal of Business Finance & Accounting 1998, 25, 1–27. [Google Scholar]
- Kitt, M. esearch and Development Tax Reliefs; Bloomsbury Publishing, 2016. [Google Scholar]
- Lamb, W.F.; Wiedmann, T.; Pongratz, J.; Andrew, R.; Crippa, M.; Olivier, J.G.; Wiedenhofer, D.; Mattioli, G.; Al Khourdajie, A.; House, J.; Pachauri, S. A review of trends and drivers of greenhouse gas emissions by sector from 1990 to 2018. Environmental research letters 2021, 16, 073005. [Google Scholar] [CrossRef]
- Leach, K.; Embassy, B. The UK low carbon transition plan. 2009. [Google Scholar]
- Lee, J.W. Green finance and sustainable development goals: The case of China. Lee, Jung Wan (2020). Green Finance and Sustainable Development Goals: The Case of China. Journal of Asian Finance Economics and Business 2020, 7, 577–586. [Google Scholar] [CrossRef]
- Legesse, T.S.; Guo, H. Does firm efficiency matter for debt financing decisions? Evidence from the biggest manufacturing countries. Journal of Applied Economics 2020, 23, 106–128. [Google Scholar] [CrossRef]
- Lewellen, W.G.; Covindassamy, M.A.; Lleu, J. The cost of capital; Wadsworth: Belmont, California, 1969; p. 20. [Google Scholar]
- Margaritis, D.; Psillaki, M. Capital structure, equity ownership and firm performance. Journal of banking & finance 2010, 34, 621–632. [Google Scholar]
- Mendez-Parra, M.; te Velde, D.W.; Winters, L.A. The impact of the UK's post-Brexit trade policy on development; ODI, UK Trade Policy Observatory (UKTPO): London, 2016. [Google Scholar]
- Modigliani, F.; Miller, M.H. The cost of capital, corporation finance and the theory of investment. The American economic review 1958, 48, 261–297. [Google Scholar]
- Modigliani, F.; Miller, M.H. Corporate income taxes and the cost of capital: a correction. The American economic review 1963, 53, 433–443. [Google Scholar]
- Muganyi, T.; Yan, L.; Sun, H.P. Green finance, fintech and environmental protection: Evidence from China. Environmental Science and Ecotechnology 2021, 7, 100107. [Google Scholar] [CrossRef]
- Myers, S.C. Capital structure puzzle. 1984. [Google Scholar]
- Nasution, A.A.; Siregar, I.; Panggabean, R. The effect of profitability, asset tangibility, corporate tax, non-debt tax shield and inflation upon the financial capital structure of the manufacturing companies listed on the Indonesian stock exchange. In International Conference on Business and Management Research (ICBMR 2017); Atlantis Press, November 2017; pp. 65–74. [Google Scholar]
- Nguyen, J.H.; Phan, H.V. Carbon risk and corporate capital structure. Journal of Corporate Finance 2020, 64, 101713. [Google Scholar] [CrossRef]
- Ramanathan, R.; He, Q.; Black, A.; Ghobadian, A.; Gallear, D. Environmental regulations, innovation and firm performance: A revisit of the Porter hypothesis. Journal of Cleaner Production 2017, 155, 79–92. [Google Scholar] [CrossRef]
- Ran, C.; Zhang, Y. Does green finance stimulate green innovation of heavy-polluting enterprises? Evidence from green finance pilot zones in China. Environmental Science and Pollution Research 2023, 0000, 1–16. [Google Scholar] [CrossRef]
- Rodrik, D. Green industrial policy. Oxford review of economic policy 2014, 30, 469–491. [Google Scholar] [CrossRef]
- Schoenmaker, D.; Schramade, W. Principles of sustainable finance; Oxford University Press, 2018. [Google Scholar]
- Scholtens, B. Finance as a driver of corporate social responsibility. Journal of business ethics 2006, 68, 19–33. [Google Scholar] [CrossRef]
- Shi, J.; Yu, C.; Li, Y.; Wang, T. Does green financial policy affect debt-financing cost of heavy-polluting enterprises? An empirical evidence based on Chinese pilot zones for green finance reform and innovations. Technological Forecasting and Social Change 2022, 179, 121678. [Google Scholar] [CrossRef]
- Stiglitz, J.E. On the irrelevance of corporate financial policy. The american Economic review 1974, 64, 851–866. [Google Scholar]
- Sun, X.; Zhou, C.; Gan, Z. Green Finance Policy and ESG Performance: Evidence from Chinese Manufacturing Firms. Sustainability 2023, 15, 6781. [Google Scholar] [CrossRef]
- Task Force, G.F. Accelerating green finance. a report to the Government by the Green Finance Taskforce. 2018.
- Treasury Committee. Net Zero and the Future of Green Finance Report. 2021. Available online: https://publications.parliament.uk/pa/cm5801/cmselect/cmtreasy/147/14702.
- Udeagha, M.C.; Muchapondwa, E. Green finance, fintech, and environmental sustainability: Fresh policy insights from the BRICS nations. International Journal of Sustainable Development & World Ecology 2023, 1–17. [Google Scholar]
- Urwin, K.; Jordan, A. Does public policy support or undermine climate change adaptation? Exploring policy interplay across different scales of governance. Global environmental change 2008, 18, 180–191. [Google Scholar] [CrossRef]
- Usman, M.; Makhdum, M.S.A.; Kousar, R. Does financial inclusion, renewable and non-renewable energy utilization accelerate ecological footprints and economic growth? Fresh evidence from 15 highest emitting countries. Sustainable cities and society 2021, 65, 102590. [Google Scholar] [CrossRef]
- Wang, M.; Li, X.; Wang, S. Discovering research trends and opportunities of green finance and energy policy: A data-driven scientometric analysis. Energy Policy 2021, 154, 112295. [Google Scholar] [CrossRef]
- Wang, M.L. Effects of the green finance policy on the green innovation efficiency of the manufacturing industry: A difference-in-difference model. Technological Forecasting and Social Change 2023, 189, 122333. [Google Scholar] [CrossRef]
- Wang, X. Research on the impact mechanism of green finance on the green innovation performance of China's manufacturing industry. Managerial and Decision Economics 2022, 43, 2678–2703. [Google Scholar] [CrossRef]
- Wang, Y.; Zhao, N.; Lei, X.; Long, R. Green finance innovation and regional green development. Sustainability 2021, 13, 8230. [Google Scholar] [CrossRef]
- Wharton Research Data Services. "WRDS" wrds.wharton.upenn.edu, accessed 2023-07-07.
- Yu, C.H.; Wu, X.; Zhang, D.; Chen, S.; Zhao, J. Demand for green finance: Resolving financing constraints on green innovation in China. Energy Policy 2021, 153, 112255. [Google Scholar] [CrossRef]
- Zhang, D.; Mohsin, M.; Rasheed, A.K.; Chang, Y.; Taghizadeh-Hesary, F. Public spending and green economic growth in BRI region: mediating role of green finance. Energy Policy 2021, 153, 112256. [Google Scholar] [CrossRef]
- Zhou, G.; Zhu, J.; Luo, S. The impact of fintech innovation on green growth in China: Mediating effect of green finance. Ecological Economics 2022, 193, 107308. [Google Scholar] [CrossRef]
- Zhou, X.; Tang, X.; Zhang, R. Impact of green finance on economic development and environmental quality: a study based on provincial panel data from China. Environmental Science and Pollution Research 2020, 27, 19915–19932. [Google Scholar] [CrossRef]
- Zhu, N.; Bu, Y.; Jin, M.; Mbroh, N. Green financial behavior and green development strategy of Chinese power companies in the context of carbon tax. Journal of Cleaner Production 2020, 245, 118908. [Google Scholar] [CrossRef]
Figure 2.
The changing trend of capital structure.
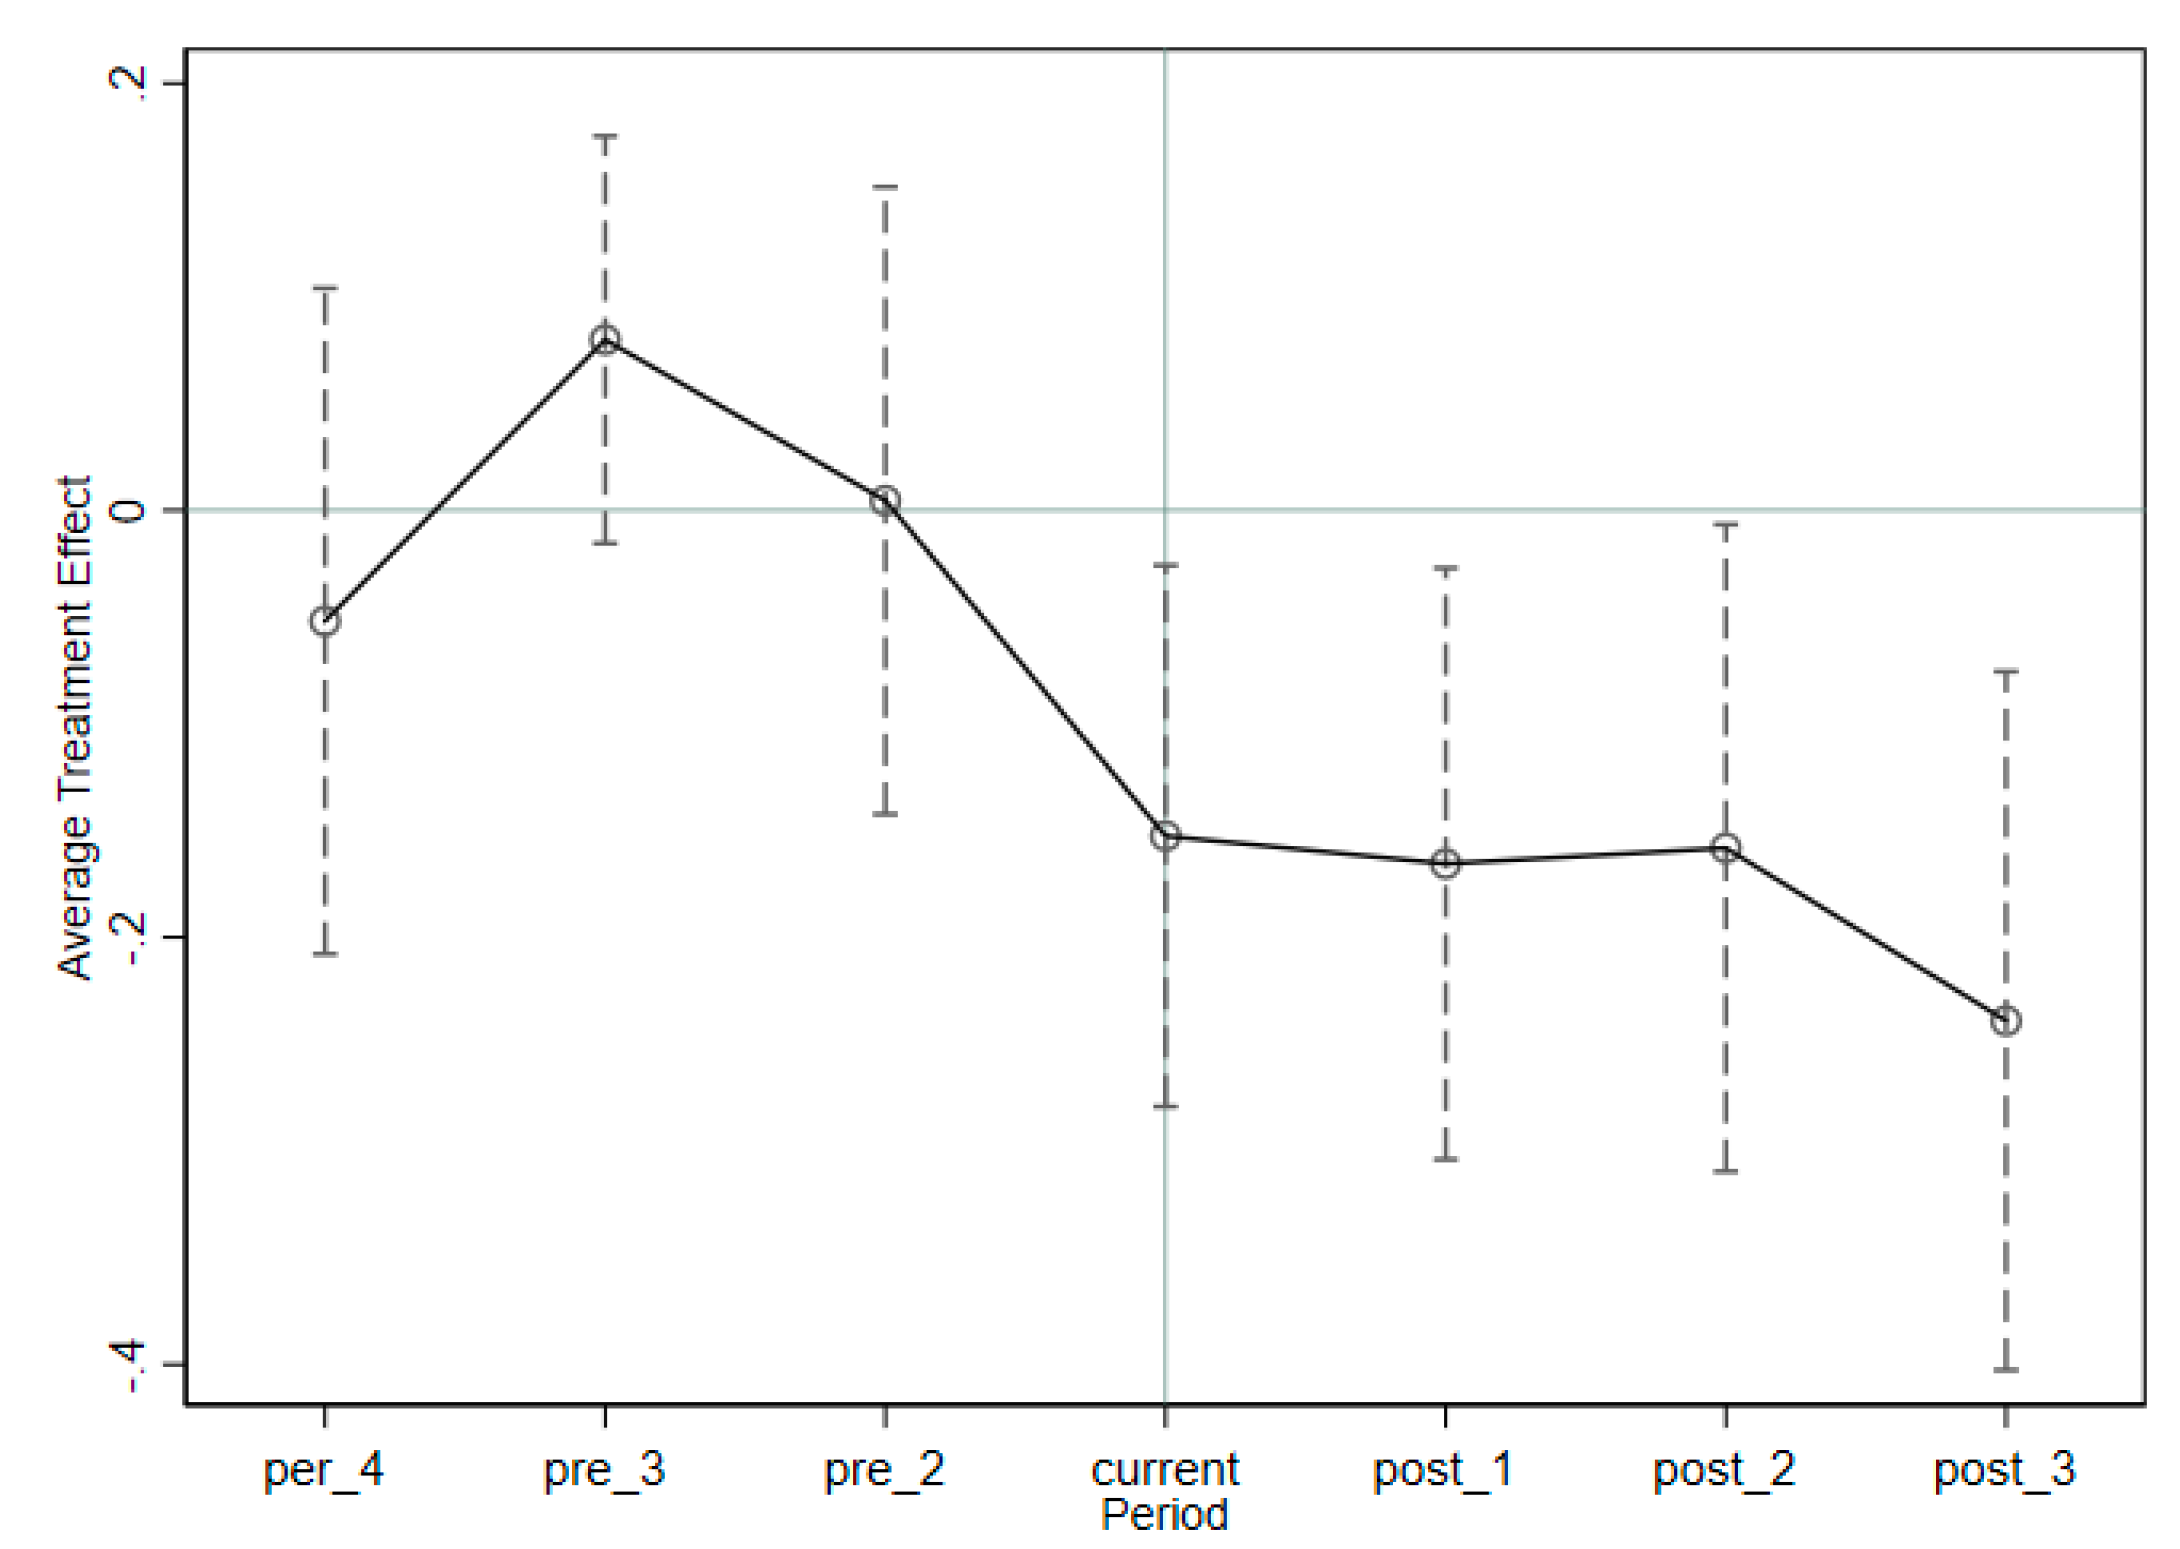
Figure 3.
Placebo test nuclear density figure.
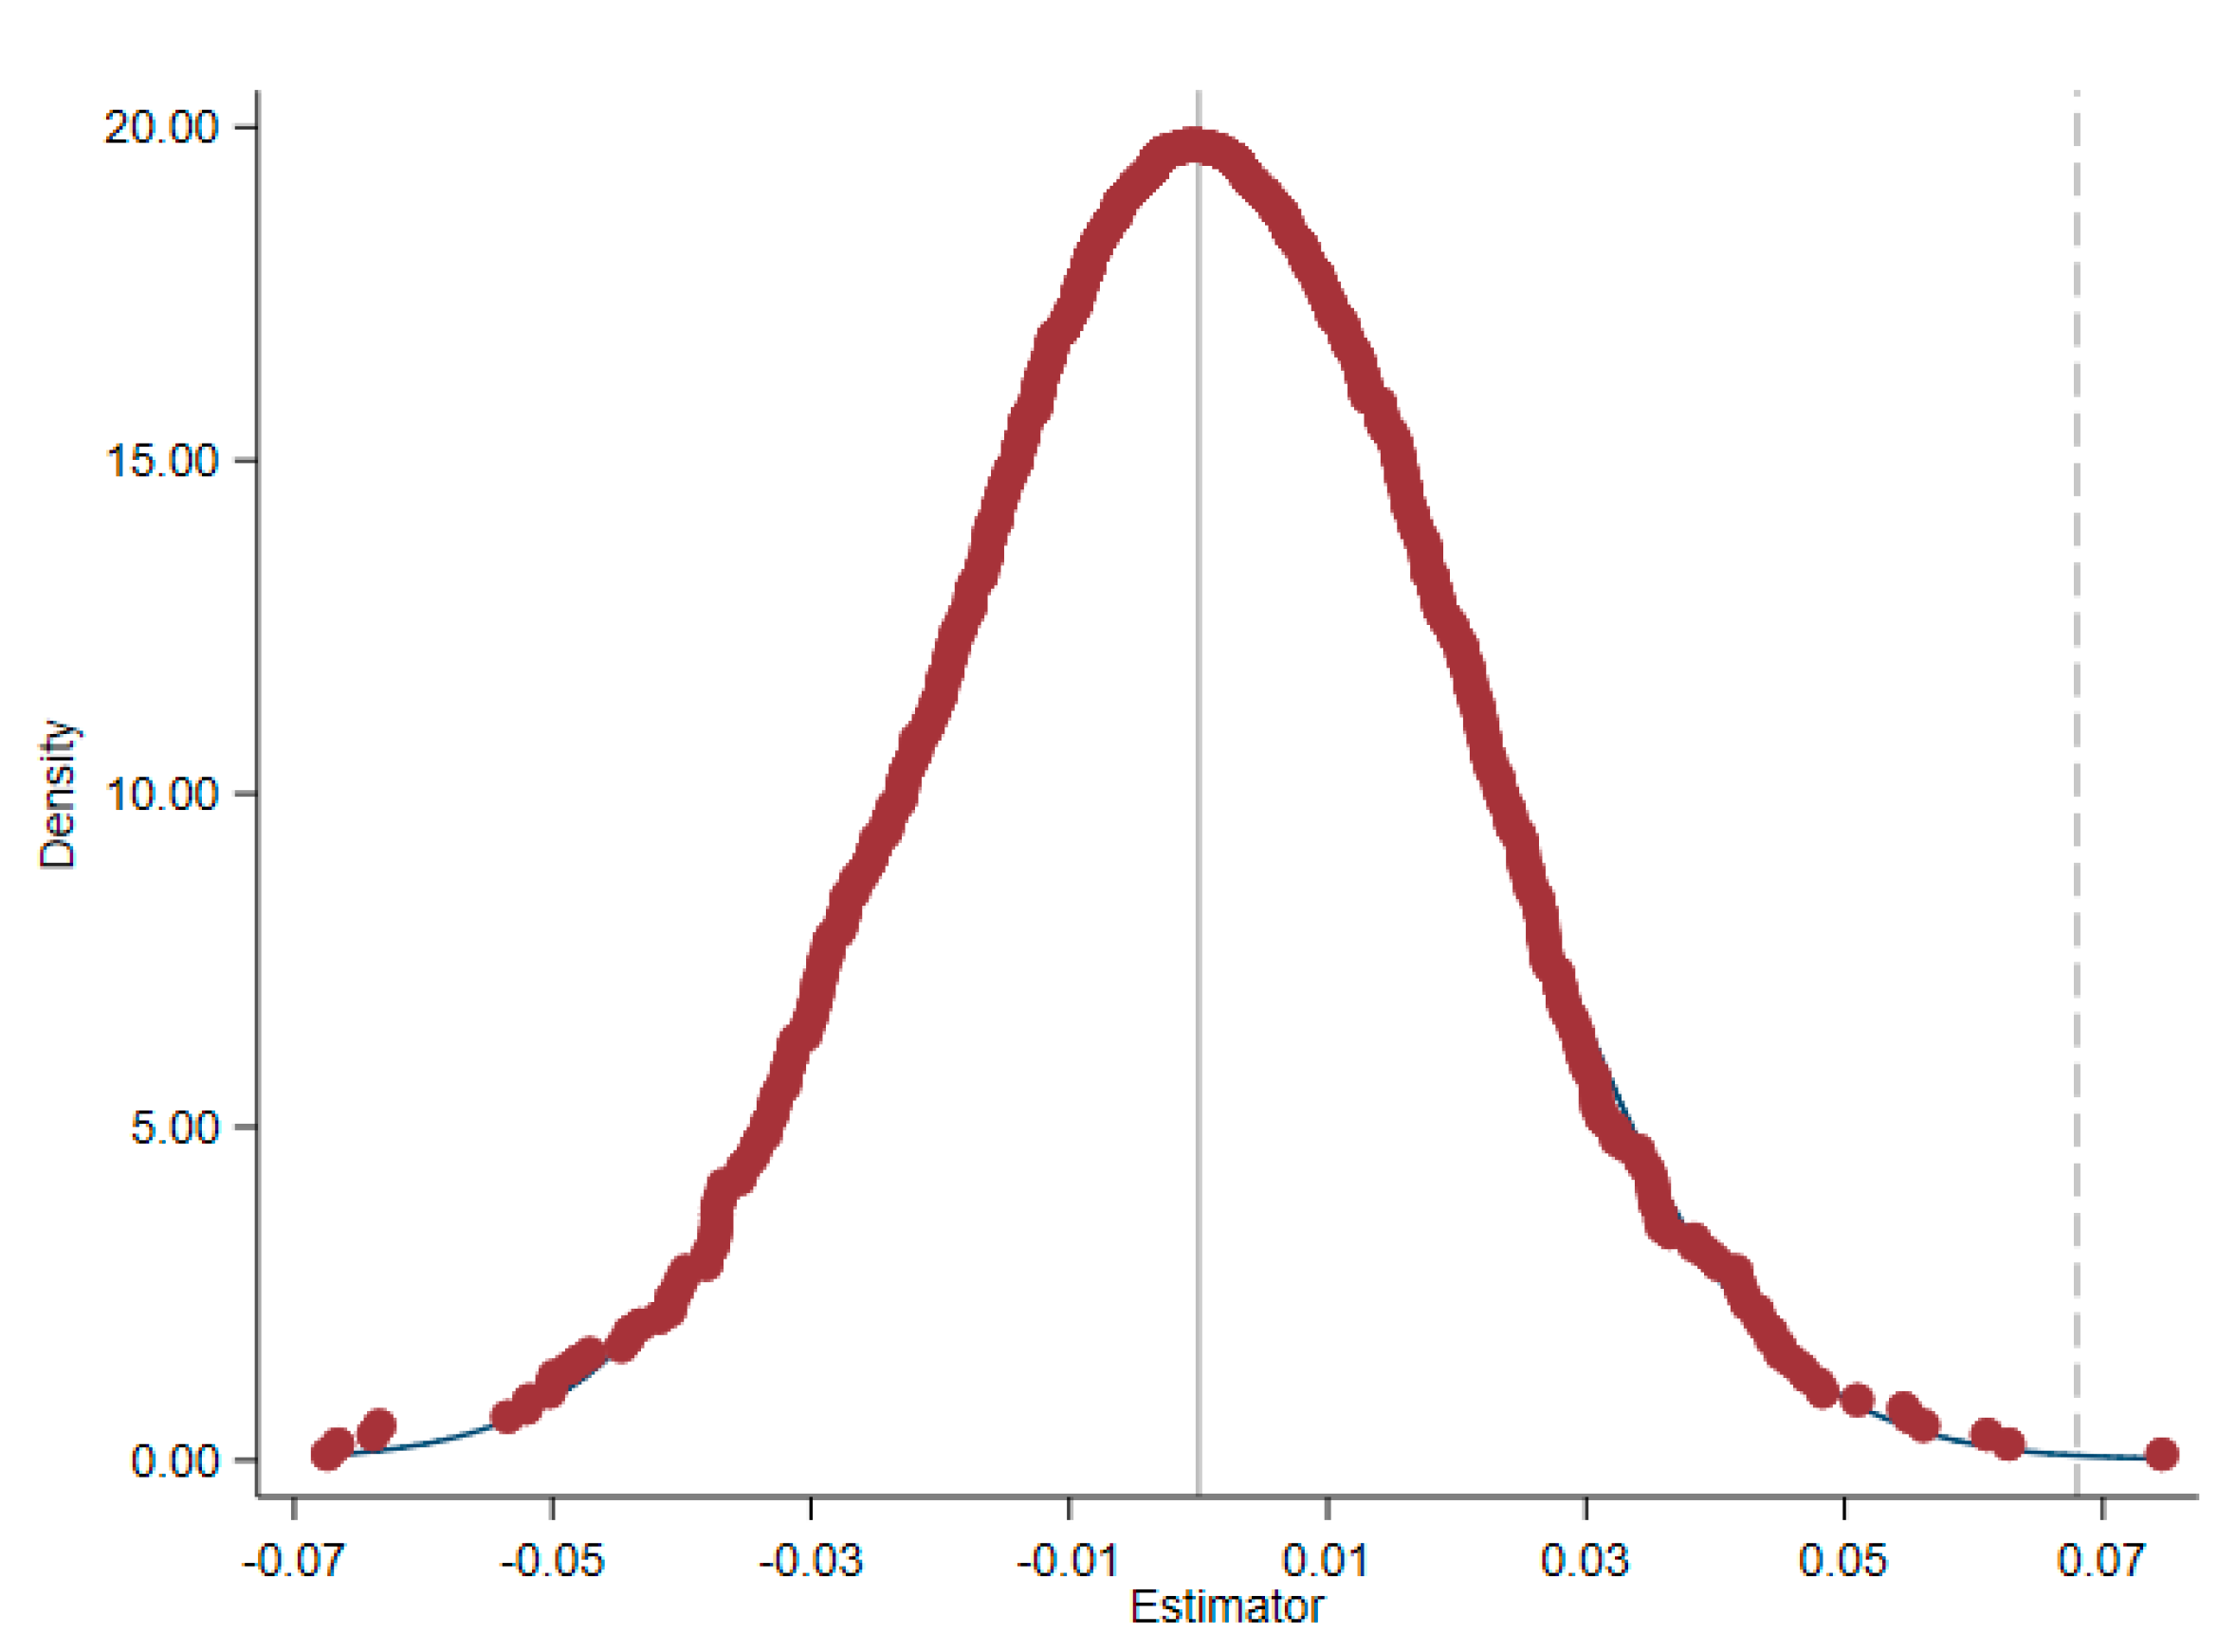
Figure 4.
iNuclear density curve before match, ii Nuclear density curve after match.
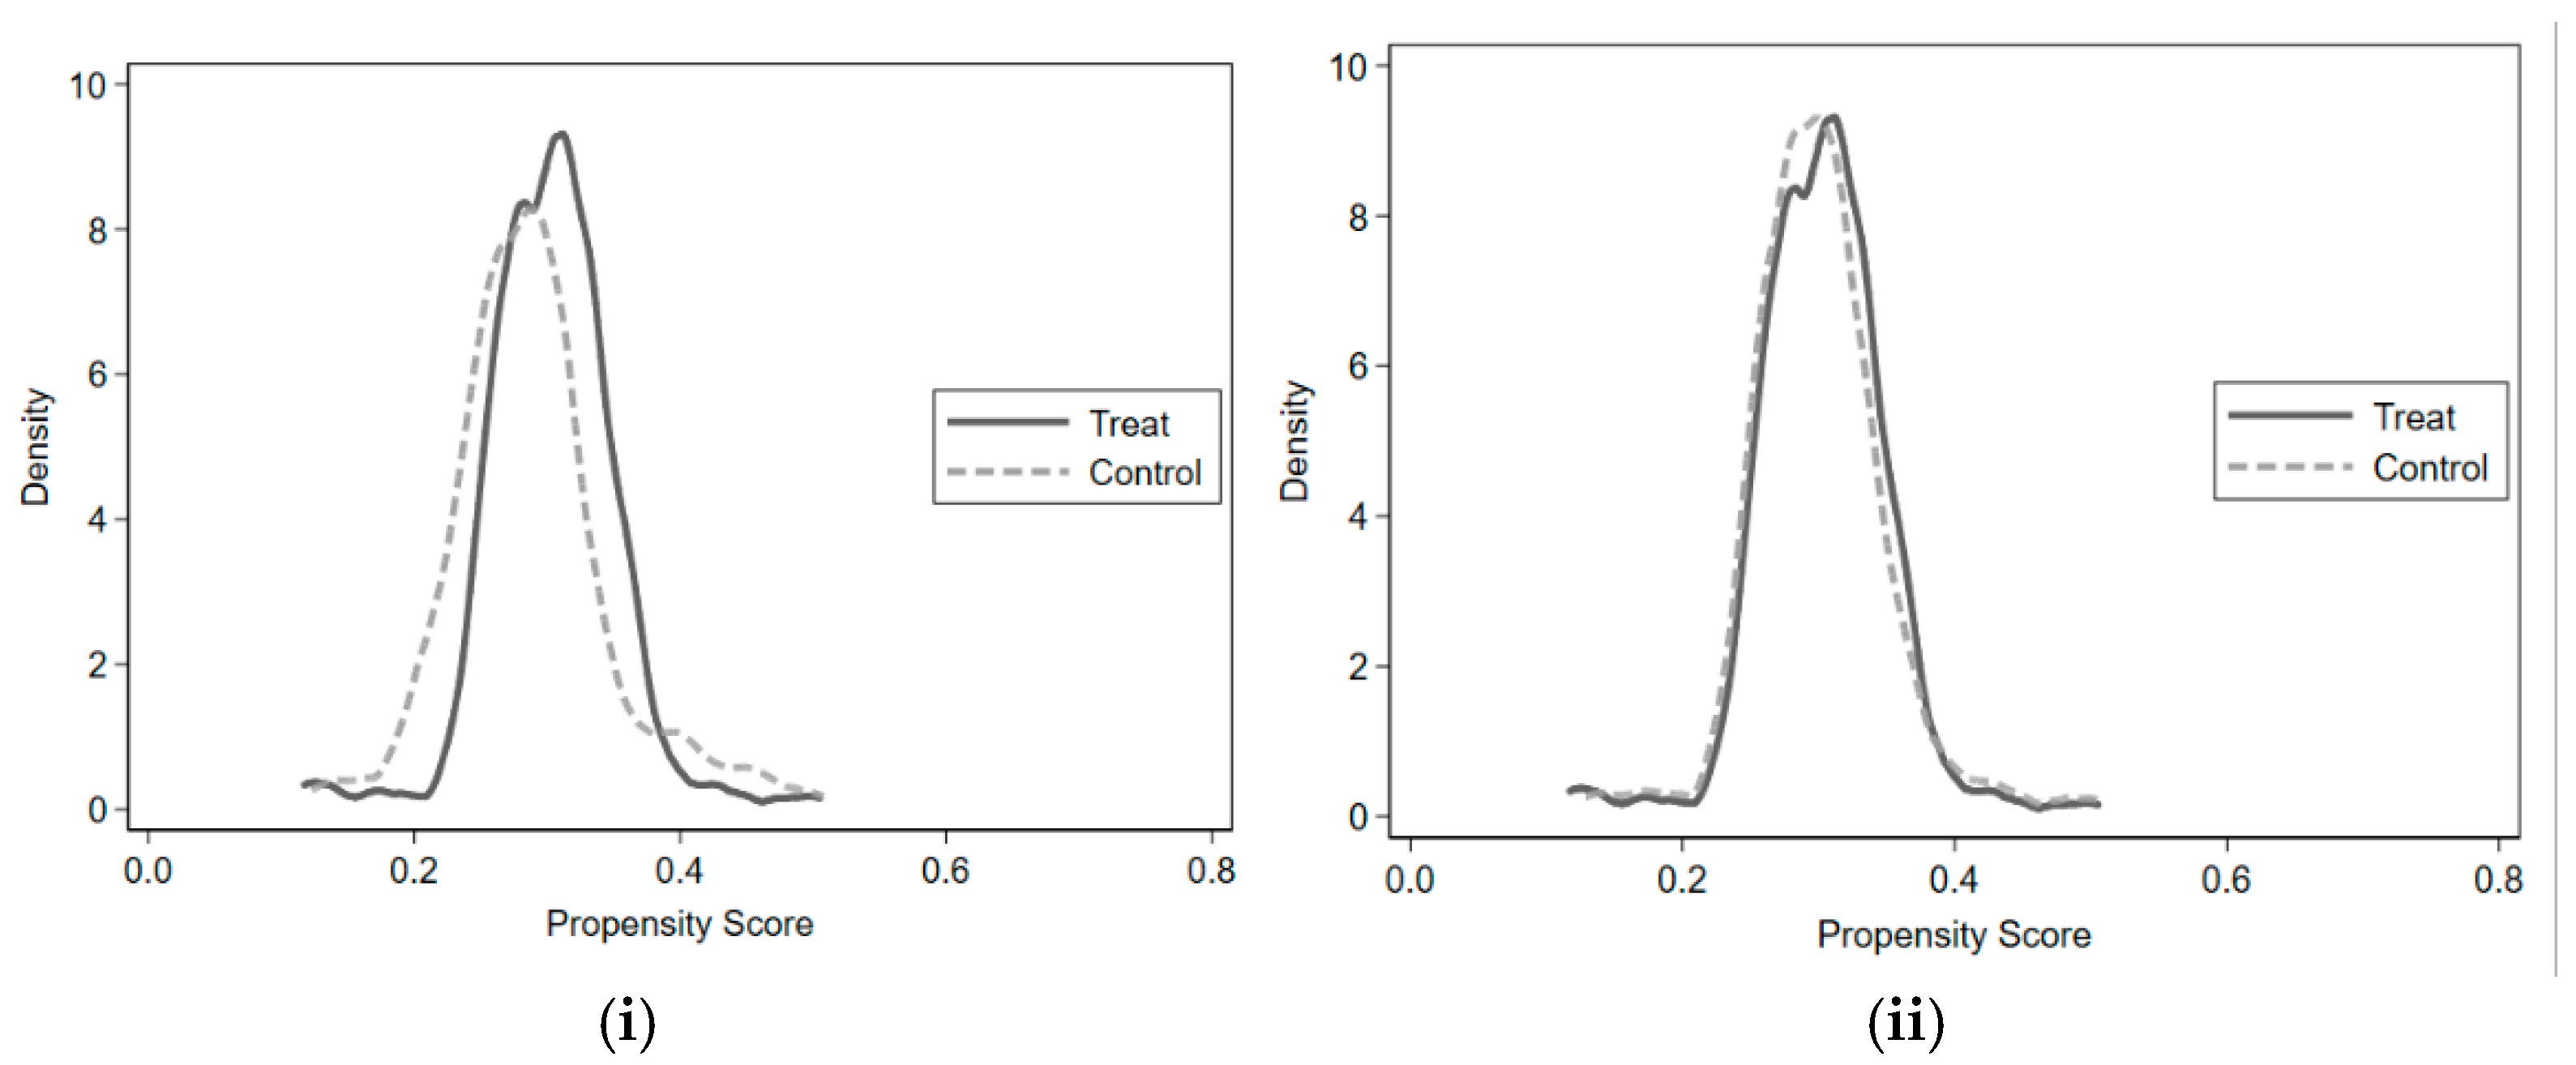

Table 1.
Separated into the treated group and the control group.
| Category | Industry (GICS Number) |
| The treated group (capital goods manufacturing industry) | 201010 Aerospace & Defense 201020 Building Products 201030 Construction & Engineering 201040 Electrical Equipment 201050 Industrial Conglomerates 201060 Machinery 201070 Trading Companies & Distributors |
| Control group (Other products manufacturing industry) | 202010 Commercial Services & Supplies 202020 Professional Services 203010 Air Freight & Logistics 203020 Passenger Airlines 203030 Marine Transportation 203040 Ground Transportation 203050 Transportation Infrastructure |
Table 2.
Variable classification and explanation.
| Classification. | Name | Label | Variable explanation |
| Dependent Variable | Financial leverage ratio | Lev | |
| Independent Variable | Difference-in-difference variable | did | |
| Time virtual variable | date | Before 2019 is 0, and after 2019 is 1 | |
| Group virtual variables | treat | The enterprise that produces capital goods is assigned a value of 1; the enterprise that produces other products is assigned a value of 0. | |
| Control Variable | Firm Size | Size | |
| Profitability | Roe | ||
| Growth potential | Growth | ||
| Non-debt tax shield | NDTS | ||
| Heterogeneity analysis variables | Degree of financing constraint | Fc | The higher the retained earnings, the fewer the financing restrictions. Firms that exceed the median retained earnings are assigned a value of 1, while others are assigned a value of 0. |
| Firm asset scale | Scal | Above the median of enterprise assets for large businesses, a value of 1, the remainder for small businesses is 0. |
Table 3.
Descriptive Statistics.
| Variable | N | Mean | Std. Dev. | Min | Max |
| Lev | 984 | -1.476 | 1.769 | -9.602 | 2.004 |
| Size | 984 | 0.854 | 0.392 | -0.865 | 1.504 |
| Growth | 984 | -0.853 | 1.572 | -11.667 | 2.131 |
| NDTS | 984 | -2.398 | 1.551 | -10.059 | -0.326 |
| Roe | 984 | 0.030 | 0.106 | -0.912 | 0.499 |
Table 4.
Before and after the enactment of the policy changes in average corporate financial leverage.
Table 4.
Before and after the enactment of the policy changes in average corporate financial leverage.
| Mean (Capital goods) | Mean (Other products) | Meandiff | |
| Total sample period | 0.466 | 0.691 | -0.225 *** |
| Before policy | 0.409 | 0.558 | -0.149 *** |
| After policy | 0.523 | 0.824 | -0.301 *** |
Note: Meandiff Is the difference between the mean.
Table 5.
Baseline regression results.
| Variable | The capital structure of the enterprise | ||
| (1) | (2) | (3) | |
| did | -0.182*** | -0.187*** | -0.187*** |
| (-3.24) | (-3.38) | (-3.35) | |
| Size | -0.007 | -0.434 | -0.4 |
| (-0.06) | (-1.53) | (-1.32) | |
| Growth | 0.134*** | 0.161*** | 0.159*** |
| (4.46) | (4.2) | (4.13) | |
| NDTS | 1.048*** | 1.049*** | 1.049*** |
| (8.40) | (7.69) | (7.83) | |
| Roe | -0.233 | -0.165 | -0.161 |
| (-0.90) | (-0.62) | (-0.60) | |
| cons | 1.531*** | 1.189*** | 1.511*** |
| (6.21) | (11) | (5.98) | |
| Year-fixed-effects | Yes | No | Yes |
| Individual-fixed-effects | No | Yes | Yes |
| R-squared | 0.941 | 0.942 | 0.942 |
| N | 984 | 984 | 984 |
Note: In parentheses are the standard errors of regression coefficients. *, * *, * * * are significant at 10%, 5%, 1% levels, respectively.
Table 6.
Analysis of the effect of green finance policy on capital structure under financing constraints and enterprise asset scale heterogeneity.
Table 6.
Analysis of the effect of green finance policy on capital structure under financing constraints and enterprise asset scale heterogeneity.
| Variable | The capital structure of the enterprise | |||
| (1) | (2) | (3) | (4) | |
| did | -0.275*** | -0.021 | -0.272*** | -0.088 |
| (-3.30) | (-0.34) | (-3.30) | (-1.21) | |
| Year-fixed-effects | Yes | Yes | Yes | Yes |
| Individual-fixed-effects | Yes | Yes | Yes | Yes |
| R-squared | 0.938 | 0.967 | 0.948 | 0.927 |
| N | 469 | 515 | 494 | 490 |
Note: In parentheses are the standard errors of regression coefficients. *, * *, * * * are significant at 10%, 5%, 1% levels, respectively.
Table 7.
Results of robustness test for PSM-DID model.
| Variable | The capital structure of the enterprise | ||
| (1) | (2) | (3) | |
| did | -0.191*** | -0.186*** | -0.191*** |
| (-3.44) | (-3.31) | (-3.42) | |
| Size | -0.395 | 0.014 | -0.354 |
| (-1.36) | -0.12 | (-1.15) | |
| Growth | 0.166*** | 0.145*** | 0.164*** |
| (4.04) | (4.36) | (3.98) | |
| NDTS | 1.048*** | 1.049*** | 1.048*** |
| (7.55) | (8.16) | (7.69) | |
| Roe | -0.241 | -0.304 | -0.237 |
| (-0.96) | (-1.25) | (-0.93) | |
| cons | 1.498*** | 1.180*** | 1.477*** |
| (5.92) | (10.53) | (5.71) | |
| Year-fixed-effects | Yes | No | Yes |
| Individual-fixed-effects | No | Yes | Yes |
| R-squared | 0.943 | 0.942 | 0.943 |
| N | 967 | 967 | 967 |
Note: In parentheses are the standard errors of regression coefficients. *, * *, * * * are significant at 10%, 5%, 1% levels, respectively.
Disclaimer/Publisher’s Note: The statements, opinions and data contained in all publications are solely those of the individual author(s) and contributor(s) and not of MDPI and/or the editor(s). MDPI and/or the editor(s) disclaim responsibility for any injury to people or property resulting from any ideas, methods, instructions or products referred to in the content. |
© 2025 by the authors. Licensee MDPI, Basel, Switzerland. This article is an open access article distributed under the terms and conditions of the Creative Commons Attribution (CC BY) license (http://creativecommons.org/licenses/by/4.0/).
Copyright: This open access article is published under a Creative Commons CC BY 4.0 license, which permit the free download, distribution, and reuse, provided that the author and preprint are cited in any reuse.


