Submitted:
06 May 2025
Posted:
06 May 2025
You are already at the latest version
Abstract
In this investigation, surface-enhanced Raman spectroscopy (SERS) combined with multivariate analysis was investigated for detection and characterization of ofloxacin residues in egg white. Gold nanoparticles (AuNPs) were meticulously synthesized to serve as the substrate for enhancing Raman signals. The SERS characteristic peaks of ofloxacin were conducted using the density functional theory (DFT) calculations. In an effort to optimize the quantitative detection conditions for ofloxacin residues in egg white, the optimal detection parameters were determined via a single-factor experiment. The optimal combination involves the homogeneous mixing of 500 μL of AuNPs, 75 μL of magnesium sulfate solution, and 20 μL of the test solution, followed by a 1-minute adsorption period prior to detection. Following a meticulous comparison of seven distinct spectral preprocessing methodologies, the utilization of adaptive iterative re-weighted penalized least squares (air-PLS) combined with savitzky-golay (SG) preprocessing for the spectral datawithin 400 to 1800 cm-1 were finally selected. The principal component analysis (PCA) helped establish an optimal support vector regression (SVR) model, which was subsequently employed to quantitatively detect the concentration of ofloxacin residues in egg white. It is noteworthy that the SVR model demonstrated outstanding performance metrics, with an R-squared prediction (R2 p) value of 0.9896, root mean square error of prediction (RMSEP) of 1.6246, and residual predictive deviation (RPD) of 8.1720. The findings indicate that the SERS-based multivariate analysis technique can swiftly and precisely identify the ofloxacin residues in egg white.
Keywords:
egg white
; ofloxacin
; surface-enhanced Raman spectroscopy
; density functional theory
; gold nanoparticles
1. Introduction
In the realm of human nutrition, a distinguished status is held by eggs as a primary source of essential proteins and a wealth of nutrients, earning their place as one of the most ubiquitous animal-derived staples in our daily lives. However, the pursuit of economic gain has led to the employment of copious amounts of feed and medications infused with antibiotics during the rearing of egg-laying hens by many poultry farmers. Unfortunately, this practice results in the presence of residual antibiotics within the eggs, and the prolonged consumption of such antibiotic-tainted eggs can lead to the accumulation of these substances in the human body, ultimately posing a significant health risk.[1],[2] Among the antibiotics found in eggs, ofloxacin, a member of the quinolone-class of broad-spectrum antibiotics, stands out prominently. It is favored for its ease of administration, broad-spectrum antibacterial properties, low cross-resistance potential, and cost-effectiveness, making it one of the most frequently employed antibiotic agents in the poultry industry.[3],[4] In the interest of maintaining the quality of animal-derived food products and safeguarding the environment, international regulations prescribing maximum residue limits (MRLs) for quinolone-class antibiotics in animal-derived foodstuffs have been meticulously outlined.[5] For example, in China, the "Regulations on the Administration of Veterinary Drugs" strictly mandate the discontinuation of four veterinary drugs, including lomefloxacin, pefloxacin, ofloxacin, and norfloxacin, in food-producing animals.[6] In the United States, the updated Veterinary Feed Directive (VFD) was implemented by the Food and Drug Administration (FDA) on January 1, 2017, following its revision on October 1, 2015, to ensure the judicious use of antibiotics in animals raised for food production.[7] Likewise, a stringent maximum residue limit of 50 μg/kg for ofloxacin in poultry products has been established in Japan. Despite these stringent regulations governing ofloxacin usage, concerns have persisted due to instances of antibiotic overuse, resulting in the discovery of ofloxacin residues exceeding established MRLs in various food products, including aquatic items, eggs, and pork.[8] These revelations have garnered substantial attention from the general public and underscore the pressing need for continued vigilance in ensuring food safety and antibiotic stewardship.
Currently, a variety of methods exist for identifying antibiotics within animal tissues, such as high-performance liquid chromatography (HPLC) ,[9] liquid chromatography-mass spectrometry (LC-MS) ,[10] and gas chromatography (GC) .[11] Despite their renowned accuracy and reliability, these methods are labour-intensive, time-consuming, expensive, and require skilled operators, which limits their applicability, especially for on-site rapid detection.[12] Therefore, there is an urgent need to investigate a swift and efficient approach to detecting residual ofloxacin in eggs. SERS has rapidly emerged as a sensitive detection technique, with broad applications in diverse domains. These include bioanalysis,[13] medical diagnostics,[14] environmental surveillance,[15] cultural heritage preservation,[16] and pesticide residue assessment.[17] SERS is user-friendly, and its sensitivity is unparalleled. In recent years, SERS technology has become increasingly significant due to its exceptional analytical efficiency and sensitivity in identifying antibiotic residues in animal-based food products.[18] Sagar Dhakal and his team have developed a quantitative detection method with SERS, which enables the swift identification of tetracycline residues in whole milk through the use of silver nanoparticles. A robust linear correlation between the SERS signal intensities at 1285 cm-1 and 1322 cm-1 and the concentration of tetracycline-containing milk was successfully established, with a lowest detectable concentration of 0.01 ppm.[19] Additionally, Akwasi Akomeah and colleagues investigated an unlabeled, straightforward surface-enhanced Raman spectroscopy material, Au@Ag nanosensors, and coupled them ingeniously with genetic algorithm-partial least squares (GA-PLS) analysis. This combined approach has facilitated the swift and accurate identification, along with measurement, of norfloxacin in fish muscle specimens, even at comparatively low concentrations (2.36×10⁻⁵ μg/mL) .[20]
SERS technology was employed alongside multivariate analysis in this investigation to expedite detection of ofloxacin residues in egg white. The optimization of SERS detection parameters for ofloxacin residues in egg white was conducted meticulously using single-factor experiments. AuNPs were selected as the enhancement substrate, with magnesium sulphate serving as the activator for SERS detection. Initially, the air-PLS was used with SG smoothing to preprocess SERS spectra ranging from 400 to 1800 cm-1. These spectra were acquired from egg white samples with varying concentrations of ofloxacin. Following this, essential feature variables were extracted using PCA. Inputs for constructing the SVR model were chosen judiciously, utilizing the first three principal component scores. This facilitated the creation of a predictive framework, enabling the quantification of ofloxacin residues in egg white. This study provides important insights into the quantitative analysis of quinolone-class veterinary drug residues in animal tissues. It achieves this through the amalgamation of SERS and multivariate analysis techniques.
2. Materials and Methods
2.1. Materials and Reagents
The chicken eggs were procured from a local wet market. Hydrogen tetrachloroaurate (III) trihydrate (HAuCl4·3H2O, ≥49.0%) was sourced from Sigma-Aldrich Trading Co., Ltd. Sodium citrate tribasic, sodium chloride, magnesium sulfate, and potassium bromide (all of analytical grade, ≥99%) were obtained from West Long Science & Technology Co., Ltd. A solution of trichloroacetic acid (C2HCl3O2, 100 g/L) and acetonitrile (CH3CN, chromatographic grade, ≥99.9%) were supplied by Shanghai Aladdin Bio-Chem Technology Co., Ltd. The ofloxacin detection standard (≥99%) was acquired from the National Standard Material Network. Ultra-pure water with a resistivity of 18.25 MΩ⋅cm was meticulously prepared in-house within the laboratory.
2.2. Instruments
A Portable Raman spectrometer, which includes the QE65Pro Raman spectrometer produced by the American Ocean Optics Company, was employed to collect Raman spectrums. The laser wavelength is 785 nm, and the scanning range is 150-2100 cm-1. The AuNPs synthesis process involved the utilization of an intelligent constant-temperature magnetic stirrer (ZNCL T, Yarong Instrument Co., Ltd., Zhengzhou, China). To characterise and analyse the gold nanoparticles, advanced equipment was utilized. This included a UV-Visible (UV-Vis) spectrophotometer (T6, Puxi General Instruments Co., Ltd., Beijing, China), scanning electron microscopy (SEM) using the ZEISS Sigma 300 system (Germany), and transmission electron microscopy (TEM) with the JEOL JEM-2100Plus instrument (Japan). All laboratory glassware was meticulously cleaned using an ultrasonic cleaner (JK-50B, Jinnick Mechanical Manufacturing Co., Ltd., Hefei, China). Experimental substances were weighed precisely on an electronic balance (FA1004B, Beijing Kewei yongxing Instruments Co., Ltd.). The ultrapure water essential for our experiments was supplied by a laboratory ultrapure water system (TeLedyne Water Quality, USA).
2.3. Gold Nanoparticles Preparation
The synthesis of AuNPs was conducted with minor adjustments, building upon prior research.[21] To begin, all glassware was meticulously cleaned through immersion in aqua regia and subsequent rinsing for subsequent use. A 150 mL solution of 2.2 mM sodium citrate was then prepared in a three-necked round-bottom flask, followed by heating with continuous stirring for a duration of 15 minutes. Subsequently, 1 mL of a 25 mM HAuCl4 solution was introduced. After an additional 10 minutes of heating and stirring, the solution was gradually cooled to 90°C, at which point 1 mL of a 60 mM sodium citrate solution was rapidly added. Following 2 minutes of vigorous stirring, an additional 1 mL of a 25 mM HAuCl4 solution was incorporated. The solution was consistently maintained at a constant temperature of 90°C and stirred for a period of 30 minutes. At this juncture, 2 mL of the solution was extracted from the flask, and the cooling process to 90°C and the subsequent reagent addition steps were reiterated. Throughout this iterative process, the nanoparticle size of the gold nanoparticles progressively increased. This sequence of steps was repeated until the 14th iteration was achieved. Finally, the resultant gold colloid was allowed to cool to room temperature and then stored at 4°C for subsequent utilization.
2.4. Preparation of Samples
Egg whites were separated using an egg white separator. Subsequently, 10 mL of blank egg white, along with varying concentrations of ofloxacin standard solutions, were transferred to 50 mL centrifuge tubes. To this mixture, 5 mL of trichloroacetic acid solution and 5 mL of acetonitrile solution were added. After being thoroughly mixed and vortexed for one minute, the samples were subjected to five minutes of ultrasonication, and then centrifugated with 4500 rpm for 10 minutes. The resulting supernatant was then collected and reserved for further analysis.[22],[23]
2.5. Calculation Theoretical Molecule
The molecular structure of ofloxacin was optimized, and theoretical Raman spectra were calculated using Gaussian 09 software, in conjunction with Gaussian View 05. DFT calculations were conducted, employing the B3LYP hybrid functional in conjunction with the 6-311G (d, p) basis set for structural optimization.[24]
2.6. SERS Measurement
SERS spectra were obtained by sequentially adding 500 μL of AuNPs, 20 μL of the test sample, and 75 μL of an electrolyte solution into individual quartz vials. Following thorough mixing, the mixture was transferred to the sample detection platform of a portable Raman spectrometer. The integration time was set to 10 seconds, the laser power to 800 mW, averaging was executed twice, and the data was smoothed with a level of 1. SERS spectra within the range of 400 to 1800 cm-1 were selected for subsequent data analysis. The entire process, including sample preparation and measurement, was completed within a 20-minute timeframe.
2.7. Optimization Schemes of SERS Detection Conditions
SERS enhancement substrates, electrolyte activators, and adsorption time have a crucial role in determining the intensity of SERS signals. Therefore, a single-factor experimental technique was employed to investigate the impact of four SERS detection variables, including electrolyte category and addition, volume of gold nanoparticle colloids, and adsorption time. SERS analysis was conducted on five parallel samples of ofloxacin extracted from egg whites, each with a concentration of 5 mg/L. The average spectrum was calculated to represent the SERS spectrum of the sample. By comparing the variation of characteristic peak intensity of samples, especially at 1309 cm-1, the optimal detection conditions were determined.
2.8. Data Analysis
All data processing procedures were conducted using MATLAB 2020b and Unscrambler X 10.4. Initially, spectral data underwent preprocessing through various techniques, including air-PLS, normalization, first and second derivatives, standard normal variate (SNV), multiplicative scatter correction (MSC), and SG. Subsequently, a comparison between PCA and competitive adaptive reweighted sampling (CARS) as feature extraction methods led to the selection of optimal feature peak variables from the Raman spectra in the 400 to 1800 cm-1 range for input into the quantitative analysis model. Finally, three models SVR, Multiple Linear Regression (MLR), and Partial Least Squares Regression (PLSR) were established. Model performance was assessed based on the correlation coefficient (R2), root mean square error (RMSE), and the RPD to identify the most effective quantitative analysis model. In general, smaller RMSE values and larger R2 and RPD values are indicative of superior model performance and accuracy.
3. Results and Discussion
3.1. Au Nanoparticle Characterization Analysis
Figure 1 provides a comprehensive characterization of gold nanoparticles synthesized through a reduction method. TEM images in Figure 1a and Figure 1b, along with the SEM image in Figure 1c, vividly depict the spherical morphology of the gold nanoparticles, underscoring their impressive uniformity. The average particle size was determined approximates 50 nm through calculations. In Figure 1d, the UV-Vis absorption spectrum reveals a prominent absorption peak at 536 nm, attributed to surface plasmon resonance (SPR), indicative of an estimated nanoparticle size of approximately 50 nm.[25] These indicate that the prepared gold colloid has capabilities of the remarkable SERS enhancement.
3.2. Experimental SERS and Theoretical Raman Spectrum for OFL
DFT is renowned for its robust computational capabilities and is widely employed in various fields, including quantum chemistry.[26]-[28] In this study, Gaussian View 05 and Gaussian 09 software were utilized to optimize and calculate the molecular structure of ofloxacin. The computational results converged successfully. The resulting theoretical Raman spectrum (line b) was compared with the experimental Raman spectrum of a 5 mg/L ofloxacin standard solution (line a), as illustrated in Figure 2a. Figure 2a clearly demonstrates a high degree of agreement between the experimental and theoretical vibrational peaks of ofloxacin. The experimental peaks at 889 cm-1 align perfectly with the theoretical peaks, while deviations of 14, 3, 6, 4, 3 and 8 nm are observed at 560, 785, 956, 1154, 1309 and 1514 cm-1 in comparison to the theoretical peaks. These variations can be attributed to the idealized vibrational modes considered in the theoretical spectra, which primarily account for interactions between molecular functional groups and may not fully encompass intermolecular forces, leading to some disparities between experimental and theoretical spectra.[29]
Ofloxacin molecules are characterized by a quinoline ring as the parent nucleus, connected to a fluorine atom, a piperazine ring, and a carboxyl group. The compound ofloxacin has a molecular formula of C18H20FN3O4. Figure 2a shows the optimized molecular structure which includes functional groups such as C-O-H, C=O, C-H, CH3, and C-F. These functional groups give rise to distinctive vibrational bands such as stretching, bending, and deformation. The assignments of specific peaks corresponding to various vibrational modes in ofloxacin are delineated in Table 1.[30] The peak at 560 cm-1 can be attributed to C-O bending and C=O stretching vibrations. The peak at 785 cm-1 is associated with C-O-H bending, whereas the peak at 889 cm-1 corresponds to the out-of-plane bending vibration of the C=O group within the quinoline ring. The peak at 956 cm-1 results from CH3 shear vibrations, and the 1154 cm-1 peak arises from C-H shear vibrations. The peak at 1309 cm-1 can be attributed to C-N-C shear vibrations and C-C-O in-plane bending vibrations.[31] Lastly, the peak at 1514 cm-1 is attributed to C-C stretching vibrations and out-of-plane bending vibrations of C-H.[32]
3.3. SERS Analysis of OFL in egg white
Figure 2b displays the SERS spectra of 5 mg/L ofloxacin in egg white extract, negative egg white extract, acetonitrile, and trichloroacetic acid. As depicted in Figure 2b, the SERS characteristic peaks of ofloxacin during the egg white extraction process are clearly located at 559, 790, 889, 956, 1161, 1309 and 1507 cm-1. Importantly, there is no spectral overlap between these SERS characteristic peaks and those of the negative egg white extract, acetonitrile and trichloroacetic acid. Therefore, the peaks at 559, 790, 889, 956, 1161, 1309 and 1507 cm-1 can be utilized for the analysis of ofloxacin residues in egg white.
In Figure 2c, the SERS spectra of ofloxacin in egg white extract at various concentrations are presented. The figure illustrates a gradual increase in the SERS characteristic peak intensity as the concentration of ofloxacin within the egg white increases, especially at 1309 cm-1. Consequently, the peak intensity of ofloxacin at 1309 cm-1 in the egg white extract can be used for the basis for establishing the standard curve. Figure 2d demonstrates the curve equation (y = 54.89x + 110.43, R2 = 0.9959) using the peak intensity at 1309 cm-1. The results illustrate a robust linear relationship between the ofloxacin concentrations in egg white and the peak intensities within the concentration range of 0.5 to 45.0 mg/L. This indicate that the adopted methods for detecting ofloxacin is feasible even below 0.5 mg/L.
3.4. Optimization of SERS Detection Parameters
The choice of specific electrolytes such as NaCl and MgSO4, as components of the SERS enhancement substrate, can either augment or diminish Raman spectroscopic intensity.[34] Therefore, an analysis was performed to determine the SERS enhancement effects from four substrate combinations, namely AuNPs, AuNPs with a MgSO4 solution, AuNPs with a NaCl solution, and AuNPs with a KBr solution, on samples containing ofloxacin moieties, as illustrated in Figure 3a. The bar chart highlights that the combination of AuNPs with an electrolyte solution significantly outperforms the use of AuNPs alone in exciting the SERS signal of ofloxacin in egg white. Under identical conditions, the introduction of MgSO4 solution as an activator result in the highest Raman characteristic peak intensity, with the peak intensity reaching its maximum at 1309 cm-1. Consequently, MgSO4 solution was chosen as the electrolytes with the AuNPs to enhance SERS in subsequent tests.
The addition of electrolytes like MgSO4 to the AuNPs can boost the SERS activity of AuNPs. Studies suggest that the quantity of added electrolyte also affects the SERS signal.[35] Taking MgSO4 as an example, the effect of electrolyte addition on the efficiency of AuNPs was investigated. The trend chart in Figure 3b demonstrates that when the amount of added MgSO4 is relatively low (<75 μL), the SERS signal of ofloxacin molecules gradually intensifies. This phenomenon can be attributed to the aggregation of AuNPs when a small amount of magnesium sulfate is added, resulting in an increase in SERS active sites. As the quantity of magnesium sulfate is increased, an excess of electrolyte disturbs the colloid stability, resulting in sol coagulation and weakening or loss of the SERS signal. Therefore, 75 μL of MgSO4 solution is considered as the optimal dosage.
When sample solution molecules encounter AuNPs, a significant number of molecules aggregate and adsorb within the gaps of the rough surface of the AuNPs, thereby enhancing the SERS spectrum.[33] Studies suggest that the addition of varying amounts of AuNPs may impact the SERS signal, underscoring the necessity of optimizing the amount of added AuNPs.[4] As evident in Figure 3c, it can be observed that with an increase in the quantity of added AuNPs, the Raman characteristic peak intensity at 1309 cm-1 initially rises and subsequently declines. The peak intensity reaches its maximum when the added amount reaches 500 μL. The possible reason for this phenomenon is that when the amount of AuNPs increases to a certain threshold, more ofloxacin molecules adsorb to the surface of the AuNPs, resulting in the strongest SERS signal at 1309 cm-1. Subsequently, due to the excessive volume of the AuNPs, the ratio of the surface area of AuNPs to the surface area of the test molecules decreases, thereby inhibiting molecular binding. Therefore, the ideal amount of AuNPs added was found to be 500 μL in subsequent experiments.
The adsorption time of the analyte on the surface of AuNPs significantly impacts the enhancement of the SERS signal. When the analyte contacts the enhanced substrate, active 'hot spots' are generated at a particular moment, maximizing the SERS signal.[36] As illustrated in Figure 3d, at 1309 cm-1, different adsorption times produce varying effects on the SERS signal intensity. The Raman spectroscopic intensity reaches its maximum at 1 minute and subsequently gradually decreases. (In the initial stages of contact, an increase in SERS signal intensity is observed, attributed to the surpassing availability of surface-active hot spots required in quantity. In the later stages of contact, a decrease in SERS spectroscopic intensity is noted as the number of active hot spots diminishes. Consequently, an optimal adsorption time was determined for 1 minute.
3.5. Data Analysis: Spectra Pretreatment
To ensure the reduction of extraneous factors, such as fluorescence, noise, and baseline drift, which may influence spectral analysis, it is of paramount importance to preprocess the raw spectral data before establishing predictive models.[37] In this regard, our study employed seven preprocessing techniques, including air-PLS, air-PLS combined with first-order and second-order derivatives, normalization, SG smoothing, SNV transformation, and MSC, with the purpose of eliminating these potential sources of interference.
Following this, a SVR model was developed for the analysis of Raman spectra derived from the samples. The application of baseline correction, first-order, and second-order derivatives aimed at the removal of drift and background effects, thus effectively enhancing the correlation of specific spectral positions, despite modifying the trends in original data correlations. It is worth noting that SG smoothing played a pivotal role in eliminating noise and baseline drift from the spectra. In spectral data analysis, sample errors manifest as irregular distribution or variations in particle size. Nevertheless, MSC and SNV can alleviate the impact of these errors on spectral analysis results, ultimately improving the correlation between the original and preprocessed spectra. Additionally, normalization serves to rectify errors stemming from significant differences in size.
The determination of the optimal preprocessing method relied on achieving the R2 and the RMSE for the established SVR prediction model. As illustrated in Table 2, it was observed that the models developed using the air-PLS, air-PLS+SG and air-PLS combined with first-order derivative preprocessing methods consistently yielded R2 values surpassing 0.98, accompanied by relatively low RMSE values. Notably, the SVR prediction model established after preprocessing with air-PLS combined with SG exhibited the highest performance, boasting an impressive R2 of 0.9896 and a minimal RMSEP of 1.6246. Consequently, our study concluded by selecting air-PLS combined with SG as the optimal spectral preprocessing method for the SVR prediction model of ofloxacin residue in egg white.
3.6. Data Dimension Reduction
During data processing, dealing with large datasets can introduce various complexities and potentially lead to performance degradation in constructed models, primarily due to the inclusion of irrelevant information.[38] Therefore, it is imperative to extract highly relevant information associated with the characteristics of the target object, reduce data redundancy, and enhance modeling efficiency. As demonstrated in Table 3, the impact on the final SVR model is compared under three conditions no feature extraction, feature extraction using CARS, and feature extraction using PCA.
CARS is a feature selection method that integrates Monte Carlo sampling with regression coefficients from Partial Least Squares (PLS) models. It involves multiple iterations to select a subset with the lowest Root Mean Square Error in Cross-Validation (RMSECV) through Monte Carlo Cross-Validation (MCCV). This subset represents the most valuable information within the dataset.[39] As shown in Figure 4, it is indicated that feature variables are extracted by CARS from a pool of 449 variables. After 33 iterations, the RMSECV reached a minimum of 1.8865, resulting in the selection of 13 feature variables for input into the SVR model. PCA, a commonly used multivariate analysis method, identifies critical information within raw data by extracting principal components that best represent the original dataset as inputs for models. Generally, when the cumulative variance contribution of the principal components exceeds 90%, it effectively encapsulates the main spectral information.[40],[41] In this research, 449 variables underwent PCA feature extraction. The first principal component accounted for 74.07% of the variance, and the cumulative variance contribution of the first three principal components exceeded 90.25%. Thus, the first three principal components were chosen as inputs for the SVR model.
Table 3 provides a performance comparison of SVR models under three different scenarios. The use of CARS and PCA for feature extraction resulted in significant improvements in model performance. Remarkably, PCA required the extraction of only three feature variables from the initial 449, achieving the highest value of 0.9896. These factors indicate that PCA was chosen as the method for feature variable extraction in this study.
3.7. Model Establishing
A prediction model was established for the detection of ofloxacin residues in egg white, encompassing various concentration gradients ranging from 0.5 mg/L to 45 mg/L. Each concentration level underwent analysis with five parallel samples, yielding a total of 120 samples. From this pool, 90 samples were randomly assigned to construct the model's training set, while the remaining 30 samples formed the prediction set. To assess the predictive accuracy and effectiveness of the model, three modeling methods SVR, MLR, and PLSR were used and compared. As presented in Table 4, the SVR-based model demonstrated the highest predictive performance with RMSEP of 1.6246, of 0.9896 and RPD of 8.1720. These metrics outperformed both MLR and PLSR models. Figure 5 illustrates the performance of the SVR model on both the calibration and prediction datasets, conclusively demonstrating its robust predictive capabilities. In summary, the SVR algorithm provided the closest approximation to actual values when predicting ofloxacin residues in egg white, significantly enhancing predictive accuracy. As a result, SVR was chosen as the optimal method for establishing the prediction model for ofloxacin residues in egg white.
4. Conclusions
In summary, a method has been developed for the identification of remnants of ofloxacin in egg white. This involves the use of SERS along with multivariate analysis. The optimum detection parameters comprised 500 μL of AuNPs, 75 μL of MgSO4 solution, and 20 μL of the liquid under test. The components were thoroughly mixed, left to adsorb for a minute and then analysed. It has been determined that the most efficient spectral preprocessing technique is to use air-PLS, along with SG smoothing. PCA-SVM model was employed on the training data and produced an R2 value of 0.9816 and an RMSE of 1.9551. In addition, the forecast dataset displayed a significant R2 value of 0.9896, with an RMSE of 1.6246 and an RPD of 8.1720. The results clearly show that incorporating AuNPs significantly improves the detection of ofloxacin in egg white. A swift and highly efficient method for identifying ofloxacin residues in egg white is provided by combining SERS with multivariate analysis.
Author Contributions
Conceptualization, Y.W. and R.Z.; methodology, J.Z.; software, S.H. and J.H.; validation, L.S. and Q.C.; formal analysis, F.P.; investigation, Y.W.; resources, M.L.; data curation, Y.W.; writing—original draft preparation, L.S.; writing—review and editing, S.H. and R.Z.; visualization, R.Z.; supervision, Y.W.; project administration, Y.W.; funding acquisition, M.L.. All authors have read and agreed to the published version of the manuscript. S.H. and J.Z. are as correspondence author. All authors reviewed the manuscript.
Funding
This research was financially supported by Key Research and Development Program Project of Jiangxi Province(20212BBF61014). The funders did not participate in the design of the study, the gathering and analysis of data, the choice to publish, or the drafting of the manuscript.
Data Availability Statement
The data collected in this research is available upon request.
Acknowledgments
The author extends her appreciation to Key Laboratory of Modern Agricultural Equipment in Jiangxi Province for funding this research work.
Conflicts of Interest
The authors declare no competing or financial interests.
Additional information
Correspondence and requests for materials should be addressed to Shuanggen Huang(shuanggenhuang1979@jxau.edu.cn).
References
- R. Kurrey, M. Mahilang, M. Kanti Deb, J. Nirmalkar, K. Shrivas, S. Pervez, M. Kumar Rai and J. Rai, Food Chemistry, 2019, 270, 459–466.
- Q. Wu, M. A. B. Shabbir, D. Peng, Z. Yuan and Y. Wang, Food Chemistry, 2021, 363, 130074.
- C. Belenguer-Sapiña, E. Pellicer-Castell, J. E. Haskouri, E. F. Simó-Alfonso, P. Amorós and A. R. Mauri-Aucejo, Journal of Food Composition and Analysis, 2022, 109, 104463.
- T. Wang, M. Liu, S. Huang, H. Yuan and J. Zhao, Analytical Letters, 2023, 56, 692–702.
- S. Hu, M. Zhao, Z. Wang, J. Yang, D. Chen and P. Yan, Journal of Chromatography A, 2021, 1649, 462235.
- Y. Yang, W. Qiu, Y. Li and L. Liu, Food Additives & Contaminants: Part B, 2020, 13, 177–184.
- S. Sarkar, M. J. Souza, T. Martin-Jimenez, M. A. Abouelkhair, S. A. Kania and C. C. Okafor, Veterinary Sciences, 2023, 10, 243.
- H. Zhang, M. Zhang, L. Li, W. Dong, Q. Ren, F. Xu, Y. Wang, T. Xu and J. Liu, Molecules, 2023, 28, 6473.
- G. G. Galyautdinova, V. I. Egorov, A. M. Saifutdinov, E. R. Rakhmetova, A. V. Malanev, D. V. Aleyev, S. Y. Smolentsev and E. I. Semenov, International Journal of Research in Pharmaceutical Sciences, 2020, 11, 311–314.
- C. Lan, D. Yin, Z. Yang, W. Zhao, Y. Chen, W. Zhang and S. Zhang, Journal of Analytical Methods in Chemistry, 2019, 2019, 1–13.
- M. R. Jadhav, A. Pudale, P. Raut, S. Utture, T. P. Ahammed Shabeer and K. Banerjee, Food Chemistry, 2019, 272, 292–305.
- Y. Kitahama, P. M. Pancorbo, H. Segawa, M. Marumi, T.-H. Xiao, K. Hiramatsu, W. Yang and K. Goda, Anal. Methods, 2023, 15, 1028–1036.
- Sultangaziyev, A. Ilyas, A. Dyussupova and R. Bukasov, Biosensors, 2022, 12, 967.
- Y. Ding, Y. Sun, C. Liu, Q. Jiang, F. Chen and Y. Cao, ChemistryOpen, 2023, 12, 1-13.
- N. T. T. Phuong, T.-A. Nguyen, V. T. Huong, L. H. Tho, D. T. Anh, H. K. T. Ta, T. H. Huy, K. T. L. Trinh and N. H. T. Tran, Micromachines, 2022, 13, 1840.
- P. Li, Y. Zhang, X. Huang, J. Chen, J. Chen, L. Li and X. Xi, ACS Omega, 2023, 8, 3091–3101.
- Q. Ou, B. Tang, L. Jiang, M. Han, W. Yang, J. Tang and G. Liu, Spectrochimica Acta Part A: Molecular and Biomolecular Spectroscopy, 2023, 290, 122315.
- M. Girmatsion, A. Mahmud, B. Abraha, Y. Xie, Y. Cheng, H. Yu, W. Yao, Y. Guo and H. Qian, Food Control, 2021, 126, 108019.
- S. Dhakal, K. Chao, Q. Huang, M. Kim, W. Schmidt, J. Qin and C. Broadhurst, Sensors, 2018, 18, 424.
- A. Agyekum, F. Y. H. Kutsanedzie, B. K. Mintah, V. Annavaram and A. O. Braimah, Food Anal. Methods, 2022, 15, 2346–2356.
- N.G. Bastús, J. Comenge and V. Puntes, Langmuir, 2011, 27, 11098-11105.
- Y. Cheng and Y. Dong, Food Control, 2011, 22, 685-689.
- Philippidis, Z. E. Papliaka and D. Anglos, Microchemical Journal, 2016, 126, 230-236.
- Y. Yang and H. Gao, Spectrochimica Acta Part A: Molecular and Biomolecular Spectroscopy, 2012, 85, 303–309.
- M. Tahghighi, D. Janner and J. Ignés-Mullol, Nanomaterials, 2020, 10, 2264.
- S. Caporali, F. Muniz-Miranda, A. Pedone and M. Muniz-Miranda, Sensors, 2019, 19, 2700.
- J. A. Obaleye, M. Lawal, R. N. Jadeja, V. K. Gupta, G. G. Nnabuike, M. O. Bamigboye, H. Roy, O. K. Yusuff and P. Bhagariya, Inorganica Chimica Acta, 2021, 519, 120264.
- X. Wu, M. V. Cañamares, I. Kakoulli and S. Sanchez-Cortes, J. Phys. Chem. Lett., 2022, 13, 5831–5837.
- N. Mahar, M. Haroon, T. A. Saleh and A. A. Al-Saadi, Journal of Molecular Liquids, 2021, 343, 117633.
- S. Haman Bayari and S. Sagdinc, Struct Chem, 2008, 19, 381–390.
- K. Kalaimagal and S. Gunasekaran, International Journal of ChemTech Research, 2015, 8, 1403–1416.
- U. Neugebauer, A. Szeghalmi, M. Schmitt, W. Kiefer, J. Popp and U. Holzgrabe, Spectrochimica Acta Part A: Molecular and Biomolecular Spectroscopy, 2005, 61, 1505–1517.
- S. D. Iancu, A. Stefancu, V. Moisoiu, L. F. Leopold and N. Leopold, Beilstein J. Nanotechnol., 2019, 10, 2338–2345.
- P. Mosier-Boss, Nanomaterials, 2017, 7, 142.
- K. Wang, Z. Yue, X. Fang, H. Lin, L. Wang, L. Cao, J. Sui and L. Ju, Science of The Total Environment, 2023, 856, 159108.
- T. Wang, M. Liu, S. Huang, H. Yuan, J. Zhao and J. Chen, Poultry Science, 2021, 100, 101165.
- L. Jiang, K. Gu, R. Liu, S. Jin, H. Wang and C. Pan, SN Appl. Sci., 2019, 1, 627.
- L. Li, Q. Cui, M. Li, T. Li, S. Cao, S. Dong, Y. Wang, Q. Dai and J. Ning, Food Chemistry, 2023, 398, 133841.
- Chiuri and F. Angelini, Sensors, 2021, 21, 2579.
- S. Tabbasum, M. I. Majeed, H. Nawaz, N. Rashid, M. Tahira, A. Mohsin, A. Arif, A. ul Haq, M. Saleem, G. Dastgir, F. Batool and S. Bashir, Photodiagnosis and Photodynamic Therapy, 2021, 35, 102426.
- F. Yang, C. Wang, H. Yu, Y. Guo, Y. Cheng, W. Yao and Y. Xie, Food Bioscience, 2022, 49, 101842.
Figure 1.
TEM image (a) and (b), SEM image (c), UV–Vis absorption spectra (d).
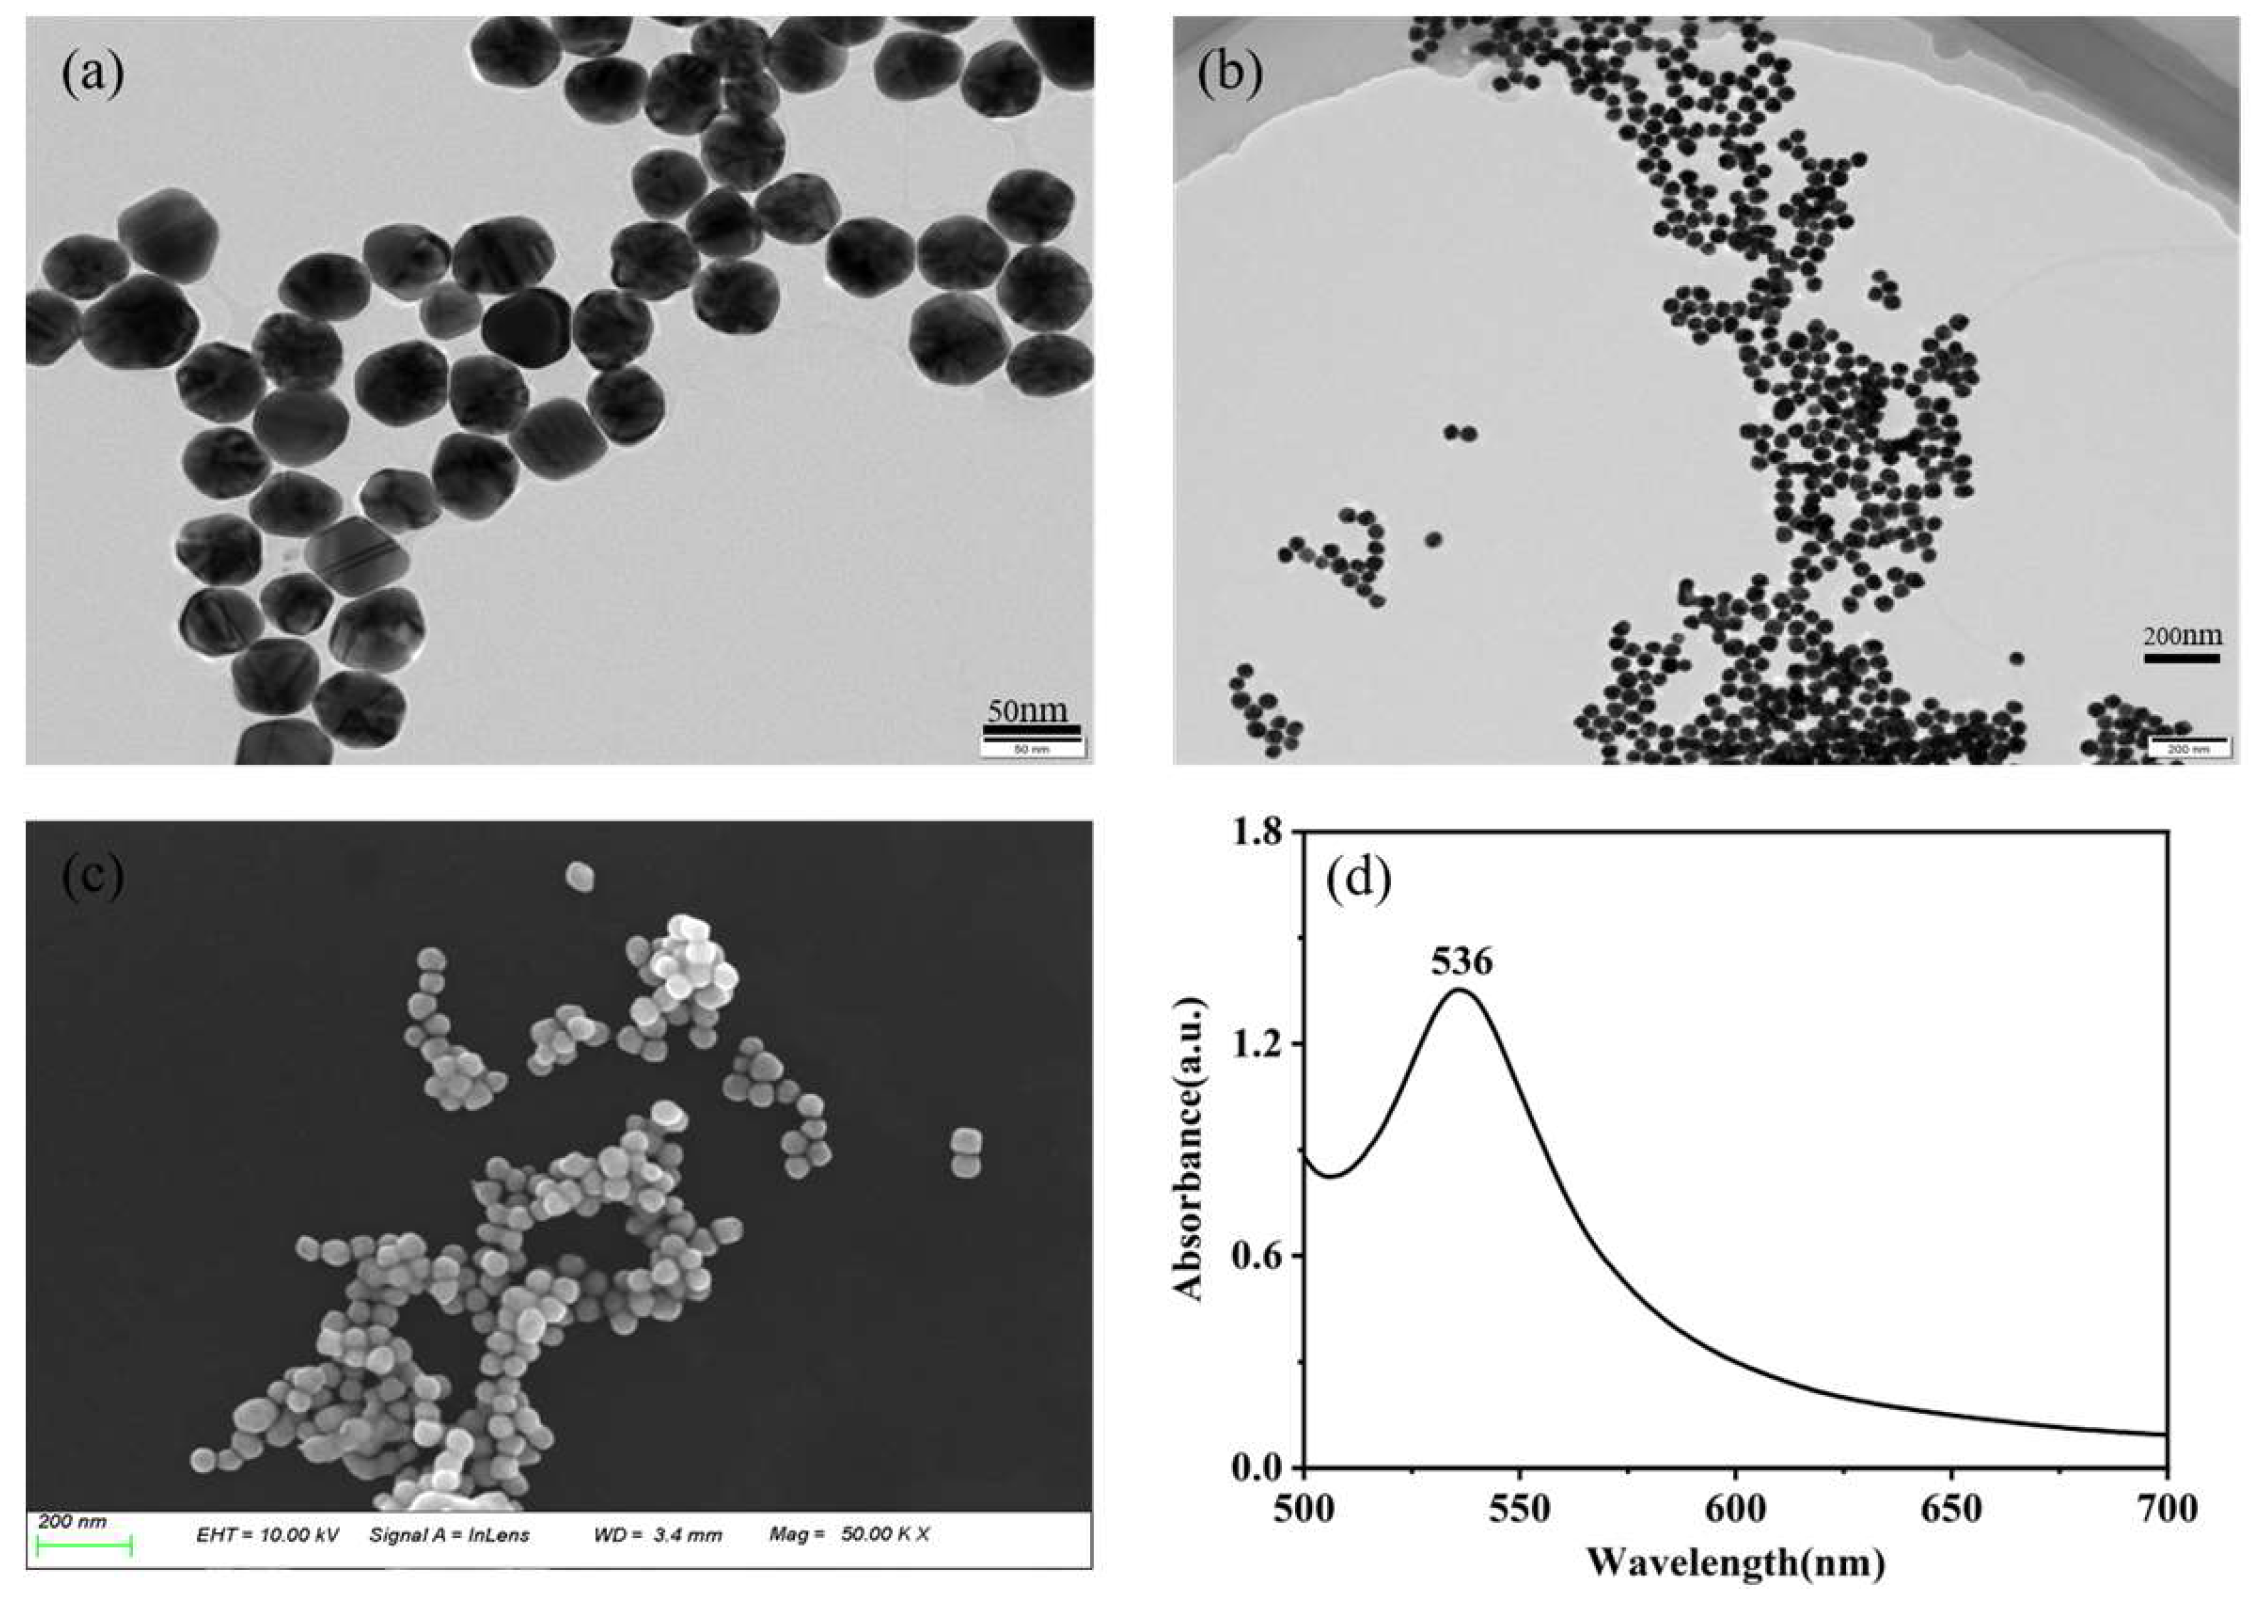
Figure 2.
(a) Experimental and DFT-calculated Raman spectra of ofloxacin. (b) SERS spectrum of egg white extract containing 5 mg/L ofloxacin, negative egg white extract, acetonitrile and trichloroacetic acid. (c) Relationship between the characteristic peak intensities at 1309 cm-1 and ofloxacin concentrations. (d) standard curve between the concentrations of ofloxacin based on egg white extraction and the peak intensities at 1309 cm-1.
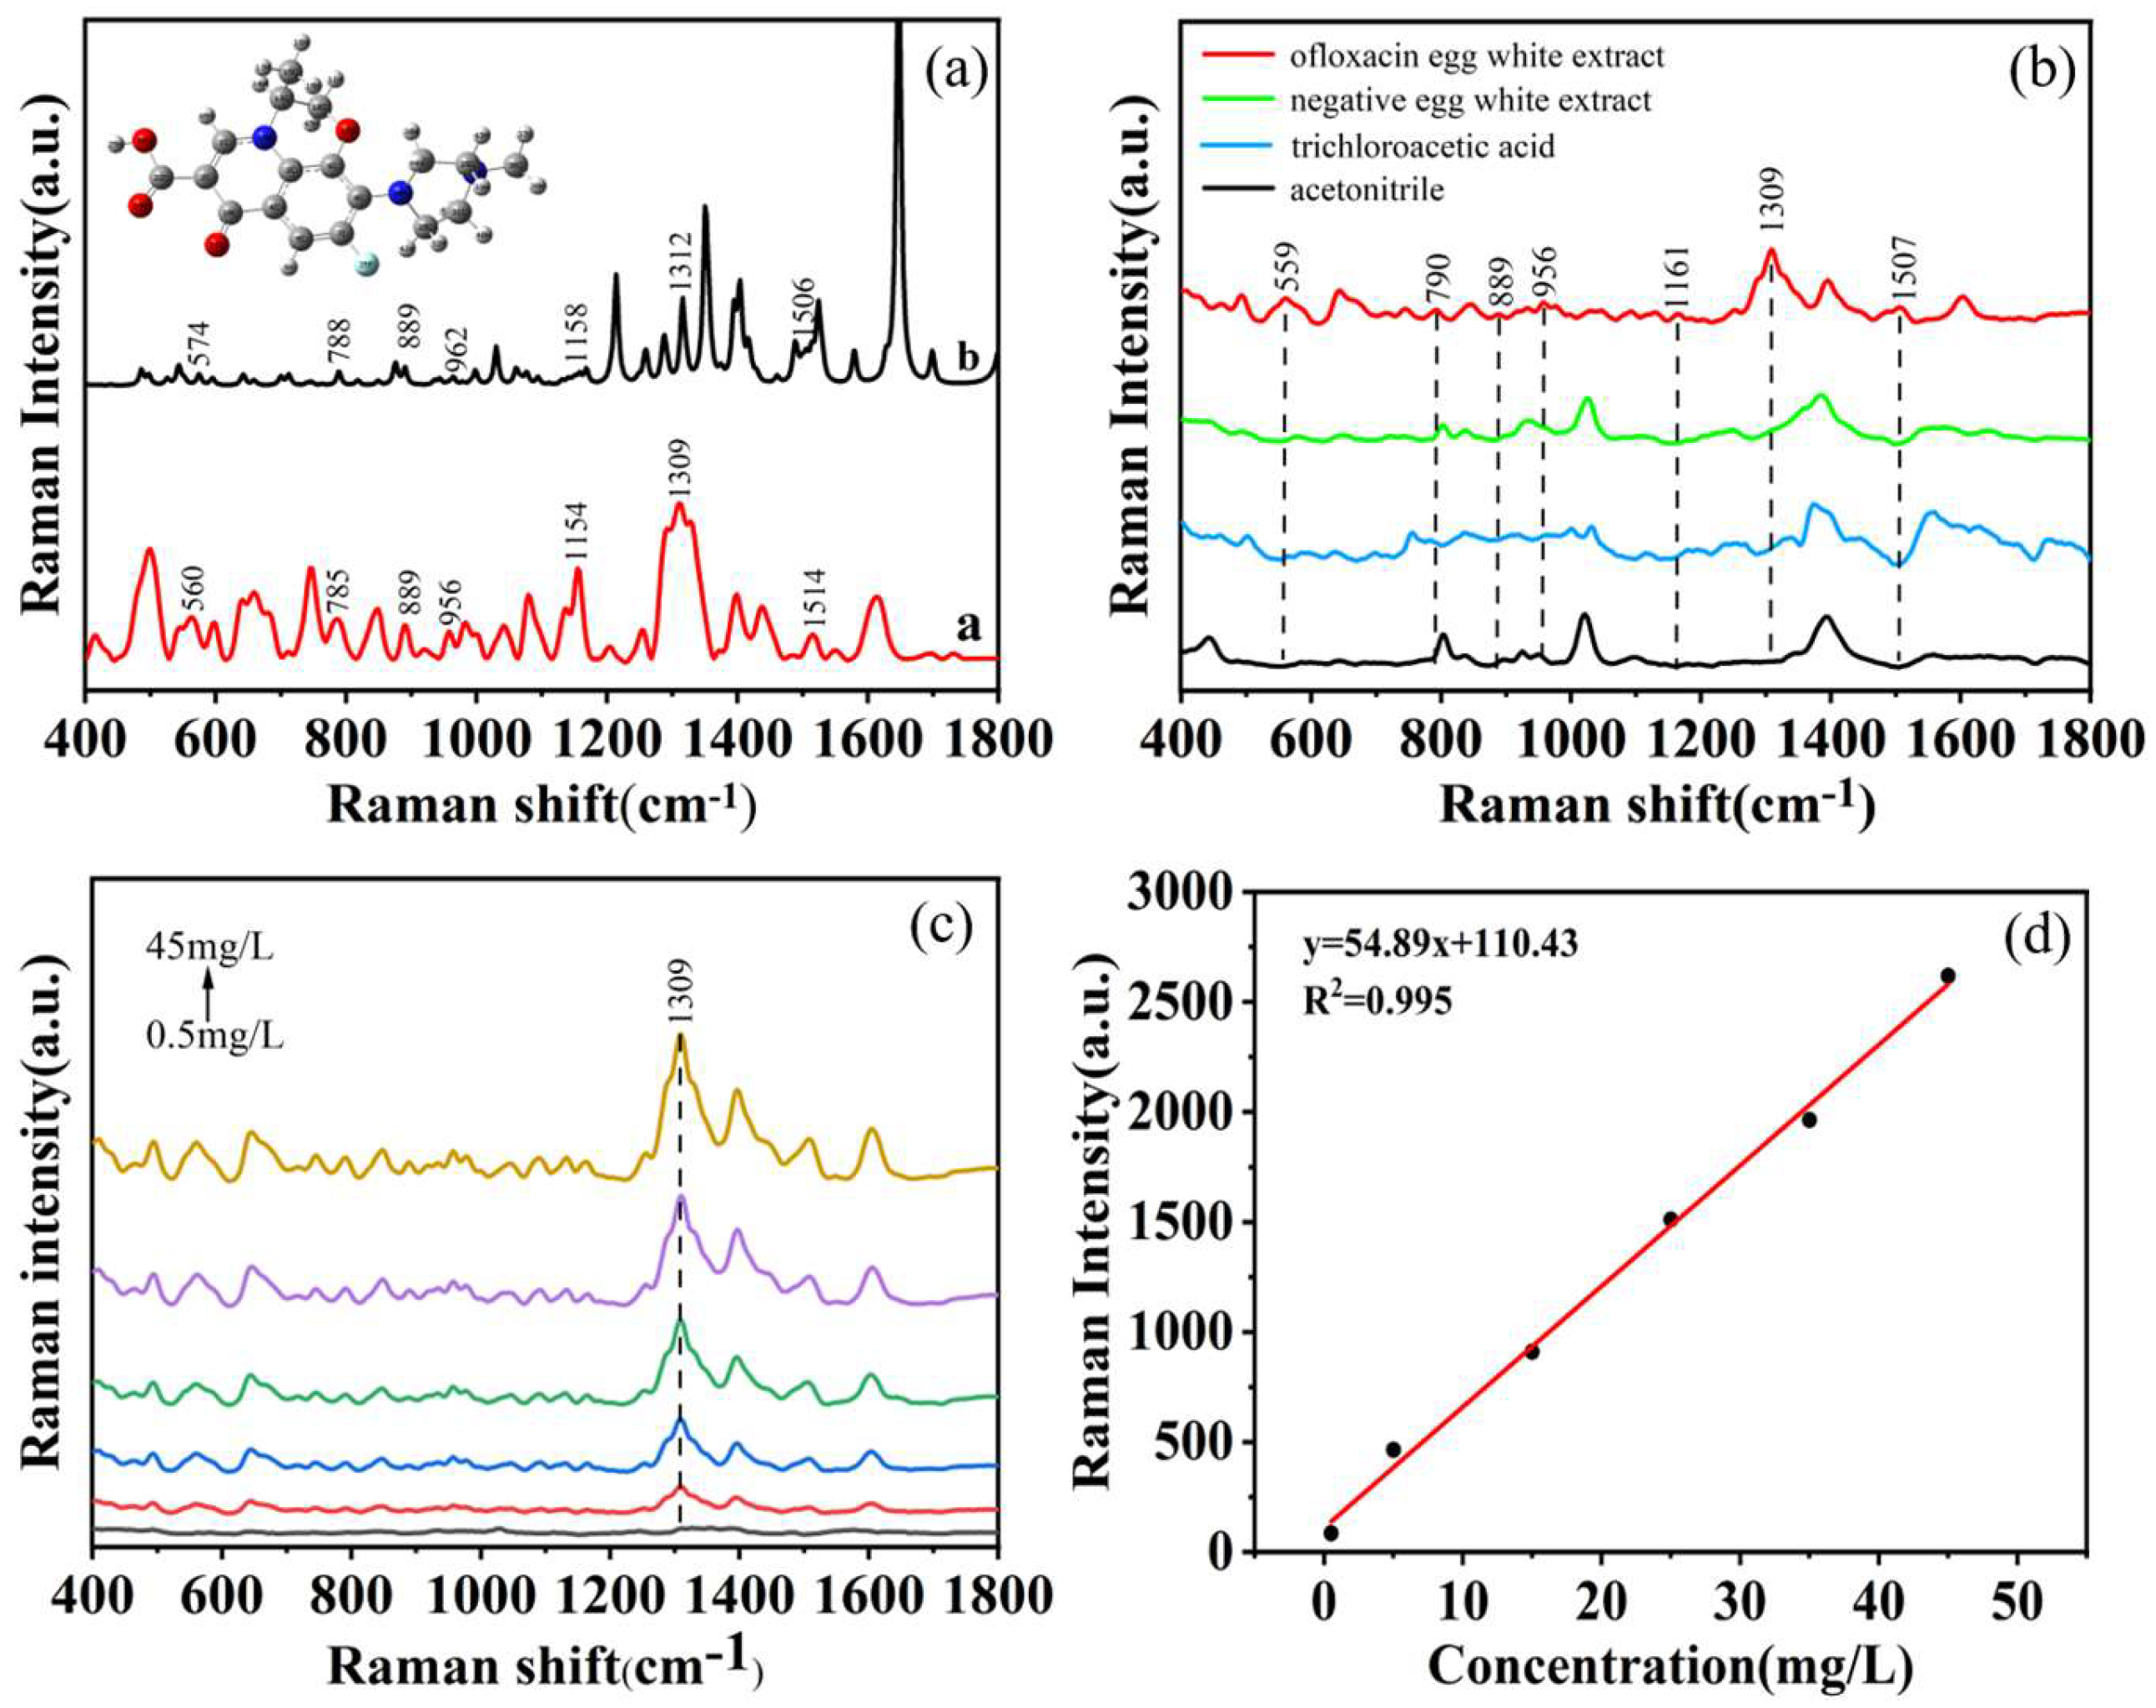
Figure 3.
Average Raman signal intensity of egg white extract containing 5 mg/L ofloxacin at 1309 cm-1 under different conditions.
Figure 3.
Average Raman signal intensity of egg white extract containing 5 mg/L ofloxacin at 1309 cm-1 under different conditions.
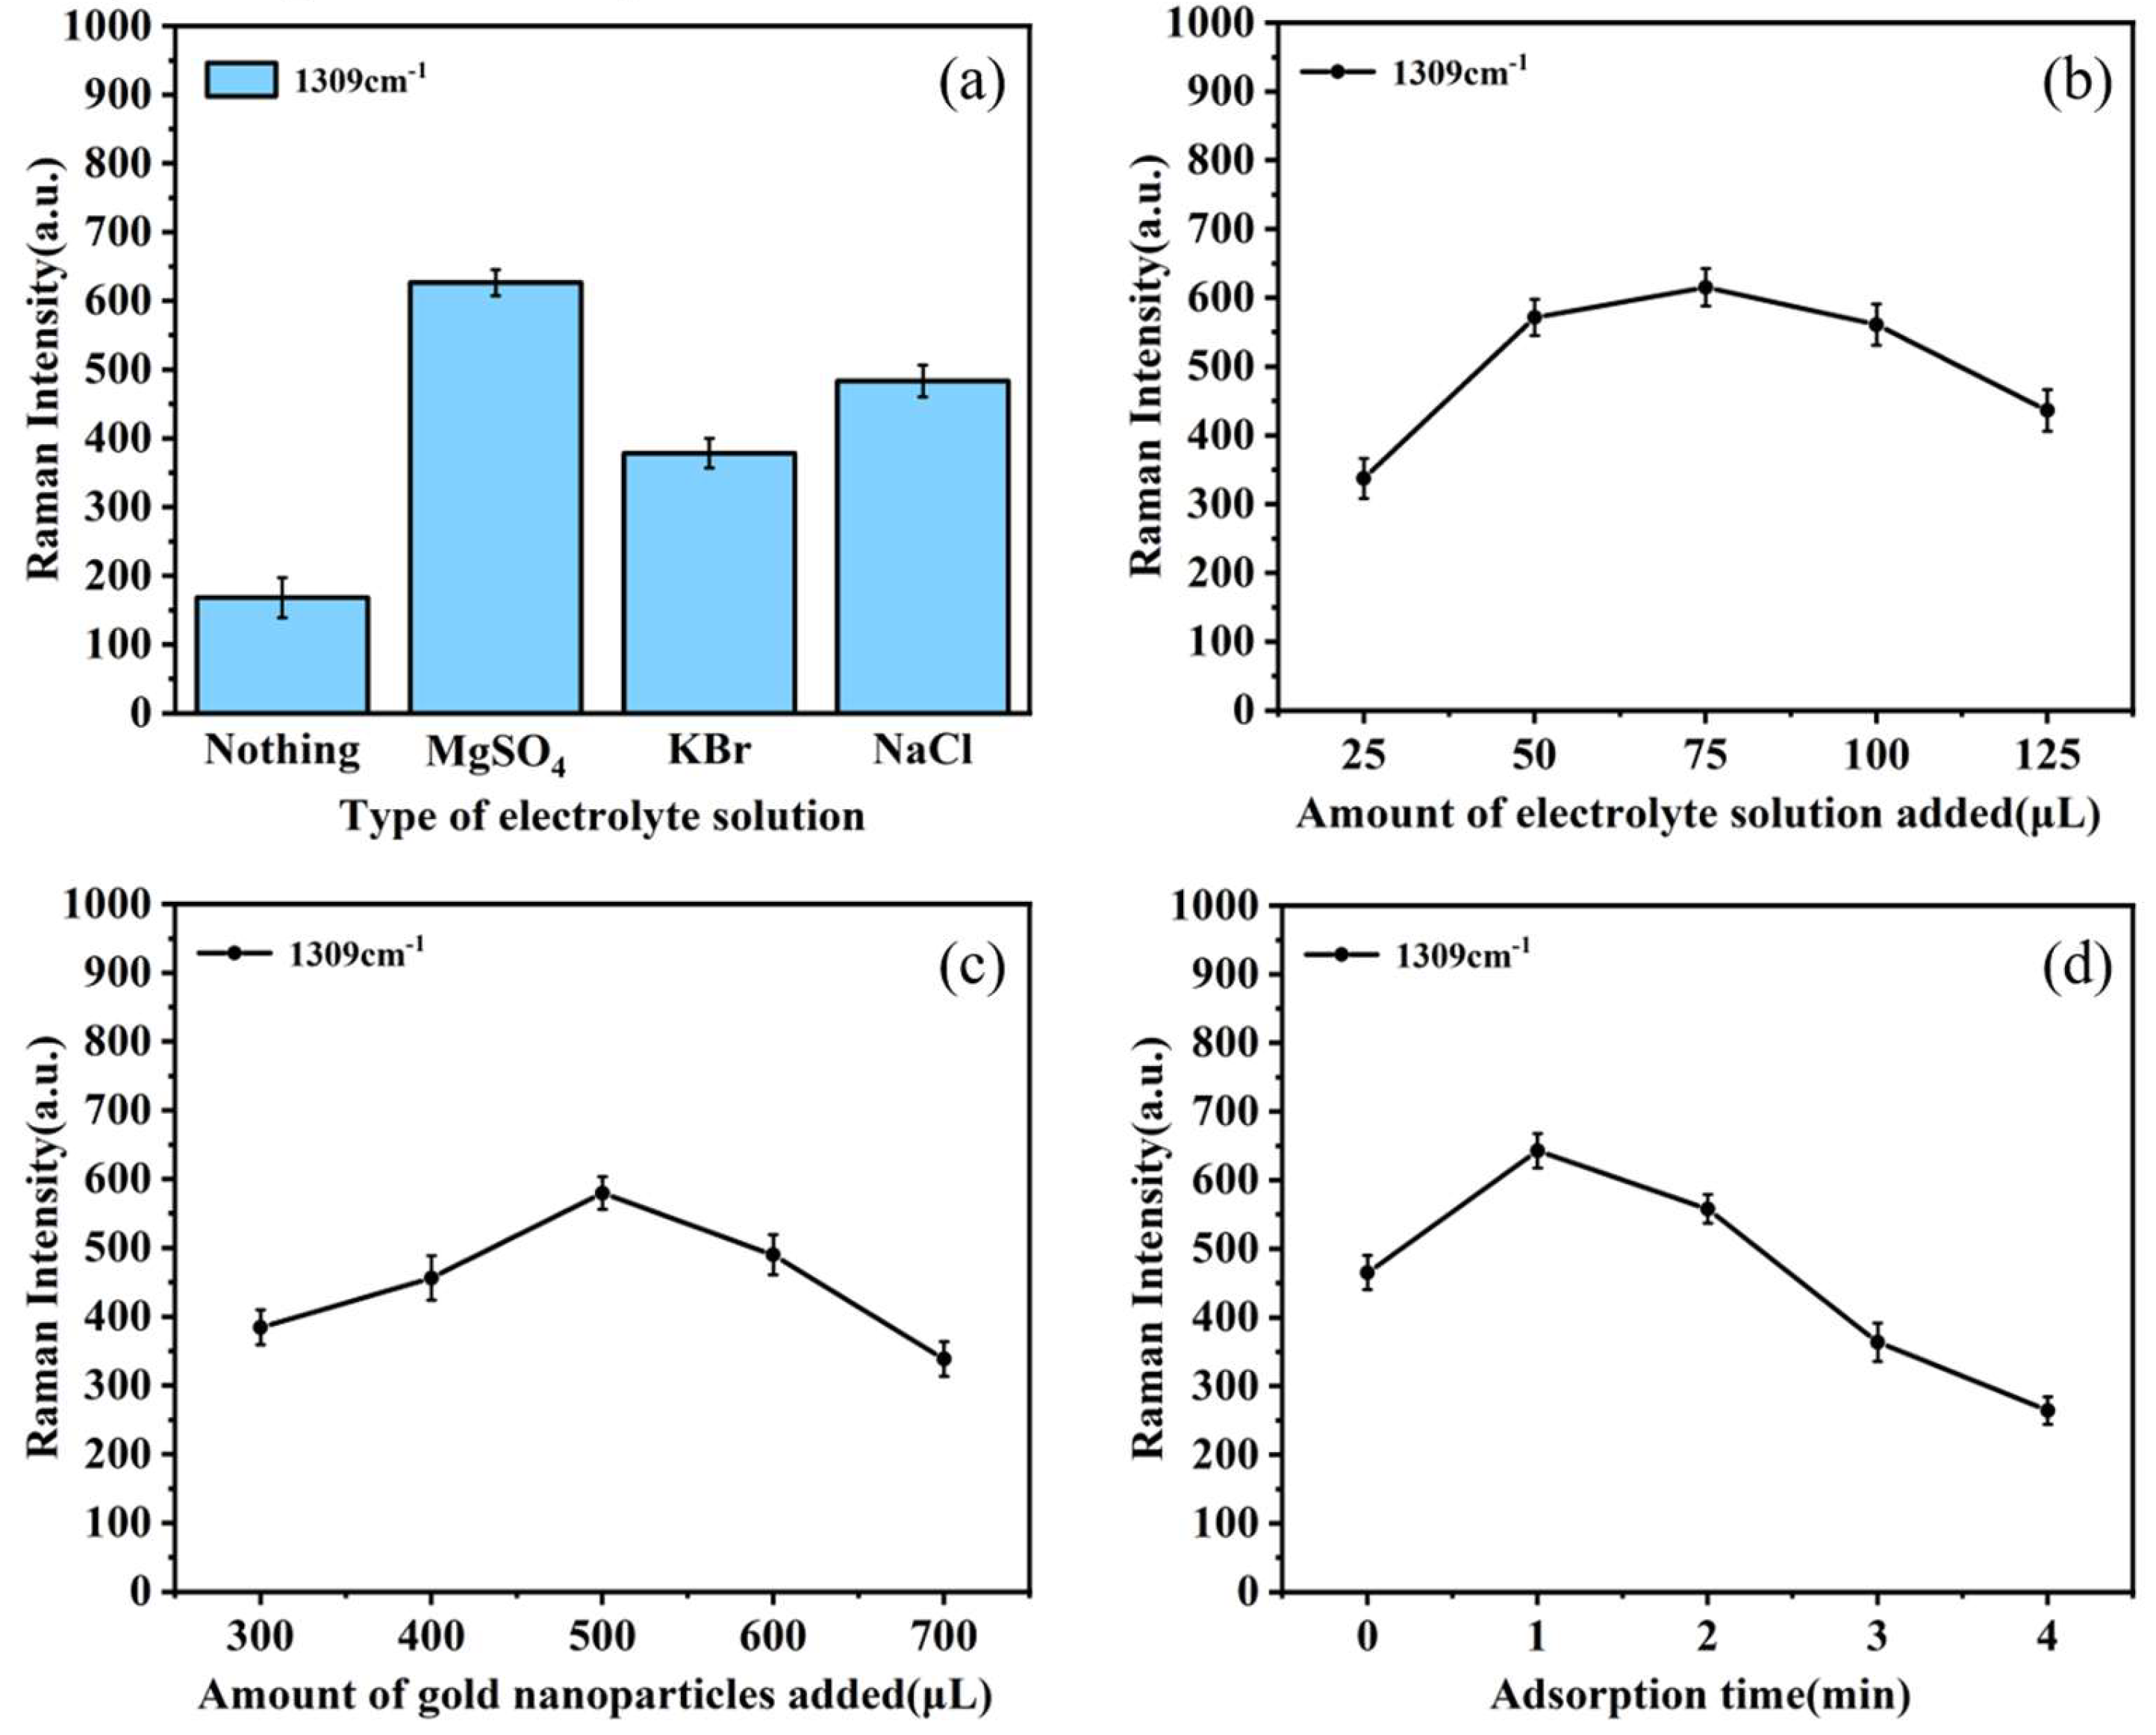
Figure 4.
CARS preference variable process diagram.
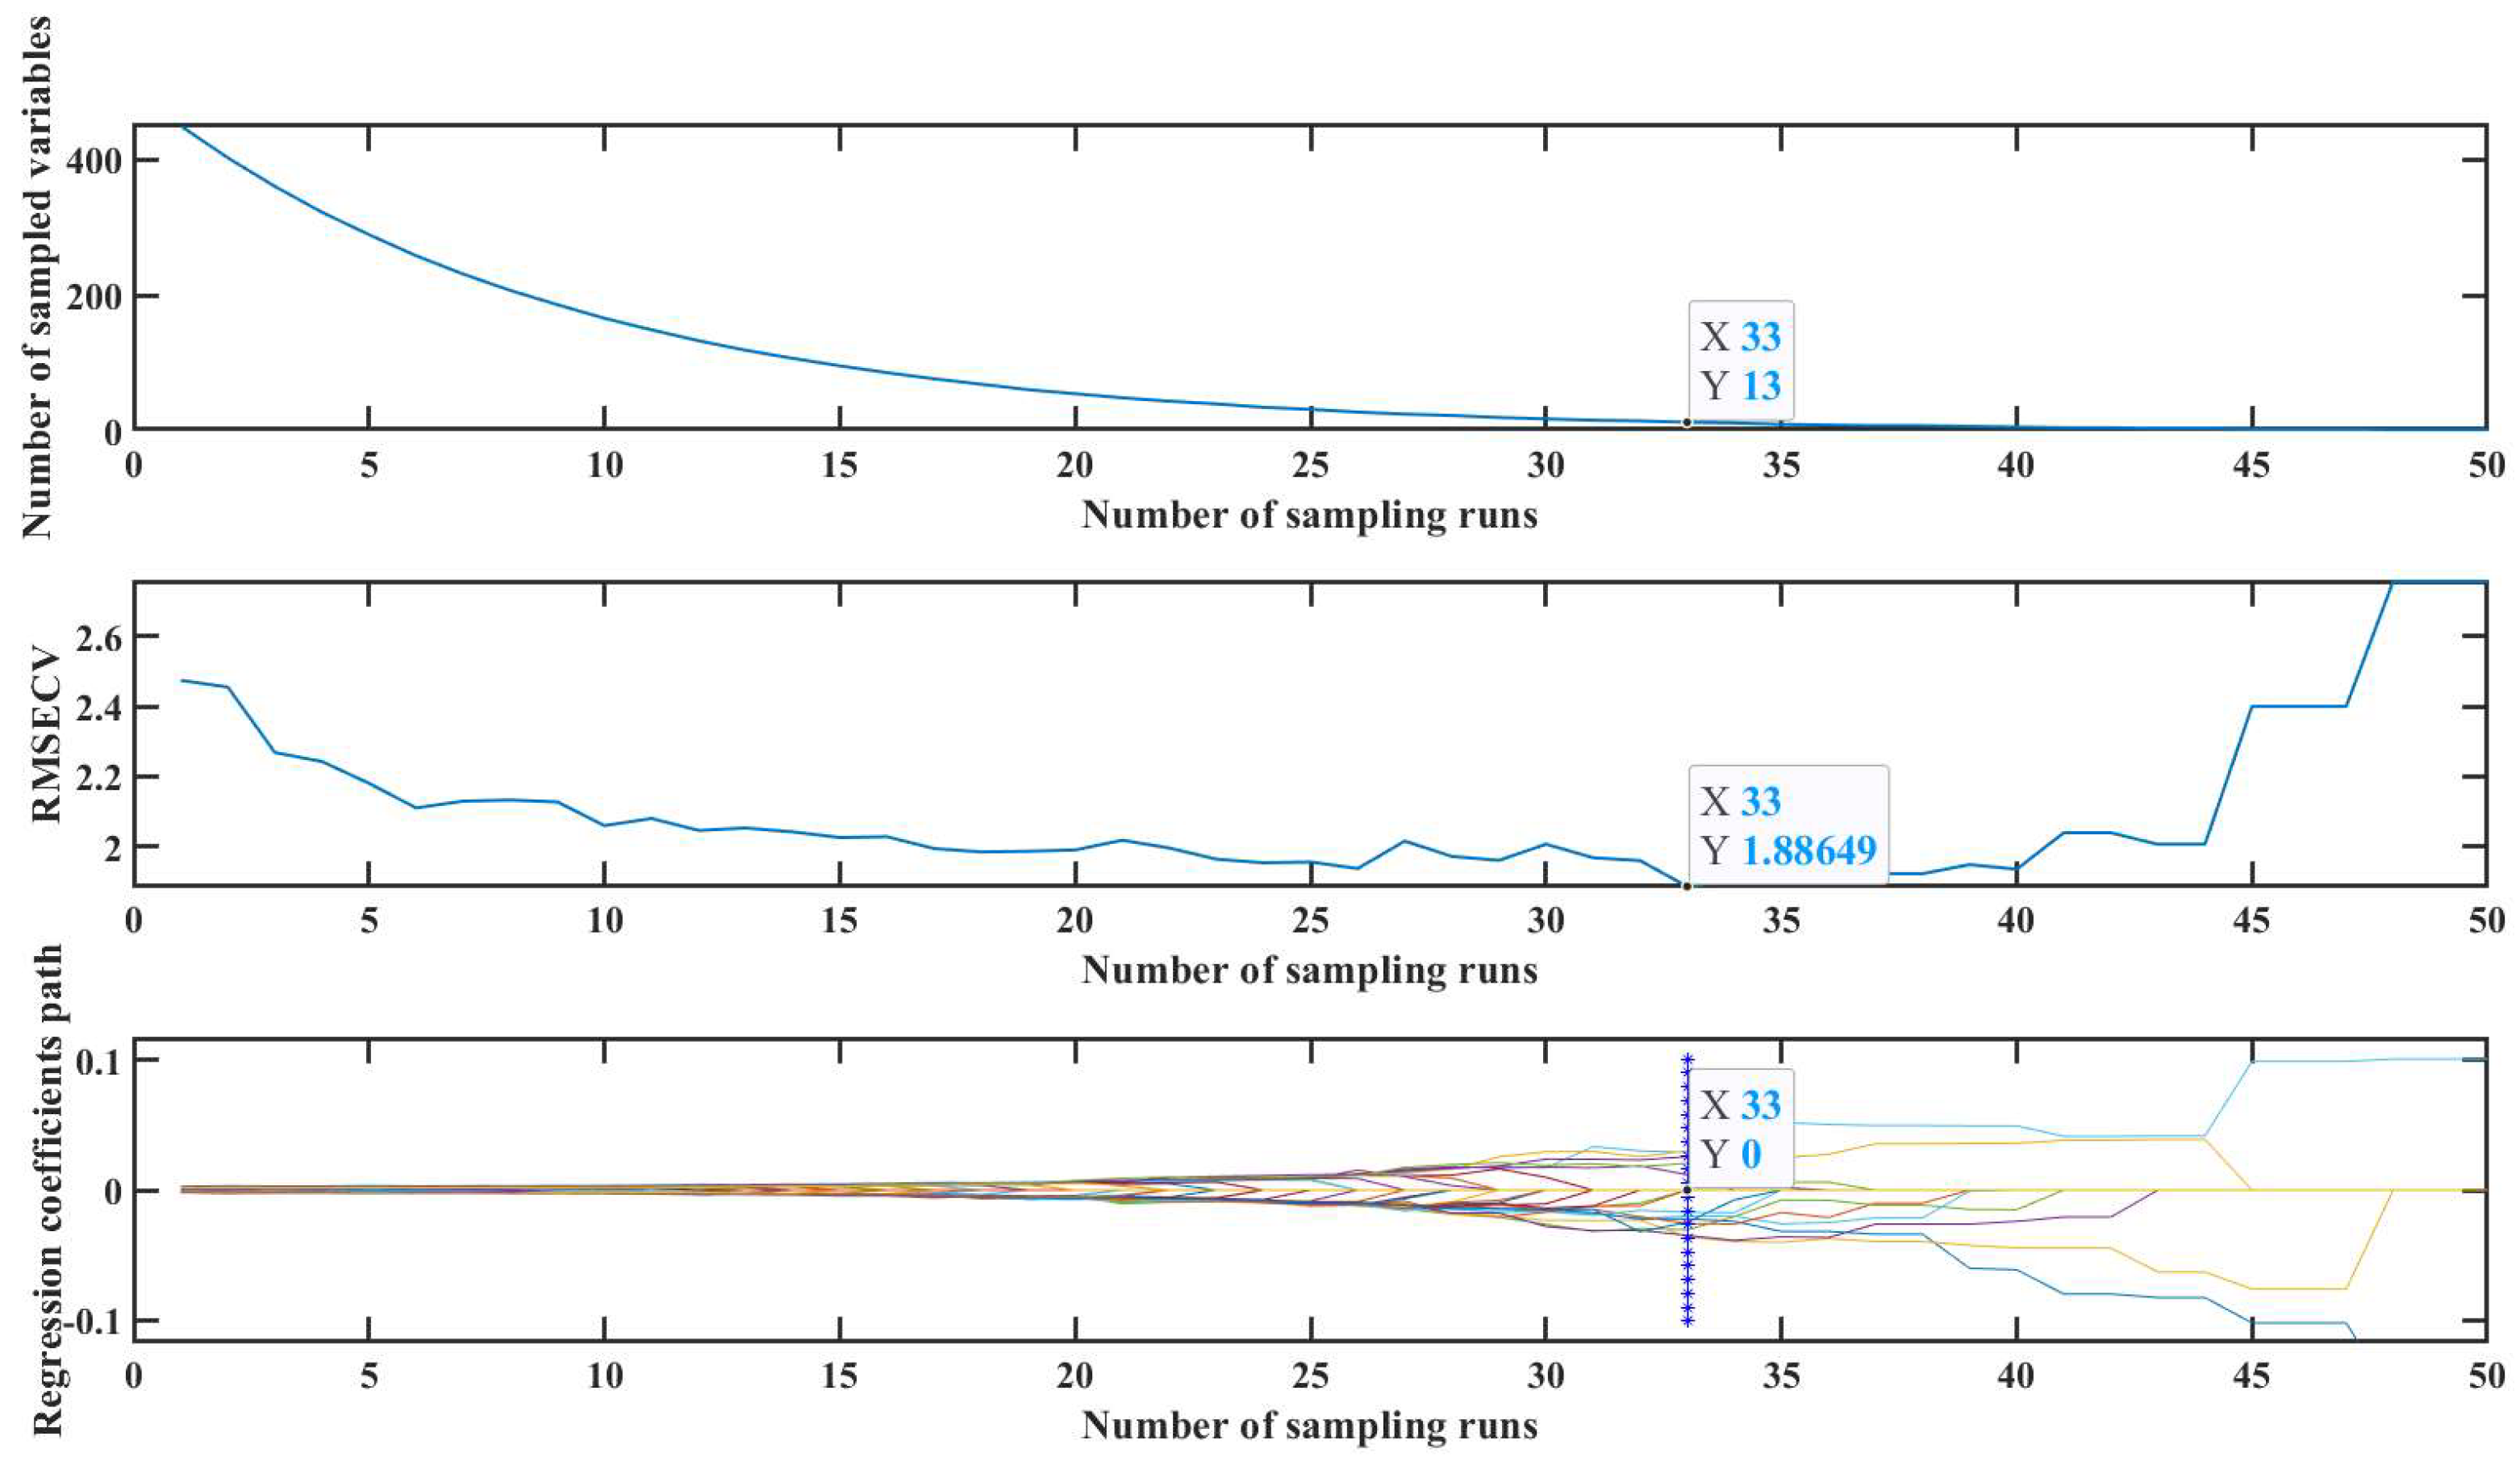
Figure 5.
Relationship between the actual value of ofloxacin residues in egg white and the predicted value of SVR model for calibration set and test set.
Figure 5.
Relationship between the actual value of ofloxacin residues in egg white and the predicted value of SVR model for calibration set and test set.
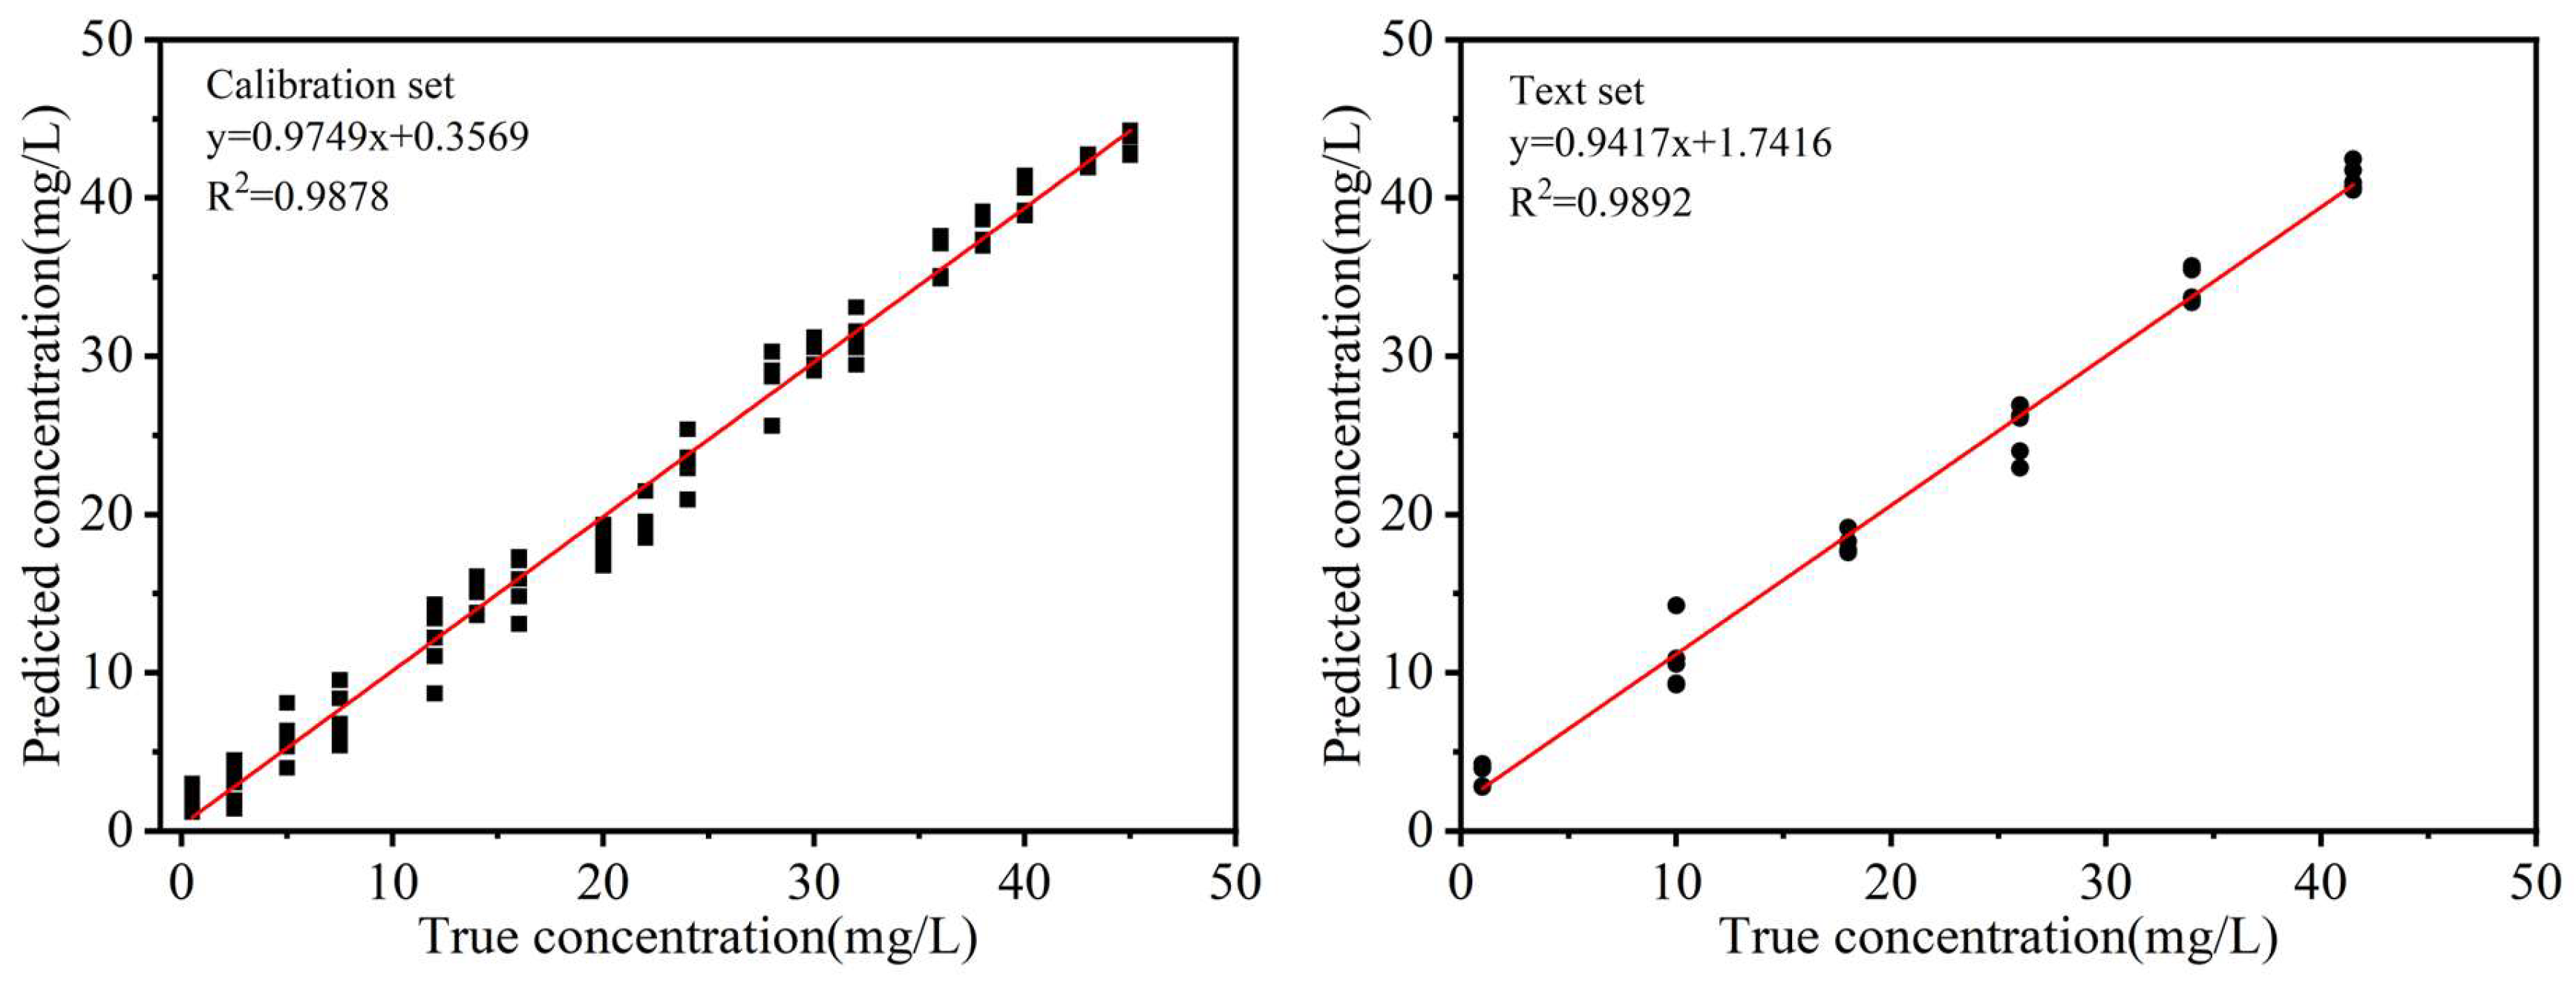

Table 1.
Raman vibrational frequency assignments for ofloxacin.
| Theoretical calculation Raman signals (cm-1) |
SERS experimental Raman signals (cm-1) |
Assigment |
|---|---|---|
| 574 | 560 | Twisting vibration of C-O bonds and Stretching vibrations of C=O bonds |
| 788 | 785 | Twisting vibration of C-O-H bonds |
| 889 | 889 | C=O bonds out-of-plane sway vibration in the quinoline ring |
| 962 | 956 | Shear vibrations of CH3 |
| 1158 | 1154 | Shear vibrations of C-H bonds |
| 1312 | 1309 | C-C-O bonds in-plane rocking vibration and Shear vibrations of C-N-C bonds |
| 1506 | 1514 | Stretching vibration of C-C bonds and out-of-plane sway vibration of C-H bonds |
Table 2.
Results of SVR models with different spectra pretreatment methods.
|
Pretreatment Methods |
PCA Variables |
Total Variables |
RMSEC | RMSEP | ||
| air-PLS air-PLS+SG |
3 3 |
449 | 0.9792 0.9816 |
2.0834 1.9551 |
0.9868 0.9896 |
1.8214 1.6246 |
| air-PLS+ first-order derivatives |
8 | 0.9812 | 2.0146 | 0.9802 | 2.1819 | |
| air-PLS+ second-order derivatives |
23 | 0.9823 | 2.5147 | 0.9682 | 3.3649 | |
| air-PLS+ normalization air-PLS+SNV air-PLS+MSC |
7 7 6 |
0.9430 0.9472 0.9156 |
3.5210 3.2561 4.1815 |
0.9372 0.9162 0.9064 |
3.6908 4.1034 4.2730 |
Table 3.
Support vector regression model results of different feature extraction methods.
| Characteristic extraction |
Number of variables |
RMSEC | RMSEP | ||
|---|---|---|---|---|---|
| SVR | 449 | 0.9748 | 2.2476 | 0.7787 | 8.8763 |
| CARS+SVR | 13 | 0.9812 | 1.9380 | 0.9885 | 1.5392 |
| PCA+SVR | 3 | 0.9816 | 1.9551 | 0.9896 | 1.6246 |
Table 4.
Prediction performance analysis of different models.
| Model | RMSEC | RMSEP | RPD | ||
|---|---|---|---|---|---|
| PLSR | 0.9693 | 2.8402 | 0.9731 | 2.3862 | 5.5127 |
| MLR | 0.9724 | 2.3601 | 0.9780 | 2.1649 | 6.1577 |
| SVR | 0.9816 | 1.9551 | 0.9896 | 1.6246 | 8.1720 |
Disclaimer/Publisher’s Note: The statements, opinions and data contained in all publications are solely those of the individual author(s) and contributor(s) and not of MDPI and/or the editor(s). MDPI and/or the editor(s) disclaim responsibility for any injury to people or property resulting from any ideas, methods, instructions or products referred to in the content. |
© 2025 by the authors. Licensee MDPI, Basel, Switzerland. This article is an open access article distributed under the terms and conditions of the Creative Commons Attribution (CC BY) license (http://creativecommons.org/licenses/by/4.0/).
Copyright: This open access article is published under a Creative Commons CC BY 4.0 license, which permit the free download, distribution, and reuse, provided that the author and preprint are cited in any reuse.


