Submitted:
02 May 2025
Posted:
06 May 2025
You are already at the latest version
Abstract
Pathophysiological differences separating small vessel disease (SVD) from Alzheimer disease (AD) may alter treatment approach. Investigating peak-arterial and late-capillary perfusion may differentiate SVD from AD. 14 Subjects with MoCA scores of 11-24 were divided into 2 groups. Group one: 6 AD likely subjects positive for 1 or 2 copies of APOE 4+. Group two: 8 SVD likely subjects APOE-. Group three: 7 age-matched normals (MoCA 26-30). All underwent 3D PASL MRI, FLAIR and SWI axial MRI. Arterial phase peak amplitude and latency, late capillary inflow/clearance rates and anatomic abnormalities quantitated using microhemorrhage count, Fazekas, Koedam, Schelton scales were compared. Arterial perfusion demonstrated no statistical differences among SVD, AD and controls suggesting normal arterial flow. Late phase perfusion showed significant localized reduction in capillary flow/clearance rates in SVD and AD compared to controls. Absent arterial phase but significant capillary inflow/clearance differences from controls suggests SVD and AD share common impaired blood brain barrier origins.
Keywords:
3D PASL MRI
; Arterial perfusion phase
; Capillary perfusion phase
; Alzheimer disease
; Small vessel disease
; dementia
; Montreal Cognitive Assessment
; Fazekas scale
; Koedam scale
; Schelten scale
Introduction
Dementia is a worldwide problem with a prevalence in 2019 of 55 million with a care cost of $1.31 billion US with estimates that by 2050, 152.8 million individuals will be affected [1,2]. The prevalence is greatest in the middle-income countries with care costs greatest in the highly developed nations [2,3]. The two most common causes are Alzheimer disease (AD) and non-stroke related vascular dementia from small vessel disease (SVD) [1,3]. Given the potential differences in therapeutic approach to both, clear knowledge of the pathologic underpinnings of each disease is essential [4,5,6,7,8,9]. Complicating distinction is the presence of ubiquitous SVD of greater or lesser degree in AD patients in both early and late-stage dementia [8,9,10].
Small vessel disease manifests as white matter hyperintensities (WMH) on fluid attenuated inversion recovery (FLAIR) MRI sequence, with or without a discrete lacunar infarction. WMH clinically not associated with typical stroke-like symptoms are found incidentally on brain MRI frequently in upper age groups [11,12,13,14,15]. Capillary vascular anatomic changes have been well described in the literature in association with neurodegenerative disease [16,17,18,19,20]. These anatomic changes appear to increase with age: 9.5% of people ages 50-59 and 73% of people ages 80-89 were found to have cerebral SVD related markers [16,17,18,19,20]. Vascular reorganization and atresia have been described in the SVD process as well as in patients in AD contributing to the pathologic burden [19]. Their pathologic origin may be of arteriolar occlusive disease origin or distinctly different and unrelated to the lipo-hyalinization causing discrete lacunar infarcts [5,9,13,14,15,21,22,23]. Alternatively, SVD purported origins may develop from blood brain barrier (BBB) leakage or capillary basis, leading to their fibrosis occlusion and remodeling [12,13,22,23,24,25,26,27]. Risk factors for developing either stroke or SVD are similar e.g., hypertension, smoking, alcohol abuse, obesity, and diabetes [28,29,30]. By exploring early phase arterial and late phase capillary perfusion in cognitively impaired subjects, one group WMH+ APOE 4+ (genetically disposed for early AD) versus WMH+ APOE - subjects not predisposed for early AD, may distinguish arterial physiological differences between the two groups [12,31,32,33] [Figure 1]. If so, then the underpinnings of SVD are distinct from the metabolic misfolding in AD. Alternatively, if no difference in the arterial phase or the late phase of perfusion is found between the two groups, but similar abnormalities in capillary phase then a single origin for both should be considered. Ascertaining SVD origin will affect future approaches to early management of AD [30,31,32,33,34].
3D PASL MRI using endogenous spin labeled blood is suited for non-invasive determination of flow by measuring signal present within a defined region of interest at multiple post- labeling delays (PLD’s) [35]. Reliability of ASL MRI in imaging arteriolar perfusion deficits is lower given the delayed transit times related to low signal to noise (S/N) and partial volume, particularly if only a single PLD is acquired [36]. By comparing peak amplitude and latency during the early perfusion phase, the peak arterial inflow isa measured [35,36,37,38,39]. With arteriopathy, reduction in peak amplitude with delayed latency compared to normal would be expected [36,37,38]. If present, SVD would be distinguished from AD where arterioles are spared [31,39]. If on the other hand, the arterioles are spared in SVD, then the early arterial phase of perfusion should not be affected [40,41,42].
By using the same method but choosing late post-labeling delay times (PLD), the capillary inflow/out flow rate can be ascertained [37,38,43,44]. If capillaries are damaged, then the late phase of perfusion should show reduced clearance rate of capillary blood flow when either group is compared to controls [39,40,41,42,43,44]. Potential correlation of arterial flow abnormalities in brain regions demonstrating late perfusion abnormalities would add evidence of arteriopathy in SVD if not seen in AD [36]. To that end, this study addresses the presence or absence of arteriopathy in early dementia presumed AD (APOE 4 +) with probable SVD (APOE 4 -) and comparing both to age matched normal controls.
To further compare the two groups with each other and controls, anatomic abnormalities using FLAIR MRI to quantify WMH with the Fazekas scale, degree of temporal atrophy Schelton scale, and degree of Parietal lobe atrophy by Koedam scale were employed. Number of microhemorrhages present on Susceptibility Weighted Imaging (SWI MRI)were counted and compared.
Methods
This pilot study was approved by CENTRA Health institutional IRB CHIRB0605. All methods were performed in accordance with the relevant guidelines and regulations.
Pilot study size estimate was uncertain as estimates of how strong these effects are unknown as to presence or absence of arterial phase differences among the groups. The number of subjects required demonstrating statistically significant differences in MCI and dementia from normals in the capillary or late phase determination were thus used.
Six APOE 4 positive subjects with mild dementia/MCI (MoCA 11-24) were recruited along with 8 APOE 4 negative subjects with SVD and mild dementia/MCI from the CENTRA Health memory disorders clinic. All subjects were between 55-85 years of age and recruited from August 2023 to June 2024. An additional 7 age matched normal controls (MoCA 26-30) were also studied. Exclusion criteria included symptomatic ischemic stroke (subject 6 in SVD group had a prior cerebellar hemorrhage), heart disease, or other organ failure, systemic vascular disease, claustrophobia, and MRI incompatible implants. Informed consent was obtained from all subjects. No financial remuneration was given.
MRI studies were obtained in the late afternoon in all subjects on a 3T Skyra Siemens MRI machine. They were advised to withhold caffeine for the prior 6 hours (standard MRI protocol) and fast for the prior 2 hours. All subjects had MoCA study within 3 months of the MRI study. All sequences were transferred to DICOM for processing and evaluation. Total scan time was 26 minutes 40 seconds.
The MRI protocol included:
- 3D PASL in the Early (arterial) Phase perfusion TR 1700 TE 16.3, Matrix 64X64x40, Averages 1, Concatenations 1, Segments 9, slice oversampling 50%, Distance factor 50%, FOV phase 100%, Turbo factor 12, EPI 21, Q2TIPS and vendor-supplied proprietary background suppression were used, bandwidth 2298 Hz/Px, echo spacing 0.54ms, flip angle 180o . Five PLD’s 800,1000,1200,1400, and 1600 ms. were employed (figure1).
- 3D PASL in the late (capillary) phase of perfusion), Matrix 64X64X40; Averages 1 concatenations 1; Segments 16; Four averages (pairs); Bolus labeling 700 ms, FOV 256 mm × 256 mm. post-inversion image acquisition time was 350 ms. Bolus labeling duration was 700 ms. Turbo factor was 12, and EPI factor was 21. Q2TIPS and vendor-supplied proprietary background suppression were used. A bandwidth of 2368/pixel and echo spacing of 0.57 ms were employed. Seven PLD’s of 2800, 3000, 3200, 3400, 3600, 3800, 4000ms were employed (Figure 1).
- FLAIR MRI axial TR 9000 ms; TE 84 ms; TI 2500; TI 2500 ms; Pixel volume 0.7 × 0.7 × 4 mm3. Slice 4 mm interleaved, Fat Sat strong Interleaved 40–4 mm image slices were obtained per sequence and voxel size was 2 × 2 × 5.5 mm3. Additional factors include distance factor 50%, Base resolution 64, Phase resolution 98%, and FoV phase 100%.
- SWI MRI axial sequence. TR 29 TE 20 FOV 256, pixel 3D, slab slices /slab 24, Distance factor 20%, FOV phase 81.3%, base resolution 320, slice thickness 1.3 mm, Slice resolution 78%, slice oversampling 14.3%, bandwidth 120 Hz/Px, segments 1.
The resulting 3D PASL images were reformatted into contiguous 4mm axial slices using standard slice angles. They along with the Flair and SWI MRI images were transferred to DICOM for analysis.
All axial PASL images were evaluated at bilateral homologous temporal, frontal and parietal anatomic levels for all subjects. Hand drawn standardized ROI’s of standard volumes for each brain region for both early and late perfusion analysis avoiding subarachnoid and ventricular CSF spaces were obtained and transferred and catalogued by brain region to PowerPoint. Temporal ROI volumes analyzed were 650 mm3 , frontal lobe volumes 1150 mm3 and parietal volumes 760 mm3 [Figure 2]. Resulting signal averages for each PLD and location were then graphed on an Excel Spreadsheet. Best fit linear analysis was applied to the 7 PLD’s (per anatomic location) in late perfusion (capillary) phase [39]. The slope of the line is the capillary inflow/clearance rate of signal per time [39]. The 5 PLD’s in arterial (early) perfusion phase were graphed using non-linear analysis and the maximum peak amplitude and its latency were recorded for all six anatomic locations [44].
Late phase capillary clearance rates and early phase arterial peak amplitude and latencies were compared among all three groups (Table 1). Additionally, the arterial phase results corresponding to brain regions showing reduced capillary (late-phase) clearance rates (defined as having slopes greater than -0.02) were compared to arterial phase results in unaffected brain regions [39,45,46,47].
White matter hyperintensities identified on the FLAIR MRI sequence for all subject groups were clinically graded using the Fazekas scale (Table 1). Presence of angular gyrus parietal atrophy was graded using Koedam scale and temporal lobe atrophy was graded using Schelten scale [48]. Direct count of microhemorrhages on SWI was also performed (Table 2). All MoCA and MIS results were compared between the AD and SVD groups using an independent t-test.
Results
Summary of Data
The 22 variables (Table 1) are reported using mean and minimum/maximum, as initial inspection using visualizations and Shapiro-Wilk tests showed that these variables are frequently skewed/not normally distributed within one or more of these groups.
Data analysis was performed using IBM SPSS Statistics v. 30. Statistical significance was set at α = 0.05.
Arterial Phase Comparisons
Box and whisker plots comparing peak latency and peak amplitude values across the three groups are illustrated in Figure 3 and Figure 4. The results of Kruskal-Wallis tests showed there were no statistically significant differences in arterial phase peak latency or amplitude values for any region across the three groups. (See Data tables 1a and 2a in Appendix A.)
Glymphatic Slope Comparisons
Late perfusion phase glymphatic slopes within the six brain regions greater than -0.02 are considered to indicate abnormal clearance found only in SVD and AD subjects. All clearance rates in the control group for all brain regions was less than 0.02 See Figure 5.
Box and whisker plots comparing glymphatic slope values across the three groups are illustrated in Figure 5. (See Data Table 3a in Appendix A.)
Kruskal-Wallis tests indicate statistically significant differences between the groups in all regions except for the right parietal and left front. Post-hoc comparisons are varied, but all significant differences show that SVD or AD slopes are greater than the normative group. There are no regions where the SVD and AD groups are significantly different from one another.
Peak amplitude and peak latency from the arterial phase of perfusion for brain regions with abnormal late glymphatic phase flow are compared across the three groups. The results of Kruskal-Wallis tests showed there were also no statistically significant differences in arterial phase peak latency or amplitude values for any region across the three groups for this reduced data.
Summary whisker graphs based on this selection of abnormal regions of glymphatic flow are illustrated in Figure 6 and 7. Sample sizes are provided separately for each region in (see Table 4a and Table 5a Appendix A).
Montreal Cognitive Assessment (MOCA) and Memory Index Score (MIS)
MoCA and its subtest, MIS, scores were approximately normally distributed within each group with the mean and SD (Table 2).
These scores were compared between the AD and SVD groups using a Welch’s t-test, which allows for different variances in the two groups. The result for MOCA scores was t(11.7) = -1.76, p = 0.105; the result for MIS scores was t(10.8) = -3.49, p = 0.005. There is no evidence that the MOCA scores of the two groups are different; the MIS scores in the SVD group are statistically significantly higher than those in the AD group.
MRI Image Score Comparisons
The results of Kruskal-Wallis tests comparing scale scores (Fazekas, Koedam, and Schelten) and count of microhemorrhages across the three groups are provided in Table 3. There were no statistically significant differences in the Koedam and microhemorrhages across the groups; however, the Fazekas scale score was significantly higher in the SVD group than the normative group (p = 0.012), and the Scheltens scale score was significantly higher in the AD group than the normative group (p = 0.006). No significant differences were found between the AD and SVD groups in either the Fazekas scale or Scheltens scale.
Discussion
The results did not support the hypothesis that arterial perfusion differences are present between the APOE 4 _ (SVD) and the APOE 4 + (AD) group. Further, neither group differed in the arterial phase of perfusion compared to controls. Although compelling, absence of differences may be related to sample size, and genetic diagnostic assumptions separating the two groups. There is precedent literature supporting absence of arterial perfusion abnormality in SVD with evidence of capillopathy [49]. There was a trend in comparing the memory index scores (MIS) of short-term memory loss in the AD group compared with the SVD group. The latter suggests accentuated temporal lobe involvement in the AD group as might be suggested with earlier β amyloid accumulation and its toxic effect on these highly metabolically active structures [50].
Limitations: A larger study in the early dementia stage will further clarify any distinction between SVD and AD. Amyloid PET scan could provide additional evidence for AD. That said, one subject in the SVD group had a negative PET obtained via a second opinion at another medical institution 8 months after their study MRI. Absence or presence of β Amyloid plaque in the early disease (MCI) stage does not rule out /in the diagnosis of AD [51,52,53].
On the other hand, both groups (SVD and AD) demonstrated focal regions of statistically significant reduced capillary inflow/outflow (late perfusion phase) compared to controls. This speaks to delayed capillary perfusion time and retained labeled fluid within the ROI both consequences of BBB dysfunction affecting both groups. Additionally, no statistically significant differences anatomically were found between the SVD and AD groups. Both showed statistically significant anatomic differences from normal controls. Thus, from a physiologic and anatomic perspective there is no distinguishing differences between the two groups. The co-occurrence of both pathologies, specifically capillary perfusion dysfunction and accumulating misfolded proteins may share the same root origin but develop via different mechanisms.
The cerebral capillary system is more complex and extensive than any other within the body comprising 80% of the cerebral vasculature [54]. The endothelial cells in particular are tasked with selective active and passive transport of essential small and large molecules via specific small molecule transporters and selective protein transport by both carrier mediated transport and receptor mediated transcytosis [55]. They are integral in establishing the glymphatic channels for transport out of waste [56]. In addition, they provide the expression of tight junction proteins between cells thus establishing the BBB [57]. Employing endothelial transport mechanisms and barrier maintenance is via astroglia indirectly through pericyte signaling, the components dubbed the neurovascular unit (NVU) [58]. The BBB is under constant assault via the inflammatory influences produced by the multiple risk factors mentioned above, which increase with age [59]. The well-known result is a slow leak of the BBB with potential destructive consequences for both capillary integrity and altered metabolic synthetic and degradation pathways [60].
Presence of SVD has varied effects on cognition depending on its extent, location and progression over time [56]. The high-risk factors linked to SVD are the usual suspects: hypertension, diabetes, smoking, obesity, multiple head traumas, senescent cells, alcohol abuse, chronic infection and newer elucidated risk factors of anxiety, depression, and sleep apnea. All of these factors are also associated with high risk of late life AD [61,62,63].
The effects of enhanced inflammatory signaling via circulating cytokines has been shown to upregulate microglial complement secretion with resulting phenotypic alteration in microglia converting them to proinflammatory cells [64]. Via microglial C3a upregulating endothelial cell C3r converting them to immune attractant cells with retraction of tight junctional proteins causing resultant BBB leak and dysregulated endothelial transport [65]. Polarization of aquaporin 4 channels in astrocyte end feet also occurs thus shutting down the glymphatic pathway [66]. The result is further intrusion of restricted proteins such as fibrinogen with secondary expression of glial inflammatory pathways affecting both capillary integrity and thus flow, as well as altering β amyloid cleavage pathways and later in the process of hyperphosphorylation Tau proteins [67]. These downstream events slowly unfold, albeit by different pathways, leading to capillary injury/loss and accumulation of toxic misfolded proteins [68,69]. Hereditary factors accelerate the early accumulation of misfolded proteins, which in turn accelerates secondary collateral BBB damage in a vicious cycle leading to cognitive decline [70].
In a previous study of mild head injury in young athletes showing acute reduced capillary/glymphatic flow followed by recovery of normal flow correlating with clinical improvement, two questions arose. By what mechanism is the BBB restored? Why does that natural recovery pathway diminish with age [46,71]? The gradual BBB leak with age is well recognized [45,72,73,74]. Before the questions can be answered, the natural mechanism of repair must be ascertained. Previous studies have shown statistically significant capillary/glymphatic flow differences in patients with diagnosed AD from normal controls [39,45,75,76]. Additionally, temporal progression of cerebral capillopathy as demonstrated by progressive decline in late phase perfusion in focal brain regions has been shown in subjects with MCI [39].
It is clear from all the various treatment trials that effective management to halt the neurodegenerative disease process must be provided in the early or preclinical phase of disease. Removing the misfolded protein byproduct of the disrupted metabolic processes has limited benefit. Perhaps it could be likened to ‘removing dead fish from a polluted pond and expecting the pollution to clear when the source thereof is upstream’ [39]. If the two processes share the early common capillary pathology with detrimental leak of normally restricted substances, then future novel therapeutic efforts to restore BBB integrity in the preclinical stage may prevent dementia [77]. Until the nexus leading to both the capillopathy and toxic proteinopathy is addressed, namely the persistent BBB leak, the disease process will likely progress. The cooccurrence of both processes compellingly suggests a common initiating disease process as well. The slow age-related leak of the blood brain barrier induced by presence of various inflammatory triggers appears most likely, with the cascade of destructive pathways disrupting the capillary conduits and the NVU cellular elements [Figure 8].
Approaching this disease from its apparent nexus point, BBB leak, may bear substantial fruit therapeutically. The question that remains is how do we identify individuals in the preclinical phase of disease, and then given the current state of the art, reduce late-life risk of dementia? Who and how do we screen patients? What is the most cost-effective and least invasive means of doing so? The latter questions have yet to be answered. The target cohort are those with significant associated validated risk factors for late life dementia. Patients with hypertension, diabetes, cigarette abuse, obesity, multiple head injuries, chronic infections/inflammation, hyperlipidemia, chronic anxiety/depression, chronic alcohol abuse, or family history of dementia are the most reasonable targets for screening [78,79]. Treatment in those identified with preclinical disease by virtue of validated screening measures require intensified therapy of modifiable risk factors with follow-up physiologic testing [80]. The targeting of hypertension, reduced cigarette abuse, and careful diabetic management has in fact reduced incidence of dementia in developed countries, however the potential degree the obesity epidemic has on truncating that trend is yet to be determined [81]. When novel therapeutic means are available to upregulate the natural BBB repair mechanisms that either become faulty or overwhelmed by age related risk factors, the neurodegenerative disease process may be averted. The role of extracting accumulating misfolded proteins (dead fish) may certainly remain part of the management plan as well.
Conclusion
Our study supports the presence of cerebral capillopathy in both subjects with early dementia APOE 4 – (SVD) and APOE 4 + (AD probable). The two groups were not separable from each other or from controls on the basis of ASL MRI arterial flow abnormalities. Both shared similar late capillary/glymphatic phase dysfunction. Given their near universal combined appearance in neurodegenerative disease, a common origin related to BBB dysfunction/leak initiating both downstream pathologies is implied. Further research into the pathophysiology of BBB dysfunction, and in particular repair pathways diminished with age, may provide the needed silver bullet for effective early treatment.
Author Contributions
All authors contributed to the project execution and authorship of this manuscript.
Funding
Liberty University College of Osteopathic Medicine # MR2402- MR2402-B3C98-711099-20.
Institutional Review Board Statement
The study was conducted according to the guidelines of the Declaration of Helsinki, and approved by the Institutional Review Board by CENTRA Health, INC Institutional Review Board Lynchburg, Virginia USA IRB approval #CHIRB0605. Approved June 30, 2023
Data Availability
All data from this study is presented in Table 2 and Appendix B. MRI images are available by request from the corresponding author.
Acknowledgements
We would like to thank Irene George OMS 3, and Karen Kang OMS 2 for their contributions; as well as the MRI: Department of Radiology, Centra Lynchburg General Hospital,
and Stan Gray, RPT, and Havana French, RPT.
Competing Interests
The authors declare no competing interests.
Appendix A

Table 1a.
Data Summary for Peripheral Arterial Compliance Variables by Group.
| AD (n = 6) | SVD (n = 8) | N (n = 7) | |||||||
| Variable | Median | Min | Max | Median | Min | Max | Median | Min | Max |
| Arterial Phase | |||||||||
| L TEMP PL | 1400 | 1000 | 1600 | 1250 | 1000 | 1600 | 1200 | 1000 | 1600 |
| L TMP PA | 54 | 25 | 160 | 75 | 35 | 140 | 58 | 18 | 240 |
| R TEMP PL | 1500 | 1200 | 1600 | 1300 | 1000 | 1600 | 1200 | 1000 | 1600 |
| R TEMP PA | 93 | 30 | 150 | 55 | 14 | 120 | 70 | 28 | 140 |
| L FRONT PL | 1300 | 1200 | 1600 | 1400 | 1200 | 1600 | 1200 | 1000 | 1400 |
| L FRONT PA | 18 | 9 | 80 | 38 | 12 | 130 | 17 | 5 | 70 |
| R FRONT PL | 1500 | 1200 | 1600 | 1400 | 1000 | 1600 | 1400 | 800 | 1600 |
| R FRONT PA | 29 | 5 | 45 | 19 | 12 | 55 | 30 | 12 | 125 |
| L PAR PL | 1500 | 1200 | 1600 | 1600 | 1200 | 1600 | 1400 | 800 | 1600 |
| L PAR PA | 27 | 7 | 50 | 39 | 20 | 85 | 25 | 12 | 40 |
| R PAR PL | 1500 | 1200 | 1600 | 1600 | 1000 | 1600 | 1400 | 1200 | 1600 |
| R PAR PA | 33 | 6 | 120 | 23 | 9 | 45 | 28 | 12 | 55 |
| Glymphatic Phase | |||||||||
| L TEMP SLOPE | -0.0128 | -0.0283 | 0.0234 | -0.0149 | -0.0490 | 0.0714 | -0.0500 | -0.1053 | -0.0356 |
| R TEMP SLOPE | -0.0281 | -0.0480 | 0.0149 | 0.0062 | -0.0457 | 0.0704 | -0.0659 | -0.1238 | -0.0258 |
| L FRONT SLOPE | -0.0044 | -0.0957 | 0.0210 | -0.0222 | -0.1500 | 0.0281 | -0.0922 | -0.1191 | -0.0285 |
| R FRONT SLOPE | -0.0196 | -0.0649 | 0.0834 | -0.0269 | -0.1165 | 0.0126 | -0.0897 | -0.1472 | -0.0509 |
| L PAR SLOPE | -0.0161 | -0.0984 | 0.0701 | -0.0323 | -0.1023 | 0.0434 | -0.0920 | -0.1864 | -0.0477 |
| R PAR SLOPE | -0.0214 | -0.1186 | 0.0299 | -0.0374 | -0.1402 | 0.0704 | -0.0957 | -0.1977 | -0.0432 |
| MRI SCORES | |||||||||
| Fazekas Scale Score | 2 | 1 | 3 | 2 | 2 | 3 | 1 | 0 | 2 |
| Koedam Score | 1 | 0 | 2 | 1 | 0 | 2 | 0 | 0 | 1 |
| Scheltens’ Score | 2 | 1 | 4 | 2 | 1 | 3 | 1 | 0 | 1 |
| # Microhemorrhages | 0 | 0 | 3 | 2 | 0 | 4 | 0 | 0 | 2 |
Table 2a.
Data Summary for Early Phase Arterial Compliance Variables by Group, Abnormal Regions Only.
Table 2a.
Data Summary for Early Phase Arterial Compliance Variables by Group, Abnormal Regions Only.
| AD | SVD | |||||||
| Variable | n | Median | Min | Max | n | Median | Min | Max |
| L TEMP PL | 3 | 1200 | 1000 | 1400 | 5 | 1300 | 1000 | 1600 |
| L TMP PA | 3 | 70 | 38 | 160 | 5 | 70 | 35 | 140 |
| R TEMP PL | 2 | 1600 | 1600 | 1600 | 6 | 1300 | 1000 | 1600 |
| R TEMP PA | 2 | 47.5 | 30 | 65 | 6 | 40 | 14 | 105 |
| L FRONT PL | 4 | 1300 | 1200 | 1600 | 4 | 1400 | 1400 | 1600 |
| L FRONT PA | 4 | 23.5 | 9 | 80 | 4 | 47.5 | 35 | 130 |
| R FRONT PL | 4 | 1300 | 1200 | 1600 | 4 | 1300 | 1000 | 1600 |
| R FRONT PA | 4 | 25.5 | 5 | 45 | 4 | 29 | 20 | 55 |
| L PAR PL | 3 | 1400 | 1200 | 1600 | 3 | 1600 | 1600 | 1600 |
| L PAR PA | 3 | 40 | 18 | 50 | 3 | 45 | 25 | 85 |
| RPAR PL | 3 | 1600 | 1400 | 1600 | 4 | 1600 | 1600 | 1600 |
| RPAR PA | 3 | 38 | 28 | 50 | 4 | 21.5 | 9 | 35 |
Table 3a.
Results of Kruskal-Wallis Tests Comparing Glymphatic Slopes.
| Variable | χ2 | df | p | Post-hoc results |
|---|---|---|---|---|
| L TEMP SLOPE | 10.98 | 2 | 0.004 | SVD > N (p = 0.019); AD > N (p = 0.009) |
| R TEMP SLOPE | 11.46 | 2 | 0.003 | SVD > N (p = 0.002) |
| L FRONT SLOPE | 4.91 | 2 | 0.086 | n/a |
| R FRONT SLOPE | 9.44 | 2 | 0.009 | AD > N (p = 0.012) |
| L PAR SLOPE | 7.09 | 2 | 0.029 | AD > N (p = 0.041) |
| R PAR SLOPE | 4.49 | 2 | 0.106 | n/a |
Table 4a.
Results of Kruskal-Wallis Tests Comparing Arterial Phase Peak Latency and Amplitude.
| Variable | χ2 | df | p |
|---|---|---|---|
| L TEMP PL | 0.30 | 2 | 0.860 |
| L TEMP PA | 1.91 | 2 | 0.385 |
| R TEMP PL | 2.16 | 2 | 0.340 |
| R TEMP PA | 0.61 | 2 | 0.736 |
| L FRONT PL | 3.50 | 2 | 0.174 |
| L FRONT PA | 3.05 | 2 | 0.218 |
| R FRONT PL | 1.53 | 2 | 0.466 |
| R FRONT PA | 0.47 | 2 | 0.793 |
| L PAR PL | 2.44 | 2 | 0.296 |
| L PAR PA | 3.85 | 2 | 0.146 |
| R PAR PL | 1.02 | 2 | 0.601 |
| R PAR PA | 0.53 | 2 | 0.769 |
Table 5a.
Results of Kruskal-Wallis Tests Comparing Arterial Phase Peak Latency and Amplitude, Abnormal Regions Only for AD and SVD Groups.
Table 5a.
Results of Kruskal-Wallis Tests Comparing Arterial Phase Peak Latency and Amplitude, Abnormal Regions Only for AD and SVD Groups.
| Variable | χ2 | df | p |
|---|---|---|---|
| L TEMP PL | 0.71 | 2 | 0.701 |
| L TEMP PA | 0.86 | 2 | 0.649 |
| R TEMP PL | 2.62 | 2 | 0.269 |
| R TEMP PA | 0.94 | 2 | 0.626 |
| L FRONT PL | 4.96 | 2 | 0.084 |
| L FRONT PA | 3.19 | 2 | 0.203 |
| R FRONT PL | 0.19 | 2 | 0.910 |
| R FRONT PA | 0.51 | 2 | 0.776 |
| L PAR PL | 4.79 | 2 | 0.091 |
| L PAR PA | 3.45 | 2 | 0.178 |
| R PAR PL | 5.05 | 2 | 0.080 |
| R PAR PA | 2.48 | 2 | 0.290 |
References
- Wimo, Anders, et al. “The worldwide costs of dementia in 2019.” Alzheimer’s & Dementia 19, no. 7 (2023): 2865-2873. [CrossRef]
- Nichols, Emma, et al. “Estimation of the global prevalence of dementia in 2019 and forecasted prevalence in 2050: an analysis for the Global Burden of Disease Study 2019.” The Lancet Public Health 7, no. 2 (2022): e105-e125.
- Mukadam, Naaheed, et al. “Changes in prevalence and incidence of dementia and risk factors for dementia: an analysis from cohort studies.” The Lancet Public Health 9, no. 7 (2024): e443-e460. [CrossRef]
- Ter Telgte, et al. “Cerebral small vessel disease: from a focal to a global perspective.” Nature Reviews Neurology 14, no. 7 (2018): 387-398.
- Ferrer, Isidro, and Noemi Vidal. “Neuropathology of cerebrovascular diseases.” Handbook of clinical neurology 145 (2018): 79-114.
- Wardlaw, J. M. “Blood-brain barrier and cerebral small vessel disease.” Journal of the neurological sciences 299, no. 1-2 (2010): 66-71.
- Shi, Yulu, and Joanna M. Wardlaw. “Update on cerebral small vessel disease: a dynamic whole-brain disease.” Stroke and vascular neurology 1, no. 3 (2016). [CrossRef]
- Wardlaw, Joanna M., Colin Smith, and Martin Dichgans. “Small vessel disease: mechanisms and clinical implications.” The Lancet Neurology 18, no. 7 (2019): 684-696.
- Kim, Si Eunet al. “Interaction between Alzheimer’s disease and cerebral small vessel disease: a review focused on neuroimaging markers.” International journal of molecular sciences 23, no. 18 (2022): 10490. [CrossRef]
- Voorter, Paulien HM, et al. “Heterogeneity and Penumbra of White Matter Hyperintensities in Small Vessel Diseases Determined by Quantitative MRI.” Stroke (2024).
- Zhou, Jianguo, Jiangtao He, and Wei Wang. “Application of 3D-ASL in hemodynamic analysis and prognosis evaluation of vascular cognitive impairment.” American Journal of Translational Research 14, no. 11 (2022): 7960.
- Wardlaw, Joanna M., et al. “Blood–brain barrier permeability and long-term clinical and imaging outcomes in cerebral small vessel disease.” Stroke 44, no. 2 (2013): 525-527. [CrossRef]
- Wei, Ke., et al. “White matter hypointensities and hyperintensities have equivalent correlations with age and CSF β-amyloid in the nondemented elderly.” Brain and behavior 9, no. 12 (2019): e01457.
- Habes, Mohamad, et al. “White matter hyperintensities and imaging patterns of brain ageing in the general population.” Brain 139, no. 4 (2016): 1164-1179. [CrossRef]
- Nielsen, Rune B., Lærke Egefjord, et al. “Capillary Dysfunction Is Associated with Symptom Severity and Neurodegeneration in Alzheimer’s Disease.” Alzheimer’s & Dementia 13, no. 10 (October 1, 2017): 1143–53. [CrossRef]
- Graff-Radford, Jonathan, et al. “Prevalence and Heterogeneity of Cerebrovascular Disease Imaging Lesions.” Mayo Clinic Proceedings (2020) 95 (6): 1195–1205. [CrossRef]
- Elmståhl, Sölve, et al. “Incidence of Cerebral Small Vessel Disease-Related MR Markers in the Swedish General Population ’Good Aging in Skåne’(GÅS) Study.” Journal of Neurology (2024) 271 (9): 5997–6003. [CrossRef]
- Fisher, Robert A., J. Scott Miners, and Seth Love. “Pathological Changes within the Cerebral Vasculature in Alzheimer’s Disease: New Perspectives.” Brain Pathology (Zurich, Switzerland) (2022) 32 (6): e13061. [CrossRef]
- Fang, Chuo, et al. “Arteriolar neuropathology in cerebral microvascular disease.” Neuropathology and Applied Neurobiology 49, no. 1 (2023): e12875.
- Kim, Young Seo, et al. “Pontine hemorrhage at a microbleed site in a patient with central pontine myelinolysis.” Neurological Sciences 32 (2011): 1251-1252.
- Lin, Jing, Dilong Wang, Linfang Lan, and Yuhua Fan. “Multiple factors involved in the pathogenesis of white matter lesions.” BioMed Research International 2017, no. 1 (2017): 9372050.
- Blanco, Pablo J., Lucas O. Müller, and J. David Spence. “Blood pressure gradients in cerebral arteries: a clue to pathogenesis of cerebral small vessel disease.” Stroke and Vascular Neurology 2, no. 3 (2017).
- Pantoni, Leonardo. “Cerebral small vessel disease: from pathogenesis and clinical characteristics to therapeutic challenges.” The Lancet Neurology 9, no. 7 (2010): 689-701. [CrossRef]
- Zhang, C. Eleana, et al. “Blood–brain barrier leakage is more widespread in patients with cerebral small vessel disease.” Neurology 88, no. 5 (2017): 426-432.
- Pan, Xijuan, et al. “Associations between carotid plaques and white matter hyperintensities in cerebral small vessel disease.” Journal of Clinical Neuroscience 129 (2024): 110871.
- Liu, Chengxia, Lin Zou, et al. “Changes of white matter integrity and structural network connectivity in nondemented cerebral small-vessel disease.” Journal of Magnetic Resonance Imaging 51, no. 4 (2020): 1162-1169. [CrossRef]
- Frey, Benedikt M., et al. “White matter integrity and structural brain network topology in cerebral small vessel disease: The Hamburg city health study.” Human brain mapping 42, no. 5 (2021): 1406-1415.
- Steinman, J.; Sun, H.-S.; Feng, Z.-P. Microvascular alterations in Alzheimer’s disease. Front. Cell. Neurosci. (2021), 14, 618986. [CrossRef.
- Yarns, Brandon C., et al. “Pathophysiology of Alzheimer’s disease.” Psychiatric Clinics 45, no. 4 (2022): 663-676.
- Koueik, Joyce, Umadevi V. Wesley, and Robert J. Dempsey. “Pathophysiology, cellular and molecular mechanisms of large and small vessel diseases.” Neurochemistry International 164 (2023): 105499. [CrossRef]
- Bath PM, Wardlaw JM. Pharmacological treatment and prevention of cerebral small vessel disease: a review of potential interventions. Int J Stroke (2015); 10: 469–78.
- Madsen, L. S. et al. Capillary dysfunction correlates with cortical amyloid load in early Alzheimer’s disease. Neurobiol. Aging 123,1–9 (2023). [CrossRef]
- Yu, L. et al. Perivascular spaces, glymphatic system and MR. Front. Neurol. 13, 844938 (2022).
- Bambach, Sven, et al. “Arterial spin labeling applications in pediatric and adult neurologic disorders.” Journal of Magnetic Resonance Imaging 55, no. 3 (2022): 698-719.
- Abeysinghe, A. A. D. T., R. D. U. S. Deshapriya, and C. Udawatte. “Alzheimer’s disease; a review of the pathophysiological basis and therapeutic interventions.” Life sciences 256 (2020): 117996.
- Lindner, Thomas, et al. “Current state and guidance on arterial spin labeling perfusion MRI in clinical neuroimaging.” Magnetic resonance in medicine 89, no. 5 (2023): 2024-2047.
- Haller, Sven, et al. “Arterial Spin Labeling Perfusion of the Brain: Emerging Clinical Applications.” Radiology (2016) 281, no. 2: 337–56.
- Jezzard, Peter, Michael A. Chappell, and Thomas W. Okell. “Arterial spin labeling for the measurement of cerebral perfusion and angiography.” Journal of Cerebral Blood Flow & Metabolism (2018) 38, no. 4: 603-626. [CrossRef]
- Haga, Sei, et al. “Arterial Spin Labeling Perfusion Magnetic Resonance Image with Dual Postlabeling Delay: A Correlative Study with Acetazolamide Loading 123i-Iodoamphetamine Single-Photon Emission Computed Tomography.” Journal of Stroke and Cerebrovascular Diseases (2016) 25, no. 1: 1–6.
- Joseph, C.R, et al. Utilizing Reduced Labeled Proton Clearance to Identify Preclinical Alzheimer Disease with 3D ASL MRI. Case Rep. Neurol. (2023), 15, 177.
- Wong, Eric C. “An introduction to ASL labeling techniques.” Journal of Magnetic Resonance Imaging 40, no. 1 (2014): 1-10. [CrossRef]
- Zhang, Nan, Marc L. Gordon, and Terry E. Goldberg. “Cerebral blood flow measured by arterial spin labeling MRI at resting state in normal aging and Alzheimer’s disease.” Neuroscience & Biobehavioral Reviews 72 (2017): 168-175. [CrossRef]
- Profaci, C.P.; Munji, R.N.; Pulido, R.S.; Daneman, R. The blood–brain barrier in health and disease: Important unanswered questions. J. Exp. Med. (2020), 217, e20190062. [CrossRef].
- N. Kim, Hae Won, Jeongho Hong, and Jae Cheon Jeon. “Cerebral small vessel disease and Alzheimer’s disease: a review.” Frontiers in Neurology 11 (2020): 927.
- Li, K.-l et al. Four-phase single-capillary stepwise model for kinetics in arterial spin labeling MRI. Magn. Reson. Med. Off. J. Int. Soc. Magn. Reson. Med. 53(3), 511–518 (2005).
- Joseph, Charles R., et al. “Pilot study utilizing MRI 3D TGSE PASL (arterial spin labeling) differentiating clearance rates of labeled protons in the CNS of patients with early Alzheimer disease from normal subjects.” Magnetic Resonance Materials in Physics, Biology and Medicine 33 (2020): 559-568. (2020). [CrossRef]
- Joseph, C.R., et al. Identifying delay in glymphatic clearance of labeled protons post-acute head trauma utilizing 3D ASL MRI (arterial spin labeling):A pilot study. Sci. Rep. (2024), 14, 6188. [CrossRef].
- Elschot, Elles P., et al. “A Comprehensive View on MRI Techniques for Imaging Blood-Brain Barrier Integrity.” Investigative Radiology (2020) 56, no. 1: 10–19. [CrossRef]
- Živanović, Milica, et al. “The role of magnetic resonance imaging in the diagnosis and prognosis of dementia.” Biomolecules and Biomedicine (2023) 23, no. 2: 209.
- Østergaard, Leif, et al.. “Cerebral Small Vessel Disease: Capillary Pathways to Stroke and Cognitive Decline.” Journal of Cerebral Blood Flow & Metabolism (2015) 36, no. 2: 302–25. [CrossRef]
- Yu, Yifan, Shilong Yu, Giuseppe Battaglia, and Xiaohe Tian. “Amyloid-β in Alzheimer’s disease: Structure, toxicity, distribution, treatment, and prospects.” ibrain 10, no. 3 (2024): 266-289.
- Chapleau, Marianne, Leonardo Iaccarino, David Soleimani-Meigooni, and Gil D. Rabinovici. “The role of amyloid PET in imaging neurodegenerative disorders: a review.” Journal of Nuclear Medicine 63, no. Supplement 1 (2022): 13S-19S.
- Rabinovici, Gil D., Constantine Gatsonis, Charles Apgar, Kiran Chaudhary, Ilana Gareen, Lucy Hanna, James Hendrix et al. “Association of amyloid positron emission tomography with subsequent change in clinical management among Medicare beneficiaries with mild cognitive impairment or dementia.” Jama 321, no. 13 (2019): 1286-1294. [CrossRef]
- Ossenkoppele, Rik, Willemijn J. Jansen, Gil D. Rabinovici, Dirk L. Knol, Wiesje M. van der Flier, Bart NM van Berckel, Philip Scheltens et al. “Prevalence of amyloid PET positivity in dementia syndromes: a meta-analysis.” Jama 313, no. 19 (2015): 1939-1950.
- Kaplan, Luke et al. “Neuronal regulation of the blood-brain barrier and neurovascular coupling.” Nature reviews. Neuroscience vol. 21,8 (2020): 416-432. [CrossRef]
- Knox, E.G., Aburto, M.R., Clarke, G. et al. The blood-brain barrier in aging and neurodegeneration. Mol Psychiatry (2022) 27, 2659–2673. [CrossRef]
- Verheggen, I C M et al. “Interaction between blood-brain barrier and glymphatic system in solute clearance.” Neuroscience and biobehavioral reviews (2018). vol. 90 (2018): 26-33. [CrossRef]
- Luissint, AC., Artus, C., Glacial, F. et al. Tight junctions at the blood brain barrier: physiological architecture and disease-associated dysregulation. Fluids Barriers CNS (2012) 9, 23. [CrossRef]
- McConnell, Heather L, and Anusha Mishra. “Cells of the Blood-Brain Barrier: An Overview of the Neurovascular Unit in Health and Disease.” Methods in molecular biology (Clifton, N.J.) (2022) vol. 2492: 3-24. [CrossRef]
- Erickson, Michelle A, and William A Banks. “Age-Associated Changes in the Immune System and Bloodbrain Barrier Functions.” International journal of molecular sciences Apr. 2019 vol. 20,7 1632. 2. [CrossRef]
- He, Jin-Ting, Xin Zhao, Lei Xu, and Cui-Ying Mao. “Vascular risk factors and Alzheimer’s disease: blood-brain barrier disruption, metabolic syndromes, and molecular links.” Journal of Alzheimer’s Disease (2020) 73, no. 1: 39-58.
- Litak, Jakub, Marek Mazurek, et al. “Cerebral Small Vessel Disease.” International Journal of Molecular Sciences (2020) 21 (24): 9729. [CrossRef]
- Wang, Zheng, Qin Chen, et al. “Risk Factors of Cerebral Small Vessel Disease: A Systematic Review and Meta-Analysis.” Medicine (2021) 100 (51): e28229. [CrossRef]
- Clancy, et al. “Neuropsychiatric Symptoms Associated with Cerebral Small Vessel Disease: A Systematic Review and Meta-Analysis.” The Lancet. Psychiatry 8 (3): 225–36. [CrossRef]
- Sorby-Adams, A., et al. The role of neurogenic inflammation in blood-brain barrier disruption and development of cerebral oedema following acute central nervous system (CNS) injury. Int. J. Mol. Sci. (2017),18, 1788. [CrossRef].
- Propson, N.E.; Roy, E.R.; Litvinchuk, A.; Köhl, J.; Zheng, H. Endothelial C3a receptor mediates vascular inflammation and blood-brain barrier permeability during aging. J. Clin. Investig. (2021), 131, e144348. [CrossRef]
- Yang, Canhong, et al. “Aquaporin-4 and Alzheimer’s disease.” Journal of Alzheimer’s Disease (2016) 52, no. 2: 391-402.
- Chagnot, A., Barnes, S. R. & Montagne, A. Magnetic resonance imaging of blood–brain barrier permeability in dementia. Neuroscience (2021) 474, 14–29.
- Yamazaki, Yu, and Takahisa Kanekiyo. “Blood-brain barrier dysfunction and the pathogenesis of Alzheimer’s disease.” International journal of molecular sciences (2017) 18, no. 9: 1965.
- Chen, Yanting, et al. “Blood-brain barrier dysfunction and Alzheimer’s disease: associations, pathogenic mechanisms, and therapeutic potential.” Frontiers in Aging Neuroscience (2023) 15: 1258640.
- Montagne, Axel, Zhen Zhao, and Berislav V. Zlokovic. “Alzheimer’s disease: a matter of blood–brain barrier dysfunction?.” Journal of Experimental Medicine (2017) 214, no. 11: 3151-3169.
- Joseph, Charles R. “Assessing Mild Traumatic Brain Injury-Associated Blood–Brain Barrier (BBB) Damage and Restoration Using Late-Phase Perfusion Analysis by 3D ASL MRI: Implications for Predicting Progressive Brain Injury in a Focused Review.” International Journal of Molecular Sciences (2024) 25, no. 21: 11522.
- Barisano, Giuseppe, Axel Montagne, et al.. “Blood–brain barrier link to human cognitive impairment and Alzheimer’s disease.” Nature cardiovascular research (2022) 1, no. 2: 108-115.
- Huang, Zhangsen, et al. “Blood-brain barrier integrity in the pathogenesis of Alzheimer’s disease.” Frontiers in neuroendocrinology (2020) 59: 100857.
- Hussain, Basharat, Cheng Fang, and Junlei Chang. “Blood–brain barrier breakdown: an emerging biomarker of cognitive impairment in normal aging and dementia.” Frontiers in neuroscience (2021)15: 688090.
- Verheggen, et al. “Increase in blood–brain barrier leakage in healthy, older adults.” Geroscience (2020) 42: 1183-1193.
- Riederer, Isabelle, et al. “Alzheimer disease and mild cognitive impairment: integrated pulsed arterial spin-labeling MRI and 18F-FDG PET.” Radiology (2018) 288.1: 198-206. [CrossRef]
- Joseph, C.R. Progressive Age-Associated Blood–Brain Barrier Leak/Dysfunction-Nexus of Neurodegenerative Disease Using MRI Markers to Identify Preclinical Disease and Potential New Targets for Future Treatments. Diagnostics (2024), 14, 726. [CrossRef].
- Davies, Peter F. “Hemodynamic shear stress and the endothelium in cardiovascular pathophysiology.” Nature clinical practice Cardiovascular medicine (2009) 6.1: 16-26.
- Regenhardt, Robert W, et al. “Pathophysiology of Lacunar Stroke: History’s Mysteries and Modern Interpretations.” Journal of stroke and cerebrovascular diseases : the official journal of National Stroke Association (2019) vol. 28,8: 2079-2097. [CrossRef]
- Cannistraro, Rocco J., Mohammed Badi, Benjamin H. Eidelman, Dennis W. Dickson, Erik H. Middlebrooks, and James F. Meschia. 2019. “CNS Small Vessel Disease.” Neurology (2021) 92 (24): 1146–56. [CrossRef]
- Livingston, Gill, et al. “Dementia prevention, intervention, and care: 2024 report of the Lancet standing Commission.” The Lancet (2024) 404, no. 10452: 572-628.
Figure 1.
Perfusion cycle with arterial, venous and capillary components versus time. The 5-arterial phase PLD times are illustrated by the orange line (800-1200ms, 200ms intervals), the 7-capillary phase PLD’s (2800-4000ms at 200 ms intervals) by the red line. T1 times (63% signal decay) of major tissue signal contributors indicated by the colored dots. Magenta dot = 800-850 msec T1 of white matter. Orange dot = 1650 msec T1 of blood. Green dot = 1700 msec T1 of gray matter (all values are for 3T). Dk blue dot = 3800 msec T1 of water (CSF fluid); (all values are for 3T). BAT = bolus arrival time; aaTT =artery-artery arrival time; τ = peak capillary arrival time. Adapted with publisher permission (Wiley) from reference 44.
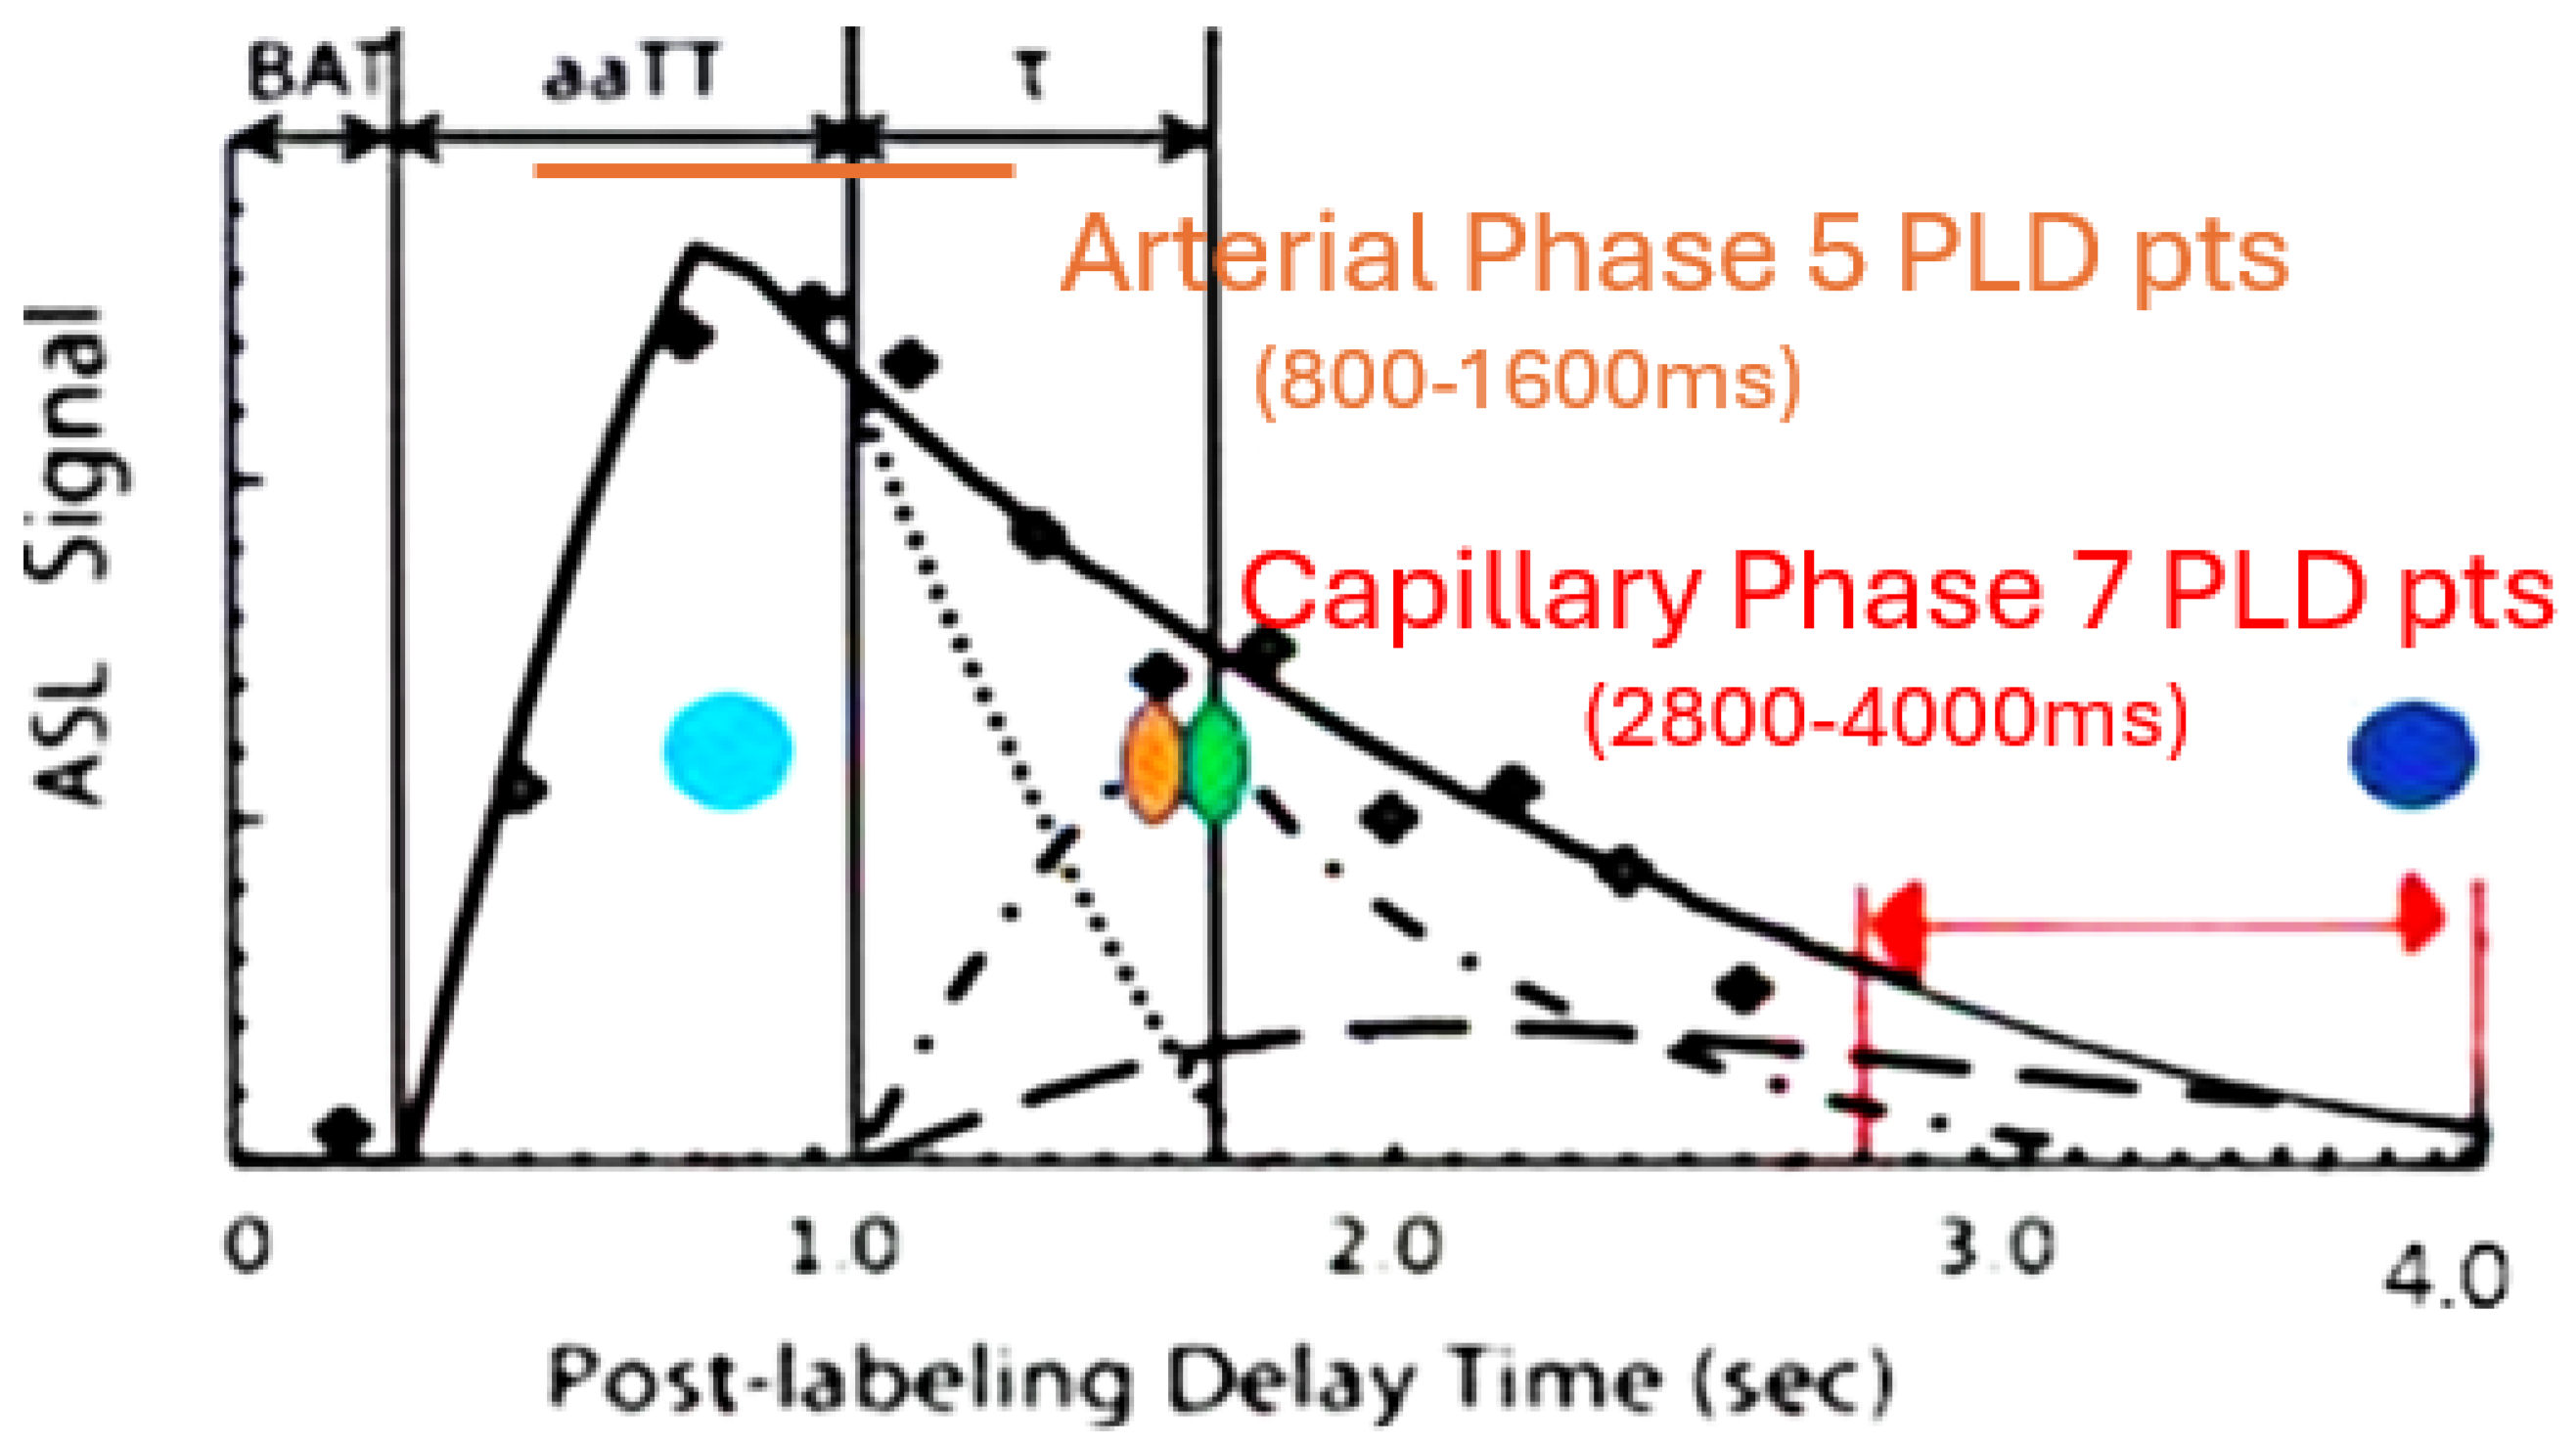
Figure 2.
Note the locations of the Region of Interest drawn for each anatomic location (shown unilaterally for clarity). Temporal lobe volume = 650 mm2, Frontal lobe=1150mm2,Parietal lobe=760mm2.
Figure 2.
Note the locations of the Region of Interest drawn for each anatomic location (shown unilaterally for clarity). Temporal lobe volume = 650 mm2, Frontal lobe=1150mm2,Parietal lobe=760mm2.
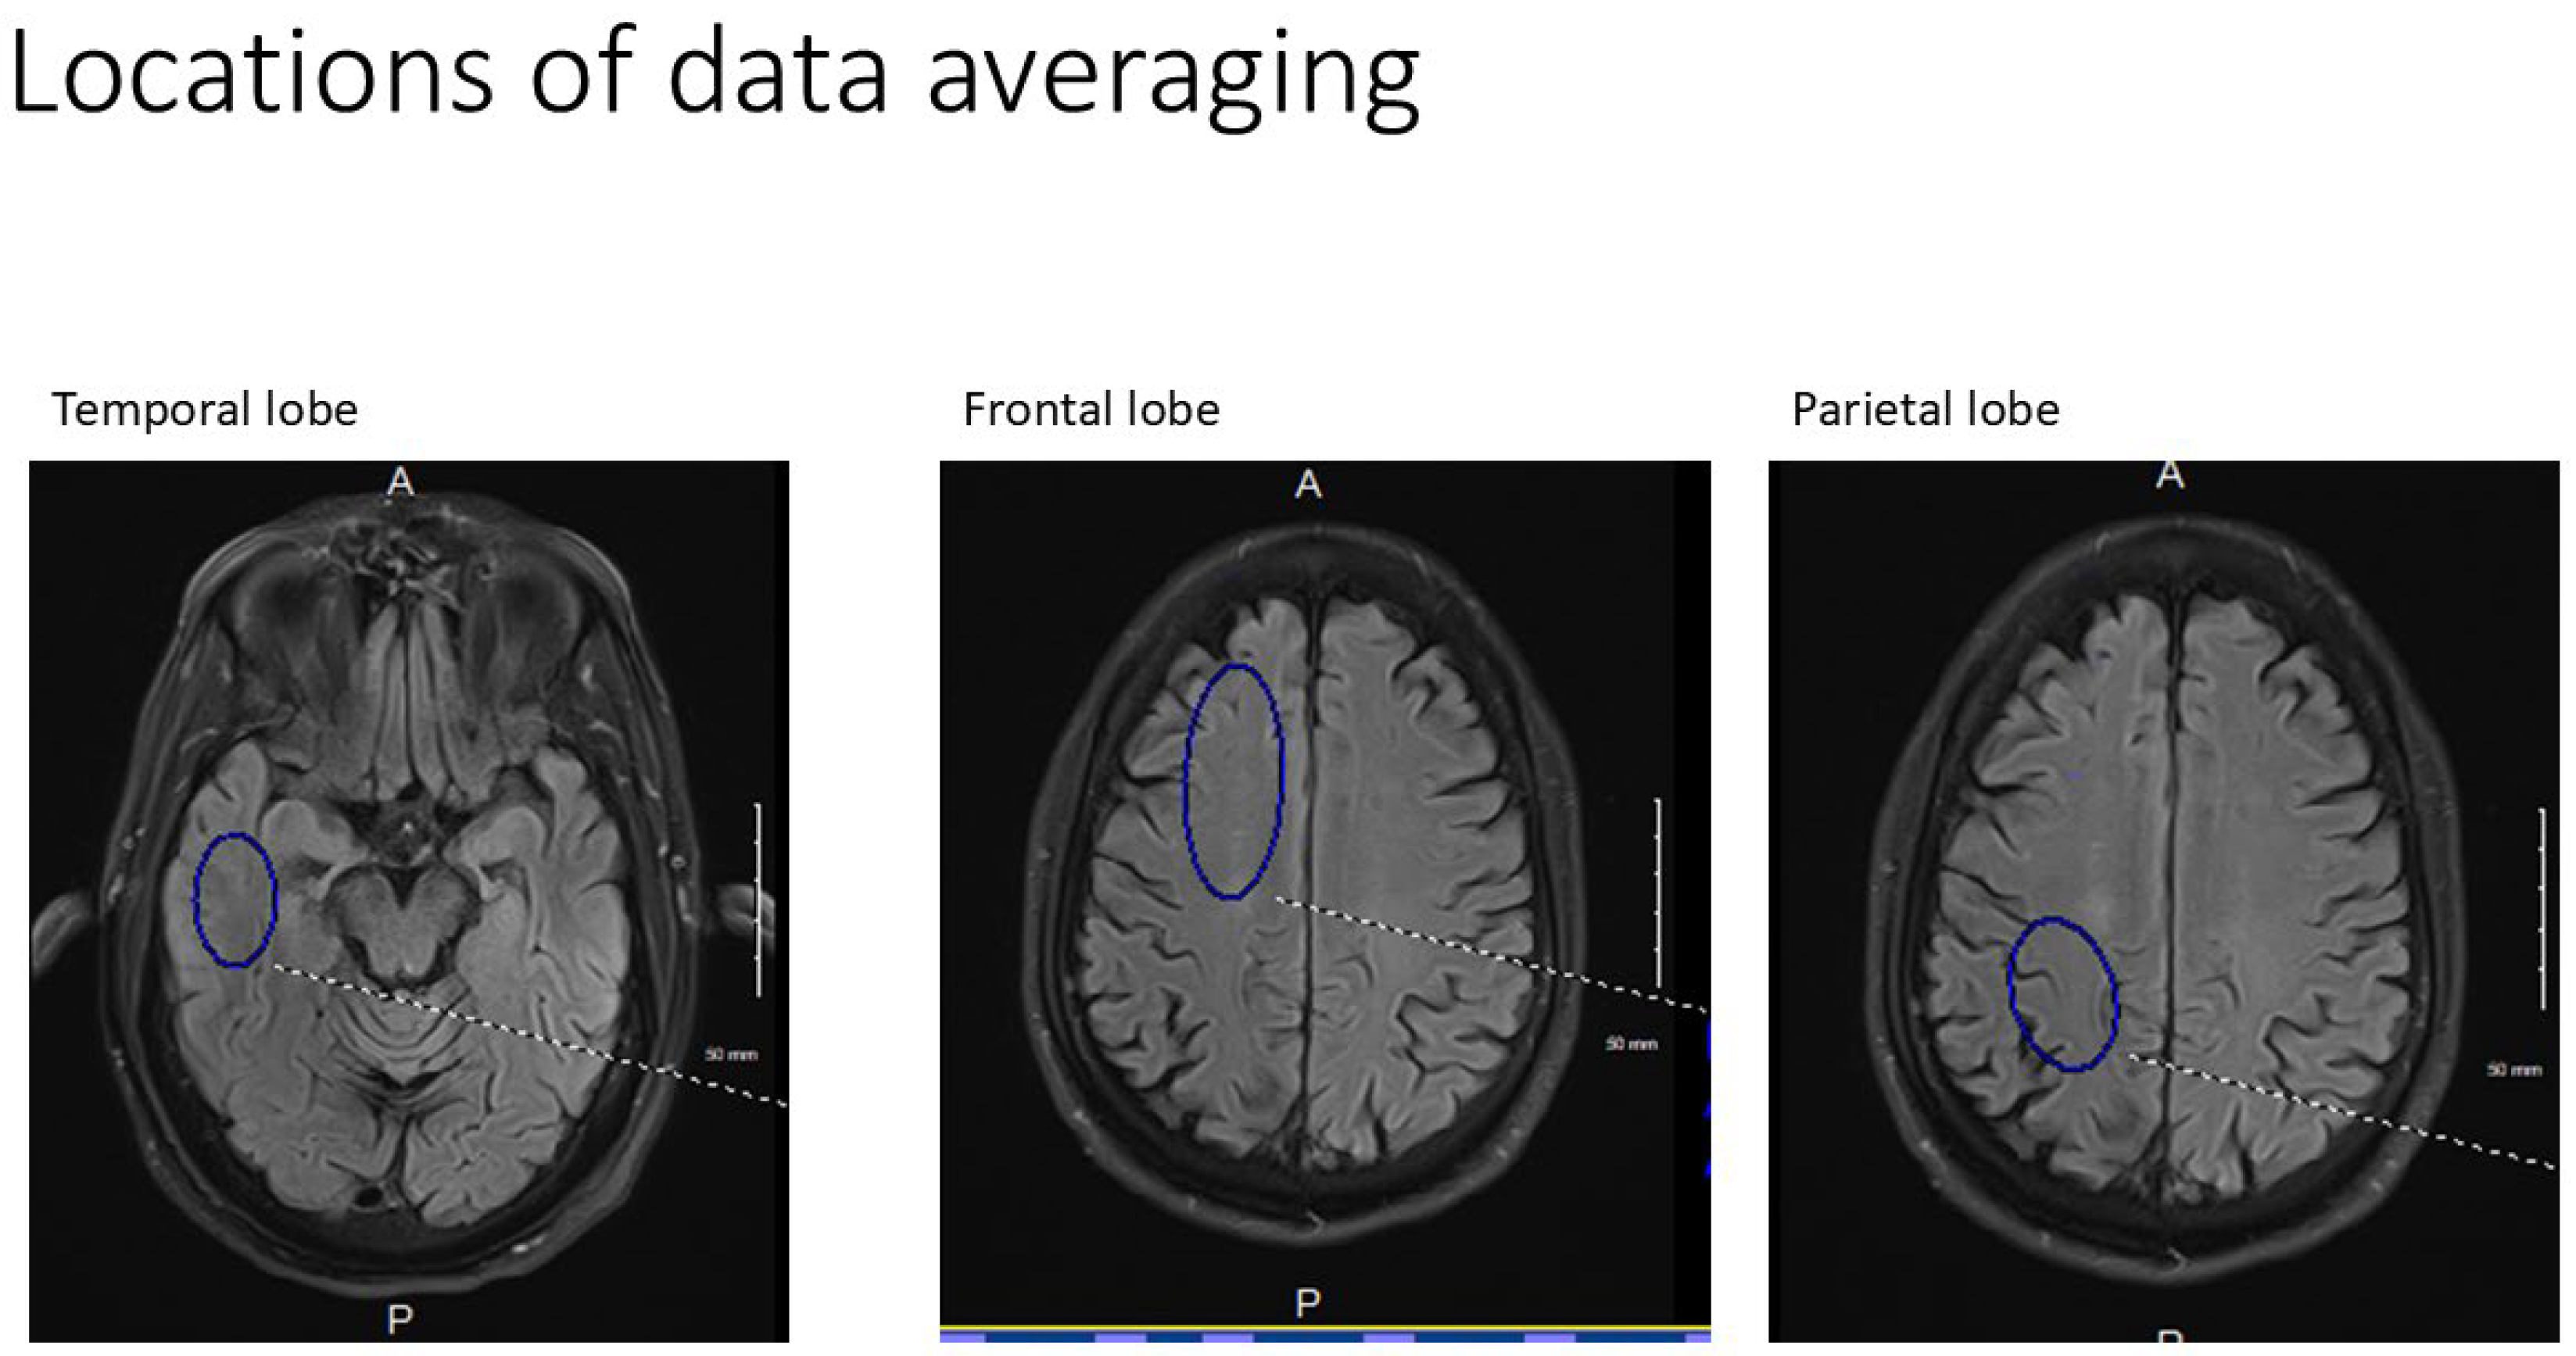
Figure 3.
Early phase arterial peak amplitude for AD, SVD, and control subjects by region. AD=Alzheimer Disease, SVD=small vessel disease, L/RTEMP=Left/Right temporal lobe, L/RFRONT=L/R Frontal lobe, L/RPAR=L/R Parietal lobe. There were no significant statistical differences among the three groups. The box =interquartile range (IQR) 25 (1st) to 75 (3rd) percentile; whisker = 1st IQR -1.5 X1st IQR and 3rd IQR +1.5X 3rd IQR. Black dots = outliers in line with their respective group. This applies to Figures 3-7.
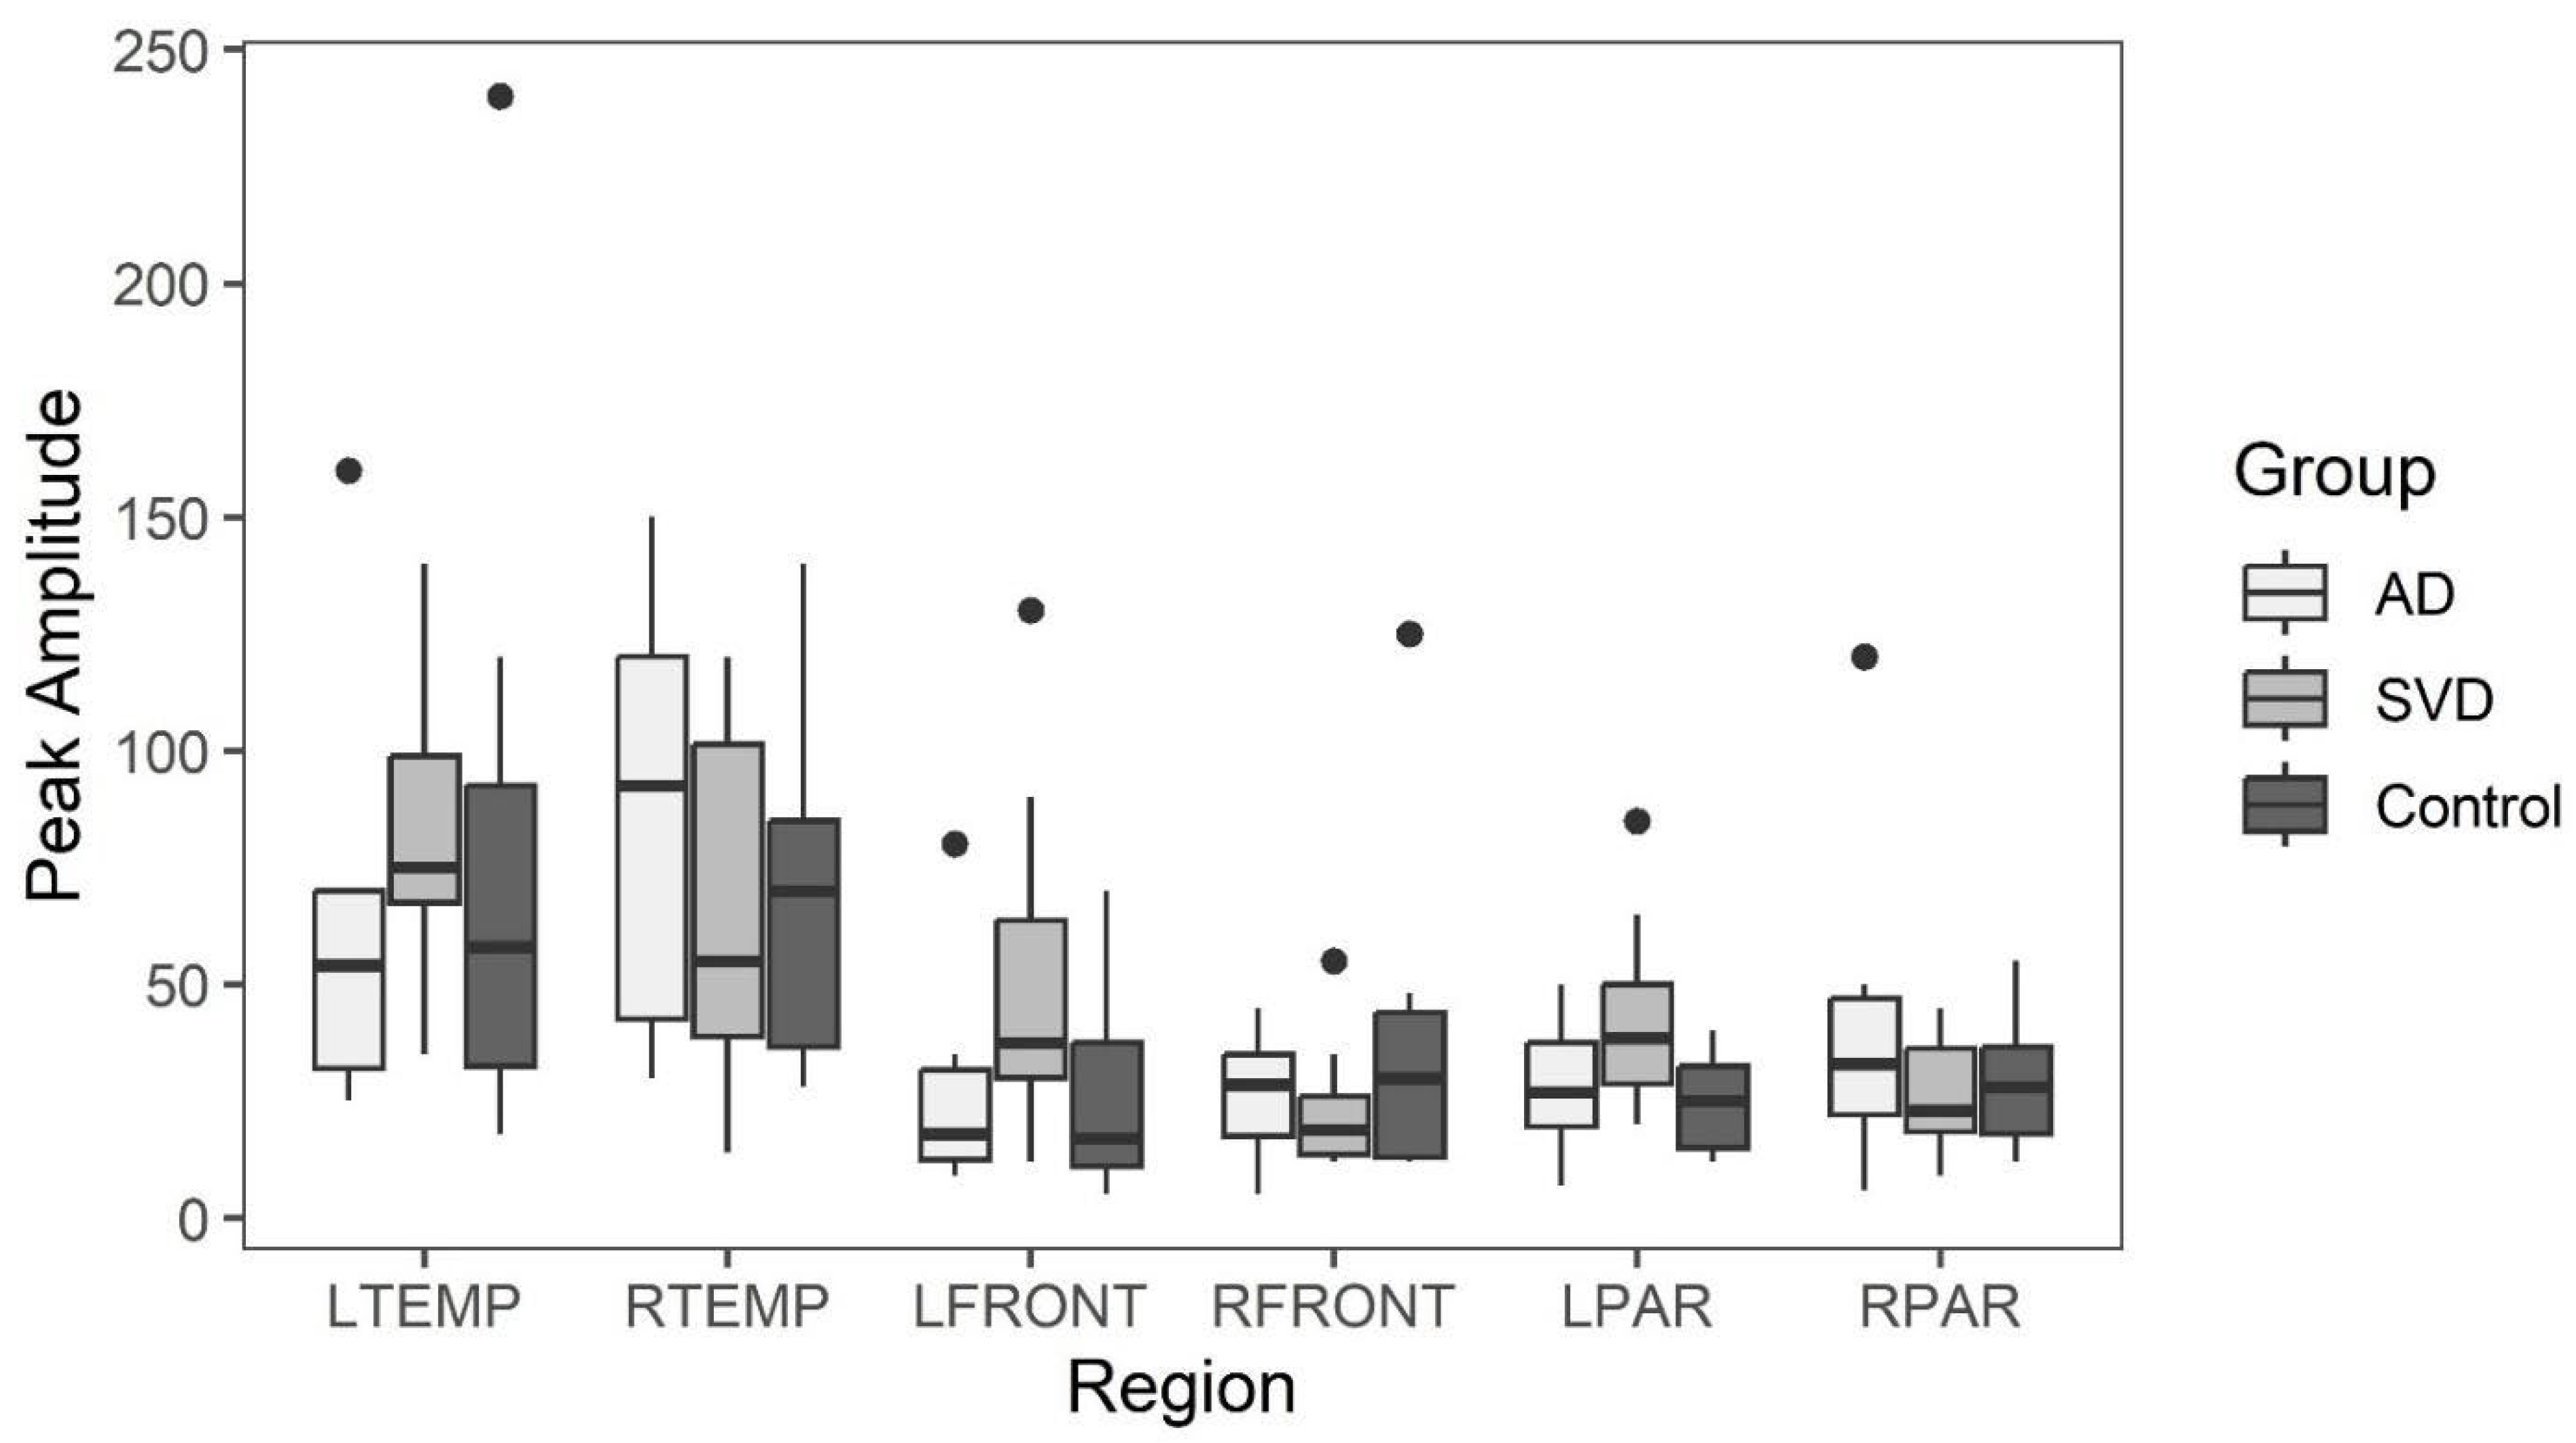
Figure 4.
Early phase arterial peak latency for AD, SVD, and control subjects by region. There were no significant statistical differences among the three groups.
Figure 4.
Early phase arterial peak latency for AD, SVD, and control subjects by region. There were no significant statistical differences among the three groups.
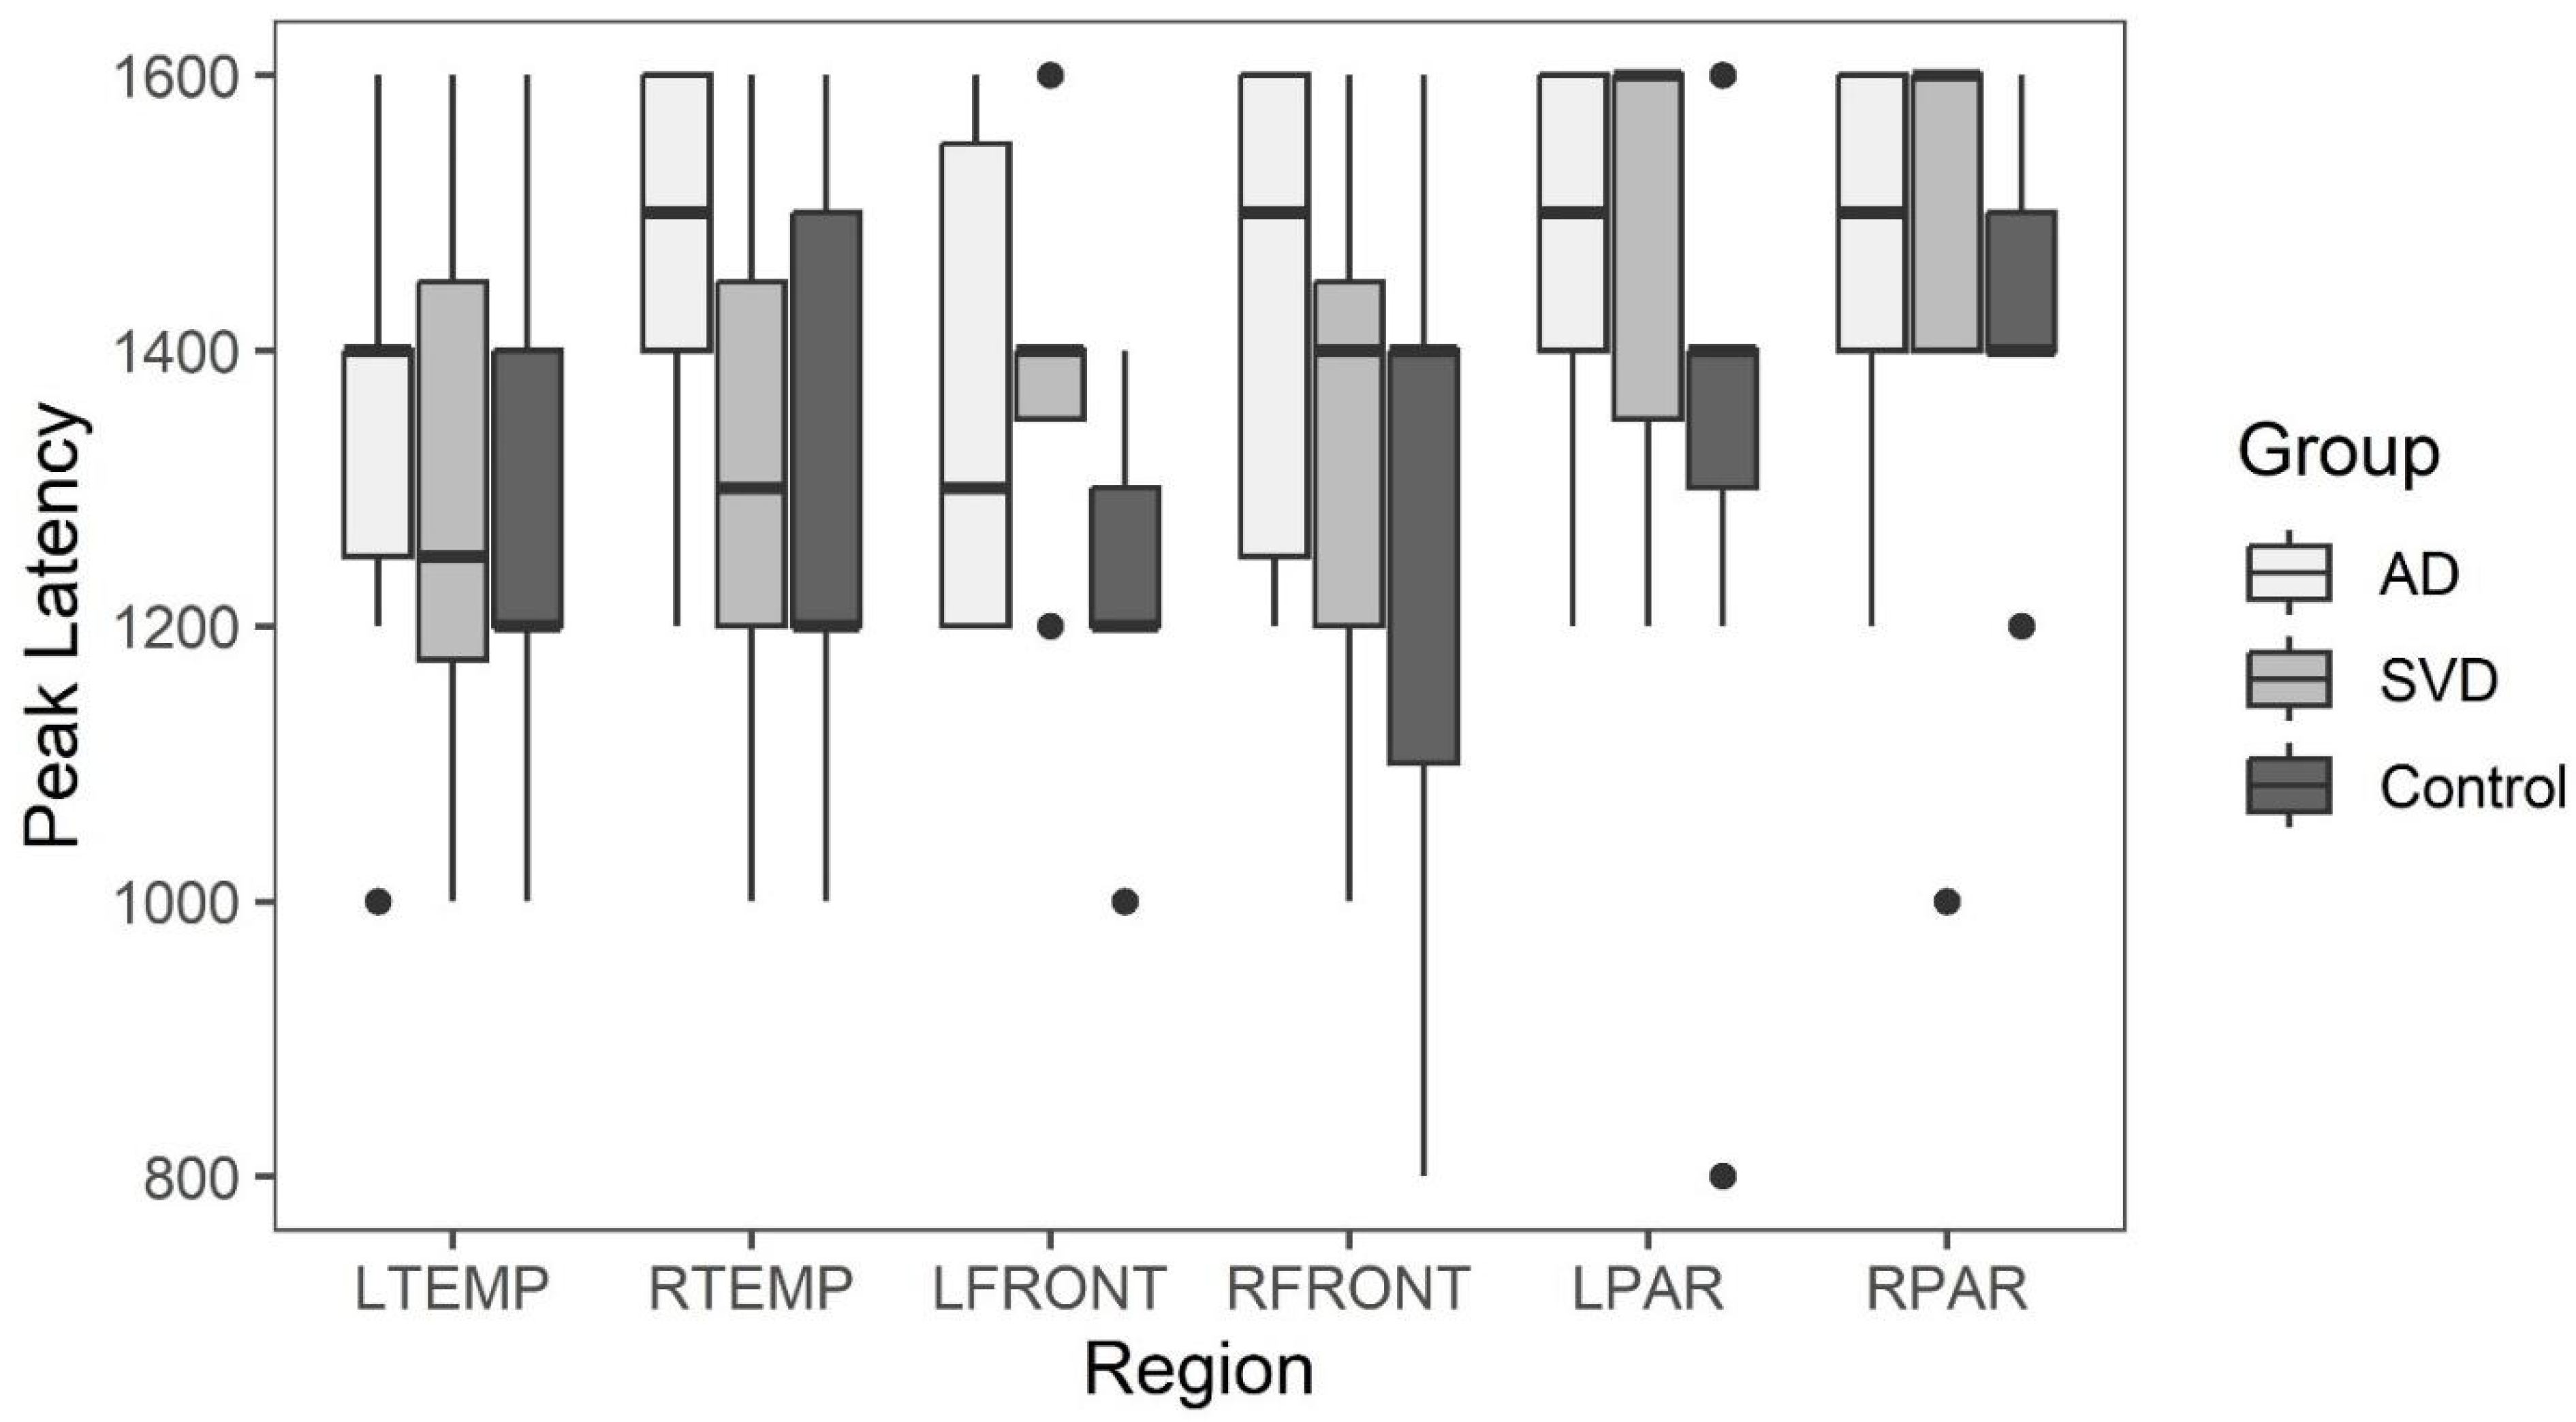
Figure 5.
Late phase glymphatic slopes for AD, SVD, and control subjects by region. Significant differences in glymphatic clearance slopes are noted when comparing SVD or AD slopes with the normative group. There are no regions where the SVD and AD groups are significantly different from one another.
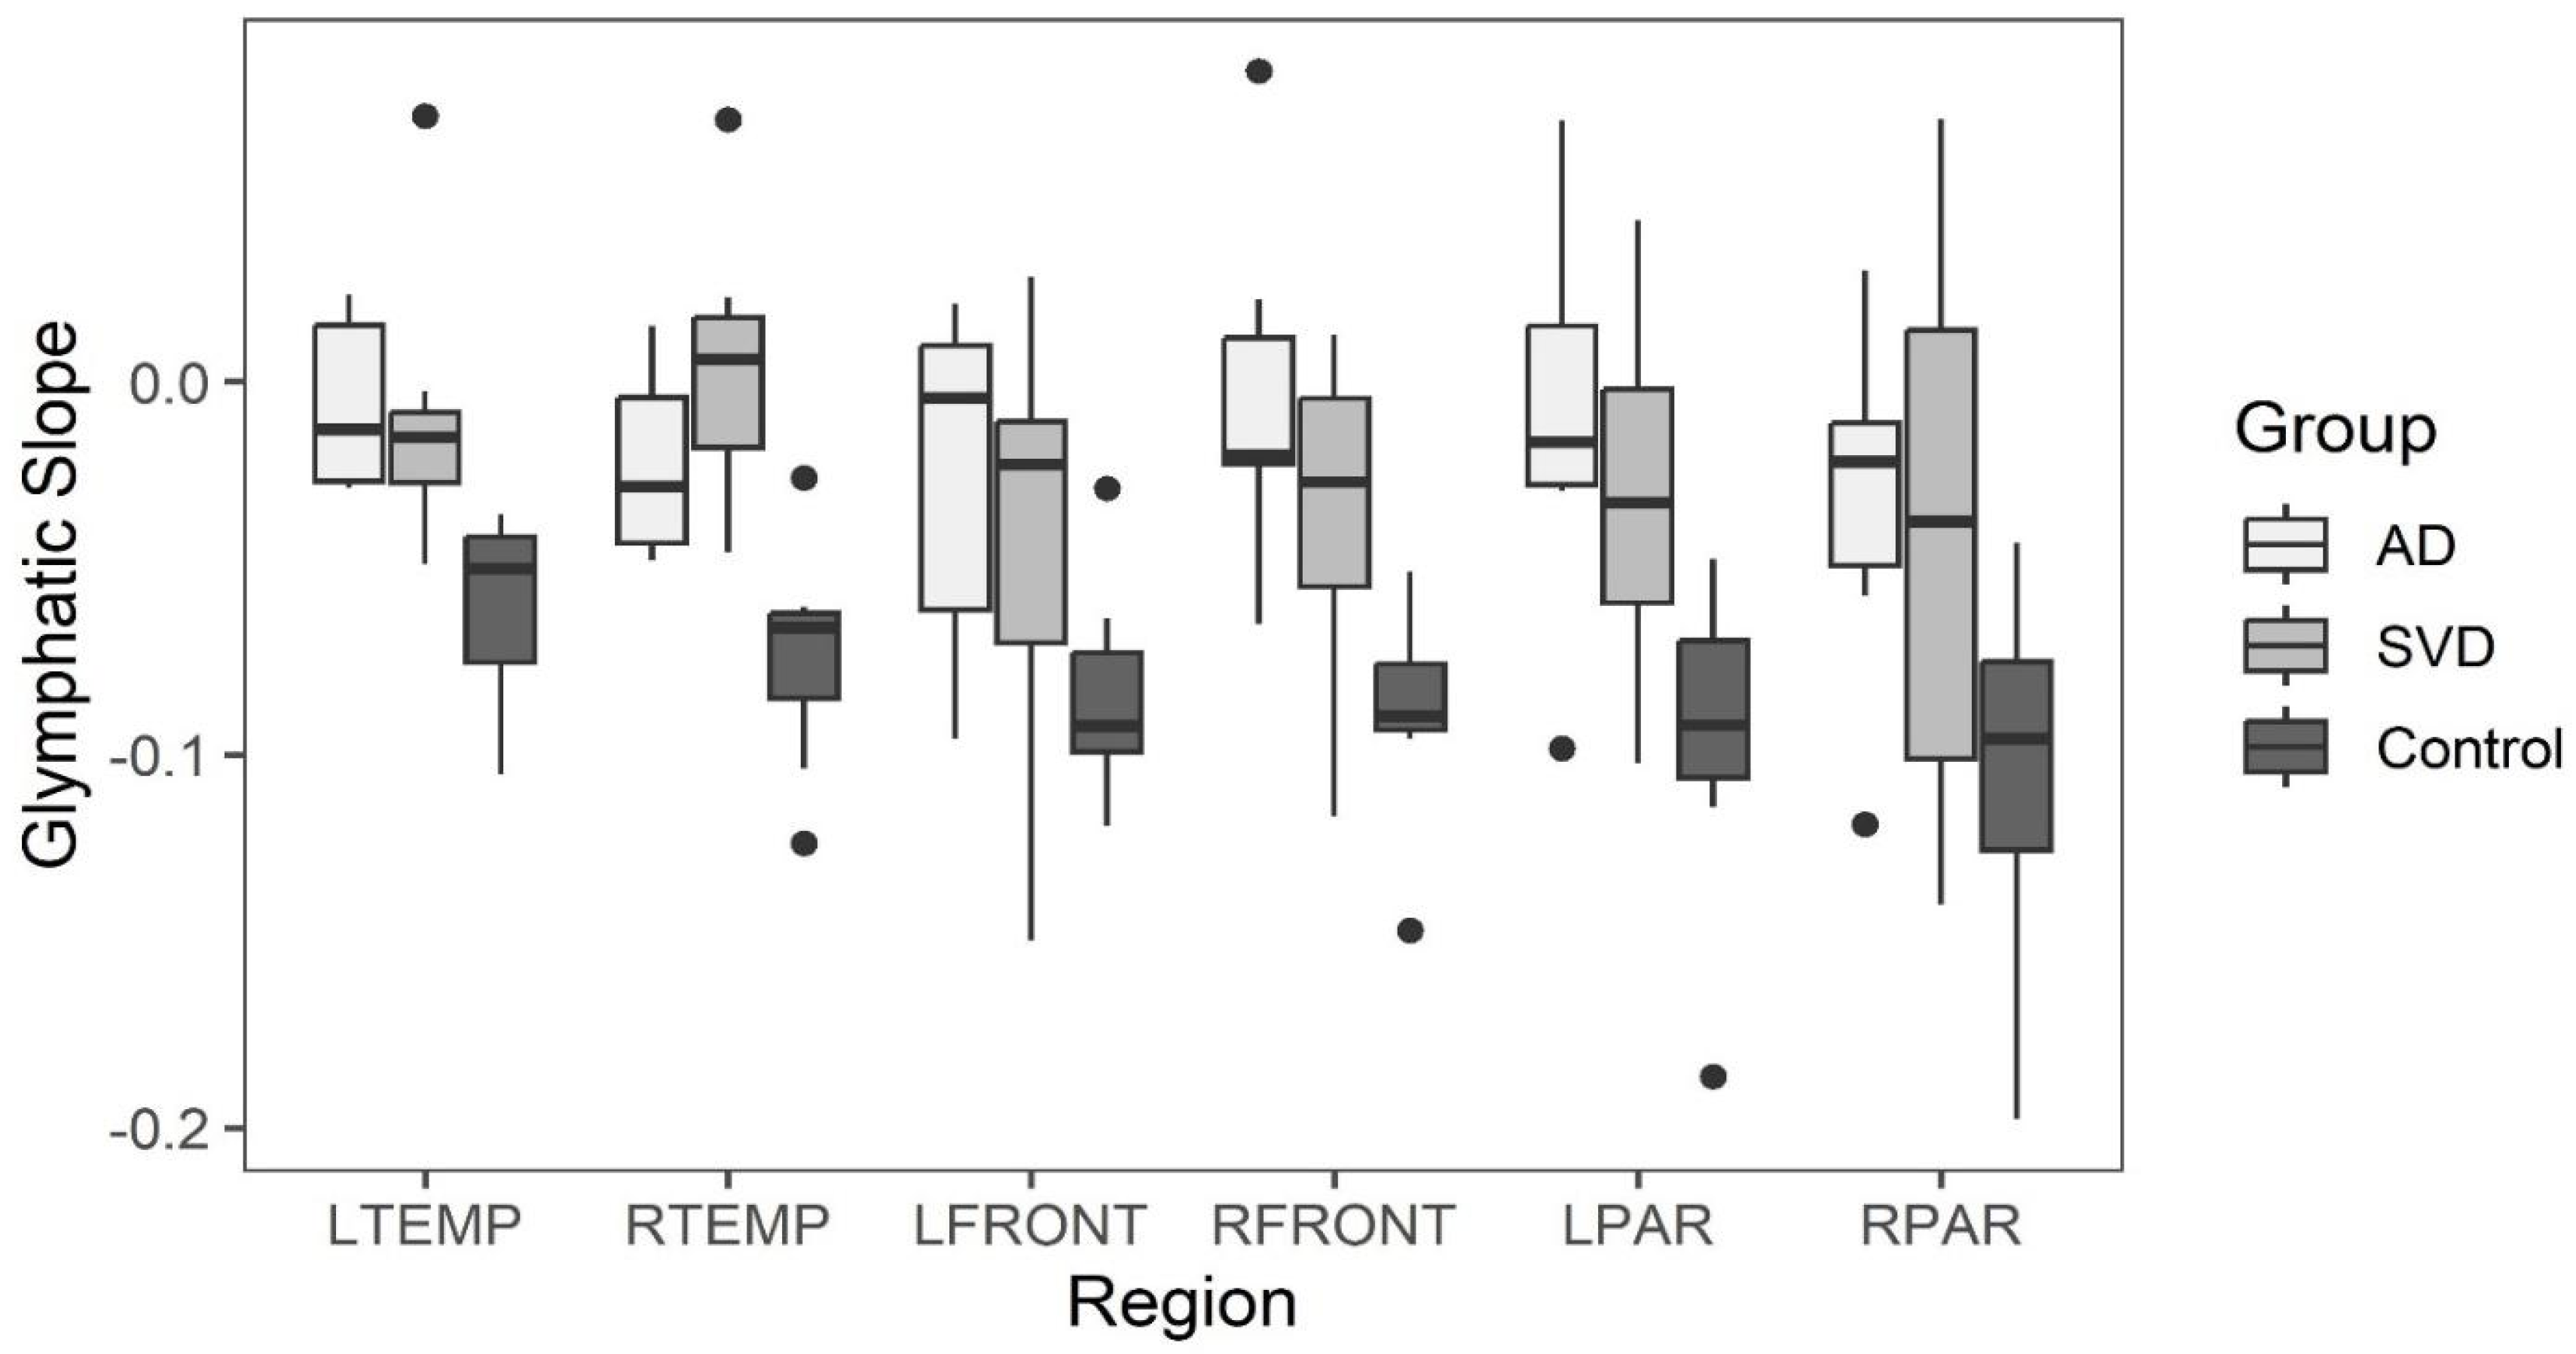
Figure 6.
Arterial phase peak amplitude for AD, SVD, and control subjects by region. Here, for AD and SVD subjects, included data has been limited to each specific region with reduced glymphatic clearance.
Figure 6.
Arterial phase peak amplitude for AD, SVD, and control subjects by region. Here, for AD and SVD subjects, included data has been limited to each specific region with reduced glymphatic clearance.
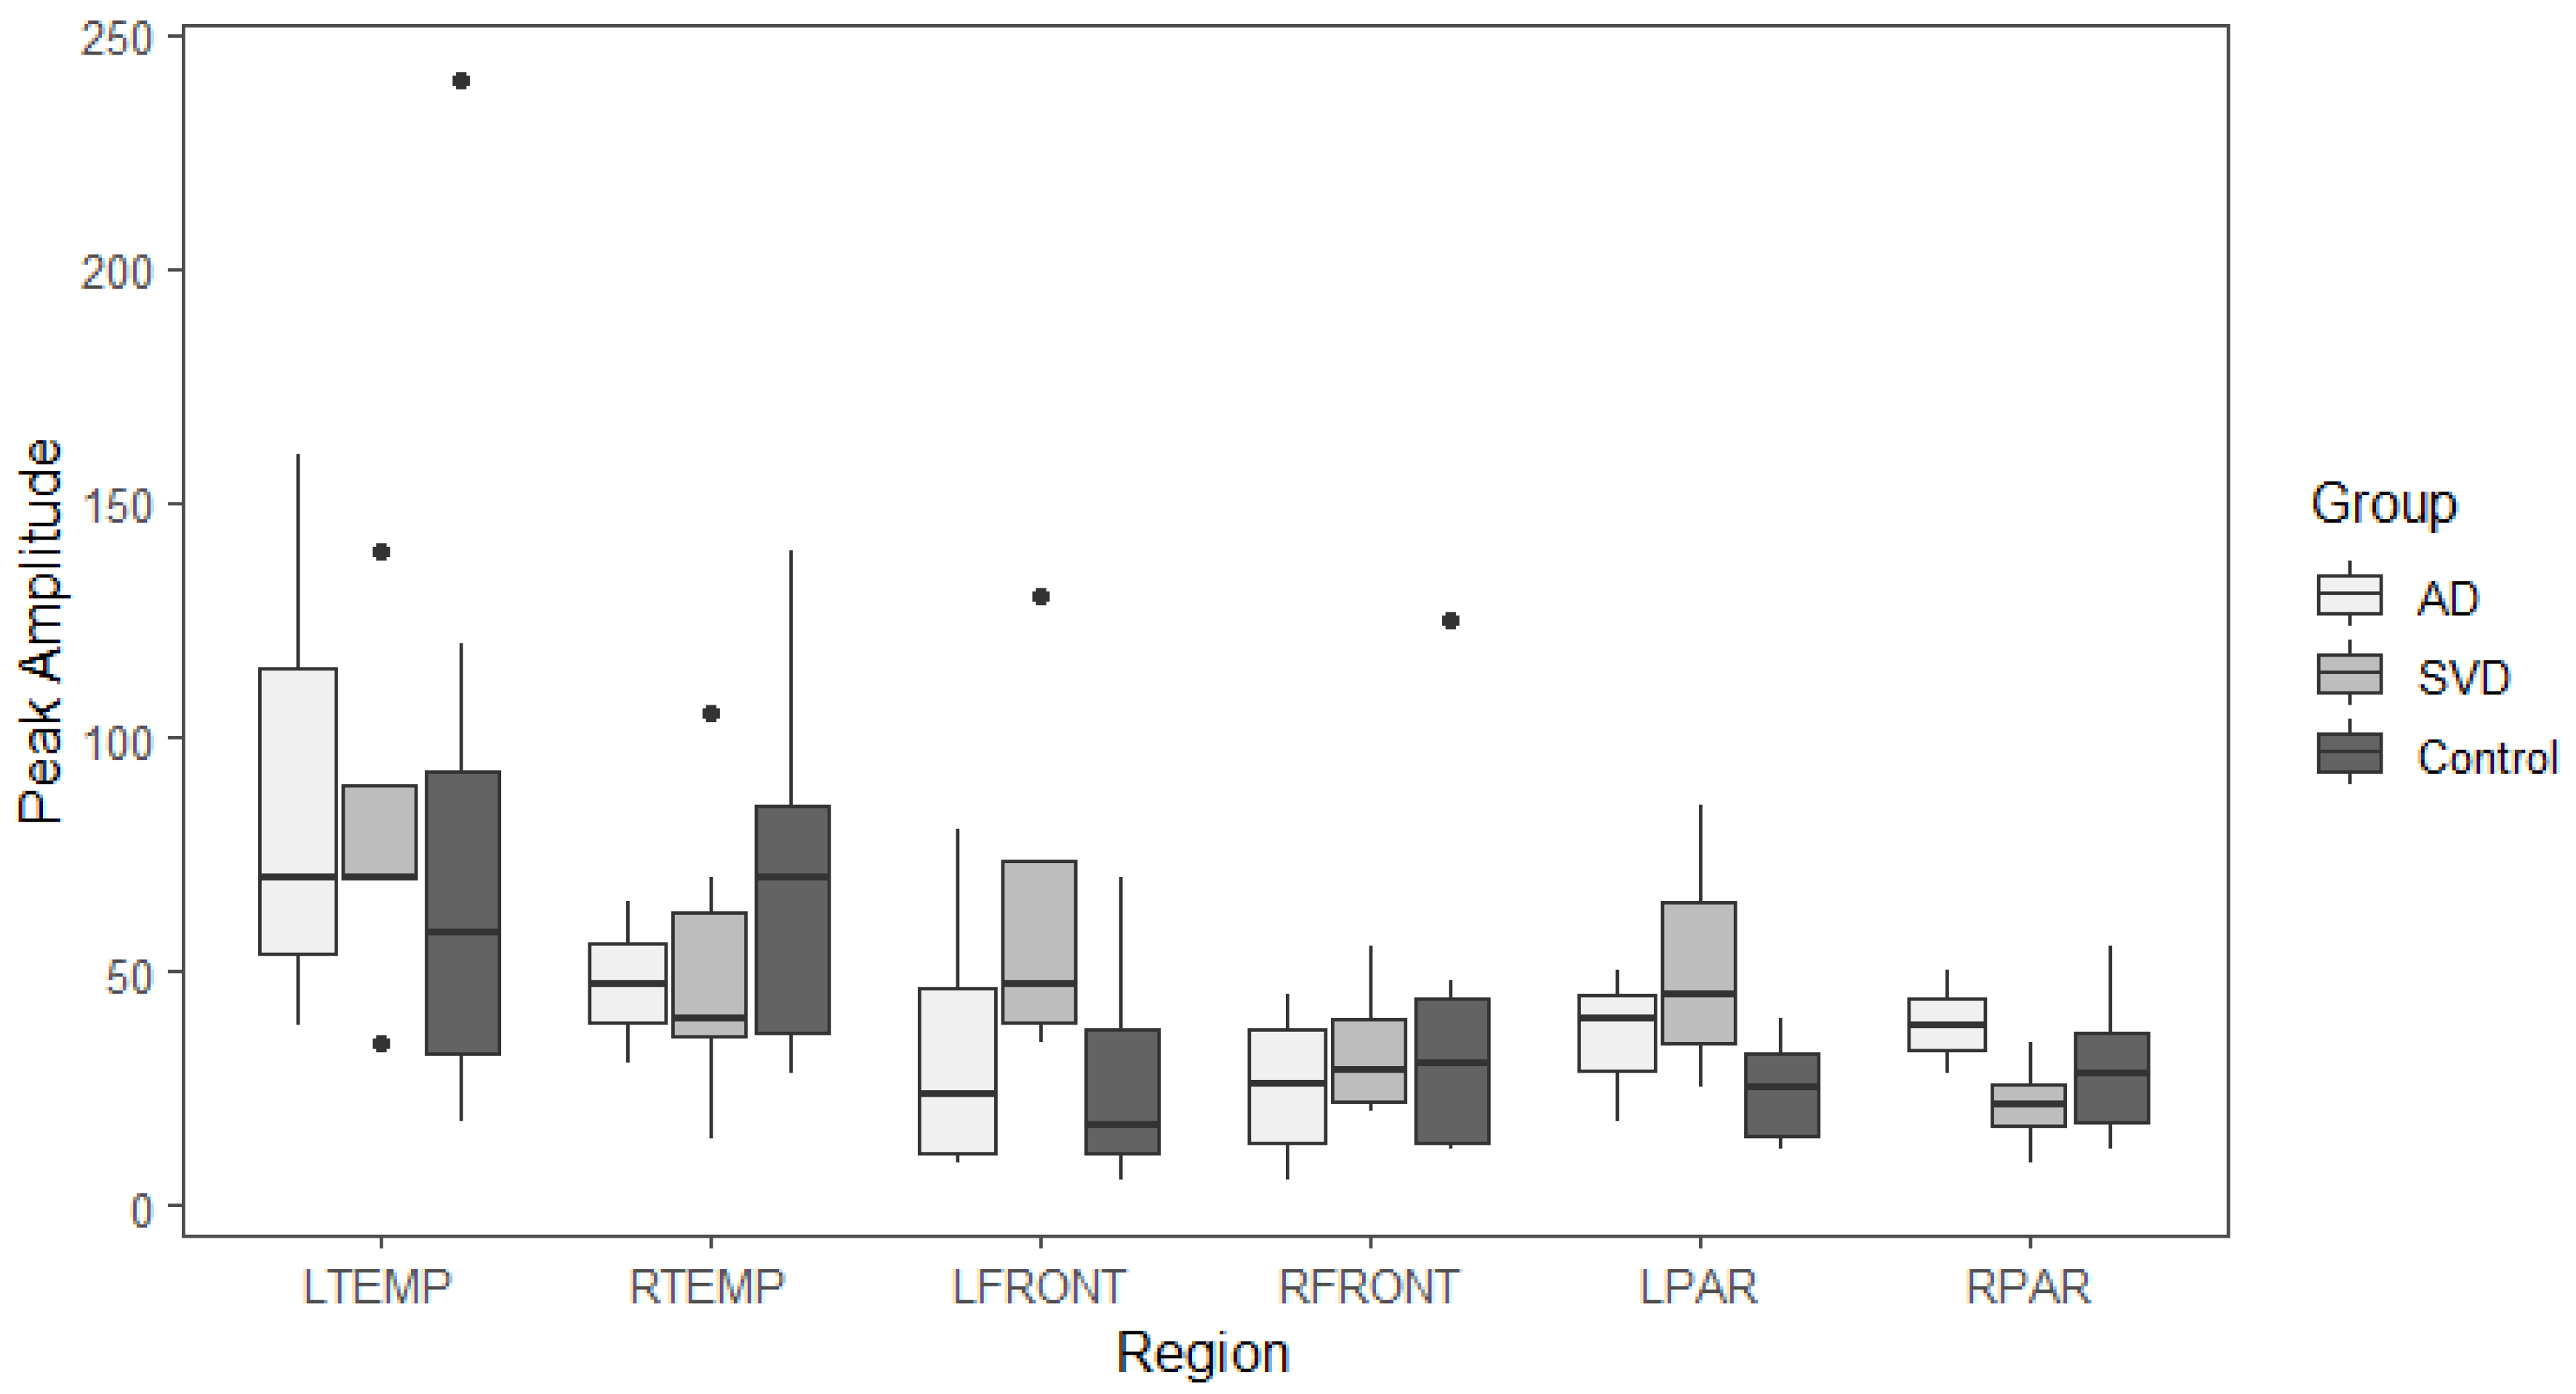
Figure 7.
Arterial phase peak latency for AD, SVD, and control subjects by region. Here, for AD and SVD subjects, included data has been limited to each specific region with reduced glymphatic clearance.
Figure 7.
Arterial phase peak latency for AD, SVD, and control subjects by region. Here, for AD and SVD subjects, included data has been limited to each specific region with reduced glymphatic clearance.
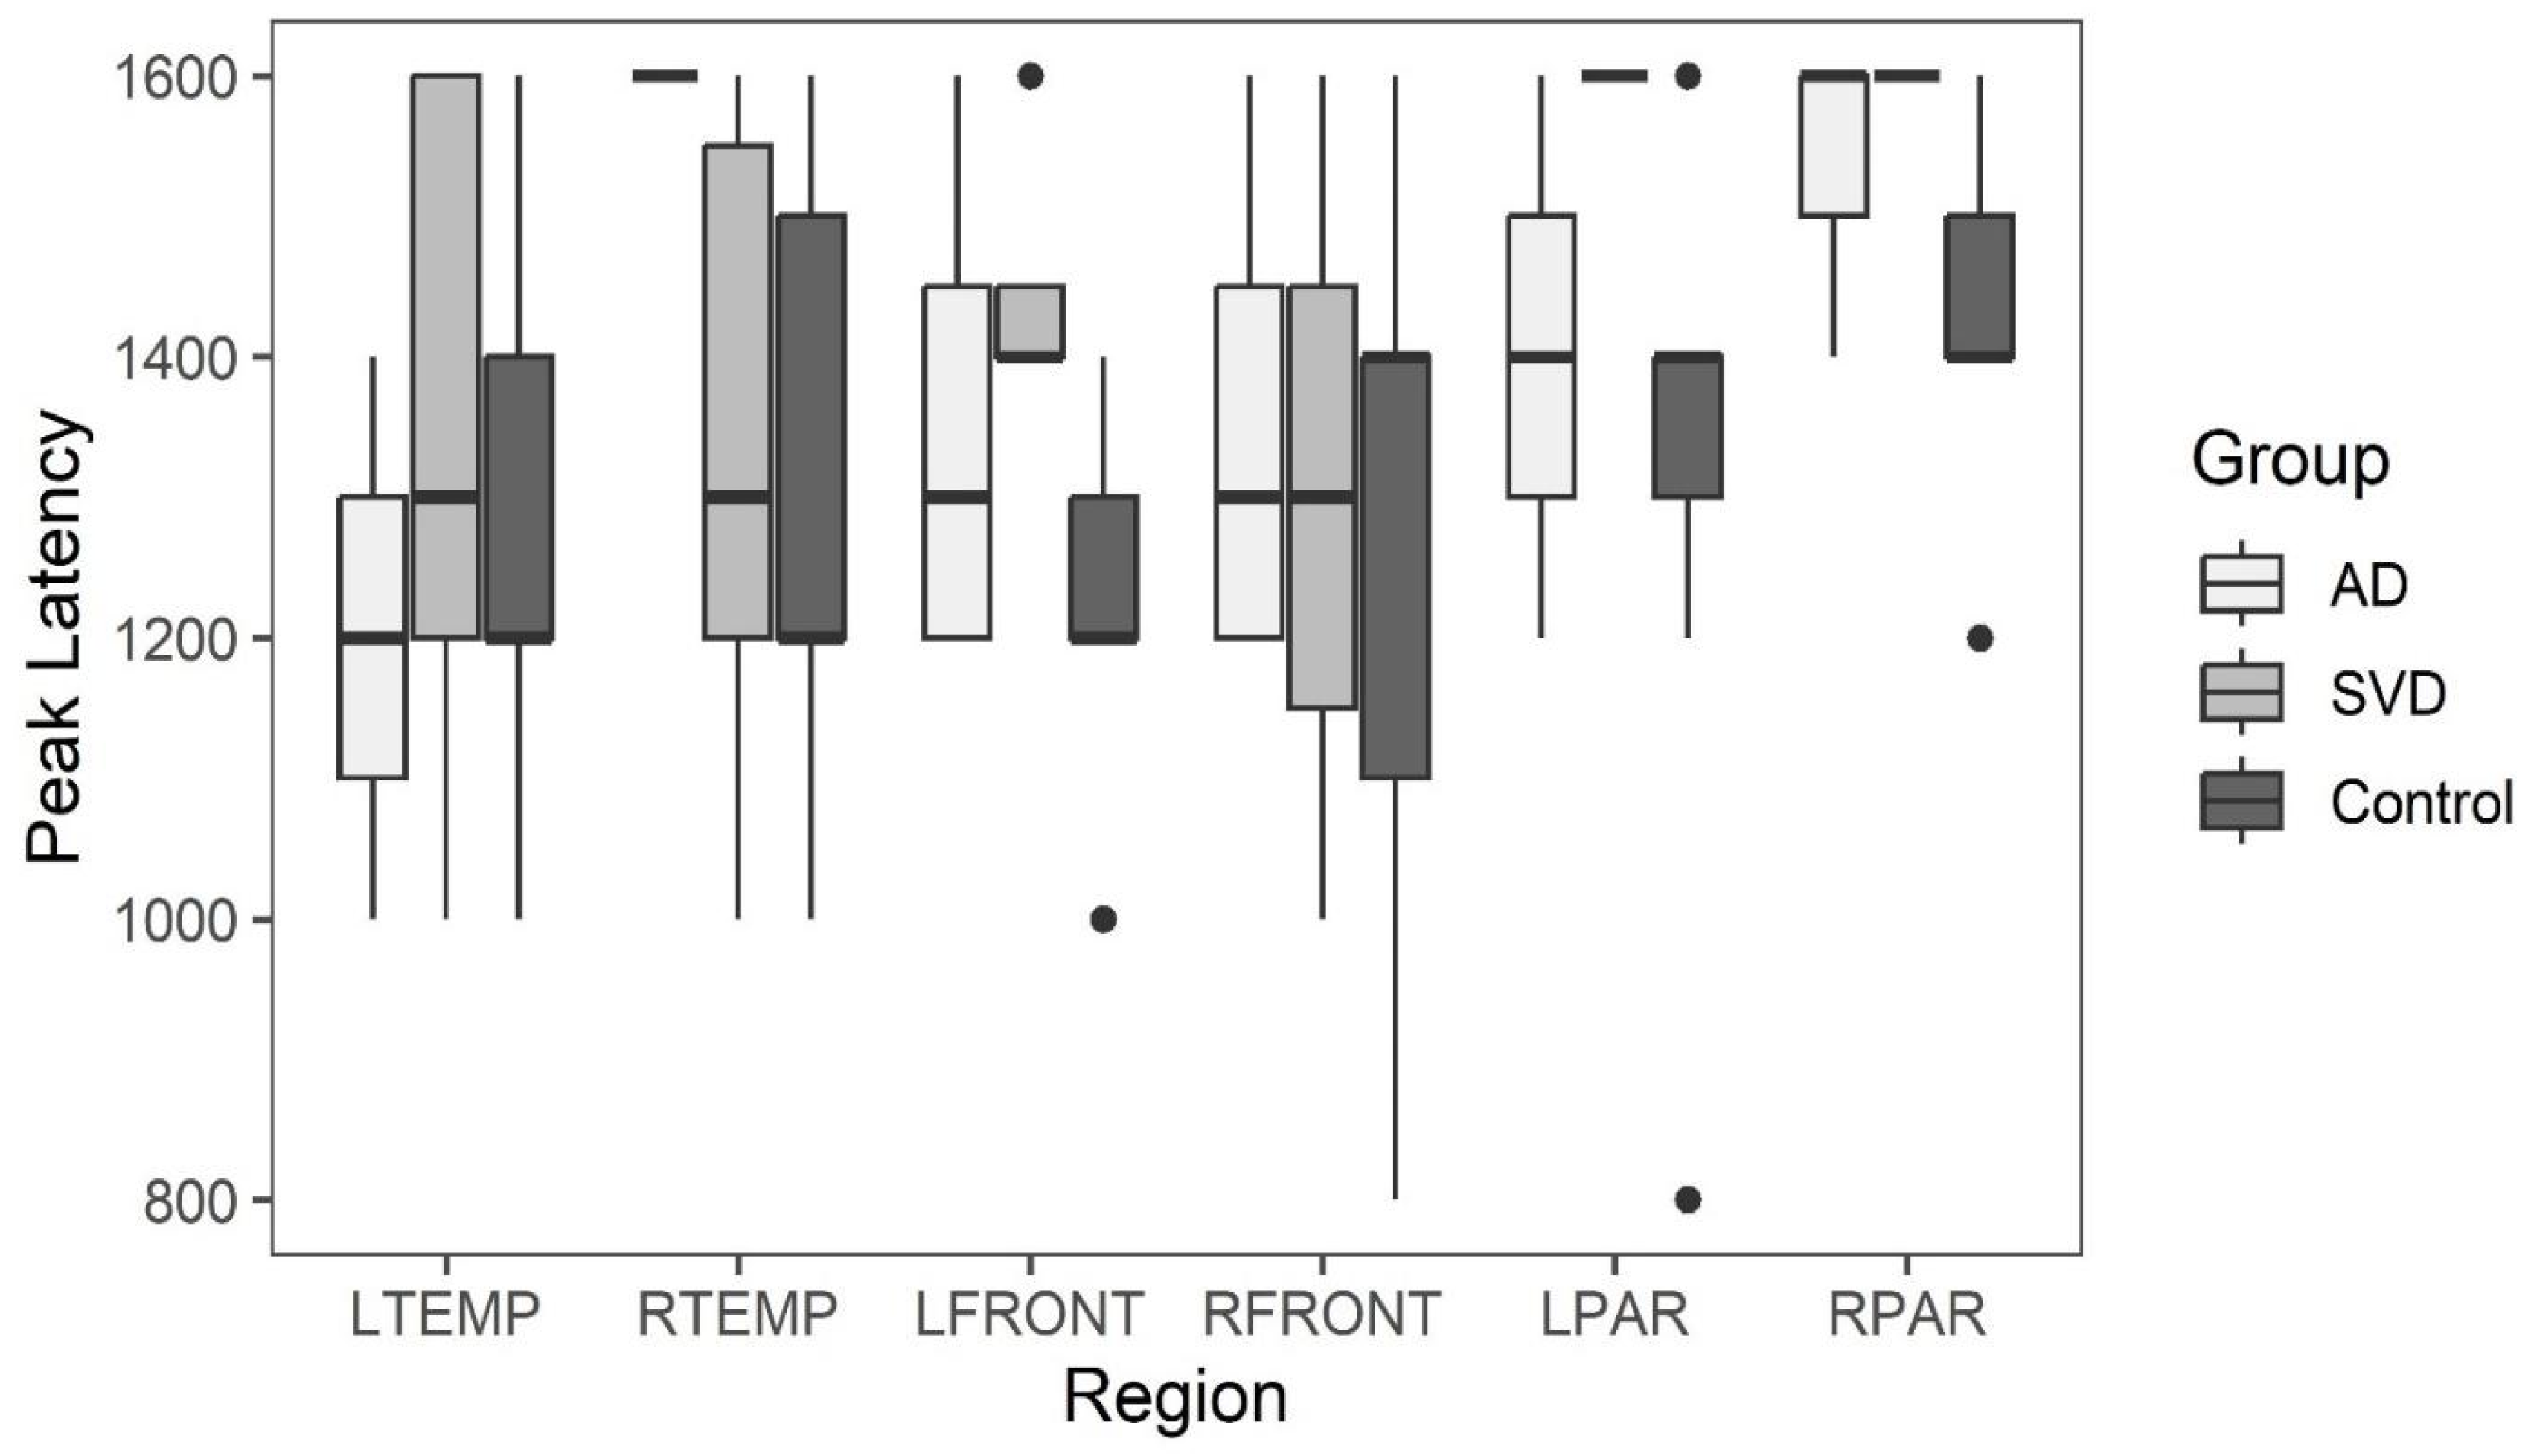
Figure 8.
Cerebral capillopathy schematic leading to Alzheimer dementia including risk factors, initial target (BBB dysfunction with leak) producing vascular injury and metabolic consequences. Accelerating factors further capillary dysfunction include accumulating misfolded proteins, capillary loss, genetic factors (GF). The rate of cognitive decline increased by GF, reducing normal handling of misfolded proteins.
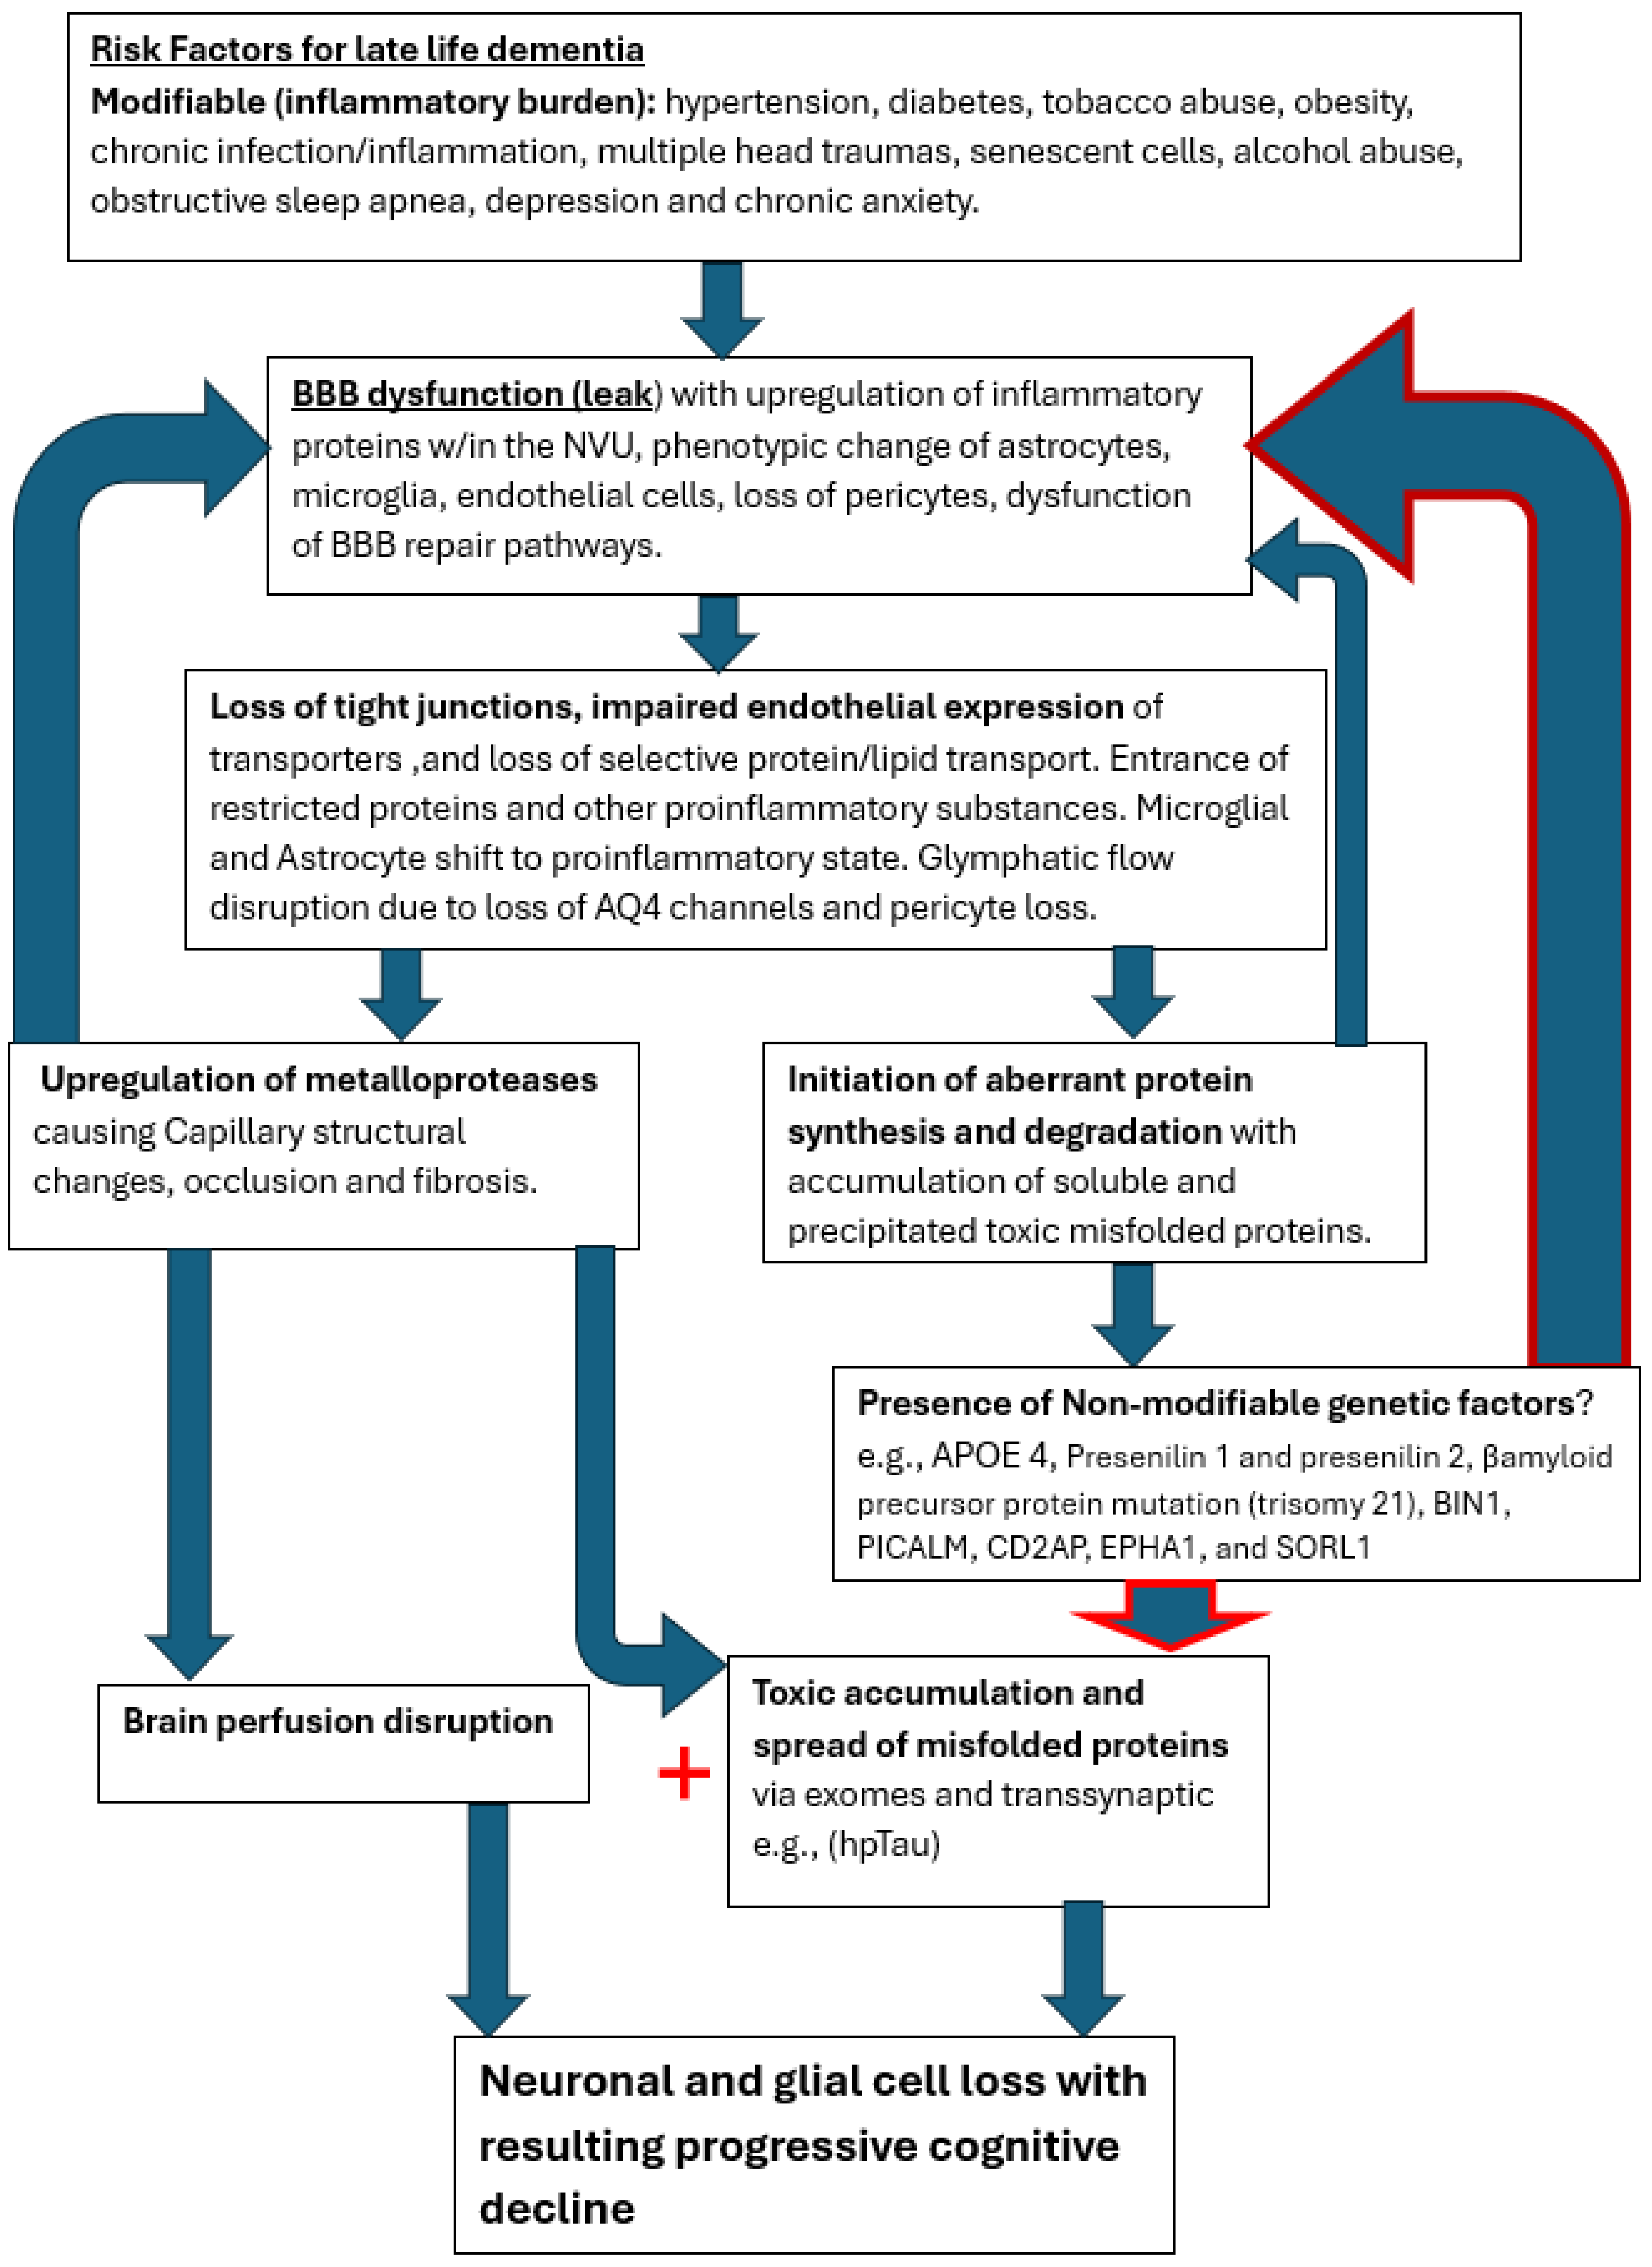
Table 1.
Compendium of demographic (age MoCA scores and SVD and AD APOE status), 0-17: Severe cognitive impairment, 18-25: Mild cognitive impairment (MCI), 26-30: Normal cognitive function. Memory index score (MIS) 0-6: Severe memory impairment, 7-11: Mild memory impairment, 12-15: Normal memory function. ASL MRI results amplitude and peak latency in the Arterial perfusion phase in the six brain regions studied, slopes of the clearance rates in the capillary/glymphatic late phase of perfusion in the same six anatomic regions with the identical size of region of interest. The presence of white matter hyperintensities on the FLAIR sequence was visually quantified using the Fazekas scale. The presence of parietal atrophy scored using Koedam scale, presence of temporal lobe atrophy scored with Schelton’s scale, and number of microhemorrhages found on SWI were directly counted. PL= peak latency in milliseconds, PA = peak amplitude in arbitrary units, AD= subjects APOE 4 positive for 1 or two copies with MCI or mild dementia, SVD= small vessel disease with MCI or mild dementia, APOE= Apolipoprotein E, MoCA=Montreal Cognitive Assessment, MIS=Memory Index score, NT= not tested, FSS = Fazekas scale score, KS = Koedam score, SSTL = Scheltens Scale Temporal Lobe, MH = microhemorrhages. Table 2 provides the values of the variables analyzed in this report. There were 6 AD individuals, 8 SVD individuals, and 7 control individuals included in this data set; individuals had values reported for 22 different variables (peak latency, peak amplitude, and glymphatic slope for each of 6 different regions, plus the Fazekas scale score, Koedam score, Scheltens’ scale, and microhemorrhage count).
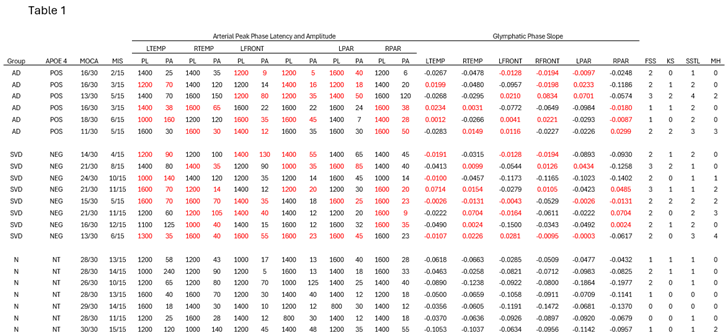 |
Table 2.
Summary of MoCA and MIS scores and standard deviations for the SVD with AD group scores compared to controls.
Table 2.
Summary of MoCA and MIS scores and standard deviations for the SVD with AD group scores compared to controls.
| MoCA | MIS | |||
|---|---|---|---|---|
| Mean | SD | Mean | SD | |
| AD | 15.0 | 2.53 | 4.0 | 1.55 |
| SVD | 18.1 | 4.08 | 8.4 | 3.06 |
| Control | 28.1 | 1.22 | 12.86 | 1.77 |
Table 3.
Results of Kruskal-Wallis Tests comparing MRI image scores among the three groups which demonstrate significant difference only between the Fazekas score (number of hyperintensities on FLAIR sequence) between the SVD and normal groups but not between the SVD and AD group. Likewise, the Schelten scale showed significant difference between the AD and normal groups but not between the SVD and AD group.
| Scale | χ2 | df | p | Post-hoc results |
|---|---|---|---|---|
| Fazekas Scale Score (Numeric estimate of white matter hyperintensities) |
8.33 | 2 | 0.016 | SVD > N (p = 0.012) |
| Koedam Score (Mesial parietal atrophy) |
3.10 | 2 | 0.213 | n/a |
| Scheltens’ Scale (Temporal lobe atrophy) |
10.39 | 2 | 0.006 | AD > N (p = 0.006) |
| Microhemorrhages | 3.51 | 2 | 0.173 | n/a |
Disclaimer/Publisher’s Note: The statements, opinions and data contained in all publications are solely those of the individual author(s) and contributor(s) and not of MDPI and/or the editor(s). MDPI and/or the editor(s) disclaim responsibility for any injury to people or property resulting from any ideas, methods, instructions or products referred to in the content. |
© 2025 by the authors. Licensee MDPI, Basel, Switzerland. This article is an open access article distributed under the terms and conditions of the Creative Commons Attribution (CC BY) license (http://creativecommons.org/licenses/by/4.0/).
Copyright: This open access article is published under a Creative Commons CC BY 4.0 license, which permit the free download, distribution, and reuse, provided that the author and preprint are cited in any reuse.


