Submitted:
05 May 2025
Posted:
06 May 2025
You are already at the latest version
Abstract
Ivy leaf extract has been shown to alleviate bronchial infection symptoms through various mechanisms, including anti-inflammatory effects. However, its impact on adaptive immunity, particularly dendritic cell (DC)/T-cell interactions, remains unexplored. This study investigated the immunomodulatory potential of ivy leaf extract (EA 575) using human monocyte-derived DCs (MoDCs). Immature MoDCs (imMoDCs) were differentiated with IL-4/GM-CSF and matured with LPS/IFN-γ (mMoDCs). MoDCs, treated with EA 575 during differentiation, were co-cultured with purified T cells. EA 575 (non-cytotoxic up to 100 µg/mL) inhibited MoDC differentiation and maturation by reducing the expression of CD1a, CD83, CD40, CD86, HLA-DR, Dectin-1, CD206, CD209, HIF-1α, and proinflammatory cytokines (IL-12, IL-23, IL-27, IL-1β, IL-6, TNF-α). EA 575-treated mMoDCs suppressed allogeneic T-cell proliferation and reduced Th1 (IFN-γ), Th17 (IL-17A, IL-22), Th9 (IL-9), Th21 (IL-21), TNF-α, and IL-6 responses. Effects were dose-dependent, with higher concentrations (100 µg/mL) showing stronger inhibition. At lower concentrations (20 µg/mL), EA 575 increased Th2 (IL-4, IL-5), and IL-10 responses, and frequencies of CD4+ T cells with Treg properties, such as CD25hiFoxp3+, Tr1 (IL-10+Foxp3−), and IL-35+ Foxp3+ cells. Immunoregulatory mechanisms mediated by EA 575-treated mMoDCs correlated with upregulation of tolerogenic markers (PD-L1, ILT3, ILT4, IDO1) on mMoDCs and the increased frequency of exhausted CD4+ T cells (PD-1+CD69+) and cytotoxic T cells (Granzyme B+PD-1+). In conclusion, EA 575 induces tolerogenic DCs with significant anti-inflammatory and immunoregulatory properties, a previously undescribed phenomenon. Lower concentrations primarily enhance immunoregulatory responses, while higher concentrations exert more pronounced anti-inflammatory effects.
Keywords:
Helix hedera L.
; Dendritic cells
; Cell culture
; T helper cells
; Immunoregulation
1. Introduction
Numerous clinical studies [1,2,3,4] have demonstrated the efficacy of ivy (Helix hedera L) leaf extract in alleviating symptoms of acute and chronic respiratory tract infections by reducing cough, bronchospasm, and secretion in both adults and children. These findings have been further substantiated by systematic reviews and meta-analyses [5,6,7]. Among the various formulations, the dry extract EA 575, marketed as Prospan in liquid and tablet forms, has shown the most significant results [5,8].
Experimental studies have explored the mechanisms underlying the beneficial effects of ivy extract and its fractions. For instance, the anti-inflammatory properties of the extract were validated in a mouse model of chronic asthma [9]. Similarly, a saponin-enriched extract demonstrated efficacy in acute and chronic inflammation models in rats, likely through mechanisms involving histamine/serotonin release inhibition and macrophage modulation [10]. However, these mechanisms remain to be directly examined. Additionally, a phenolic fraction of ivy extract exhibited antimicrobial, antioxidant, and anti-inflammatory activities in a murine lipopolysaccharide (LPS)-induced acute lung injury model [11].
The anti-inflammatory effects of EA 575 have also been demonstrated in vitro. In LPS-stimulated murine macrophages, EA 575 significantly reduced interleukin-6 (IL-6) production in a dose-dependent manner [12]. In human monocytic and epithelial cell lines, EA 575 inhibited the translocation of Nuclear Factor-kappa B (NF-κB) to the nucleus by stabilizing the NF-κB: Inhibitor of Nuclear Factor-kappa B alpha (IκBα) complex and reducing IκBα phosphorylation [13]. Since NF-kB regulates genes encoding pro-inflammatory cytokines [14], including interleukin (IL)-6, this pathway represents a key target of EA 575. Furthermore, EA 575 was shown to block adenosine receptor A2B signaling, enhancing β2-adrenergic responsiveness and reducing IL-6 production, which likely contributes to its bronchodilatory and anti-inflammatory effects [15].
The bioactive components responsible for the health benefits of ivy leaf extract are predominantly triterpene saponins, such as hederacosides A, B, and C, and α-hederin, along with polyphenols, flavonoids, alkaloids, and other constituents [16,17]. Both saponins [18] and polyphenols [19] possess anti-inflammatory properties through mechanisms like direct inhibition of pro-inflammatory cytokine production and modulation of arachidonic acid metabolism. Polyphenols also stimulate Natural Killer (NK) cells and promote anti-inflammatory cytokines [20].
Despite these findings, the effect of Helix hedera L extract on T-cell-mediated immunity remains largely unexplored. Studies of its constituents, isolated from other plants or used in purified forms, suggest potential T-cell modulatory effects [21,22]. Notably, saponins exhibit strong adjuvant activity, enhancing T-cell-mediated responses, including CD8+ cytotoxicity [23]. Polyphenols are also potent immunomodulators, but their effects depend on various factors, such as source and extraction method [24].
This study aims to investigate the immunomodulatory potential of EA 575 using an in vitro model of monocyte-derived dendritic cells (MoDCs) co-cultured with T cells. As potent antigen-presenting cells, DCs initiate and regulate T-cell-mediated immunity [25]. MoDCs, specifically “inflammatory MoDCs,” play a critical role in inflammation [26] and infection [27]. The DC/T-cell co-culture model enables the evaluation of DC differentiation, maturation, alloreactivity, Th polarization, and T regulatory cell (Treg) induction [28].
2. Materials and Methods
2.1. Characterization of EA 575® by HPLC Analysis
Ivy leaf dry extract EA 575® (DER 5-7.5:1, 30% ethanol) (Batch number 21N0160) was obtained from Engelhard Arzneimittel GmbH & Co. KG (Niederdorfelden, Germany). EA 575® (10 mg) was dissolved in 5 mL of 50% EtOH, passed through a 0.45 µm filter, and analyzed using a High-Performance Liquid Chromatography (HPLC) system (Agilent Series 1200 HPLC system, Agilent Technologies, Inc., Santa Clara, CA, USA) equipped with a YMC-Triart C18 column, 250 × 4.6 mm I.D., S-5µm, 12 nm (YMC Separation Technology, YMC Co., Ltd., Kyoto, Japan), and a photodiode array detector (200-500 nm). The mobile phases were: Solvent A: H2O/acetonitrile (44:2, v/v), pH adjusted to 2.0 with 85% phosphoric acid; Solvent B: Acetonitrile. The following linear gradient was used: 0-9 min 100% A, 9-10 min to 94% A, 10-25 min to 85% A, 25-50 min to 40% A, 50-51 min to 0% A, 51-65 min 0% A. The flow rate was 1 mL/min up to 50 min. From 51 to 65 min the flow rate was 1.5 mL/min. The analysis was performed over a detection period of 0-65 minutes at 205 nm.
Identification of constituents was performed by comparing the UV spectra of reference substances and their corresponding retention times. Chromatograms were recorded and evaluated using Agilent ChemStation Software Version B.04.01. The following ingredients were identified: protocatechuic acid, neochlorogenic acid, chlorogenic acid, cryptochlorogenic acid, rutin, kaempferol-3-O-rutinoside, 3,4-, 3,5- and 4,5 dicaffeoylquinic acid, hederacoside B, C, D and F, hederaginin-3-O-glucoside, α-, β- and δ-hederin [29].
2.2. Cell Cultures
All experiments on human cells were approved by the Ethical Board of the University of East Sarajevo, Medical Faculty Foca, and were conducted according to institutional guidelines. Peripheral blood mononuclear cells (PBMCs) were isolated from citrated venous blood taken from healthy volunteers using density gradient centrifugation on lymphocyte separation medium 1077 (PAA, Linz, Austria). Blood donors provided written informed consent in accordance with the Declaration of Helsinki. The cells from the interphase were collected, washed three times by low-speed centrifugation to remove platelets, and subjected to immunomagnetic-activated cell sorting (MACS) (Miltenyi Biotec, Bergisch Gladbach, Germany) to purify monocytes (CD14+ cells) and T (CD3+) cells. Monocytes were isolated using the Monocyte Isolation Kit II, and T cells were isolated using the Pan T cell Isolation Kit, following the manufacturer’s instructions (Miltenyi Biotec, Bergisch Gladbach, Germany). The purity of the isolated cells was approximately 92% for monocytes and 95% for T cells.
To generate immature (im) MoDCs, monocytes (density 0.5 × 10⁶/mL) were cultured for 4 days in DC culture medium (CellGenix, Freiburg, Germany) with the addition of 100 ng/mL human recombinant Granulocyte Macrohage-Colony Stimulating Factor (GM-CSF) (Novartis, Basel, Switzerland) and 25 ng/mL human recombinant IL-4 (Roche Diagnostics, Basel, Switzerland) in 6-well plates (Sarstedt, Numbrecht, Germany) with a volume of 2 mL. The culture conditions were as follows: incubator - Hereaus; temperature - 37°C; humidity - 90%; CO₂ - 5%. The 4-day culture period was sufficient to generate imMoDCs. For the generation of mMoDCs, cultures were treated with 50 ng/mL interferon-γ (IFN-γ) (R&D Systems, Minneapolis, MN, USA) and 200 ng/mL lipopolysaccharide (LPS) from Escherichia coli 0.111:B4 (Sigma-Aldrich, Darmstadt, Germany) for 24 hours. Two different concentrations of EA 575 (20 µg/mL and 100 µg/mL) were used to treat MoDCs at the start of MoDC differentiation. In the MoDC maturation experiment, EA 575 was added 4 hours prior to the application of IFN-γ/LPS, and the extract was maintained throughout the incubation period. On day 5, control and EA 575-treated im- or mMoDCs were collected by pipetting, washed twice with RPMI-1640 medium (Sigma-Aldrich, Darmstadt, Germany), counted, and used in subsequent experiments. The supernatants were collected and stored at -80°C until cytokine levels were determined. The co-cultures of MoDCs and purified T cells were described separately depending on the assay used.
2.3. Cytotoxicity Assays
Cytotoxicity of EA 575 was assessed using the MTT assay and an apoptosis/necrosis assay. Monocytes (1.5 × 10⁵/well), induced to differentiate into imMoDCs, were cultured in DC culture medium in 96-well flat-bottom plates (Sarstedt, Numbrecht, Germany) for 24 or 48 hours, either alone (control) or with different concentrations of EA 575 (12.5, 25, 50, 100, 200, and 400 µg/mL). Cultures were performed in triplicates.
MTT assay was performed as follows: In brief, the cells were incubated with MTT (3-(4,5-dimethylthiazol-2-yl)-2,5-diphenyltetrazolium bromide) for 4 hours at a concentration of 0.5 mg/mL. Cell-free cultures with corresponding EA 575 concentrations served as blank controls. After incubation, formazan crystals, which were developed in metabolically active cell cultures, were dissolved by overnight treatment with 10% (w/v) sodium dodecyl sulfate (SDS, Millipore, Burlington, MA, USA) and 0.01 N (v/v) hydrochloric acid (HCl, Sigma-Aldrich, Darmstadt, Germany). The absorbance was read at wavelengths of 670 and 570 nm using an ELx800 microplate reader (Biotek, Winooski, VT, USA). The optical density (OD) was corrected by subtracting OD 670 from OD 570. The relative metabolic activity (MTT%) in EA 575-treated cultures was determined by subtracting the blank controls from the corrected OD values. Relative values (% metabolic activity) were calculated based on the OD values of control cell cultures, which were set as 100%.
To determine whether EA 575 induces apoptosis and/or necrosis, monocytes induced to differentiate into imMoDCs were cultured for 24 or 48 hours as described above. Apoptosis was determined using an Annexin-V/Propidium Iodide (PI) staining kit (R&D Systems, Minneapolis, MN) according to the manufacturer’s instructions. Briefly, cells (2 × 10⁵/tube) were pre-treated with calcium-binding buffer, followed by staining with Annexin-V-fluorescein isothiocyanate (FITC) and PI. The stained cells were analyzed on a BD LSR II flow cytometer (BD Biosciences, Franklin Lakes, NJ, USA). Adequate compensation was performed by single-cell staining. The obtained results were analyzed offline using the FlowJo VX program (BD Biosciences, Franklin Lakes, NJ, USA). Single Annexin-V-FITC-positive cells were characterized as early apoptotic cells, double-positive cells were late apoptotic/secondary necrotic cells, and single PI-positive cells were primarily necrotic cells. Dead cells in both im- and mMoDCs cultures after the entire cultivation period (5 days) were also counted using a light microscope after staining the cells with a 1% Trypan Blue solution. Total viability (% of surviving cells in culture relative to the initial number of cells used as 100%) was determined as follows: number of viable cells at the end of the culture period (5 days) / number of initial cells at the beginning of culture × 100.
2.4. Autophagy and Reactive Oxygen Species Assays
Autophagy was analyzed by measuring autophagy flux. Monocytes, induced to differentiate into imMoDCs, were cultured with 20 or 100 µg/mL of EA 575 for 24 hours as described above. At the end of the culture period, the cells were collected, washed twice with PBS, and stained using the Muse Autophagy Kit (Luminex Corporation, Texas, United States). The kit detects a membrane-converted variant of LC3, known as LC3-II. The cells were stained either directly with an anti-LC3-II antibody or, alternatively, washed first with phosphate-buffered saline (PBS) and incubated for 4 hours in PBS with bafilomycin, according to the manufacturer’s protocol. The total expression of LC3-II was determined using a Guava Muse Cell Analyzer (Luminex). Autophagy flux was calculated as the ratio of bafilomycin-treated cells to non-treated cells in each culture.
To evaluate the production of reactive oxygen species (ROS), the Muse Oxidative Stress Kit (Luminex Corporation) was used. In brief, monocytes induced to differentiate into imMoDCs were cultured with 20 or 100 µg/mL of EA 575 for 24 hours, as described above. After 24 hours, the cells were collected, washed with PBS, and incubated with dihydroethidium (DHE) dye, which serves as a probe for ROS detection. The stained cells were analyzed using a Guava Muse Cell Analyzer (Luminex).
2.5. Alloreactivity Assay
The potential of EA 575-treated im- or mMoDCs to induce T-cell proliferation was tested using an allogeneic Mixed Leukocyte Reaction (MLR). Purified allogeneic CD3+ T cells (1 × 10⁵/well) were labeled with carboxifluorescein diacetate succinimidyl ester (CFSE) dye (Invitrogen, Waltham, MA, USA) and co-cultured with im- or mMoDCs at various MoDC/T-cell ratios (1:10 – 1:40) in complete RPMI 1640 medium, which contained RPMI 1640 medium, 10% fetal calf serum (FCS), 50 µM 2-mercaptoethanol, and antibiotics (penicillin and streptomycin, 100 U/mL; all components from Sigma-Aldrich, Darmstadt, Germany). After 4 days, the cells were collected and stained with 7-AAD (50 µg/mL) (Sigma-Aldrich, Darmstadt, Germany) to identify only viable T cells for analysis. Proliferation was determined using a flow cytometer (BD Biosciences, Franklin Lakes, NJ, USA) by CFSE dilution after excluding doublets. The acquired data were analyzed offline using FlowJo VX software (BD Biosciences, Franklin Lakes, NJ, USA).
To determine cytokine levels in the supernatants, the co-cultures were incubated with phorbol 12-myristate 13-acetate (PMA, 20 ng/mL) and ionomycin (500 ng/mL) (both from Sigma-Aldrich, Darmstadt, Germany) for 6 hours, followed by supernatant collection. To determine the intracellular expression of cytokines, parallel co-cultures were treated with monensin (2 mM, Sigma-Aldrich, Darmstadt, Germany) for 4 hours before cell harvesting.
2.6. T Helper Polarization Assay
To study Th polarization capabilities, control, and EA 575-treated mMoDCs were co-cultured with purified T cells at a 1:20 MoDC: T-cell ratio for 5 days in round-bottom 96-well plates. The culture medium used was the complete RPMI medium. After the culture period, the cells were treated with PMA and ionomycin as described above to collect either cell-free supernatants or cells. The collected cells were then processed for flow cytometry, and the supernatants were frozen at −80°C until cytokine measurement.
2.7. Induction of T Regulatory and Exhausted Cells
To induce Tregs, mMoDC/T-cell co-cultures were set up at a suboptimal 1:50 MoDC: T-cell ratio in the complete culture medium supplemented with a low dose of human recombinant IL-2 (2 ng/mL, R&D Systems, Minneapolis, MN) for 6 days. The co-cultures were then stimulated with PMA/ionomycin and monensin as described above and processed for flow cytometry analysis.
2.8. Cytokine Assays
The following interleukins (IL-12p17, IL-23, IL-27, IL-2, IL-6, IL-9, IL-10, IL-13, IL-17A, IL-21, and IL-22), tumor necrosis factor-α (TNF-α), and IFN-γ were simultaneously detected from a single sample of culture supernatant, either from MoDCs or MoDC/T-cell co-cultures, using a Flow Cytomix Microbeads Assay (BioLegend’s LEGENDplex™) according to the manufacturer’s instructions. IL-1β, IL-12p70, IL-23, IL-27, and transforming growth factor-beta (TGF-β) levels in supernatants from MoDC cultures or MoDC/T-cell co-cultures were measured using specific sandwich enzyme-linked immunosorbent assays (ELISA) (all kits from R&D Systems, Minneapolis, MN) following the manufacturer’s instructions. Cytokine levels were quantified using standard curves established with known concentrations of cytokines in the assays. Each cytokine level was normalized to the standard number of cells (3 × 10⁵ MoDCs in MoDC cultures and 1 × 10⁵ T cells in MoDC/T-cell co-cultures), as calculated following cell collection.
2.9. Flow Cytometry
Phenotypic analysis of MoDCs and T cells was performed using flow cytometry. Cells were labeled with fluorescently conjugated antibodies (Abs) and other reagents, including isotype controls for non-specific fluorescence. The following Abs and reagents were used: Bio-Rad Laboratories (Hercules, CA, USA): IgG1 negative control-PE (MCA928PE) and IgG1 negative control-FITC (MCA928F); BioLegend (Basel, Switzerland): Anti-CD1a-PerCP/Cy5.5 (HI149), anti-HLA-DR-APC/Cy7 (L234), anti-IL-4-PerCP/Cy5.5 (MP4-25D2), anti-IL-4-PE (MP4-25D2), anti-ILT-4-APC (42D1), anti-CD25-PE (BC96), anti-CD25-PerCP/Cy5.5 (M-A251), anti-IL-10-APC (JES5-16E3), anti-IL-10-PE (JES5-16E3), anti-TGF-β-APC (TW4-6H10), anti-IL-17A-Alexa Fluor 488 (BL168), anti-IFN-γ-APC (4S.B3), anti-IFN-γ-FITC (4S.B3), anti-CD83-FITC (HB15e), IgG1 negative control-PerCP/Cy5.5 (HTK888), and anti-PD-1L-PE (29E.2A3). Other reagents included monoclonal antibodies to CD3-FITC, granzyme B-APC, CD33-APC, IL-35-PerCP, PD-1-FITC, and CD69-PE; R&D Systems (Minneapolis, MN, USA): Anti-HLA-DR-PerCP (L243), anti-IDO-1-APC (700838), anti-CD4-FITC (11830), anti-CD4-APC (11830), anti-TGF-β-PE (9016); Miltenyi Biotec (Gladbach, Germany): Anti-CD14-FITC (TUK4) and anti-IL-1β-PE (rea1172); Thermo Fisher Scientific (Dreieich, Germany): Anti-CD86-PE (IT2.2), streptavidin-PerCP, streptavidin-APC, anti-ILT3-PE (ZM4.1), IgG1 negative control-APC (MA5-18093), and anti-IL-17A-APC (eBio17B7); BD Biosciences (San Diego, CA, USA): Anti-CD40-APC (5C3), anti-IL-12 (p40/p70)-PE (C11.5), anti-CD3-PE (SK7), anti-FoxP3-PerCP/Cy5.5, and anti-FoxP3-Alexa Fluor 488 (236A/E7); Elabscience (Houston, TX, USA): Anti-CD8-PerCP/Cy5.5 (HIT8a).
Cells were incubated with Abs for 30 minutes at 4°C. For intracellular staining, surface-labeled cells were fixed and permeabilized using the BioLegend Fixation and Permeabilization Kit. Flow cytometric analysis was performed using a BD LSR II flow cytometer (BD Biosciences, Franklin Lakes, NJ, USA). Signal overlap between channels was compensated using single-stained controls before each experiment. Doublets were excluded based on FSC-A/FSC-H properties. For phenotypic gating, more than 10,000 cells were analyzed per sample, and cells with low FSC-A/SSC-A properties, representing primarily dead cells, were excluded. To minimize non-specific fluorescence, appropriate isotype control antibodies, and fluorescence-minus-one (FMO) controls were used. Data were processed and analyzed using the FlowJoVX software (BD Biosciences, Franklin Lakes, NJ, USA).
2.10. Statistical Analysis
The results are presented as representative data or as mean ± SD from six independent experiments conducted with six donors. Initially, the normality of the data was tested using the Shapiro–Wilk test. Differences in mean values between control and experimental cultures were analyzed using one-way ANOVA with Dunnett’s post-test. Statistical analyses were performed using GraphPad Prism software version 8.1 (GraphPad, La Jolla, CA, USA). Values of p < 0.05 were considered statistically significant.
3. Results
3.1. Cytotoxicity of EA 575
The first set of experiments aimed to evaluate the cytotoxicity of EA 575 using monocytes at the initial stage of DC differentiation. The initial screening was performed using the MTT assay. Results presented in Figure 1A indicate that EA 575, at concentrations up to 100 µg/mL, did not significantly affect cellular metabolic activity. However, concentrations of 200 µg/mL and 400 µg/mL reduced metabolic activity (p < 0.01 and p < 0.001, respectively), indicating a cytotoxic effect at higher concentrations.
To investigate the mode of cell death, an apoptosis/necrosis assay was conducted. Figure 1B,C demonstrate that 200 µg/mL of EA 575 induced apoptosis in both cell types, with a further increase observed after 48 hours (p < 0.001). Additionally, the highest concentration slightly increased the proportion of necrotic cells after 24 hours (p < 0.01).
The highest non-cytotoxic concentration of the extract (100 µg/mL) triggered ROS production without significantly affecting autophagy (Supplementary Figure S1).
3.2. EA 575 Impairs the Differentiation of MoDCs
To study the effect of EA 575 on the differentiation of MoDCs, monocytes were treated with low (20 µg/mL) and high (100 µg/mL) non-cytotoxic concentrations of EA 575 at the beginning of MoDC differentiation. Phenotypic analysis, performed on day 5, showed a significant impairment in imMoDC differentiation, with the effect being more pronounced at the higher concentration (Figure 2A,B). This conclusion is based on the lower expression of CD1a (p < 0.01), Dectin-1 (p < 0.01), CD206 (p < 0.001), CD209 (p < 0.0001), CD86 (p < 0.001), and HLA-DR (p < 0.0001) compared to control imMoDCs. In contrast, the expression of CD40 remained unchanged, while HIF-1α expression was upregulated (p < 0.05). Additionally, CD14 was nearly completely downregulated in both control and EA 575-treated MoDCs. The expression of these markers on imMoDCs in the presence of a lower concentration of EA 575 was either not significantly different compared to the control (CD1a, Dectin-1, and HIF-1α) or less pronounced compared to the higher concentration of EA 575 for the following markers: CD206 (p < 0.05), CD209 (p < 0.001), CD86 (p < 0.05), and HLA-DR (p < 0.01).
Regarding tolerogenic markers, the expression of Programmed Death-Ligand 1 (PD-L1) and Immunoglobulin-Like Transcript 3 (ILT3) increased in a dose-dependent manner (p < 0.05 and p < 0.0001, respectively), while ILT4 expression was upregulated only in the presence of the lower concentration of EA 575 (p < 0.05). In contrast, Indoleamine 2,3-Dioxygenase 1 (IDO1) expression remained unchanged.
ImMoDCs differentiated in the presence of EA 575, similar to control imMoDCs, produced low levels of most cytokines, except IL-6, IL-8, and IL-27.
IL-27 was significantly upregulated by EA 575 at higher concentrations (p < 0.001). Conversely, the same concentration of the extract reduced the production of IL-6 (p < 0.001), IL-8 (p < 0.0001), and Tumor Necrosis Factor (TNF)-α (p < 0.0001). No significant changes were observed in the levels of Transforming Growth Factor (TGF-β), IL-12, IL-23, and IL-10 (Supplementary Table S1).
3.3. EA 575 Impairs the Phenotypic Maturation of MoDCs
Control and EA 575-treated imMoDCs, differentiated for 4 days, were induced to mature using LPS and IFN-γ, as described in the Materials and Methods section. On day 5, MoDCs were analyzed for the expression of several membrane-bound and intracellular markers. As shown in Supplementary Table S2, LPS and IFN-γ stimulation promoted the maturation of control MoDCs, evidenced by the upregulated expression of CD83 (a maturation marker), CD86 and CD40 (costimulatory molecules), and HLA-DR. Conversely, the expression of markers associated with antigen recognition (CD206 and CD209) was downregulated compared to control imMoDCs.
The maturation of MoDCs differentiated in the presence of EA 575 was significantly inhibited compared to control mMoDCs, as indicated by a decrease in the expression of nearly all markers. This effect was dose-dependent for CD83 (p < 0.001 and p < 0.0001), CD40 (p < 0.05 and p < 0.01), HLA-DR (p < 0.05 and p < 0.001), and HIF-1α (p < 0.05 and p < 0.01). No dose-dependent differences were observed for CD86 (p < 0.01) and CD209 (p < 0.01), where the effects were similar at both concentrations. The expression of CD206 and Dectin-1 was inhibited only at the higher concentration of EA 575 (p < 0.05 and p < 0.001, respectively). In contrast, the expression of CD11c, a conventional DC marker, was downregulated in a dose-dependent manner (p < 0.05 and p < 0.01, respectively) (Figure 3 and Supplementary Figure S2).
The expression of tolerogenic markers PD-L1 (p < 0.001 and p < 0.0001) and ILT3 (p < 0.05 and p < 0.001) on mMoDCs was upregulated in a dose-dependent manner in the presence of EA 575. In contrast, the expression of ILT4 (p < 0.05) and IDO1 (p < 0.05) was upregulated only at the higher concentration of EA 575 (Figure 4).
3.4. Effect of EA 575 on the Production of Cytokines by MoDCs
The production of cytokines relevant for immune response stimulation in the supernatants of mMoDC cultures, including IL-12p70 (p < 0.0001), IL-23 (p < 0.0001), IL-27 (p = 0.0001), IL-1β (p < 0.01 and p < 0.001, respectively), and TNF-α (p < 0.05 and p < 0.0001, respectively), was significantly down-regulated by EA 575 in a dose-dependent manner.
The production of IL-27 (p < 0.0001) and IL-6 (p < 0.01) was reduced only in the presence of a higher concentration of EA 575. The production of immunoregulatory cytokines IL-10 and TGF-β remained unchanged, whereas the level of IL-8 was significantly increased (p < 0.05) at the higher concentration of EA 575 (Figure 5).
A similar dose-dependent effect was observed at the intracellular level for cytokines such as IL-12p70 (p < 0.001 and p < 0.0001, respectively), IL-1β (p < 0.05 and p < 0.01, respectively), and TNF-α (p < 0.05 and p < 0.01, respectively). In contrast, the frequency of IL-10+ cells was significantly increased by both EA 575 concentrations (p < 0.001), while the expression of IL-33 and TGF-β remained unchanged (Supplementary Figure S3).
3.5. Effect of EA 575-Treated MoDCs on the Proliferation of Alloreactive T Cells
MoDCs were co-cultured with purified allogeneic T cells previously stained with the CFSE fluorescent dye at varying MoDC/T-cell ratios. After 4 days, proliferation indices were determined based on the dilution of the fluorescent dye resulting from the doubling of proliferating cell populations. The results shown in Figure 6 indicate that mMoDCs pretreated with EA 575 during differentiation induced a dose-dependent inhibition of T-cell proliferation. However, the effect was statistically significant only at MoDC/T-cell ratios of 1:10 and 1:20. As expected, imMoDCs had no effect, regardless of the concentration of the extract.
3.6. Effect of EA 575-Treated MoDCs on Th Polarization
EA 575-treated MoDCs significantly modulate Th polarization. The effect of the extract on mMoDCs pretreated with the lower concentration of EA 575 during differentiation was more pronounced, as evidenced by a decreased frequency of IFN-γ+CD4+ (Th1) cells (p < 0.01) alongside an increased frequency of IL-4+CD4+ (Th2) cells (p < 0.05) and IL-10+CD4+ T cells (p < 0.01). MoDCs pretreated with a higher concentration of EA 575 reduced the frequency of Th1 (p < 0.01) and Th17 cells (p < 0.05) without significantly affecting Th2 or IL-10+CD4+ T cells (Figure 7).
A much larger panel of cytokines was analyzed in the supernatants of mMoDC/T-cell co-cultures. As shown in Figure 8, the production of Th1 cytokines (IFN-γ) and Th1-related cytokines (IL-2 and TNF-α) was significantly downregulated by EA 575-treated mMoDCs, regardless of whether they were treated with both concentrations of EA 575 or only the lower concentration (TNF-α; p < 0.001). The pattern of Th2 cytokine production aligned with the results observed at the intracellular level. Specifically, EA 575-treated mMoDCs, pretreated with the lower concentration of the extract, increased the production of IL-4 (p < 0.05) and IL-5 (p < 0.05), while no changes were observed with the higher concentration of EA 575. Conversely, the production of IL-13 was significantly reduced with higher concentrations of EA 575 (p < 0.05), whereas lower concentrations had no significant effects. The production of Th17 cytokines (IL-17A and IL-22), Th21 cytokine (IL-21), and Th9 cytokine (IL-9) was significantly decreased in co-cultures with EA 575-treated mMoDCs, regardless of the concentration of the extract used. For IL-17A, IL-21, and IL-9, the effects were dose-dependent. Furthermore, EA 575-treated mMoDCs pretreated with the lower concentration of the extract reduced the production of IL-6 (p < 0.05) but increased IL-10 (p < 0.01).
3.7. Effect of EA 575-Treated mMoDCs on the Development of Treg Populations
mMoDCs treated with lower concentrations of EA 575 significantly increased the percentages of Treg subsets, including CD4+CD25hiFoxp3+ Tregs (p < 0.0001) and Tr1 cells (Foxp3-IL-10+) (p < 0.05), in co-culture with T cells. Additionally, the percentage of CD4+IL-35+ Tregs was also elevated (p < 0.05) with lower concentrations of EA 575. In contrast, an increase in CD4+TGF-β+ cells was observed only when MoDCs were treated with a higher concentration of EA 575 (p < 0.05) (Figure 9).
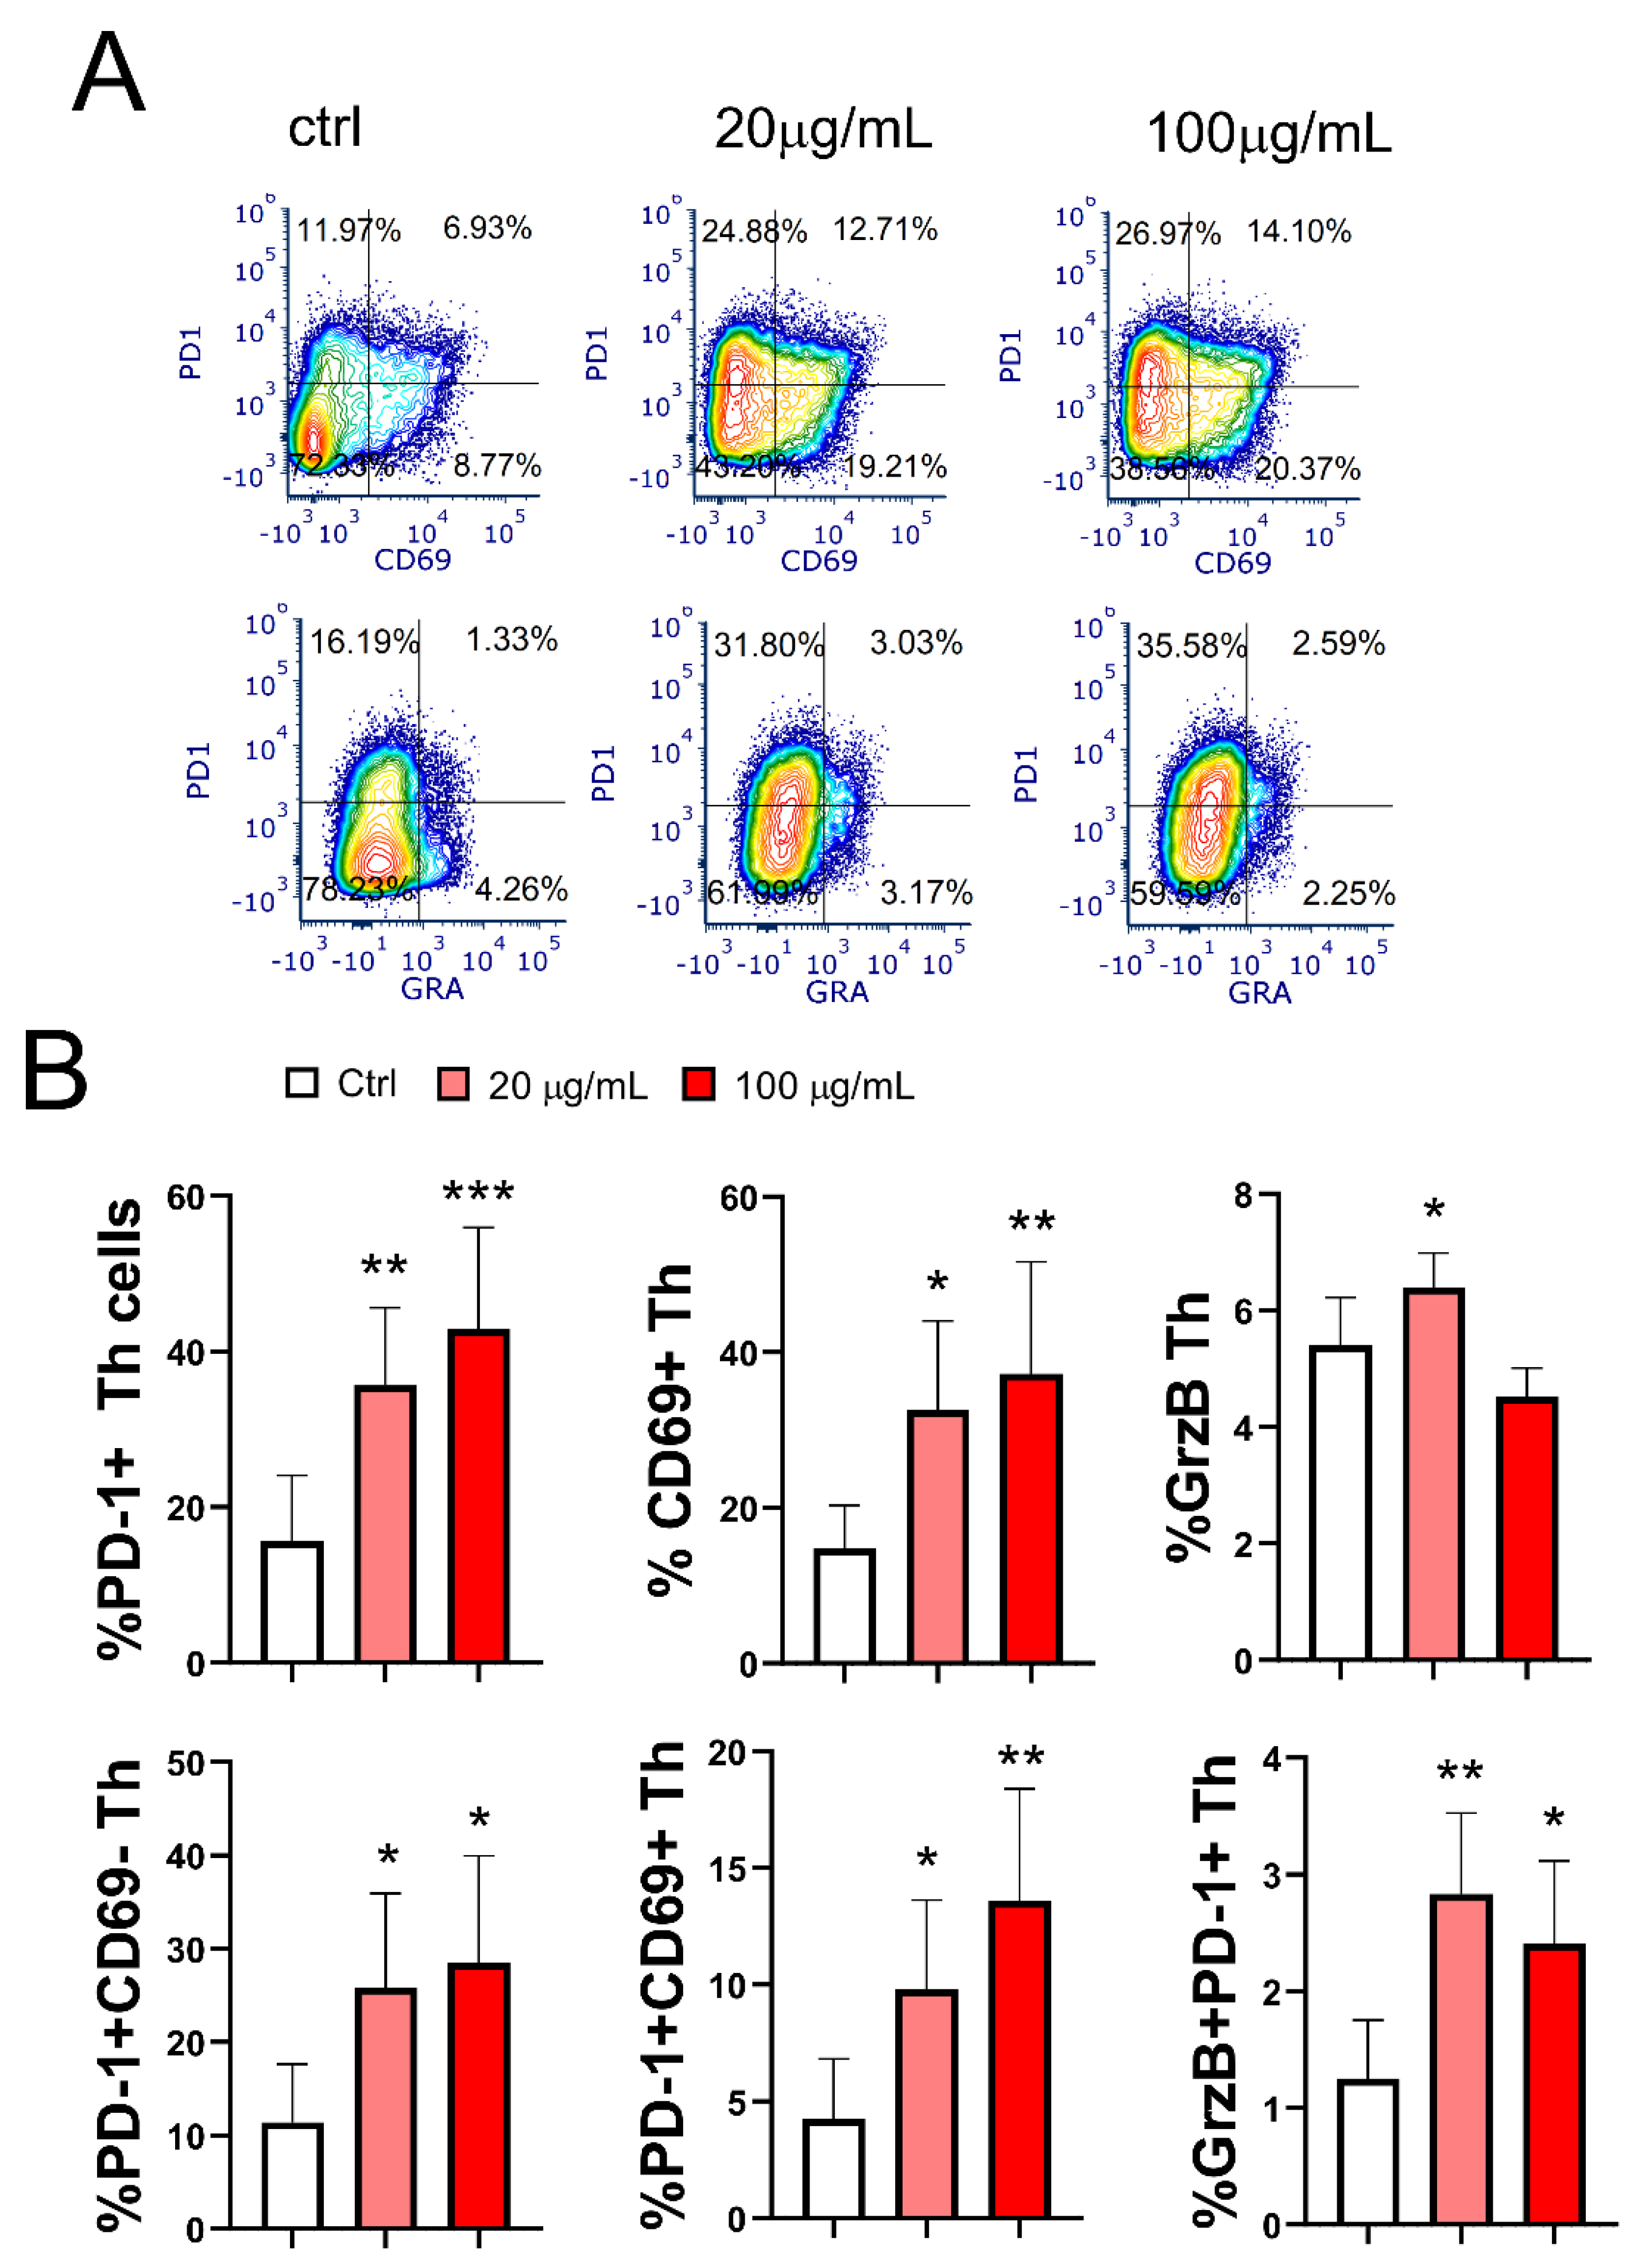
3.8. Effect of EA 575-Treated mMoDCs on the Development of Exhausted PD1+CD4+ Cells and Cytotoxic CD4+ T Cells
The final aim of this study was to investigate the effect of EA 575-treated mMoDCs on the development of hyporesponsive/exhausted Th cells. As shown in Figure 10, pretreatment of MoDCs with both concentrations of EA 575 resulted in an increased frequency of PD1+CD4+ T cells (p < 0.01 and p < 0.001, respectively) with the exhausted phenotype, and this effect was dose-dependent. The proportion of total CD69+ Th cells, as well as a subset of these cells co-expressing PD1 (CD4+PD1+CD69+ cells), followed the same expression pattern in co-culture with EA 575-treated mMoDCs (p < 0.05 and p < 0.01, respectively).
A distinct population of cytotoxic CD4+ T cells expressing granzyme B was observed in a relatively small proportion of CD4+ T cells in the control mMoDC/T-cell co-culture (5.4 ± 0.8). Interestingly, mMoDCs pretreated with a lower concentration of EA 575 increased the frequency of granzyme B+CD4+ T cells (p < 0.05). However, the frequency of a subset of these cells expressing PD1 was significantly increased in the co-culture of T cells with mMoDCs pretreated with both concentrations of EA 575 (p < 0.01 and p < 0.05, respectively).
4. Discussion
Ivy (Helix hedera L.) leaf extract contains biologically active compounds with clinical benefits, particularly in managing bronchial infections due to its potential antispasmodic, bronchodilating, and antitussive properties [1,2,5,7,30]. The anti-inflammatory potential of the extract, especially EA 575 [5], prompted an investigation into its effects on adaptive immunity. Using an in vitro co-culture system of MoDCs and T cells, we tested this hypothesis.
Initial experiments assessed the cytotoxicity of EA 575 at various concentrations. Monocytes induced to differentiate into MoDCs remained viable at concentrations up to 100 µg/mL, but higher concentrations (≥200 µg/mL) significantly reduced cell viability due to apoptosis, linked to oxidative stress. Subcytotoxic concentrations (100 µg/mL) caused oxidative stress without inducing apoptosis or autophagy. These results align with reports that higher concentrations of Hedera helix extracts induce apoptosis in normal and malignant cells via pro-oxidant activity, with effects varying by experimental conditions and extract composition [31,32,33,34,35]. As this study aimed to identify non-cytotoxic concentrations for further research, detailed mechanisms of cytotoxicity were not explored.
The first experiments examined whether EA 575 affects MoDC differentiation. Key markers of imMoDC differentiation in the presence of IL-4 and GM-CSF include downregulated CD14, upregulated CD1a, HLA-DR, co-stimulatory molecules (CD86, CD40), CD206, CD209, and Dectin 1, alongside tolerogenic markers (PD-1L, ILT3, ILT4, IDO1) [36,37,38]. Our results showed that EA 575 inhibited MoDC differentiation, reducing most differentiation and immunogenic markers (except CD40 and CD14) while upregulating tolerogenic markers (excluding IDO1) in a dose-dependent manner. EA 575-treated MoDCs displayed a tolerogenic phenotype with reduced immune-stimulatory capacity, indicating the significant impact of EA 575 on their maturation potential.
To stimulate maturation, we used LPS and IFN-γ to activate the control and EA 575-treated imMoDCs, generating Th1-polarizing dendritic cells (DCs) with strong immunostimulatory properties [39]. Mature MoDCs (mMoDCs) showed increased CD83, HLA-DR, co-stimulatory molecules (CD86, CD40), and Dectin-1, alongside reduced CD206 and CD209 [28]. They also produced IL-12, IL-23, IL-27, IL-1β, and TNF-α, consistent with robust immune activation [40,41,42].
EA 575 inhibited mMoDC phenotypic and functional maturation in a dose-dependent manner, reducing HLA-DR, CD83, co-stimulatory molecules, and antigen uptake markers (Dectin-1, CD206, CD209). The reduced expression of co-stimulatory molecules was consistent with a diminished allostimulatory potential, as reflected by a decreased proliferation of allogeneic T cells in co-culture with EA 575-treated mMoDCs.
The explanation for the downregulation of other markers is more complex. Dectin-1, crucial for DC maturation, likely represents an additional target of EA 575’s suppressive effect [43]. Reduced CD206, involved in antigen processing and tolerance, and CD209, key for pathogen recognition and DC/T-cell interactions, further contributed to decreased pro-inflammatory and immune responses [44,45,46].
MoDC maturation relies on glycolysis activation via the Phosphatidylinositol 3-kinase/Akt/Mechanistic Target of Rapamycin (PI3K/Akt/mTOR) pathway and p38 Mitogen-Activated Protein Kinase (MAPK), Extracellular Signal-Regulated Kinases 1 and 2 (ERK1/2), and Signal Transducer and Activator of Transcription 3 (STAT3) signaling, antagonized by AMP-Activated Protein Kinase (AMPK), which promotes oxidative phosphorylation via Peroxisome Proliferator-Activated Receptor Gamma (PPARγ) [47,48]. EA 575 components likely interfere with this metabolic switch. Flavonoids, such as rutin, a dominant EA 575 polyphenol, suppress mTOR activity and target Phosphatidylinositol 3-Kinase (PI3K), MAPK, and NF-κB pathways [49,50,51].
Saponins in EA 575, including α-hederin and hederacoside C, modulate signaling pathways like PI3K/Akt/mTOR, MAPK, and AMPK. α-Hederin induces autophagic cell death via ROS-dependent AMPK/mTOR signaling, while hederacoside C inhibits MAPK and NF-κB pathway components [52,53,54,55]. Although the effects of Hedera helix extract and its components on DCs remain unexplored, it is reasonable to postulate that most of these signaling pathways are involved.
MoDCs treated with EA 575 and matured with LPS/IFN-γ remain semimature, as indicated by their phenotypic markers and reduced ability to stimulate T-cell proliferation. Despite this, these cells modulate Th polarization, inhibiting Th1, Th17, Th9, and Th21 responses in a generally dose-dependent manner. These effects correlate with decreased production of IL-12, IL-23, and IL-27, key cytokines for Th1 and Th17 responses. These findings are particularly significant, as the Th1, Th17, and Th21 immune responses are linked to chronic inflammation, including autoimmune disorders and obesity-induced asthma. In addition, Th9 cells have a key role in the development of allergic airway inflammation [56,57]. By mitigating these T-cell-mediated immune activities, EA 575 emerges as a promising therapeutic candidate.
The explanation of the effect of EA 575-treated MoDCs on the Th2 response, primarily involved in defense against helminthic infections, humoral immunity, and the pathogenesis of allergic diseases such as asthma [58], is more complex. MoDCs treated with lower extract concentrations enhanced the Th2 response, evidenced by increased IL-4 and IL-5 production, whereas higher concentrations suppressed IL-13. This shift may result from the suppression of Th1 and Th17 responses or the activation of genes favoring Th2 differentiation [59]. However, the implications of these findings for atopic asthma remain unclear. In this context, further studies using alternative in vitro immunological models are necessary before proceeding to clinical trials.
Lower concentrations of EA 575 also reduced IL-6 and TNF-α in co-cultures, consistent with previous studies on EA 575’s anti-inflammatory effects [9,10,11,12,13,55]. Hederacoside C, a dominant saponin in EA 575, downregulates IL-6, IL-1β, and TNF-α expression while upregulating IL-10. Rutin inhibits TNF-α, IL-6, IL-1β, and cyclooxygenase-2 via NF-κB/MAPK suppression, while chlorogenic acid and dicaffeoylquinic acids reduce inflammation and oxidative stress through similar mechanisms [60,61,62].
Another very important phenomenon that arose from this study is related to the development of tolerogenic DCs in the presence of EA 575. Tolerogenic DCs expressed numerous inhibitory markers including PD-L1, ILT3, ILT4, and IDO1 (evaluated in this study), as well as Inducible Costimulator Ligand (ICOS-L) and Cytotoxic T Lymphocyte Antigen 4 (CTLA-4). Additionally, tolerogenic DCs produce immunoregulatory cytokines IL-10 and TGF-β [63]. Our results showed that EA 575 up-regulated PD-L1, ILT3, and ILT4 expression on both imMoDCs and mMoDCs, mainly in a dose-dependent manner. A lower extract concentration also up-regulated IDO1 expression in mMoDCs.
The expression of PD-1L and its receptor PD-1 is a physiological process that controls immune responses and inflammation, thereby protecting normal tissue from damage [64]. Increased ILT3 and ILT4 expression on DCs signifies heightened tolerogenic properties [65], with ILT3 being particularly critical for inducing CD4+ Foxp3+ Tregs [66]. The coordinated expression of tolerogenic markers is closely interconnected. For example, tryptophan catabolism via IDO activity induces T-cell nonresponsiveness and tolerance while simultaneously upregulating ILT3 and ILT4 on DCs [67]. Furthermore, the increased expression of IDO1 in DCs is mediated by CTLA-4 [68].
A key function of tolerogenic DCs is the induction of Tregs. Our study showed that mMoDCs treated with lower EA 575 concentrations during differentiation induced classical Treg subsets (CD4+CD25hiFoxP3+), Tr1 cells (CD4+IL-10+FoxP3-), and CD4+IL-35+ Tregs in mMoDC/T-cell co-cultures. These findings correlated with increased IL-10 levels in co-culture supernatants, representing novel observations. Treg subsets differ but act collectively to maintain immune homeostasis. FoxP3+ Tregs inhibit effector Th1, Th2, and Th17 responses depending on involved ligands and transcription factors, contributing to self-tolerance [69]. Tr1 cells, through high IL-10 production, dominantly mediate peripheral tolerance [70], while IL-35+ Tregs secrete IL-35, an immunosuppressive cytokine crucial for their induction and regulatory effects [70,71,72].
Some other findings may relate to the development of tolerogenic DCs by EA 575. For instance, increased CD11c expression by EA 575-MoDCs, observed in our study, has been reported in tolerogenic intestinal DCs in coeliac disease patients [73]. However, this contrasts with the reduced HIF-1α expression by EA 575-MoDCs. HIF-1α regulates immune checkpoint molecules such as PD-L1 and CD73 [74] and is relevant for DCs, as IL-10 production correlates with HIF-1α expression [75].
Initially identified as an early T-cell activation marker, CD69 exhibits both immunosuppressive and pro-inflammatory effects, depending on its interaction with specific ligands such as Gal-1, calprotectin (S100A8/S100A9), Myl9/12, or ox-LDL [76]. CD69 binding to Gal-1 on DCs induces IL-10+ T cells with anti-inflammatory properties [76], while its interaction with Myl9/12 recruits activated T cells to inflamed lungs in asthma [77].
PD-1, another T-cell activation molecule, balances immunity and tolerance. Expressed by Tregs and other immune cells, PD-1 inhibits effector T-cell activation during prolonged antigen stimulation, preventing self-reactive responses [78]. Sustained PD-1 expression drives T-cell exhaustion, characterized by reduced cytokine production and increased inhibitory receptor expression [79,80,81,82]. In our model, EA 575-treated MoDCs increased CD69 and PD-1 expression on CD4+ T cells, elevating the frequency of PD1+CD69+ and PD1+CD69- CD4+ T cells. Additionally, these MoDCs increased the frequency of CD4+Granzyme B+ cells, a subset of cytotoxic CD4+ T cells that may enhance anti-tumor immunity [83]. However, the elevated expression of PD1 on these cells suggests potential exhaustion. Although the increased PD1 expression on these T cell subsets implies hypofunctional properties, the exact role of exhausted T cells in limiting immune responses remains to be elucidated.
Cumulatively, our results significantly expand the understanding of the biological and immunological effects of Hedera helix extract, especially EA 575, one of the most standardized and clinically validated extracts. While the study has limitations, such as not investigating CD8+ T cells and not exploring further mechanisms due to the extract’s mixed components, it opens exciting avenues for future research. This includes designing immunological protocols for clinical studies, particularly in chronic lung diseases, where EA 575 is prominently used, including autoimmune-related conditions.
5. Conclusions
This study demonstrates for the first time that EA 575, a dry extract of ivy leaf, is a potent immunomodulator. The extract modulates T-cell immune responses through complex mechanisms involving DCs. EA 575 inhibits the differentiation and maturation of MoDCs, leading to the acquisition of tolerogenic properties. MoDCs treated with EA 575 decrease the production of immunogenic cytokines (e.g., IL-12 family) and reduce T-cell proliferation. Additionally, they inhibit Th1, Th17, Th9, Th21, and pro-inflammatory immune responses. The Th2 response is modulated depending on the specific Th2 cytokine and EA 575 concentration. These immunomodulatory effects are linked to the induction of various subsets of tolerogenic and exhausted Th cells. Lower concentrations of EA 575 are more immunomodulatory, while higher concentrations are more anti-inflammatory. These findings shed light on the immunological activity of EA 575, providing insights into the beneficial effects of Hedera helix leaf extract in chronic lung diseases. Moreover, they highlight that EA 575’s activation of immunoregulatory mechanisms may help prevent excessive immune activation, limit inflammation and tissue damage, and maintain immune homeostasis.
Supplementary Materials
The following supporting information can be downloaded at: Preprints.org.
Author Contributions
Conceptualization: M.Č., D.B. and H. H.; Data curation: M.B., S. T., L.P.; Formal analysis: M.Č., M.B., S.T. and D.B.; Funding acquisition: M.Č., H.H., A.R., S.M. and D.B.; Investigation: M.Č., M.B., A.D. and S.T. Methodology: M.B., S.T. and M.Č.; Project administration: M.Č.; Software: S.T., S.M. Supervision: M.Č. D.B.; Writing—original draft preparation: M.Č. Writing—review, and editing: H.H., A.R. and M.Č. All authors have read and agreed to the published version of the manuscript.
Funding
This study was supported by the University of East Sarajevo, Medical Faculty Foča, Foča, Bosnia and Herzegovina, (project UIS/MFF: I.1.20-22), Serbian Academy of Sciences and Arts, Belgrade, Serbia (Project F 115) and a research grant of Engelhard Arzneimittel GmbH & Co. KG, 61138 Niederdorfelden, Germany.
Institutional Review Board Statement
The study was conducted in accordance with the Declaration of Helsinki, and the protocol was approved by the Ethics Committee of Medical Faculty Foča (permission number: 01-2-36/1/2024).
Informed Consent Statement
Informed consent was obtained from all subjects involved in the study.
Data Availability Statement
All data are included in this article.
Acknowledgments
The authors would like to thank Dušan Mihajlović and Vanja Mališ (Faculty of Medicine, Foča) for their assistance with certain methodological aspects. Yuliya Ilieva (Engelhard Arzneimittel GmbH & Co.) is gratefully acknowledged for reviewing the manuscript and providing helpful suggestions.
Conflicts of Interest
The authors declare no conflict of interest. The funders had no role in the design of the study; in the collection, analyses, or interpretation of data; in the writing of the manuscript, or in the decision to publish the results.
References
- Fazio, S.; Pouso, J.; Dolinsky, D.; Fernandez, A.; Hernandez, M.; Clavier, G.; Hecker, M. Tolerance, safety and efficacy of Hedera helix extract in inflammatory bronchial diseases under clinical practice conditions: a prospective, open, multicentre postmarketing study in 9657 patients. Phytomedicine 2009, 16, 17–24. [Google Scholar] [CrossRef] [PubMed]
- Cwientzek, U.; Ottillinger, B.; Arenberger, P. Acute bronchitis therapy with ivy leaves extracts in a two-arm study. A double-blind, randomised study vs. an other ivy leaves extract. Phytomedicine, 2011, 18, 1105-9. [CrossRef]
- Schaefer, A.; Kehr, M. S.; Giannetti, B. M.; Bulitta, M.; Staiger, C. A randomized, controlled, double-blind, multi-center trial to evaluate the efficacy and safety of a liquid containing ivy leaves dry extract (EA 575((R))) vs. placebo in the treatment of adults with acute cough. Pharmazie 2016, 71, 504–509. [Google Scholar] [PubMed]
- Schaefer, A.; Ludwig, F.; Giannetti, B. M.; Bulitta, M.; Wacker, A. Efficacy of two dosing schemes of a liquid containing ivy leaves dry extract EA 575 versus placebo in the treatment of acute bronchitis in adults. ERJ Open Res 2019, 5. [Google Scholar] [CrossRef]
- Lang, C.; Rottger-Luer, P.; Staiger, C. A Valuable Option for the Treatment of Respiratory Diseases: Review on the Clinical Evidence of the Ivy Leaves Dry Extract EA 575(R). Planta Med 2015, 81, 968–74. [Google Scholar] [CrossRef] [PubMed]
- Seifert, G.; Upstone, L.; Watling, C. P.; Vogelberg, C. Ivy leaf dry extract EA 575 for the treatment of acute and chronic cough in pediatric patients: review and expert survey. Curr Med Res Opin 2023, 39, 1407–1417. [Google Scholar] [CrossRef]
- Völp, A.; Schmitz, J.; Bulitta, M.; Raskopf, E.; Acikel, C.; Mosges, R. Ivy leaves extract EA 575 in the treatment of cough during acute respiratory tract infections: meta-analysis of double-blind, randomized, placebo-controlled trials. Sci Rep 2022, 12, 20041. [Google Scholar] [CrossRef]
- Stauss-Grabo, M.; Atiye, S.; Warnke, A.; Wedemeyer, R. S.; Donath, F.; Blume, H. H. Observational study on the tolerability and safety of film-coated tablets containing ivy extract (Prospan(R) Cough Tablets) in the treatment of colds accompanied by coughing. Phytomedicine 2011, 18, 433–6. [Google Scholar] [CrossRef]
- Hocaoglu, A. B.; Karaman, O.; Erge, D. O.; Erbil, G.; Yilmaz, O.; Kivcak, B.; Bagriyanik, H. A.; Uzuner, N. Effect of Hedera helix on lung histopathology in chronic asthma. Iran J Allergy Asthma Immunol 2012, 11, 316–23. [Google Scholar]
- Suleyman, H.; Mshvildadze, V.; Gepdiremen, A.; Elias, R. Acute and chronic antiinflammatory profile of the ivy plant, Hedera helix, in rats. Phytomedicine 2003, 10, 370–4. [Google Scholar] [CrossRef]
- Shokry, A. A.; El-Shiekh, R. A.; Kamel, G.; Bakr, A. F.; Ramadan, A. Bioactive phenolics fraction of Hedera helix L. (Common Ivy Leaf) standardized extract ameliorates LPS-induced acute lung injury in the mouse model through the inhibition of proinflammatory cytokines and oxidative stress. Heliyon, 2022, 8, e09477. [CrossRef]
- Schulte-Michels, J.; Runkel, F.; Gokorsch, S.; Häberlein, H. Ivy leaves dry extract EA 575(R) decreases LPS-induced IL-6 release from murine macrophages. Pharmazie 2016, 71, 158–61. [Google Scholar]
- Schulte-Michels, J.; Keksel, C.; Häberlein, H.; Franken, S. Anti-inflammatory effects of ivy leaves dry extract: influence on transcriptional activity of NF-kappaB. Inflammopharmacology 2019, 27, 339–347. [Google Scholar] [CrossRef] [PubMed]
- Liu, T.; Zhang, L.; Joo, D.; Sun, S. C. NF-kappaB signaling in inflammation. Signal Transduct Target Ther 2017, 2, 17023. [Google Scholar] [CrossRef] [PubMed]
- Meurer, F.; Häberlein, H.; Franken, S. Ivy Leaf Dry Extract EA 575((R)) Has an Inhibitory Effect on the Signalling Cascade of Adenosine Receptor A(2B). Int J Mol Sci 2023, 24. [Google Scholar]
- Hänsel, R.; Keller, K.; Rimpler, H.; Schneider, G. , Drogen EO. In Berlin: Springer-Verlag: 1993.
- Lutsenko, Y.; Bylka, W.; Matlawska, I.; Darmohray, R. Hedera helix as a medicinal plant. Herba Polonica 2010, 56, 83–96. [Google Scholar]
- Passos, F. R. S.; Araujo-Filho, H. G.; Monteiro, B. S.; Shanmugam, S.; Araujo, A. A. S.; Almeida, J.; Thangaraj, P.; Junior, L. J. Q.; Quintans, J. S. S. Anti-inflammatory and modulatory effects of steroidal saponins and sapogenins on cytokines: A review of pre-clinical research. Phytomedicine 2022, 96, 153842. [Google Scholar] [CrossRef]
- Hussain, T.; Tan, B.; Yin, Y.; Blachier, F.; Tossou, M. C.; Rahu, N. Oxidative Stress and Inflammation: What Polyphenols Can Do for Us? Oxid Med Cell Longev 2016, 2016, 7432797. [Google Scholar] [CrossRef]
- Mamun, M. A. A.; Rakib, A.; Mandal, M.; Kumar, S.; Singla, B.; Singh, U. P. Polyphenols: Role in Modulating Immune Function and Obesity. Biomolecules 2024, 14. [Google Scholar] [CrossRef]
- Focaccetti, C.; Izzi, V.; Benvenuto, M.; Fazi, S.; Ciuffa, S.; Giganti, M. G.; Potenza, V.; Manzari, V.; Modesti, A.; Bei, R. Polyphenols as Immunomodulatory Compounds in the Tumor Microenvironment: Friends or Foes? Int J Mol Sci 2019, 20. [Google Scholar] [CrossRef]
- Lasso, P.; Gomez-Cadena, A.; Uruena, C.; Donda, A.; Martinez-Usatorre, A.; Barreto, A.; Romero, P.; Fiorentino, S. Prophylactic vs. Therapeutic Treatment With P2Et Polyphenol-Rich Extract Has Opposite Effects on Tumor Growth. Front Oncol, 2018, 8, 356. [CrossRef]
- Rajput, Z. I.; Hu, S. H.; Xiao, C. W.; Arijo, A. G. Adjuvant effects of saponins on animal immune responses. J Zhejiang Univ Sci B 2007, 8, 153–61. [Google Scholar] [CrossRef]
- de Carvalho, J. T. G.; Da Silva Baldivia, D.; de Castro, D. T. H.; Dos Santos, H. F.; Dos Santos, C. M.; Oliveira, A. S.; Alfredo, T. M.; Vilharva, K. N.; de Picoli Souza, K.; Dos Santos, E. L. The immunoregulatory function of polyphenols: implications in cancer immunity. J Nutr Biochem 2020, 85, 108428. [Google Scholar] [CrossRef]
- Eisenbarth, S. C. Dendritic cell subsets in T cell programming: location dictates function. Nat Rev Immunol 2019, 19, 89–103. [Google Scholar] [CrossRef] [PubMed]
- Randolph, G. J.; Inaba, K.; Robbiani, D. F.; Steinman, R. M.; Muller, W. A. Differentiation of phagocytic monocytes into lymph node dendritic cells in vivo. Immunity 1999, 11, 753–61. [Google Scholar] [CrossRef] [PubMed]
- Leon, B.; Lopez-Bravo, M.; Ardavin, C. Monocyte-derived dendritic cells formed at the infection site control the induction of protective T helper 1 responses against Leishmania. Immunity 2007, 26, 519–31. [Google Scholar] [CrossRef]
- Collin, M.; Bigley, V. Human dendritic cell subsets: an update. Immunology. [CrossRef]
- Greunke, C.; Hage-Hülsmann, A.; Sorkalla, T.; Keksel, N.; Häberlein, F.; Häberlein, H. A systematic study on the influence of the main ingredients of an ivy leaves dry extract on the β₂-adrenergic responsiveness of human airway smooth muscle cells. Pulm. Pharmacol. Ther. 2015, 31, 92–98. [Google Scholar] [CrossRef]
- Sierocinski, E.; Holzinger, F.; Chenot, J. F. Ivy leaf (Hedera helix) for acute upper respiratory tract infections: an updated systematic review. Eur J Clin Pharmacol 2021, 77, 1113–1122. [Google Scholar] [CrossRef]
- Yenigün, V. B.; Kocyigit, A.; Kanımdan, E.; Durmus, E.; Koktasoglu, F. Hedera helix (Wall Ivy) leaf ethanol extract shows cytotoxic and apoptotic effects in glioblastoma cells by generating reactive oxygen species. Acta Medica 2023, 54, 295–303. [Google Scholar] [CrossRef]
- Liu, B. X.; Zhou, J. Y.; Li, Y.; Zou, X.; Wu, J.; Gu, J. F.; Yuan, J. R.; Zhao, B. J.; Feng, L.; Jia, X. B.; Wang, R. P. Hederagenin from the leaves of ivy (Hedera helix L.) induces apoptosis in human LoVo colon cells through the mitochondrial pathway. BMC Complement Altern Med. [CrossRef]
- Kim, E. H.; Baek, S.; Shin, D.; Lee, J.; Roh, J. L. Hederagenin Induces Apoptosis in Cisplatin-Resistant Head and Neck Cancer Cells by Inhibiting the Nrf2-ARE Antioxidant Pathway. Oxid Med Cell Longev 2017, 2017, 5498908. [Google Scholar] [CrossRef]
- Gulcin, I.; Mshvildadze, V.; Gepdiremen, A.; Elias, R. Antioxidant activity of saponins isolated from ivy: alpha-hederin, hederasaponin-C, hederacolchiside-E and hederacolchiside-F. Planta Med 2004, 70, 561–3. [Google Scholar] [CrossRef]
- Mba Gachou, C.; Laget, M.; Guiraud-Dauriac, H.; De Meo, M.; Elias, R.; Dumenil, G. The protective activity of alpha-hederine against H2O2 genotoxicity in HepG2 cells by alkaline comet assay. Mutat Res 1999, 445, 9–20. [Google Scholar] [CrossRef]
- Cabeza-Cabrerizo, M.; Cardoso, A.; Minutti, C. M.; Pereira da Costa, M.; Reis e Sousa, C. Dendritic Cells Revisited. Annu Rev Immunol 2021, 39, 131–166. [Google Scholar] [CrossRef]
- Gieseler, R.; Heise, D.; Soruri, A.; Schwartz, P.; Peters, J. H. In-vitro differentiation of mature dendritic cells from human blood monocytes. Dev Immunol 1998, 6, 25–39. [Google Scholar] [CrossRef] [PubMed]
- Takenaka, M. C.; Quintana, F. J. Tolerogenic dendritic cells. Semin Immunopathol 2017, 39, 113–120. [Google Scholar] [CrossRef] [PubMed]
- Han, T. H.; Jin, P.; Ren, J.; Slezak, S.; Marincola, F. M.; Stroncek, D. F. Evaluation of 3 clinical dendritic cell maturation protocols containing lipopolysaccharide and interferon-gamma. J Immunother 2009, 32, 399–407. [Google Scholar] [CrossRef]
- Gee, K.; Guzzo, C.; Che Mat, N. F.; Ma, W.; Kumar, A. The IL-12 family of cytokines in infection, inflammation and autoimmune disorders. Inflamm Allergy Drug Targets 2009, 8, 40–52. [Google Scholar] [CrossRef]
- Tait Wojno, E. D.; Hunter, C. A.; Stumhofer, J. S. The Immunobiology of the Interleukin-12 Family: Room for Discovery. Immunity 2019, 50, 851–870. [Google Scholar] [CrossRef]
- Kim, M. K.; Kim, J. Properties of immature and mature dendritic cells: phenotype, morphology, phagocytosis, and migration. RSC Adv 2019, 9, 11230–11238. [Google Scholar] [CrossRef]
- Ren, A.; Li, Z.; Zhang, X.; Deng, R.; Ma, Y. Inhibition of Dectin-1 on Dendritic Cells Prevents Maturation and Prolongs Murine Islet Allograft Survival. J Inflamm Res 2021, 14, 63–73. [Google Scholar] [CrossRef]
- van der Zande, H. J. P.; Nitsche, D.; Schlautmann, L.; Guigas, B.; Burgdorf, S. The Mannose Receptor: From Endocytic Receptor and Biomarker to Regulator of (Meta)Inflammation. Front Immunol 2021, 12, 765034. [Google Scholar] [CrossRef]
- Relloso, M.; Puig-Kroger, A.; Pello, O. M.; Rodriguez-Fernandez, J. L.; de la Rosa, G.; Longo, N.; Navarro, J.; Munoz-Fernandez, M. A.; Sanchez-Mateos, P.; Corbi, A. L. DC-SIGN (CD209) expression is IL-4 dependent and is negatively regulated by IFN, TGF-beta, and anti-inflammatory agents. J Immunol 2002, 168, 2634–43. [Google Scholar] [CrossRef]
- Labiod, N.; Luczkowiak, J.; Tapia, M. M.; Lasala, F.; Delgado, R. The role of DC-SIGN as a trans-receptor in infection by MERS-CoV. Front Cell Infect Microbiol 2023, 13, 1177270. [Google Scholar] [CrossRef]
- Adamik, J.; Munson, P. V.; Hartmann, F. J.; Combes, A. J.; Pierre, P.; Krummel, M. F.; Bendall, S. C.; Arguello, R. J.; Butterfield, L. H. Distinct metabolic states guide maturation of inflammatory and tolerogenic dendritic cells. Nat Commun 2022, 13, 5184. [Google Scholar] [CrossRef]
- Krawczyk, C. M.; Holowka, T.; Sun, J.; Blagih, J.; Amiel, E.; DeBerardinis, R. J.; Cross, J. R.; Jung, E.; Thompson, C. B.; Jones, R. G.; Pearce, E. J. Toll-like receptor-induced changes in glycolytic metabolism regulate dendritic cell activation. Blood 2010, 115, 4742–9. [Google Scholar] [CrossRef] [PubMed]
- Hosseinzade, A.; Sadeghi, O.; Naghdipour Biregani, A.; Soukhtehzari, S.; Brandt, G. S.; Esmaillzadeh, A. Immunomodulatory Effects of Flavonoids: Possible Induction of T CD4+ Regulatory Cells Through Suppression of mTOR Pathway Signaling Activity. Front Immunol 2019, 10, 51. [Google Scholar] [CrossRef] [PubMed]
- Pandey, P.; Khan, F.; Qari, H. A.; Oves, M. Rutin (Bioflavonoid) as Cell Signaling Pathway Modulator: Prospects in Treatment and Chemoprevention. Pharmaceuticals (Basel) 2021, 14. [Google Scholar] [CrossRef]
- Thiyagarajan, V.; Lee, K. W.; Leong, M. K.; Weng, C. F. Potential natural mTOR inhibitors screened by in silico approach and suppress hepatic stellate cells activation. J Biomol Struct Dyn 2018, 36, 4220–4234. [Google Scholar] [CrossRef] [PubMed]
- Zhu, M.; Sun, Y.; Bai, H.; Wang, Y.; Yang, B.; Wang, Q.; Kuang, H. Effects of saponins from Chinese herbal medicines on signal transduction pathways in cancer: A review. Front Pharmacol 2023, 14, 1159985. [Google Scholar] [CrossRef]
- Xiang, Y. C.; Shen, J.; Si, Y.; Liu, X. W.; Zhang, L.; Wen, J.; Zhang, T.; Yu, Q. Q.; Lu, J. F.; Xiang, K.; Liu, Y. Paris saponin VII, a direct activator of AMPK, induces autophagy and exhibits therapeutic potential in non-small-cell lung cancer. Chin J Nat Med 2021, 19, 195–204. [Google Scholar] [CrossRef]
- Sun, J.; Feng, Y.; Wang, Y.; Ji, Q.; Cai, G.; Shi, L.; Wang, Y.; Huang, Y.; Zhang, J.; Li, Q. alpha-hederin induces autophagic cell death in colorectal cancer cells through reactive oxygen species dependent AMPK/mTOR signaling pathway activation. Int J Oncol 2019, 54, 1601–1612. [Google Scholar] [CrossRef]
- Akhtar, M.; Shaukat, A.; Zahoor, A.; Chen, Y.; Wang, Y.; Yang, M.; Umar, T.; Guo, M.; Deng, G. Anti-inflammatory effects of Hederacoside-C on Staphylococcus aureus induced inflammation via TLRs and their downstream signal pathway in vivo and in vitro. Microb Pathog 2019, 137, 103767. [Google Scholar] [CrossRef]
- Raphael, I.; Nalawade, S.; Eagar, T. N.; Forsthuber, T. G. T cell subsets and their signature cytokines in autoimmune and inflammatory diseases. Cytokine 2015, 74, 5–17. [Google Scholar] [CrossRef]
- Zielinski, C. E. T hel per cell subsets: diversification of the field. Eur J Immunol 2023, 53, e2250218. [Google Scholar] [CrossRef] [PubMed]
- Walker, J. A.; McKenzie, A. N. J. T(H)2 cell development and function. Nat Rev Immunol 2018, 18, 121–133. [Google Scholar] [CrossRef] [PubMed]
- Brogdon, J. L.; Xu, Y.; Szabo, S. J.; An, S.; Buxton, F.; Cohen, D.; Huang, Q. Histone deacetylase activities are required for innate immune cell control of Th1 but not Th2 effector cell function. Blood 2007, 109, 1123–30. [Google Scholar] [CrossRef] [PubMed]
- Zhang, X.; Huang, H.; Yang, T.; Ye, Y.; Shan, J.; Yin, Z.; Luo, L. Chlorogenic acid protects mice against lipopolysaccharide-induced acute lung injury. Injury 2010, 41, 746–52. [Google Scholar] [CrossRef]
- Jang, G.; Lee, S.; Hong, J.; Park, B.; Kim, D.; Kim, C. Anti-Inflammatory Effect of 4,5-Dicaffeoylquinic Acid on RAW264.7 Cells and a Rat Model of Inflammation. Nutrients 2021, 13. [Google Scholar] [CrossRef]
- Han, E. H.; Kim, J. Y.; Kim, H. G.; Chun, H. K.; Chung, Y. C.; Jeong, H. G. Inhibitory effect of 3-caffeoyl-4-dicaffeoylquinic acid from Salicornia herbacea against phorbol ester-induced cyclooxygenase-2 expression in macrophages. Chem Biol Interact 2010, 183, 397–404. [Google Scholar] [CrossRef]
- Morante-Palacios, O.; Fondelli, F.; Ballestar, E.; Martinez-Caceres, E. M. Tolerogenic Dendritic Cells in Autoimmunity and Inflammatory Diseases. Trends Immunol 2021, 42, 59–75. [Google Scholar] [CrossRef]
- Alsaab, H. O.; Sau, S.; Alzhrani, R.; Tatiparti, K.; Bhise, K.; Kashaw, S. K.; Iyer, A. K. PD-1 and PD-L1 Checkpoint Signaling Inhibition for Cancer Immunotherapy: Mechanism, Combinations, and Clinical Outcome. Front Pharmacol 2017, 8, 561. [Google Scholar] [CrossRef]
- Ravetch, J. V.; Lanier, L. L. Immune inhibitory receptors. Science 2000, 290, 84–9. [Google Scholar] [CrossRef]
- Suciu-Foca, N.; Cortesini, R. Central role of ILT3 in the T suppressor cell cascade. Cell Immunol 2007, 248, 59–67. [Google Scholar] [CrossRef]
- Brenk, M.; Scheler, M.; Koch, S.; Neumann, J.; Takikawa, O.; Hacker, G.; Bieber, T.; von Bubnoff, D. Tryptophan deprivation induces inhibitory receptors ILT3 and ILT4 on dendritic cells favoring the induction of human CD4+CD25+ Foxp3+ T regulatory cells. J Immunol 2009, 183, 145–54. [Google Scholar] [CrossRef] [PubMed]
- Fallarino, F.; Grohmann, U.; Hwang, K. W.; Orabona, C.; Vacca, C.; Bianchi, R.; Belladonna, M. L.; Fioretti, M. C.; Alegre, M. L.; Puccetti, P. Modulation of tryptophan catabolism by regulatory T cells. Nat Immunol 2003, 4, 1206–12. [Google Scholar] [CrossRef] [PubMed]
- Shevyrev, D.; Tereshchenko, V. Treg Heterogeneity, Function, and Homeostasis. Front Immunol 2019, 10, 3100. [Google Scholar] [CrossRef]
- Freeborn, R. A.; Strubbe, S.; Roncarolo, M. G. Type 1 regulatory T cell-mediated tolerance in health and disease. Front Immunol 2022, 13, 1032575. [Google Scholar] [CrossRef] [PubMed]
- Ye, C.; Yano, H.; Workman, C. J.; Vignali, D. A. A. Interleukin-35: Structure, Function and Its Impact on Immune-Related Diseases. J Interferon Cytokine Res 2021, 41, 391–406. [Google Scholar] [CrossRef]
- Sawant, D. V.; Yano, H.; Chikina, M.; Zhang, Q.; Liao, M.; Liu, C.; Callahan, D. J.; Sun, Z.; Sun, T.; Tabib, T.; Pennathur, A.; Corry, D. B.; Luketich, J. D.; Lafyatis, R.; Chen, W.; Poholek, A. C.; Bruno, T. C.; Workman, C. J.; Vignali, D. A. A. Adaptive plasticity of IL-10(+) and IL-35(+) T(reg) cells cooperatively promotes tumor T cell exhaustion. Nat Immunol 2019, 20, 724–735. [Google Scholar] [CrossRef]
- Kheiri, F.; Rostami-Nejad, M.; Amani, D.; Sadeghi, A.; Moradi, A.; Aghamohammadi, E.; Sahebkar, A.; Zali, M. R. Expression of tolerogenic dendritic cells in the small intestinal tissue of patients with celiac disease. Heliyon 2022, 8, e12273. [Google Scholar] [CrossRef]
- Wu, Q.; Zhou, W.; Yin, S.; Zhou, Y.; Chen, T.; Qian, J.; Su, R.; Hong, L.; Lu, H.; Zhang, F.; Xie, H.; Zhou, L.; Zheng, S. Blocking Triggering Receptor Expressed on Myeloid Cells-1-Positive Tumor-Associated Macrophages Induced by Hypoxia Reverses Immunosuppression and Anti-Programmed Cell Death Ligand 1 Resistance in Liver Cancer. Hepatology 2019, 70, 198–214. [Google Scholar] [CrossRef]
- Tran, C. W.; Gold, M. J.; Garcia-Batres, C.; Tai, K.; Elford, A. R.; Himmel, M. E.; Elia, A. J.; Ohashi, P. S. Hypoxia-inducible factor 1 alpha limits dendritic cell stimulation of CD8 T cell immunity. PLoS One 2020, 15, e0244366. [Google Scholar] [CrossRef]
- Li, Y.; Gu, Y.; Yang, P.; Wang, Y.; Yu, X.; Li, Y.; Jin, Z.; Xu, L. CD69 is a Promising Immunotherapy and Prognosis Prediction Target in Cancer. Immunotargets Ther 2024, 13, 1–14. [Google Scholar] [CrossRef]
- Kimura, M. Y.; Hayashizaki, K.; Tokoyoda, K.; Takamura, S.; Motohashi, S.; Nakayama, T. Crucial role for CD69 in allergic inflammatory responses: CD69-Myl9 system in the pathogenesis of airway inflammation. Immunol Rev 2017, 278, 87–100. [Google Scholar] [CrossRef] [PubMed]
- Sharpe, A. H.; Pauken, K. E. The diverse functions of the PD1 inhibitory pathway. Nat Rev Immunol 2018, 18, 153–167. [Google Scholar] [CrossRef]
- Bai, Y.; Hu, M.; Chen, Z.; Wei, J.; Du, H. Single-Cell Transcriptome Analysis Reveals RGS1 as a New Marker and Promoting Factor for T-Cell Exhaustion in Multiple Cancers. Front Immunol 2021, 12, 767070. [Google Scholar] [CrossRef] [PubMed]
- Blank, C. U.; Haining, W. N.; Held, W.; Hogan, P. G.; Kallies, A.; Lugli, E.; Lynn, R. C.; Philip, M.; Rao, A.; Restifo, N. P.; Schietinger, A.; Schumacher, T. N.; Schwartzberg, P. L.; Sharpe, A. H.; Speiser, D. E.; Wherry, E. J.; Youngblood, B. A.; Zehn, D. Defining ‘T cell exhaustion’. Nat Rev Immunol 2019, 19, 665–674. [Google Scholar] [CrossRef] [PubMed]
- Miggelbrink, A. M.; Jackson, J. D.; Lorrey, S. J.; Srinivasan, E. S.; Waibl-Polania, J.; Wilkinson, D. S.; Fecci, P. E. CD4 T-Cell Exhaustion: Does It Exist and What Are Its Roles in Cancer? Clin Cancer Res 2021, 27, 5742–5752. [Google Scholar] [CrossRef]
- Mita, Y.; Kimura, M. Y.; Hayashizaki, K.; Koyama-Nasu, R.; Ito, T.; Motohashi, S.; Okamoto, Y.; Nakayama, T. Crucial role of CD69 in anti-tumor immunity through regulating the exhaustion of tumor-infiltrating T cells. Int Immunol 2018, 30, 559–567. [Google Scholar] [CrossRef]
- Cenerenti, M.; Saillard, M.; Romero, P.; Jandus, C. The Era of Cytotoxic CD4 T Cells. Front Immunol 2022, 13, 867189. [Google Scholar] [CrossRef]
Figure 1.
The effect of EA 575 on the cytotoxicity of monocytes induced to differentiate into imMoDCs. A) Metabolic activity assessed by the MTT assay. Values are expressed as mean ± SD (n = 4). B) Representative flow cytometry plots from one experiment showing apoptosis and necrosis. C) Apoptosis and necrosis presented as mean ± SD (n = 4). **p < 0.01; ***p < 0.001 compared to control (Ctrl).
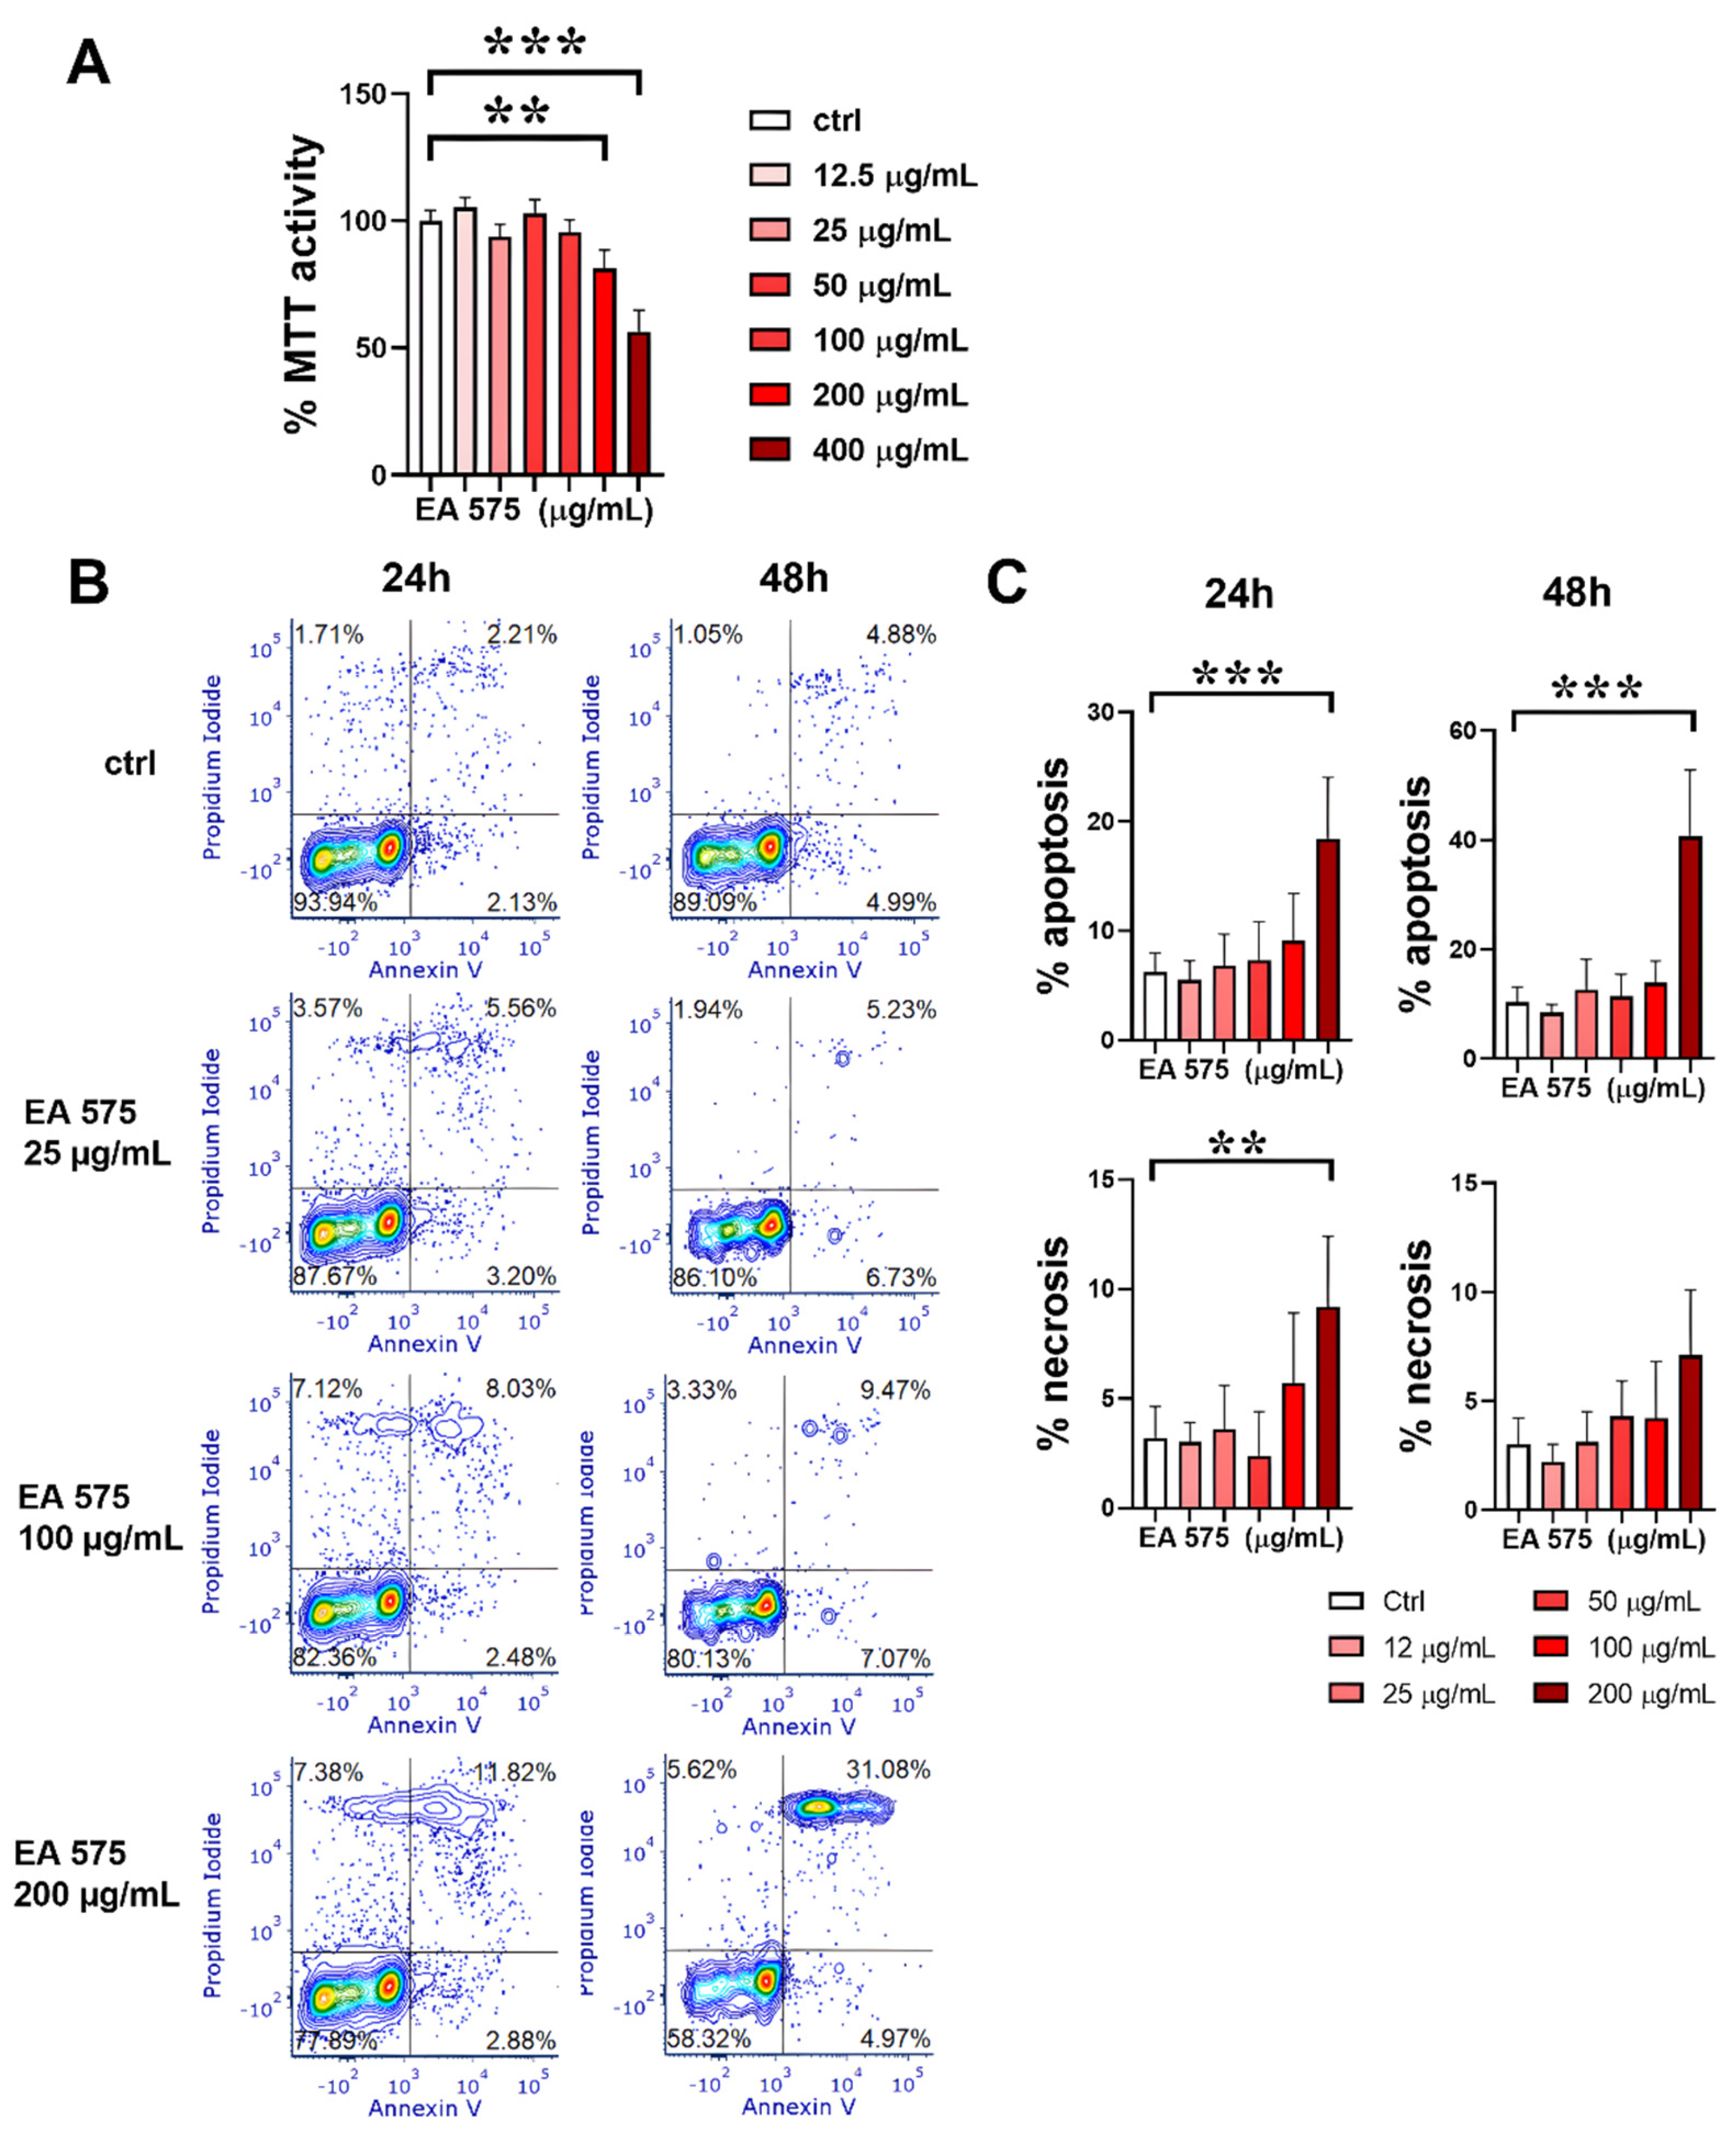
Figure 2.
The effect of EA 575 on the expression of differentiation markers on imMoDCs. MoDCs were differentiated from monocytes in the presence of lower (20 µg/mL) and higher (100 µg/mL) concentrations of EA 575 over 5 days. A) Expression of CD1a and CD14: Representative flow cytometry plots from one experiment; histograms show mean percentages of positive cells ± SD (n = 6 donors).B) Expression of differentiation markers presented as mean percentages or mean fluorescence intensity (MFI) ± SD (n = 6 donors). *p < 0.05; **p < 0.01; ***p < 0.001; ****p < 0.0001 compared to control (Ctrl).
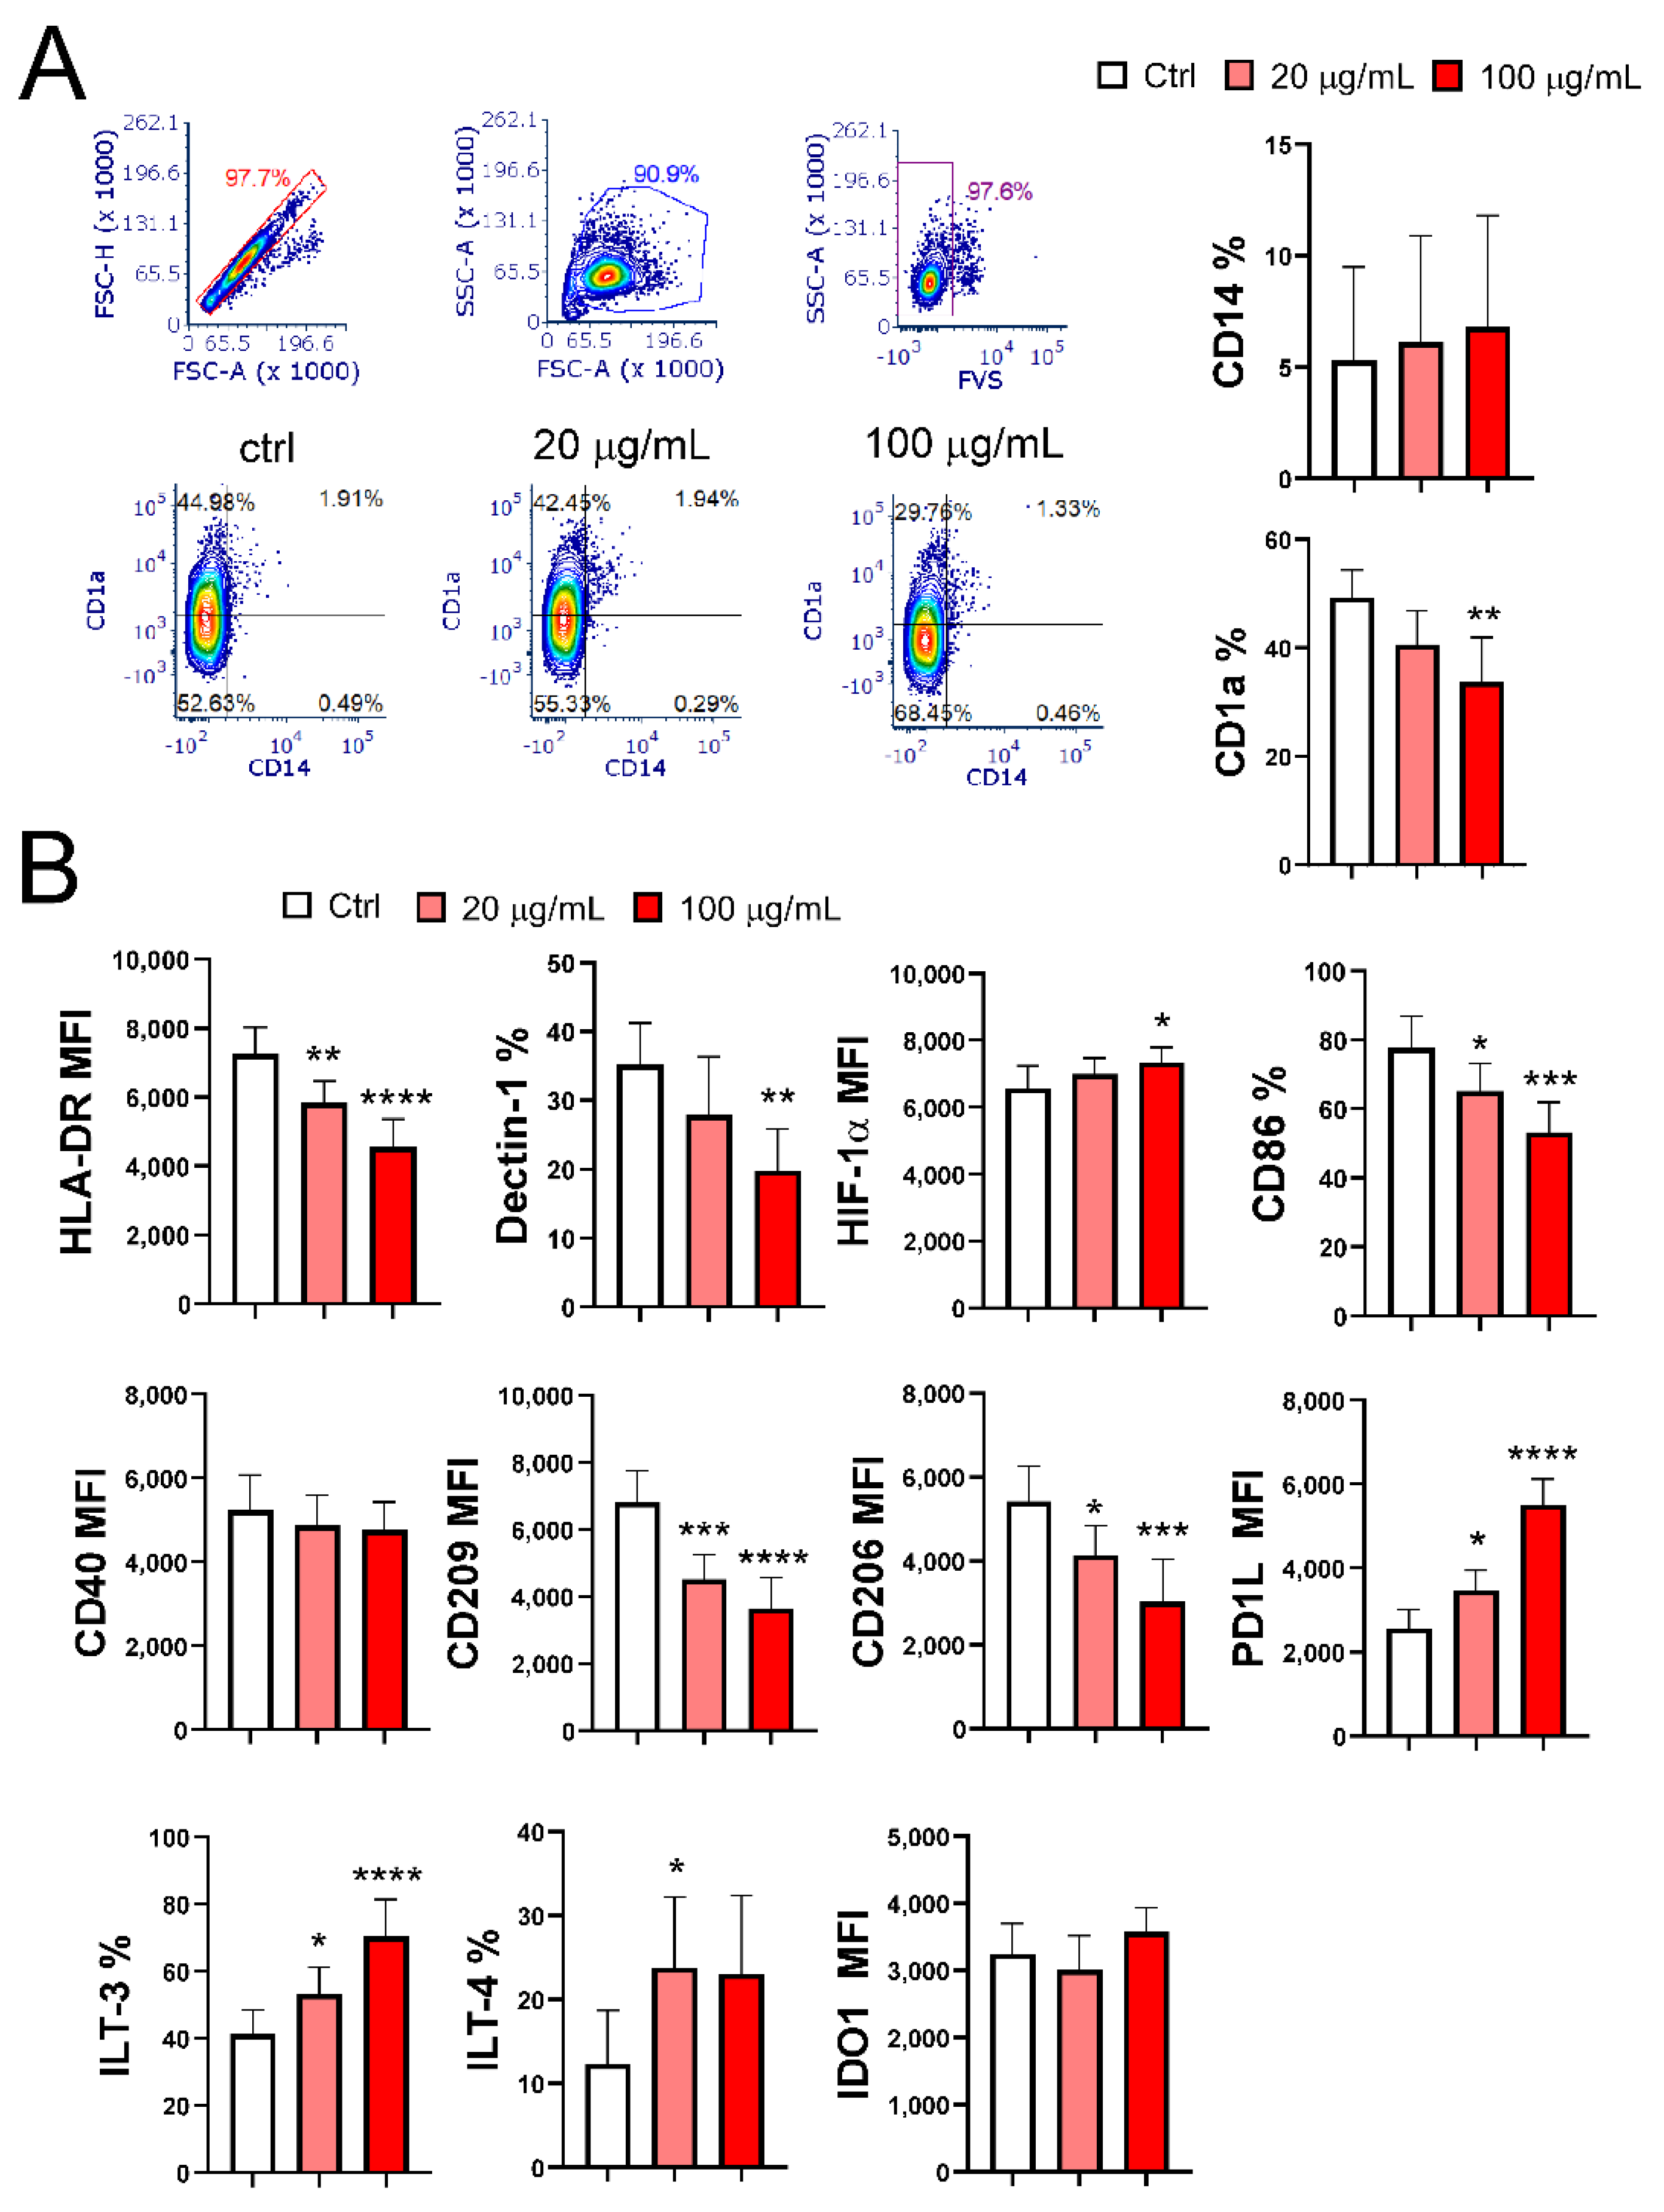
Figure 3.
The effect of EA 575 on the expression of differentiation/maturation markers on mMoDCs. MoDCs were differentiated from monocytes in the presence of lower (20 µg/mL) and higher (100 µg/mL) concentrations of EA 575 for 4 days and then induced to mature with LPS/ IFN-γ. Expression of markers on mMoDCs were presented as mean percentages or mean fluorescence intensity (MFI) ± SD (n = 6 donors). *p < 0.05; **p < 0.01; ***p < 0.001 compared to control (Ctrl).
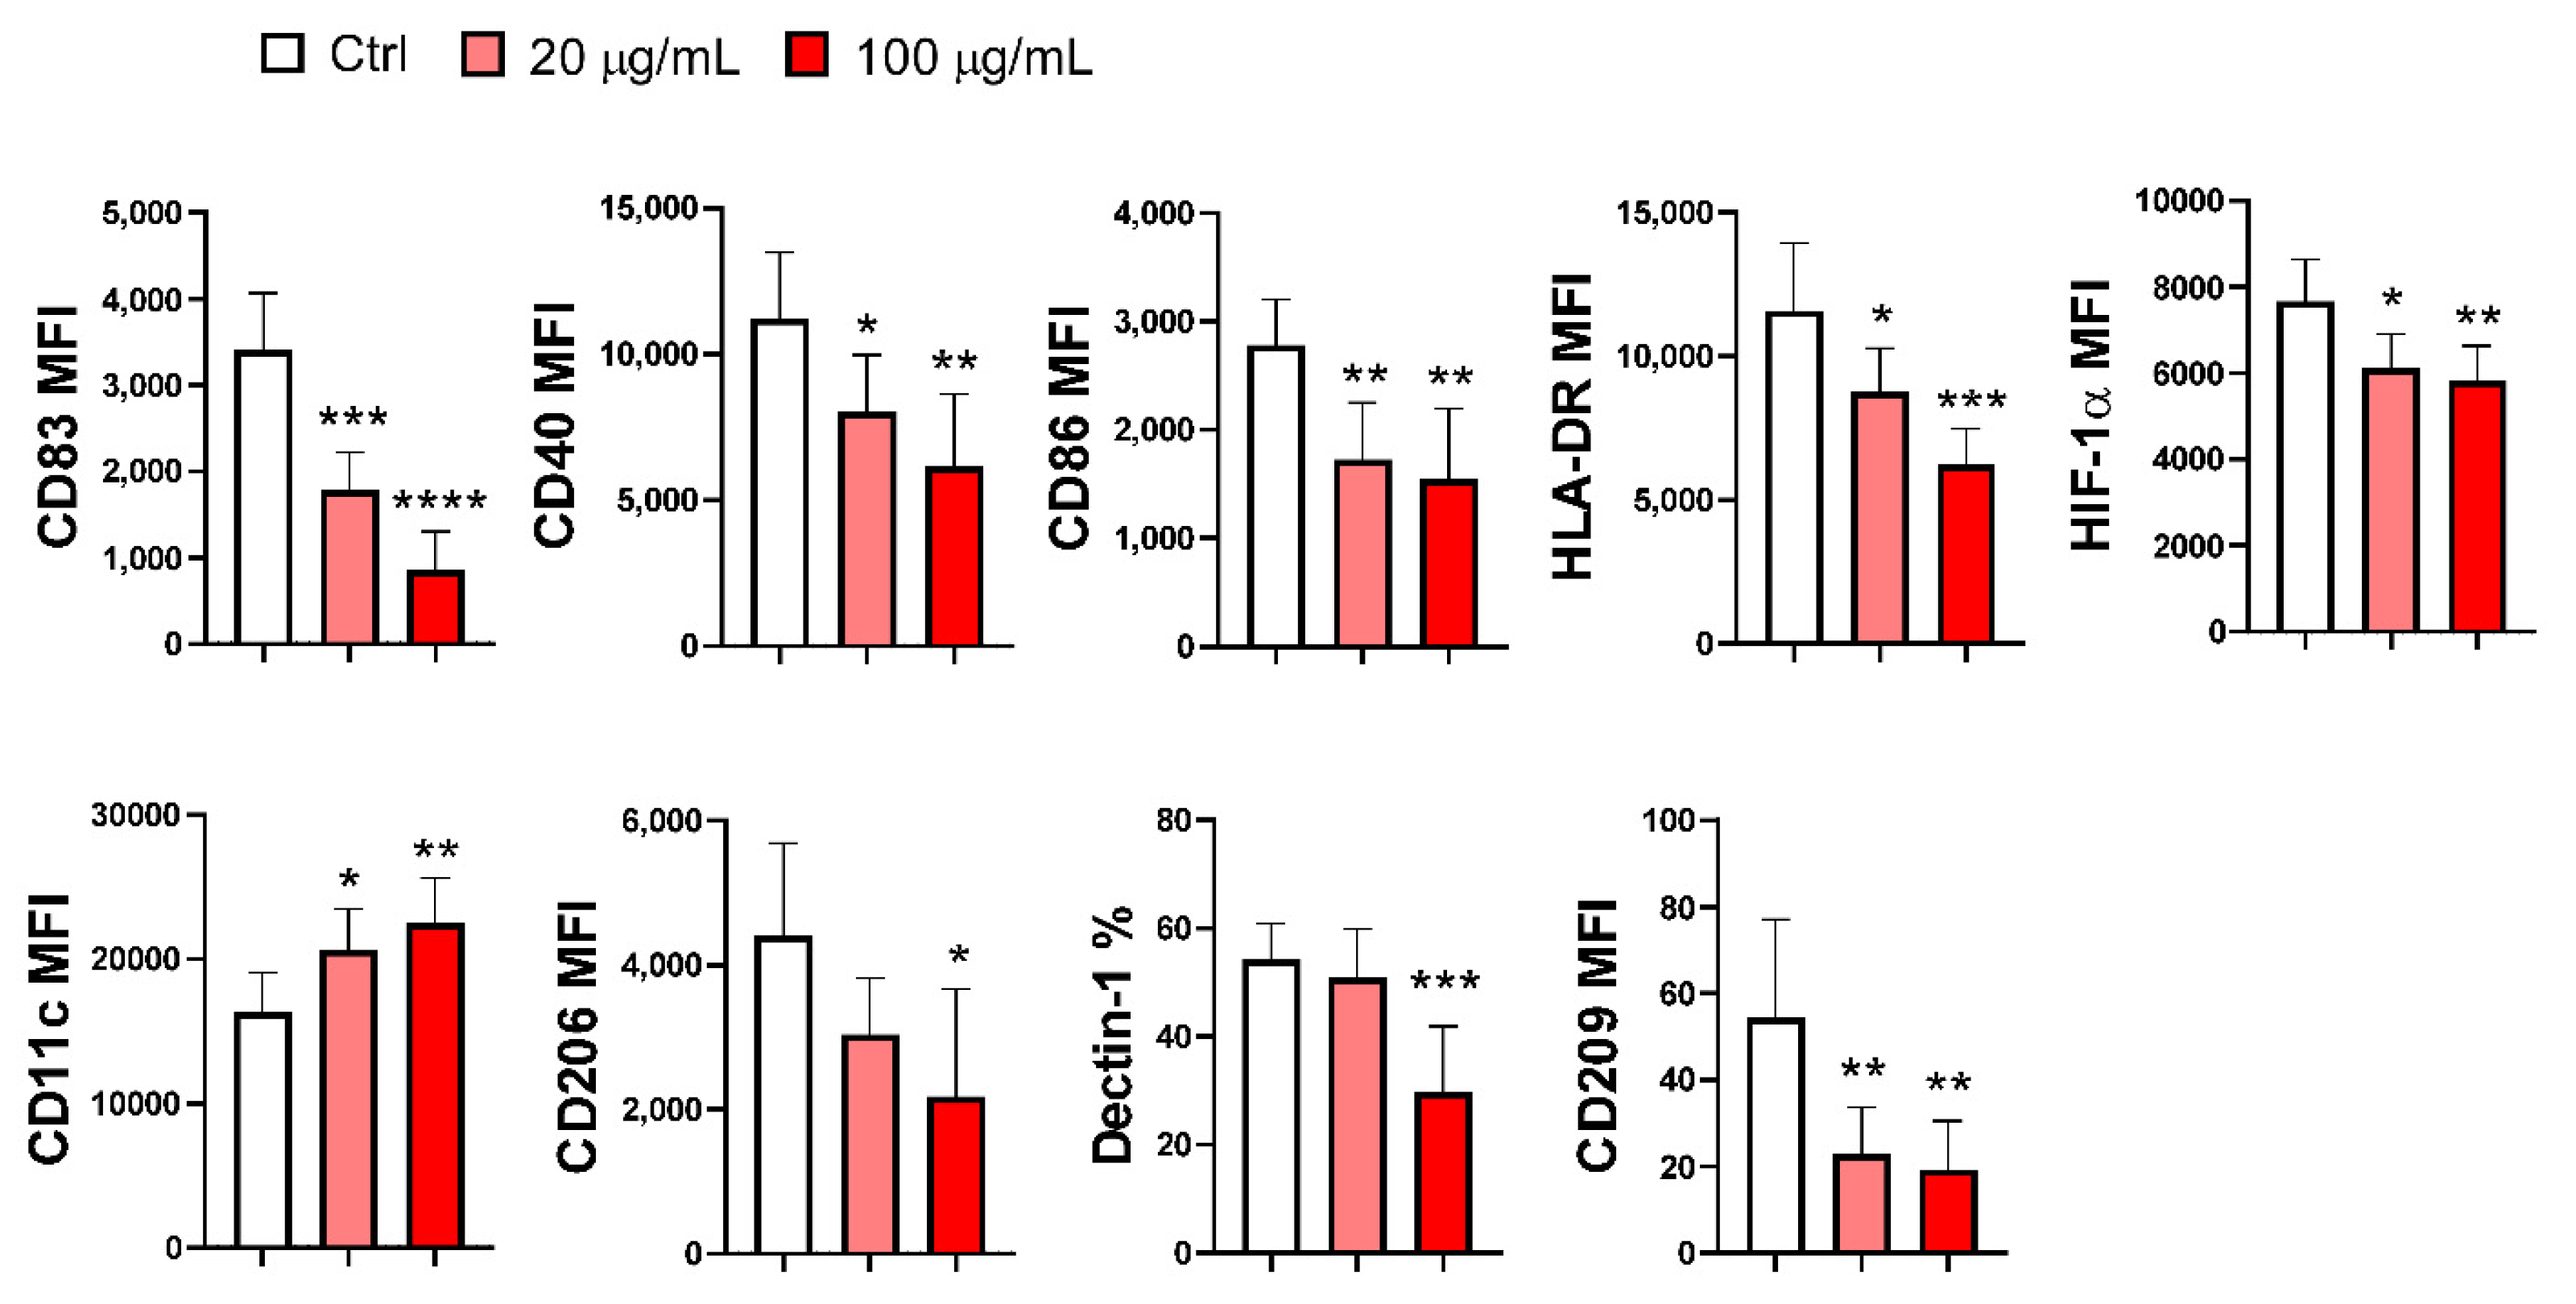
Figure 4.
The effect of EA 575 on the expression of tolerogenic markers on mMoDCs. MoDCs were differentiated from monocytes in the presence of lower (20 µg/mL) and higher (100 µg/mL) concentrations of EA 575 for 4 days and then induced to mature with LPS/ IFN-γ. Expression of markers on mMoDCs was examined on day 5 and presented: A) as percentages or mean fluorescence intensity (MFI) of one representative experiment or B) as mean percentages or MFI ± SD (n = 6 donors). *p < 0.05; ***p < 0.001 compared to control (Ctrl).
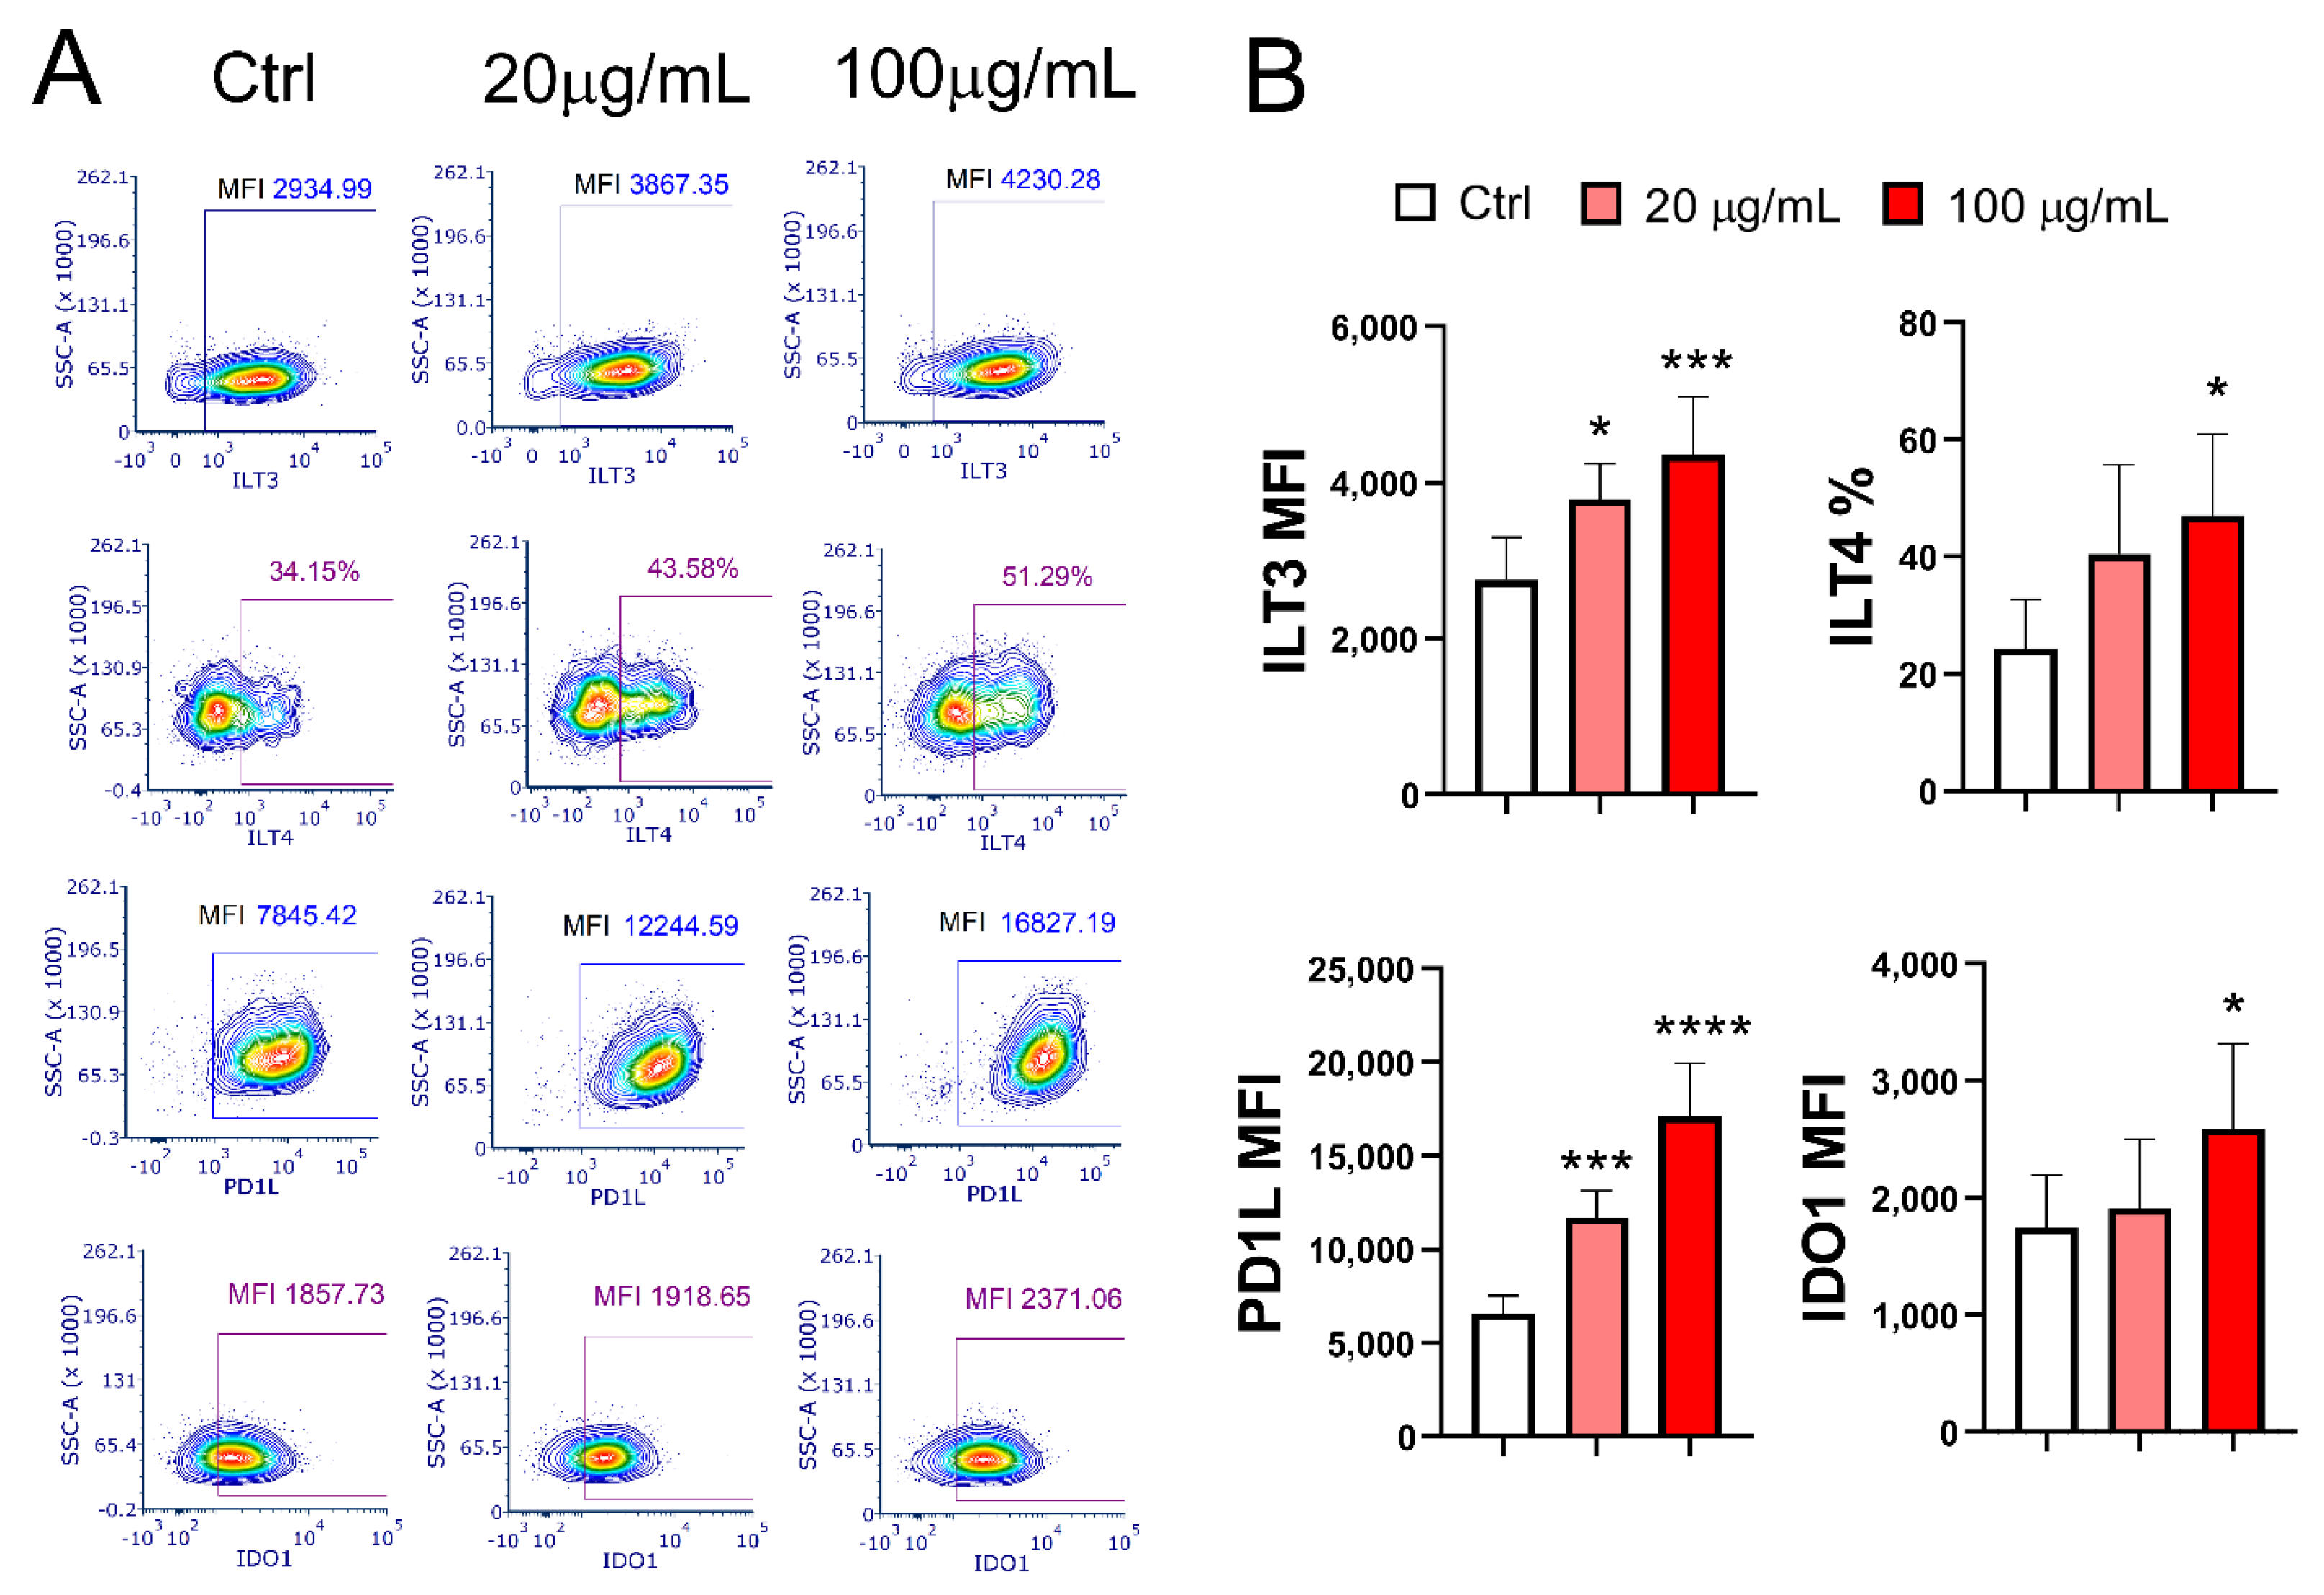
Figure 5.
The effect of EA 575 on the production of cytokines by mMoDCs. MoDCs were differentiated from monocytes in the presence of lower (20 µg/mL) and higher (100 µg/mL) concentrations of EA 575 for 4 days and then induced to mature with LPS/ IFN-γ. Levels of cytokines were presented as mean pg/mL standardized to 3 x 10⁵ MoDCs ± SD (n = 6 donors). ). *p < 0.05; **p < 0.01; ***p < 0.001; ****p < 0.0001 compared to control (Ctrl).
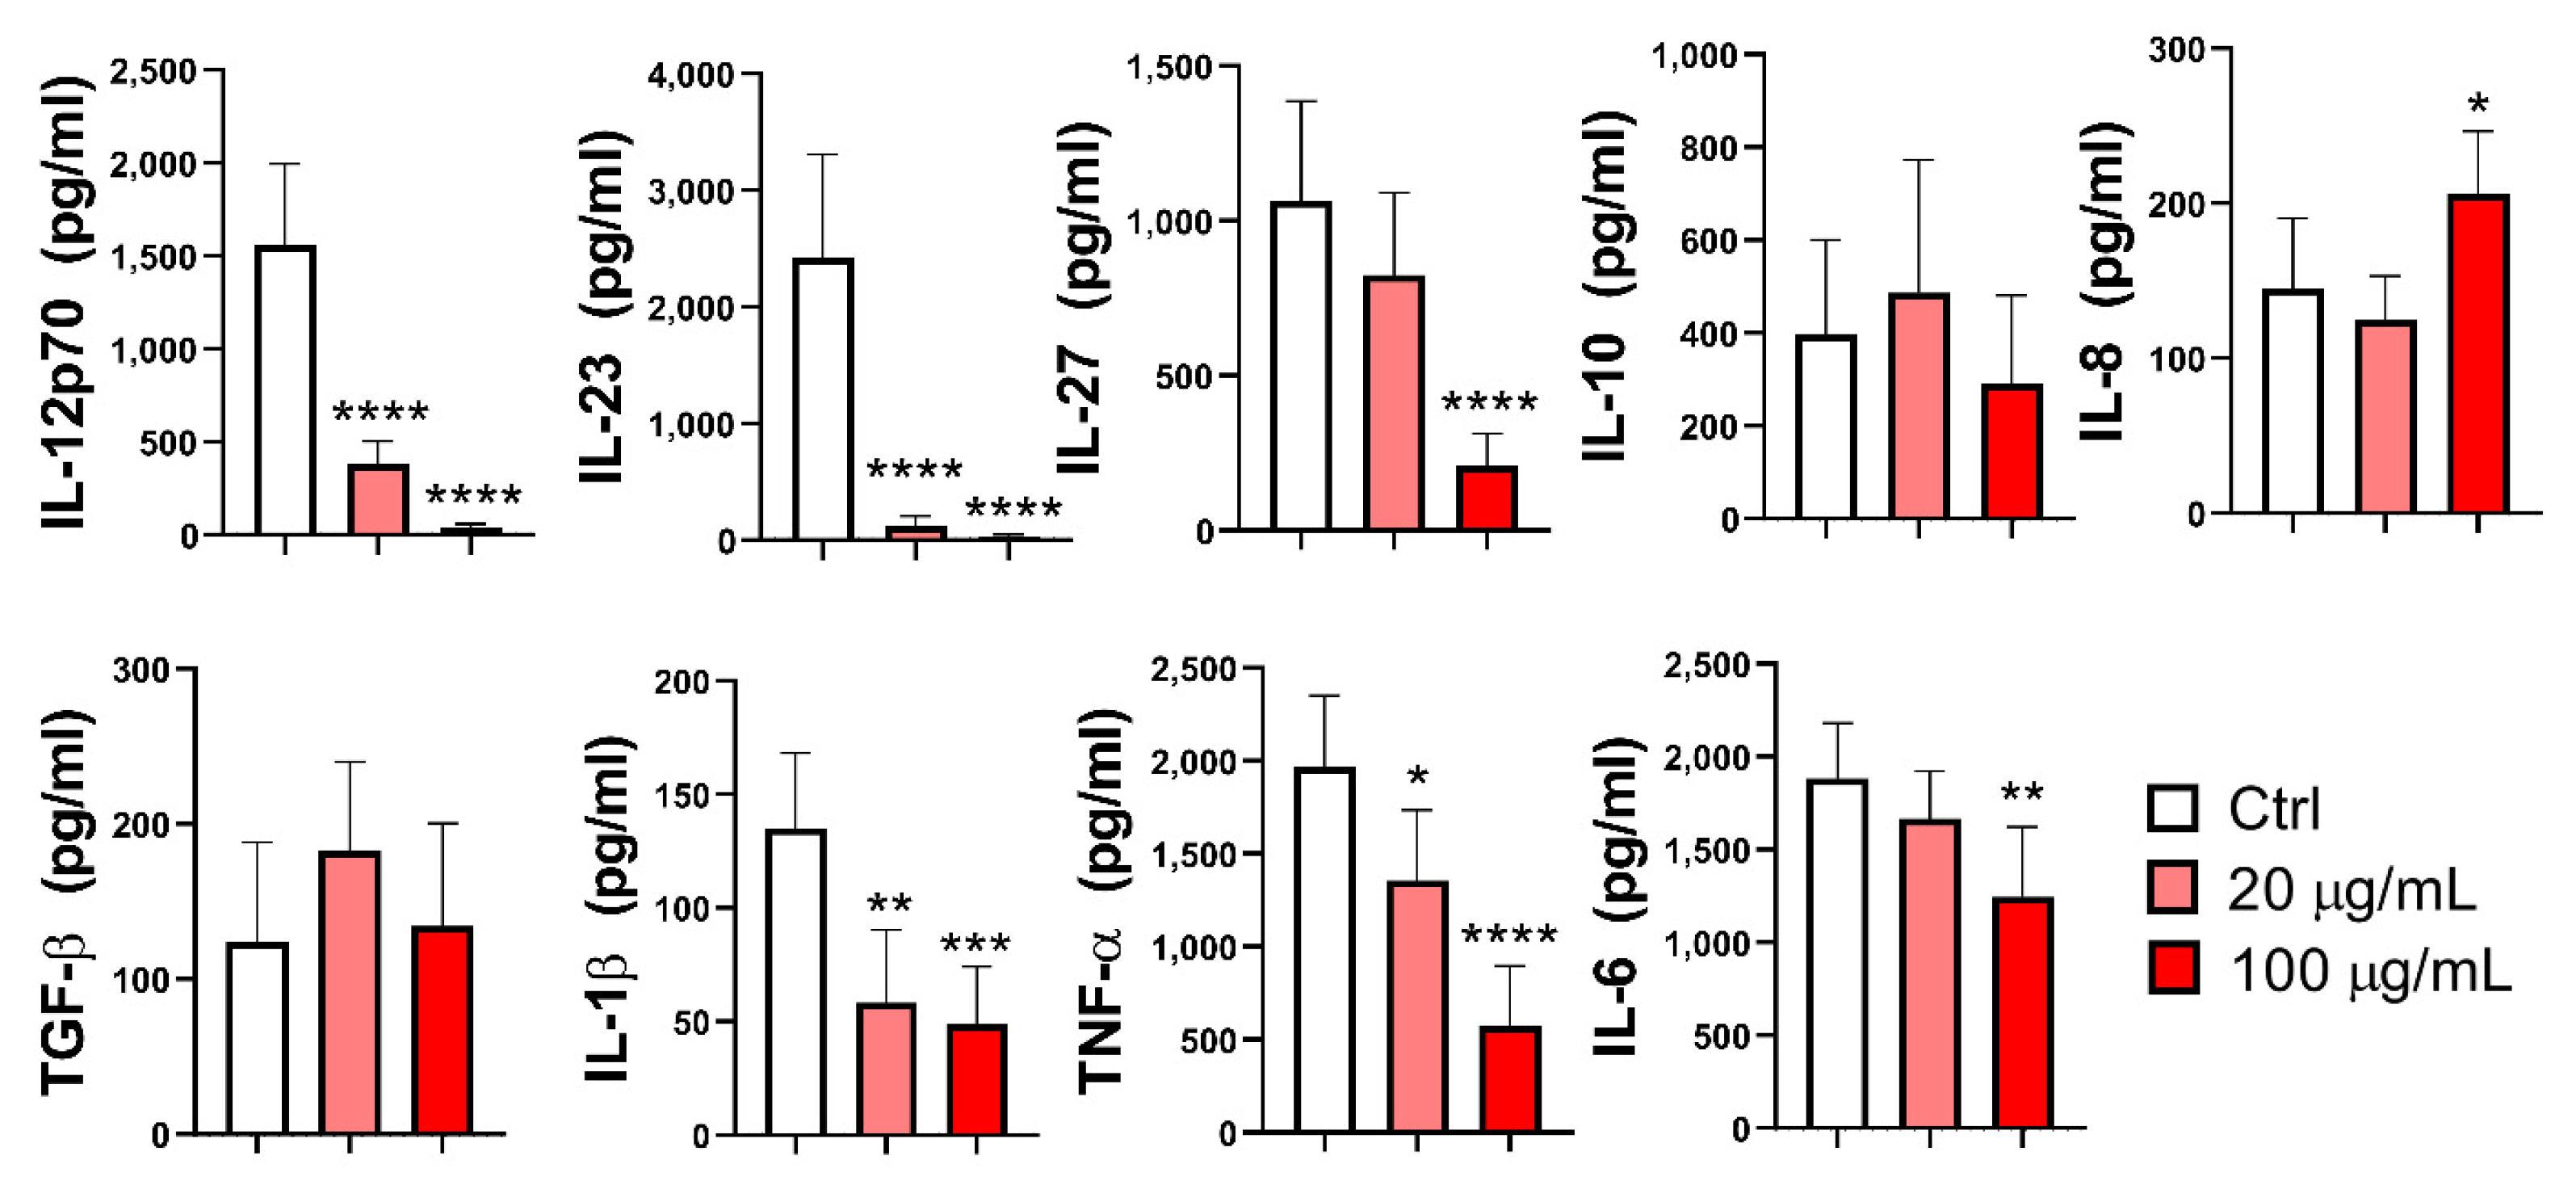
Figure 6.
The effect of EA 575-treated MoDCs on the proliferation of allogeneic T cells. Control and EA 575-treated im- or mMoDCs were incubated with CFSE-prelabelled T cells at different ratios. Proliferation was measured by flow cytometry as described in Materials and Methods. The upper row (A) presents histograms of proliferating cells and corresponding indexes of one representative experiment. B) Proliferation indexes (mean ± SD; n = 3); *p < 0.05 compared to the corresponding control.
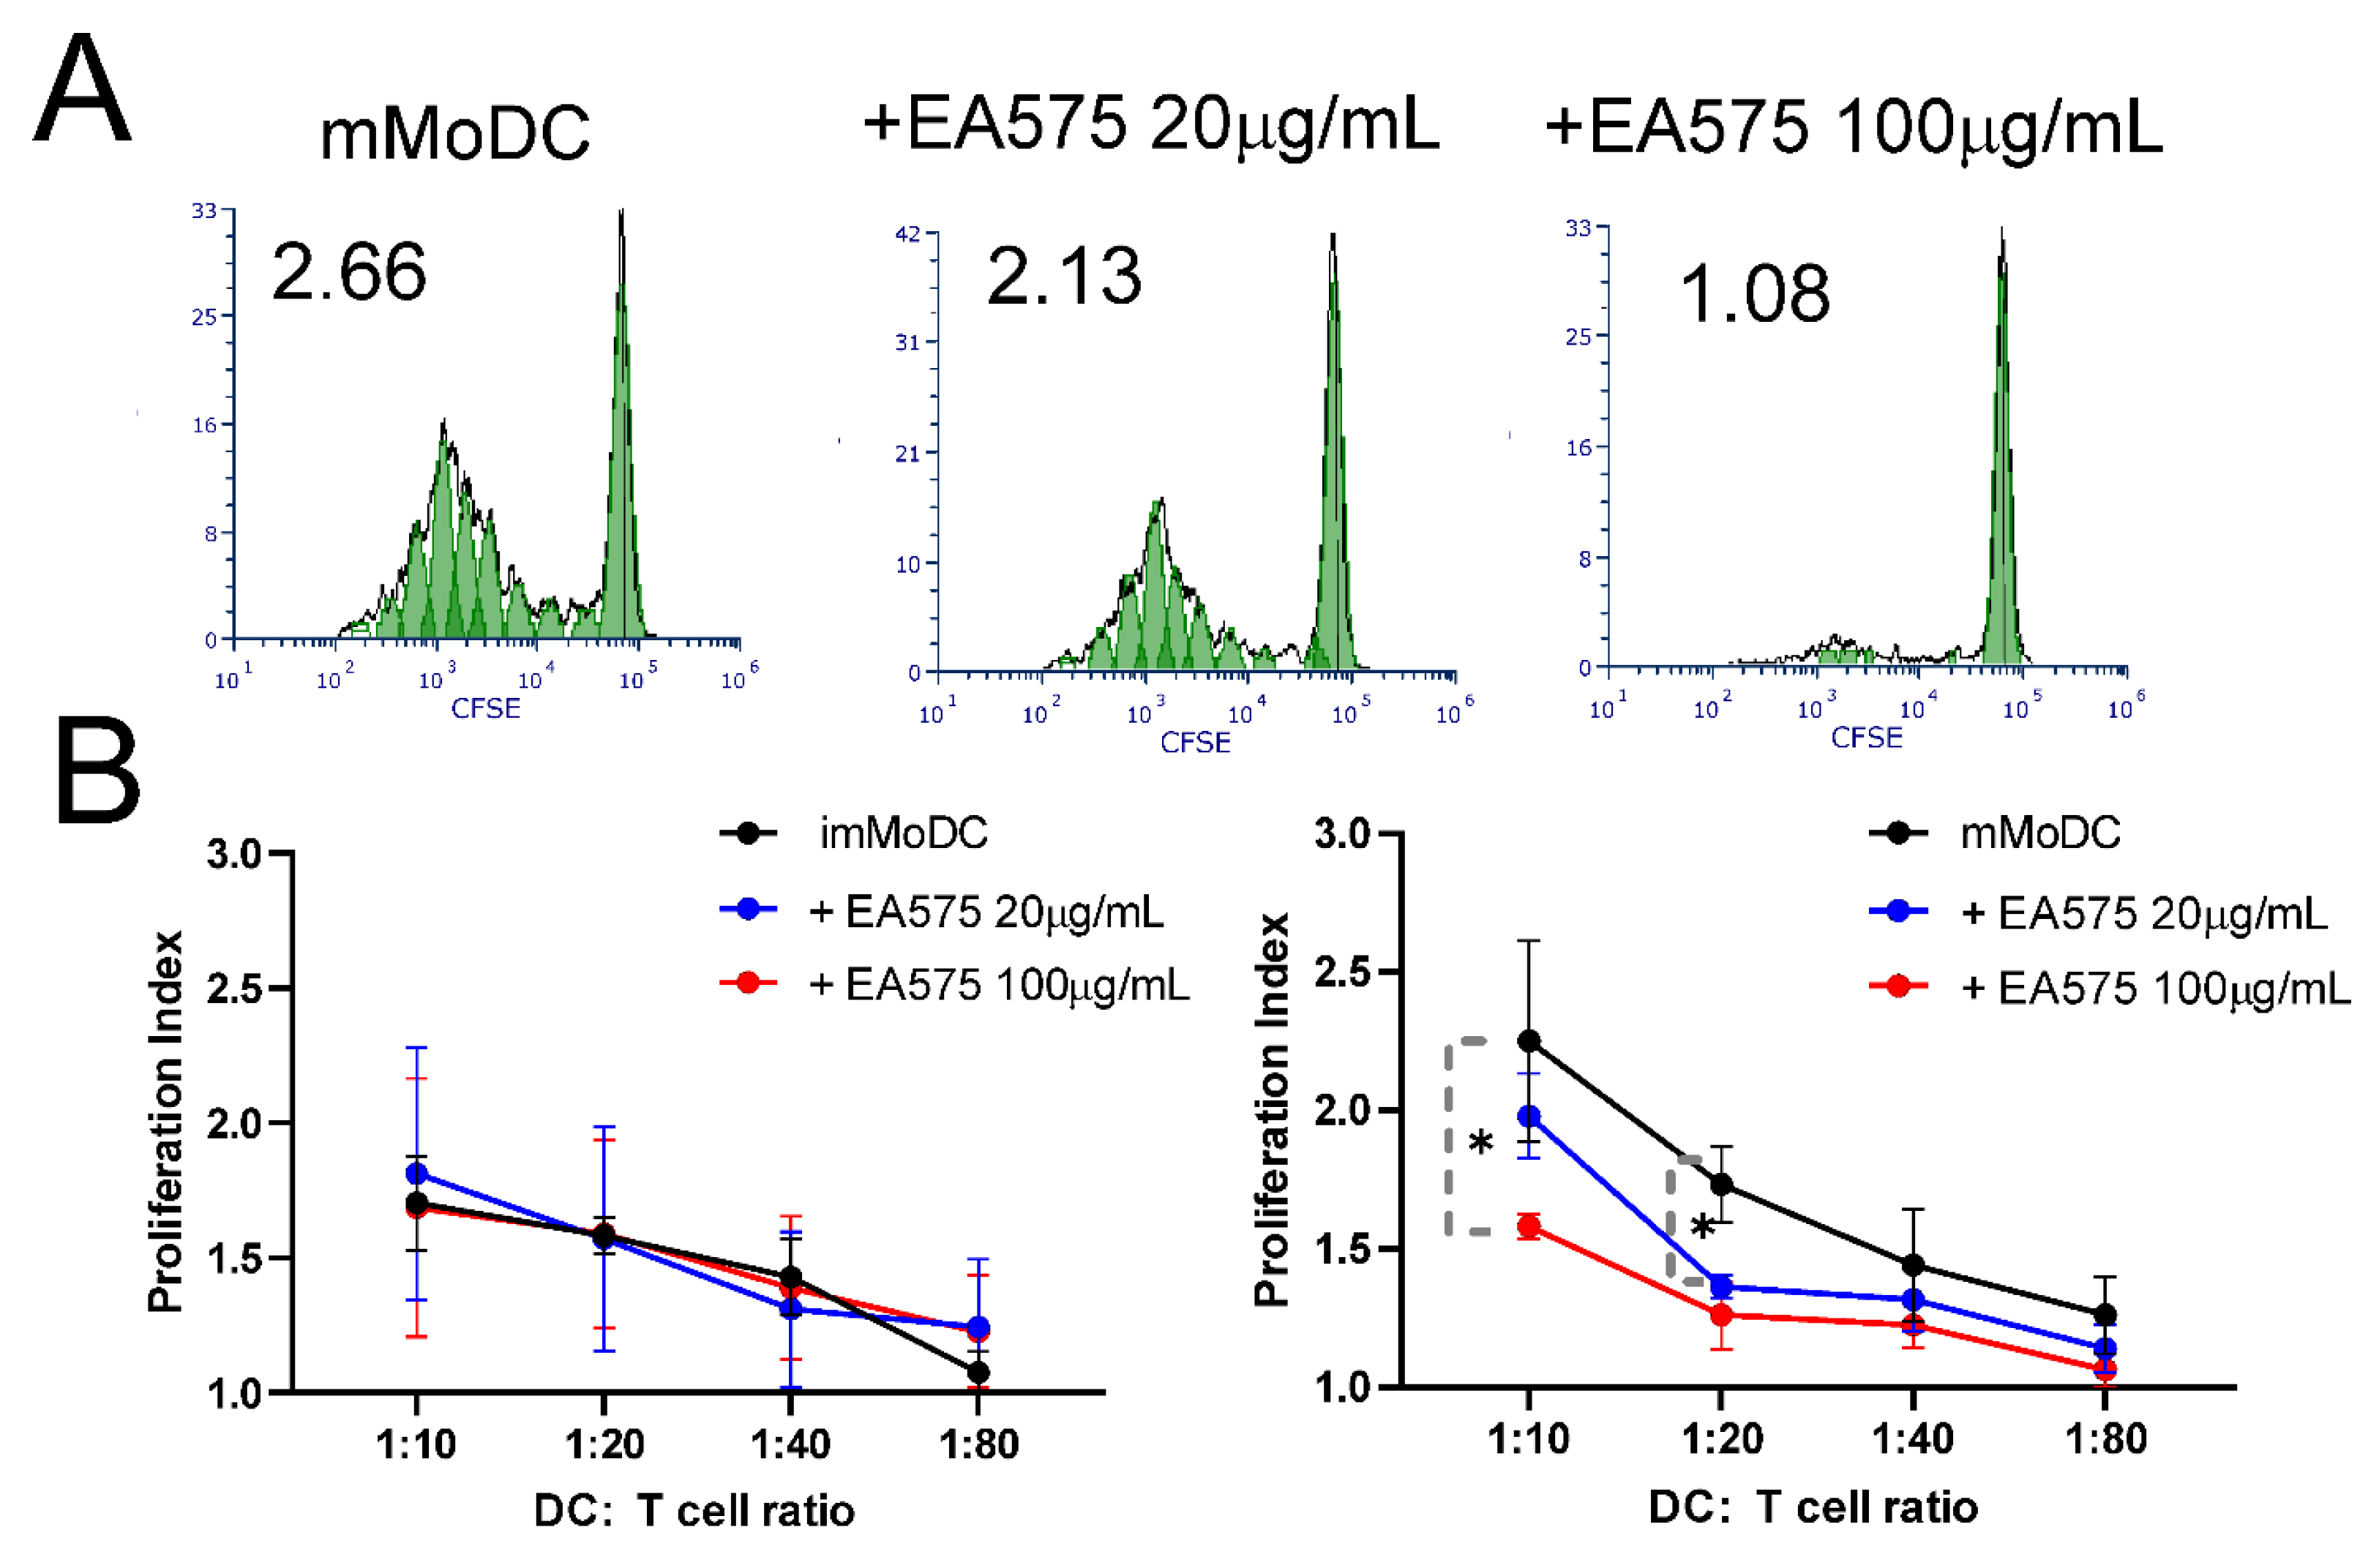
Figure 7.
The effect of EA 575-treated MoDCs on Th polarization. Control and EA 575-treated mMoDCs were co-cultured with purified T cells as described in the Materials and Methods section. Th polarization was assessed by flow cytometry based on the expression of intracellular cytokines. A) Representative plots from one experiment. B) Mean percentages of positive cells ± SD (n = 6 donors). *p < 0.05; **p < 0.01 compared to control (Ctrl).
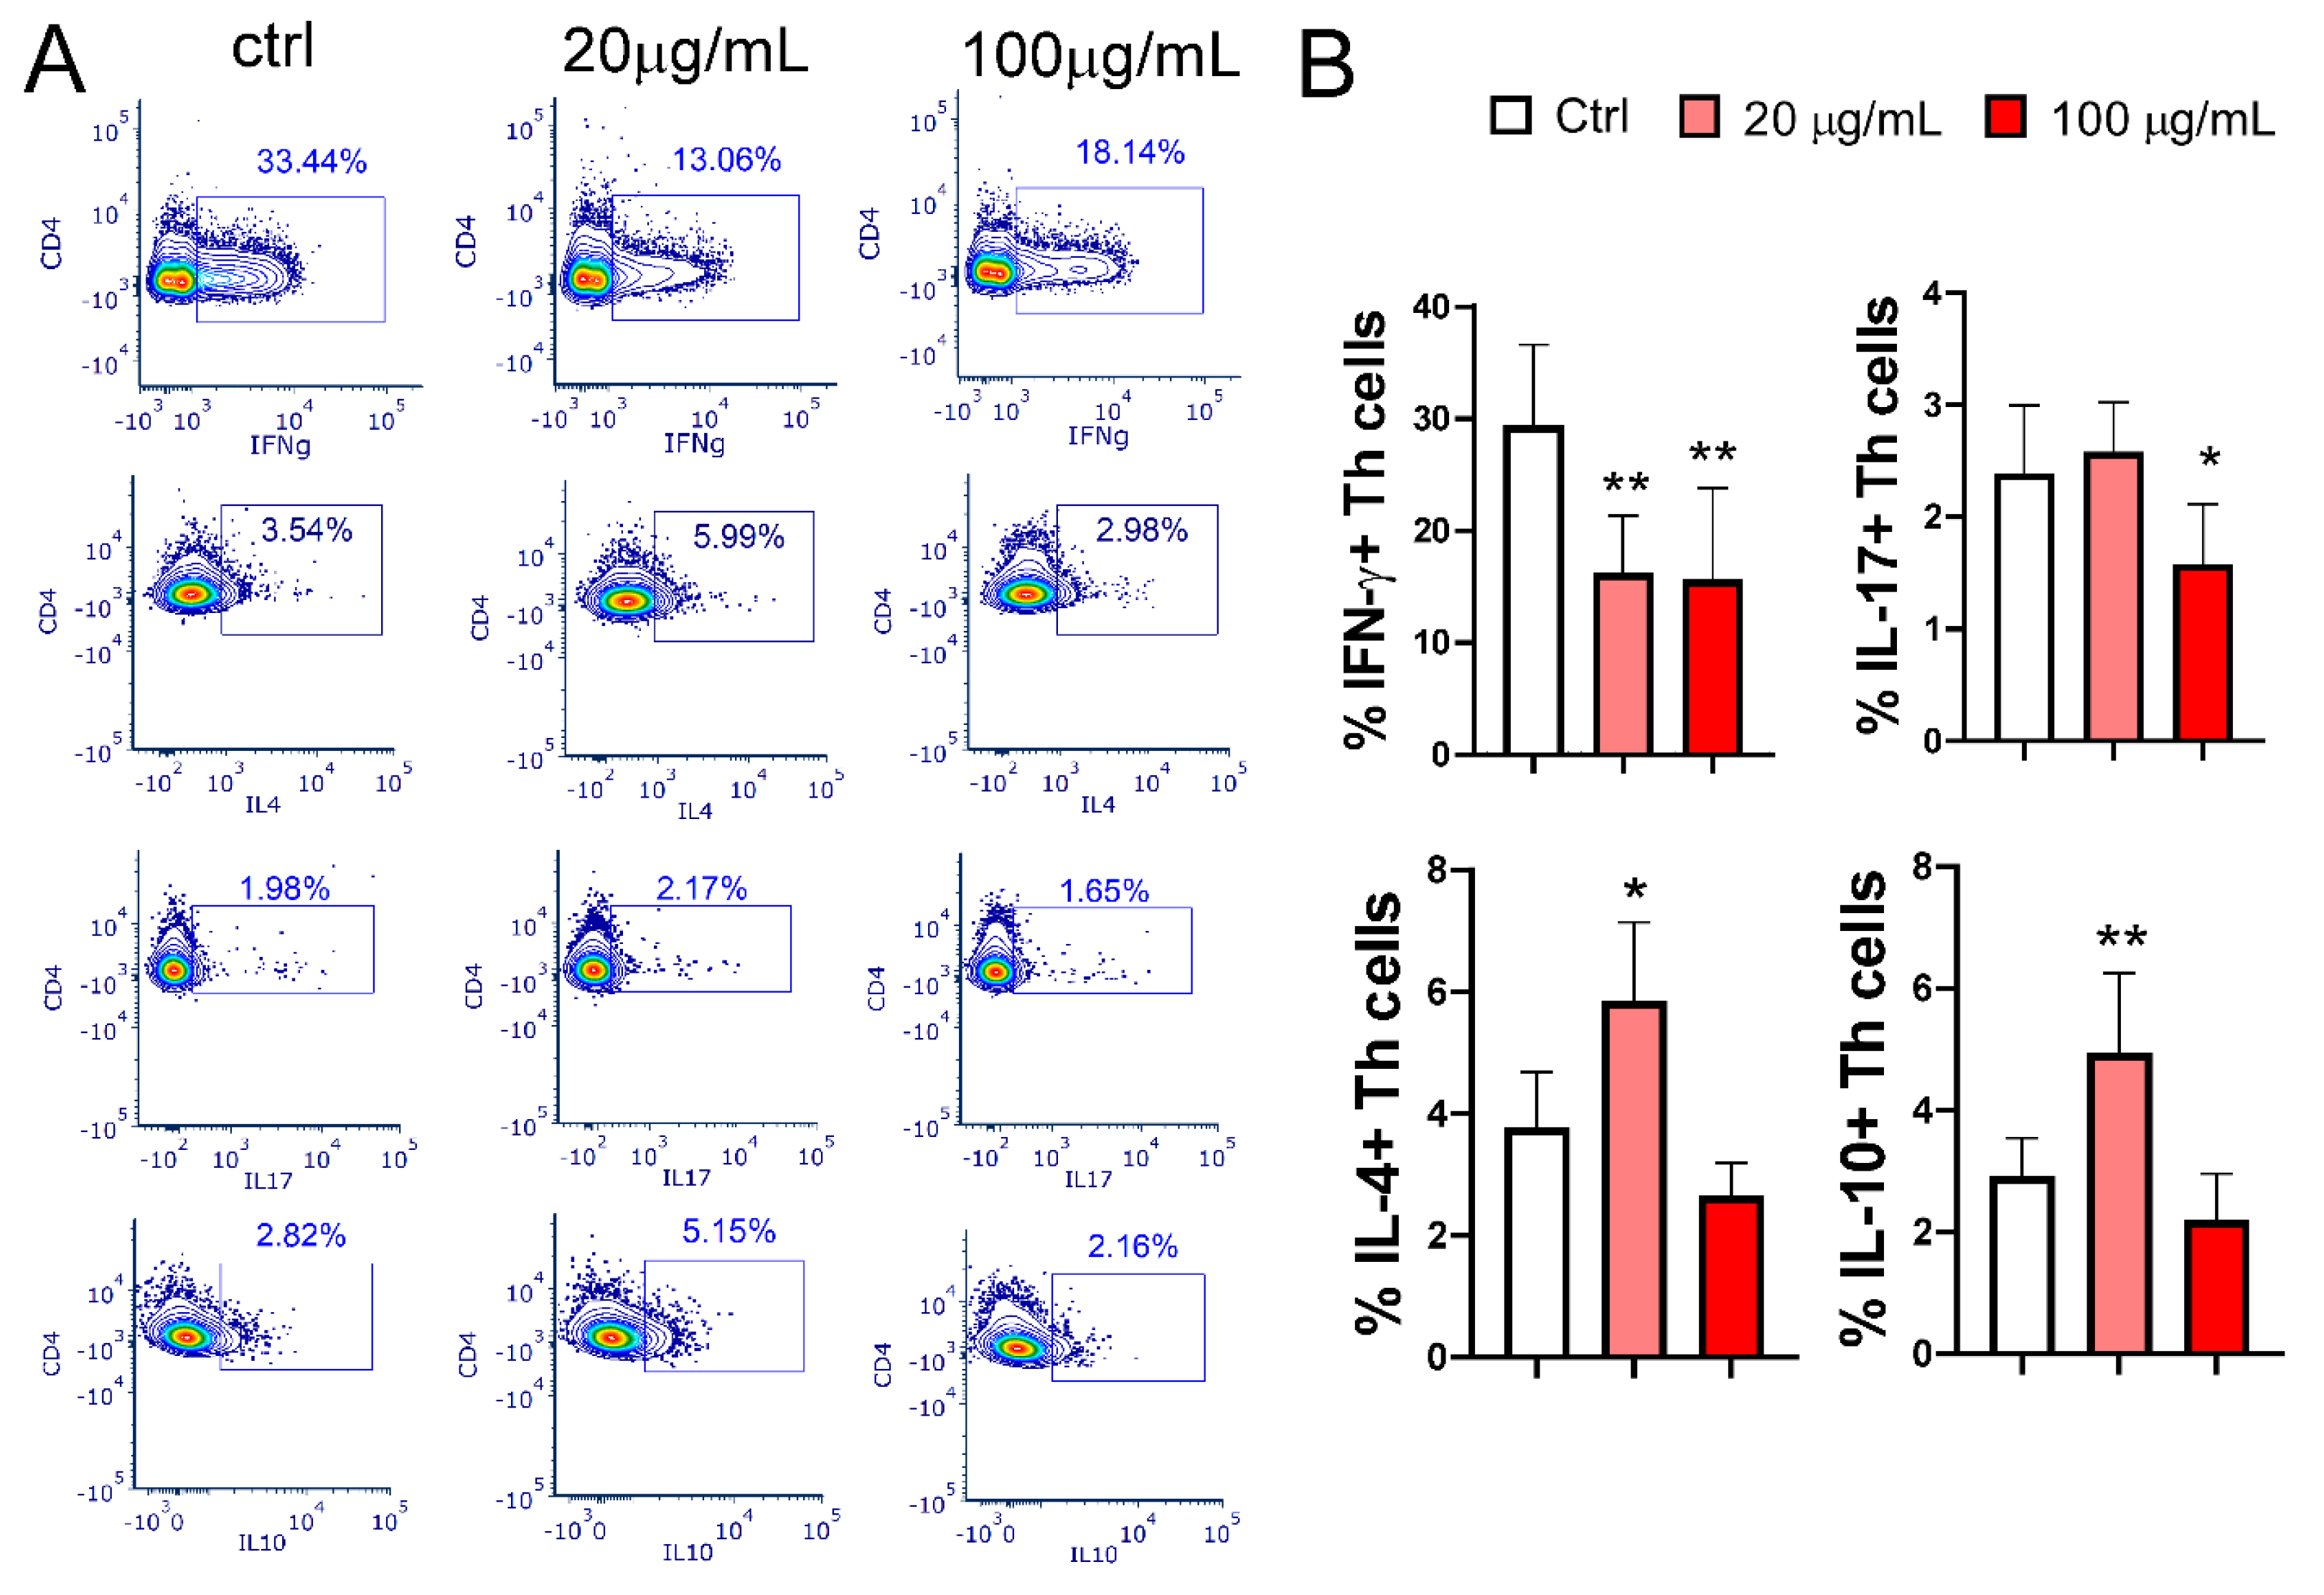
Figure 8.
The effect of EA 575-treated mMoDCs on Th polarization, determined by cytokine levels in co-culture supernatants. Control and EA 575-treated mMoDCs were co-cultured with purified T cells as described in the Materials and Methods section. Th polarization was assessed by measuring cytokine production in the supernatants of mMoDC/T-cell co-cultures using flow cytometry. Values are expressed as mean cytokine concentrations (pg/mL) ± SD (n = 6 donors). *p < 0.05; **p < 0.01; ***p < 0.001; ****p < 0.0001 compared to control (Ctrl).
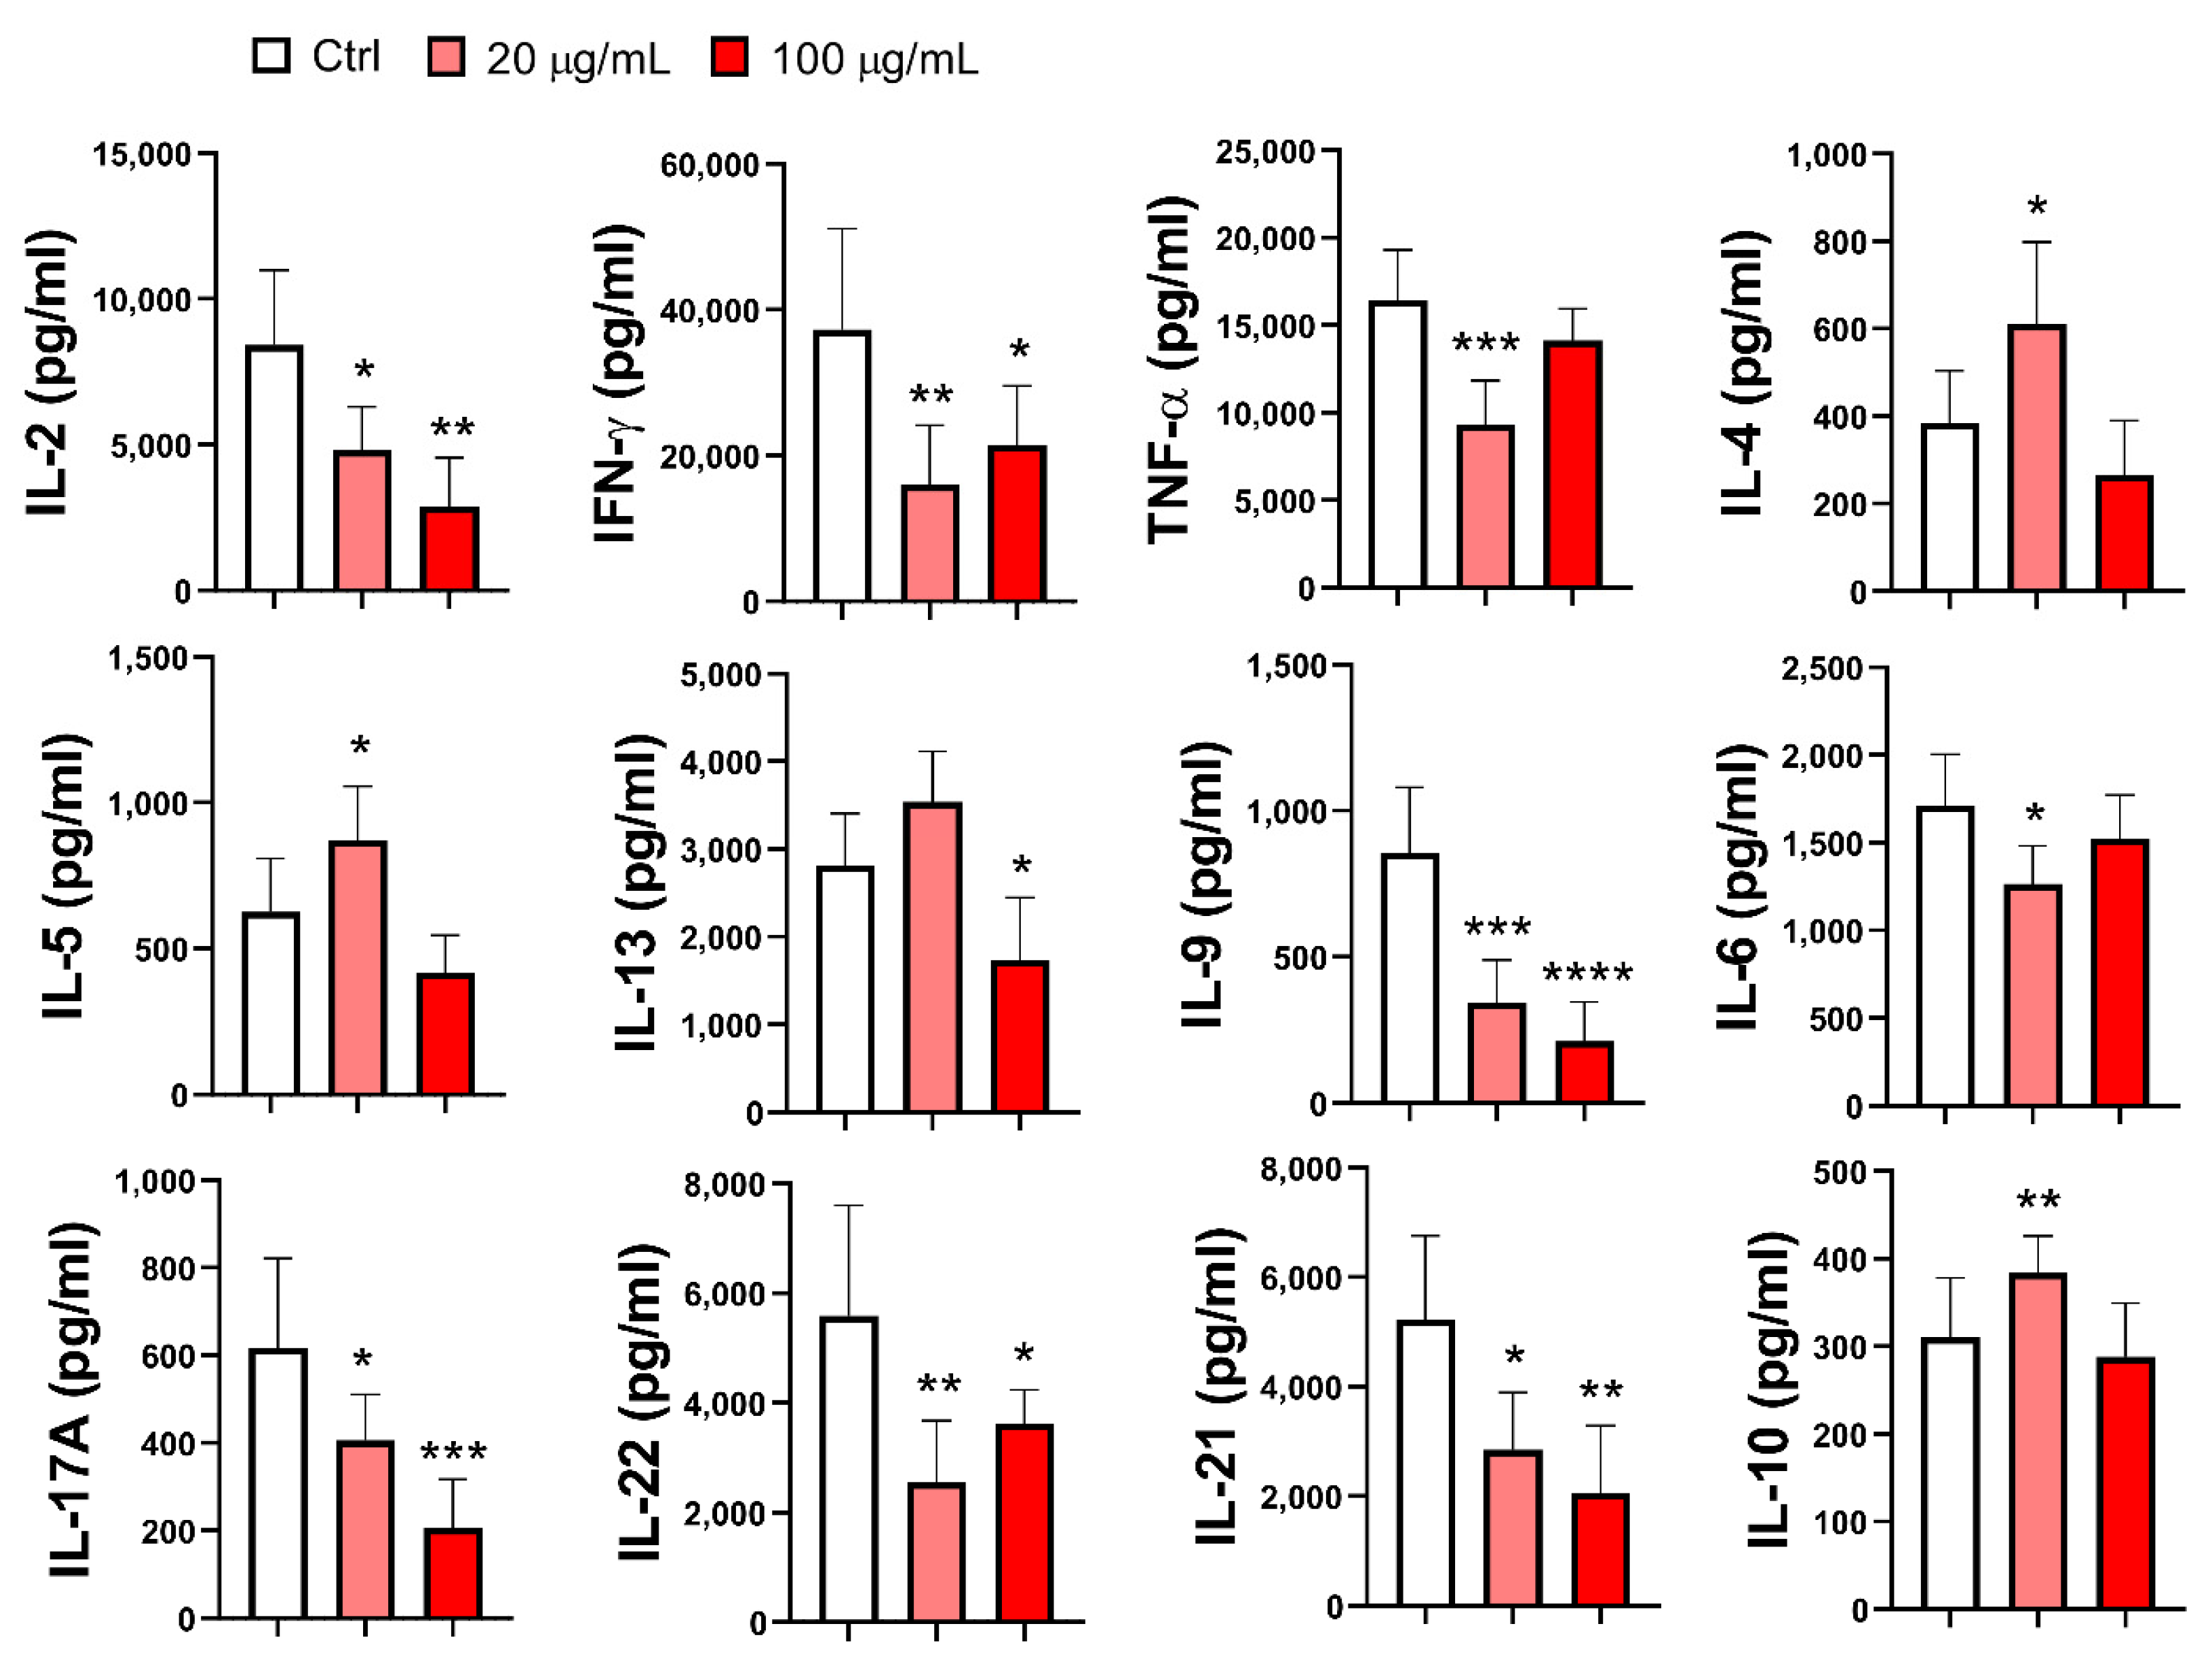
Figure 9.
The effect of EA 575-treated mMoDCs on Tregs. Control and EA 575-treated mMoDCs were co-cultured with purified T cells as described in Materials and Methods. Treg subsets were determined by flow cytometry based on the expression of characteristic intracellular markers. A) Representative plots of one experiment; B) mean percentages or positive cells ± SD (n = 6 donors). *p < 0.05; ****p < 0.0001 compared to control (Ctrl).
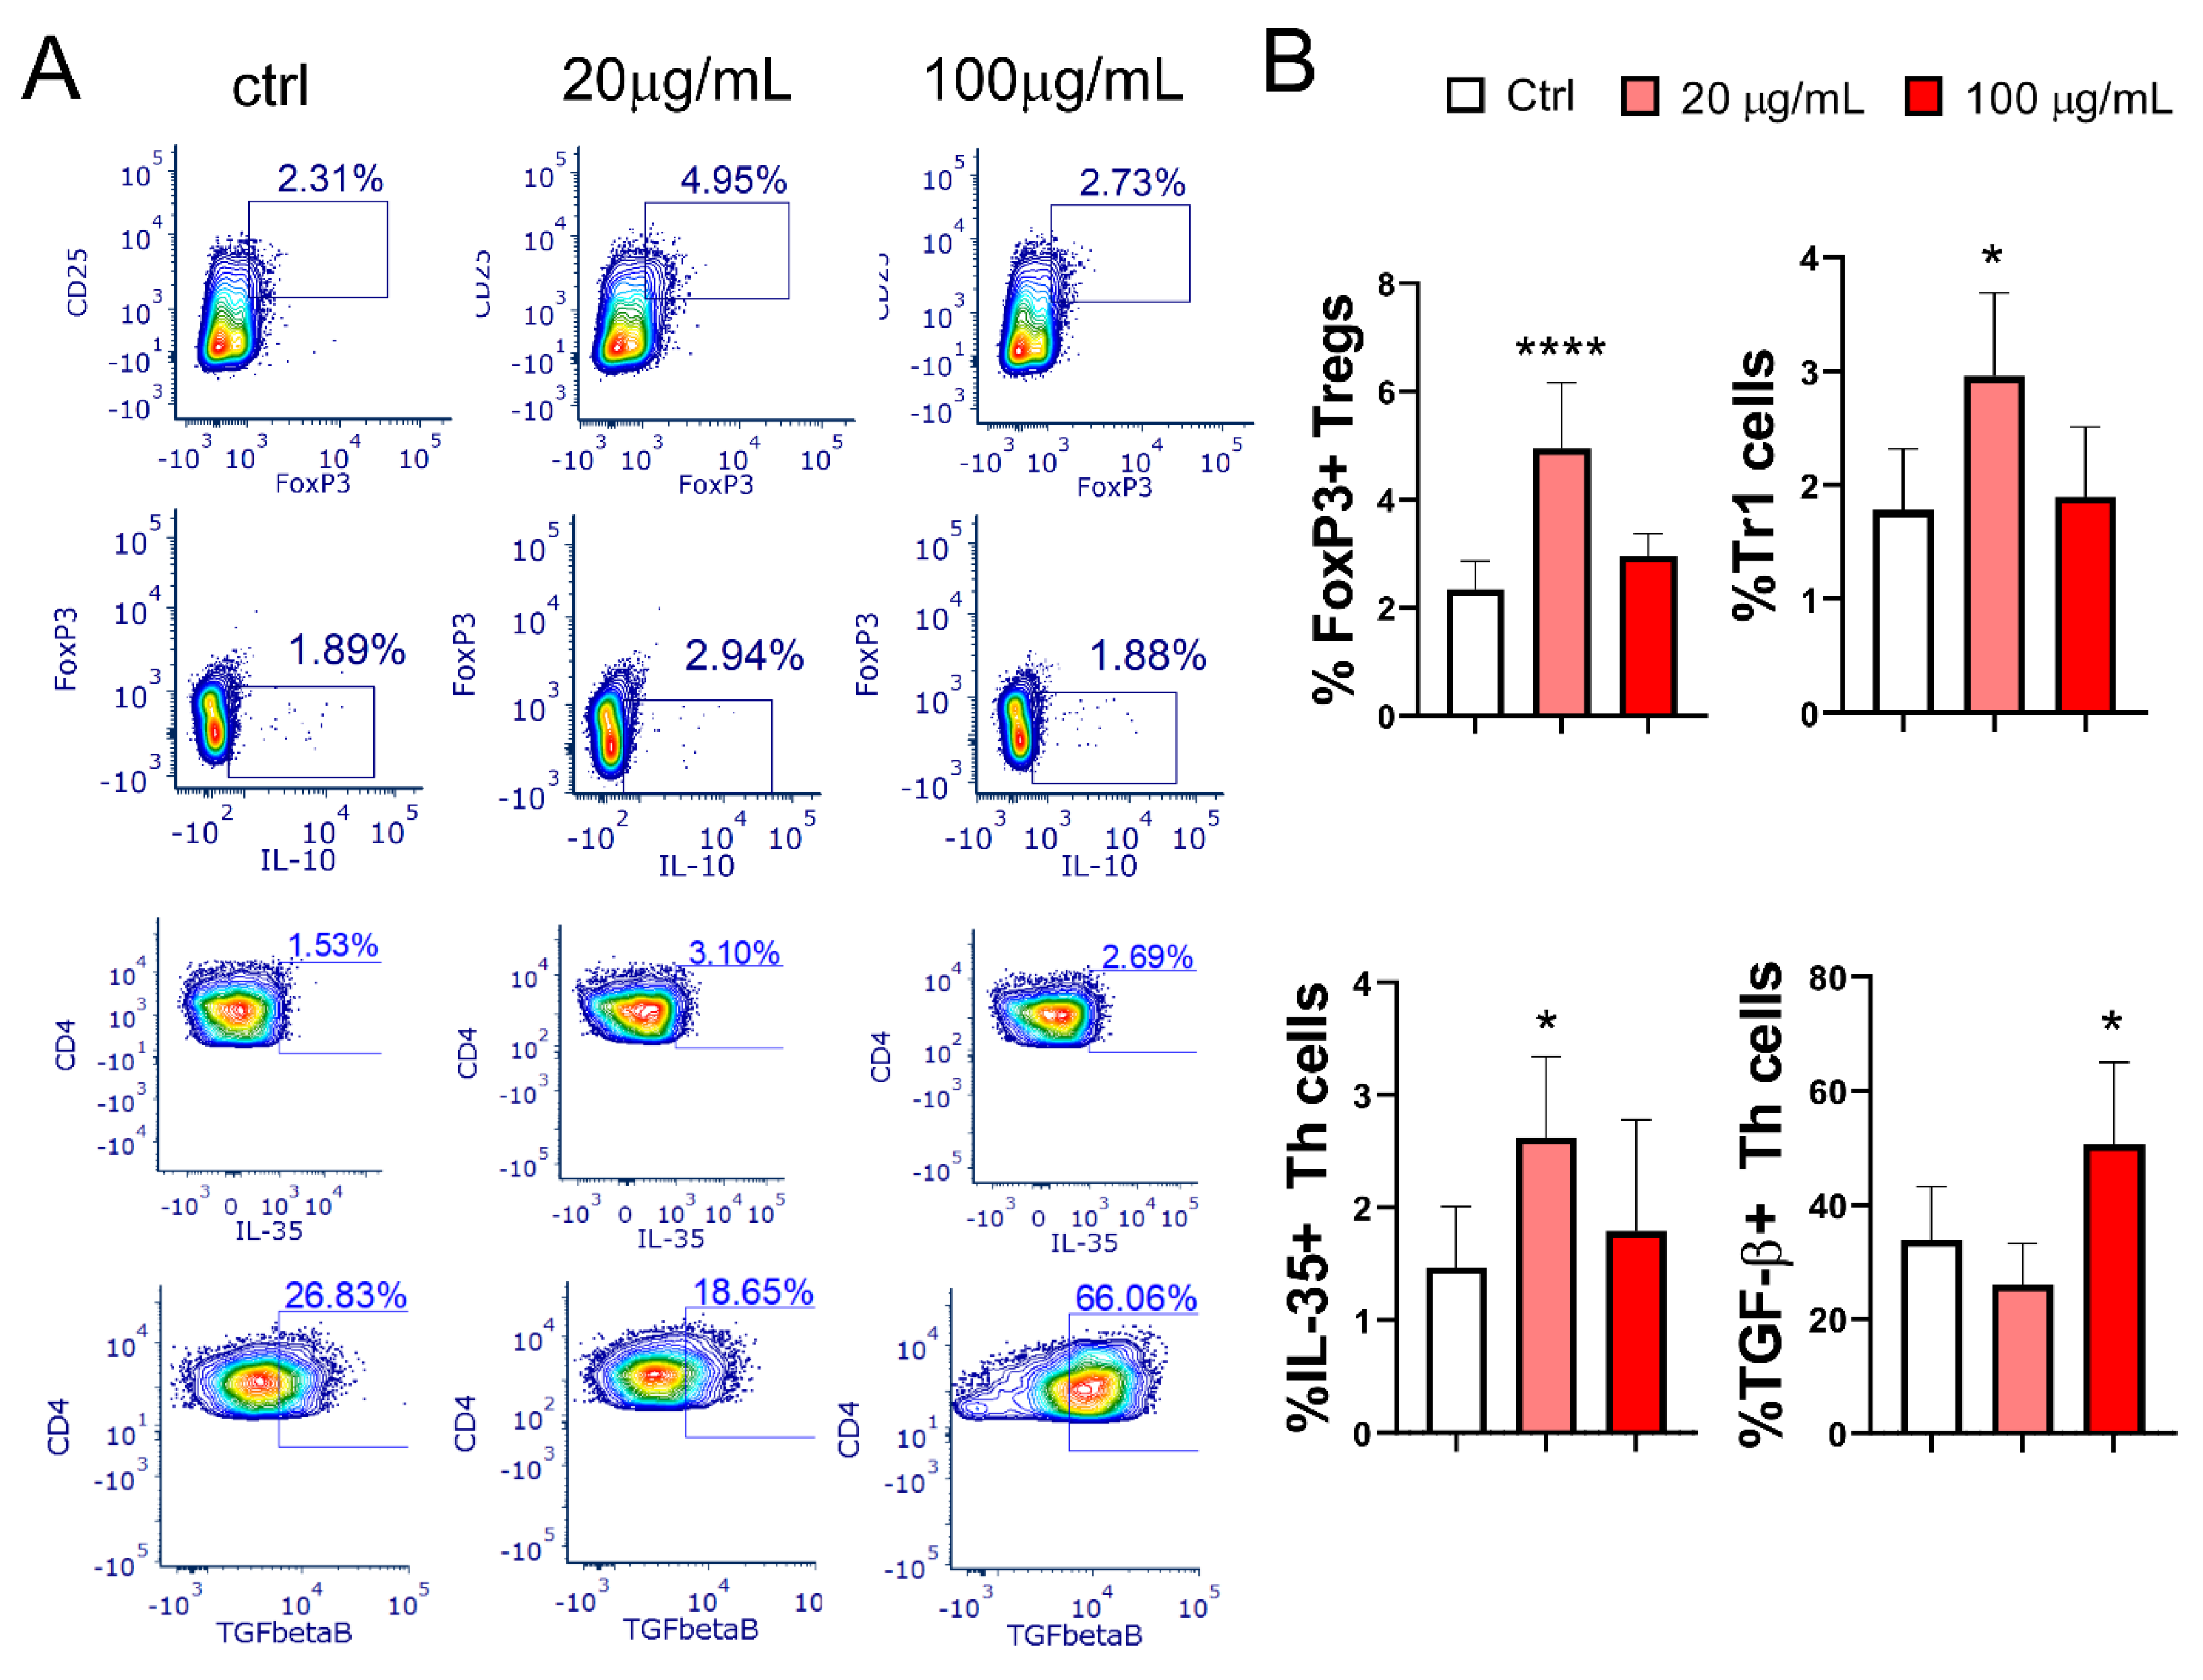
Figure 10.
Effect of EA 575-treated mMoDCs on the development of exhausted PD1+CD4+ T cells and cytotoxic CD4+granzyme B+ cells. Control and EA 575-treated mMoDCs were co-cultured with purified T cells as described in the Materials and Methods section. The subsets of exhausted Th cells and cytotoxic Th cells were identified by flow cytometry based on the expression of characteristic markers. A) Representative flow cytometry plots from one experiment. B) Mean percentages of positive cells ± SD (n = 6 donors). *p < 0.05; **p < 0.01; ***p < 0.001 compared to control (Ctrl).
Disclaimer/Publisher’s Note: The statements, opinions and data contained in all publications are solely those of the individual author(s) and contributor(s) and not of MDPI and/or the editor(s). MDPI and/or the editor(s) disclaim responsibility for any injury to people or property resulting from any ideas, methods, instructions or products referred to in the content. |
© 2025 by the authors. Licensee MDPI, Basel, Switzerland. This article is an open access article distributed under the terms and conditions of the Creative Commons Attribution (CC BY) license (http://creativecommons.org/licenses/by/4.0/).
Copyright: This open access article is published under a Creative Commons CC BY 4.0 license, which permit the free download, distribution, and reuse, provided that the author and preprint are cited in any reuse.


