Submitted:
05 May 2025
Posted:
06 May 2025
You are already at the latest version
Abstract
Forest carbon monitoring represents a cornerstone of global climate mitigation strategies, particularly under the accelerating push toward carbon neutrality. Recent advances in remote sensing technologies, geographic information systems (GIS), and artificial intelligence (AI) have transformed the capacity to quantify forest carbon dynamics across scales. This review synthesizes developments from 2020 to 2025, focusing on the integration of multi-source remote sensing data—including optical, SAR, and LiDAR—into scalable, GIS-based carbon monitoring systems. We systematically evaluate modeling frameworks ranging from empirical regression to machine learning, deep learning, and process-based ecological models, emphasizing their performance, scalability, and uncertainty management. Furthermore, we examine the operationalization of these technologies in national carbon accounting systems, REDD+ monitoring frameworks, and voluntary carbon markets. Case studies from Brazil and the Congo Basin illustrate diverse implementation pathways. Key challenges—including data standardization, model transferability, and high-resolution cost barriers—are critically assessed. Finally, future directions highlight the need for AI-augmented modeling, cloud-native workflows, and integrated sky-to-ground monitoring networks to enable real-time, policy-relevant carbon assessments. Together, these elements frame a next-generation forest carbon monitoring paradigm that is scientifically robust, operationally scalable, and aligned with global carbon neutrality goals.
Keywords:
Forest Carbon Monitoring
; Remote Sensing Data Fusion
; GIS-Based Spatial Modeling
; Carbon Neutrality
; REDD+ MRV Systems
1. Introduction
Forests constitute one of the largest and most vital terrestrial carbon sinks, absorbing atmospheric CO₂ via photosynthesis and storing it in biomass and soils. Globally, they sequester an estimated 2–4 Pg C yr⁻¹, effectively buffering the rise in greenhouse gas concentrations and playing a critical role in climate stabilization efforts [1,2]. This ecosystem service renders forests indispensable to achieving the Paris Agreement’s temperature targets (1.5–2 °C) and mid-century carbon neutrality trajectories [3,4]. As a nature-based mitigation strategy, enhancing forest carbon uptake is among the most cost-effective options for offsetting residual anthropogenic emissions [5,6].
However, the persistence of forests as net carbon sinks is increasingly uncertain under the dual pressures of climate change and anthropogenic disturbance. Warming temperatures, shifting precipitation regimes, and intensifying disturbances—such as drought, wildfire, and pests—can reduce forest productivity and increase mortality, while deforestation and degradation, particularly in tropical regions, release over 1 Pg C annually [3,7]. The global net sink depends on the dynamic balance between such emissions and regrowth. Despite significant losses, synthesis studies combining inventory and remote sensing data report a persistent net sink of ~0.4 Pg C yr⁻¹ over the past three decades [1,8], though uncertainties remain high.
In the context of carbon neutrality and sustainable development, protecting and expanding forest carbon sinks is a key priority. Many countries have included afforestation, reforestation, and sustainable forest management in their Nationally Determined Contributions (NDCs), supported by international mechanisms like REDD+, which ties conservation outcomes to verifiable emissions reductions [3,9]. Accurate and transparent quantification of forest carbon stocks and their temporal changes is thus essential for policy, governance, and international reporting [10,11]. Moreover, forests provide critical co-benefits—biodiversity conservation, hydrological regulation, and livelihoods—aligning climate action with broader sustainability goals. Initiatives such as the Bonn Challenge and the Paris Agreement’s land-use targets underscore the need for robust monitoring systems capable of capturing both carbon gains (e.g., natural regrowth, plantations) and losses (e.g., deforestation, degradation) with spatial and temporal precision [3,9,11,12]. As this review outlines, remote sensing and GIS technologies are emerging as indispensable tools for enabling such monitoring at scale.
Traditionally, forest carbon estimation has relied on field-based inventories, wherein tree measurements within sample plots are converted to biomass and carbon estimates using species-specific or generalized allometric equations [13,14]. While these methods offer high accuracy at the plot level, they are resource-intensive, limited in spatial coverage, and often infeasible in remote or data-poor tropical regions—resulting in large uncertainties when extrapolating to regional or national scales [10,15]. The advent of satellite remote sensing, beginning with Landsat-1 in 1972, revolutionized forest monitoring by providing consistent, synoptic observations, enabling a shift from sparse sampling to systematic, large-scale assessment [16].
Over the past two decades, remote sensing capabilities have expanded substantially. Moderate-resolution optical sensors such as Landsat and Sentinel-2 (10–30 m spatial resolution, 5–16-day revisit) enable the monitoring of forest cover, phenology, and vegetation indices (e.g., NDVI, EVI), which have been empirically linked to above-ground biomass (AGB) [14,17,18]. Although optical signals saturate in dense tropical canopies [19], they remain essential for mapping forest extent and condition, particularly due to their long historical archives. Applications include AGB modeling in subtropical China using Landsat-8 and Sentinel-2 (R² ~ 0.65) [18], and carbon estimation in Brazil’s Atlantic Forest with <20% error when stratified by successional stage [19]. Complementary data from thermal and passive microwave sensors (e.g., MODIS, ECOSTRESS, SMOS, SMAP) provide information on surface temperature, evapotranspiration, and vegetation optical depth (VOD), with the latter showing strong correlations to biomass and water status, especially in humid tropical forests [20-23]. Figure 1 illustrates a conceptual framework for monitoring forest phenological changes based on multi-source remote sensing platforms, including satellites, UAVs, and ground-based sensors. The workflow encompasses vegetation index calculation, data smoothing, mathematical modeling, and phenological event extraction, which collectively support the estimation of seasonal biomass dynamics and carbon flux variations [24].
Active remote sensing, particularly Synthetic Aperture Radar (SAR) and spaceborne LiDAR, has enabled more direct quantification of forest structure. L-band and P-band SAR systems (e.g., ALOS PALSAR, ESA’s BIOMASS mission) are especially sensitive to woody biomass, while C-band systems like Sentinel-1 are effective for cloud-penetrating forest change detection but have reduced sensitivity to high-biomass canopies [25]. SAR interferometry (InSAR), exemplified by TanDEM-X, provides canopy height estimates critical for structural modeling [26]. Integration of SAR with optical data improves biomass estimation, as demonstrated in Indian tropical forests and boreal ecosystems where multisensor fusion reduced model error and improved robustness [27,28]. NASA’s GEDI LiDAR mission (2019–2023) marked a major advance, collecting billions of waveform returns at ~25 m footprints globally, capturing vertical canopy structure for AGB estimation [29]. Despite its sparse sampling (~1–2% global land area), GEDI provides an essential calibration layer when fused with radar and optical data, as shown in high-resolution biomass mapping of the Brazilian Amazon using GEDI, ICESat-2, Sentinel-1, and optical inputs [30,31]. Recent studies have further demonstrated the efficacy of integrating SAR and LiDAR data for accurate biomass estimation [32,33].
Geographic Information Systems (GIS) play a pivotal role in synthesizing heterogeneous data sources—field measurements, optical imagery, radar, and LiDAR—into spatially explicit carbon models. This integration facilitates advanced mapping of forest structure and carbon stocks, as detailed in Section 3 and Section 4. The surge in peer-reviewed literature on remote sensing–based forest carbon assessments over the past two decades reflects the growing adoption of these technologies [34]. Increasingly, studies deploy machine learning and multi-sensor fusion to overcome the limitations of individual datasets, enhancing the scalability and precision of carbon estimates. Concurrent advances in GIS enable the management of massive geospatial datasets and the incorporation of ancillary layers (e.g., elevation, land tenure), thereby supporting applications ranging from near-real-time deforestation alerts to national-scale biomass inventories. Collectively, these developments have transformed forest carbon monitoring into a dynamic, high-resolution, and policy-relevant system aligned with the growing demand for verifiable, high-frequency data to support climate mitigation and carbon neutrality objectives [35].
This review highlights recent progress (mainly 2020–2025) in remote sensing and GIS-based forest carbon monitoring, focusing on technologies that support global carbon neutrality targets. Section 2 summarizes key data sources, including satellite sensors (optical, thermal, radar), UAV and airborne platforms (LiDAR, hyperspectral), and auxiliary datasets such as field inventories and climate data. Section 3 discusses multi-source integration, emphasizing fusion of optical, radar, and LiDAR data, spatial modeling in GIS environments, 3D forest reconstruction, and time-series analysis for monitoring carbon flux. Section 4 evaluates carbon estimation methods, from empirical models and regressions to advanced machine learning (e.g., random forests, neural networks) and ecosystem process models (e.g., CASA, InVEST, Biome-BGC), with a focus on accuracy, scalability, and uncertainty.
Applications reviewed in Section 5 include national carbon inventories, REDD+ monitoring, land-use change detection, and smart forestry systems. These tools are central to carbon accounting and climate mitigation strategies. Section 6 addresses key challenges—data inconsistency, model generalizability, high-resolution cost trade-offs, and lack of ground validation, especially in remote regions. Section 7 outlines future directions: cloud platforms (e.g., Google Earth Engine), AI-augmented modeling, integrated satellite-to-ground monitoring networks, and operational GIS-remote sensing systems for nature-based climate solutions. Section 8 concludes with a summary of current advances, implications for forest governance, and the need for continued innovation and collaboration.
This review provides a global perspective, integrating examples across biomes to inform researchers and decision-makers on the evolving capabilities and frontiers of forest carbon monitoring. Unlike previous reviews that primarily focus on technical advancements in remote sensing methods for forest carbon stock estimation (e.g., Xu et al. 2025 [36]), this study provides a systems-level synthesis that integrates RS, GIS, and ecosystem modeling frameworks under the carbon neutrality agenda. It highlights both methodological progress and policy-oriented applications to inform national and global forest carbon monitoring strategies. To further contextualize the contribution of this review within the existing body of literature, we provide a direct comparison with the recent work by Xu et al. (2025), which presents a comprehensive review of remote sensing technologies for forest carbon estimation. Table 1 outlines key distinctions in scope, methodology, and intended application between the two reviews. While Xu et al. focus predominantly on sensor-specific capabilities and classification of empirical and process-based modeling approaches, their treatment of carbon monitoring remains largely decoupled from policy frameworks and real-world implementation. In contrast, this review is explicitly structured to align remote sensing innovations with the carbon neutrality agenda, integrating national policy demands, REDD+ mechanisms, and case studies to bridge technical feasibility with governance relevance.
2. Data Foundations for Forest Carbon Monitoring
2.1. Optical Satellite Data
Optical satellite sensors have long served as the primary backbone of large-scale forest monitoring efforts. Instruments such as Landsat 8/9 (30 m; 16-day revisit) and Sentinel-2 (10–20 m; ~5-day revisit) offer consistent, high-quality multispectral data spanning the visible to shortwave infrared (SWIR) regions. These sensors enable the calculation of vegetation indices (e.g., NDVI, EVI, NDWI), which serve as proxies for canopy greenness, leaf area, and vegetation vigor—key parameters linked to carbon assimilation and storage potential [5,17,19,28].
Despite their utility, optical indices tend to saturate in high-biomass tropical forests (>150–200 Mg ha⁻¹), limiting their direct applicability in dense forest carbon estimation [10]. However, they remain indispensable for forest classification, change detection, and phenological monitoring, particularly when calibrated with field inventories or structure-sensitive datasets such as LiDAR [18,31].
Thermal infrared sensors (e.g., MODIS TIRS, VIIRS) contribute ancillary information relevant to ecosystem carbon dynamics by measuring land surface temperature, which reflects drought stress and fire susceptibility. These inputs support productivity and respiration parameterization in process-based carbon flux models [37]. Additionally, passive microwave sensors such as SMOS and SMAP provide coarse-resolution (9–40 km) estimates of vegetation optical depth (VOD), a variable correlated with canopy water content and total biomass. VOD time series have demonstrated sensitivity to interannual biomass changes, particularly during extreme climatic events such as the 2015 Amazon drought [22,23].
2.2. Radar and Microwave Observations
Synthetic Aperture Radar (SAR) systems provide all-weather, day-and-night imaging capabilities, making them particularly valuable in persistently cloudy tropical regions. C-band SAR (e.g., Sentinel-1, ~10 m) is suitable for detecting deforestation and degradation but saturates at relatively low AGB levels. In contrast, L-band systems (e.g., ALOS-2 PALSAR-2) offer improved sensitivity to canopy structure in low- to mid-biomass stands (~100–150 Mg ha⁻¹) [25,27] . Forthcoming P-band missions, such as ESA’s BIOMASS satellite, are explicitly designed to penetrate dense canopies and estimate AGB in high-biomass tropical and boreal forests [25].
Interferometric SAR (InSAR) techniques, which exploit phase differences between multiple acquisitions, allow the retrieval of canopy height and vertical structure dynamics. Previous missions such as SRTM (C-band) and TanDEM-X (X-band) have produced global digital elevation models, which, when integrated with L-band backscatter data, substantially enhance AGB estimates [20,26,34].
The fusion of SAR with optical and LiDAR data has become a standard practice. SAR provides structural sensitivity, optical sensors deliver biochemical and phenological information, and LiDAR ensures vertical precision and calibration fidelity. This synergistic integration enables the production of spatially explicit, high-resolution biomass maps and enhances the robustness of national forest inventories and REDD+ MRV (Monitoring, Reporting and Verification) systems [27,30,31].
2.3. LiDAR Observations
Light Detection and Ranging (LiDAR) technologies represent a paradigm shift in forest structure monitoring by enabling direct, three-dimensional measurement of canopy geometry. Airborne LiDAR scanning (ALS), with point densities of 5–20 pts/m², captures canopy height, foliage vertical profiles, and structural heterogeneity at high fidelity. When calibrated with field plots, ALS-derived structural metrics have yielded AGB estimation errors typically ranging between 5–15% across forest types [30,38].
At the orbital scale, NASA’s GEDI (Global Ecosystem Dynamics Investigation) mission has pioneered systematic sampling of vertical forest structure from the International Space Station. Despite covering only ~4% of global forests, GEDI footprints (~25 m diameter) provide critical training and validation data for extrapolating biomass estimates from wall-to-wall satellite observations [30,39]..
LiDAR also supports object-based approaches to biomass estimation. Algorithms applied to ALS and terrestrial LiDAR point clouds can delineate individual tree crowns, retrieve height and crown width, and estimate per-tree AGB via allometric relationships [16,29]. Moreover, multi-temporal LiDAR acquisitions enable precise detection of subtle structural changes due to degradation, regeneration, or selective logging—changes often invisible in spectral data [38]. As LiDAR costs decline and mission coverage expands, its role as a reference standard for multi-sensor biomass modeling is expected to persist.
2.4. UAV and Airborne Remote Sensing
Unmanned Aerial Vehicles (UAVs) and crewed airborne platforms provide ultra-high-resolution data that are indispensable for local-scale carbon assessments, model calibration, and validation. UAVs equipped with RGB cameras and Structure-from-Motion (SfM) photogrammetry generate detailed orthomosaics and canopy height models (CHMs) at sub-meter resolutions. For instance, UAV surveys in Indian coniferous forests produced CHMs with ~0.1 m vertical accuracy, closely matching field inventory data and supporting robust single-tree AGB estimation [26].
Airborne platforms, carrying LiDAR and hyperspectral sensors, offer broader spatial coverage (~100–1000 km²) while retaining high resolution (0.5–5 m). Programs such as NASA’s Carbon Monitoring System (CMS) integrate these observations to generate regional biomass maps and train satellite-based models [31]. Imaging spectroscopy provides additional insights into foliar biochemical properties (e.g., chlorophyll, nitrogen, cellulose), species composition, and physiological stress, which are crucial for stratified biomass estimation [28].
UAV and airborne thermal sensors further enhance carbon vulnerability assessment by mapping canopy temperature—an early indicator of water stress and potential mortality. These platforms serve as a critical intermediate scale, linking plot-level measurements and coarse-resolution satellite pixels, thereby supporting scalable, calibrated biomass modeling frameworks [30,39].
2.5. Auxiliary Data: Field Observations and Environmental Covariates
Field-based measurements remain the empirical cornerstone of carbon estimation, providing direct quantification of forest attributes and anchoring remote sensing models to observed biomass. National Forest Inventories (NFIs), such as those in China [13,16] and the United States [17,18], offer consistent longitudinal datasets for carbon stock assessment. In data-deficient tropical regions, international networks (e.g., RAINFOR, AfriTRON, TmFO) play a pivotal role by supplying spatially distributed, standardized field plots—often co-located with airborne or spaceborne LiDAR acquisitions [30,38].
In addition, ancillary geospatial layers—including land cover maps, climate variables (e.g., temperature, precipitation), topography, and soil properties—serve as essential covariates in statistical and process-based carbon models [27,40]. Socioeconomic and infrastructure data (e.g., road networks, protected areas) further inform spatial drivers of deforestation and carbon flux. These heterogeneous datasets are integrated in GIS platforms to support model stratification, spatial alignment, and uncertainty assessment [35,41,42], thereby enabling robust, policy-relevant carbon accounting systems.
Table 2 summarizes the representative remote sensing data sources currently utilized for forest carbon monitoring, outlining their sensor types, spatial and temporal resolutions, revisit frequencies, and major contributions to carbon stock estimation and change detection. This overview highlights the complementary strengths of different platforms and serves as a reference for selecting appropriate datasets in operational Monitoring, Reporting, and Verification (MRV) systems.
3. Modeling Layer: Data Integration and Biomass Estimation Methods
3.1. Multi-Source Data Fusion and Uncertainty Management for Forest Carbon Monitoring
3.1.1. Multi-Source Data Fusion Techniques
Modern forest carbon monitoring demands integration across remote sensing modalities. Multi-source data fusion—combining optical, radar, LiDAR, thermal, and microwave observations—overcomes the inherent limitations of single sensors. By synthesizing complementary information on canopy structure, vegetation vigor, and surface roughness, fusion frameworks produce more accurate, spatially complete estimates of aboveground biomass (AGB) across heterogeneous forest landscapes.
Feature-level fusion is currently the most prevalent integration strategy. In this approach, remote sensing datasets are co-registered spatially and temporally, and relevant features (e.g., vegetation indices, radar backscatter, elevation, or canopy metrics) are extracted and used as joint inputs into statistical or machine learning models. Typical data combinations include optical indices (e.g., NDVI, EVI, NDWI) from sensors such as Landsat and Sentinel-2, backscatter coefficients from SAR sensors (e.g., Sentinel-1, ALOS-2 PALSAR), and structural information from digital elevation models (e.g., SRTM) or airborne laser scanning (ALS). Optical sensors provide vital spectral information on vegetation vigor and chlorophyll activity, while radar data contribute structural sensitivity under persistent cloud cover or closed canopy conditions. The synergy between spectral and structural parameters improves robustness and resolves saturation issues commonly observed in high-biomass regimes.
Several case studies highlight the operational efficacy of this approach. In tropical dry forests, Sinha [27]demonstrated that integrating Landsat spectral indices with C-band (Sentinel-1) and L-band (ALOS PALSAR) SAR data significantly enhanced AGB prediction performance. Similarly, a study conducted in northern China employed a random forest model incorporating Sentinel-1 VV/VH backscatter, Sentinel-2 multispectral bands, ALOS PALSAR L-band HH/HV, and SRTM elevation data, resulting in a cross-validated R² of 0.77—substantially outperforming single-sensor models [39].
LiDAR-enhanced fusion frameworks have become increasingly prominent following the deployment of spaceborne LiDAR missions such as GEDI and ICESat-2. These datasets, although spatially sparse and temporally discontinuous, offer high-precision canopy height and vertical structure information, making them ideal for calibrating or validating wall-to-wall predictions. For instance, Ometto et al. [44] successfully combined GEDI-derived height metrics, ICESat-2 canopy structure, Sentinel-1 radar backscatter, and optical indices using gradient boosting regression to map AGB in the Brazilian Amazon. Their integrated model achieved regional mean errors as low as ~10%, offering one of the most spatially explicit biomass products to date in high-biomass tropical ecosystems.
Temporal fusion—combining multi-seasonal or multi-year observations—further enhances monitoring by mitigating cloud-related gaps and accounting for phenological variability. This is especially important in subtropical and monsoonal forest zones, where data availability can be seasonally constrained. For example, in southern China, seasonal fusion of Sentinel-2 and radar time-series has improved temporal coherence in AGB estimates and enabled annual monitoring at 10–30 m resolution [45].
In addition to traditional feature-level fusion, recent studies have explored decision-level fusion, where multiple models are trained on different sensor datasets and their outputs are subsequently aggregated. Ensemble techniques, such as stacking or voting, increase generalizability and reduce sensor-specific biases across biomass gradients [46]. These approaches are particularly effective in large-area applications where forest composition and disturbance regimes vary substantially.
The operationalization of multi-source fusion has been significantly facilitated by the emergence of cloud-based geospatial platforms. Open-access infrastructures such as Google Earth Engine (GEE), FAO’s SEPAL, and Amazon Web Services (AWS) provide computational scalability and democratized access to petabyte-scale satellite archives, allowing researchers to conduct data fusion and biomass estimation workflows without requiring high-performance local hardware. These platforms support model deployment, result visualization, and cross-scale harmonization—capabilities essential for national forest inventories and REDD+ monitoring, reporting, and verification (MRV) systems [47-49].
Despite these advances, several challenges persist. First, sensor interoperability and cross-calibration require careful handling to prevent systematic biases. Second, spatial and temporal mismatches between datasets can introduce artifacts unless appropriately normalized. Third, the computational complexity of fusing high-dimensional data requires optimized algorithms and scalable architectures. Future research directions should therefore focus on automated feature engineering, uncertainty quantification in fusion outputs, and the development of standardized pipelines for operational biomass monitoring.
Multi-source data fusion represents a pivotal advancement in forest carbon monitoring, enabling high-resolution, spatially explicit, and temporally consistent AGB estimation across diverse forest types and climatic zones. The strategic integration of optical, radar, and LiDAR data—augmented by machine learning and open-access computing platforms—is ushering in a new era of policy-relevant, observation-constrained forest carbon modeling.
Despite the advances in fusion strategies, the compounded uncertainties introduced by integrating heterogeneous datasets pose a critical challenge. Understanding and managing these uncertainties are essential for producing credible biomass estimates and ensuring transparency in carbon reporting frameworks. The following section (3.1.2) details the mechanisms of uncertainty propagation and current best practices for addressing these errors.
3.1.2. Uncertainty Propagation and Error Analysis in Multi-source Fusion
Multi-source fusion integrates diverse sensor observations to enhance forest carbon monitoring. However, it simultaneously compounds errors originating from sensor noise, geolocation mismatches, temporal discrepancies, and modeling approximations. If unaddressed, these uncertainties propagate through the fusion process, biasing biomass estimates and compromising their utility for policy applications.
The main sources of uncertainty include radiometric inconsistencies in optical data, SAR signal saturation in dense forests, LiDAR sampling limitations, and misalignment between datasets collected at different times or resolutions (Table 3). Model-related uncertainties further arise from assumptions embedded in machine learning or empirical regression frameworks.
Quantifying how these uncertainties interact, and influence biomass predictions is critical. Two principal approaches dominate current practice:
Monte Carlo Simulation (MCS) assigns statistical error distributions to each input dataset, then generates multiple synthetic realizations through random sampling. Biomass estimation models are applied to each realization, producing ensembles of predictions from which pixel-level confidence intervals can be extracted. MCS captures nonlinear interactions between errors and provides spatially explicit uncertainty surfaces.
Analytical Error Propagation, in contrast, applies Taylor series approximations to derive the variance of model outputs as a function of input uncertainties. Although computationally efficient, this method assumes linear relationships and may underestimate uncertainty in complex fusion scenarios.
Both approaches require robust characterization of input error distributions, not ad hoc assumptions. Best practices mandate uncertainty quantification at every processing stage, from raw data ingestion to final biomass estimation. Uncertainty layers should be reported alongside biomass maps to enable transparent interpretation, risk assessment, and policy application.
To systematically characterize and quantify uncertainties in multi-source forest carbon monitoring, the key processing stages are outlined schematically in Figure 2.
Recent studies exemplify these principles. Ometto et al. (2023) combined GEDI height metrics and Sentinel-1 backscatter using MCS, generating biomass maps with spatially variable confidence intervals across the Brazilian Amazon. Such uncertainty-aware products are increasingly demanded by REDD+ MRV frameworks and carbon markets, where overconfident estimates can have financial and legal implications[44].
Without systematic uncertainty analysis, multi-source fusion risks delivering precise but inaccurate carbon stock assessments. Future workflows must embed uncertainty modeling as a standard component, elevating remote sensing–based biomass estimation from heuristic mapping to rigorous, decision-grade science.
3.2. Empirical Regression and Allometric Approaches
Empirical regression methods have served as the backbone of forest biomass estimation in remote sensing studies for several decades due to their conceptual simplicity, methodological transparency, and strong linkage to field-measured biomass. These models typically establish statistical relationships between remote sensing–derived metrics—such as vegetation indices, backscatter coefficients, or LiDAR canopy height—and reference biomass values obtained from field plots through allometric equations calibrated via destructive sampling or forest inventory data [50]. The approach is especially prevalent in national GHG inventory systems and REDD+ MRV applications, where transparency, reproducibility, and policy compliance are paramount [23].
A wide array of functional forms has been employed to describe the biomass–signal relationship, including linear, exponential, logarithmic, and power functions, depending on the sensor type, forest condition, and biomass range [51]. In low- to moderate-biomass forests, linear or exponential models using NDVI or EVI often perform adequately. However, in high-biomass forests—particularly tropical evergreen stands—optical indices tend to saturate beyond 150–200 Mg ha⁻¹, resulting in substantial underestimation [52]. In such cases, radar-based backscatter, particularly L-band SAR, is frequently substituted, although it too exhibits saturation at higher biomass levels. LiDAR-derived metrics, such as mean canopy height or percentile height distributions (e.g., H90), have shown superior performance in such contexts due to their structural sensitivity [53].
To address signal saturation and ecological heterogeneity, stratified regression is commonly employed. In this method, forests are grouped into relatively homogeneous strata based on forest type, age class, or eco-region, and separate models are developed within each stratum. This approach has been shown to improve estimation accuracy by accounting for differences in species composition and structural development [54]. For example, dry deciduous forests and moist evergreen forests may require distinct modeling strategies, even when using the same input features.
Recent refinements have also addressed the issue of spatial non-stationarity in the predictor–response relationships. Geographically Weighted Regression (GWR) has emerged as a spatially adaptive alternative to global regression, allowing model coefficients to vary across space and better capture localized ecological dynamics [55]. GWR is particularly effective in fragmented or topographically complex landscapes, where a single set of coefficients may fail to account for regional variability. However, GWR models are computationally intensive and sensitive to kernel bandwidth selection, which can affect local model stability.
Overfitting is another concern, especially when multiple correlated predictors are used. Regularization techniques such as Least Absolute Shrinkage and Selection Operator (LASSO) and Ridge regression have been increasingly applied to constrain model complexity and enhance generalization [56,57]. These methods introduce penalty terms to reduce variance and are particularly effective in high-dimensional settings involving multi-sensor fusion datasets.
Allometric equations, which serve as the foundation for translating field-measured tree metrics into biomass, remain integral to the calibration of remote sensing–based regression models. These equations often follow a power-law form (e.g., Biomass = a × DBH^b), where DBH is diameter at breast height, and the coefficients a and b are species- or region-specific. When applied in conjunction with remotely sensed canopy metrics—particularly LiDAR-derived height or crown area—these equations help bridge the gap between structural observation and biomass quantification. Studies that combine remote sensing with locally calibrated allometric models have demonstrated superior predictive accuracy compared to using global allometries, which may fail to account for regional morphological variation [50,58].
Despite their advantages, empirical regression models exhibit several limitations that constrain their utility in large-scale and heterogeneous settings. First, their predictive performance is often tightly bound to the calibration domain, limiting transferability. Second, they typically assume a fixed functional form, which may be overly simplistic for complex ecosystems exhibiting non-linear or threshold-based biomass responses. Third, while computationally lightweight, they lack the capacity to explicitly model ecological processes, such as carbon fluxes, phenological transitions, or disturbance recovery trajectories.
Nonetheless, empirical models remain foundational for several reasons. Their implementation is straightforward, requiring minimal computational infrastructure and limited expertise in algorithmic optimization. They are also inherently interpretable, with clear parameter meanings that are useful for communicating results to policymakers and stakeholders. Consequently, many countries continue to rely on regression-based approaches for Tier 2 REDD+ reporting, especially in data-scarce regions where more advanced models may not be feasible.
In summary, empirical regression and allometric modeling approaches occupy a critical niche in the forest carbon estimation toolkit. While they are gradually being supplanted by more flexible machine learning and process-based frameworks in research applications, they continue to serve as essential baselines and benchmarks in operational systems. Future work may focus on integrating these models into hybrid frameworks that leverage their interpretability while addressing their structural limitations through spatial stratification, adaptive regression, and selective fusion with machine learning algorithms.
3.3. Machine Learning Approaches
Machine learning (ML) techniques have become central to forest carbon estimation workflows, driven by the increasing volume, complexity, and heterogeneity of remote sensing data. These methods are particularly adept at modeling non-linear relationships and high-dimensional feature spaces, offering distinct advantages over traditional empirical regression approaches in terms of flexibility, scalability, and predictive power. As such, ML-based biomass models are now widely employed across forest types, bioclimatic zones, and geographic scales, from local demonstration plots to national carbon monitoring systems [30,39].
Among ML algorithms, ensemble tree-based methods such as Random Forests (RF) and Gradient Boosting Machines (GBMs) have seen the most widespread adoption in forest carbon modeling. RF operates by constructing a large number of decision trees using bootstrapped samples and randomly selected subsets of input features. The final prediction is derived from the ensemble average, which enhances model robustness and reduces variance [59]. RF is highly tolerant of multicollinearity and noise in predictor variables, making it especially well-suited for integrating multi-source remote sensing data, including spectral bands, vegetation indices, SAR backscatter, LiDAR-derived structural metrics, and topographic variables.
Numerous studies have demonstrated the effectiveness of RF in forest biomass estimation. For example, in a study conducted in northern China, an RF model incorporating Sentinel-1 C-band SAR, Sentinel-2 spectral indices, ALOS-2 PALSAR L-band backscatter, and SRTM DEM data achieved an R² of 0.77, significantly outperforming single-sensor models [39]. Similarly, in the Congo Basin and across boreal regions, RF has been used to integrate GEDI LiDAR, optical time series, and ancillary covariates to produce spatially explicit aboveground biomass (AGB) maps at 30–100 m resolution with relative errors typically below 20% [30,60].
GBMs, including variants such as XGBoost, LightGBM, and CatBoost, build models sequentially by iteratively correcting the residuals of previous models. This approach enables them to capture complex feature interactions and fine-scale patterns in biomass distributions, particularly in structurally diverse landscapes or anthropogenically disturbed regions [61,62]. While GBMs generally achieve higher accuracy than RF when hyperparameters are carefully tuned, they are more sensitive to overfitting and require additional computational effort during training. In biomass modeling applications, GBMs have been effectively used to integrate GEDI-derived canopy metrics with Sentinel-2 imagery and bioclimatic variables in the Amazon, achieving mean biomass prediction errors as low as 10% [44].
In addition to RF and GBMs, other ML algorithms have been explored for biomass estimation, including Support Vector Machines (SVMs), k-Nearest Neighbors (kNN), and multivariate adaptive regression splines (MARS). However, these methods have seen more limited application due to interpretability issues, sensitivity to input parameterization, and relatively poor scalability when faced with large remote sensing datasets [63]. Despite this, SVMs remain of interest for small-scale, high-precision mapping projects, particularly in homogenous plantation systems or well-inventoried study areas.
Geospatial variants of ML methods are also emerging. For example, Geographic Random Forests and spatially explicit GBMs allow model coefficients or splits to vary by location, accounting for non-stationary relationships across ecological gradients [64]. These adaptations are especially useful in topographically complex regions or where strong spatial autocorrelation in residuals is present. Integration with geostatistical tools such as kriging or Empirical Bayesian Kriging (EBK) further refines the spatial smoothness and continuity of biomass predictions [31].
Interpretability remains a key challenge for ML-based biomass models, particularly in the context of policy applications such as REDD+ or national GHG inventories. To address this, researchers are increasingly incorporating explainability tools such as variable importance scores, partial dependence plots, and SHAP (SHapley Additive exPlanations) values [61,62]. These tools help illuminate which input features drive predictions and allow for comparisons across regions or forest types. For instance, in a national-scale biomass map of Canada, RF model outputs were parsed using SHAP values to reveal that elevation, SAR backscatter, and canopy height were the most influential predictors in boreal zones, while NDVI and temperature played stronger roles in southern temperate forests [60].
ML models are particularly powerful when used in conjunction with multi-source data fusion (Section 3.1), enabling the synergistic use of optical, radar, LiDAR, and environmental variables. They also scale well to cloud computing platforms such as Google Earth Engine (GEE), allowing continental- or global-scale biomass mapping using preprocessed satellite archives [47-49].
However, ML approaches are not without limitations. They often require large, representative training datasets to avoid bias or overfitting—something not always available in tropical or data-poor regions. Moreover, their “black box” nature can pose challenges in stakeholder communication and in translating findings into actionable policy recommendations. As such, hybrid modeling frameworks that integrate ML with ecological constraints or process-based components are increasingly favored, offering a balance between predictive power and interpretability.
In conclusion, machine learning has revolutionized biomass estimation in remote sensing, enabling accurate, flexible, and scalable modeling across diverse forest environments. When supported by sufficient ground truth and thoughtful feature selection, ML-based models not only surpass traditional regression methods in accuracy but also serve as core components of next-generation carbon monitoring platforms.
3.4. Deep Learning Methods
Deep learning (DL), a subset of machine learning characterized by neural network architectures with multiple hidden layers, has become an emerging force in forest biomass estimation, particularly in contexts requiring the extraction of complex spatial patterns from high-dimensional remote sensing datasets. Unlike traditional ML algorithms that rely on handcrafted features, DL models can autonomously learn hierarchical representations from raw input data, making them especially suitable for applications involving optical imagery, LiDAR point clouds, and hyperspectral data [65].
The most widely used DL architecture in biomass estimation is the Convolutional Neural Network (CNN), originally developed for image classification and object detection tasks. CNNs are adept at capturing spatial dependencies and textures by applying convolutional filters across input imagery. In the context of forest carbon monitoring, CNNs have been employed to analyze multispectral and hyperspectral images for mapping canopy cover, stand structure, and biomass distributions at fine scales [34]. Their ability to learn spatial context has proven especially valuable in heterogeneous landscapes such as mixed forests, agroforestry mosaics, or post-disturbance recovery zones, where conventional pixel-wise regression models may struggle.
Several studies have demonstrated the superior performance of CNN-based biomass models compared to traditional regression or tree-based approaches. For example, a study using high-resolution UAV imagery and hyperspectral data in Malaysian tropical forests showed that a CNN model achieved lower root mean square error (RMSE) values than Random Forest and Support Vector Machine models when predicting AGB across structurally diverse stands [35]. CNNs are particularly effective in plantation forestry and urban forest settings, where regular planting geometry or anthropogenic edges create spatial patterns that are readily learned by convolutional kernels.
Beyond 2D imagery, the advent of 3D DL architectures has extended the applicability of deep learning to LiDAR-based biomass estimation. Models such as VoxelNet, PointNet, and PointCNN are capable of directly processing 3D point clouds or voxelized representations of forest structure without the need for prior rasterization or manual feature engineering [66]. These models extract volumetric and structural information, such as canopy height profiles, crown morphology, and gap distributions, and translate them into biomass predictions using end-to-end learning frameworks. In high-density airborne LiDAR datasets, such models have achieved per-plot biomass prediction accuracies exceeding those of conventional regression or ML methods, particularly in open-canopy or uneven-aged forest systems.
One notable advantage of DL approaches is their capacity to integrate multi-modal input streams. Recent developments include hybrid CNN architectures that simultaneously ingest optical, radar, and LiDAR-derived features through parallel input channels, enabling the fusion of spectral and structural information in a single model. Such architectures have been used to detect subtle biomass variations associated with selective logging or low-intensity degradation—phenomena often missed by optical-only or index-based models [65]. In the Amazon Basin, multi-modal CNNs integrating Sentinel-2 imagery, GEDI waveform data, and InSAR-derived canopy height were used to produce spatially explicit biomass maps with unprecedented resolution and sensitivity to structural gradients [61].
Despite these capabilities, DL approaches face several practical challenges. First, their performance is highly dependent on the availability of large, high-quality labeled datasets. Unlike traditional models that can function with a few hundred ground plots, DL models often require thousands of samples to avoid overfitting and ensure generalization. This requirement is particularly difficult to meet in tropical forests, where field data collection is costly and logistically challenging. Second, the training of deep models is computationally demanding, requiring graphical processing units (GPUs) and substantial memory. This may limit accessibility for institutions lacking advanced hardware or cloud computing credits.
Moreover, DL models are often criticized for their “black box” nature. While they offer high predictive performance, their internal representations and decision rules are rarely interpretable in ecological or biophysical terms. Efforts to improve explainability include the application of saliency maps, class activation mapping (CAM), and gradient-based sensitivity analysis to visualize which input features or regions contribute most to model predictions. While these tools are gaining traction, they remain underutilized in forest carbon monitoring compared to their use in medical or urban remote sensing domains.
To address some of these limitations, recent research has explored hybrid frameworks that combine the spatial modeling strengths of DL with the ecological interpretability of process-based models or empirical constraints. For example, physics-informed neural networks (PINNs) embed known biophysical relationships—such as allometric scaling laws or light use efficiency functions—into the architecture of the model, constraining predictions within ecologically plausible bounds [66]. Other efforts focus on semi-supervised or transfer learning strategies, where DL models trained in data-rich regions are adapted to data-poor settings via fine-tuning or domain adaptation.
Deep learning has introduced a transformative set of tools for forest biomass estimation, enabling unprecedented accuracy and spatial detail, particularly in high-resolution or multi-sensor environments. However, the approach is still maturing within the ecological remote sensing community, and broader adoption will depend on overcoming data, computation, and interpretability barriers. As training datasets grow and model transparency improves, DL is poised to become a cornerstone of future biomass modeling systems, particularly as part of hybrid or ensemble approaches that blend data-driven precision with ecological reasoning.
3.5. Process-based Ecological Models
Process-based ecological models offer a mechanistic alternative to empirical and data-driven biomass estimation methods. Rather than inferring biomass from statistical relationships, these models simulate the underlying biophysical and physiological processes that govern forest carbon dynamics—including photosynthesis, autotrophic and heterotrophic respiration, carbon allocation, litterfall, and decomposition. Because they are grounded in ecological theory and parameterized with environmental drivers, process-based models are particularly well suited for long-term simulations, climate sensitivity analyses, and the evaluation of land-use and management scenarios [36,37] .
The Carnegie–Ames–Stanford Approach (CASA) is among the most widely implemented process-based models in forest carbon applications. CASA is a light-use efficiency (LUE) model that calculates Net Primary Productivity (NPP) by multiplying the fraction of absorbed photosynthetically active radiation (fAPAR) by photosynthetic efficiency, which is constrained by temperature and moisture stress factors. MODIS-derived NDVI or fAPAR is commonly used to drive the model at regional to global scales [67]. CASA outputs are often coupled with carbon turnover and allocation models to estimate biomass accumulation in above- and belowground pools. Its relatively simple structure and compatibility with satellite inputs make it a favored choice in regional-scale biomass trend assessments, especially in data-sparse regions [36].
More complex models such as Biome-BGC and 3-PG (Physiological Principles Predicting Growth) incorporate additional ecological components, including water and nutrient cycling, phenology, and stand age dynamics [68,69]. Biome-BGC operates on a daily timestep, simulating carbon and nitrogen fluxes across multiple ecosystem compartments, including foliage, stem, roots, litter, and soil organic matter. It requires detailed inputs, including meteorological data, soil properties, species-specific physiological parameters, and leaf area index (LAI). The model has been used extensively in temperate and boreal forests and serves as a core component of global biosphere modeling frameworks [70]. Meanwhile, 3-PG emphasizes forest productivity and growth processes, often used in plantation and afforestation modeling, where site-specific parameters can be calibrated from field and remote sensing data [69].
A key strength of process-based models is their capacity to generate internally consistent estimates of multiple carbon pools, including both aboveground and belowground biomass, as well as soil organic carbon (SOC). This holistic perspective is valuable in climate reporting contexts, such as REDD+ Tier 3 methodologies and national greenhouse gas inventories, where flux-based accounting is needed. These models also provide essential support for scenario-based forecasting. For instance, they can simulate the impacts of altered precipitation regimes, increased CO₂ fertilization, or fire suppression policies on biomass accumulation and carbon sequestration over decadal timescales [37].
Despite these advantages, process models face several limitations. One major challenge lies in their parameter sensitivity and the difficulty of site-specific calibration. Many key parameters—such as maximum photosynthetic rates, respiration coefficients, or carbon allocation ratios—are derived from literature values or local experiments, and uncertainty in their specification can propagate substantially into model outputs. This is particularly problematic in tropical forests, where in situ physiological data are limited, and ecosystem diversity is high [71].
To address these limitations, process models are increasingly integrated with remote sensing data, either through parameter constraint, state variable assimilation, or hybrid modeling. For example, satellite-derived LAI, canopy height, or biomass estimates from LiDAR can be used to initialize, calibrate, or validate model simulations, thereby improving realism and reducing model drift [70,72]. In plantation forests, the 3-PG model has been successfully constrained using LiDAR-derived canopy cover and height, improving aboveground biomass prediction across rotations [69].
Recent advances also include data assimilation techniques, such as ensemble Kalman filtering or Markov Chain Monte Carlo sampling, which allow the dynamic updating of model states and parameters using time-series observations. These approaches have been applied in conjunction with MODIS NPP data, GEDI-derived canopy heights, and flux tower measurements to generate near-real-time carbon balance estimates with quantified uncertainty [73].
Furthermore, the development of hybrid models that blend process-based logic with machine learning architectures represents a promising frontier. In these frameworks, neural networks or decision trees are trained not only on raw data but also on outputs or residuals from process models, enabling error correction and improved generalization. Other designs embed biophysical constraints into neural network loss functions, promoting ecologically plausible outputs even in the absence of dense ground truth [73].
From a policy perspective, process-based models provide the analytical backbone for many integrated assessment models (IAMs) and Earth system models (ESMs), which inform international climate negotiations and national planning. Their ability to simulate future carbon dynamics under variable management and climate regimes makes them indispensable for long-term strategic decision-making [37].
In conclusion, process-based ecological models are essential components of the forest carbon modeling landscape. While they may not match the short-term predictive accuracy of advanced machine learning algorithms, their mechanistic underpinnings, multi-pool structure, and scenario simulation capacity render them uniquely valuable for both scientific understanding and policy formulation. Their integration with remote sensing data—through assimilation, calibration, or hybrid modeling—marks a critical evolution, positioning them as central actors in next-generation forest carbon monitoring systems.
3.6. Belowground and Soil Carbon Estimation
While aboveground biomass (AGB) has traditionally dominated forest carbon mapping efforts, belowground biomass (BGB) and soil organic carbon (SOC) often account for over 30–50% of total forest carbon stocks, particularly in mature tropical and boreal ecosystems. Accurate estimation of these below-surface components is critical for developing comprehensive carbon inventories and for understanding long-term carbon sequestration potential and vulnerability to disturbance. However, compared to AGB, both BGB and SOC remain underrepresented in large-scale remote sensing–based monitoring systems due to methodological, observational, and ecological challenges [39].
BGB is most estimated through indirect methods using empirical relationships derived from destructive sampling or allometric models. A widely applied approach is to use a fixed biomass expansion factor (BEF) or root-to-shoot ratio, typically formulated as BGB = AGB × R, where R varies by species, biome, and soil condition. The IPCC provides generalized R values (e.g., 0.24 for tropical moist forests), but studies have shown significant variability across forest types, stand ages, and disturbance regimes [38]. For example, root biomass allocation tends to be higher in dry forests or nutrient-poor soils and lower in intensively managed plantations. This variability imposes considerable uncertainty when using static ratios, especially for spatially explicit mapping.
Emerging strategies aim to improve BGB estimation by integrating LiDAR-derived canopy structure, UAV photogrammetry, and ancillary site-level variables such as soil texture, elevation, or precipitation. Some recent studies have explored the correlation between LiDAR-measured canopy height and fine root biomass, particularly in boreal systems, where vertical structure is a strong proxy for belowground productivity [26,74]. UAV-based Structure-from-Motion (SfM) photogrammetry has also enabled high-resolution estimation of surface roughness and canopy volume, indirectly linked to root mass in semi-open forests. However, direct observation of BGB using remote sensing remains technically unfeasible, necessitating continued reliance on calibrated modeling frameworks.
Soil organic carbon (SOC), on the other hand, has garnered increasing attention due to its persistence, magnitude, and role in ecosystem resilience. SOC stocks are influenced by complex interactions between litter input, microbial activity, moisture regimes, and land-use history. While ground-based measurements provide the most accurate estimates, their spatial coverage is limited. As a result, remote sensing–informed SOC modeling relies heavily on covariate-driven approaches, in which spatial predictors such as land cover, vegetation indices, temperature, precipitation, and topography are used to predict SOC distributions through regression or machine learning [39,75].
Process-based models such as CENTURY, RothC, and the InVEST Carbon module simulate SOC dynamics over time based on carbon input from vegetation, decomposition rates, and climate data[76]. These models can be run in tandem with remote sensing–derived biomass estimates to capture carbon flow from aboveground pools into soil reservoirs. For example, InVEST assigns SOC densities to specific land-cover types and tracks stock changes across land-use transitions, providing a rapid but coarse estimate of SOC dynamics under management scenarios [77]. However, this approach is limited by the static nature of carbon density inputs and often underrepresents temporal variability.
To address temporal uncertainty, new efforts have focused on integrating satellite observations of vegetation optical depth (VOD), land surface temperature (LST), and soil moisture indices—particularly from SMAP, SMOS, and MODIS sensors—as dynamic proxies for SOC change [80]. These data are increasingly being fused in hybrid models within situ observations and environmental covariates to produce spatially continuous SOC maps with improved temporal fidelity. For example, VOD has been used to detect long-term moisture–biomass interactions that influence SOC accrual or depletion following deforestation, fire, or drought.
Advanced geostatistical methods and uncertainty quantification are also being applied to belowground carbon modeling. Monte Carlo simulations and Bayesian inference are used to propagate uncertainties from model inputs (e.g., allometric coefficients, SOC calibration samples) through to output estimates [80]. For instance, Avitabile et al. applied spatial simulation to reconcile SOC estimates from field plots and global models, identifying uncertainty “hotspots” in the Congo Basin and central South America [80]. Moreover, spatial autocorrelation in SOC and BGB errors necessitates stratified or spatially weighted error reporting, as aggregation does not necessarily reduce uncertainty due to landscape heterogeneity [78].
Despite ongoing advancements, the integration of belowground carbon into national-level forest monitoring systems remains limited. Challenges include the paucity of high-resolution, publicly available SOC maps, the mismatch between the spatial resolution of field samples and satellite predictors, and the complexity of vertical SOC distribution in deep soils. Nonetheless, as satellite missions increasingly include L-band and P-band passive microwave sensors (e.g., SMAP, BIOMASS), and as LiDAR and hyperspectral technologies mature, the potential for improved belowground carbon estimation is expanding.
In conclusion, although BGB and SOC remain among the most challenging components of the forest carbon cycle to quantify remotely, progress in modeling frameworks, sensor integration, and uncertainty analysis is gradually closing the gap. Their inclusion is essential for developing complete, policy-relevant carbon inventories and for assessing mitigation potential across diverse forest systems. Continued efforts to couple in situ soil data with remote sensing and ecological models will be critical to advancing high-confidence, spatially explicit assessments of total forest carbon storage.
3.7. Comparative Evaluation of Modeling Approaches Across Forest Types
The modeling of forest biomass and carbon stocks has evolved from simple empirical regressions to sophisticated machine learning and process-based systems. Each methodology presents distinct trade-offs among accuracy, data demands, interpretability, and operational scalability.
Empirical models offer high transparency and operational simplicity but are limited by ecological heterogeneity and saturation effects at high biomass [22,23,54]. Machine learning methods (e.g., RF, XGBoost) provide high predictive performance across diverse landscapes but often require extensive ground truth and risk reduced interpretability [30,39,59-61]. Deep learning models excel in complex, high-resolution environments by directly learning from raw inputs but are data- and computation-intensive [34,65,79]. Process-based ecological models (e.g., CASA, Biome-BGC) simulate biomass dynamics mechanistically, facilitating scenario analyses, although calibration demands are high [36,37,69,72]. Belowground and soil carbon estimation remains a major uncertainty, despite emerging improvements using remote sensing and hybrid modeling [26,39,74,78,80]. Hybrid frameworks that integrate ML and ecological constraints are increasingly favored for balancing accuracy, robustness, and interpretability [61,73].
While previous sections have elaborated on various modeling approaches individually, a systematic, cross-comparative evaluation across different forest types and modeling frameworks remains necessary. In particular, understanding the trade-offs among empirical regression, machine learning, deep learning, and process-based models is crucial for selecting appropriate methodologies under varying ecological conditions and data environments. To address this, we provide a comparative synthesis summarizing the performance, data requirements, interpretability, scalability, advantages, and limitations of each modeling paradigm, based on recent literature and operational case studies. This evaluation aims to guide researchers and practitioners in making informed methodological choices for forest carbon monitoring systems tailored to specific project contexts.
Table 4 Comparative evaluation of different modeling approaches for forest carbon estimation across various forest types, summarizing predictive performance, data requirements, interpretability, scalability, and practical considerations.
Each modeling approach exhibits distinct strengths and weaknesses depending on the ecological context, data availability, and application objectives. Empirical models offer simplicity and interpretability but are limited in dense forests; machine learning provides higher accuracy at the cost of explainability; deep learning excels in heterogeneous, high-resolution environments but demands extensive data and computational resources; and process-based models offer ecosystem process realism but require complex calibration. Therefore, future forest carbon monitoring systems may benefit from hybrid frameworks that strategically combine multiple modeling approaches to balance accuracy, robustness, and operational scalability.
3.8. Meta-Analysis of Biomass Estimation Method Performance
To provide a systematic and quantitative comparison of different modeling approaches for forest biomass estimation, a small-scale meta-analysis was conducted. We reviewed 30 peer-reviewed studies published between 2020 and 2025 that reported performance metrics for remote sensing-based biomass models, including R² (coefficient of determination) and RMSE (root mean square error, in Mg C ha⁻¹). The studies encompass a range of forest types, geographic regions, and remote sensing data sources (e.g., optical, SAR, LiDAR).
The modeling methods were classified into four categories: empirical regression, machine learning (e.g., Random Forest, Gradient Boosting), deep learning (e.g., Convolutional Neural Networks), and process-based ecological models (e.g., CASA, Biome-BGC). For each category, the mean R², mean RMSE, and 95% confidence intervals (CIs) were calculated. Table 5 summarizes the aggregated results.
These results reveal several key patterns:
- Deep learning models (mainly CNN-based architectures) achieved the highest average predictive performance (mean R² = 0.85; RMSE = 25 Mg C ha⁻¹), especially in structurally heterogeneous tropical forests.
- Machine learning methods such as Random Forest and Gradient Boosting also exhibited strong predictive power (mean R² = 0.78) while maintaining moderate data requirements and reasonable interpretability.
- Empirical regression models, despite their simplicity and high transparency, tended to have lower predictive performance, particularly in high-biomass environments prone to signal saturation.
- Process-based models demonstrated moderate performance (mean R² = 0.66), reflecting their strength in simulating ecosystem processes but also the challenges associated with parameter calibration and spatial heterogeneity.
This meta-analysis provides empirical evidence supporting the growing preference for machine learning and deep learning approaches in forest carbon monitoring. However, it also highlights the importance of balancing predictive accuracy with model interpretability, operational scalability, and ground-truth data availability, particularly in policy-driven applications such as REDD+ MRV and national GHG inventories.
4. Application Layer: Forest Carbon Monitoring Under Policy Frameworks
To operationalize forest carbon monitoring for REDD+ MRV, national greenhouse gas inventory (GHGI) submissions, and voluntary carbon markets, a systematic end-to-end workflow is required. Figure 3 illustrates the integrated workflow, from multi-source data acquisition and fusion through spatial carbon modeling and final policy interface aggregation.
4.1. REDD+ Monitoring and MRV Mechanisms
Effective Measurement, Reporting, and Verification (MRV) systems are essential for implementing REDD+ initiatives under the UNFCCC. However, ensuring transparency, consistency, and credibility of reported emission reductions across diverse national contexts remains a major challenge [13,81].
Remote sensing and GIS-based approaches have become the foundation of REDD+ MRV systems. Countries such as Brazil, Guyana, and Colombia employ wall-to-wall satellite monitoring—using Landsat, Sentinel-2, and LiDAR—to derive deforestation rates, biomass estimates, and Forest Reference Emission Levels (FRELs) [3,82,83]. Programs like FCPF and UN-REDD have supported over 50 countries in operationalizing geospatial workflows, often combining optical imagery, radar backscatter, and field plot calibration [83].
These systems enable consistent, spatially explicit carbon accounting, underpinning result-based financing. Brazil’s use of PRODES deforestation data and national biomass models supported over $3 billion in REDD+ payments [3,84]. Remote sensing also facilitates independent verification, enhancing the credibility and legitimacy of REDD+ claims.
4.2. National and Regional Case Studies
4.2.1. Brazil: Integration of Remote Sensing into REDD+ Accounting
Brazil required a robust, transparent forest monitoring system to operationalize its REDD+ commitments and receive performance-based payments.
Since 2004, Brazil’s PRODES program has used Landsat-class imagery to produce annual deforestation maps. Recently, GEDI LiDAR, Sentinel-1 SAR, and Sentinel-2 optical data have been fused to generate high-resolution aboveground biomass (AGB) maps [84].
This system allowed Brazil to report a net carbon sink of –0.18 ± 0.06 Pg C yr⁻¹ for the Amazon, facilitating substantial REDD+ financing. The country’s success provides a global benchmark for integrating remote sensing into national MRV frameworks.
4.2.2. Congo Basin: Overcoming Data Scarcity
The Congo Basin faces persistent data gaps due to limited field plots, cloud cover, and logistical constraints. Researchers developed pan-African biomass models combining ALOS PALSAR, MODIS VIs, and GEDI footprint calibration [80]. Updated biomass and carbon stock maps have been generated despite ground data scarcity.
4.2.3. Indonesia: Forest Monitoring for REDD+ and Private Commitments
Indonesia aimed to reduce deforestation while monitoring extensive tropical forest landscapes prone to peatland degradation. Indonesia established the Sadewa early warning system, using Sentinel-1/2 and Landsat imagery to track land cover change in near-real time. High-carbon stock (HCS) mapping and peatland integrity monitoring were integrated into national and project-level MRV [81].
The system enabled compliance with REDD+ conditional financing and supported corporate “zero-deforestation” supply chain verification. Integration of satellite alerts into enforcement reduced illegal logging in several provinces.
4.3. Carbon Markets and Zero-Deforestation Supply Chains
Corporate climate pledges and voluntary carbon markets require credible, spatially explicit measurement of forest carbon emissions and removals.
Remote sensing underpins the verification of carbon credits by mapping baseline deforestation risks and monitoring project-level interventions. High-resolution UAV, LiDAR, and multispectral imagery are commonly used to establish counterfactual baselines and demonstrate avoided emissions [3,86] Platforms like Global Forest Watch support real-time monitoring for supply chain compliance.
Geospatial MRV enables validation under standards such as the Verified Carbon Standard (VCS) and Climate, Community and Biodiversity Alliance (CCBA). It also underpins corporate “zero-deforestation” pledges, ensuring transparency in palm oil, soy, and timber supply chains [86,87]. Remote sensing is thus central to enhancing investor confidence and ensuring environmental integrity in forest carbon markets.
4.4. Smart Forestry and Digital Carbon Systems
Traditional forest monitoring methods are often slow, labor-intensive, and insufficient for real-time carbon management, limiting adaptive interventions. Smart forestry integrates Internet of Things (IoT) ground sensors, UAV remote sensing, and AI-driven analytics into digital forest management platforms [88]. IoT devices measure tree growth, microclimate, and CO₂ fluxes, UAV LiDAR and hyperspectral imaging capture high-resolution structure and species composition. These data streams feed into “digital twin” forest models that simulate management scenarios and carbon trajectories.
Smart forestry systems enable near-real-time disturbance detection, site-specific interventions (e.g., precision thinning), and transparent carbon accounting [88]. Community participation through mobile-GIS apps strengthens ground-truthing and participatory MRV. Emerging blockchain applications even allow micro-payments based on verified incremental carbon sequestration. Overall, smart forestry advances dynamic, scalable carbon monitoring aligned with climate neutrality goals [88,89].
5. Challenges and Future Perspectives
5.1. Data Heterogeneity and Lack of Standardization
Forest carbon monitoring increasingly relies on integrating multi-source remote sensing datasets; however, heterogeneity in spatial resolution, data format, sensor calibration, and preprocessing standards remains a critical barrier [25,90]. Inconsistencies in atmospheric correction, speckle filtering, and geolocation introduce artifacts unrelated to true forest changes. Efforts like CEOS ARD standards and GFOI guidelines have improved harmonization but cannot fully resolve discrepancies across optical, SAR, and LiDAR sources [91]. Structural differences (e.g., raster vs. point cloud formats) and definitional variability (e.g., differing forest canopy thresholds) further complicate integration [13,80].
Promoting open metadata standards, cross-sensor calibration, and standardized biomass estimation protocols is essential. Establishing cloud-based preprocessing pipelines and encouraging adherence to unified methodological frameworks can significantly enhance global comparability of carbon monitoring results.
5.2. Limited Model Generalizability and Field Validation Deficiency
Models trained in specific ecological or geographical contexts often perform poorly when transferred elsewhere, due to differences in forest structure, species composition, and remote sensing signal behavior [92,93].
Pan-tropical models exhibit systematic regional biases, and even within continents, wood density and canopy architecture vary widely. Sparse field plot data and inconsistent inventory protocols further hinder robust calibration and validation [13,39,80]. Advances such as domain adaptation (e.g., geographically weighted regression) and contextual covariate integration (e.g., soil type, climate) are promising [30,46]. Expanding globally harmonized plot networks, improving remeasurement frequency, and leveraging airborne LiDAR as calibration surrogates are critical to improving model reliability across scales.
To strengthen model generalizability and reduce context-specific biases, future research should prioritize the establishment of standardized, multi-biome field validation networks. Small-scale validation experiments should combine UAV-LiDAR surveys and ground-based inventory plots across tropical and temperate forests, synchronized seasonally to capture phenological variations. These efforts would enable systematic calibration of satellite-based biomass models and reduce uncertainties in cross-continental carbon assessments.
5.3. High-Resolution Data Access: Cost and Temporal Constraints
High-resolution imagery (e.g., PlanetScope, UAV LiDAR) provides superior spatial detail but remains costly and logistically challenging for broad-scale, continuous forest carbon monitoring [88]. One-off LiDAR acquisitions are common, while systematic, high-frequency updates are rare due to financial, technical, and institutional constraints. In contrast, freely available datasets like Landsat and Sentinel offer regular coverage but insufficient detail for detecting subtle disturbances [94,95]. Hybrid monitoring approaches—combining national moderate-resolution mapping with targeted high-resolution sampling—are increasingly adopted. Broader open-access policies (e.g., NICFI’s tropical imagery release) and capacity-building for data analysis in low-income regions are essential to democratize advanced monitoring capabilities.
The integration of satellite, UAV, and ground-based sensor networks forms a dynamic, multi-scale forest carbon monitoring system capable of real-time biomass estimation and flux attribution. Figure 4 illustrates the conceptual workflow of this integrated monitoring framework, from satellite observations to ground-based CO₂ flux measurements, culminating in real-time carbon forecasting capabilities.
5.4. Future Directions: Toward Intelligent, Integrated Carbon Monitoring
Facing the above challenges, future research and operational development are converging along three main pathways:
5.4.1. Cloud Platforms and Automated Monitoring
Cloud computing ecosystems like Google Earth Engine and SEPAL have revolutionized data accessibility and processing efficiency [49,82]. Future MRV systems will increasingly rely on cloud-native infrastructures, enabling near-real-time biomass tracking and standardized workflows for national inventories.
5.4.2. AI-Augmented Ecological Modeling
Artificial intelligence offers unprecedented opportunities for enhancing process-based models, real-time disturbance detection, and adaptive forest management optimization [96,97]. Hybrid systems combining ecological constraints with machine learning flexibility will drive next-generation carbon forecasting and scenario planning.
5.4.3. Integrated Sky-to-Ground Networks
A comprehensive carbon monitoring framework will integrate satellite, UAV, and ground-based sensor data into dynamic, multi-scale networks [98,99]. Fusion of remote sensing and in situ CO₂ flux measurements will enable more accurate detection, attribution, and forecasting of forest carbon dynamics under changing climate regimes.
As forest carbon monitoring systems evolve toward greater intelligence, integration, and operational scalability, several research frontiers emerge as critical priorities. These include advancing AI-augmented modeling, enabling real-time biomass tracking, scaling high-resolution MRV systems cost-effectively, and integrating satellite, UAV, and ground-based observations.
Table 6 summarizes the key research questions, methodological approaches, and critical data needs associated with each frontier. This synthesis aims to guide future efforts in developing next-generation carbon monitoring systems aligned with climate neutrality objectives.
5.4.4. Monitoring Belowground Carbon: Emerging Opportunities from New Satellite Missions
Belowground carbon pools, comprising root biomass and soil organic carbon (SOC), represent a substantial yet poorly constrained component of forest carbon stocks. Recent advances in satellite remote sensing offer new pathways for improving belowground carbon monitoring at regional to global scales.
The Soil Moisture Active Passive (SMAP) mission provides global measurements of surface soil moisture with ~9 km resolution and frequent revisit times. Soil moisture data, when integrated with radar backscatter from Sentinel-1 or with vegetation optical depth (VOD) products, can be leveraged to infer soil carbon dynamics indirectly. Empirical models and machine learning approaches have been developed to link temporal soil moisture variations, vegetation productivity, and SOC stocks, particularly in regions where field inventories are sparse.
For example, Hu et al. (2022) demonstrated that fusing SMAP soil moisture and Sentinel-1 C-band radar data enabled regional mapping of soil organic carbon density across boreal and temperate ecosystems, with uncertainties comparable to ground-based surveys. Their approach involved training random forest models using soil moisture indices, radar backscatter metrics, and ancillary covariates against harmonized SOC inventories[100].
The upcoming BIOMASS satellite mission, equipped with long-wavelength P-band SAR, will further enhance sensitivity to woody biomass and, potentially, sub-canopy soil moisture variations. Its high penetration capability may indirectly assist in constraining belowground carbon pools when combined with surface observations.
Integrating multi-source remote sensing datasets—including SMAP, Sentinel-1, BIOMASS, and optical indices—offers a promising framework for belowground carbon monitoring. However, uncertainties remain high, especially regarding spatial transferability of models and temporal stability of SOC estimates. Future research should focus on developing standardized calibration datasets, validating satellite-derived SOC estimates within situ measurements, and improving model interpretability across forest types.
5.4.5. Uncertainty Management in REDD+ Carbon Credit Issuance
In REDD+ carbon accounting frameworks, the quantification and management of model uncertainty are critical to ensuring the environmental integrity and market credibility of issued carbon credits. Biomass estimation errors—arising from remote sensing data fusion, allometric model variability, and sampling inconsistencies—can lead to over- or underestimation of emission reductions. Without appropriate adjustments, these uncertainties pose significant risks for over-crediting, which undermines the credibility of REDD+ projects and carbon markets.
To mitigate these risks, several mechanisms have been adopted in existing standards: (1) Conservative Discount Factors: Many REDD+ methodologies apply a conservative discount to the estimated emission reductions based on quantified uncertainty. For instance, the Verified Carbon Standard (VCS) recommends that projects with higher levels of uncertainty apply a larger deduction from the credited amount, proportionate to the confidence interval width. (2) Uncertainty Adjustment Mechanisms: Some frameworks explicitly model uncertainty during the monitoring process and dynamically adjust credited carbon quantities based on observed variability. Probabilistic models, Monte Carlo simulations, and Bayesian updating approaches have been proposed to more systematically integrate uncertainty into credit issuance. (3) Buffer Pools and Risk Mitigation Accounts: In addition to direct deductions, REDD+ systems often require a percentage of credits to be set aside in buffer pools as insurance against unforeseen risks, including methodological uncertainties and natural disturbances.
Incorporating these practices into national and project-level MRV systems enhances transparency, incentivizes continuous improvement in monitoring methodologies, and builds market trust. Future work should focus on standardizing uncertainty quantification protocols across projects and harmonizing discounting procedures to ensure equitable treatment of forest carbon assets.
Priority research directions include: (1) operationalizing cloud-native biomass monitoring pipelines; (2) embedding AI into ecological modeling frameworks; (3) developing coordinated sky-to-ground observation networks; and (4) expanding globally harmonized field validation datasets. Targeted investments in these areas are crucial to achieving scalable, credible, and policy-relevant forest carbon monitoring systems.
6. Conclusions
The accelerating demand for verifiable, scalable, and policy-relevant forest carbon monitoring has propelled a profound transformation in data acquisition, modeling approaches, and application frameworks. This review integrates multi-source remote sensing, GIS-based spatial modeling, and artificial intelligence into a unified architecture tailored to carbon neutrality objectives. By synthesizing recent advances across optical, radar, LiDAR, and machine learning platforms, we illustrate how observational innovation and modeling sophistication are converging to deliver dynamic, high-resolution carbon assessments.
Yet, significant challenges remain. Data standardization across sensors, model transferability across biomes, and the high costs of very-high-resolution monitoring still constrain operational deployment at global scales. Bridging these gaps demands a shift towards AI-augmented ecological modeling, real-time monitoring infrastructures, and integrated sky-to-ground observation networks.
Achieving the next generation of forest carbon monitoring will require not only technical innovation but also coordinated global investment in open data ecosystems, validation networks, and cross-disciplinary research. As forests stand at the nexus of climate stability, biodiversity conservation, and sustainable development, building robust, transparent, and scalable carbon monitoring systems is no longer optional—it is imperative.
Author Contributions
Conceptualization, Xiongwei Liang and Shaopeng Yu; Methodology, Xiongwei Liang; Software, Xiongwei Liang; Validation, Xiongwei Liang, Shaopeng Yu, and Bo Meng; Formal Analysis, Xiongwei Liang; Investigation, Xiongwei Liang; Resources, Xiongwei Liang; Data Curation, Xiongwei Liang; Writing—Original Draft Preparation, Xiongwei Liang; Writing—Review and Editing, Xiongwei Liang, Shaopeng Yu, Bo Meng, Xiaodi Wang, Chunxue Yang, Chuanqi Shi, and Junnan Ding; Visualization, Xiongwei Liang; Supervision, Shaopeng Yu; Project Administration, Shaopeng Yu; Funding Acquisition, Shaopeng Yu. All authors have read and agreed to the published version of the manuscript.
Funding
This article was funded by the Heilongjiang Provincial Natural Science Foundation of China (LH2023C066). Harbin City Science and Technology Plan Self-ra Project (ZC2023ZJ001004)
Data Availability Statement
Data are available through request to the corresponding author.
Conflicts of Interest
The authors declare no conflicts of interest.
References
- Yoro, K.O.; Daramola, M.O. Chapter 1 - CO2 emission sources, greenhouse gases, and the global warming effect. In Advances in Carbon Capture, Rahimpour, M.R., Farsi, M., Makarem, M.A., Eds.; Woodhead Publishing: 2020; pp. 3-28.
- Pan, Y.; Birdsey, R.A.; Fang, J.; Houghton, R.; Kauppi, P.E.; Kurz, W.A.; Phillips, O.L.; Shvidenko, A.; Lewis, S.L.; Canadell, J.G.; et al. A Large and Persistent Carbon Sink in the World’s Forests. Science 2011, 333, 988–993. [Google Scholar] [CrossRef] [PubMed]
- Friedlingstein, P.; O'sullivan, M.; Jones, M.W.; Andrew, R.M.; Hauck, J.; Landschützer, P.; Le Quéré, C.; Li, H.; Luijkx, I.T.; Olsen, A. Global carbon budget 2024. Earth System Science Data Discussions 2024, 2024, 1–133. [Google Scholar] [CrossRef]
- Khanna, J.; Medvigy, D.; Fueglistaler, S.; Walko, R. Regional dry-season climate changes due to three decades of Amazonian deforestation. Nature Climate Change 2017, 7, 200–204. [Google Scholar] [CrossRef]
- Anderegg, W.R.L.; Trugman, A.T.; Badgley, G.; Anderson, C.M.; Bartuska, A.; Ciais, P.; Cullenward, D.; Field, C.B.; Freeman, J.; Goetz, S.J.; et al. Climate-driven risks to the climate mitigation potential of forests. Science 2020, 368, eaaz7005. [Google Scholar] [CrossRef]
- Cook-Patton, S.C.; Leavitt, S.M.; Gibbs, D.; Harris, N.L.; Lister, K.; Anderson-Teixeira, K.J.; Briggs, R.D.; Chazdon, R.L.; Crowther, T.W.; Ellis, P.W.; et al. Mapping carbon accumulation potential from global natural forest regrowth. Nature 2020, 585, 545–550. [Google Scholar] [CrossRef]
- Trugman, A.T.; Quetin, G.R. Leveraging Uncertainty in Terrestrial Ecosystem Carbon Stocks and Fluxes. Earth's Future 2023, 11, e2022EF003322. [Google Scholar] [CrossRef]
- Dye, A.W.; Houtman, R.M.; Gao, P.; Anderegg, W.R.L.; Fettig, C.J.; Hicke, J.A.; Kim, J.B.; Still, C.J.; Young, K.; Riley, K.L. Carbon, climate, and natural disturbance: a review of mechanisms, challenges, and tools for understanding forest carbon stability in an uncertain future. Carbon Balance and Management 2024, 19, 35. [Google Scholar] [CrossRef]
- Cho, S.; Baral, S.; Burlakoti, D. Afforestation/Reforestation and Avoided Conversion Carbon Projects in the United States. Forests 2025, 16, 115. [Google Scholar] [CrossRef]
- Malhi, Y.; Meir, P.; Brown, S. Forests, carbon and global climate. Philosophical Transactions of the Royal Society of London. Series A: Mathematical, Physical and Engineering Sciences 2002, 360, 1567–1591. [Google Scholar] [CrossRef]
- Bossy, T.; Ciais, P.; Renaudineau, S.; Wan, L.; Ygorra, B.; Adam, E.; Barbier, N.; Bauters, M.; Delbart, N.; Frappart, F.; et al. State of the art in remote sensing monitoring of carbon dynamics in African tropical forests. Frontiers in Remote Sensing 2025, Volume 6 - 2025. [Google Scholar] [CrossRef]
- Musselman, R.C.; and Fox, D.G. A Review of the Role of Temperate Forests in the Global CO2 Balance. Journal of the Air & Waste Management Association 1991, 41, 798–807. [Google Scholar] [CrossRef]
- Bloom, A.A.; Exbrayat, J.-F.; van der Velde, I.R.; Feng, L.; Williams, M. The decadal state of the terrestrial carbon cycle: Global retrievals of terrestrial carbon allocation, pools, and residence times. Proceedings of the National Academy of Sciences 2016, 113, 1285–1290. [Google Scholar] [CrossRef] [PubMed]
- Shannon, E.; Finley, A.; May, P.; Domke, G.; Andersen, H.-E. ; Gaines, III; Nothdurft, A.; Banerjee, S. Leveraging national forest inventory data to estimate forest carbon density status and trends for small areas, 2025. [Google Scholar]
- Nguyen, A.; Saha, S. Machine Learning and Multi-source Remote Sensing in Forest Carbon Stock Estimation: A Review; 2024.
- Xie, X.; Wang, Q.; Dai, L.; Su, D.; Wang, X.; Qi, G.; Ye, Y. Application of China’s National Forest Continuous Inventory Database. Environmental Management 2011, 48, 1095–1106. [Google Scholar] [CrossRef]
- Fang, J.; Chen, A.; Peng, C.; Zhao, S.; Ci, L. Changes in Forest Biomass Carbon Storage in China Between 1949 and 1998. Science 2001, 292, 2320–2322. [Google Scholar] [CrossRef]
- Magerl, A.; Le Noë, J.; Erb, K.-H.; Bhan, M.; Gingrich, S. A comprehensive data-based assessment of forest ecosystem carbon stocks in the US 1907–2012. Environmental Research Letters 2019, 14, 125015. [Google Scholar] [CrossRef]
- Navalgund, R.R.; Jayaraman, V.; Roy, P. Remote sensing applications: An overview. current science 2007, 1747–1766. [Google Scholar]
- Gong, Z.; Ge, W.; Guo, J.; Liu, J. Satellite remote sensing of vegetation phenology: Progress, challenges, and opportunities. ISPRS Journal of Photogrammetry and Remote Sensing 2024, 217, 149–164. [Google Scholar] [CrossRef]
- Goetz, S.; and Dubayah, R. Advances in remote sensing technology and implications for measuring and monitoring forest carbon stocks and change. Carbon Management 2011, 2, 231–244. [Google Scholar] [CrossRef]
- Liu, Z.; Peng, C.; Work, T.; Candau, J.-N.; DesRochers, A.; Kneeshaw, D. Application of machine-learning methods in forest ecology: recent progress and future challenges. Environmental Reviews 2018, 26, 339–350. [Google Scholar] [CrossRef]
- Zhao, Q.; Yu, S.; Zhao, F.; Tian, L.; Zhao, Z. Comparison of machine learning algorithms for forest parameter estimations and application for forest quality assessments. Forest Ecology and Management 2019, 434, 224–234. [Google Scholar] [CrossRef]
- Dong, W.; Mitchard, E.; Chen, Y.; Chen, M.; Cao, C.; Hu, P.; Xu, C.; Hancock, S. Comparing remote sensing-based forest biomass mapping approaches using new forest inventory plots in contrasting forests in northeastern and southwestern China; 2024.
- Panda, S.S.; Rao, M.N.; Thenkabail, P.S.; Misra, D.; Fitzgerald, J.P. Remote sensing systems—Platforms and sensors: Aerial, satellite, UAV, optical, radar, and LiDAR. In Remote Sensing Handbook, Volume I; CRC Press: 2016; pp. 3-86.
- Teillet, P.M.; Staenz, K.; William, D.J. Effects of spectral, spatial, and radiometric characteristics on remote sensing vegetation indices of forested regions. Remote Sensing of Environment 1997, 61, 139–149. [Google Scholar] [CrossRef]
- Gao, S.; Yan, K.; Liu, J.; Pu, J.; Zou, D.; Qi, J.; Mu, X.; Yan, G. Assessment of remote-sensed vegetation indices for estimating forest chlorophyll concentration. Ecological Indicators 2024, 162, 112001. [Google Scholar] [CrossRef]
- Mutanga, O.; Shoko, C.; Adelabu, S.; Bangira, T. Remote sensing of aboveground forest biomass: A review. Tropical Ecology 2016, 57, 125–132. [Google Scholar]
- Li, D.; Mi, W.; and Jiang, J. China’s high-resolution optical remote sensing satellites and their mapping applications. Geo-spatial Information Science 2021, 24, 85–94. [Google Scholar] [CrossRef]
- Mura, M.D.; Prasad, S.; Pacifici, F.; Gamba, P.; Chanussot, J.; Benediktsson, J.A. Challenges and Opportunities of Multimodality and Data Fusion in Remote Sensing. Proceedings of the IEEE 2015, 103, 1585–1601. [Google Scholar] [CrossRef]
- ElMasry, G.; Sun, D.-W. CHAPTER 1 - Principles of Hyperspectral Imaging Technology. In Hyperspectral Imaging for Food Quality Analysis and Control, Sun, D.-W., Ed.; Academic Press: San Diego, 2010; pp. 3–43. [Google Scholar]
- Priyanka, *!!! REPLACE !!!*; Rajat, *!!! REPLACE !!!*; Musthafa, M.; Avtar, R.; Singh, G. Forest Biomass Estimation Using S-Band SAR and Lidar Data. In Proceedings of the IGARSS 2024 - 2024 IEEE International Geoscience and Remote Sensing Symposium, 7-12 July 2024, 2024; pp. 4495-4498.
- Tian, X.; Li, J.; Zhang, F.; Zhang, H.; Jiang, M. Forest Aboveground Biomass Estimation Using Multisource Remote Sensing Data and Deep Learning Algorithms: A Case Study over Hangzhou Area in China. Remote Sensing 2024, 16, 1074. [Google Scholar] [CrossRef]
- Bioucas-Dias, J.M.; Plaza, A.; Camps-Valls, G.; Scheunders, P.; Nasrabadi, N.; Chanussot, J. Hyperspectral Remote Sensing Data Analysis and Future Challenges. IEEE Geoscience and Remote Sensing Magazine 2013, 1, 6–36. [Google Scholar] [CrossRef]
- Thenkabail, P.S.; Lyon, J.G.; Huete, A. Advances in hyperspectral remote sensing of vegetation and agricultural crops. In Fundamentals, sensor systems, spectral libraries, and data mining for vegetation; CRC press: 2018; pp. 3-37.
- Xu, W.; Cheng, Y.; Luo, M.; Mai, X.; Wang, W.; Zhang, W.; Wang, Y. Progress and Limitations in Forest Carbon Stock Estimation Using Remote Sensing Technologies: A Comprehensive Review. Forests 2025, 16, 449. [Google Scholar] [CrossRef]
- Shiney, S.; Rg, G. Estimation of Above Ground Biomass Using Machine Learning and Deep Learning Algorithms: A Review. 2024; pp. 181-196.
- Li, C.; Li, M.; Liu, J.; Li, Y.; Dai, Q. Comparative Analysis of Seasonal Landsat 8 Images for Forest Aboveground Biomass Estimation in a Subtropical Forest. Forests 2020, 11, 45. [Google Scholar] [CrossRef]
- Verly, O.M.; Vieira Leite, R.; da Silva Tavares-Junior, I.; José Silva Soares da Rocha, S.; Garcia Leite, H.; Marinaldo Gleriani, J.; Paula Miranda Xavier Rufino, M.; de Fatima Silva, V.; Moreira Miquelino Eleto Torres, C.; Plata-Rueda, A.; et al. Atlantic forest woody carbon stock estimation for different successional stages using Sentinel-2 data. Ecological Indicators 2023, 146, 109870. [Google Scholar] [CrossRef]
- Sinha, S.; Jeganathan, C.; Sharma, L.K.; Nathawat, M.S. A review of radar remote sensing for biomass estimation. International Journal of Environmental Science and Technology 2015, 12, 1779–1792. [Google Scholar] [CrossRef]
- Treuhaft, R.N.; Law, B.E.; Asner, G.P. Forest Attributes from Radar Interferometric Structure and Its Fusion with Optical Remote Sensing. BioScience 2004, 54, 561–571. [Google Scholar] [CrossRef]
- Beaudoin, A.; T., L.T.; S., G.; E., N.; A., L.; E., M.; C., H.C.; C., H.H.; A., K.J.; and Shin, R.T. Retrieval of forest biomass from SAR data. International Journal of Remote Sensing 1994, 15, 2777–2796. [CrossRef]
- Shiney, S.A.; Geetha, R. Estimation of Above Ground Biomass Using Machine Learning and Deep Learning Algorithms: A Review. In Proceedings of the Advances in Artificial Intelligence and Machine Learning in Big Data Processing, Cham, 2025//; 2025; pp. 181–196. [Google Scholar]
- Ometto, J.P.; Gorgens, E.B.; de Souza Pereira, F.R.; Sato, L.; de Assis, M.L.R.; Cantinho, R.; Longo, M.; Jacon, A.D.; Keller, M. A biomass map of the Brazilian Amazon from multisource remote sensing. Sci Data 2023, 10, 668. [Google Scholar] [CrossRef]
- Li, X.; Peng, Q.; Shen, R.; Xu, W.; Qin, Z.; Lin, S.; Ha, S.; Kong, D.; Yuan, W. Long-term reconstructed vegetation index dataset in China from fused MODIS and Landsat data. Scientific Data 2025, 12, 152. [Google Scholar] [CrossRef]
- Luo, M.; Anees, S.A.; Huang, Q.; Qin, X.; Qin, Z.; Fan, J.; Han, G.; Zhang, L.; Shafri, H.Z.M. Improving Forest Above-Ground Biomass Estimation by Integrating Individual Machine Learning Models. Forests 2024, 15, 975. [Google Scholar] [CrossRef]
- Sun, X.; Li, G.; Wu, Q.; Ruan, J.; Li, D.; Lu, D. Mapping Forest Carbon Stock Distribution in a Subtropical Region with the Integration of Airborne Lidar and Sentinel-2 Data. Remote Sensing 2024, 16, 3847. [Google Scholar] [CrossRef]
- Jiang, W.; Zhang, L.; Zhang, X.; Gao, S.; Gao, H.; Sun, L.; Yan, G. Multi-Decision Vector Fusion Model for Enhanced Mapping of Aboveground Biomass in Subtropical Forests Integrating Sentinel-1, Sentinel-2, and Airborne LiDAR Data. Remote Sensing 2025, 17, 1285. [Google Scholar] [CrossRef]
- Gorelick, N.; Hancher, M.; Dixon, M.; Ilyushchenko, S.; Thau, D.; Moore, R. Google Earth Engine: Planetary-scale geospatial analysis for everyone. Remote Sensing of Environment 2017, 202, 18–27. [Google Scholar] [CrossRef]
- Yang, Q.; Su, Y.; Hu, T.; Jin, S.; Liu, X.; Niu, C.; Liu, Z.; Kelly, M.; Wei, J.; Guo, Q. Allometry-based estimation of forest aboveground biomass combining LiDAR canopy height attributes and optical spectral indexes. Forest Ecosystems 2022, 9, 100059. [Google Scholar] [CrossRef]
- Khan, M.N.; Tan, Y.; Gul, A.A.; Abbas, S.; Wang, J. Forest Aboveground Biomass Estimation and Inventory: Evaluating Remote Sensing-Based Approaches. Forests 2024, 15, 1055. [Google Scholar] [CrossRef]
- Khati, U.; Lavalle, M.; Shiroma, G.H.X.; Meyer, V.; Chapman, B. Assessment of Forest Biomass Estimation from Dry and Wet SAR Acquisitions Collected during the 2019 UAVSAR AM-PM Campaign in Southeastern United States. Remote Sensing 2020, 12, 3397. [Google Scholar] [CrossRef]
- Borsah, A.A.; Nazeer, M.; Wong, M.S. LIDAR-Based Forest Biomass Remote Sensing: A Review of Metrics, Methods, and Assessment Criteria for the Selection of Allometric Equations. Forests 2023, 14, 2095. [Google Scholar] [CrossRef]
- Jiang, X.; Li, G.; Lu, D.; Chen, E.; Wei, X. Stratification-Based Forest Aboveground Biomass Estimation in a Subtropical Region Using Airborne Lidar Data. Remote Sensing 2020, 12, 1101. [Google Scholar] [CrossRef]
- Chen, L.; Ren, C.; Zhang, B.; Wang, Z.; Xi, Y. Estimation of Forest Above-Ground Biomass by Geographically Weighted Regression and Machine Learning with Sentinel Imagery. Forests 2018, 9, 582. [Google Scholar] [CrossRef]
- Hu, Y.; Nie, Y.; Liu, Z.; Wu, G.; Fan, W. Improving the Potential of Coniferous Forest Aboveground Biomass Estimation by Integrating C- and L-Band SAR Data with Feature Selection and Non-Parametric Model. Remote Sensing 2023, 15, 4194. [Google Scholar] [CrossRef]
- Ali, N.; Khati, U. Forest Aboveground Biomass and Forest Height Estimation Over a Sub-tropical Forest Using Machine Learning Algorithm and Synthetic Aperture Radar Data. Journal of the Indian Society of Remote Sensing 2024, 52. [Google Scholar] [CrossRef]
- Sillett, S.C.; Graham, M.E.; Montague, J.P.; Antoine, M.E.; Koch, G.W. Ground-based calibration for remote sensing of biomass in the tallest forests. Forest Ecology and Management 2024, 561, 121879. [Google Scholar] [CrossRef]
- Kämäräinen, M.; Tuovinen, J.P.; Kulmala, M.; Mammarella, I.; Aalto, J.; Vekuri, H.; Lohila, A.; Lintunen, A. Spatiotemporal lagging of predictors improves machine learning estimates of atmosphere–forest CO2 exchange. Biogeosciences 2023, 20, 897–909. [Google Scholar] [CrossRef]
- Netsianda, A.; Mhangara, P. Aboveground biomass estimation in a grassland ecosystem using Sentinel-2 satellite imagery and machine learning algorithms. Environmental Monitoring and Assessment 2025, 197, 138. [Google Scholar] [CrossRef]
- Nguyen, A.; Saha, S. Machine Learning and Multi-source Remote Sensing in Forest Carbon Stock Estimation: A Review. 2024; arXiv:2411.17624 2024. [Google Scholar]
- Schratz, P.; Muenchow, J.; Iturritxa, E.; Richter, J.; Brenning, A. Performance evaluation and hyperparameter tuning of statistical and machine-learning models using spatial data. 2018; arXiv:1803.11266 2018. [Google Scholar]
- Sivasankar, T.; Lone, J.; Sarma, K.K.; Qadir, A.; N, R. Estimation of Above Ground Biomass Using Support Vector Machines and ALOS/PALSAR data. VIETNAM JOURNAL OF EARTH SCIENCES 2019, 41, 95–104. [Google Scholar] [CrossRef]
- Wu, Z.; Yao, F.; Zhang, J.; Liu, H. Estimating Forest Aboveground Biomass Using a Combination of Geographical Random Forest and Empirical Bayesian Kriging Models. Remote Sensing 2024, 16, 1859. [Google Scholar] [CrossRef]
- Dong, L.; Du, H.; Han, N.; Li, X.; Zhu, D.e.; Mao, F.; Zhang, M.; Zheng, J.; Liu, H.; Huang, Z.; et al. Application of Convolutional Neural Network on Lei Bamboo Above-Ground-Biomass (AGB) Estimation Using Worldview-2. Remote Sensing 2020, 12, 958. [Google Scholar] [CrossRef]
- Oehmcke, S.; Li, L.; Revenga, J.C.; Nord-Larsen, T.; Trepekli, K.; Gieseke, F.; Igel, C. Deep learning based 3D point cloud regression for estimating forest biomass. In Proceedings of the Proceedings of the 30th international conference on advances in geographic information systems, 2022; pp. 1-4.
- Wu, C.; Chen, K.; E, C.; You, X.; He, D.; Hu, L.; Liu, B.; Wang, R.; Shi, Y.; Li, C.; et al. Improved CASA model based on satellite remote sensing data: simulating net primary productivity of Qinghai Lake basin alpine grassland. Geosci. Model Dev. 2022, 15, 6919–6933. [Google Scholar] [CrossRef]
- Wang, Q.; Watanabe, M.; Ouyang, Z. Simulation of water and carbon fluxes using BIOME-BGC model over crops in China. Agricultural and Forest Meteorology 2005, 131, 209–224. [Google Scholar] [CrossRef]
- Bai, Y.; Pang, Y.; Kong, D. Integrating remote sensing and 3-PG model to simulate the biomass and carbon stock of Larix olgensis plantation. Forest Ecosystems 2024, 11, 100213. [Google Scholar] [CrossRef]
- Niu, Z.; He, H.; Peng, S.; Ren, X.; Zhang, L.; Gu, F.; Zhu, G.; Peng, C.; Li, P.; Wang, J.; et al. A Process-Based Model Integrating Remote Sensing Data for Evaluating Ecosystem Services. Journal of Advances in Modeling Earth Systems 2021, 13, e2020MS002451. [Google Scholar] [CrossRef]
- K C, A.; Bhattarai, S.; Pandey, P. A Comparison of Landsat-8 and Sentinel-2 spectral indices for estimating aboveground forest carbon in a community forest. Forestry Journal of Institute of Forestry Nepal 2023, 01, 40–55. [Google Scholar] [CrossRef]
- Fox, A.M.; Huo, X.; Hoar, T.J.; Dashti, H.; Smith, W.K.; MacBean, N.; Anderson, J.L.; Roby, M.; Moore, D.J.P. Assimilation of Global Satellite Leaf Area Estimates Reduces Modeled Global Carbon Uptake and Energy Loss by Terrestrial Ecosystems. Journal of Geophysical Research: Biogeosciences 2022, 127, e2022JG006830. [Google Scholar] [CrossRef]
- Carter, S.; Herold, M.; Jonckheere, I.G.C.; Espejo, A.B.; Green, C.; Wilson, S. Capacity Development for Use of Remote Sensing for REDD+ MRV Using Online and Offline Activities: Impacts and Lessons Learned. Remote Sensing 2021, 13, 2172. [Google Scholar] [CrossRef]
- Sa, R.; Fan, W. Estimation of Forest Parameters in Boreal Artificial Coniferous Forests Using Landsat 8 and Sentinel-2A. Remote Sensing 2023, 15, 3605. [Google Scholar] [CrossRef]
- Cutting, B.J.; Atzberger, C.; Gholizadeh, A.; Robinson, D.A.; Mendoza-Ulloa, J.; Marti-Cardona, B. Remote Quantification of Soil Organic Carbon: Role of Topography in the Intra-Field Distribution. Remote Sensing 2024, 16, 1510. [Google Scholar] [CrossRef]
- Zafar, Z.; Zubair, M.; Zha, Y.; Mehmood, M.S.; Rehman, A.; Fahd, S.; Nadeem, A.A. Predictive modeling of regional carbon storage dynamics in response to land use/land cover changes: An InVEST-based analysis. Ecological Informatics 2024, 82, 102701. [Google Scholar] [CrossRef]
- Gong, W.; Duan, X.; Mao, M.; Hu, J.; Sun, Y.; Wu, G.; Zhang, Y.; Xie, Y.; Qiu, X.; Rao, X.; et al. Assessing the impact of land use and changes in land cover related to carbon storage by linking trajectory analysis and InVEST models in the Nandu River Basin on Hainan Island in China. Frontiers in Environmental Science 2022, Volume 10 - 2022. [Google Scholar] [CrossRef]
- Wadoux, A.M.J.-C.; Heuvelink, G.B.M. Uncertainty of spatial averages and totals of natural resource maps. Methods in Ecology and Evolution 2023, 14, 1320–1332. [Google Scholar] [CrossRef]
- Hu, X.; Shi, L.; Lin, L.; Li, S.; Deng, X.; Li, L.; Bian, J.; Lian, X. A novel hybrid modelling framework for GPP estimation: Integrating a multispectral surface reflectance based Vcmax25 simulator into the process-based model. Science of The Total Environment 2024, 921, 171182. [Google Scholar] [CrossRef]
- Avitabile, V.; Herold, M.; Heuvelink, G.B.M.; Lewis, S.L.; Phillips, O.L.; et al. An integrated pan-tropical biomass map using multiple reference datasets. Global Change Biology 2016, 22, 1406–1420. [Google Scholar] [CrossRef]
- Hargita, Y.; Günter, S.; Köthke, M. Brazil submitted the first REDD+ reference level to the UNFCCC—Implications regarding climate effectiveness and cost-efficiency. Land Use Policy 2016, 55, 340–347. [Google Scholar] [CrossRef]
- Hansen, M.C.; Potapov, P.V.; Moore, R.; Hancher, M.; Turubanova, S.A.; Tyukavina, A.; Thau, D.; Stehman, S.V.; Goetz, S.J.; Loveland, T.R.; et al. High-Resolution Global Maps of 21st-Century Forest Cover Change. Science 2013, 342, 850–853. [Google Scholar] [CrossRef]
- Hook, A.; Laing, T. The politics and performativity of REDD+ reference levels: Examining the Guyana-Norway agreement and its implications for ‘offsetting’ towards ‘net zero’. Environmental Science & Policy 2022, 132, 171–180. [Google Scholar] [CrossRef]
- Stokstad, E. In controversial move, Brazil may outsource Amazon deforestation monitoring. Science Magazine 2017. [Google Scholar] [CrossRef]
- Dubayah, R.; Armston, J.; Kellner, J.; Duncanson, L.; Healey, S.; Patterson, P.; Hancock, S.; Tang, H.; Bruening, J.; Hofton, M. GEDI L4A Footprint Level Aboveground Biomass Density, Version 2.1. ORNL DAAC, Oak Ridge, Tennessee, USA. 2022.
- Halme, E.; Pellikka, P.; Mõttus, M. Utility of hyperspectral compared to multispectral remote sensing data in estimating forest biomass and structure variables in Finnish boreal forest. International Journal of Applied Earth Observation and Geoinformation 2019, 83, 101942. [Google Scholar] [CrossRef]
- Du, Y.; Chen, D.; Li, H.; Liu, C.; Liu, S.; Zhang, N.; Fan, J.; Jiang, D. Research on Estimating and Evaluating Subtropical Forest Carbon Stocks by Combining Multi-Payload High-Resolution Satellite Data. Forests 2023, 14, 2388. [Google Scholar] [CrossRef]
- Royal Norwegian Ministry of, C. ; Environment. High-Resolution Satellite Data Opens for the Tropics. Press Release, 2020. [Google Scholar]
- Cappello, C.; Pratihast, A.K.; Pérez Ojeda del Arco, A.; Reiche, J.; De Sy, V.; Herold, M.; Vivanco Vicencio, R.E.; Castillo Soto, D. Alert-Driven Community-Based Forest Monitoring: A Case of the Peruvian Amazon. Remote Sensing 2022, 14, 4284. [Google Scholar] [CrossRef]
- Xu, D.; Wang, H.; Xu, W.; Luan, Z.; Xu, X. LiDAR Applications to Estimate Forest Biomass at Individual Tree Scale: Opportunities, Challenges and Future Perspectives. Forests 2021, 12, 550. [Google Scholar] [CrossRef]
- Fonweban, J.; Programme, U.-R. The UN-REDD Programme Approach to National Forest Monitoring and Measurement, Reporting and Verification (MRV); United Nations Collaborative Programme on Reducing Emissions from Deforestation and Forest Degradation (UN-REDD): 2021.
- Ramachandran, N.; Saatchi, S.; Tebaldini, S.; d’Alessandro, M.M.; Dikshit, O. Mapping tropical forest aboveground biomass using airborne SAR tomography. Scientific Reports 2023, 13, 6233. [Google Scholar] [CrossRef]
- Rodríguez-Veiga, P.; Quegan, S.; Carreiras, J.; Persson, H.J.; Fransson, J.E.S.; Hoscilo, A.; Ziółkowski, D.; Stereńczak, K.; Lohberger, S.; Stängel, M.; et al. Forest biomass retrieval approaches from earth observation in different biomes. International Journal of Applied Earth Observation and Geoinformation 2019, 77, 53–68. [Google Scholar] [CrossRef]
- Roy, D.; Huang, H.; Boschetti, L.; Giglio, L.; Yan, L.; Zhang, H.; Li, Z.; Roy, D. Landsat-8 and Sentinel-2 burned area mapping -A combined sensor multi-temporal change detection approach. Remote Sensing of Environment 2019, 231, 111254. [Google Scholar] [CrossRef]
- Duarte, E.; Barrera, J.A.; Dube, F.; Casco, F.; Hernández, A.J.; Zagal, E. Monitoring Approach for Tropical Coniferous Forest Degradation Using Remote Sensing and Field Data. Remote Sensing 2020, 12, 2531. [Google Scholar] [CrossRef]
- Huang, B.; Yang, Y.; Li, R.; Zheng, H.; Wang, X.; Wang, X.; Zhang, Y. Integrating Remotely Sensed Leaf Area Index with Biome-BGC to Quantify the Impact of Land Use/Land Cover Change on Water Retention in Beijing. Remote Sensing 2022, 14, 743. [Google Scholar] [CrossRef]
- Yan, X.; Jing, L.; R., S.A.; Di, Y.; Tianyue, M.; YiTing, S.; and Shao, J. Evaluation of machine learning methods and multi-source remote sensing data combinations to construct forest above-ground biomass models. International Journal of Digital Earth 2023, 16, 4471–4491. [CrossRef]
- Strassburg, B.B.N.; Iribarrem, A.; Beyer, H.L.; Cordeiro, C.L.; Crouzeilles, R.; Jakovac, C.C.; Braga Junqueira, A.; Lacerda, E.; Latawiec, A.E.; Balmford, A.; et al. Global priority areas for ecosystem restoration. Nature 2020, 586, 724–729. [Google Scholar] [CrossRef] [PubMed]
- Intergovernmental Panel on Climate, C. Chapter 7: Agriculture, Forestry, and Other Land Uses (AFOLU). In Climate Change 2022: Mitigation of Climate Change. Contribution of Working Group III to the Sixth Assessment Report of the Intergovernmental Panel on Climate Change; Cambridge University Press: Cambridge, United Kingdom and New York, NY, USA, 2022. [Google Scholar]
- Hu, Z.; Piao, S.; Knapp, A.K.; Wang, X.; Peng, S.; Yuan, W.; Running, S.; Mao, J.; Shi, X.; Ciais, P.; et al. Decoupling of greenness and gross primary productivity as aridity decreases. Remote Sensing of Environment 2022, 279, 113120. [Google Scholar] [CrossRef]
Figure 1.
Conceptual framework of vegetation phenology monitoring using satellite and UAV imagery under environmental constraints.
Figure 1.
Conceptual framework of vegetation phenology monitoring using satellite and UAV imagery under environmental constraints.
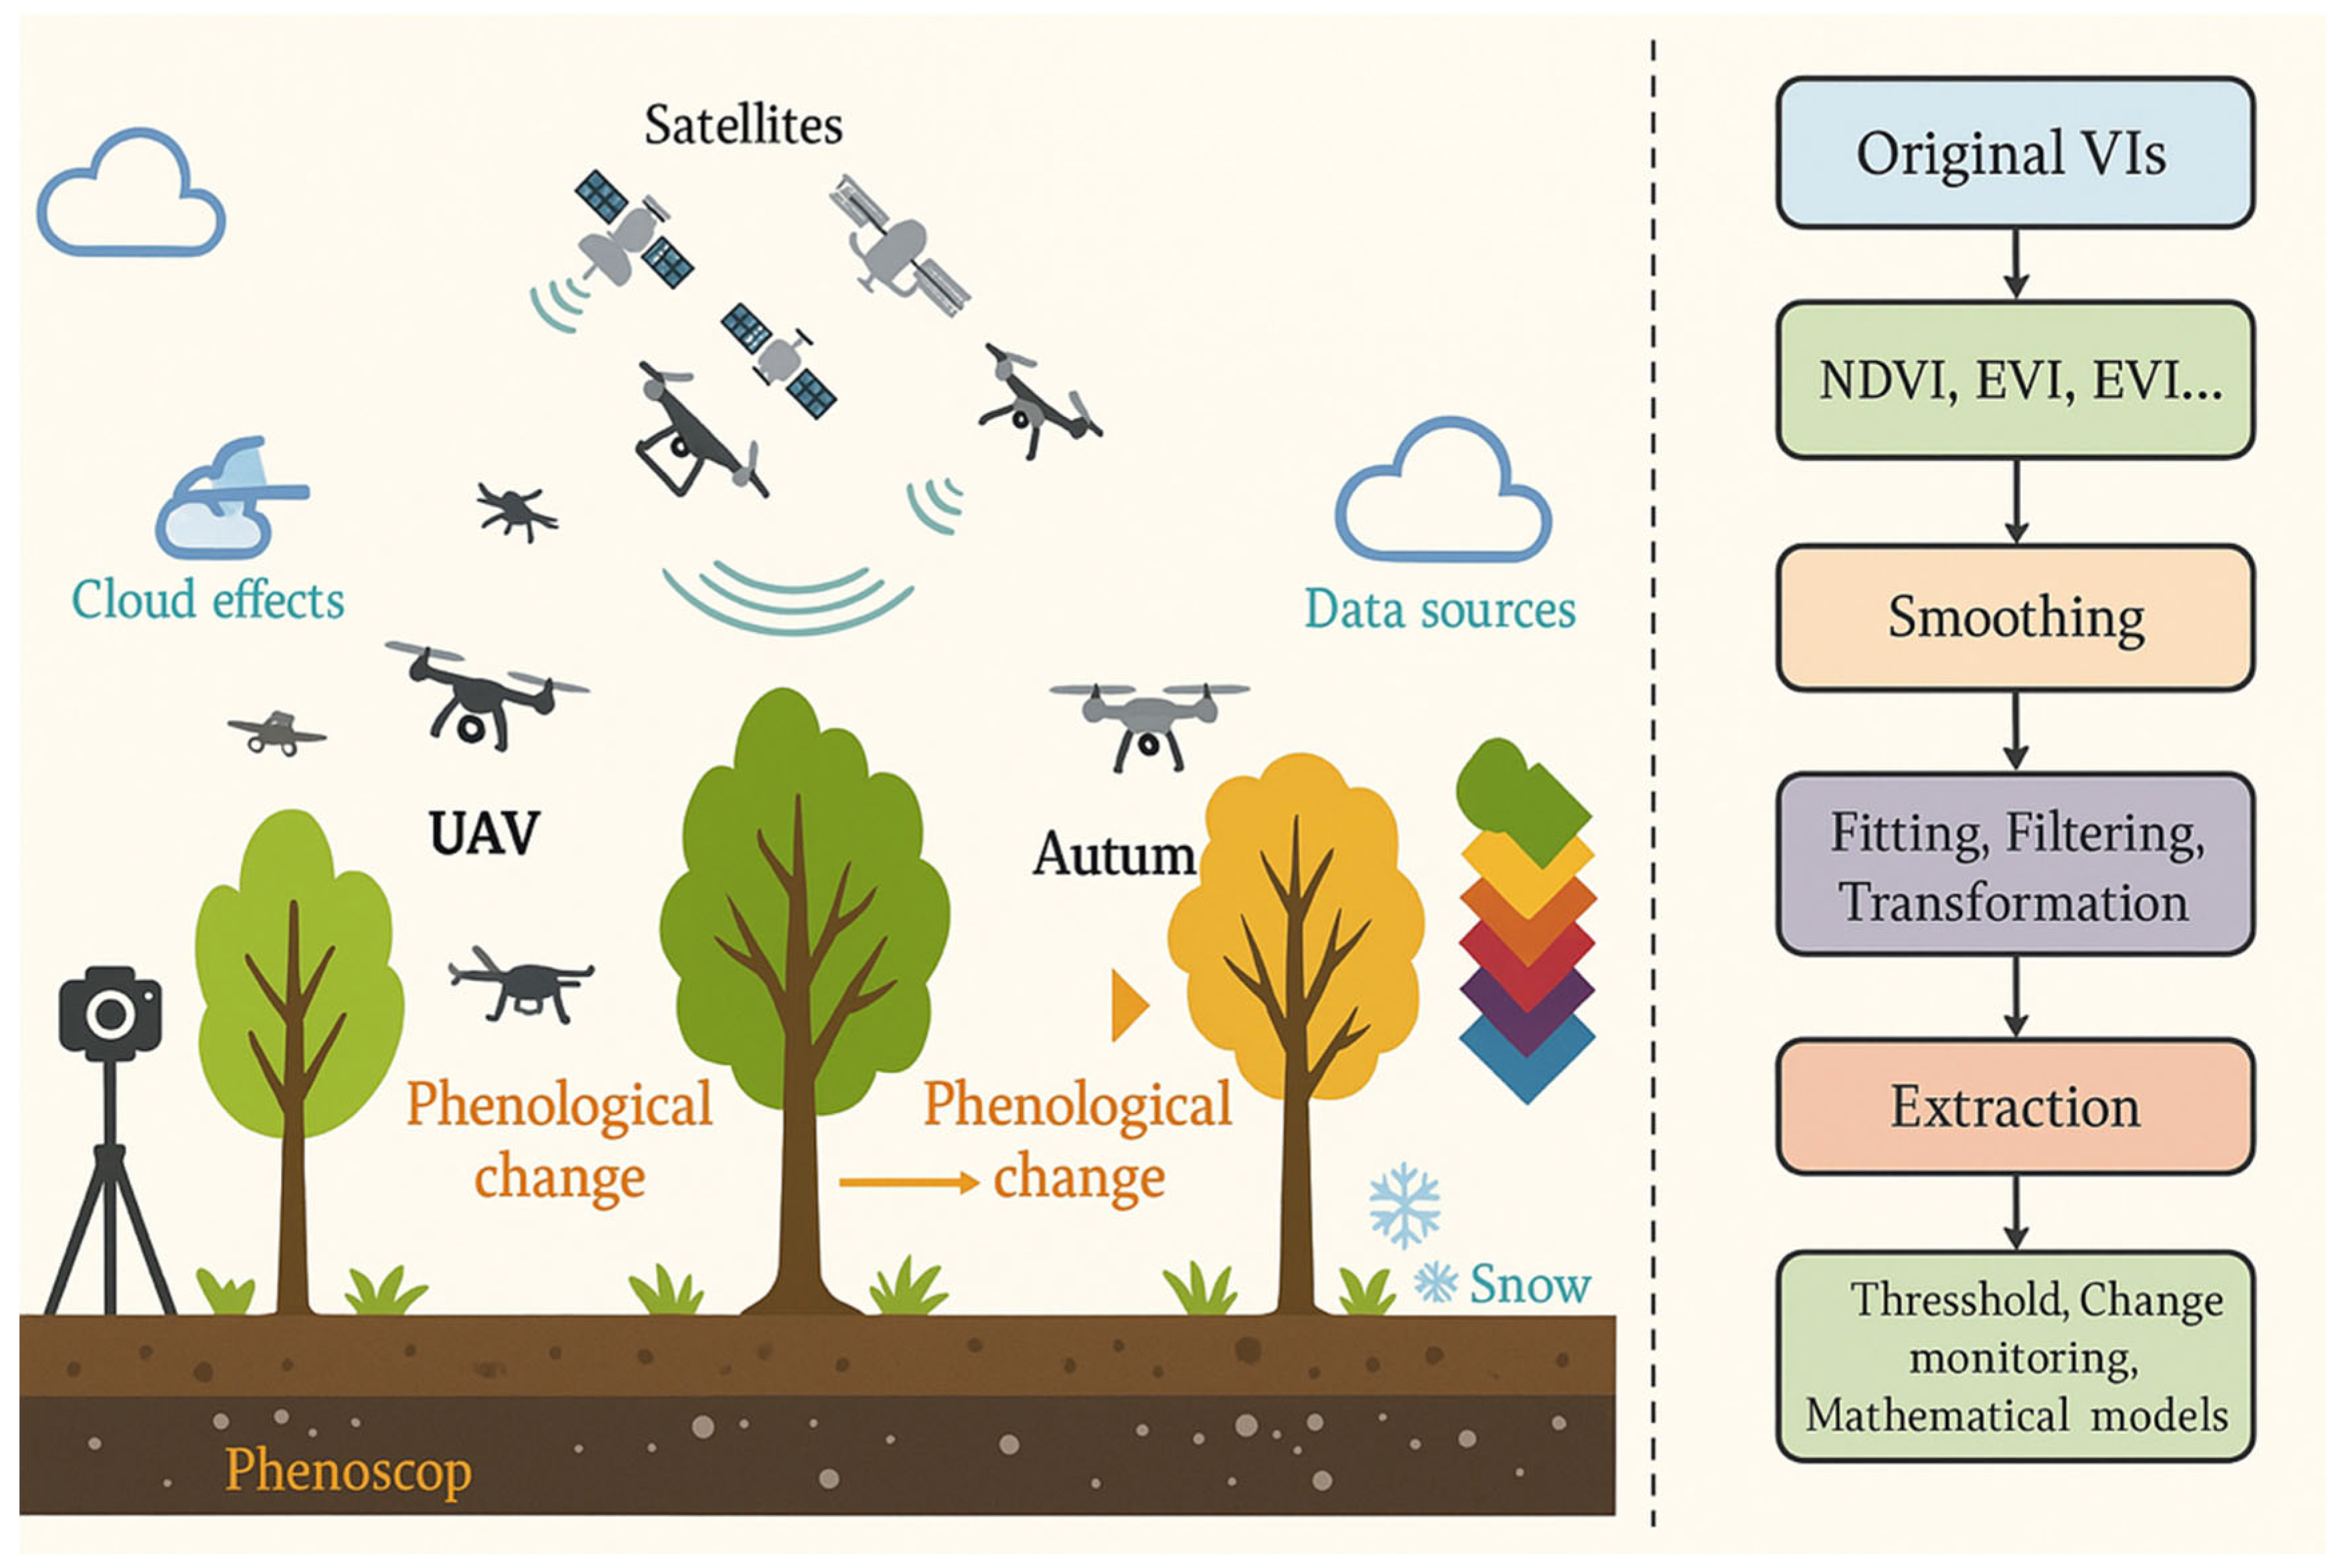
Figure 2.
Workflow of Uncertainty Propagation in Multi-source Forest Carbon Monitoring. Schematic workflow for uncertainty propagation in multi-source forest biomass estimation. Multiple sensor datasets are assigned uncertainty distributions, propagated through biomass estimation models using Monte Carlo simulation or analytical error modeling, resulting in biomass and uncertainty maps for decision-making support.
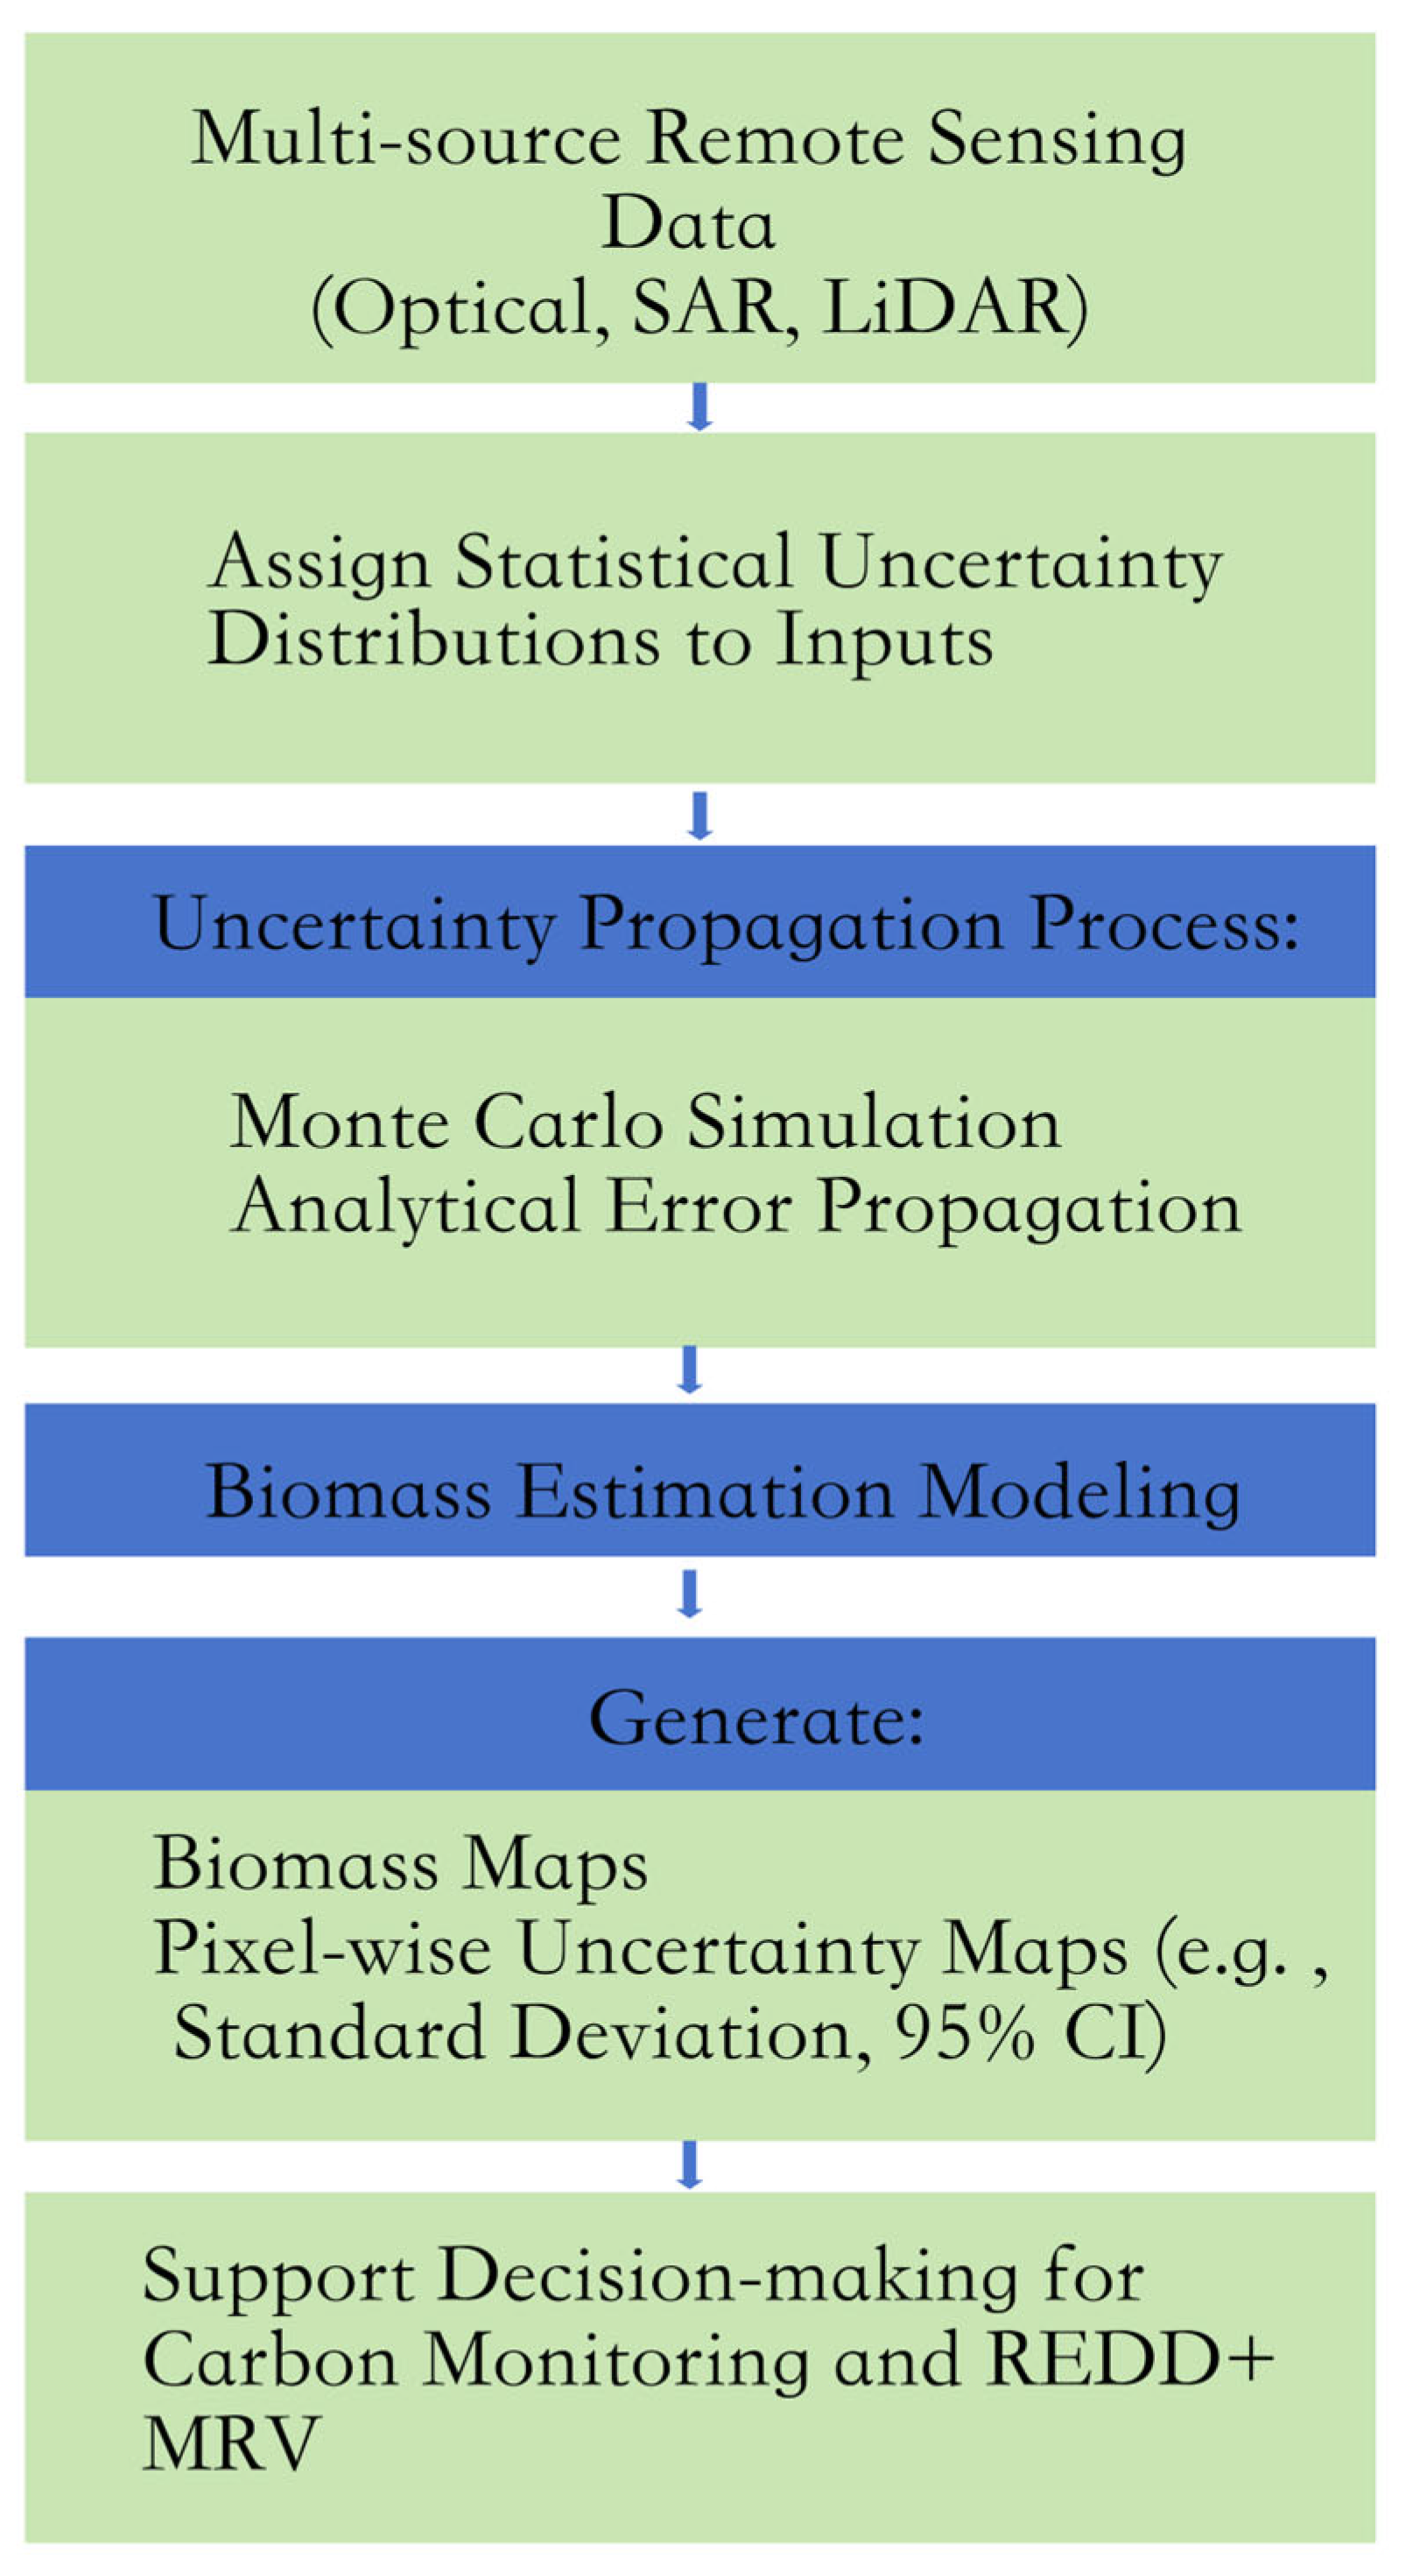
Figure 3.
End-to-End Workflow for Operational Forest Carbon Monitoring and Policy Integration.
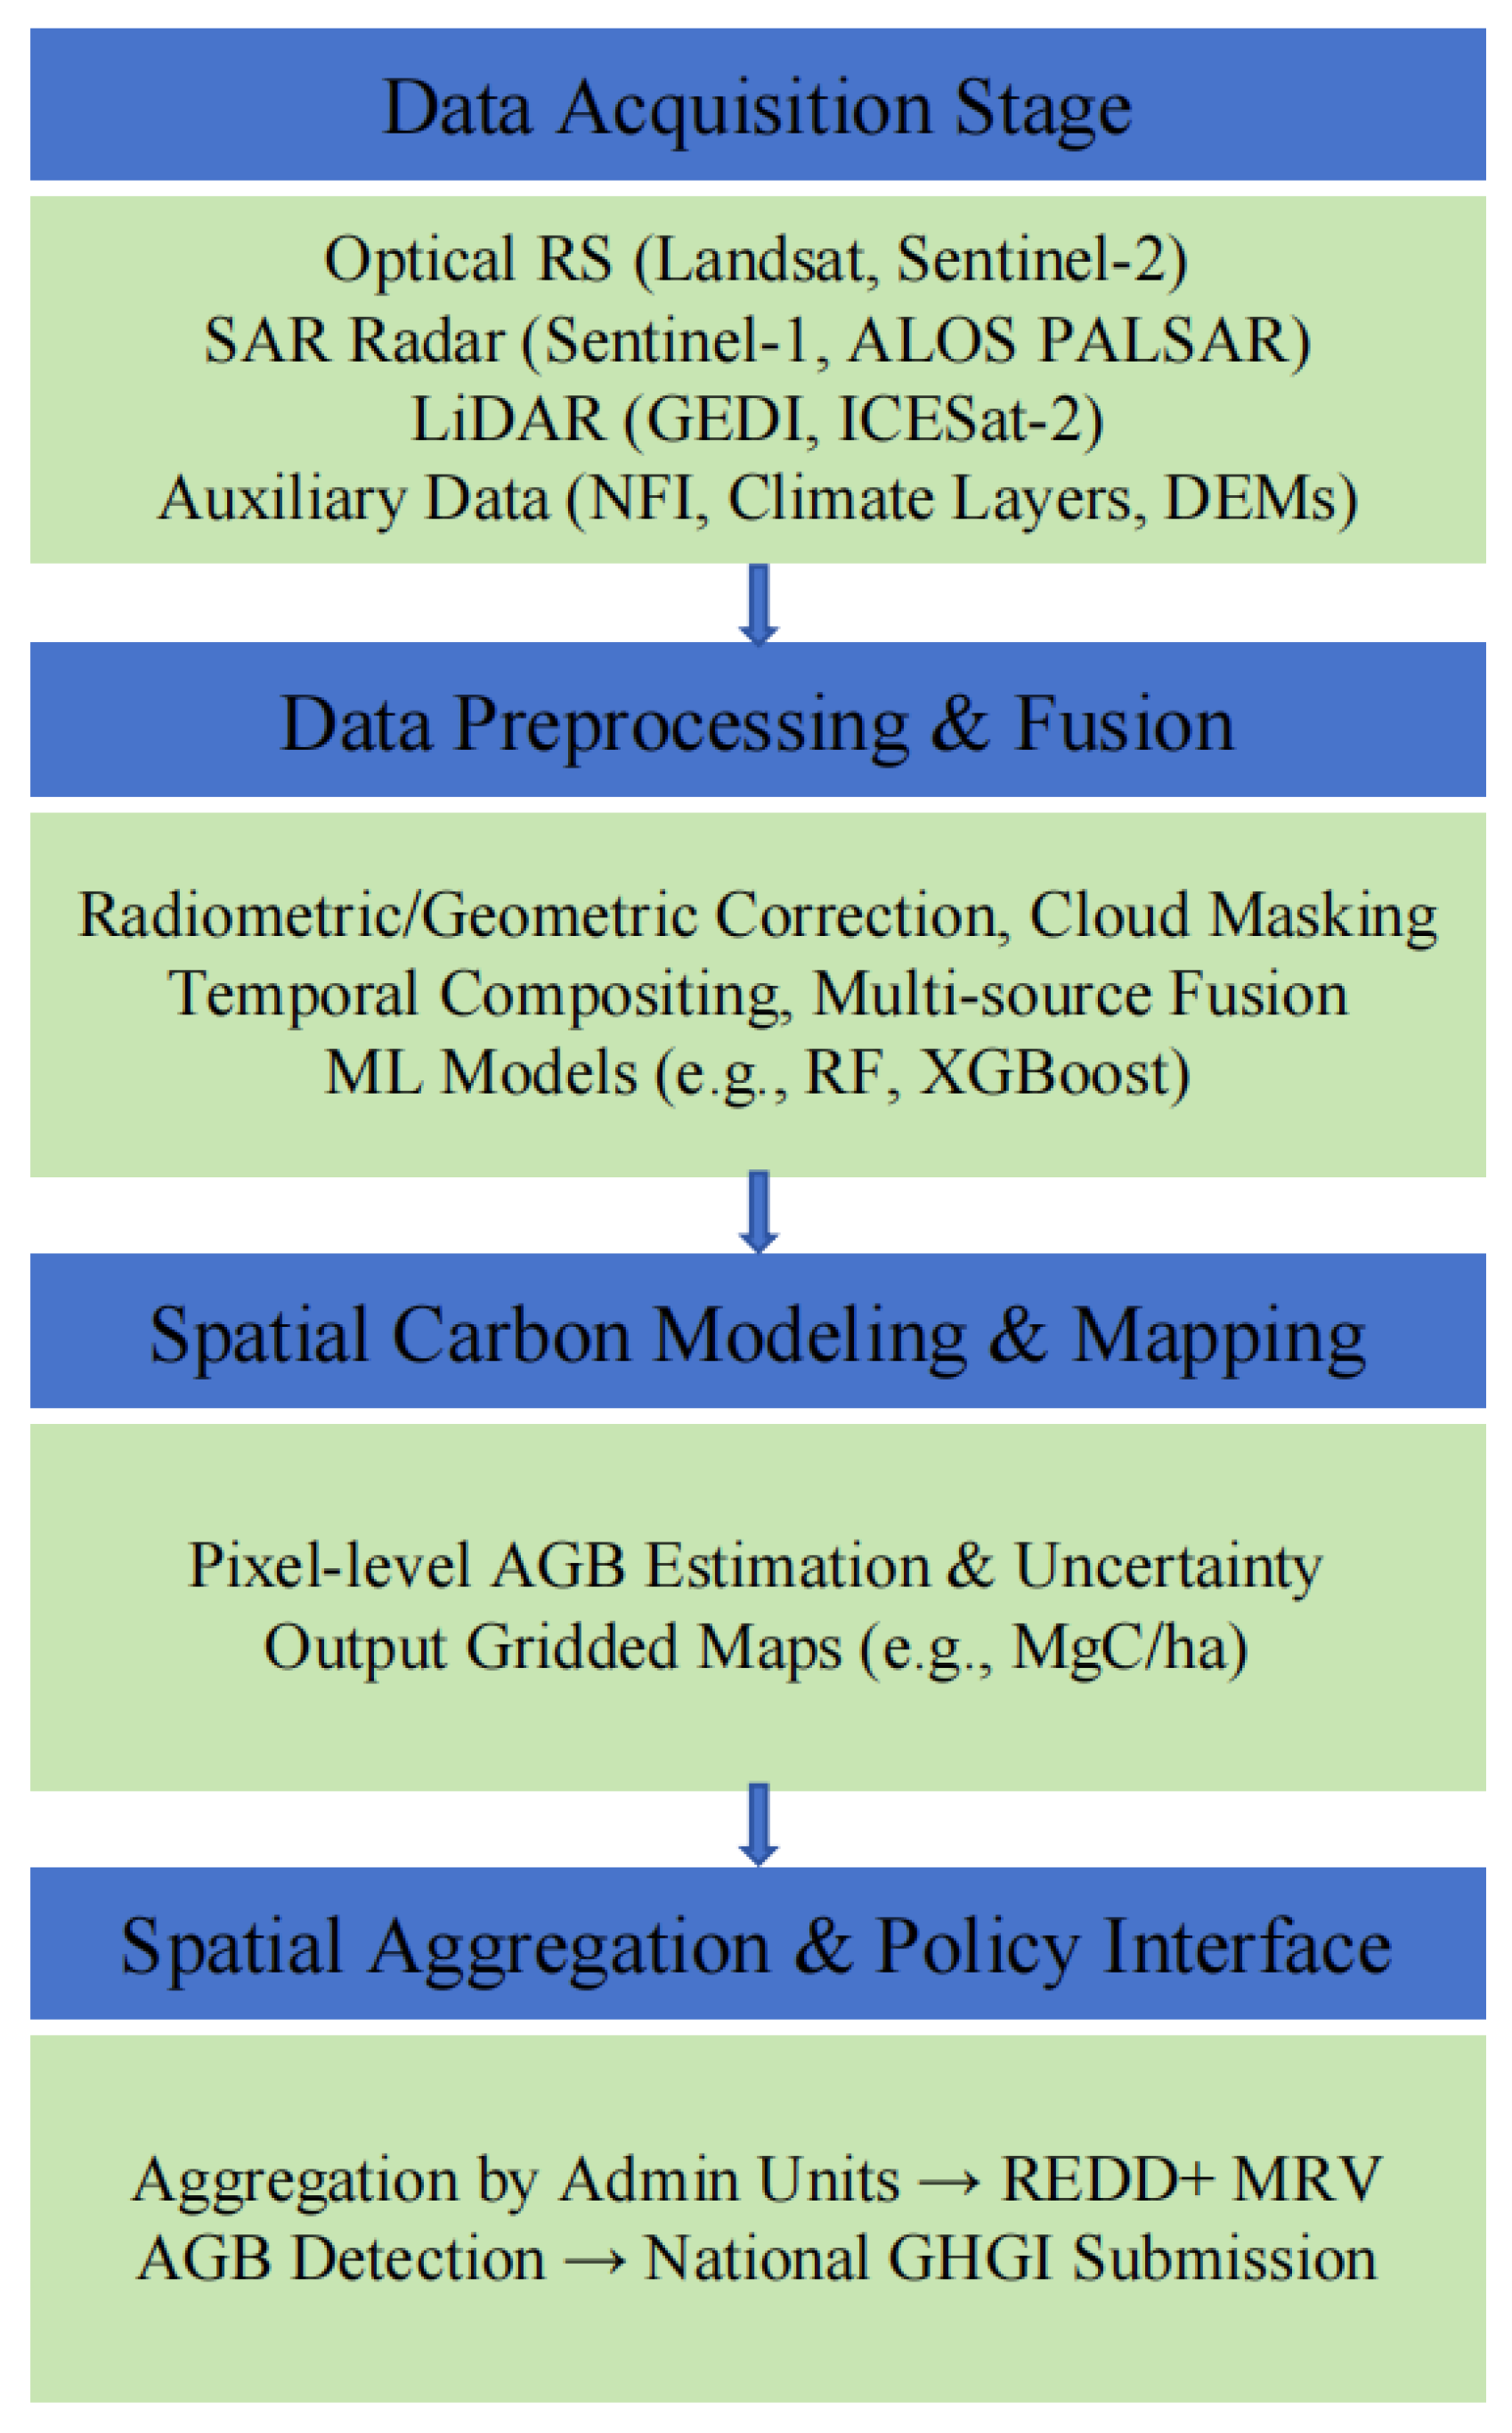
Figure 4.
Integrated Satellite, UAV, and Ground Network for Real-Time Carbon Monitoring.
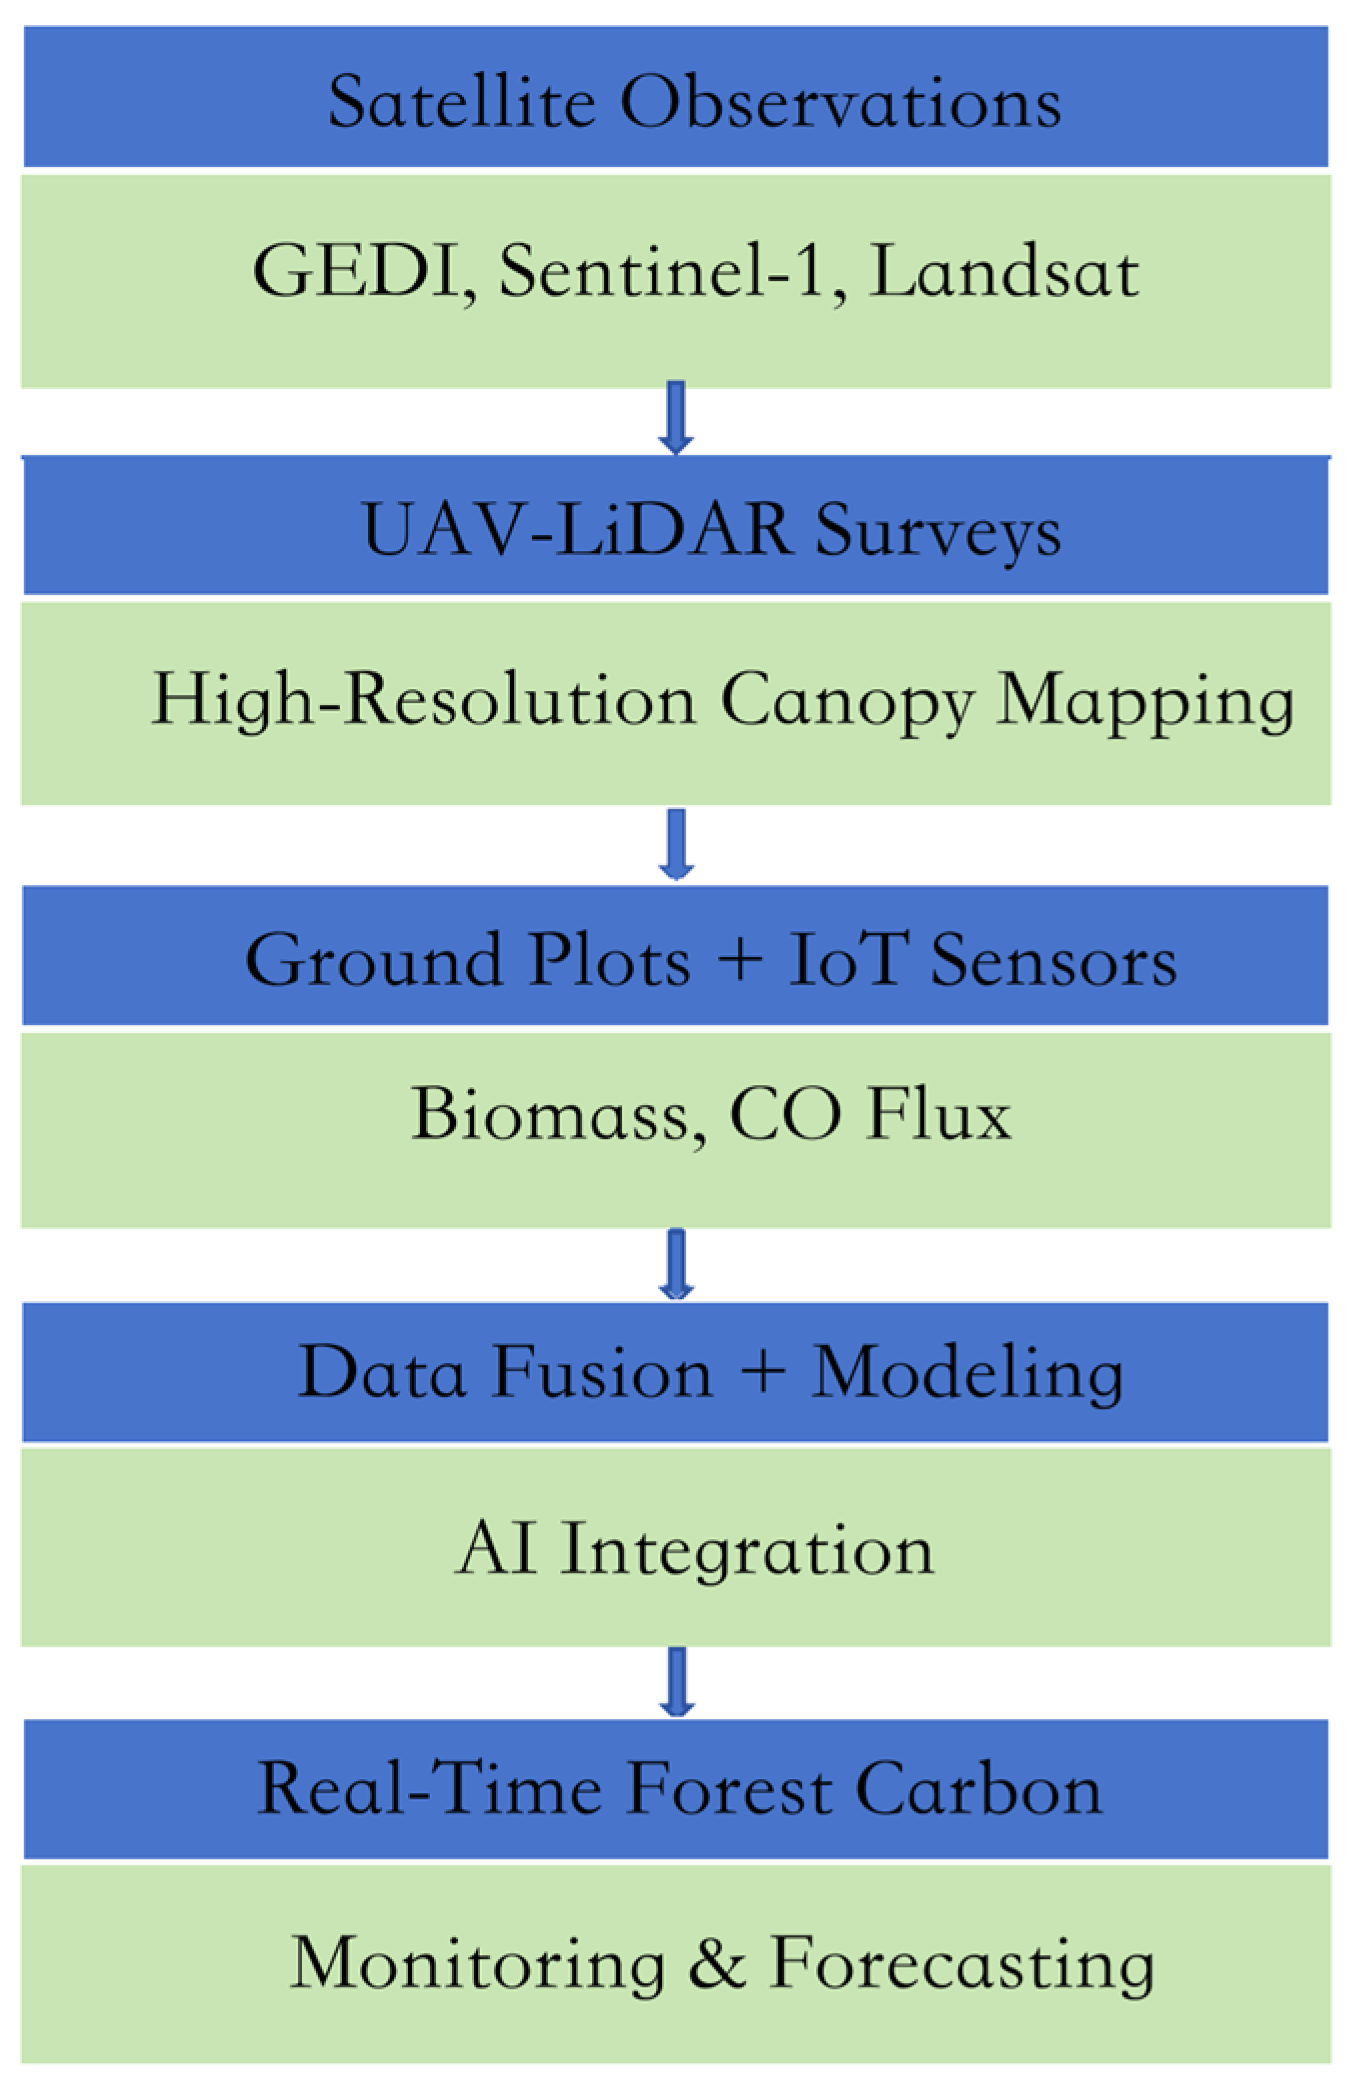

Table 1.
Comparative Analysis of This Review and Xu et al. (2025).
| Dimension | This Review | Xu et al. – Forests |
|---|---|---|
| Time Span and Focus | 2020–2025; carbon neutrality-focused integration | 1999–2024; technology-oriented historical scope |
| Remote Sensing Data Scope | Multi-source fusion (optical, SAR, LiDAR) with GIS modeling | Segmented analysis by sensor type with technical emphasis |
| Modeling Perspective | Practical use of ML/DL in scalable carbon estimation workflows | Conceptual classification of empirical and process-based models |
| Policy Integration | Strong alignment with REDD+, carbon markets, and NDC tracking | Technical depth but minimal linkage to climate policy mechanisms |
| Case Study Inclusion | Detailed policy-technical cases (e.g., Brazil, Congo Basin) | Lacks regionally grounded implementation examples |
| Strategic Outlook | Proposes an integrated RS-GIS-AI-policy monitoring framework | Emphasis on modeling uncertainty and methodological innovation |
| Distinctive Contribution | Practice-oriented synthesis with emphasis on operational feasibility and interdisciplinary integration | Methodologically detailed but policy-neutral, serving primarily technical audiences |
Table 2.
Representative remote sensing data sources for forest carbon monitoring. Spatial/temporal resolutions are approximate. Abbreviations: VIS – visible, TIR – thermal infrared, SAR – synthetic aperture radar, ALS – airborne LiDAR scanning.
Table 2.
Representative remote sensing data sources for forest carbon monitoring. Spatial/temporal resolutions are approximate. Abbreviations: VIS – visible, TIR – thermal infrared, SAR – synthetic aperture radar, ALS – airborne LiDAR scanning.
| Sensor / Mission | Type | Resolution | Revisit | Key Forest Carbon Uses |
| Landsat-8/9 (NASA/USGS) | Optical (VIS–SWIR) |
30 m | 16 days | Long-term forest cover change; biomass via spectral indices (calibrated with plots)[18]. |
| Sentinel-2 (ESA) | Optical (VIS–SWIR) |
10 m (20 m SWIR) | 5 days (2-satellite constellation) | High-resolution mapping of canopy greenness, leaf area, and forest type; inputs to biomass models, especially in regrowth and mosaic landscapes[19]. |
| MODIS (Terra/Aqua) | Optical (VIS–TIR) |
250–500 m (1 km TIR) | 1–2 days | Regional to global monitoring of vegetation activity (NDVI/EVI, FPAR); NPP estimation for carbon flux modeling[43]. |
| Planet Scope (Planet Labs) | Optical (VIS–NIR) |
3–5 m | Daily (constellation) | Detection of fine-scale changes (small clearings, degradation); verification of project-level carbon actions (e.g., tree planting survival). |
| Sentinel-1 (ESA) | SAR (C-band, VV/VH) |
10 m | 6–12 days | All-weather forest cover monitoring; near-real-time deforestation alerts; detecting flooding and damage under clouds. Limited biomass sensitivity in dense forests[25]. |
| ALOS-2 PALSAR-2 (JAXA) | SAR (L-band, HH/HV) |
25 m (10 m in spotlight) | ~42 days (global mode) | Mapping forest/non-forest extent and structure in tropics [27]; AGB estimation in low to mid biomass stands (e.g., woodland, secondary forest). |
| BIOMASS (ESA, 2024+) | SAR (P-band) |
~50–100 m | 16 days (planned) | Dedicated biomass mapping mission for high-biomass tropical and boreal forests; will provide first P-band tomographic data to estimate AGB up to >300 Mg ha−1 [25]. |
| GEDI Lidar (NASA, ISS) | LiDAR (1064 nm) |
~25 m footprint (60 m spacing) | ~2–4 years mission (sampling) | ~12 million shots per year sampling Earth’s forests; provides canopy height and structure used to calibrate biomass models and create 1-km gridded AGB products[29,30]. |
| ICESat-2 (NASA) | LiDAR (532 nm photon-counting) | ~17 m footprint (0.7 km track spacing) | 91-day exact repeat (sampling) | Global photon-counting LiDAR data used for canopy height retrievals (especially in high latitudes); complements GEDI by covering >51°N/S and open forests. |
| SMOS/SMAP (ESA/NASA) | Passive microwave (L-band) |
~40 km / 9 km | 2–3 days | Vegetation Optical Depth (VOD) as proxy for biomass and water content; tracking large-scale carbon changes (e.g., drought impacts) in combination with models [22,23]. |
| TanDEM-X (DLR) | SAR Interferometry (X-band) | ~12 m (height grid) | N/A (2010–2015 data) | Global digital elevation model from InSAR; used to derive forest canopy height (with ground DEM) and estimate biomass when calibrated[26]. |
| VIIRS (NASA/NOAA) | Thermal & Optical | 375 m (optical) 750 m (thermal) | Daily (polar orbit) | Active fire detection and burn scar mapping for estimating fire emissions; night-time lights can indicate human activity near forests (indirect driver data). |
Table 3.
Major Sources of Uncertainty in Multi-source Forest Biomass Estimation.
| Source | Description | Impact |
|---|---|---|
| Optical sensor radiometry | Calibration errors, atmospheric contamination | Biases in vegetation indices |
| SAR saturation | Loss of sensitivity in high biomass zones | Underestimated AGB |
| LiDAR sampling gaps | Sparse coverage, geolocation drift | Local errors in canopy structure |
| Temporal misalignment | Seasonality, disturbance mismatches | Phenology artifacts |
| Model structure assumptions | Over-simplified relationships | Systematic bias in biomass predictions |
Table 4.
Comparative Evaluation of Modeling Approaches for Forest Carbon Estimation across Different Forest Types.
Table 4.
Comparative Evaluation of Modeling Approaches for Forest Carbon Estimation across Different Forest Types.
| Modeling Approach | Suitable Forest Types | Typical Accuracy (R²) | Prediction Error (RMSE, Mg C/ha) | Data Requirements | Interpretability | Scalability | Strengths | Limitations |
|---|---|---|---|---|---|---|---|---|
| Empirical Regression | Temperate forests, open forests | 0.50–0.70 | 30–60 | Low | Very High | High | Simple to implement, transparent results | Signal saturation in high-biomass forests; limited generalizability |
| Machine Learning (RF) | Tropical, temperate, and boreal forests | 0.65–0.85 | 20–45 | Medium–High | Moderate | Very High | Robust to noise; integrates multi-source data effectively | Requires large training datasets; limited causal interpretation |
| Deep Learning ( CNN) | Tropical rainforests, highly heterogeneous landscapes | 0.75–0.90 | 15–35 | Very High | Low | Moderate | Excellent in extracting complex spatial patterns; suitable for high-resolution data | Data- and compute-intensive; “black box” model behavior |
| Process-based Models (CASA, Biome-BGC) | All forest types | 0.50–0.75 | 30–50 | Medium–High | High | Moderate | Simulates ecosystem processes; enables long-term scenario modeling | Requires detailed environmental inputs; complex parameterization |
Table 5.
Summary statistics of modeling performance metrics (R² and RMSE) for different biomass estimation approaches based on a meta-analysis of 30 studies (2020–2025).
Table 5.
Summary statistics of modeling performance metrics (R² and RMSE) for different biomass estimation approaches based on a meta-analysis of 30 studies (2020–2025).
| Modeling Approach | Mean R² ± SD | Mean RMSE (Mg C ha⁻¹) ± SD | 95% CI for R² |
|---|---|---|---|
| Empirical Regression | 0.62 ± 0.08 | 42 ± 6 | (0.60, 0.64) |
| Machine Learning | 0.78 ± 0.07 | 30 ± 5 | (0.76, 0.80) |
| Deep Learning | 0.85 ± 0.05 | 25 ± 4 | (0.83, 0.87) |
| Process-based Modeling | 0.66 ± 0.09 | 50 ± 8 | (0.63, 0.69) |
Table 6.
Future Research Priorities in Forest Carbon Monitoring.
| Research Frontier | Key Questions | Methodological Approaches | Critical Data Needs |
|---|---|---|---|
| AI-Augmented Modeling | How to integrate time series into deep learning models? | Temporal CNNs, Transfer Learning | Time-labeled biomass datasets |
| Real-Time Biomass Monitoring | Can sub-monthly biomass trends be operationalized? | Edge Computing, SAR Time Series Analysis | Near-real-time calibration data |
| High-Resolution MRV Scaling | What is the cost–benefit threshold for VHR datasets? | Cost-Effectiveness Modeling, Sampling Optimization | Regional pilot studies linked to REDD+ |
| Sky-Ground Data Fusion | How to unify satellite, UAV, and field measurements? | Data Assimilation, AI Fusion Frameworks | Coordinated multi-source observations |
Disclaimer/Publisher’s Note: The statements, opinions and data contained in all publications are solely those of the individual author(s) and contributor(s) and not of MDPI and/or the editor(s). MDPI and/or the editor(s) disclaim responsibility for any injury to people or property resulting from any ideas, methods, instructions or products referred to in the content. |
© 2025 by the authors. Licensee MDPI, Basel, Switzerland. This article is an open access article distributed under the terms and conditions of the Creative Commons Attribution (CC BY) license (http://creativecommons.org/licenses/by/4.0/).
Copyright: This open access article is published under a Creative Commons CC BY 4.0 license, which permit the free download, distribution, and reuse, provided that the author and preprint are cited in any reuse.


