
Submitted:
02 May 2025
Posted:
05 May 2025
You are already at the latest version
Abstract
Water quality in the city of Huarmey-Lima-Peru is assessed through monitoring processes conducted by the National Water Authority (ANA). Traditional formula-based calculations and Excel macros, along with manual data validation, significantly extend the analysis and documentation time for evaluating water quality parameters. This study focuses on classifying water samples into Human Consumption (1-A2) and Animal Drinking (3-D2) categories by developing a machine learning model, specifically utilizing the K-Nearest Neighbors (KNN) algorithm. The primary objective is to enhance accuracy and efficiency in classifying water quality for human and animal consumption, aligning with Peru's Water Quality Index standards (WQI). The implementation of the KNN model demonstrated superior classification performance compared to traditional spreadsheet-based methods, achieving an accuracy of 75% with Excel-based classification and 90% using KNN. Additionally, the research evaluates the performance of KNN against Random Forest (RF) and Support Vector Machine (SVM). This approach significantly improved the speed and accuracy of water sample categorization, benefiting decision-making in water resource management for the Huarmey basin.
Keywords:
Water quality index
; physicochemical parameters
; machine learning
; K Neighbors Classifier
1. Introduction
Water quality assessment is a critical process for ensuring safe water usage, particularly in Huarmey, Peru, where the National Water Authority (ANA) conducts regular monitoring. Currently, the Water Quality Index (WQI) classification relies on manual methods using Excel macros, which are time-consuming and prone to human error [1].
In this study, processing time is optimized, and accuracy is improved in classifying the quality of water intended for human consumption (1-A2) and animal consumption (3-D2) through the application of machine learning algorithms. The implementation of these models seeks to overcome the limitations of conventional methods, which can be inaccurate and computationally expensive. By improving the efficiency and reliability of water classification, this approach will contribute to more informed decision-making for water resource management, thus ensuring more effective and timely monitoring [2].
Figure 1 illustrates the monitoring and classification process of water quality in the Huarmey Basin, which is carried out in multiple stages to ensure compliance with environmental regulations and accuracy in the evaluation of water parameters (Autoridad Nacional de Agua, 2021). However, despite the rigor of the procedure, the conventional methodology based on the WQI and Excel macros presents limitations in efficiently and accurately classifying water bodies. These limitations may lead to inconsistencies in the results, ultimately affecting decision-making in water resource management. During the analysis phase, collected samples undergo laboratory evaluation to determine their physicochemical and biological parameters. However, the traditional classification of these data relies on manual processes and predefined rules, which can introduce errors and reduce the system’s ability to adapt to variations in water quality. Such deficiencies may hinder the early detection of environmental issues and delay the implementation of corrective measures [3]. To address this issue, this study proposes the implementation of the K-NN algorithm as a solution to optimize the classification of water quality data. This machine learning technique enhances classification accuracy and efficiency by reducing subjectivity and minimizing errors in water quality assessment. Once validated, the results obtained using this approach are documented and submitted to governmental entities, contributing to more informed decision-making and the sustainable management of water resources.
Given the situation described, “the control commission requested information from the technical area of the Provincial Municipality of Huarmey and identified that 8 of the 10 towns that have Sanitation Services Administration Board (JASS, Perú) lack a pre-chlorination system; in addition, it warned of a delay by the provincial municipality in implementing the National Superintendency of Sanitation Services (SUNASS), who is a public agency that regulates sanitation services in Peru, recommendations on the deficiencies detected in Tayca. The official guidance report was prepared by the Institutional Control Body (OCI) of the Provincial Municipality of Huarmey and was communicated to the head of the entity for the corresponding actions to safeguard the health of the inhabitants of the eight affected population centers” [4]. Water quality is vital to protect public health, preserve ecosystems, ensure food production, boost economies, and guarantee the sustainable use of water resources. For these reasons, monitoring and proper management of water quality are essential priorities in Peru's environmental and public health policies [5]. Given the critical need for accurate and timely water quality classification, automation, and data-driven approaches have become essential. Machine Learning (ML) offers a robust solution for automating classification tasks, improving both accuracy and efficiency in environmental monitoring systems. Among ML techniques, KNN stands out as a reliable algorithm for classification problems where labeled data is available, making it an ideal choice for categorizing water samples according to WQI standards [6].
This study proposes the implementation of KNN to automate WQI classification, addressing the inefficiencies of the traditional manual method. By leveraging historical water quality datasets, we aim to develop a model capable of accurately classifying water samples for human consumption (1-A2) and animal drinking (3-D2) while significantly reducing processing time (See Figure 2). This study proposes an optimized model for water quality classification in the Huarmey watershed, integrating the KNN algorithm into the analysis and monitoring process. The workflow begins with state authorization and sampling planning, followed by sample extraction and analysis in the laboratory. The data obtained are subsequently processed and classified using the WQI and the KNN algorithm implemented in Colab, which improves the accuracy of water classification. Once the results are validated, the technical documentation is generated, and the final report is sent to the competent authorities. The integration of the KNN model optimizes water quality assessment, providing a more accurate and efficient approach to decision-making in water resource management [7].
Water quality is a critical factor for public health and environmental sustainability. Evaluating physicochemical parameters allows identifying potential risks for human and animal consumption. In Peru, ANA is responsible for monitoring and assessing water quality using the WQI. Traditionally, this process relies on manual calculations through Excel macros, which are time-consuming and prone to human error [8]. This study proposes the implementation of a KNN machine learning model to automate and optimize the classification of water quality parameters in the Huarmey River Basin. The proposed model aims to improve accuracy, reduce processing time, and enhance the reliability of water quality assessments, particularly in the categories of human consumption (1-A2) and animal drinking (3-D2) according to ANA standards [9].
According to the results obtained in the research work of [10,11,12,13,14,15,16,17,18,19,20], to carry out an efficient classification process it is necessary to ensure that the data set contains an adequate amount of fairly homogeneous information for each class to be recognized, for this it is additionally important to carry out an adequate debugging or cleaning of data discarding or eliminating information that may distort the adequate classification process.
2. Background
Manual methods for calculating the WQI face several challenges, including processing delays, human error, and limited scalability. The reliance on static formulas and manual data validation in Excel slows decision-making and increases the likelihood of inaccurate classifications [7].
Machine learning algorithms, particularly KNN, provide a dynamic and automated solution for classifying complex datasets. KNN is a non-parametric algorithm that assigns a class to a new data point based on the majority vote of its KNN, making it suitable for classifying water quality data [21]. Several studies highlight the advantages of using KNN over traditional methods, particularly in scenarios requiring the classification of environmental parameters and large datasets. This research builds on previous findings to demonstrate the feasibility of applying KNN for optimizing WQI calculations [22]. Water quality classification in Peru follows WQI standards, where samples are categorized based on physical, chemical, and biological parameters such as:
- pH levels
- Dissolved oxygen (DO)
- Biochemical oxygen demand (BOD)
- Heavy metal concentration (Pb, Zn, As, etc.)
Previously, traditional statistical methods were used to classify water quality, but machine learning approaches have demonstrated superior efficiency and accuracy in similar environmental monitoring applications. The KNN algorithm offers a robust classification technique, particularly when coupled with cross-validation methods to prevent overfitting. See Table 1.
This water quality assessment system is linked to a color scale, where each quality level is represented by a specific color, which facilitates the interpretation of the water status. The indicator, applied in each period, analyzes the results of physical, chemical, and microbiological parameters. Using a mathematical formula, it converts a large amount of data (concentrations of the parameters analyzed) into a single scale, expressed as a percentage. An WQI value close to 0 percent indicates a high negative impact on water quality, while a value close to 100 percent reflects ideal conditions. This approach is useful for managing large volumes of data and presenting the WQI of an area or body of water under various conditions, such as (1) general monitoring, (2) dry season, and (3) rainy season [23].
Currently, ANA relies on Excel-based macros and manual calculations to classify water quality. While this method is widely used, it has significant drawbacks:
- High processing time – Manual classification can take hours or even days, depending on the dataset size.
- Prone to human errors – Data entry mistakes and formula inconsistencies can lead to misclassifications.
- Limited scalability – The method struggles to handle large-scale datasets efficiently.
These limitations highlight the need for an automated, data-driven approach to enhance efficiency, accuracy, and reproducibility in WQI classification [24].
Machine learning (ML) has emerged as a powerful tool for automating classification tasks in environmental science. Studies have shown that ML models can outperform traditional statistical methods in:
- Water quality prediction using regression models.
- Anomaly detection in water contamination events.
- Pattern recognition in water parameter fluctuations.
Among various ML techniques, KNN has proven effective for classification tasks where labeled data is available. KNN is particularly suited for WQI classification due to its ability to categorize new samples based on similarity to existing data points [25].
3. Previous concepts
3.1. Water Quality Index (WQI)
WQI is a standardized tool that integrates various physicochemical, biological, and microbiological parameters to evaluate water quality through a single numerical value. This index simplifies the interpretation of water quality data for regulatory authorities, scientists, and the general public.
In Peru, the WQI is calculated based on parameters established by the ANA, following the guidelines of the "Environmental Quality Standard for Water (ECA - Agua)." The parameters are classified according to the intended use of the water, with two primary categories being:
- 1-A2: Suitable for human consumption after conventional treatment.
- 3-D2: Suitable for animal drinking purposes.
3.2. K-Nearest Neighbors (KNN)
The KNN algorithm is a supervised learning method that classifies a data point based on its proximity to its nearest neighbors in the feature space. This algorithm is particularly useful for water quality classification due to its simplicity and effectiveness when properly tuned [26]. How the KNN Algorithm Works (See Figure 3):
- Distance Calculation: The algorithm calculates the distance between the new data point and existing samples using metrics such as:
- Euclidean Distance (for continuous data).
- Manhattan Distance (for multidimensional data).
- b.
- Choosing the Value of K: Determines the number of neighbors to consider. In this study, k = 8 was selected as the optimal value through parameter tuning (Saddiqi et al., 2024).
- c.
- Majority Vote: The algorithm assigns the category that appears most frequently among the k-nearest neighbors [27].
- d.
- Advantages of the KNN Algorithm:
- Simplicity and Flexibility: Easy to implement and interpret, adaptable to various types of data.
- Robustness: Effective for noisy data if the k value is chosen appropriately.
- Versatility: Works with both numerical and categorical datasets [22].
3.3. Cross-Validation
Cross-validation is a statistical method used to evaluate model performance. This study employs a 5-fold cross-validation approach to mitigate overfitting and ensure the generalizability of the KNN model [3].
Cross-Validation Process in this Study:
- Data Splitting: The dataset is divided into five equal folds using the KFold method from the scikit-learn library.
- Training and Evaluation: For each iteration:
- The model is trained in four folds and validated on the fifth.
- The coefficient of determination (R²) is calculated to measure model accuracy.
- 3.
- Parameter Optimization: GridSearchCV was used to identify the optimal k value (k = 8), maximizing classification performance.
- 4.
- Overfitting Prevention: This process helps prevent overfitting by ensuring that the model does not rely too heavily on specific subsets of the data
Benefits of Cross-Validation:
The three dimensions of the graph are labeled "f1," "f2," and a third vertical dimension, which is the variable that reflects a score or value on a 0 to 100 AQI scale, represents f3.
- The horizontal "f1" axis represents a quantitative characteristic or metric, with values ranging from 0 to 1.
- The "f2" axis also measures a characteristic or metric, and its values range from 0 to approximately 0.7.
- The vertical axis represents an outcome or assessment variable, with values ranging from 0 to 100.
- The data are labeled with four different categories:
- Red (Circles): Represents the "Bad" category, with high scores (close to 100) on the vertical axis and located in a particular area of the "f1" and "f2" axes.
- Green (Triangles): Represents the "Excellent" category, with data distributed primarily in the lower part of the graph (low scores on the vertical axis) and concentrated within a specific range of "f1" and "f2".
- Blue (Squares): Represents the "Fair" category, with points mainly in the middle of the graph (vertical axis around 50) and with intermediate values for "f1" and "f2".
- Yellow (Diamonds): Represents the "Good" category, with values distributed primarily in the left quadrant of the graph.
As we can see in Figure 4, to justify the use of the KNN algorithm in classifying water parameters according to WQI, it is important to analyze the model performance using key evaluation metrics in the classification context. Cross-validation is a technique that divides the data into several subsets to train and test the model on different partitions, ensuring that the model performance does not depend on a single dataset [31,32]. Cross-validation is a technique used in the field of artificial intelligence and machine learning to measure the performance of a model. Its main purpose is to prevent the model from overfitting the training data, offering a more robust and reliable evaluation [33].
In this case, the training data came from data collection and generation, and were constantly validated with ICAs, which were calculated from data obtained from the ANA, along with records from the years 2020, 2021, and 2023. Thus, in each iteration, the training data was checked using data independent of these [34]. To manage overfitting, hyperparameters were properly tuned, and techniques such as regularization and tree depth control were implemented. Underfitting was avoided by selecting sufficiently complex models, appropriately tuning KNN parameters, and Random Forest tree configuration. Furthermore, cross-validation enabled a robust evaluation of the model and prevented conclusions from being based on a single dataset, providing a more generalized view of performance.
4. Methodology
This section describes the dataset, preprocessing techniques, KNN implementation, and validation methods used in this study. The goal is to ensure high classification accuracy while optimizing the model’s efficiency and scalability.
4.1. Dataset and Preprocessing
The dataset was compiled from official reports provided by the ANA, which conducted water quality monitoring in the Huarmey River Basin. Data from the years 2020, 2021, and 2023 were selected to provide a comprehensive temporal analysis.[35].
4.1.1. Data Acquisition
The dataset consists of historical water quality measurements collected in the Huarmey basin, Ancash, Perú, during the three-year monitoring period: 2020, 2021 and 2023 [23].
- The dataset was obtained from the ANA which conducts regular water quality monitoring in Peru.
- Water samples were collected from multiple locations in the Huarmey basin.
- Physicochemical and Biological Attributes Considered:
- pH levels – Determines acidity or alkalinity.
- Dissolved Oxygen (DO) – Essential for aquatic life.
- Biochemical Oxygen Demand (BOD) – Measures organic pollution levels.
- Heavy Metals (Pb, Zn, As, Cd, etc.) – Indicates industrial or agricultural contamination.
- Coliform Bacteria – Measures microbiological contamination.
4.1.2. Data Preprocessing
To prepare the dataset for machine learning classification, the following steps were taken:
- Normalization – Standardizing numerical values to ensure uniform feature scaling.
- Handling missing values – Using imputation techniques to maintain data integrity.
- Encoding categorical labels – Converting WQI classification categories into numerical values (e.g., 1-A2 → Class 0, 3-D2 → Class 1).
Figure 5 illustrates the training workflow of machine learning models for water quality classification in two categories: human consumption (1-A2) and animal drinking water (3-D2). From a root node, two main processes are defined: trainCategory1A2 and trainCategoryAnimalDrinkingWater, each training models based on Support Vector Machines (SVM), Random Forest, and KNN. These models enable efficient multiclass classification, optimizing processing time and accuracy in WQI evaluation [36].
4.2. KNN Model Implementation
The KNN algorithm was selected for its effectiveness in classification tasks with structured datasets. The model was implemented using Scikit-Learn in Python.
4.2.1. Hyperparameter Optimization
- The optimal value of k was determined using GridSearchCV, which tested multiple values to maximize accuracy.
- The best-performing model was found at k=8.
4.2.2. Validation Method
- 5-Fold Cross-Validation was used to improve model reliability and prevent overfitting.
- Weighted F-score was selected as the primary evaluation metric.

Table 2.
Performance Comparison: Excel Macros vs. KNN for WQI Classification.
| Aspect | Excel Macros (Traditional Method) | KNN-Based Classification |
| Accuracy (F-Score) | 75% | 90% |
| Processing Time | Several hours | Minutes |
| Error Margin | High (Manual Entry Errors, Formula Inconsistencies) | Low (Automated, Consistent Computation) |
| Scalability | Limited to Small Datasets | Efficient for Large-Scale Data |
| Human Intervention | Required for Data Entry and Formula Validation | Fully Automated Once Trained |
| Flexibility to New Data | Requires Manual Updates | Learns and Adapts from New Data |
4.3. Comparison with the Traditional WQI Method
To evaluate the effectiveness of the KNN model, we compared its performance with the traditional Excel-based WQI classification method used by the ANA in Peru (Table 2, Table 3). The analysis focuses on accuracy, processing efficiency, scalability, and error susceptibility to determine which approach offers the best solution for classifying water quality. To assess the effectiveness of KNN, the model was compared with the traditional Excel-based WQI classification:
5. System Implementation
The system is structured into several modules:
- Data Input Module: Receives raw water quality data.
- Preprocessing Module: Normalizes, cleans, and encodes the data.
- Training Module: Implements KNN with optimized hyperparameters.
- Classification Module: Classifies water quality into 1-A2 and 3-D2 categories.
- Visualization Module: Generates graphical outputs for better interpretation [37].
The model was compared against traditional Excel-based calculations, demonstrating superior accuracy and reduced processing time. KNN reduced manual processing by 40% and achieved an accuracy rate of 99.9% for category 1-A2 and 98.7% for category 3-D2.
Figure 6 illustrates the evolution of the R² score per fold in the KNN model applied to the WQI classification. The results demonstrate a high level of accuracy and consistency, reinforcing the model’s suitability for water quality assessment.
- High R² Scores Across Folds
- The R² score remains very close to 1, indicating a near-perfect prediction capability.
- Two folds (2 and 3) achieve an optimal R² score of 1.0000, highlighting the model's robustness.
- b.
- Stable Performance with Minor Variations
- Despite slight fluctuations in folds 1, 4, and 5, the scores remain above 0.99, ensuring high reliability.
- The minor dip in fold 4 still maintains an exceptionally high predictive accuracy, showcasing the model's generalization capability.
- c.
- Successful Model Export and Training Efficiency
- The model was successfully trained and exported with 8,000 samples, ensuring a well-generalized learning process.
- The structured approach, including label encoding and data partitioning, facilitated an efficient classification workflow.
6. Results
Key findings from the implementation of the KNN model include:
- Improved Accuracy: The KNN model provided a classification accuracy of 90% for human consumption (1-A2) and for animal drinking (3-D2).
- Reduced Processing Time: The model automated and accelerated the classification process, reducing manual intervention by 40%.
- Error Reduction: Cross-validation reduced the risk of overfitting, enhancing the reliability of the classification process [38].
6.1. Performance Metrics and Accuracy Comparison
To evaluate model performance, we measured classification accuracy, f-score, and processing time. The results are summarized in Table 4:
- KNN significantly outperformed Excel-based classification, improving the f-score from 75% to 90%.
- Processing time was reduced from several hours to just minutes, making the model more suitable for large-scale and real-time applications.
- The model demonstrated strong generalization capabilities, meaning it maintained high accuracy across different datasets from 2020, 2021, and 2023.
6.2. Cross-Validation and Model Stability
To ensure the model's reliability and prevent overfitting, we implemented 5-fold cross-validation.
- Without Cross-Validation: The model showed high variance, meaning performance fluctuated across different datasets.
- With Cross-Validation: The accuracy remained consistent, confirming the model's ability to generalize new water samples.
- GridSearchCV was used to optimize k, identifying k=8 as the best value. The f-score remained stable between 89%-91% across different folds, demonstrating robustness [22].
6.3. Comparison with Traditional WQI Classification Methods
The manual WQI classification using Excel macros has been the standard approach, but it has several drawbacks. Requires extensive manual data entry, leading to potential human errors. Limited scalability makes it difficult to process large datasets efficiently. Time-consuming, requiring hours for classification and validation.
In contrast, the KNN based classification model provided:
- Higher accuracy with fewer errors.
- Significant time savings, completing tasks in minutes instead of hours.
- Automation and scalability, making it adaptable for larger datasets and future integrations with IoT-based water monitoring systems.
Figure 7 presents the water quality assessment for Category 3 - Animal Drinking Water, using different machine learning models (SVM, Random Forest, and KNN). The Calculated WQI is 48.55, which classifies the water as "Regular". All three predictive models (SVM, Random Forest, and KNN) also classify the water as "Regular", confirming consistency across different classification approaches. Analysis of Water Quality Parameters (Charts 1-4):
Chart 1: Conductivity, Coliforms, and Aluminum (al)
- Conductivity (blue) shows fluctuations across samples, with peaks at samples 4 and 6.
- Coliforms (orange) present a significant spike at sample 3, indicating a potential biological contamination event.
- Aluminum (al) (green) remains consistently low across all samples.
Chart 2: Biological Oxygen Demand (BOD), Manganese (mn), and Zinc (zn)
- BOD (blue) shows an increase in sample 6, suggesting a possible rise in organic matter.
- Manganese (mn) and Zinc (zn) remain relatively stable, with a slight increase at sample 3.
Chart 3: pH, Oxygen (o), and Copper (cu)
- pH (blue) remains stable throughout the samplings.
- Dissolved Oxygen (o) (orange) presents fluctuations but stays within an expected range.
- Copper (cu) (green) maintains low levels with minor variations.
Chart 4: Heavy Metals (Arsenic, Boron, Cadmium, Mercury, and Lead)
- Cadmium (cd) and Lead (pb) show significant peaks at sample 3, indicating potential heavy metal contamination.
- Arsenic (as), Boron (b), and Mercury (hg) present small fluctuations but remain within low concentration levels.
6.4. Potential Impact of KNN for Water Quality Monitoring
- Real-Time Analysis: KNN enables rapid classification, allowing authorities to respond faster to contamination risks.
- Scalability: The model can process large datasets efficiently, making it suitable for nationwide applications.
- Adaptability: The system can incorporate new data over time, improving its predictions and accuracy.
7. Conclusions
- The implementation of KNN for WQI classification has demonstrated significant advantages over the traditional Excel-based method, improving both accuracy and processing efficiency. The key findings of this study highlight the effectiveness of machine learning in automating environmental data classification, offering a scalable solution for water monitoring systems [7].
- The weighted f-score increased from 75% (Excel) to 90% (KNN), demonstrating superior precision. This improvement reduces misclassification errors and enhances the reliability of water quality assessments. In the context of correct word use, an even more notable increase of 65% in scores was observed, compared to the control group. These findings highlight the positive and differential influence of system implementation, particularly in precision and appropriateness of word use [39].
- Real-time water quality monitoring using IoT sensors can automatically feed data into the KNN model, allowing instant classification and early detection of contamination events. Future studies should incorporate more extensive datasets, covering multiple regions and seasonal variations to improve model robustness and adaptability [40].
Author Contributions
Conceptualization, H.V. and J.P. ; methodology, H.V., J.P. and P.D.; software, J.P. and G.M.; validation, D.C., Y.G. and M.R.; formal analysis, H.V., A.C., L.G. and R.G.; investigation, J.P.; resources, G.M. and O.B. ; data curation, J.P..; writing—original draft preparation, J.P, H.V. ; writing—review and editing, G.M., Y.G. and. D.C.; supervision, H.V.; funding acquisition, H.V. All authors have read and agreed to the published version of the manuscript.
Funding
Please add: This research was supported by Universidad Nacional Mayor de San Marcos – R. R. Nro. aabb-cc and Project number C25202481– Project type PCONFIGI 2025.
Acknowledgments
We extend our gratitude to the ANA for providing access to critical water quality data. Special thanks to the academic advisors and research team for their invaluable guidance throughout the project.
Conflicts of Interest
The authors declare no conflicts of interest. The funders had no role in the design of the study; in the collection, analyses, or interpretation of data; in the writing of the manuscript; or in the decision to publish the results.
References
- D. Castillo Suarez, “Diseño Del Sistema De Abastecimiento De Agua Potable Para La Mejora De La Condición Sanitaria Del Caserío Molinopampa, Distrito De Malvas, Provincia De Huarmey, Región Ancash - 2020,” 2019.
- Autoridad Nacional de Agua, “MONITOREO DE LA CALIDAD DEL AGUA DE LA CUENCA AIJA-HUARMEY 2021 (11 de agosto al 22 de setiembre del 2021) PERÚ Ministerio de Desarrollo Agrario y Riego Autoridad Nacional del Agua,” 2021.
- L. L. Ochoa, “Evaluation of Classification Algorithms using Cross Validation,” Ind. Innov. Infrastruct. Sustain. Cities Communities, pp. 24–26, 2019. [CrossRef]
- La República, “Áncash: Agua sin cloración consumen pobladores de ocho centros poblados de Huarmey | Sociedad | La República.” pp. 1–12, 2021, [Online]. Available: https://larepublica.pe/sociedad/2021/11/17/ancash-agua-sin-cloracion-consumen-pobladores-de-ocho-centros-poblados-de-huarmey-lrnd.
- Organización Mundial de la Salud, “Water, sanitation and hygiene links to health : Facts and figures.” 2022, [Online]. Available: https://iris.who.int/handle/10665/69489.
- E. E. Hussein et al., “Groundwater Quality Assessment and Irrigation Water Quality Index Prediction Using Machine Learning Algorithms,” Water (Switzerland), vol. 16, no. 2, 2024. [CrossRef]
- M. Cakir, M. Yilmaz, M. A. Oral, H. Ö. Kazanci, and O. Oral, “Accuracy assessment of RFerns, NB, SVM, and kNN machine learning classifiers in aquaculture,” J. King Saud Univ. - Sci., vol. 35, no. 6, p. 102754, 2023. [CrossRef]
- Ancash Noticias, “Preocupante: ANA constata la mala calidad de agua en la cuenca de agua del río de Huarmey - Ancash Noticias Ancash Noticias.” 2021, [Online]. Available: https://ancashnoticias.com/2021/01/03/ancash-ana-constata-la-mala-calidad-de-la-cuenca-de-agua-del-rio-de-huarmey/.
- E. Dritsas and M. Trigka, “Efficient Data-Driven Machine Learning Models for Water Quality Prediction,” Computation, vol. 11, no. 2, 2023. [CrossRef]
- H. Vega, E. Sanez, P. D. La Cruz, S. Moquillaza, and J. Pretell, “Intelligent System to Predict University Students Dropout,” Int. J. online Biomed. Eng., vol. 18, no. 7, pp. 27–43, 2022. [CrossRef]
- R. Villanueva-Alarcon and H. Vega-Huerta, “PConvolutional Neural Networks on assembling classification models to detect mel-anoma skin cancer Convolutional Neural Networks on Assembling Classifi-cation Models to Detect Melanoma Skin Cancer.” 2020. [CrossRef]
- G. L. E. Maquen-Niño et al., “Brain Tumor Classification Deep Learning Model Using Neural Networks,” Int. J. online Biomed. Eng., vol. 19, no. 9, pp. 81–92, 2023. [CrossRef]
- P. De-La-Cruz, R. Rojas-Coaquira, H. Vega-Huerta, J. Pérez-Quintanilla, and M. Lagos-Barzola, “A Systematic Review Regarding the Prediction of Academic Performance,” Journal of Computer Science, vol. 18, no. 12. Science Publications, pp. 1219–1231, 2022. [CrossRef]
- J. Yauri, M. Lagos, H. Vega-huerta, P. De-la-cruz-vdv, G. L. E. Maquen-niño, and E. Condor-tinoco, “Detection of Epileptic Seizures Based-on Channel Fusion and Transformer Network in EEG Recordings,” Int. J. Adv. Comput. Sci. Appl., vol. 14, no. 5, 2023. [CrossRef]
- G. L. E. Maquen-niño, J. Bravo, R. Alarcón, I. Adrianzén-olano, and H. Vega-huerta, “Una revisión sistemática de Modelos de clasificación de dengue utilizando machine learning,” RISTI - Rev. Iber. Sist. e Tecnol. Inf., vol. 6, no. 50, pp. 5–27, 2023. [CrossRef]
- H. Vega-Huerta, K. Pantoja-Pimentel, S. Quintanilla Jaimes, G. Maquen-Niño, P. De-La-Cruz-VdV, and L. Guerra-Grados, “Classification of Alzheimer’s Disease Based on Deep Learning Using Medical Images,” vol. 20, no. 10, pp. 101–114, 2024. [CrossRef]
- H. Vega-huerta et al., “Reconocimiento facial mediante aprendizaje por transferencia para el control de acceso a áreas restringidas,” pp. 261–273, 2023.
- H. Vega-huerta et al., “Intelligent Facial Recognition System for Vehicles,” Springer Int. Publ., 2025. [CrossRef]
- H. Vega-huerta et al., “Classification Model of Skin Cancer Using Convolutional Neural Network,” Ingénierie des Systèmes d ’ Inf., vol. 30, no. 2, pp. 387–394, 2025. [CrossRef]
- P. DelaCruz-VdV et al., “Diagnosis of Brain Tumors using a Convolutional Neural Network,” Smart Innov. Syst. Technol., vol. 366, p. Pages 45-56, 2023. [CrossRef]
- M. Zounemat-Kermani, O. Batelaan, M. Fadaee, and R. Hinkelmann, “Ensemble machine learning paradigms in hydrology: A review,” Journal of Hydrology, vol. 598. Elsevier B.V., 2021. [CrossRef]
- H. Tahraoui et al., “Advancing Water Quality Research: K-Nearest Neighbor Coupled with the Improved Grey Wolf Optimizer Algorithm Model Unveils New Possibilities for Dry Residue Prediction,” Water (Switzerland), vol. 15, no. 14, 2023. [CrossRef]
- Autoridad Nacional del Agua, “Metodología para la determinación del índice de calidad de agua Ica-PE, aplicado a los cuerpos de agua continentales superficiales.” pp. 1–55, 2018, [Online]. Available: https://repositorio.ana.gob.pe/handle/20.500.12543/2440.
- Gestión sostenible del agua, “Sustainable Water Management.” 2024, [Online]. Available: https://www.agry.purdue.edu/hydrology/projects/nexus-swm/es/Tools/WaterQualityCalculator.php.
- N. Nasir et al., “Water quality classification using machine learning algorithms,” J. Water Process Eng., vol. 48, 2022. [CrossRef]
- M. Huang, B. Q. Hu, H. Jiang, and B. W. Fang, “A water quality prediction method based on k-nearest-neighbor probability rough sets and PSO-LSTM,” Appl. Intell., vol. 53, no. 24, pp. 31106–31128, 2023. [CrossRef]
- M. Hamzaoui, M. O. E. Aoueileyine, and R. Bouallegue, “A Hybrid Method of K-Nearest Neighbors with Decision Tree for Water Quality Classification in Aquaculture,” in Communications in Computer and Information Science, 2023, vol. 1864 CCIS, pp. 287–299. [CrossRef]
- C. Janiesch, P. Zschech, and K. Heinrich, “Machine learning and deep learning,” Electron. Mark., vol. 31, no. 3, 2021. [CrossRef]
- P. Linardatos, V. Papastefanopoulos, and S. Kotsiantis, “Explainable ai: A review of machine learning interpretability methods,” Entropy, vol. 23, no. 1. 2021. [CrossRef]
- L. Savitri and R. Nursalim, “Klasifikasi Kualitas Air Minum menggunakan Penerapan Algoritma Machine Learning dengan Pendekatan Supervised Learning,” Diophantine J. Math. Its Appl., vol. 2, no. 01, pp. 30–36, 2023. [CrossRef]
- J. Fernández-Hernández, P. Herranz-Hernández, and L. Segovia-Torres, “Validación cruzada sobre una misma muestra: Una práctica sin fundamento,” R.E.M.A. Rev. Electrónica Metodol. Apl., vol. 24, no. 1, 2022. [CrossRef]
- L. López Lozano, I. Palazón Bru, A. Palazón Bru, M. Arroyo Fernández, and M. González-Estecha, “Procedimiento de validación de un método para cuantificar cobalto en suero por espectroscopia de absorción atómica con atomización electrotérmica,” Rev. del Lab. Clin., vol. 8, no. 1, pp. 46–51, 2015. [CrossRef]
- B. Ainapure, N. Baheti, J. Buch, B. Appasani, A. V Jha, and A. Srinivasulu, “Drinking water potability prediction using machine learning approaches: A case study of Indian rivers,” Water Pract. Technol., vol. 18, no. 12, pp. 3004–3020, 2023. [CrossRef]
- P. Chen, “Unlocking policy effects: Water resources management plans and urban water pollution,” J. Environ. Manage., vol. 365, p. 121642, 2024. [CrossRef]
- Autoridad Nacional del Agua, “Monetoreo_de_parametros_cuenca_Huarmey_2023,” 2023.
- M. Y. Shams, A. M. Elshewey, E. S. M. El-kenawy, A. Ibrahim, F. M. Talaat, and Z. Tarek, “Water quality prediction using machine learning models based on grid search method,” Multimed. Tools Appl., vol. 83, no. 12, 2024. [CrossRef]
- M. G. Uddin, S. Nash, A. Rahman, and A. I. Olbert, “Performance analysis of the water quality index model for predicting water state using machine learning techniques,” Process Saf. Environ. Prot., vol. 169, pp. 808–828, 2023. [CrossRef]
- J. Seyedmohammadi, A. Zeinadini, M. N. Navidi, and R. W. McDowell, “A new robust hybrid model based on support vector machine and firefly meta-heuristic algorithm to predict pistachio yields and select effective soil variables,” Ecol. Inform., vol. 74, 2023. [CrossRef]
- M. N. Kanyama, F. B. Shava, A. M. Gamundani, and A. Hartmann, “Machine learning applications for anomaly detection in Smart Water Metering Networks: A systematic review,” Phys. Chem. Earth, vol. 134, 2024. [CrossRef]
- H. A. Saddiqi, Z. Javed, Q. M. Ali, A. Ullah, and I. Ahmad, “Modelling and predicting lift force and trans-membrane pressure using linear, KNN, ANN and response surface models during the separation of oil drops from produced water,” J. Water Process Eng., vol. 66, p. 106014, 2024. [CrossRef]
Figure 1.
Current process for classifying water quality using the WQI using Excel macro techniques.
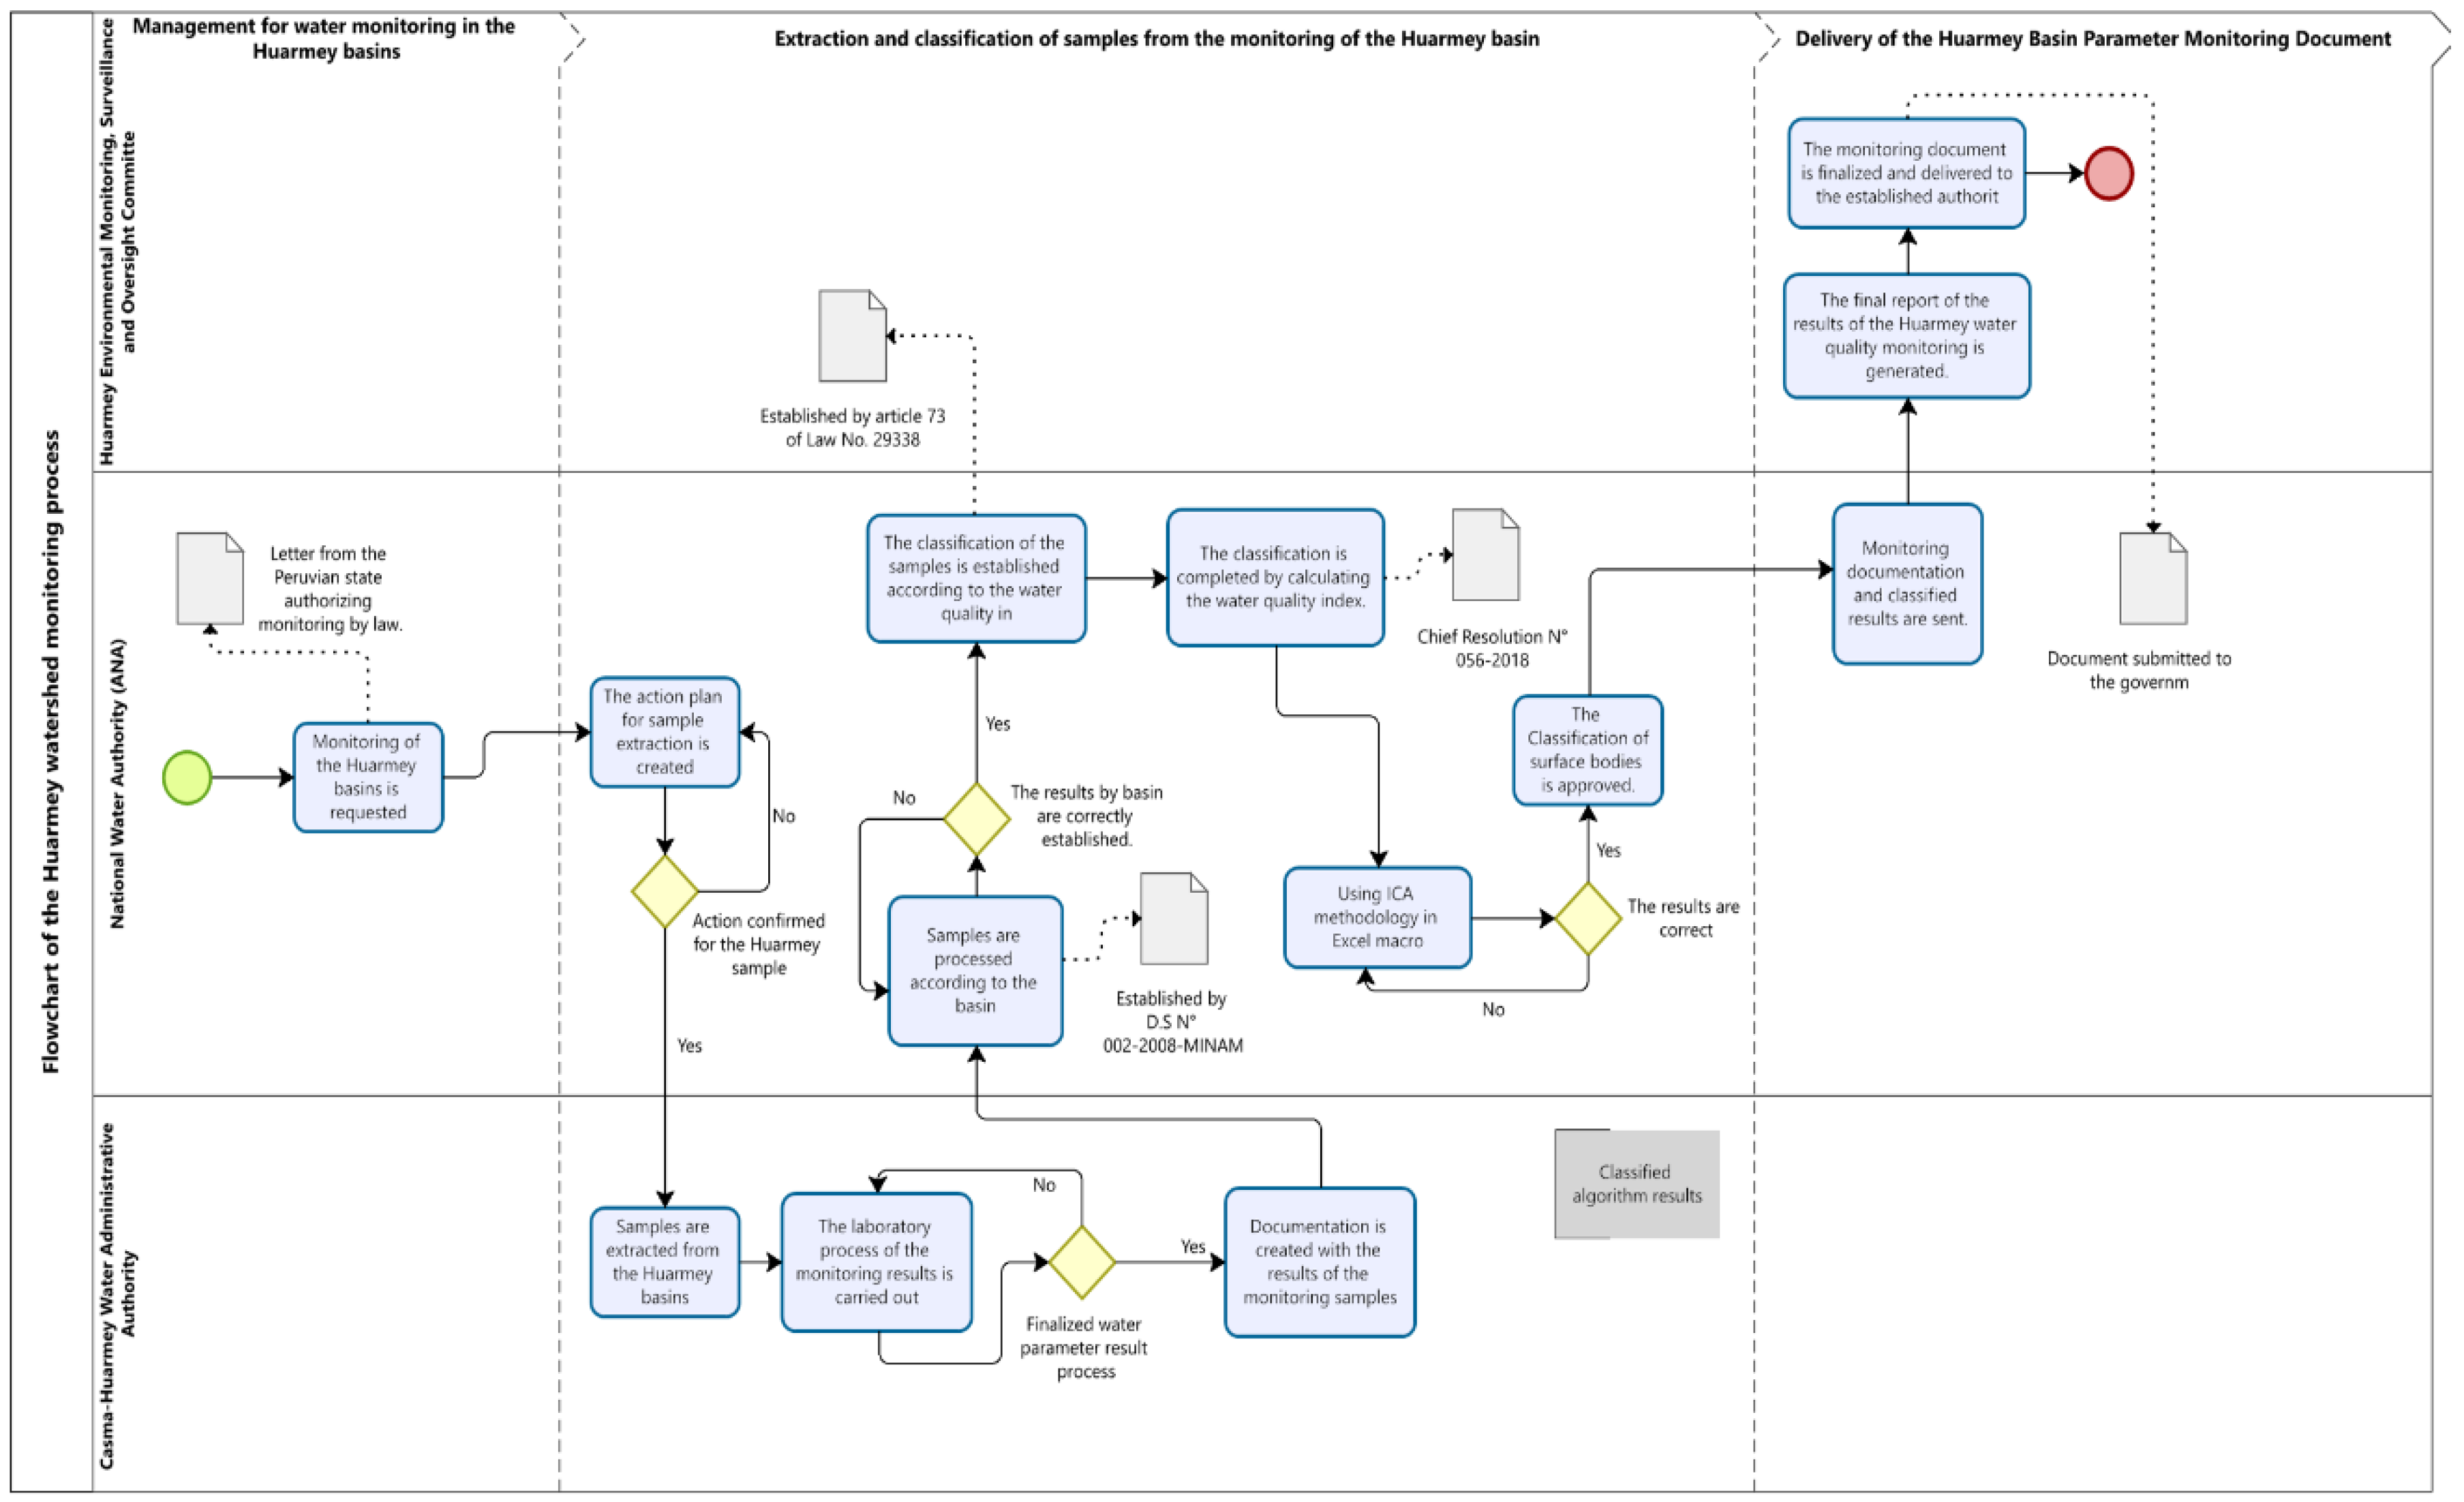
Figure 2.
Proposed Final Process for Water Quality Classification using the WQI and the KNN.
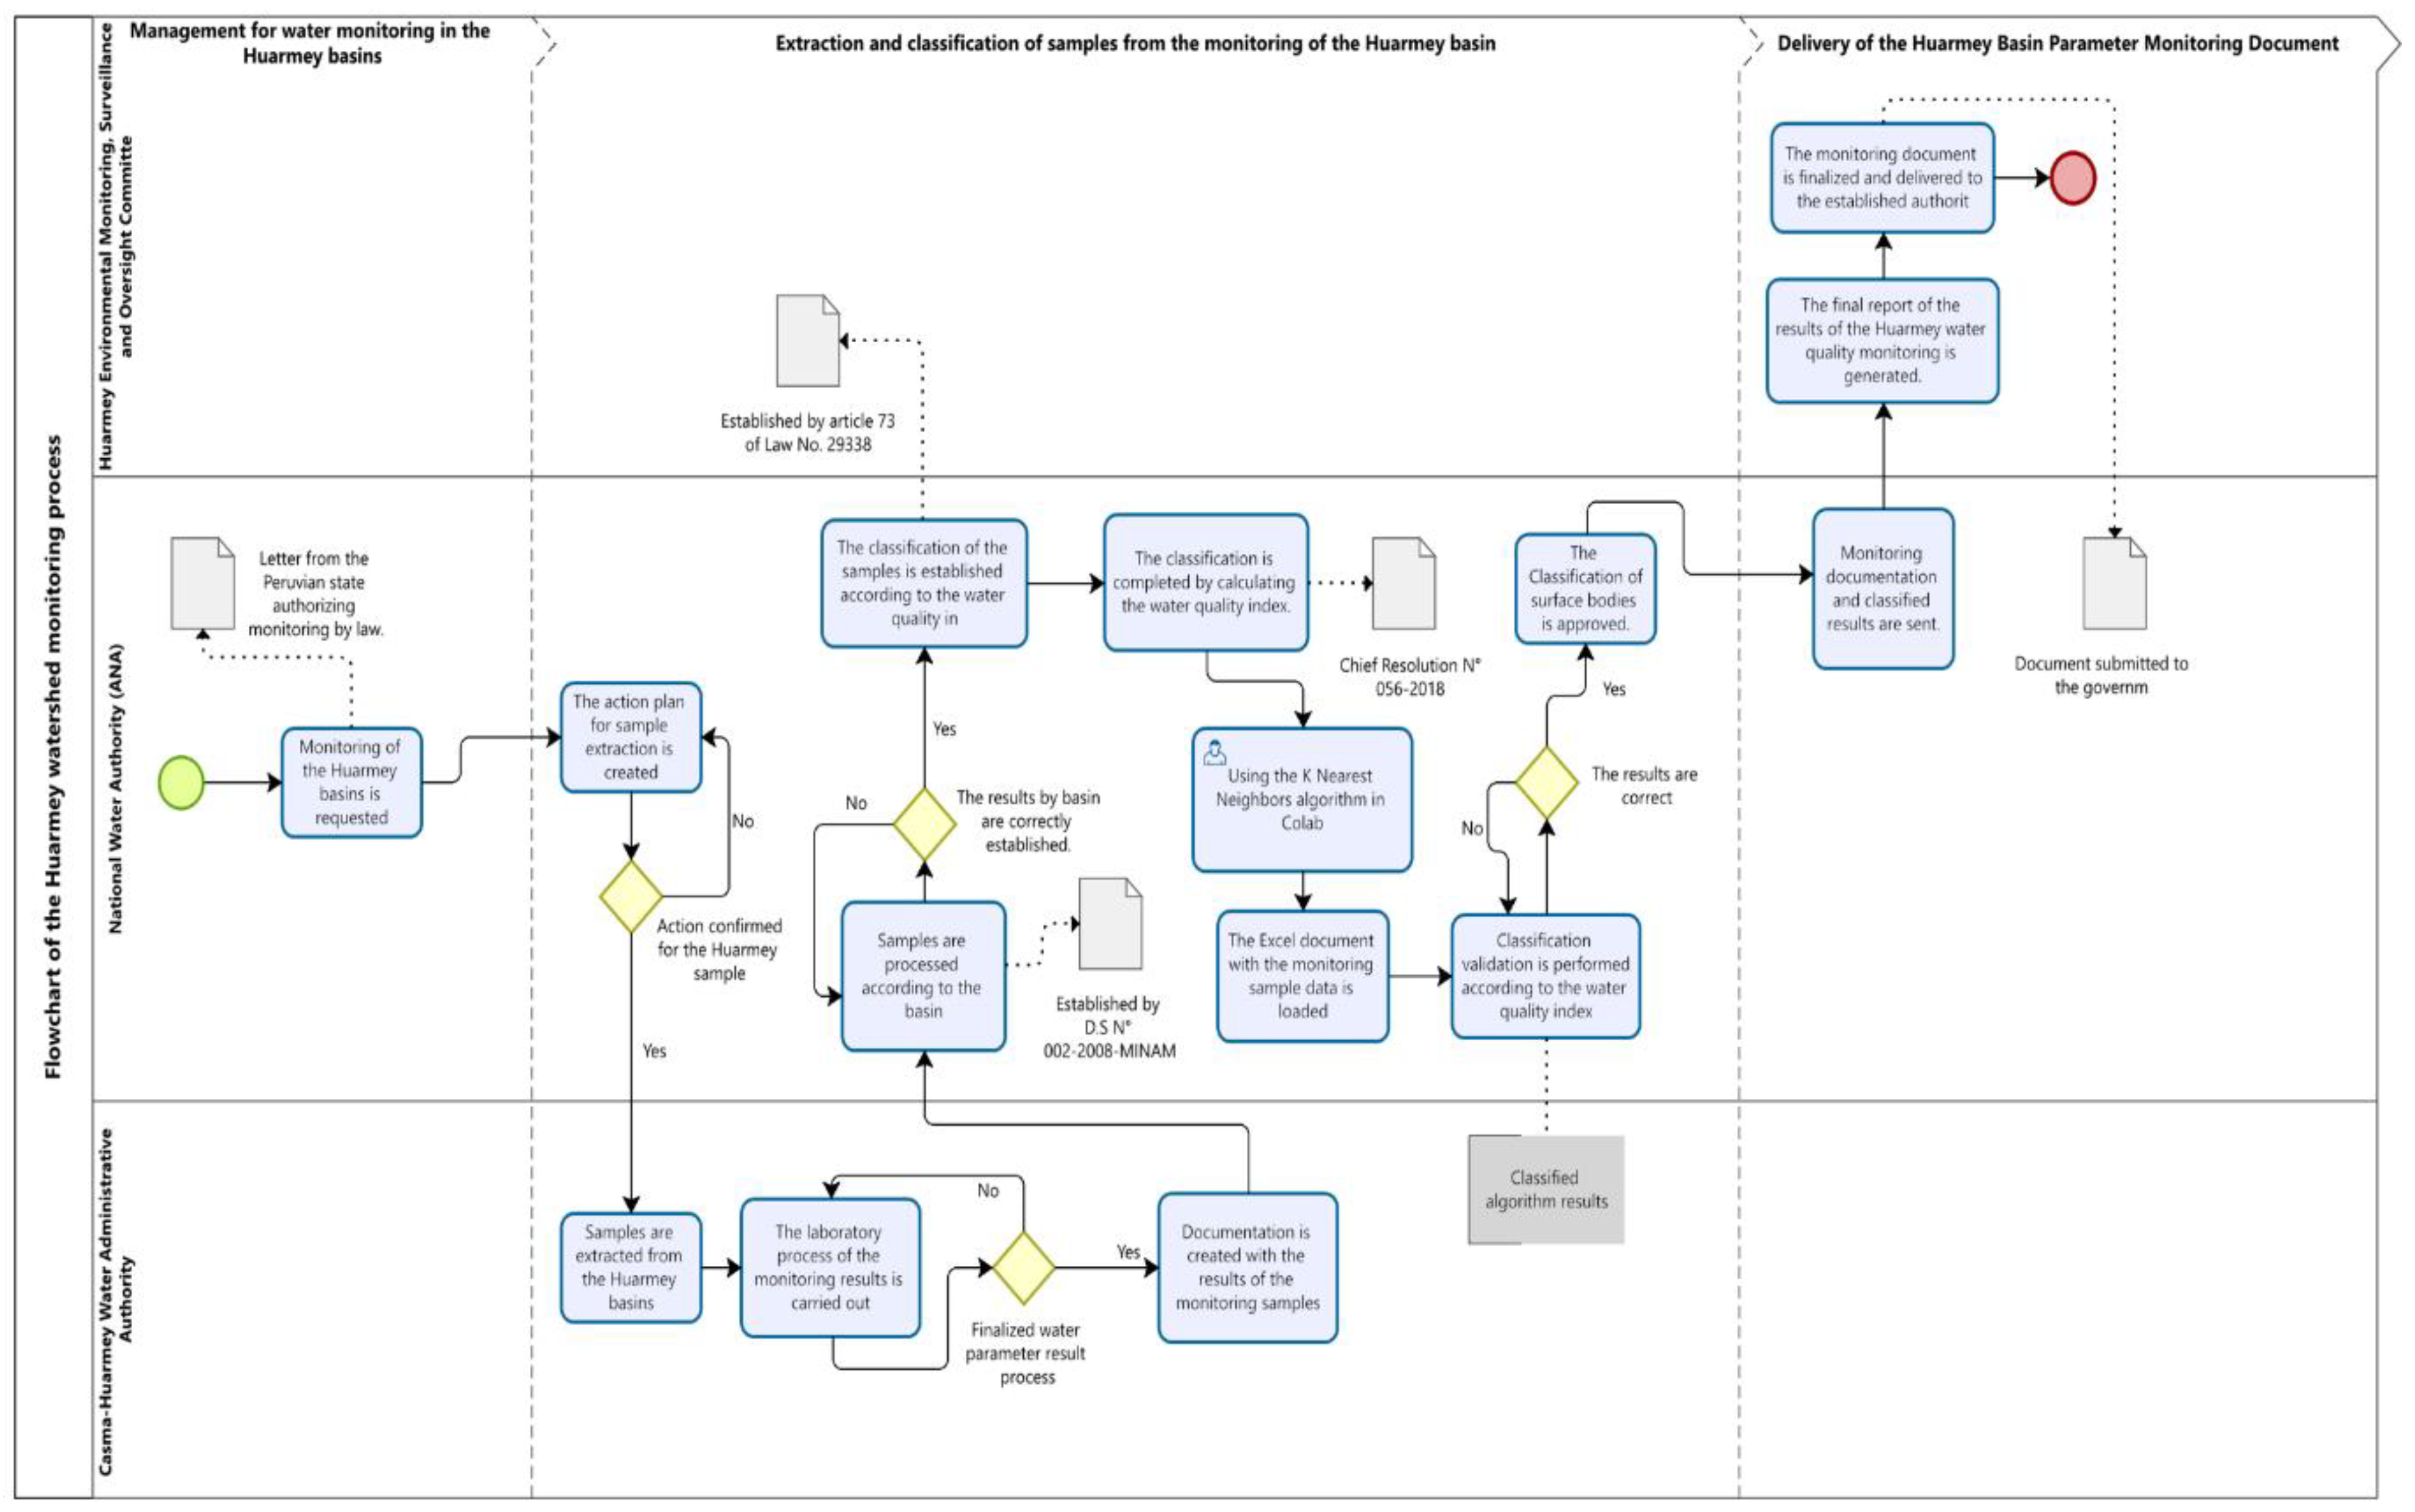
Figure 3.
Flowchart of the preprocessing process from raw data to clean and structured input for the KNN model.
Figure 3.
Flowchart of the preprocessing process from raw data to clean and structured input for the KNN model.
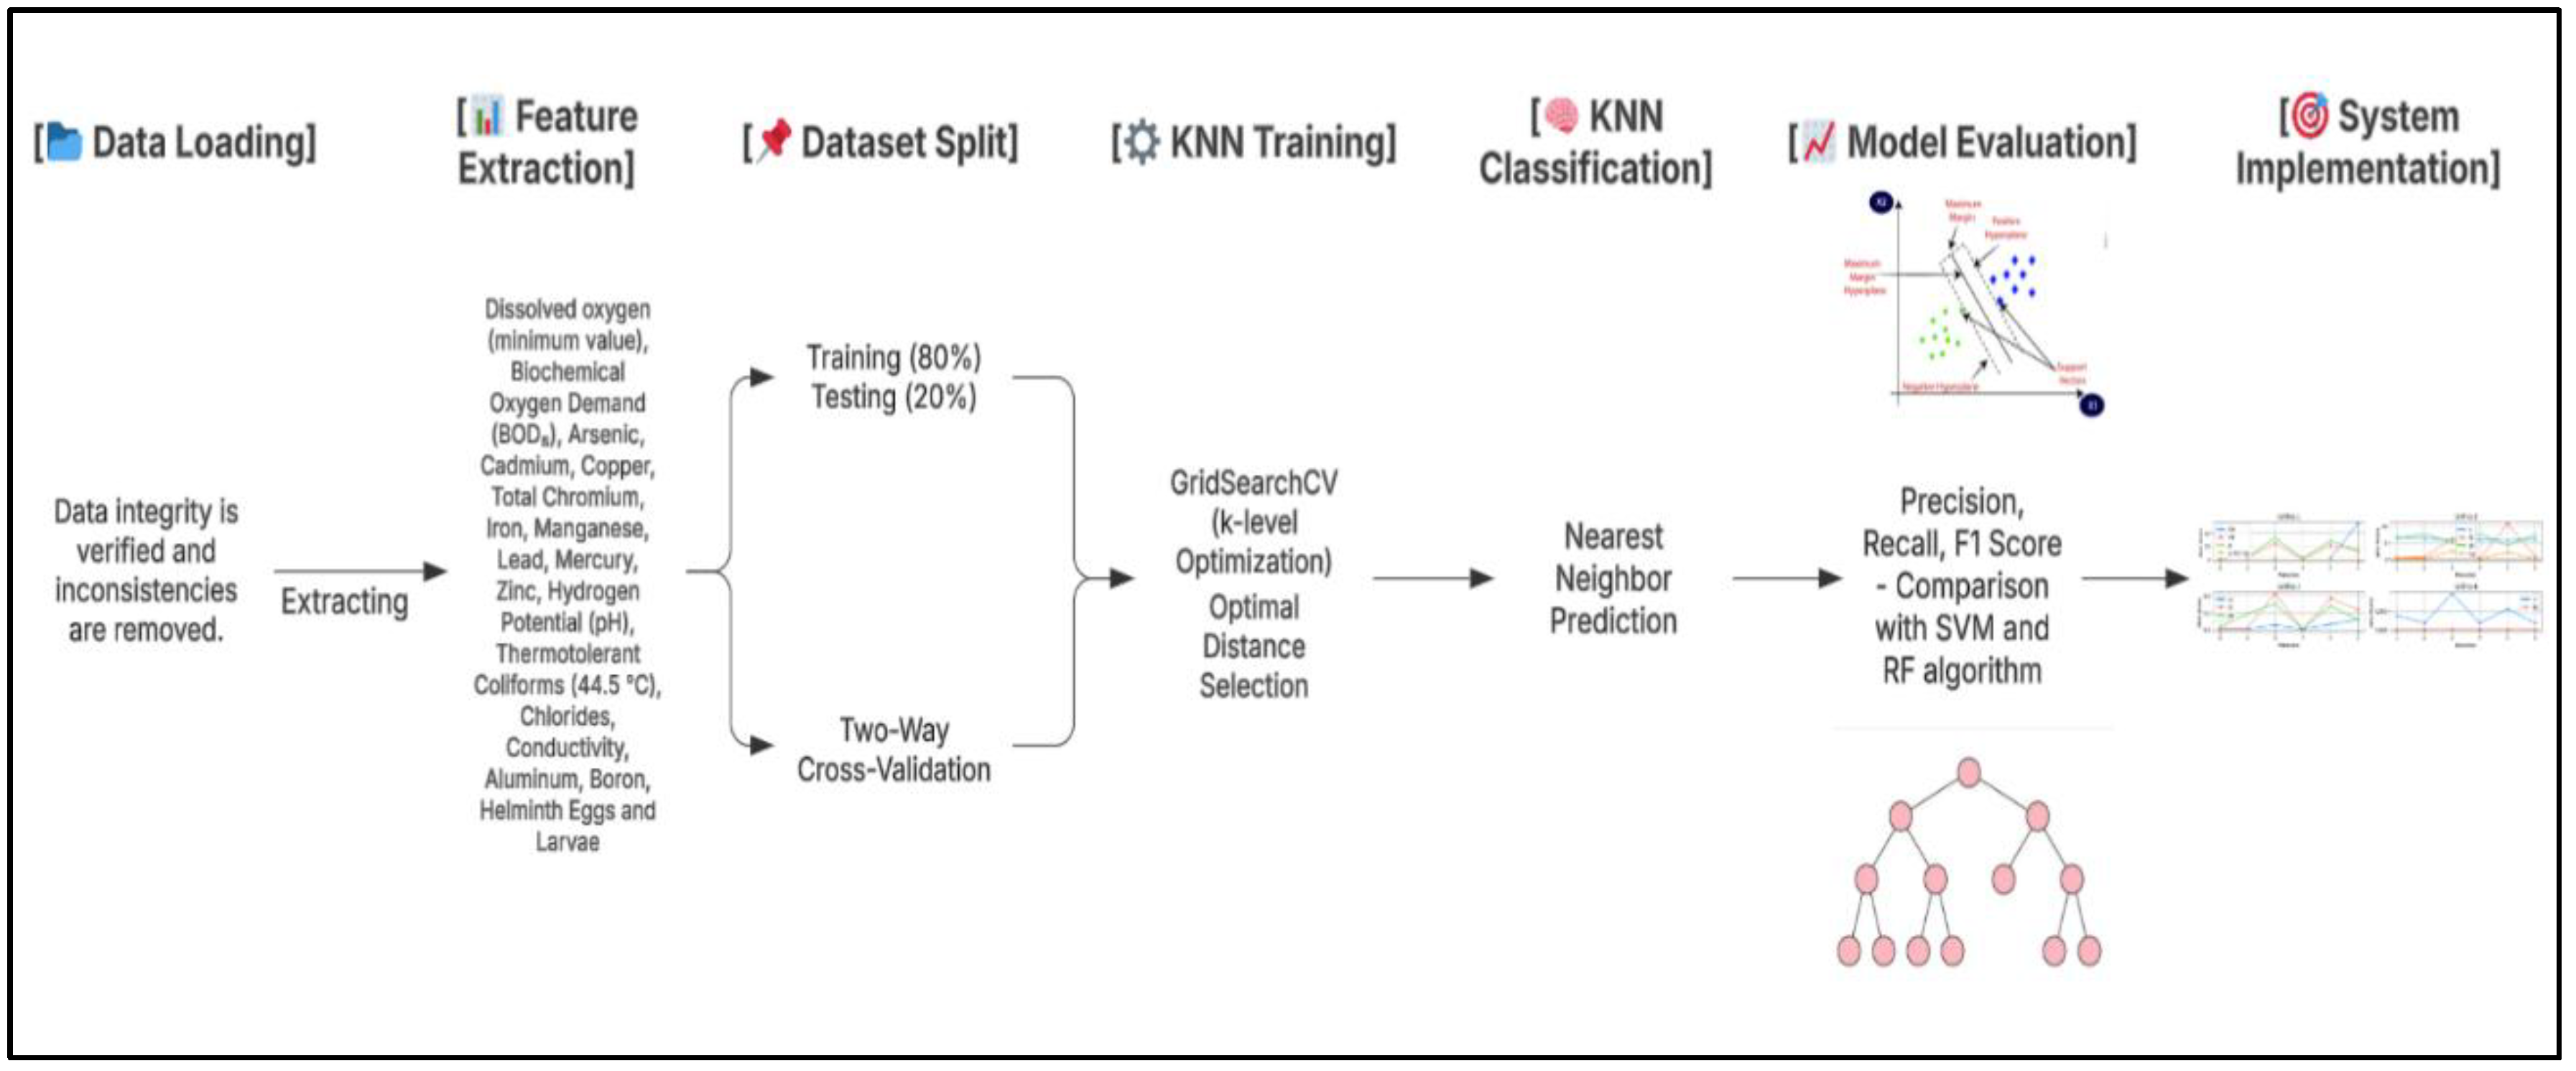
Figure 4.
Results obtained from training the KNN algorithm in Google Colab.
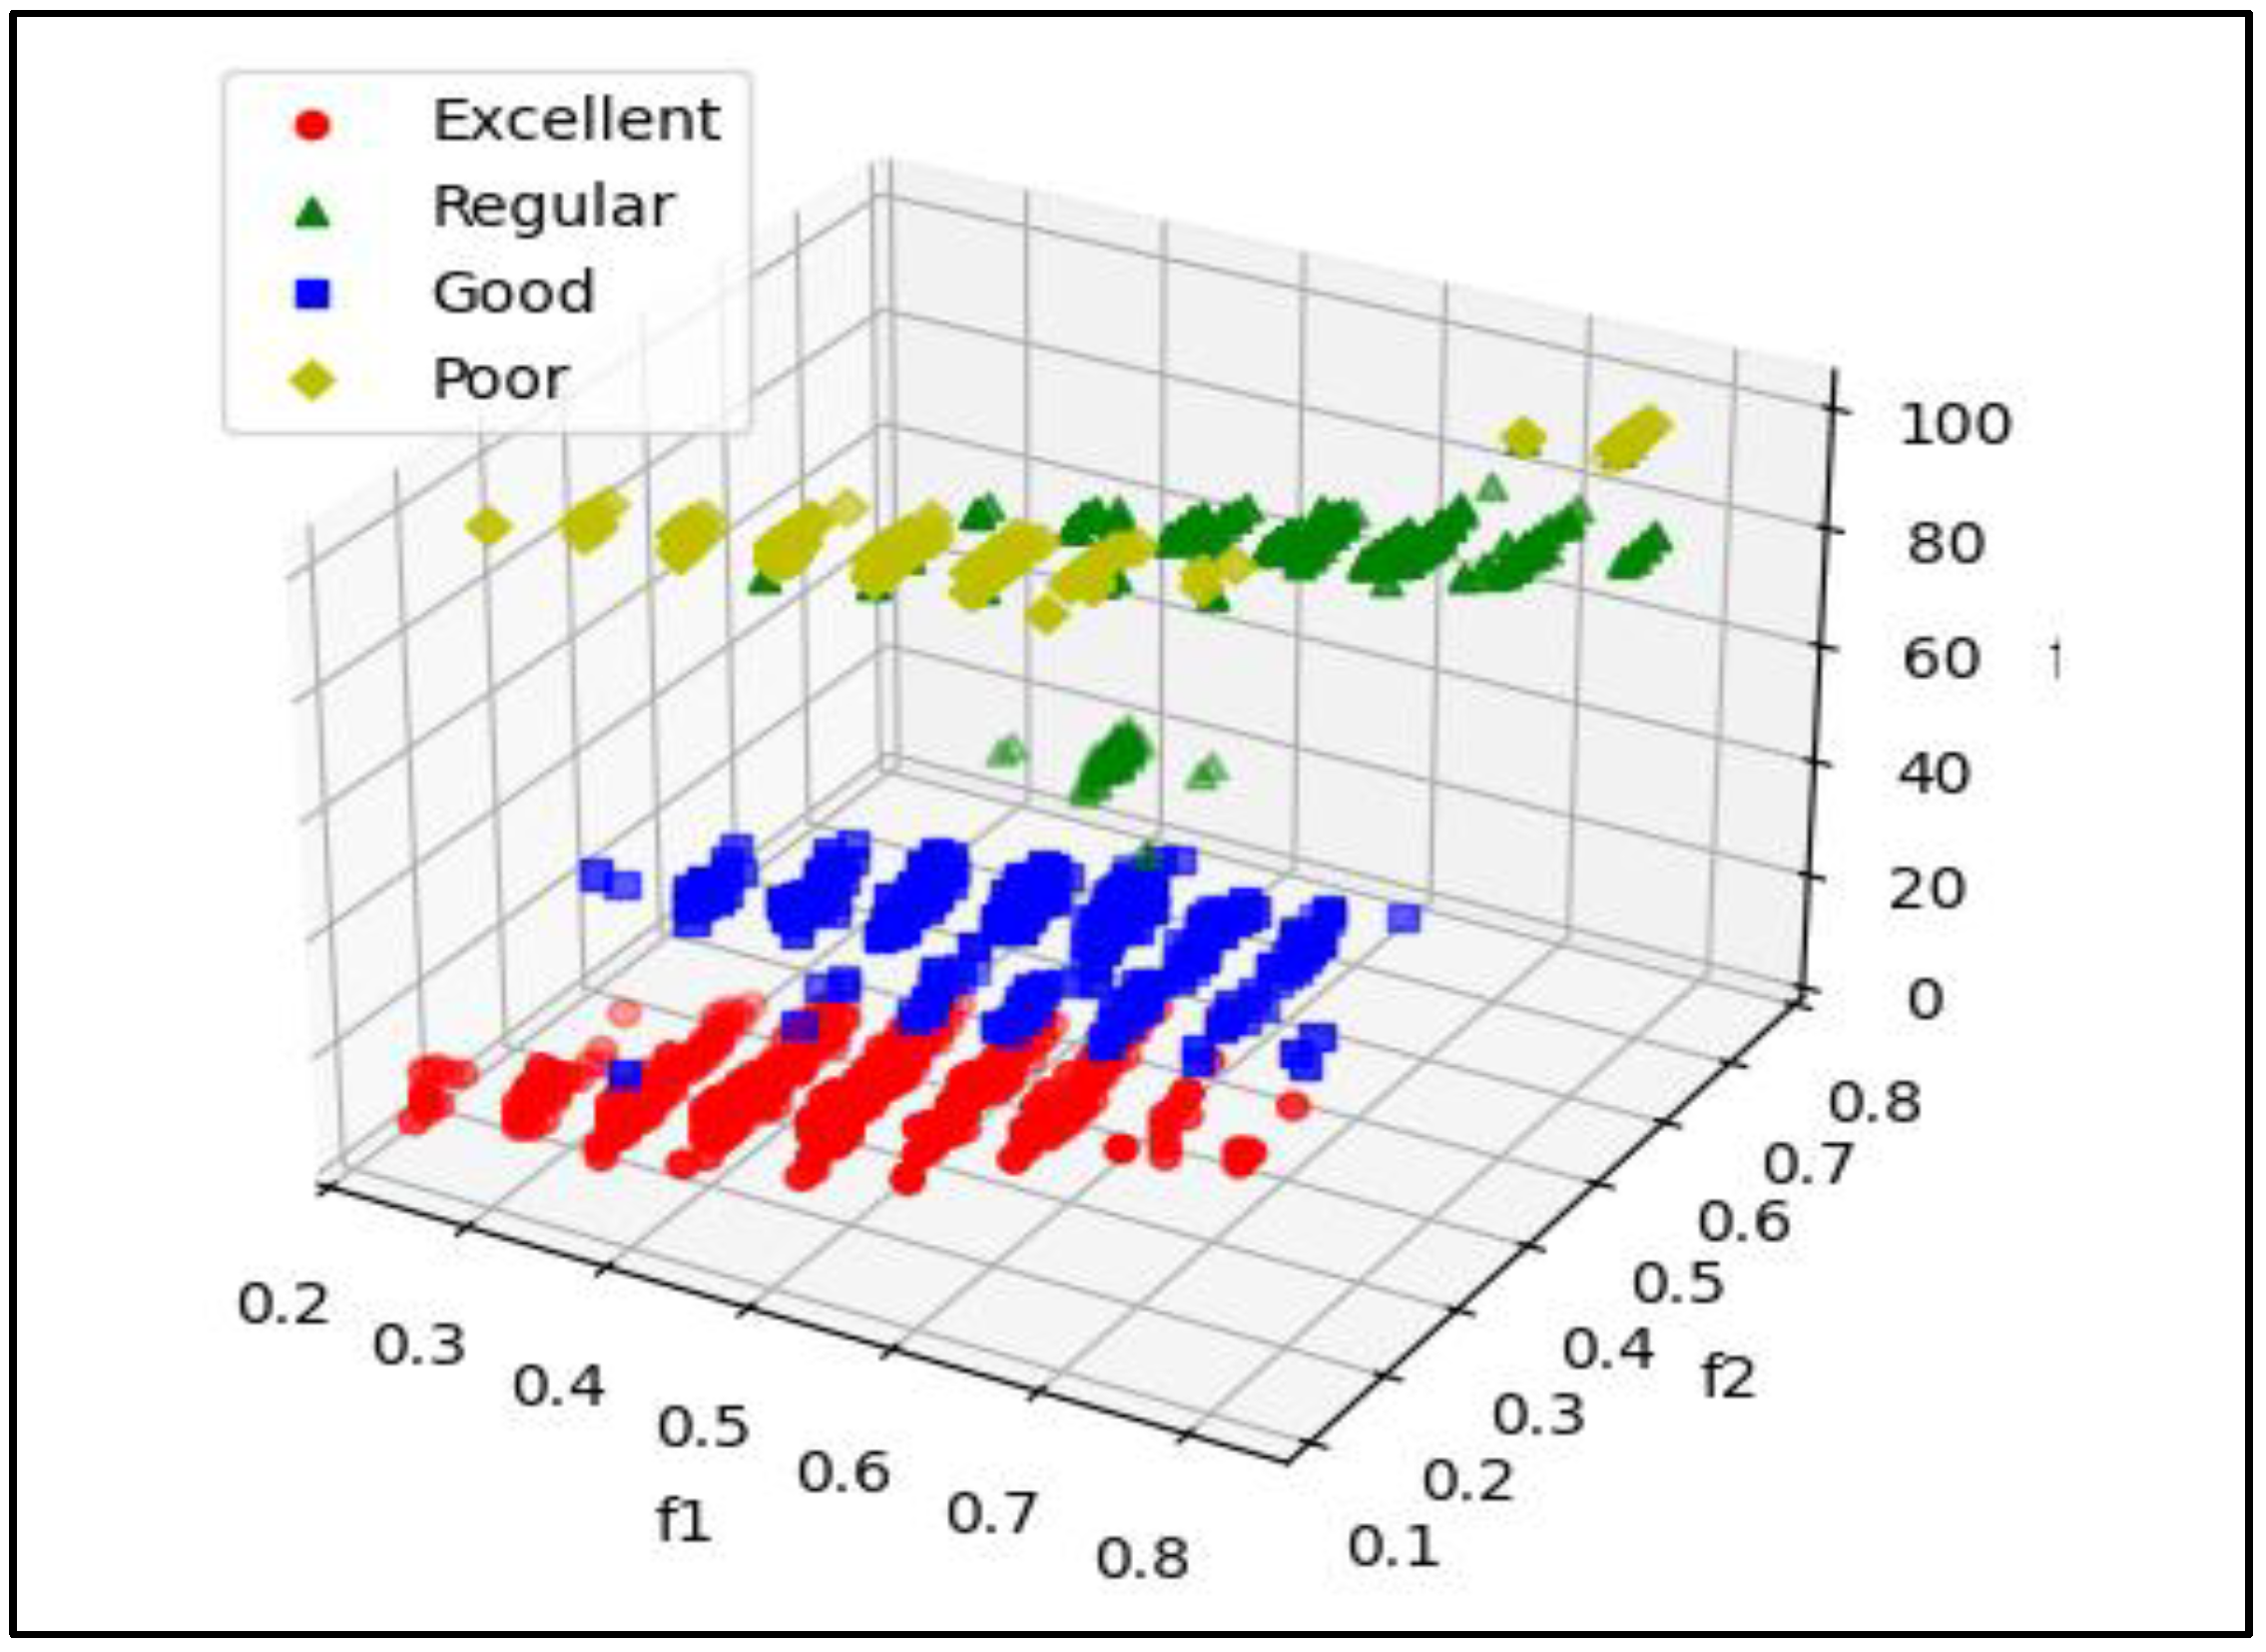
Figure 5.
Training structure of classification models for WQI assessment.
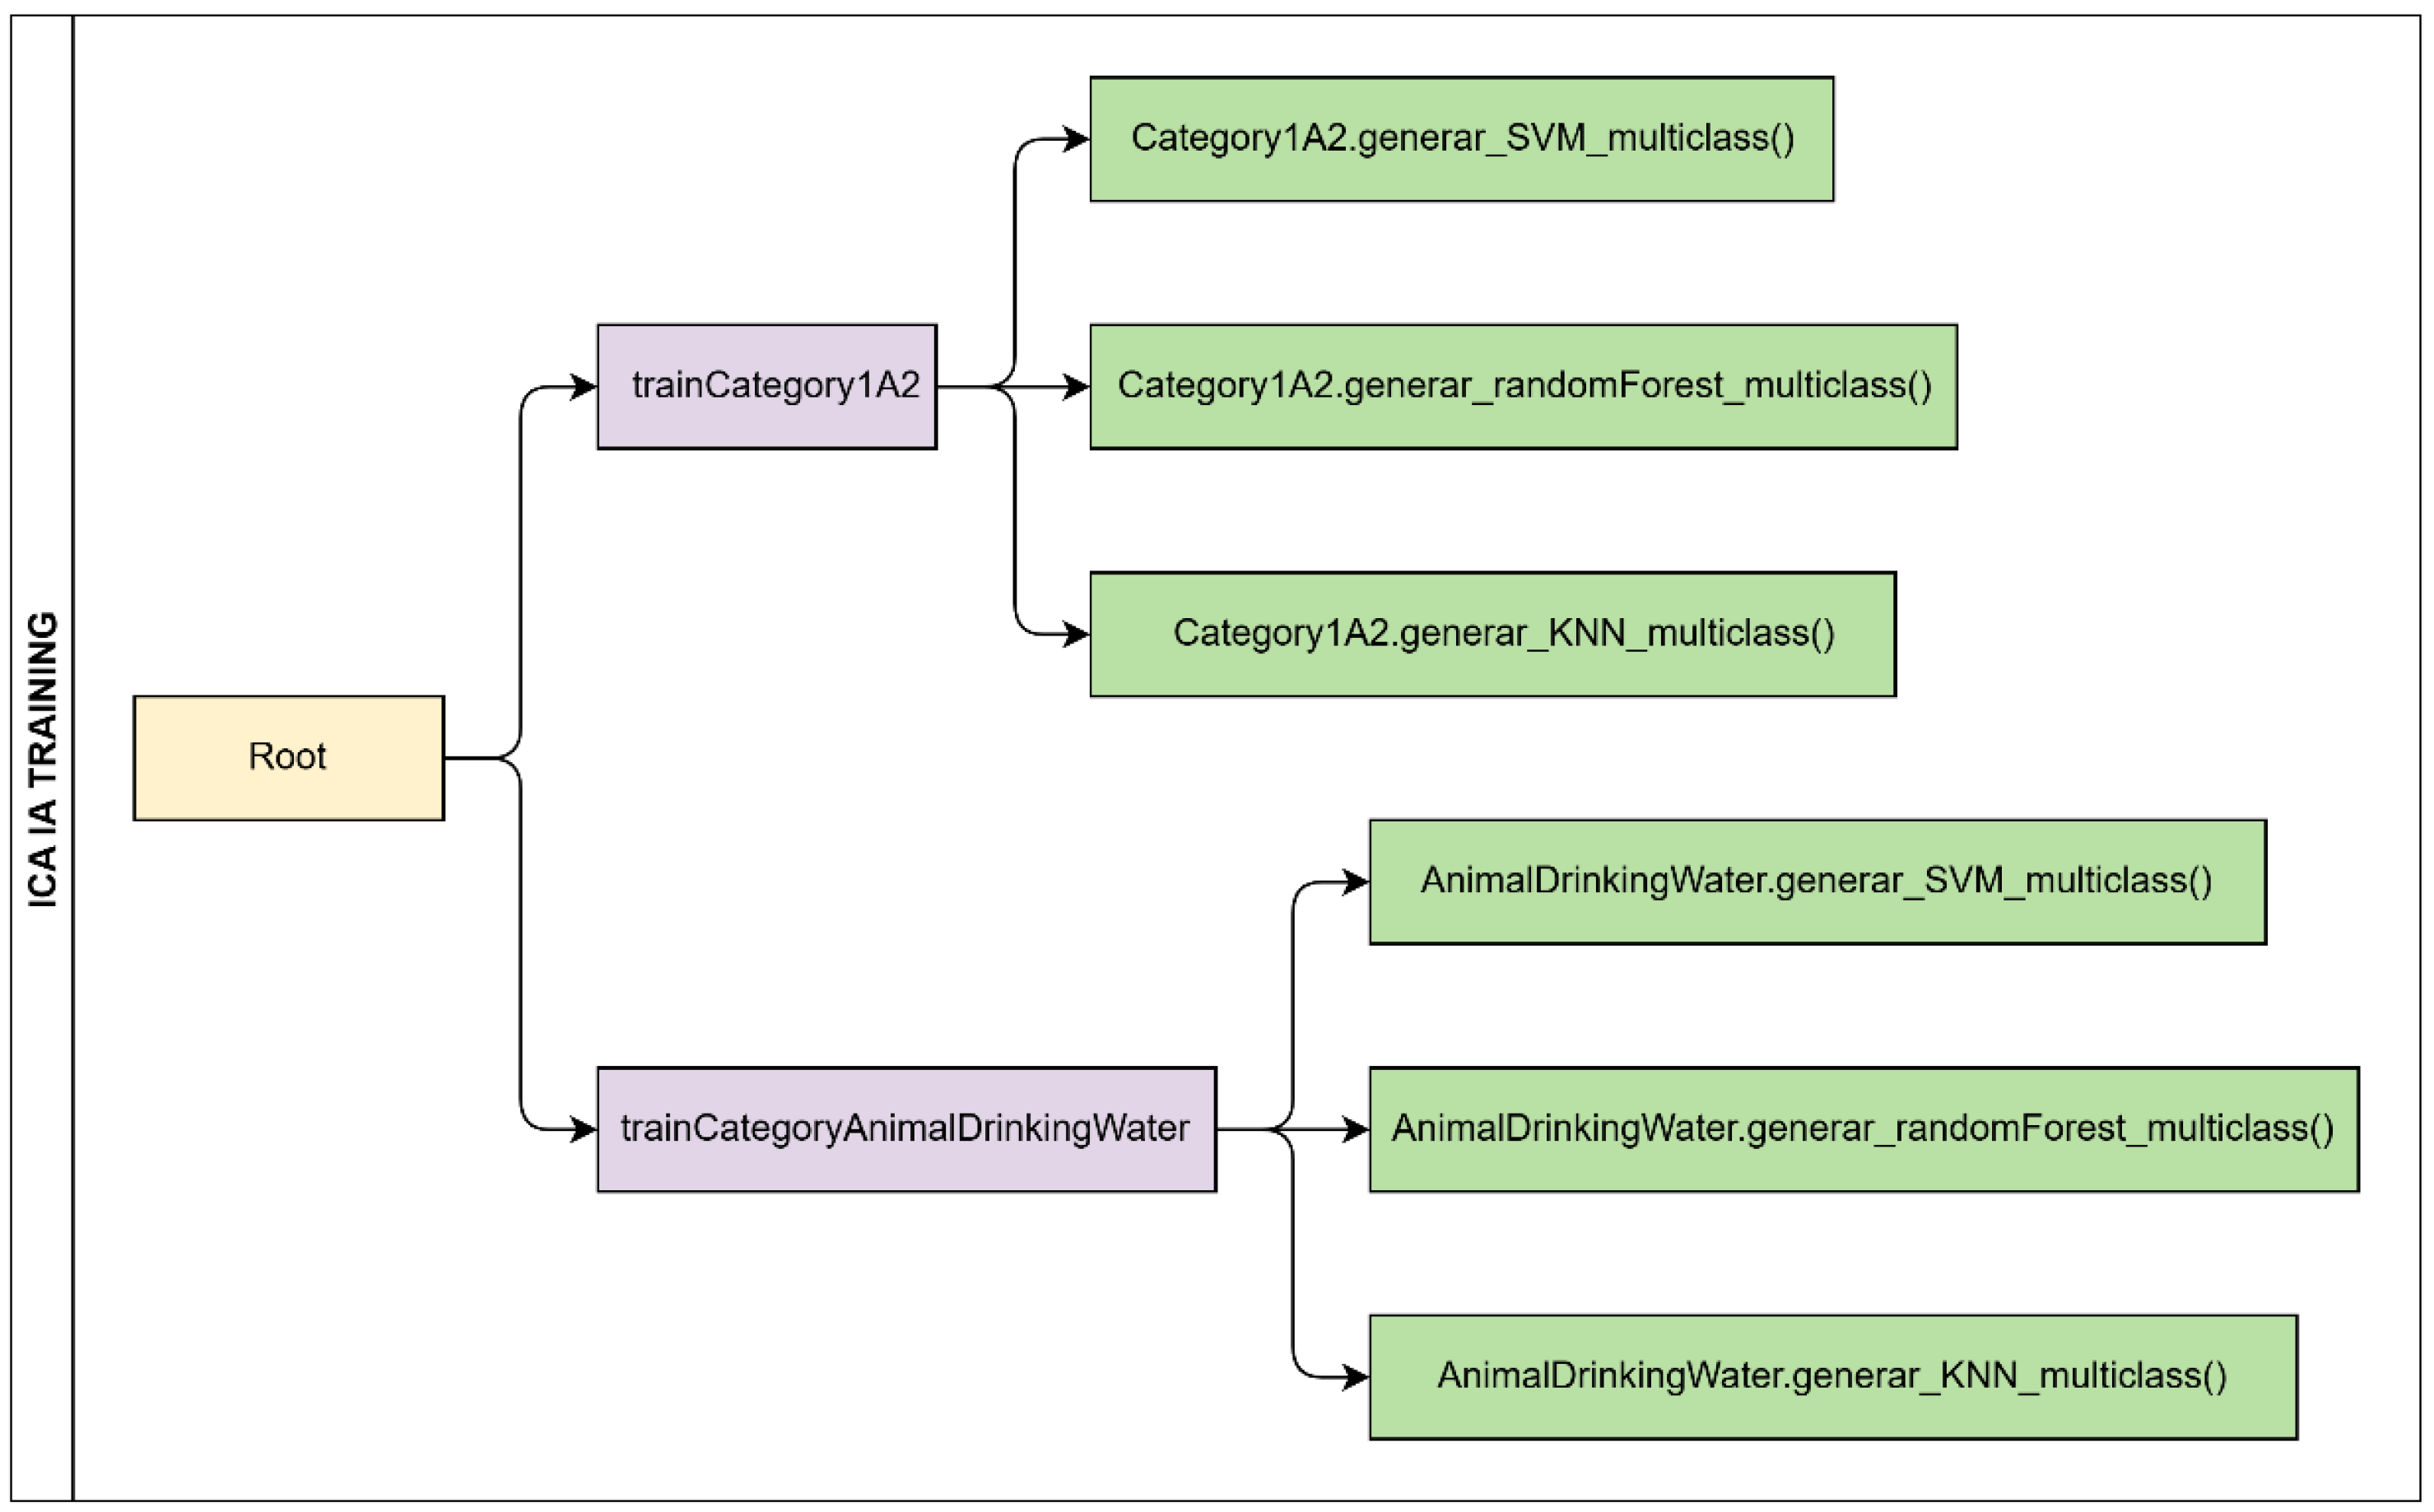
Figure 6.
Positive Performance of KNN Model for Water Quality Prediction.
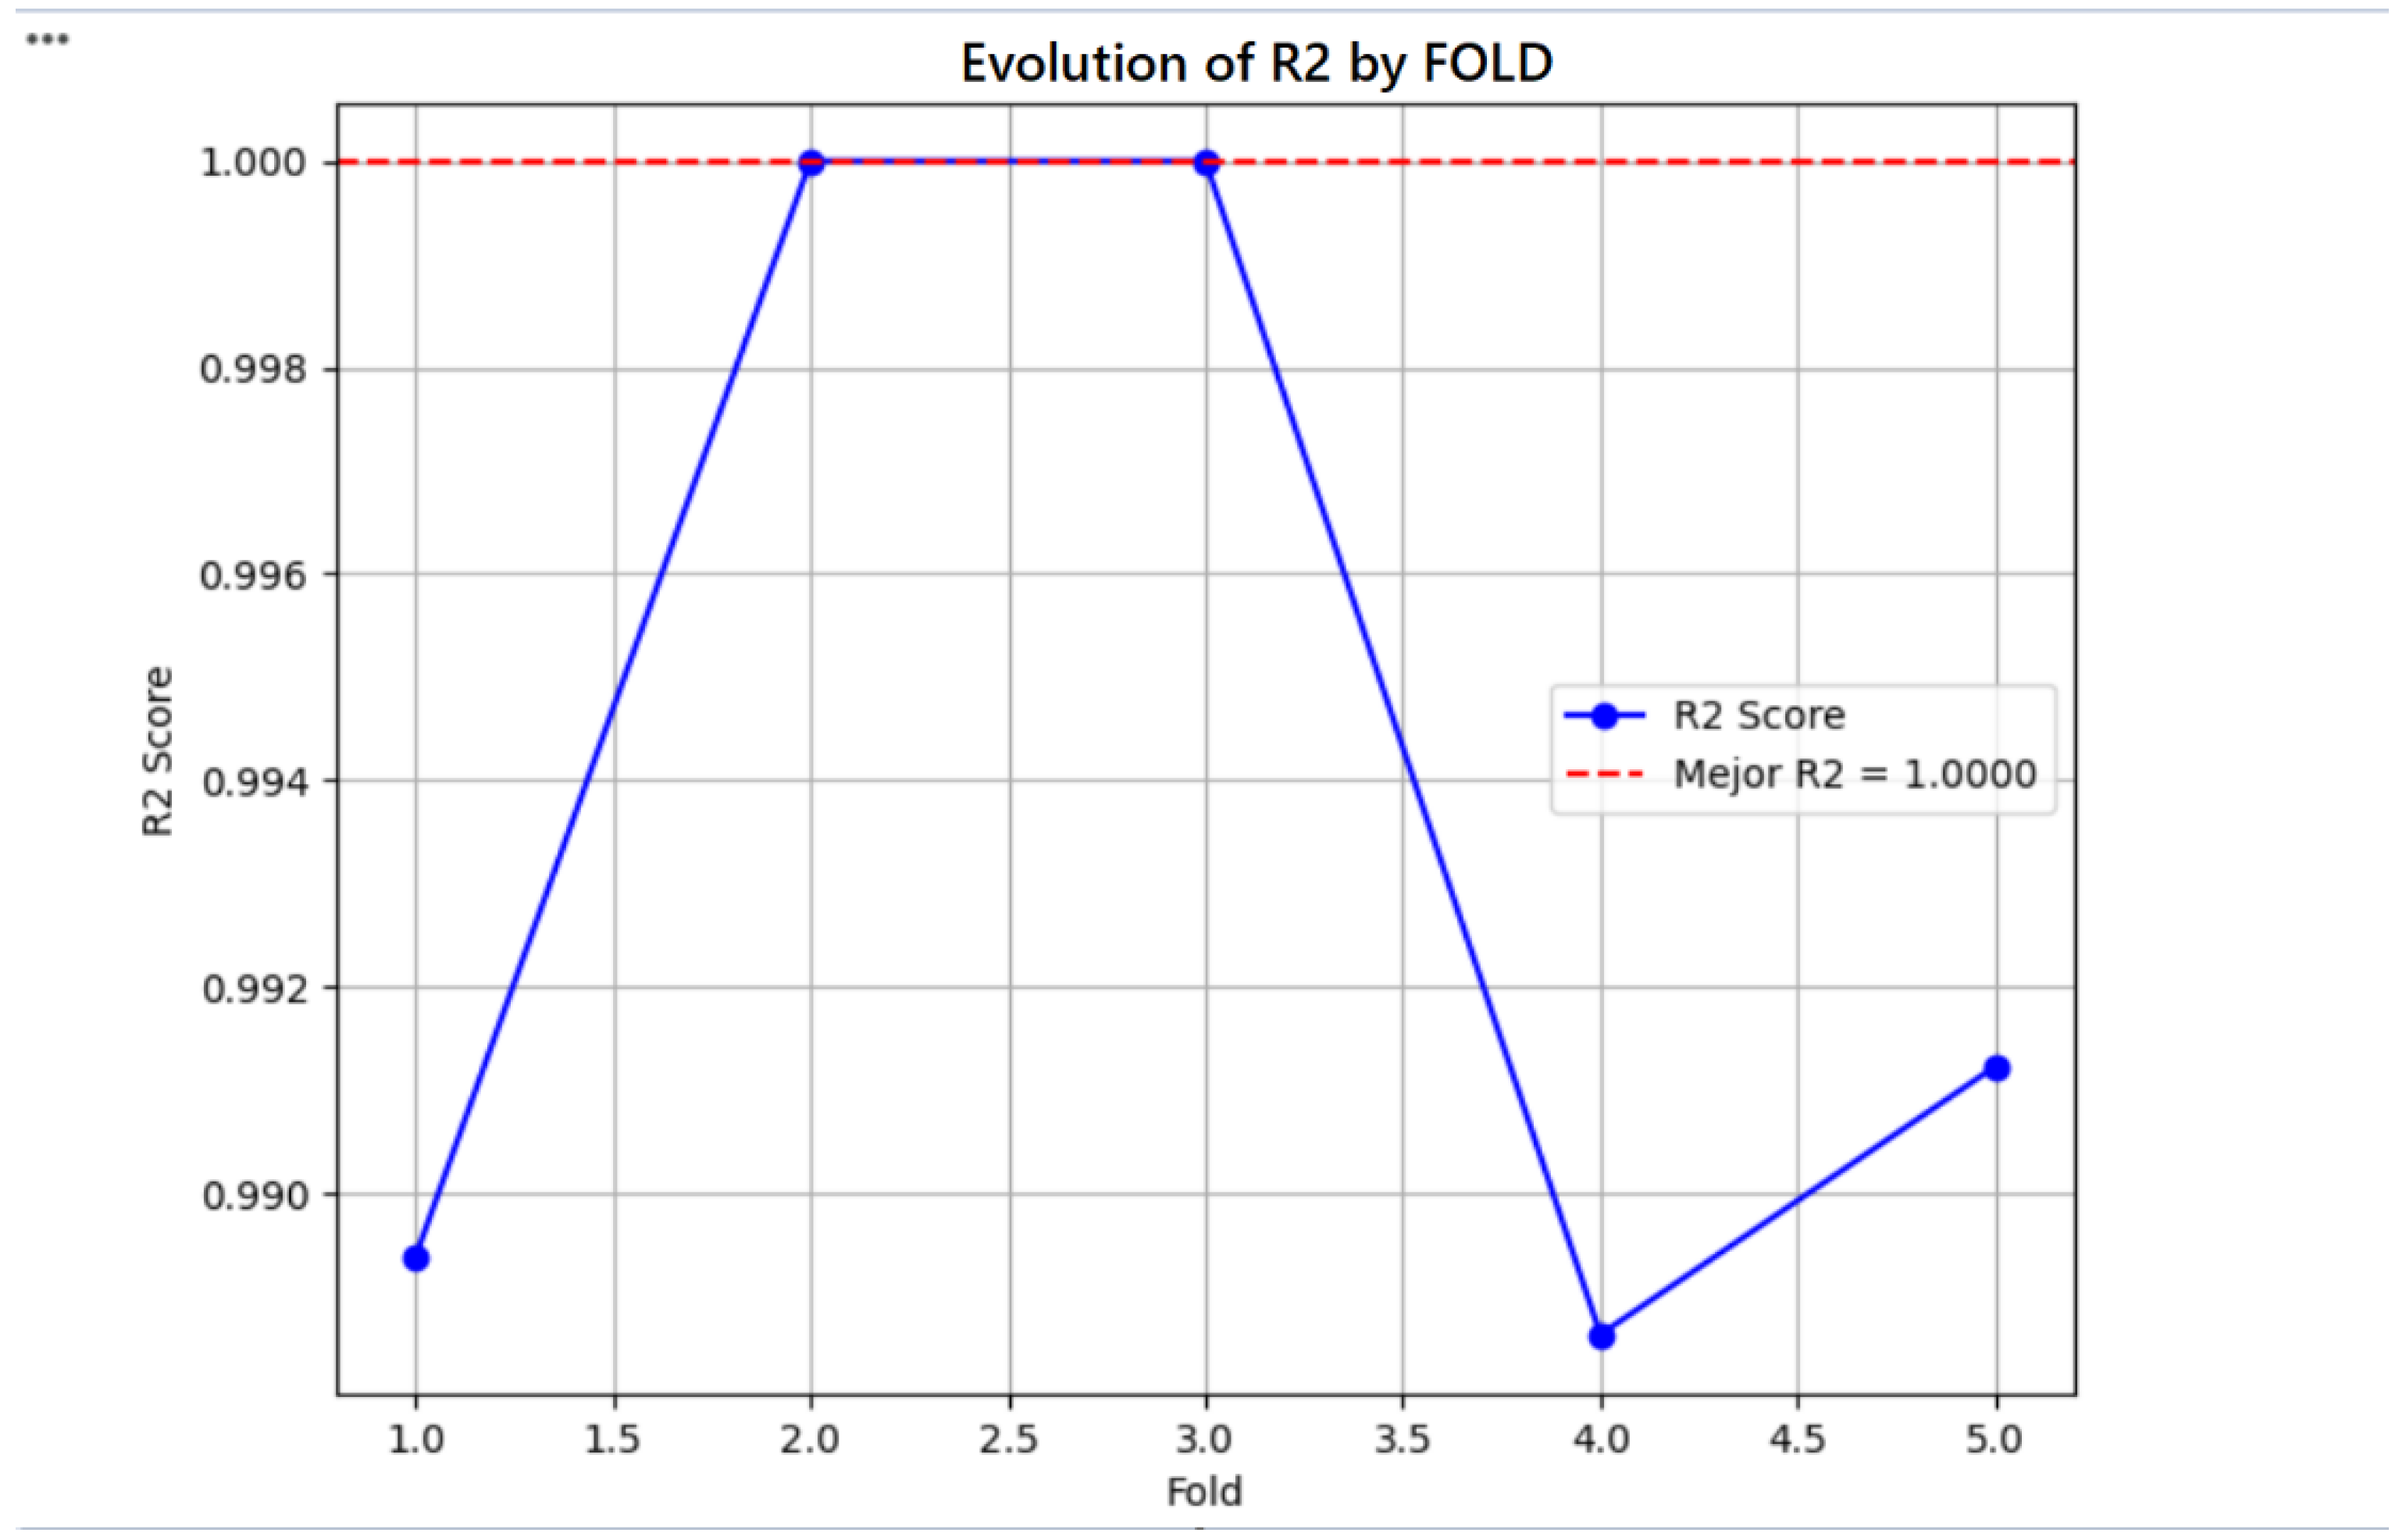
Figure 7.
Results of the classification of the KNN algorithm in the 2021 physicochemical parameter data for category 3 of animal drink from the Huarmey basins.
Figure 7.
Results of the classification of the KNN algorithm in the 2021 physicochemical parameter data for category 3 of animal drink from the Huarmey basins.
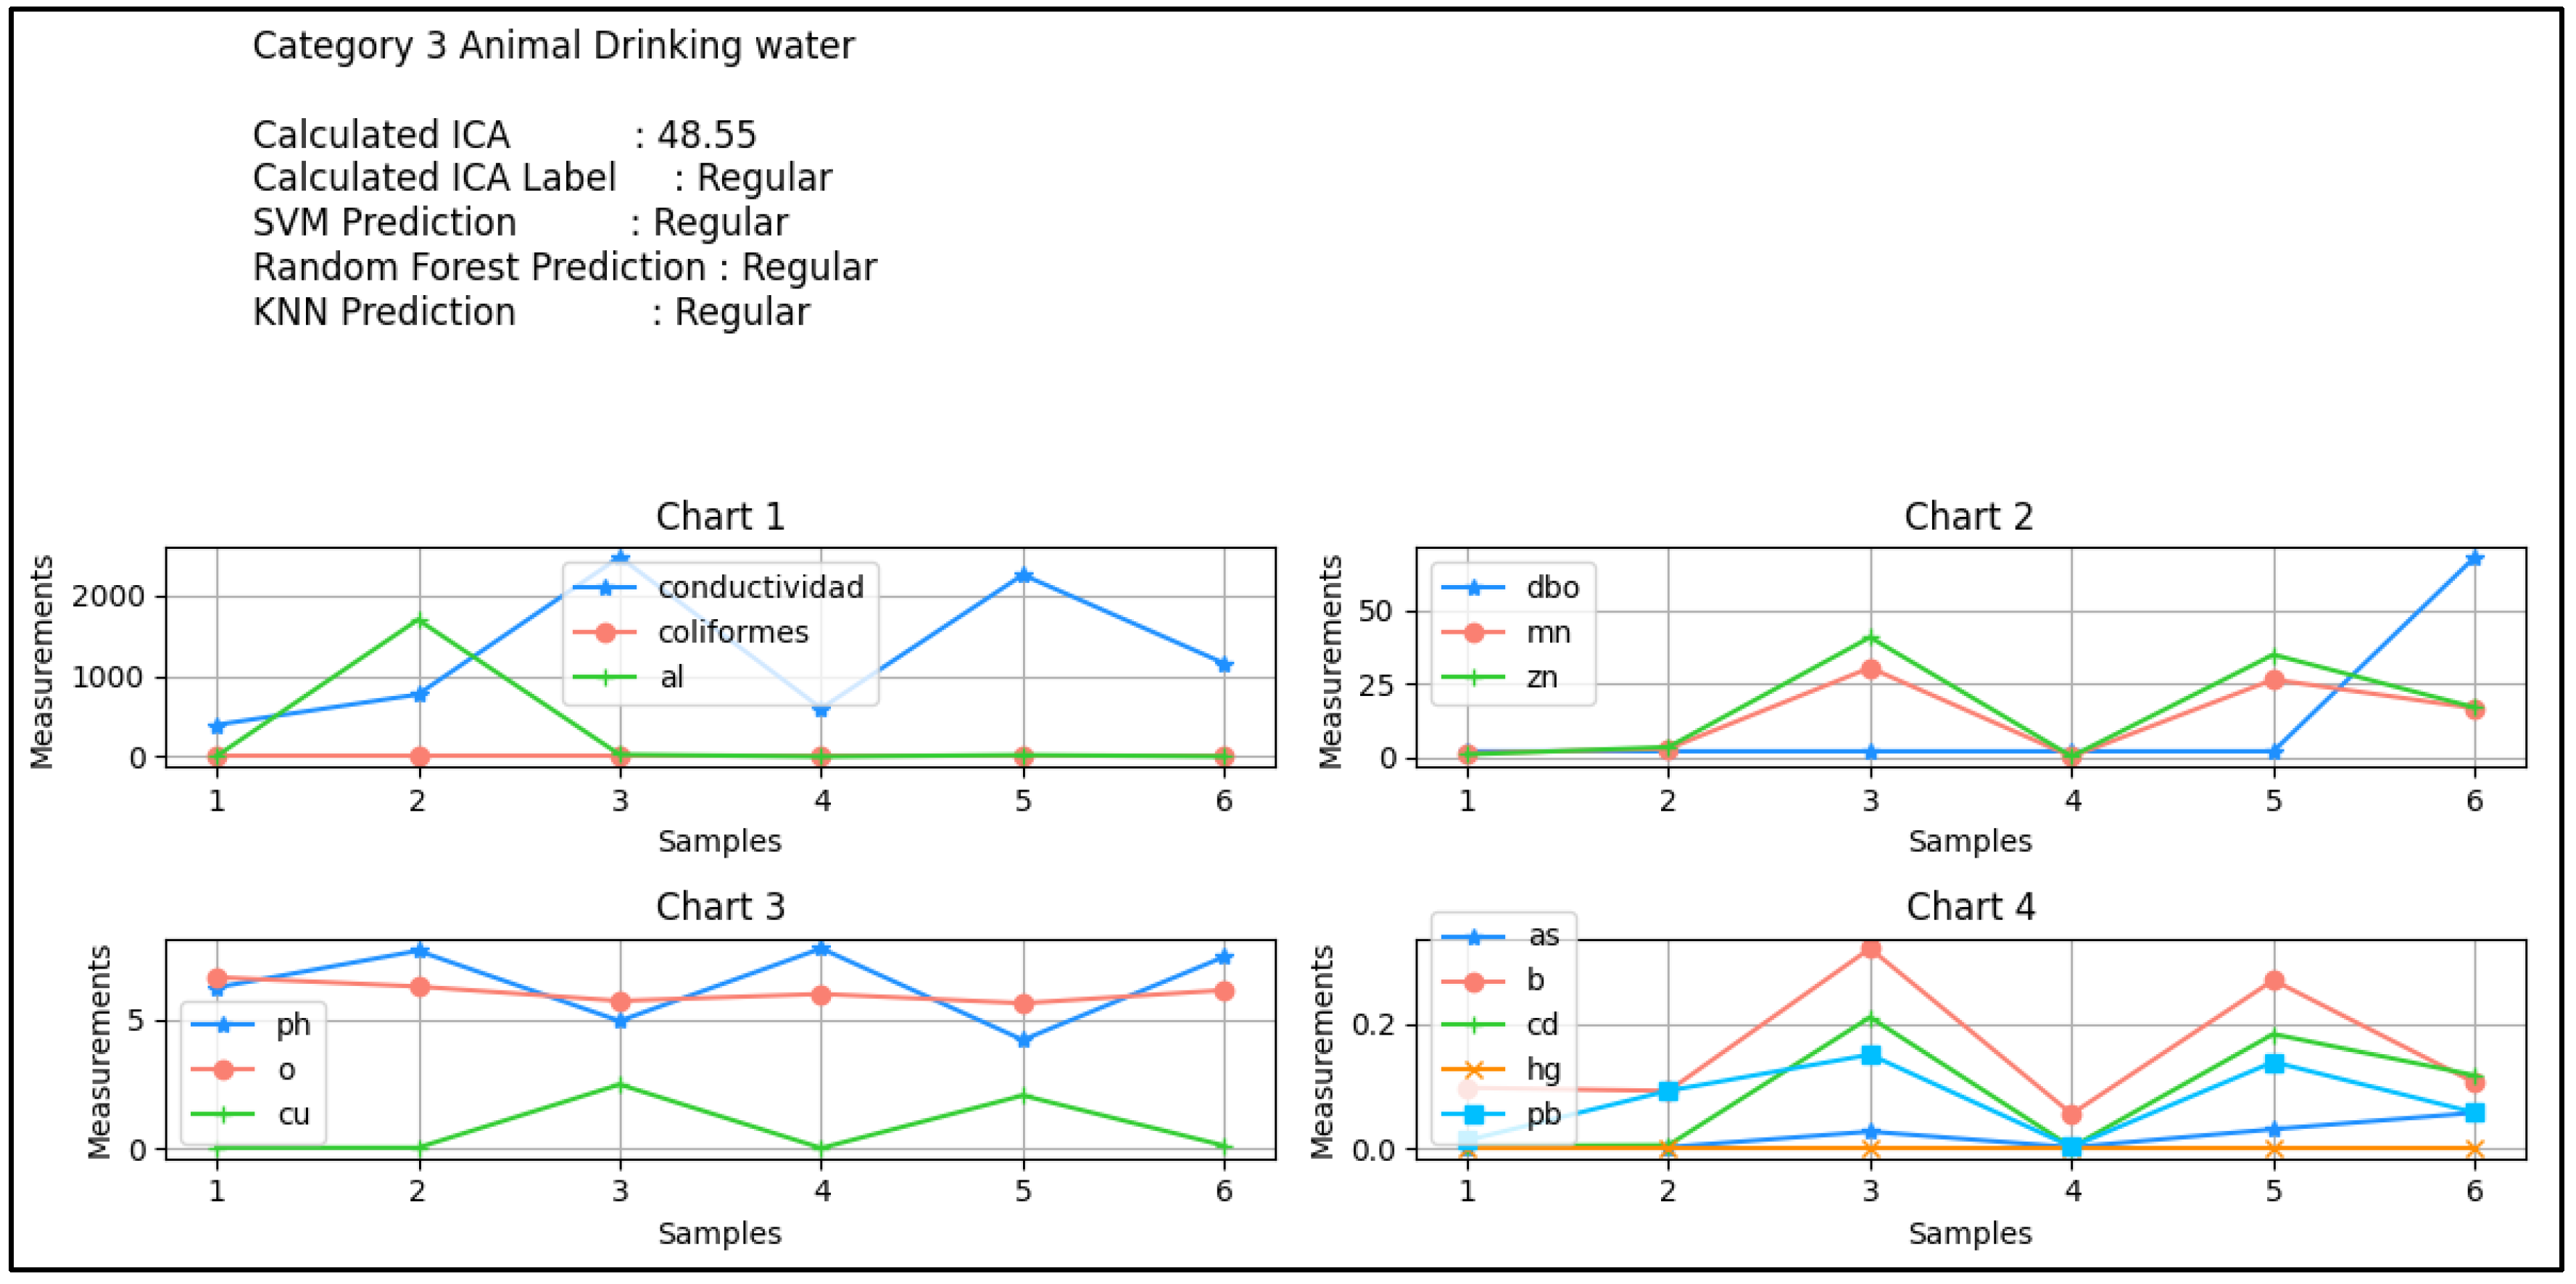
Table 1.
Categorization of Water Quality According to the WQI-PE Index.
| WQI- PE | Rating | Interpretation |
| 100 - 90 | Excellent | The water quality is protected with no threats or damage. Conditions are very close to natural or desirable levels. |
| 89 - 75 | Good | The water quality deviates slightly from its natural state. However, desirable conditions may be affected by minor threats or damage. |
| 74 - 45 | Regular | Natural water quality is occasionally threatened or degraded. Water quality often deviates from desirable values. Many uses require treatment. |
| 44 - 30 | Poor | The water quality does not meet quality objectives, and desirable conditions are frequently threatened or degraded. Many uses require treatment. |
| 29 - 0 | Very Poor | The water quality does not meet quality objectives, is almost always threatened or degraded, and all uses require prior treatment. |
Table 3.
Comparison with the Traditional WQI Method.
| Method | Processing Time | Accuracy (F-Score) |
| Excel Macros | Hours | 75% |
| KNN (Optimized, k=8) | Minutes | 90% |
Table 4.
Performance Metrics and Accuracy Comparison.
| Method | F-Score (%) | Processing Time | Scalability |
| Excel Macros (Manual) | 75% | Several hours | Limited (Manual Handling) |
| KNN (Optimized, k=8) | 90% | Minutes | High (Automated) |
Disclaimer/Publisher’s Note: The statements, opinions and data contained in all publications are solely those of the individual author(s) and contributor(s) and not of MDPI and/or the editor(s). MDPI and/or the editor(s) disclaim responsibility for any injury to people or property resulting from any ideas, methods, instructions or products referred to in the content. |
© 2025 by the authors. Licensee MDPI, Basel, Switzerland. This article is an open access article distributed under the terms and conditions of the Creative Commons Attribution (CC BY) license (http://creativecommons.org/licenses/by/4.0/).
Copyright: This open access article is published under a Creative Commons CC BY 4.0 license, which permit the free download, distribution, and reuse, provided that the author and preprint are cited in any reuse.


