Submitted:
30 April 2025
Posted:
30 April 2025
You are already at the latest version
Abstract
Background/Objectives: The development of novel agents for chronic hepatitis B (CHB) has rapidly evolved, but only with a few candidates progressing to phase III trials. This study aimed to systematically evaluate key design elements of CHB cure trials and their impact on trial performance. Methods: We conducted a systematic review of clinical trial registries (ClinicalTrials.gov, WHO Clinical Trials Registry Platform, and Chinese Clinical Trial Registry) and publications (PubMed, Embase, and the Cochrane Library) for CHB cure trials. The relationship between the design characteristics and the performance of the trials was analyzed with Cox regression and meta-analysis. Results: A total of 244 trials and 23 publications involving 1,798 patients were included. Phase I clinical trials had a completion rate of 65.5%, with 38.7% advancing to phase II. For phase II trials, the completion rate was 48.9%, only with 4.3% advancing to phase III. Novel trial designs were adopted by 30.3% of the CHB clinical trials. Smaller sample size significantly was associated with higher completion rates in both phase I (HR: 0.980, 95% CI: 0.966–0.994) and phase II trials (HR: 0.994, 95% CI: 0.988–0.999). Shorter treatment duration was associated with higher completion rates only in phase I trials (HR: 0.992, 95% CI: 0.986–0.998). Meta-analysis of early-phase trials showed that direct-acting antivirals (SMD: 5.43, 95% CI: 0.22–10.64) were superior to control groups in achieving HBV cure. Conclusions: This study demonstrates that smaller sample sizes and shorter treatment durations are significantly associated with higher completion rates in early-phase trials.
Keywords:
chronic hepatitis B
; Novel therapeutic agents
; HBsAg loss
; clinical trials
; trial design
1. Introduction
Hepatitis B virus (HBV) infection continues to be a significant global public health issue, affecting approximately 257.5 million individuals as of 2022 [1]. If left untreated, it can result in detrimental clinical outcomes, including cirrhosis and hepatocellular carcinoma (HCC) [2,3]. Currently, the treatment of chronic hepatitis B (CHB) includes nucleos(t)ide analogs (NAs) and pegylated interferons (IFNs), either as monotherapy or in combination. These therapies effectively suppress viral replication, improve liver function tests, halt or even reverse liver fibrosis and cirrhosis and reduce the risk of HCC [4], However, they yield only very low rates of hepatitis B surface antigen (HBsAg) loss [5,6]. Therefore, novel therapeutic agents are needed to achieve higher functional cure rates for CHB.
Novel agents for functional cure of CHB in development include direct-acting antivirals and immunomodulatory agents [7,8,9]. Clinical trials are one of the key steps for regulatory approval of the novel agents for treating CHB, but currently, only a few advance to phase III clinical trials [10]. Guidance on the design and endpoints of clinical trials for the functional cure of HBV has been jointly published by AASLD and EASL [11], novel trial designs, including platform, umbrella, and basket designs, have also become increasingly used to improve the efficiency of the clinical trials for curing CHB [12,13]. However, there is remarkable variability and uncertainty in clinical trial designs, particularly in terms of patient population selection, treatment duration, sample size, and endpoint definitions [8]. These factors pose challenges in the implementation, evaluation, interpretation, and regulatory approval of the novel agents for functional cure of HBV [14]. Therefore, it is prudent to optimize clinical trial designs to enhance the efficiency and feasibility of the clinical trials for HBV cure.
This study aimed to investigate the key features of the clinical trial design and to identify the key factors influencing the trial completion for HBV cure.
2. Results
The search for clinical trial registry identified 1,156 clinical trials. After removing 98 duplicates and excluding 814 trials based on the inclusion and exclusion criteria, 244 trials were included for analysis. Among these, phase I trials constituted the largest proportion (48.8%), followed by phase II trials (37.7%) (Figure 1).
The search for publication identified 15,246 studies. After removing 5,157 duplicates and 4,272 studies published before 2010, and 5,567 based on title and abstract screening, 250 studies remained for full-text review. Finally, 23 studies comprising 1,798 patients were included for analysis (Figure 1).
2.1. Basic Information on the Included Clinical Trials on Novel Agents for CHB
Among the 244 included clinical trials, most phase III trials were active (83.3%), while most trials in other phases were completed. Additionally, the proportion of phase II trials that advanced to phase III trials was lower than that of phase I trials that advanced to phase II trials (Table 1). The included clinical trials involved 2,393 centers. The top five countries with the highest numbers of participating centers were China (491 centers, 20.52%), South Korea (260 centers, 10.87%), the United States (234 centers, 9.78%), Australia (129 centers, 5.39%), and the United Kingdom (122 centers, 5.10%) (Figure 2, Supplementary Table S1). In total, 78 primary sponsors supported these trials (Supplementary Table S2).
2.2. Annual Growth and Drug Types in Clinical Trials of Novel Agents for CHB
The number of phase I, phase I/II, and phase II trials substantially increased from 2005 to 2024. The highest five-year growth rates were recorded between 2015 and 2019: phase I trials increased by 410%, phase I/II trials by 233.3%, and phase II trials by 322.2% (Figure 3).
Different novel drugs were distributed unevenly across trial phases. Capsid or core inhibitors accounted for the largest proportion in phase I trials (35 trials, 29.4%), with 30.4% (14/35) successfully advancing to phase II (14 trials, 30.4%) (Figure 4A, 4D). Therapeutic vaccines accounted for the largest proportion in phase I/II trials (10 trials, 40.0%) (Figure 4B), whereas RNAi gene silencers accounted for the largest proportion in phase II trials (28 trials, 30.4%) (Figure 4C).
2.3. Design Characteristics of Clinical Trials of Novel Agents for CHB Cure
Traditional designs on clinical trials of novel agents for CHB cure accounted for nearly 70%, whereas novel trial designs accounted for only 30.3%. Phases I-III trials predominantly used randomized allocation, parallel intervention models, and open-label designs. Phase I and III trials primarily employed monotherapy and placebo controls, whereas phase II trials often used combination therapies and active controls. The median treatment durations ranged from 14 days (phase I) to 336 days (phase III), whereas the median follow-up durations ranged from 28 days (phase I) to 336 days (phase III). The sample sizes increased significantly from phase I (median 49) to phase III (median 534).
The novel designs included adaptive designs (43 trials, 58.1%), seamless designs (27 trials, 36.5%), platform trials (3 trials, 4.0%), and other designs (1 trial, 1.4%). The proportion of novel designs in phase I trials (32.8%) was higher than in phase II trials (8.7%) (Table 2).
2.4. Trial Performance of Early-Phase Clinical Trials of Novel Agents for CHB Cure
2.4.1. Factors Influencing Trial Completion in Early-Phase Clinical Trials
Univariate analysis indicated that factors such as drug type, sample size, novel design, subject, treatment duration, intervention model, and follow-up duration influenced the completion of phase I trials. For phase II trials, the influencing factors included drug type, sample size, novel design, and masking (Supplementary Table S3). A multivariate proportional Cox regression model was performed to further identify the independent factors impacting trial completion, with stratification by factors that violated the proportional hazards assumption (Table 3). We found that an increased sample size was significantly associated with a lower completion rate in both phase I (HR: 0.980, 95% CI: 0.966–0.994, P = 0.003) and phase II trials (HR: 0.994, 95% CI: 0.988–0.999, P = 0.037). A longer treatment duration was significantly associated with a lower completion rate only in phase I trials (HR: 0.992, 95% CI: 0.986–0.998, P = 0.011). However, the novel trial design did not negatively affect the completion of either phase I or phase II trials (Table 3).
2.4.2. The Preliminary Efficacy of Novel Agents for CHB Cure
Meta-analysis showed that the direct-acting antivirals group demonstrated significantly greater efficacy than the control group (SMD: 5.43, 95% CI: 0.22–10.64). In the subgroup analysis of direct-acting antivirals, RNAi gene silencers (SMD: 11.25, 95% CI: 1.26–21.24) and antisense molecules (SMD: 1.78, 95% CI: 1.04–2.51) showed significantly higher efficacy than the control group. However, the efficacy of the other novel agents was similar to that of the control group, particularly for immunomodulatory agents such as therapeutic vaccines and compounds that activate the innate immune system (Figure 5).
3. Discussion
This study comprehensively investigated the impact of trial design on the performance of clinical trials for curing CHB. Notably, larger sample sizes were associated with lower completion rates in both phase I and II clinical trials, and longer treatment durations were associated with lower completion rates in only phase I clinical trials. Novel trial designs adopted by around one-third of the HBV cure trials did not negatively influence completion rates in either phase.
The observed association between smaller sample sizes and higher completion rates in Phase I and II clinical trials may reflect reduced operational complexities and costs, facilitating faster recruitment, monitoring, and data collection. In phase I clinical trials, smaller sample sizes are used to test the initial safety and pharmacokinetics, enabling rapid assessment and minimizing delays [18]. Similarly, smaller cohorts are used in phase II clinical trials to evaluate the preliminary efficacy, alleviating the logistical challenges associated with larger studies [18]. However, while smaller sample sizes may improve trial feasibility, they may also limit statistical power and generalizability, particularly in later phases where larger sample sizes are essential to confirm efficacy and assess broader applicability [19].
The negative impact of longer treatment durations on phase I trial completion rates suggests that shorter treatment regimens may reduce dropout rates and enhance participant retention. Since phase I trials primarily focus on safety and pharmacokinetics, shorter durations can minimize participant burden, facilitating subject retention and improving the likelihood of completing the trial within the planned timeframe. This finding underscores the importance of leveraging the treatment duration and the need for sufficient data collection, particularly in early-phase trials where safety and tolerability are the primary endpoints.
The absence of a negative impact of novel trial designs on completion rates is intriguing and may reflect the unique challenges inherent in CHB trials. While adaptive and seamless designs theoretically offer time-saving benefits by enabling modifications based on interim results or facilitating smooth transitions between trial phases [14,20,21], their implementation in CHB trials may be constrained by the need for long-term follow-up to assess endpoints such as HBsAg loss. However, the use of surrogate endpoints, such as early HBsAg decline, could help mitigate this limitation by providing interim efficacy signals, thereby accelerating trial timelines [11]. Additionally, while the complexity of real-time monitoring and statistical adjustments in adaptive designs may reduce their efficiency, our findings suggest that these challenges do not significantly hinder trial completion. Thus, while novel trial designs hold promise, their successful integration into CHB trials will require careful consideration of long-term endpoint monitoring and biomarker validation to fully realize their potential benefits.
The limited adoption of novel trial designs in CHB trials contrasts with their widespread use in oncology, where adaptive, umbrella, and basket designs have significantly accelerated the development of targeted therapies [22]. In oncology, these designs facilitate patient stratification based on biomarkers, enabling the simultaneous testing of multiple therapies and more efficient identification of effective treatments [22]. A similar approach in CHB could enhance the precise targeting of therapies. However, the direct application of these approaches to CHB trials is challenging due to the lack of validated biomarkers and the need for long-term monitoring of endpoints such as HBsAg loss. A similar trend is observed in metabolic dysfunction-associated fatty liver disease (MAFLD) trials, where traditional designs continue to dominate despite the growing interest in novel approaches [23,24]. These facts underscore the necessity for collaborative efforts to address common challenges, such as biomarker validation and long-term endpoint monitoring, across chronic liver diseases.
The low transition rate from phase II to phase III trials (4.3%) is a barrier to the development of novel CHB therapies. This rate is lower than the average transition rate for chronic disease clinical trials (23.1%), highlighting phase II as a critical step in CHB drug development [25]. The challenges encountered in phase II clinical trials may stem from issues related to drug efficacy, patient recruitment, or study design, which must be addressed to improve the likelihood of success in later phases. Overcoming these barriers will be essential for accelerating the development of effective therapies for CHB cure.
Finally, we found that direct-acting antivirals demonstrated significantly superior efficacy, highlighting their potential as pivotal agents in achieving a functional cure for CHB. In contrast, immunomodulatory agents have not exhibited significantly superior efficacy so far. This discrepancy may arise from fundamental differences in their mechanisms of action: direct-acting antivirals directly inhibit viral replication, while immunomodulatory agents primarily enhance host immune responses[26,27], which may require longer observation periods or only work in patients with specific favorable profiles to achieve measurable benefits. Furthermore, the limited number of publications on immunomodulatory agents may have restricted the ability to comprehensively assess their efficacy. It is possible that novel immunomodulatory agents developed in the future could demonstrate significantly superior efficacy.
This study has several limitations. First, the relatively limited number of clinical trials may have compromised the robustness of the multivariate Cox model. Second, incomplete registration information in some trials, such as missing details on inclusion and exclusion criteria, allocation, and masking, may have impacted the findings. Finally, the trial status is based on the latest updates from these registries, which cannot be independently verified by us.
4. Materials and Methods
This study adhered to the Preferred Reporting Items for Systematic Review and Meta-analyses (PRISMA) statement [15].
4.1. Identification and Screen of Clinical Trials
4.1.1. Data Sources and Search Strategy for Clinical Trials
We searched the WHO International Clinical Trials Registry Platform (ICTRP), ClinicalTrials.gov, and the Chinese Clinical Trial Registry (ChiCTR) from their inception until September 1, 2023, with trial statuses updated as of October 1, 2024. The search strategy employed key terms including ‘chronic hepatitis B’, ‘HBV’, ‘CHB’, ‘chronic HBV infection’, and ‘hepatitis B virus’.
4.1.2. Inclusion and Exclusion Criteria for Clinical Trials
Clinical trials were included if they met the following criteria: (1) Phase: phase I-III clinical trials; (2) Population: adults with CHB or healthy volunteers (HV); (3) Intervention: the intervention group involved novel agents under development for CHB; (4) Outcome: decline in levels or loss of HBsAg was used as one of the primary endpoints in phase II-III clinical trials.
Trials were excluded if they met any of the following criteria: (1) trials involving participants with co-infections (e.g., hepatitis C or D or human immunodeficiency virus); (2) trials with cirrhosis, decompensation, HCC, or transplantation; (3) trials with alcohol use, autoimmune, metabolic, kidney diseases, or pregnancy; (4) non-interventional trials; and (5) trials only using currently available HBV therapies, including NAs, IFNs, traditional Chinese medicine, or preventive vaccines.
4.2. Identification and Screen of Publications
4.2.1. Data Sources and Search Strategy for Publications
We searched in PubMed, Embase, and Cochrane Library databases from their inception through March 31, 2024. using key terms such as 'chronic hepatitis B', 'HBV', 'CHB', 'chronic HBV infection', and 'hepatitis B virus'. Details are provided in Supplementary Methods.
4.2.2. Inclusion and Exclusion Criteria for Publications
The inclusion and exclusion criteria for publications were the same as those employed in searching for clinical trials. For the meta-analysis, we included only studies that reported changes in HBsAg levels and excluded studies with participants of less than 10.
4.3. Data Extraction
Data extraction was conducted independently by two investigators with cross-verification. The extracted information encompassed basic trial information, including trial ID, public title, scientific title, country, number of participating centers, sponsor, start and end dates, and trial status. Trial design characteristics covered intervention type, control type, sample size, treatment duration, follow-up duration, primary and secondary outcomes, and design type. Information was also gathered on the drug names and codenames used in the trials. Additionally, eligibility criteria for participants of the clinical trials were extracted, including levels of alanine aminotransferase (ALT), HBV DNA and HBsAg, hepatitis B e antigen (HBeAg) status, and subject type. From the included publications, we extracted the name of the first author, year of publication, country, sample size, study design, levels of HBsAg at baseline, on-treatment and/or off-treatment, and decline in HBsAg levels.
4.4. Terminology and Definition
A functional cure for CHB is defined as sustained undetectable levels of HBsAg and HBV DNA in the serum after a finite course of treatment, with or without seroconversion to anti-HBs [16]. This definition of functional cure was used as the primary therapeutic goal in evaluating novel agents for CHB treatment.
The classification of novel drug types follows the criteria used by the Hepatitis B Foundation [9]. Direct-acting antivirals include RNA interference (RNAi) gene silencers, entry inhibitors, capsid or core inhibitors, HBsAg inhibitors, antisense molecules, and other related agents. Immunomodulatory agents include therapeutic vaccines, compounds that activate the innate immune system, monoclonal antibodies, checkpoint inhibitors, and other immune modulatory therapies.
4.5. Statistical Analysis
Characteristics of clinical trials, including trial phases and implementation status, the geographic distribution of participating centers, and drug types were reported as frequencies and percentages. The key elements of the trial design were summarized as medians with interquartile ranges for continuous variables and as frequencies for categorical variables in each trial phase. Temporal trends in trial numbers and growth rates were calculated for phase I, phase I/II, and phase II trials.
To analyze factors affecting trial implementation, trials were considered completed if their status reported in registration platforms was listed as "Completed", regardless of whether the trial met its endpoints. Trials with the status "Active, not recruiting", "Recruiting", or "Not yet recruiting" as of October 1, 2024, were treated as censored data. Trials with the status "Terminated", "Withdrawn", or "Unknown status" were excluded from the analysis due to uncertainty in their completion status. Univariate Cox regression analysis was conducted to assess the relationship between individual covariates and the completion of clinical trials. Covariates with a P-value < 0.20 were included in the multivariate Cox regression model, which was developed using a stepwise forward selection method. The proportional hazards assumption was tested using Schoenfeld residuals, and variables that violated this assumption (P-value < 0.05) were addressed through stratification in the Cox regression model. In a stratified Cox regression model, the baseline hazard function varies across levels of the stratification variable, and the effect of covariates is assumed to be consistent across these strata [17]. Due to the limited number of phase I/II, phase II/III, and phase III trials, Cox regression analysis was conducted only on phase I and phase II trials.
A meta-analysis was performed to assess the efficacy of novel agents using data from publications. The standardized mean difference (Hedges' g, SMD) and 95% confidence intervals (CIs) of HBsAg decline were calculated using a random effects model. Subgroup analyses were conducted based on different types of novel agents.
To visualize the data distribution, a choropleth world map was used to display the geographic distribution of clinical trial centers, line charts were used to show the growth of novel drugs, and bar charts were used to represent the distribution of categorical variables. All analyses were performed using R Software version 4.3.1.
5. Conclusions
This study found that smaller sample sizes and shorter treatment durations were associated with higher completion rates in early-phase trials. The transition rate from phase II to phase III trials was low, posing a significant barrier to the HBV drug development. In addition, novel trial designs did not negatively impact the performance on early-phase trials. In the future, further optimization of trial design is warranted to accelerate the development of curative CHB therapies.
Supplementary Materials
The following supporting information can be downloaded at the website of this paper posted on Preprints.org, Table S1: Table S1 Distribution of the number of participating centers in clinical trials of novel agents for CHB. Table S2: Primary sponsors of clinical trials of novel agents for CHB. Table S3: Univariate Cox proportional hazards analysis of risk factors for the completion of Phase I and Phase II clinical trials.
Author Contributions
Conceptualization, Hong You, Jidong Jia, and Yuanyuan Kong; methodology, Lichen Shi, Hao Wang, Jidong Jia, and Yuanyuan Kong; formal analysis, Lichen Shi, Hao Wang, Jidong Jia, and Yuanyuan Kong; data curation, Lichen Shi, Hao Wang, Cheng Huang, and Yifan Du; writing—original draft preparation, Lichen Shi; writing—review and editing, Hao Wang, Cheng Huang, Yifan Du, Hong You, Jidong Jia, and Yuanyuan Kong. All authors have read and agreed to the published version of the manuscript.
Funding
This research was funded by the National Key Research and Development Program of China (grant numbers 2023YFC2306902 and 2023YFC2306900), and the High-level Public Health Technical Talents Program of the Beijing Municipal Health Commission (grant number XUEKEGUGAN-010-018)
Institutional Review Board Statement
Not applicable.
Informed Consent Statement
Not applicable.
Data Availability Statement
The raw data supporting the conclusions of this article will be made available by the authors on request.
Conflicts of Interest
The authors declare no conflicts of interest.
Abbreviations
The following abbreviations are used in this manuscript:
| AASLD | American Association for the Study of Liver Diseases |
| ALT | Alanine Aminotransferase |
| ChiCTR | Chinese Clinical Trial Registry |
| CHB | Chronic Hepatitis B |
| EASL | European Association for the Study of the Liver |
| HBeAg | Hepatitis B e Antigen |
| HBsAg | Hepatitis B Surface Antigen |
| HBV | Hepatitis B Virus |
| HCC | Hepatocellular Carcinoma |
| HCV | Hepatitis C Virus |
| HDV | Hepatitis D Virus |
| HV | Healthy Volunteers |
| ICTRP | International Clinical Trials Registry Platform |
| IFNs | Pegylated Interferons |
| MAFLD | Metabolic Dysfunction-Associated Fatty Liver Disease |
| NAs | Nucleos(t)ide Analogs |
| RNAi | RNA Interference |
| TE | Treatment-experienced |
| TN | Treatment-naïve |
| ULN | Upper Limit of Normal |
References
- Polaris Observatory Collaborators. Global prevalence, cascade of care, and prophylaxis coverage of hepatitis B in 2022: a modelling study. The lancet. Gastroenterology & hepatology 2023, 8, 879–907. [Google Scholar] [CrossRef]
- Jeng, W.J.; Papatheodoridis, G.V.; Lok, A.S.F. Hepatitis B. Lancet (London, England) 2023, 401, 1039–1052. [Google Scholar] [CrossRef]
- Choi, W.M.; Kim, G.A.; Choi, J.; Choi, G.H.; Lee, Y.B.; Sinn, D.H.; Lim, Y.S. Non-linear association of baseline viral load with on-treatment hepatocellular carcinoma risk in chronic hepatitis B. Gut 2024, 73, 649–658. [Google Scholar] [CrossRef] [PubMed]
- European Association for the Study of the Liver. EASL 2017 Clinical Practice Guidelines on the management of hepatitis B virus infection. Journal of hepatology 2017, 67, 370–398. [Google Scholar] [CrossRef]
- Wong, G.L.H.; Gane, E.; Lok, A.S.F. How to achieve functional cure of HBV: Stopping NUCs, adding interferon or new drug development? Journal of hepatology 2022, 76, 1249–1262. [Google Scholar] [CrossRef]
- Lim, S.G.; Baumert, T.F.; Boni, C.; Gane, E.; Levrero, M.; Lok, A.S.; Maini, M.K.; Terrault, N.A.; Zoulim, F. The scientific basis of combination therapy for chronic hepatitis B functional cure. Nature reviews. Gastroenterology & hepatology 2023, 20, 238–253. [Google Scholar] [CrossRef]
- Dusheiko, G.; Agarwal, K.; Maini, M.K. New Approaches to Chronic Hepatitis B. The New England journal of medicine 2023, 388, 55–69. [Google Scholar] [CrossRef]
- Pawlotsky, J.M. New hepatitis B drug development disillusions: time to reset? The lancet. Gastroenterology & hepatology 2023, 8, 192–197. [Google Scholar] [CrossRef]
- Hepatitis B Foundation. Drug Watch. Available online: https://www.hepb.org/treatment-and-management/drug-watch/ (accessed on.
- Li, J.; Liu, S.; Zang, Q.; Yang, R.; Zhao, Y.; He, Y. Current trends and advances in antiviral therapy for chronic hepatitis B. Chinese medical journal 2024, 137, 2821–2832. [Google Scholar] [CrossRef] [PubMed]
- Ghany, M.G.; Buti, M.; Lampertico, P.; Lee, H.M. Guidance on treatment endpoints and study design for clinical trials aiming to achieve cure in chronic hepatitis B and D: Report from the 2022 AASLD-EASL HBV-HDV Treatment Endpoints Conference. Journal of hepatology 2023, 79, 1254–1269. [Google Scholar] [CrossRef]
- Woodcock, J.; LaVange, L.M. Master Protocols to Study Multiple Therapies, Multiple Diseases, or Both. The New England journal of medicine 2017, 377, 62–70. [Google Scholar] [CrossRef]
- Hou, J.; Zhang, W.; Xie, Q.; Hua, R.; Tang, H.; Morano Amado, L.E.; Yang, S.S.; Peng, C.Y.; Su, W.W.; Chuang, W.L.; et al. Xalnesiran with or without an Immunomodulator in Chronic Hepatitis B. The New England journal of medicine 2024, 391, 2098–2109. [Google Scholar] [CrossRef] [PubMed]
- Bhatt, D.L.; Mehta, C. Adaptive Designs for Clinical Trials. The New England journal of medicine 2016, 375, 65–74. [Google Scholar] [CrossRef]
- Page, M.J.; McKenzie, J.E.; Bossuyt, P.M.; Boutron, I.; Hoffmann, T.C.; Mulrow, C.D.; Shamseer, L.; Tetzlaff, J.M.; Akl, E.A.; Brennan, S.E.; et al. The PRISMA 2020 statement: an updated guideline for reporting systematic reviews. BMJ (Clinical research ed.) 2021, 372, n71. [Google Scholar] [CrossRef] [PubMed]
- Lok, A.S.; Zoulim, F.; Dusheiko, G.; Ghany, M.G. Hepatitis B cure: From discovery to regulatory approval. Hepatology (Baltimore, Md.) 2017, 66, 1296–1313. [Google Scholar] [CrossRef]
- Kleinbaum, D.G.; Klein, M. The Stratified Cox Procedure. In Survival Analysis: A Self-Learning Text; leinbaum, D.G., Klein, M., Eds.; Springer New York: New York, NY, 2012; pp. 201–240. [Google Scholar]
- Fountzilas, E.; Tsimberidou, A.M.; Vo, H.H.; Kurzrock, R. Clinical trial design in the era of precision medicine. Genome Med 2022, 14, 101. [Google Scholar] [CrossRef]
- Button, K.S.; Ioannidis, J.P.; Mokrysz, C.; Nosek, B.A.; Flint, J.; Robinson, E.S.; Munafò, M.R. Power failure: why small sample size undermines the reliability of neuroscience. Nat Rev Neurosci 2013, 14, 365–376. [Google Scholar] [CrossRef] [PubMed]
- Mansinho, A.; Boni, V.; Miguel, M.; Calvo, E. New designs in early clinical drug development. Annals of oncology : official journal of the European Society for Medical Oncology 2019, 30, 1460–1465. [Google Scholar] [CrossRef]
- Lorch, U.; Berelowitz, K.; Ozen, C.; Naseem, A.; Akuffo, E.; Taubel, J. The practical application of adaptive study design in early phase clinical trials: a retrospective analysis of time savings. European journal of clinical pharmacology 2012, 68, 543–551. [Google Scholar] [CrossRef]
- Park, J.J.H.; Hsu, G.; Siden, E.G.; Thorlund, K.; Mills, E.J. An overview of precision oncology basket and umbrella trials for clinicians. CA Cancer J Clin 2020, 70, 125–137. [Google Scholar] [CrossRef]
- Harrison, S.A.; Allen, A.M.; Dubourg, J.; Noureddin, M.; Alkhouri, N. Challenges and opportunities in NASH drug development. Nature medicine 2023, 29, 562–573. [Google Scholar] [CrossRef] [PubMed]
- Domingues, I.; Leclercq, I.A.; Beloqui, A. Nonalcoholic fatty liver disease: Current therapies and future perspectives in drug delivery. Journal of controlled release : official journal of the Controlled Release Society 2023, 363, 415–434. [Google Scholar] [CrossRef] [PubMed]
- Thomas, D.; Chancellor, D.; Micklus, A. New Clinical Development Success Rates 2011-2020 Report; 2023. [Google Scholar]
- Amin, O.E.; Colbeck, E.J.; Daffis, S.; Khan, S.; Ramakrishnan, D.; Pattabiraman, D.; Chu, R.; Micolochick Steuer, H.; Lehar, S.; Peiser, L.; et al. Therapeutic Potential of TLR8 Agonist GS-9688 (Selgantolimod) in Chronic Hepatitis B: Remodeling of Antiviral and Regulatory Mediators. Hepatology (Baltimore, Md.) 2021, 74, 55–71. [Google Scholar] [CrossRef] [PubMed]
- Dawood, A.; Abdul Basit, S.; Jayaraj, M.; Gish, R.G. Drugs in Development for Hepatitis B. Drugs 2017, 77, 1263–1280. [Google Scholar] [CrossRef]
Figure 1.
Flow chart of the inclusion and exclusion of clinical trials and relevant publications. ChiCTR, Chinese Clinical Trial Registry; HBV, Hepatitis B Virus; HCV, Hepatitis C Viruses; HDV, Hepatitis D Viruses; HIV, Human Immunodeficiency Virus; ICTRP, International Clinical Trials Registry Platform; IFNs, Pegylated Interferon; NAs, Nucleos(t)ide Analogs.
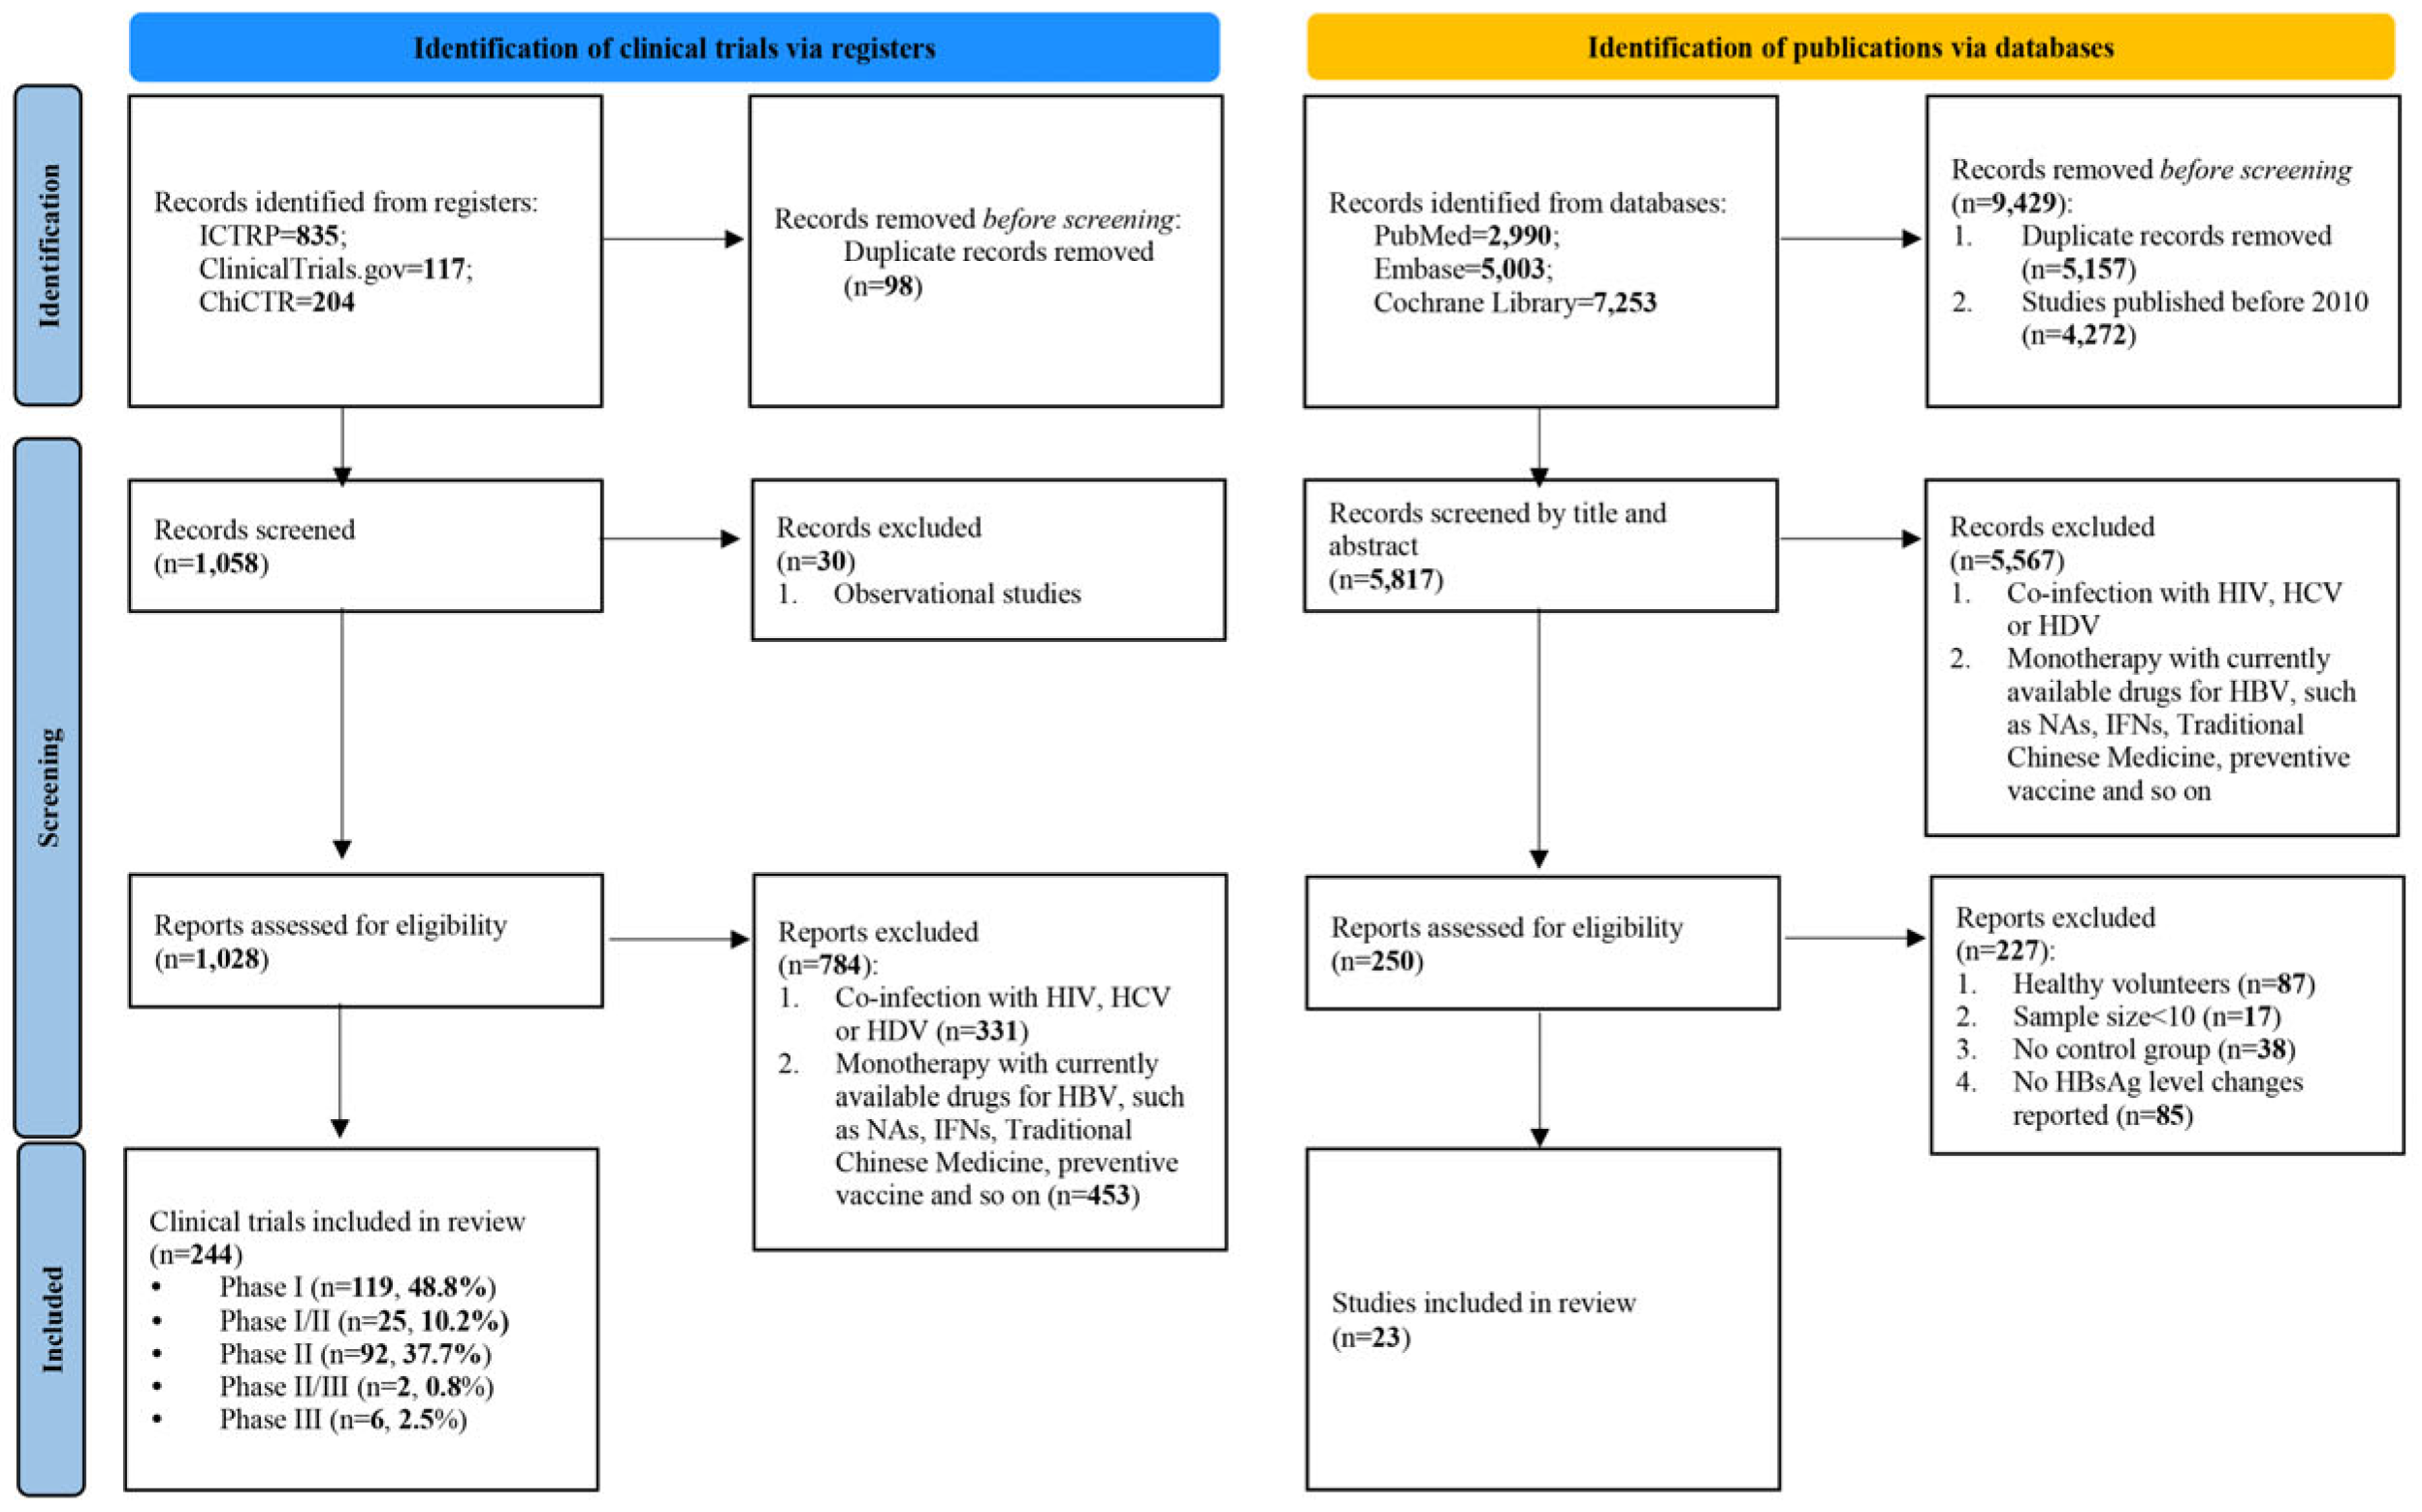
Figure 2.
Distribution of the number of participating centers in clinical trials of novel agents for CHB.
Figure 2.
Distribution of the number of participating centers in clinical trials of novel agents for CHB.
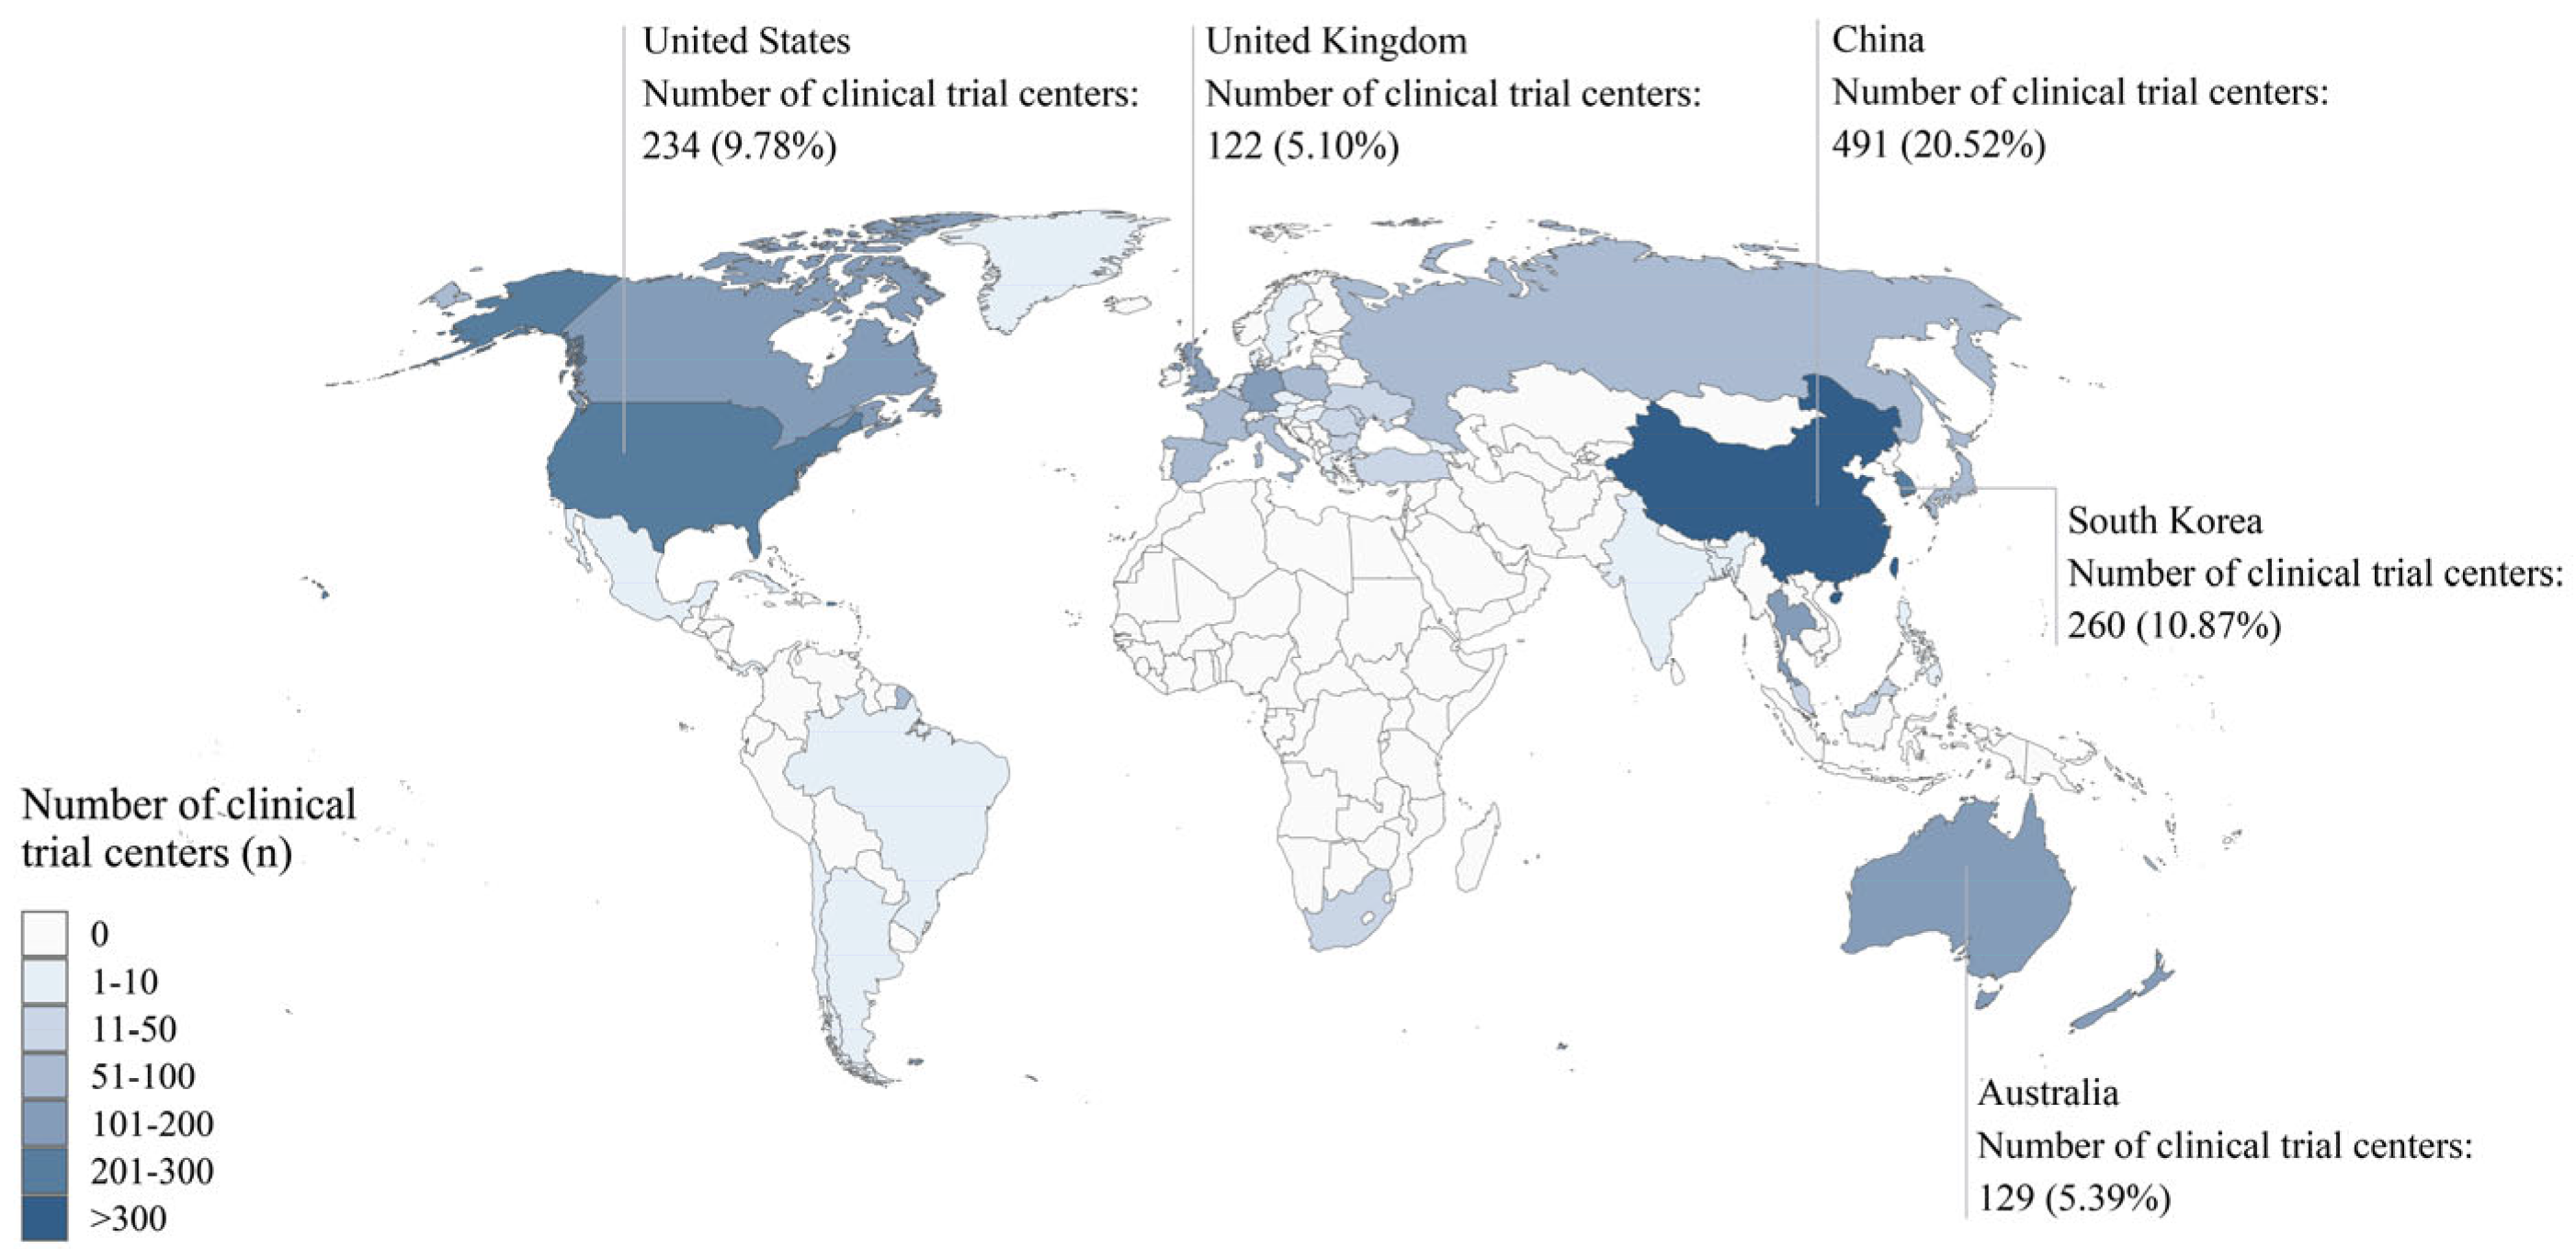
Figure 3.
The annual growth of phase I-II clinical trials of novel agents for CHB.
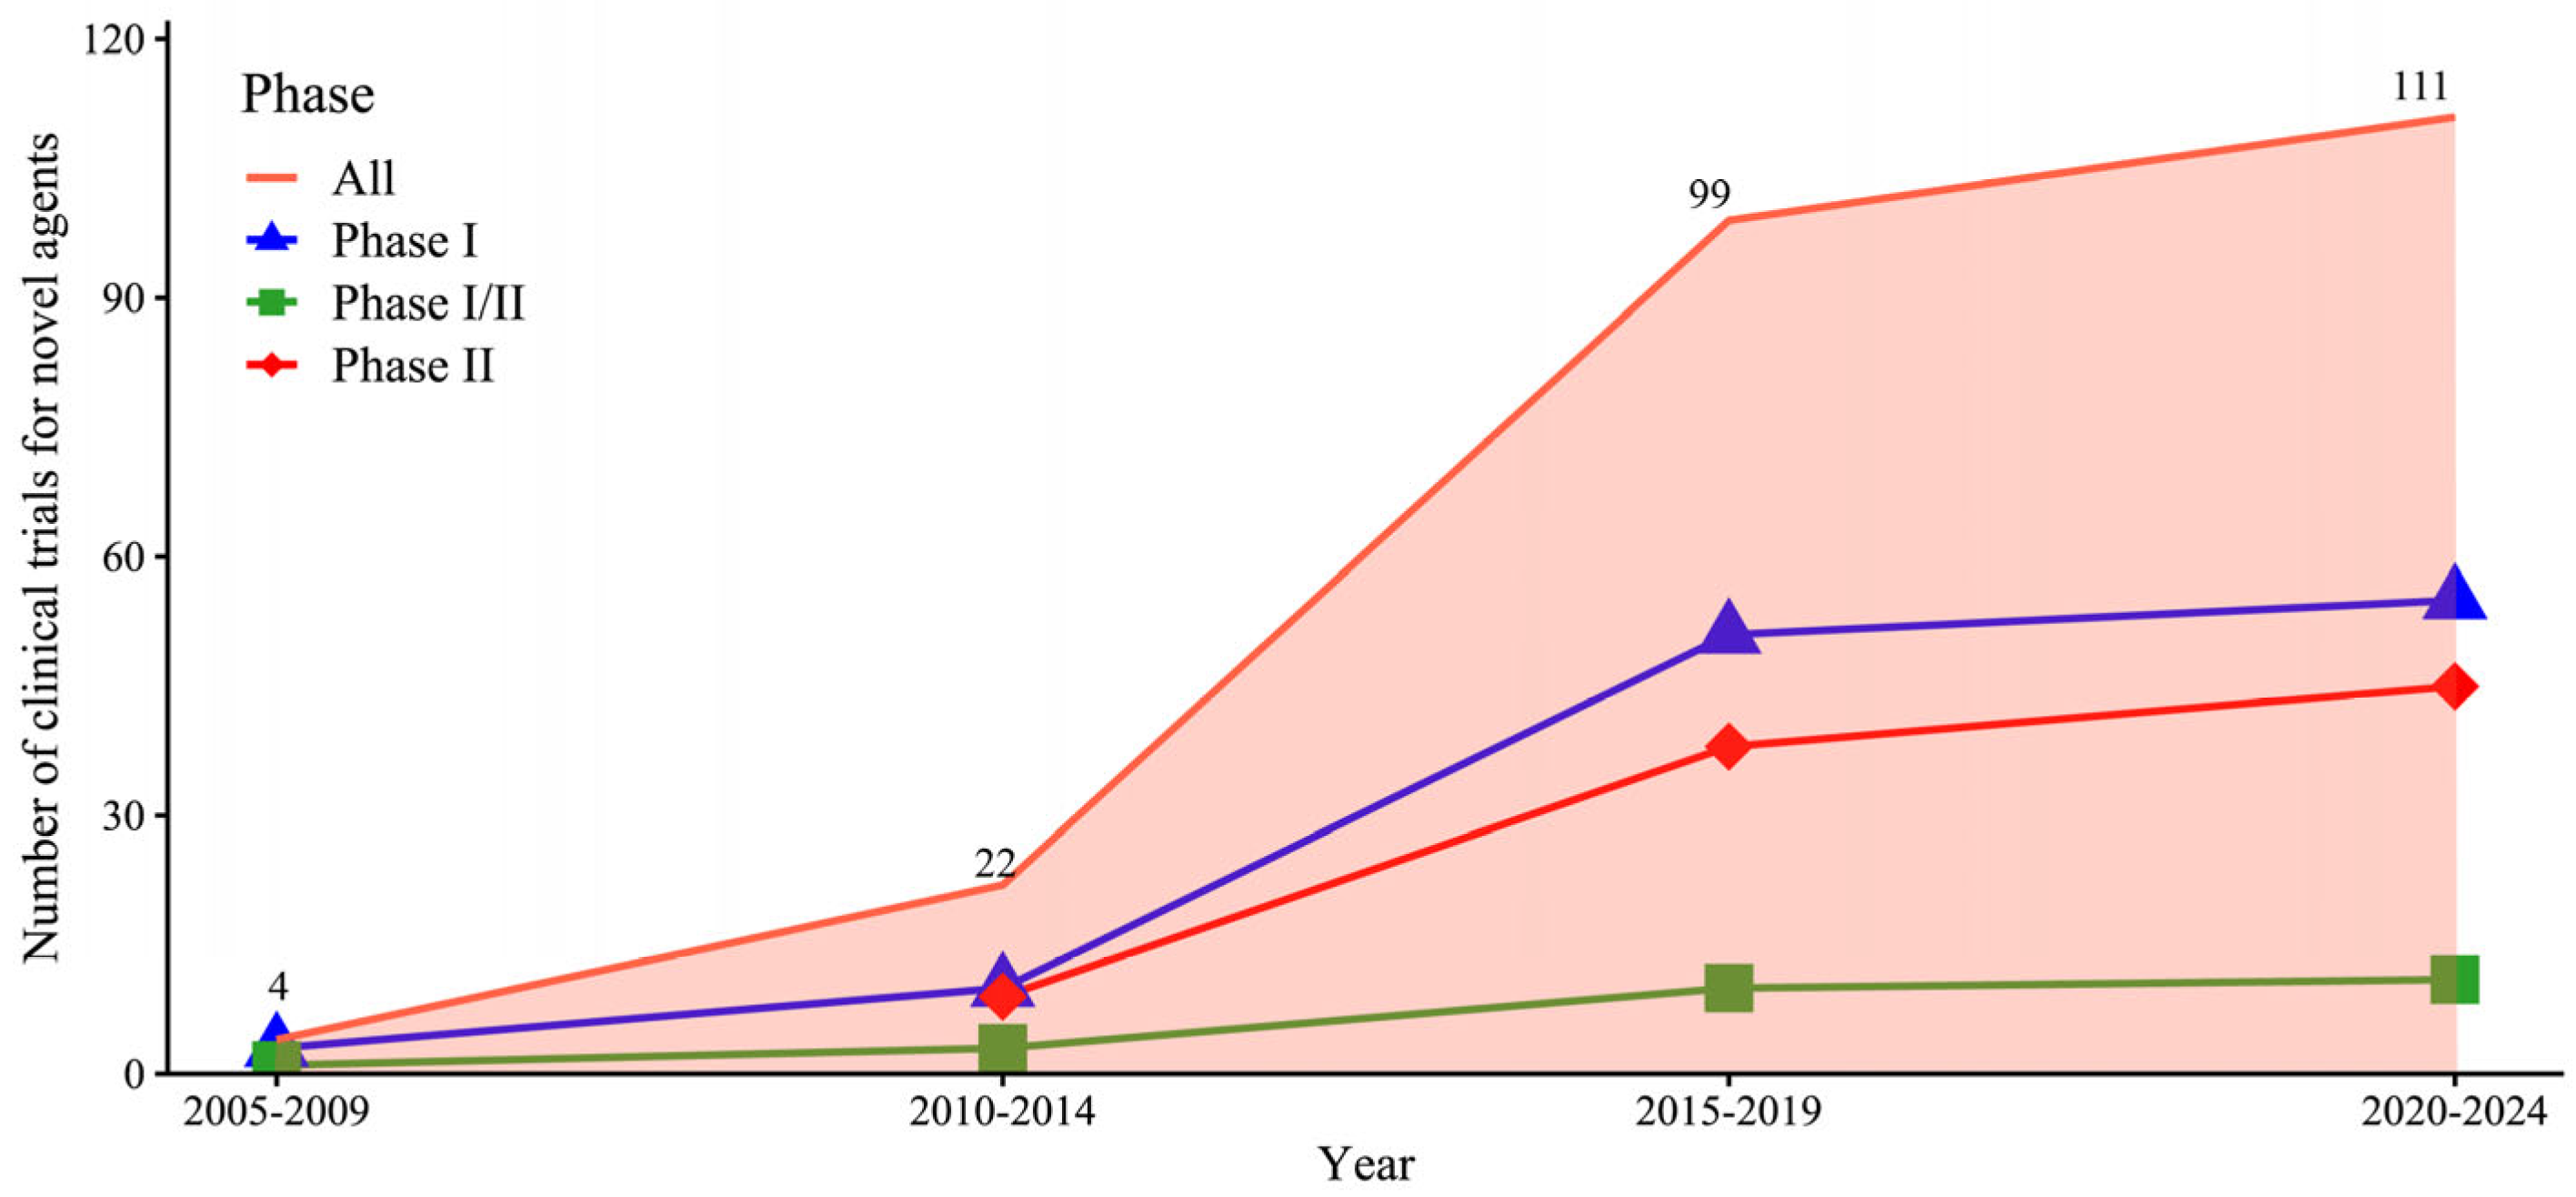
Figure 4.
The percentage distribution of novel drug types. (A) Distribution of novel drug types in phase I trials. (B) Distribution of novel drug types in Phase I/II trials. (C) Distribution of novel drug types in phase II trials. (D) Distribution of novel drug types advancing from phase I to phase II trials. Immune activators: Compounds that activate the innate immune system. annual growth of Phase I-II clinical trials of novel agents for CHB.
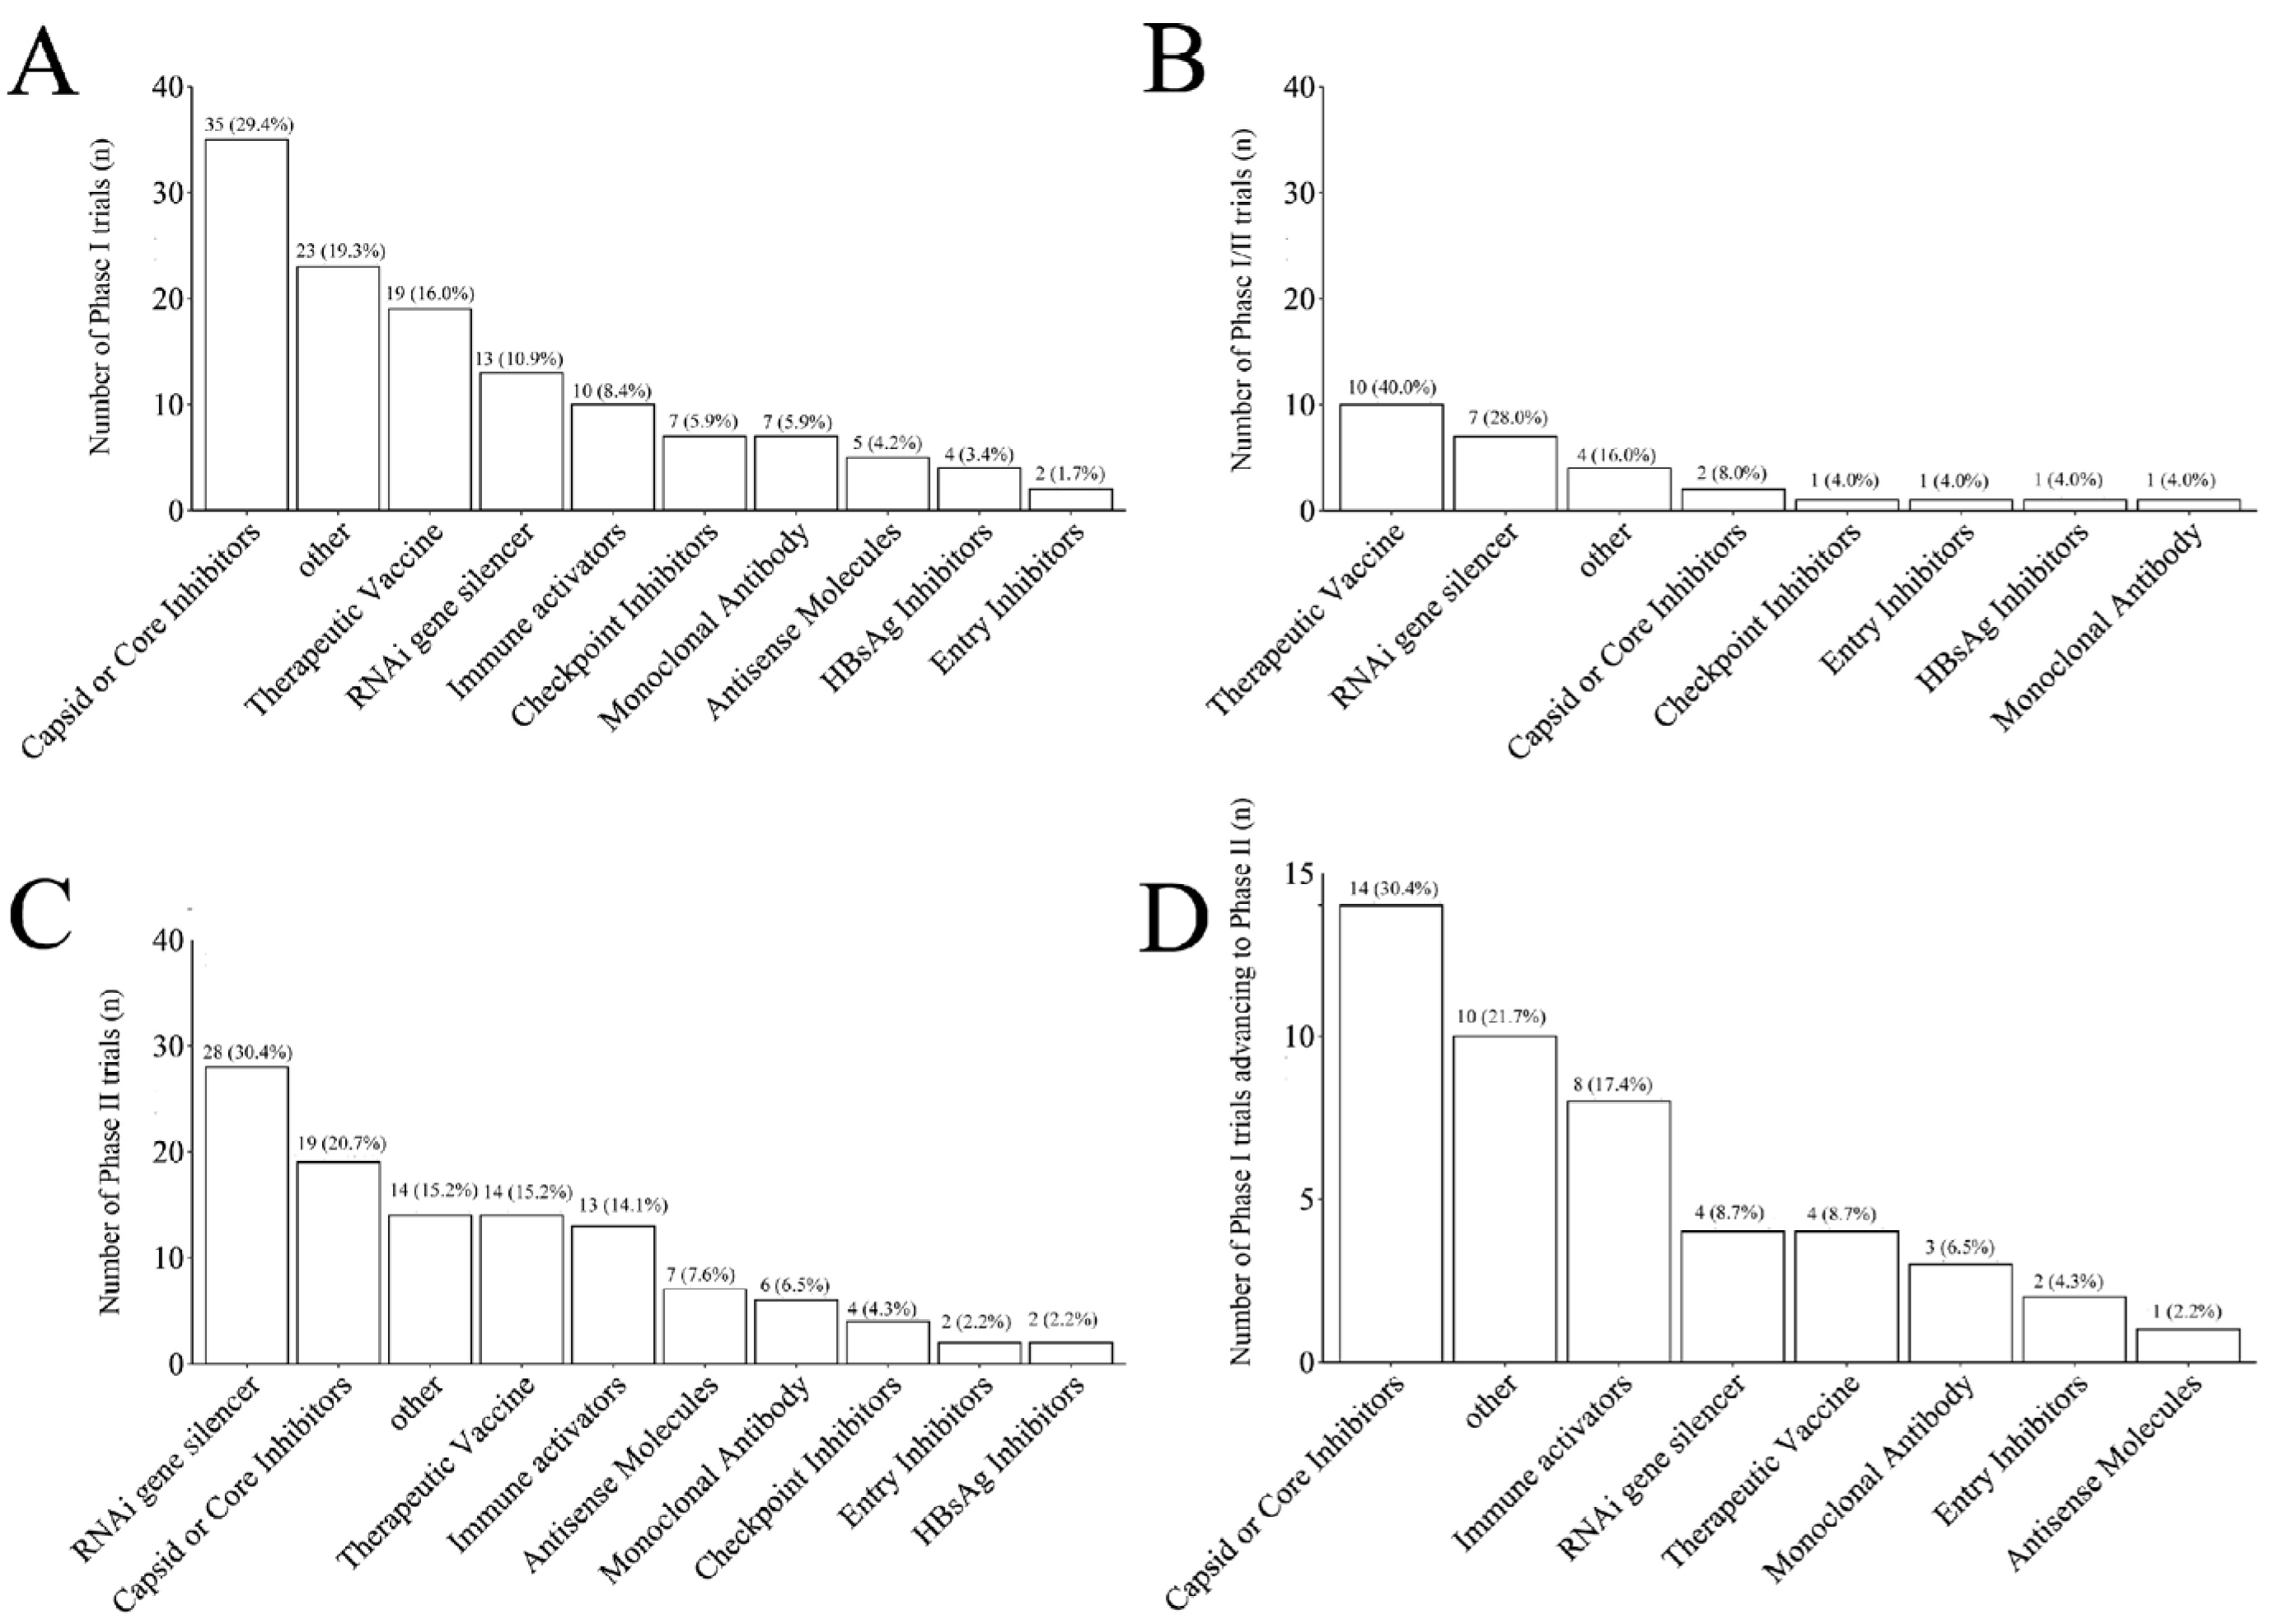
Figure 5.
Forest plot illustrating the efficacy of novel agents compared to the control group in clinical trials for CHB. Note: Two studies included multiple control groups or different populations, leading to a total of 25 study entries in the meta-analysis. Immune activators: Compounds that activate the innate immune system.
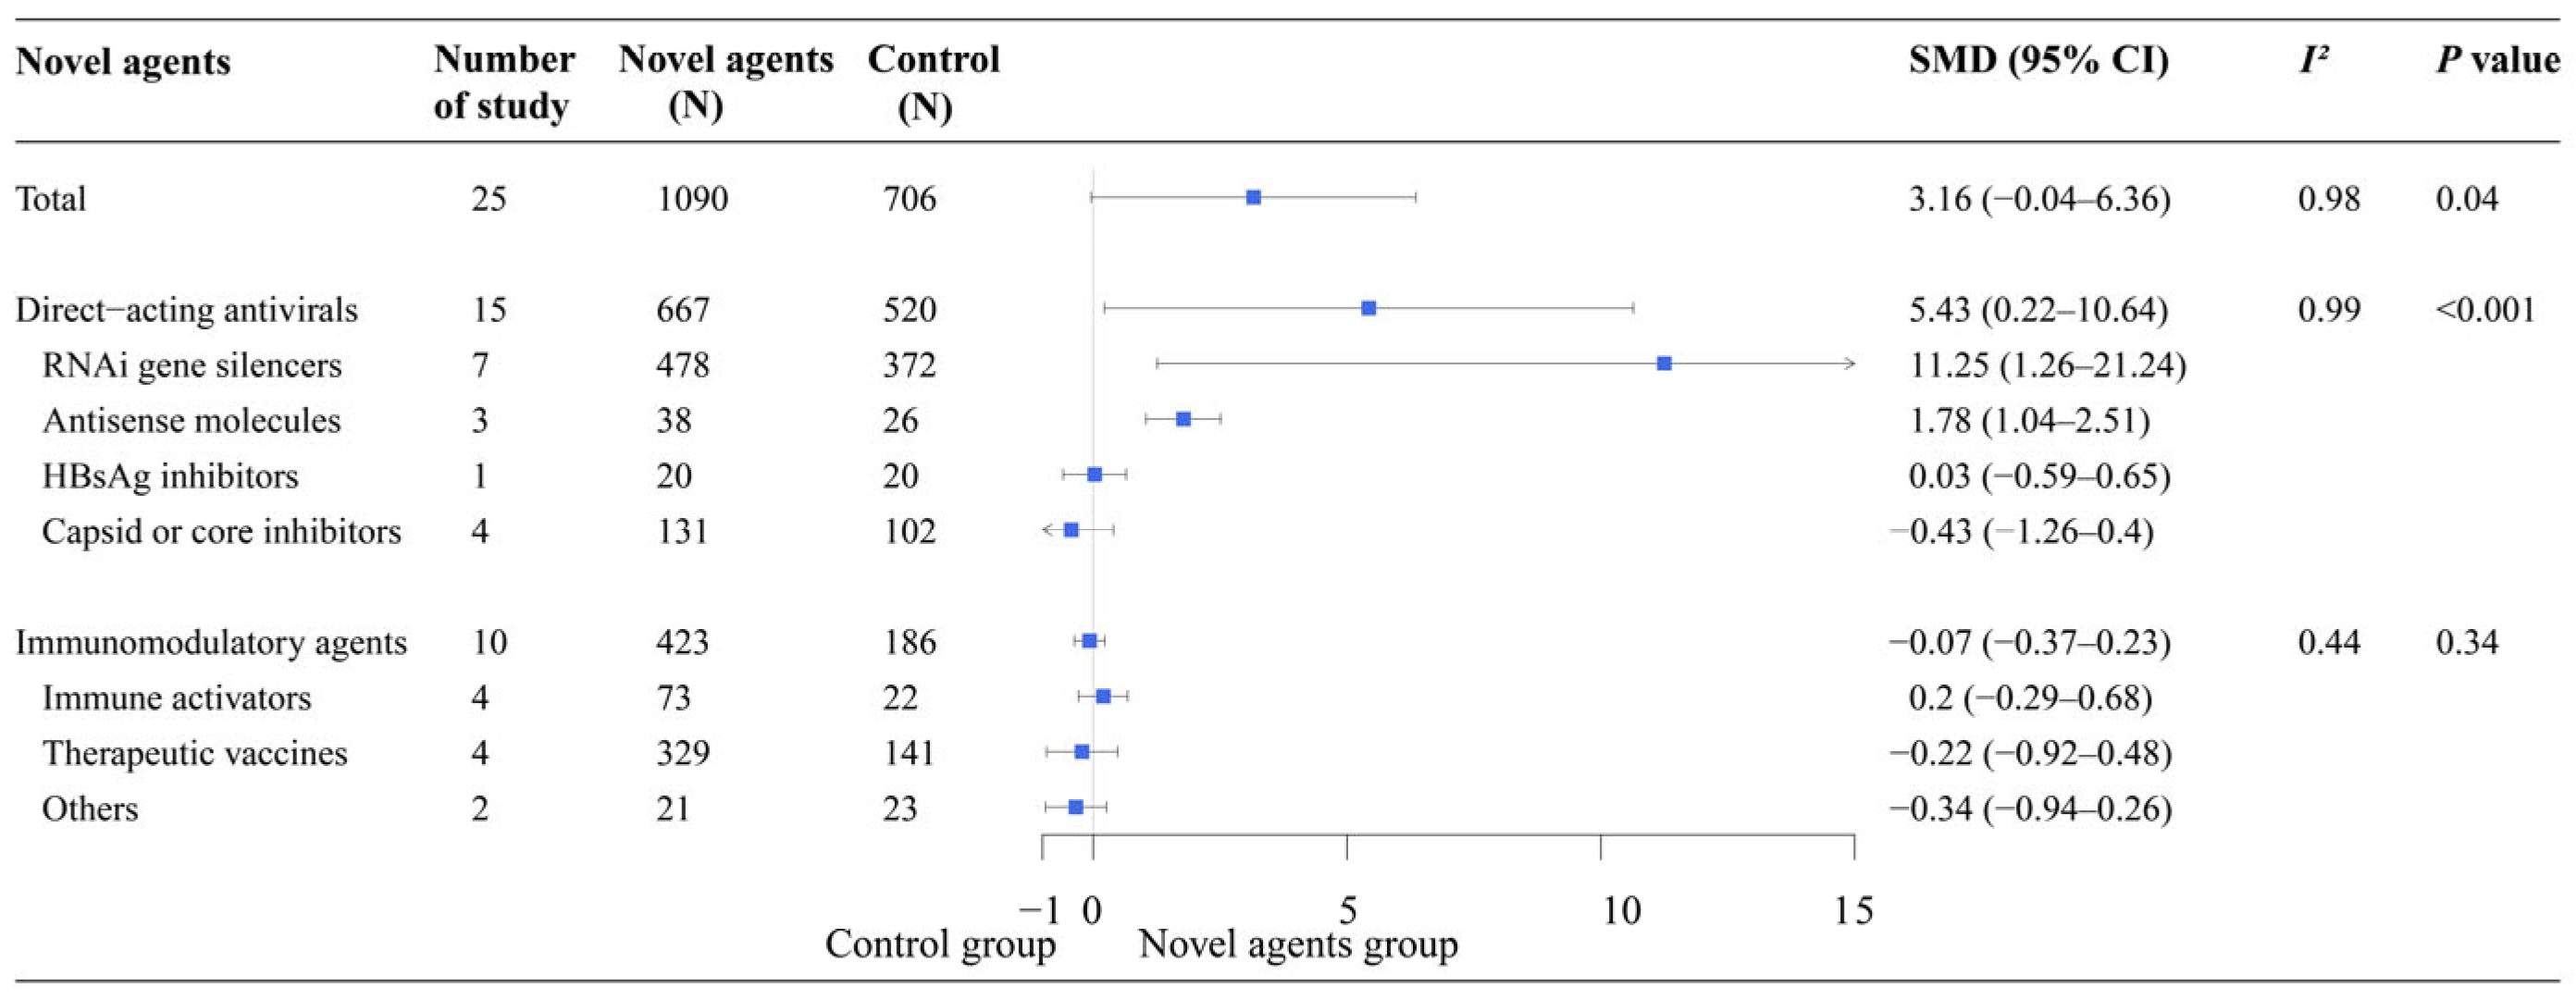

Table 1.
The status of phase I-III clinical trials of novel agents for CHB.
| Trial Status | I (N=119) | I/II (N=25) | II (N=92) | II/III (N=2) | III (N=6) |
|---|---|---|---|---|---|
| Active* | 14 (11.8%) |
8 (32.0%) | 14 (15.2%) |
None | 5 (83.3%) |
| Completed | 78 (65.5%) |
13 (52.0%) | 45 (48.9%) |
1 (50.0%) |
None |
| Terminated/Withdrawn | 17 (14.3%) |
3 (12.0%) |
21 (22.8%) |
1 (50.0%) | None |
| Unknown status | 10 (8.4%) |
1 (4.0%) |
12 (13.0%) |
None | 1 (16.7%) |
| Advanced to the next Phase | 46 (38.7%) |
2 (8.0%) |
4 (4.3%) |
None | None |
* The status of "Active" in the trial includes the categories "Active, not recruiting," "Recruiting," and "Not yet recruiting."
Table 2.
Design features of phases I - III clinical trials of novel agents for CHB.
| Design | I | I/II | II | II/III | III |
|---|---|---|---|---|---|
| Allocation (Non-Randomized/Randomized) | 19/90 | 5/16 | 7/76 | 0/2 | 0/6 |
| Intervention Model (Parallel/Single/Others) |
70/16/23 | 15/4/5 | 79/7/4 | 2/0/0 | 6/0/0 |
| Masking (Single/Double /Triple/Quadruple/Open) |
2/26/19/ 31/31 |
2/3/3/ 3/14 |
6/18/11/ 14/42 |
0/0/0/ 0/2 |
0/2/0/ 2/1 |
| Treatment (Combination/Monotherapy) |
22/97 | 9/16 | 72/20 | 1/1 | 0/6 |
| Control (Placebo/Active/ Dose-response#/None) |
76/13/ 12/18 |
9/6/ 4/6 |
20/46/ 8/18 |
0/1/ 0/1 |
4/2/ 0/0 |
| Duration of treatment (Median (P25; P75)) (Day) |
28 (14; 84) |
112 (28; 175) |
168 (105; 336) |
252 (210; 294) |
336 (210; 336) |
| Duration of follow-up (Median (P25; P75)) (Day) |
14 (0; 75) |
84 (0; 224) |
168 (0; 315) |
252 (210; 294) |
336 (336; 337) |
| Sample size (Median (P25; P75)) |
49 (28; 80) |
52 (32; 82) |
66 (36; 122) |
248 (241; 254) |
534 (494; 787) |
| Novel trial designs (Seamless/Adaptive/ Platform/Others) |
0/38/0/1 | 25/0/0/0 | 0/5/3/0 | 2/0/0/0 | 0/0/0/0 |
| Inclusion Criteria | |||||
| ALT (<2/<5/>5 ULN) | 11/8/4 | 2/2/2 | 17/12/3 | 2/0/0 | 5/0/1 |
| HBsAg (<1000/>100/ >1000 IU/mL) |
1/9/10 | 1/2/3 | 2/25/10 | 0/0/0 | 0/0/4 |
| Subject (CHB/HV/ CHB and HV) |
42/43/34 | 18/3/4 | 92/0/0 | 2/0/0 | 6/0/0 |
| CHB subject (TN/TE/Both) | 18/31/11 | 1/10/0 | 12/48/3 | 0/2/0 | 1/4/0 |
| HBeAg (Positive/ Negative/ Both) |
6/7/21 | 2/3/3 | 10/15/18 | 0/2/0 | 1/2/1 |
| HBV DNA (>20/ <20<100 IU/mL) |
22/13/7 | 8/3/2 | 28/24/8 | 0/0/2 | 2/0/4 |
| Primary Outcome | |||||
| AE/PK/Immunogenicity | 98/35/1 | 17/3/0 | 26/2/3 | 0/0/0 | 0/0/0 |
| LLOQ of HBsAg*/DNA | 0/0 | 1/3 | 18/14 | 0/2 | 6/4 |
| Decline of HBsAg/DNA/RNA | 4/5/0 | 6/2/0 | 54/9/2 | 0/0/0 | 0/1/0 |
| Secondary Outcome | |||||
| AE/PK/Immunogenicity | 12/72/20 | 5/7/5 | 31/39/7 | 1/0/2 | 0/0/0 |
| LLOQ of HBsAg*/ HBeAg/DNA |
22/12/4 | 14/11/2 | 66/44/30 | 0/0/0 | 4/0/4 |
| Decline of HBsAg/HBeAg/DNA/RNA | 49/17/ 28/8 |
18/3/ 7/1 |
87/20/ 41/12 |
2/2/ 0/0 |
0/0/ 0/0 |
AE, Adverse Event; CHB, Chronic Hepatitis B; HV, Healthy Volunteers; LLOQ, Lower Limit of Quantification; PK, Pharmacokinetics; TE, Treatment-experienced; TN, Treatment-naïve; ULN, Limit of Normal. # The control refers to comparisons between different doses of novel drugs. * In Phase I/II trials, the outcomes were HBsAg loss or seroconversion, while in Phase III trials, the outcome was functional cure.
Table 3.
Stepwise multivariate Cox proportional hazards analysis of risk factors for the completion of phase I and phase II trials, stratified by factors that violated the proportional hazards assumption.
Table 3.
Stepwise multivariate Cox proportional hazards analysis of risk factors for the completion of phase I and phase II trials, stratified by factors that violated the proportional hazards assumption.
| Variables | Phase I | Phase II | ||
|---|---|---|---|---|
| HR (95% CI) | P-value | HR (95% CI) | P-value | |
| Sample size | 0.980 (0.966, 0.994) | 0.005 | 0.994 (0.988, 0.999) | 0.037 |
| Treatment duration | 0.992 (0.986, 0.998) | 0.011 | - | - |
| Novel design | ||||
| No | Ref | 0.992 | Ref | 0.574 |
| Yes | 1.003 (0.465, 2.169) | 0.582 (0.089, 3.831) | ||
Disclaimer/Publisher’s Note: The statements, opinions and data contained in all publications are solely those of the individual author(s) and contributor(s) and not of MDPI and/or the editor(s). MDPI and/or the editor(s) disclaim responsibility for any injury to people or property resulting from any ideas, methods, instructions or products referred to in the content. |
© 2025 by the authors. Licensee MDPI, Basel, Switzerland. This article is an open access article distributed under the terms and conditions of the Creative Commons Attribution (CC BY) license (http://creativecommons.org/licenses/by/4.0/).
Copyright: This open access article is published under a Creative Commons CC BY 4.0 license, which permit the free download, distribution, and reuse, provided that the author and preprint are cited in any reuse.


