
Submitted:
29 April 2025
Posted:
29 April 2025
You are already at the latest version
Abstract
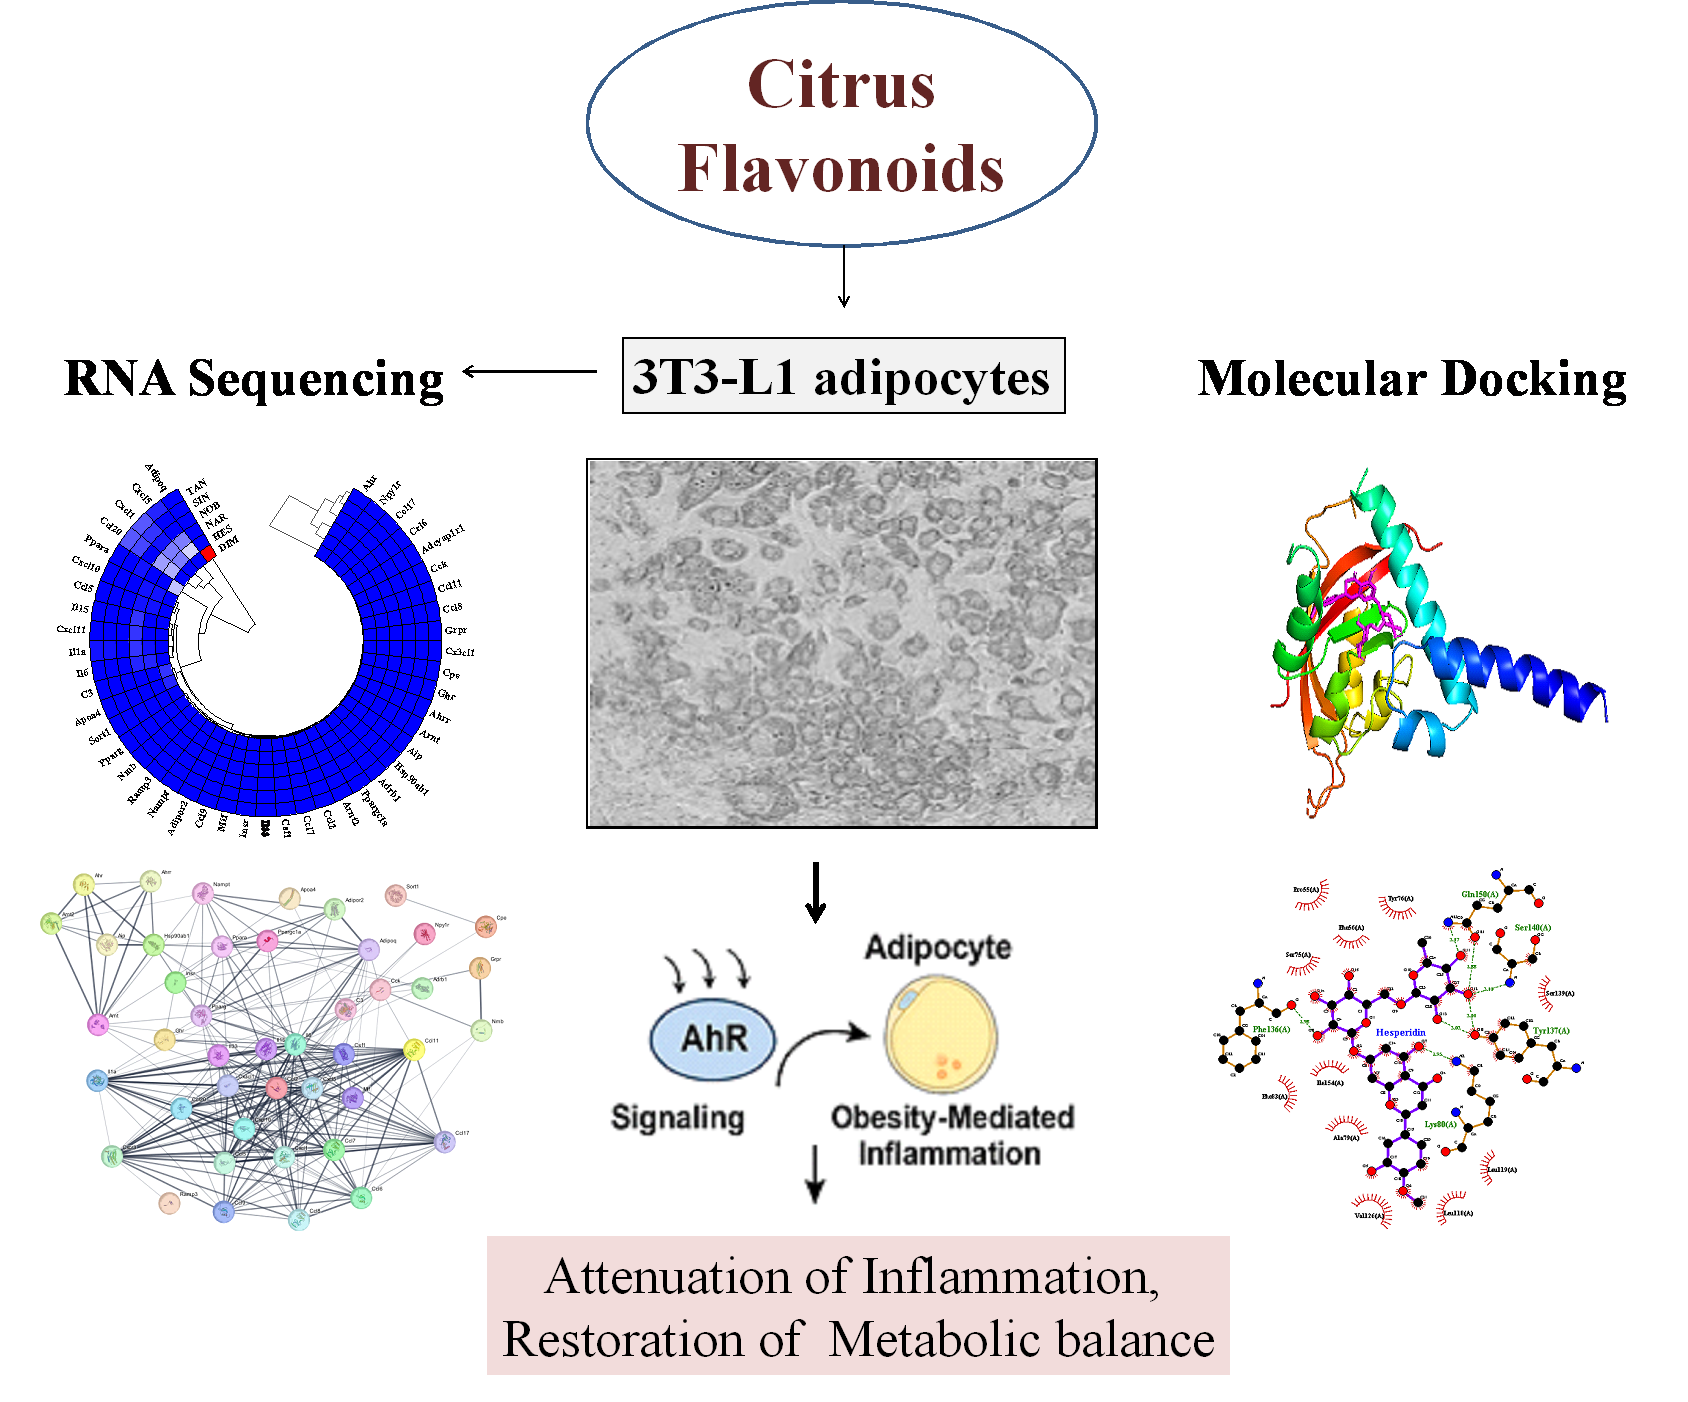
The aryl hydrocarbon receptor (AhR) plays a crucial role in obesity-associated inflammation and metabolic dysfunction. This study investigates the transcriptomic and structural effects of citrus-derived flavonoids—hesperidin (HES), narirutin (NAR), nobiletin (NOB), sinensetin (SIN), and tangeretin (TAN)—on AhR signaling in 3T3-L1 adipocytes. Adipocyte differentiation was induced in preadipocytes to establish a differentiated adipocyte model (DIM) for subsequent analyses. Flavonoids were applied during the differentiation period. RNA sequencing identified 23,282 expressed genes, among which 1,134 were commonly upregulated, 1,501 downregulated, and 343 contra-regulated across all flavonoid treatments. Compared to the Normal group (undifferentiated preadipocytes), the DIM group exhibited the highest number of uniquely modulated genes, indicating a robust transcriptional response. Gene ontology and pathway enrichment analyses highlighted involvement in AhR signaling, adipogenesis, cytokine–cytokine receptor interactions, and chemokine signaling. Protein–protein interaction (PPI) network analysis identified central hub genes involved in AhR signaling and metabolic regulation, including Ahr, Arnt2, Pparg, IL-6, and Ccl20. Molecular docking simulations revealed strong binding affinities of HES (−8.9 kcal/mol) and NAR (−8.7 kcal/mol) to AhR, stabilized by hydrogen bonds and hydrophobic interactions at conserved residues Ser140, Gln150, and Tyr137. These integrative findings suggest that citrus flavonoids, particularly HES and NAR, function as selective AhR modulators capable of attenuating inflammation and restoring metabolic balance in obesity-related adipocyte dysfunction.
Keywords:
Aryl hydrocarbon receptor (AHR)
; Flavonoids
; Hesperidin
; Narirutin
; Obesity
; Inflammation
; 3T3-L1 adipocytes
1. Introduction
The aryl hydrocarbon receptor is a ligand-activated transcription factor that plays a pivotal role in xenobiotic metabolism and immune responses [1,2]. The aryl hydrocarbon receptor, a member of the basic helix-loop-helix/Per-Arnt-Sim (bHLH/PAS) family, functions as a sensor, integrator, and transcription factor [3,4]. Among transcriptional regulators involved in this immune-metabolic imbalance, the aryl hydrocarbon receptor (AhR) has emerged as a key integrator of environmental and endogenous signals [5,6]. Its activation by diverse ligands, such as environmental toxins, endogenous metabolites, and microbial products, can lead to pro- or anti-inflammatory outcomes depending on the specific tissue context and ligand characteristics [5,7]. Notably, aberrant AhR signaling links to obesity-induced inflammation and metabolic dysfunction [2,8].
Obesity, a multifactorial metabolic disorder, has become a major global health concern. Beyond the accumulation of excess adipose tissue, it is characterized by systemic low-grade inflammation and profound metabolic dysregulation [9,10,11]. Obesity increases the risk of insulin resistance, type 2 diabetes, cardiovascular disease, nonalcoholic fatty liver disease, and certain cancers [9,12]. These widespread effects are driven by immune and hormonal imbalances, including altered adipokines signaling and immune cell activation, which impact multiple organs [10,11,12,13]. Adipose tissue functions as both an energy reservoir and an endocrine organ that secretes adipokines such as leptin, adiponectin, and resistin, which regulate appetite, insulin sensitivity, and immune responses [14,15,16]. In obesity, adipocyte hypertrophy triggers a shift in macrophage polarization from anti-inflammatory M2 to pro-inflammatory M1 phenotypes, promoting secretion of cytokines such as TNF-α, IL-6, and MCP-1 [17,18]. This pro-inflammatory microenvironment exacerbates systemic insulin resistance and disrupts lipid and glucose homeostasis.
Recent evidence suggests that certain dietary flavonoids, particularly those derived from citrus fruits, may modulate AhR activity [19,20]. Flavonoids such as hesperidin (HES), narirutin (NAR), nobiletin (NOB), sinensetin (SIN), and tangeretin (TAN) have demonstrated antioxidant, anti-inflammatory, and metabolic regulatory properties in preclinical studies [21,22]. However, the mechanisms by which these flavonoids interact with AhR and influence gene networks related to adipocyte inflammation and metabolism remain incompletely understood.
To address this gap, we investigated the regulatory effects of citrus flavonoids on AhR signaling in a cellular model of adipogenesis and inflammation. Transcriptomic profiling via RNA sequencing was used to characterize gene expression changes in 3T3-L1 adipocytes treated with each flavonoid. In parallel, molecular docking simulations were performed to examine the structural interactions between flavonoids and the AhR ligand-binding domain. By integrating transcriptomic and computational approaches, we aimed to elucidate how citrus flavonoids regulate gene networks and receptor interactions relevant to metabolic and inflammatory processes.
The present study used RNA sequencing and molecular docking to explore how citrus flavonoids influence aryl hydrocarbon receptor (AhR) signaling in 3T3-L1 adipocytes. Our integrated approach identified flavonoids as selective AhR modulators (SAhRMs), providing new insights into their potential role in reducing obesity-associated inflammation and supporting nutraceutical development for metabolic disorders.
2. Results
2.1. Differentially Expressed Genes in Flavonoid-Treated 3T3-L1 Adipocytes
RNA sequencing analysis identified 23,282 genes expressed in 3T3-L1 adipocytes treated with citrus flavonoids, including HES, NAR, NOB, SIN, and TAN. Differential expression analysis revealed distinct gene regulation patterns between the DIM group and Normal group. The DIM group exhibited the most extensive transcriptional changes, uniquely regulating 2,138 genes—1,470 upregulated and 668 downregulated—underscoring its substantial impact on adipocyte gene expression.
Comparison of DEGs between HES and NAR treatments identified 639 commonly upregulated genes, 747 commonly downregulated genes, and 231 contra-regulated genes, suggesting both shared and divergent transcriptomic responses (Figure 2A). Additionally, DIM group showed a separate cluster of 1,647 DEGs (1,124 upregulated and 523 downregulated), further confirming its distinct regulatory role. Intersection analysis of the polymethoxylated flavone subgroup (NOB, SIN, TAN) revealed 495 commonly upregulated genes, 754 downregulated genes, and 112 contra-regulated genes, indicating functional convergence within this subclass (Figure 2B).
Scatter plots of normalized gene expression (Figure S1) highlighted several DEGs with significant changes across treatment groups. Among them, Ahr, Adipoq, Pparg, IL-6, Il1a, Ccl2, and Cxcl10 displayed prominent treatment-specific expression profiles, reflecting modulation of genes involved in AhR signaling, adipogenesis, and inflammation.
Notably, a subset of 45 DEGs associated with AhR signaling, inflammation, and obesity exhibited distinct clustering patterns across flavonoid treatments. AhR related genes formed a separate cluster from those involved in metabolic and inflammatory responses, underscoring the central role of AhR in mediating flavonoid-induced transcriptomic changes in adipocytes (Figure 2C). Collectively, these findings underscore the diverse and complementary effects of citrus flavonoids on adipocyte transcriptomes, particularly through modulation of AhR -associated and immunometabolic signaling pathways.
2.2. Gene Ontology Analysis
Gene Ontology (GO) and differential gene expression analyses revealed that citrus flavonoids modulate biological processes, molecular functions, and cellular components associated with adipogenesis, inflammation, and AhR signaling. Among the experimental groups, the DIM group predominantly influenced adipogenesis-related genes (36%), HES NAR, and NOB exhibited balanced effects on adipogenic and inflammatory pathways (Figure 3A).
Notably, in the DIM group, AhR expression was significantly suppressed (0.416-fold) compared to the Normal group. However, treatment with HES and NAR restored AhR expression levels closer to those observed in the Normal group (0.988-fold and 1.214-fold, respectively), suggesting that these flavonoids may counteract differentiation-associated suppression of the AhR axis (Table 1). Key metabolic genes associated with obesity—including Adipoq, Apoa4, and Ppara—were significantly modulated. In particular, the DIM group exhibited a dramatic increase in Adipoq expression (~200-fold) and affected Pparg expression, indicating a potential role in improving adipocyte metabolic profiles. Notably, treatment with citrus flavonoids such as HES and NAR modulated the expression levels of these genes, suggesting that these compounds may influence adipocyte metabolism by regulating key adipogenic markers (Table 2). Inflammation-related genes such as Cxcl1, Cxcl5, Ccl20, and Il1a were highly upregulated by HES and NAR, while the DIM group showed suppression of pro-inflammatory targets including Cxcl5, Ccl17, Ccl2, Ccl5, and Il33 (Table 3).
GO enrichment analyses further supported these findings, highlighting significant regulation of biological processes (e.g., cellular response to stimuli, signal transduction, metabolic regulation; FDR ≤ 1.0e−18) (Figure 3B), molecular functions (e.g., cytokine activity, receptor binding, ligand interaction; FDR ≤ 1.0e−24) (Figure 3C), and cellular components (e.g., extracellular matrix, receptor complexes, AhR complex; FDR ≤ 1.0e−15) (Figure 3D).
2.3. Pathway Enrichment Analysis
Pathway enrichment analyses identified several biological pathways modulated by citrus flavonoids in 3T3-L1 adipocytes. KEGG analysis revealed significant enrichment in cytokine–cytokine receptor interaction, viral protein–cytokine interaction, and chemokine signaling pathways (FDR ≤ 1.0e−24) (Figure 4A). Reactome mapping showed activation of G protein-coupled receptor (GPCR) ligand binding, downstream signaling, and chemokine receptor pathways (FDR ≤ 1.0e−20) (Figure 4B). WikiPathways analysis emphasized chemokine signaling, adipogenesis, cytokine response, and inflammation (FDR ≤ 1.0e−16) (Figure 4C). STRING-based cluster enrichment identified modules related to CXCR signaling, JAK–STAT signaling, and the aryl hydrocarbon receptor (AhR) nuclear complex (FDR ≤ 1.0e−22) (Figure 4D). Collectively, these findings highlight the involvement of immune–metabolic pathways, with AhR signaling emerging as a key node in mediating flavonoid-induced responses in adipocytes.
2.4. Protein-Protein Interaction Network Analysis
STRING analysis identified gene networks associated with AhR, inflammation, and obesity (Figure 5). Central hub genes— AhR, Arnt2, Ccl20, Cxcl10, IL-6, and Adipoq—formed dense networks with regulatory overlap. AhR cofactors (Aip, Hsp90ab1, and Arnt) exhibited strong modular interactions, consistent with their known roles in xenobiotic metabolism. Metabolic regulators such as Pparg, Adipoq, Ppara, and Ramp3 displayed direct links with inflammatory genes IL-6, Il33, and Ccl2, are indicating immune–metabolic crosstalk. Notably, IL-6 emerged as a key connecting node. This network reinforces the convergence of AhR -driven gene regulation across inflammation and metabolism.
2.5. Molecular Docking Analysis
Molecular docking studies demonstrated that HES and NAR exhibited the strongest binding affinities to AhR, with docking scores of −8.9 and −8.7 kcal/mol, respectively. In contrast, NOB, SIN, and TAN showed comparatively lower affinities, ranging from −6.6 to −6.8 kcal/mol (Table 4; Figure 6).
HES and NAR formed hydrogen bonds with key amino acid residues within the AhR binding pocket, including Ser140, Gln150, Lys80, Phe136, and Tyr137. All tested flavonoids engaged in hydrophobic interactions with conserved residues such as Ser139, Tyr76, Ser75, Phe56, Ala79, Ile154, Leu118, Leu119, and Phe83. Notably, interactions with conserved residues like Tyr76, Phe83, and Phe136 suggest ligand specificity and potential functional relevance (Figure 6A and 6E). These structural interactions align with transcriptomic and network analyses, indicating that citrus flavonoids, particularly HES and NAR, may modulate AhR activity directly through binding. This mechanism potentially underpins their observed anti-inflammatory and anti-obesity effects, warranting further mechanistic exploration.
3. Discussion
Our study demonstrates that citrus-derived flavonoids modulate AhR-mediated signaling in 3T3-L1 adipocytes, thereby influencing downstream inflammatory and metabolic responses. Through transcriptomic analysis, flavonoids—particularly HES and NAR—were found to regulate gene clusters associated with adipogenesis, cytokine signaling, and AhR pathways [2,25]. Flavonoid treatment led to the upregulation of Arnt2 and partial restoration of Ahr expression, which had been suppressed during adipocyte differentiation. This regulatory pattern suggests that HES and NAR may function as selective AhR modulators (SAhRMs), consistent with prior findings on dietary polyphenols [26,27]. Importantly, these compounds downregulated pro-inflammatory mediators such as IL-6, Il1a, Ccl2, and Ccl20, confirming their anti-inflammatory potential [27,28]. Notably, Adipoq, Pparg, and Ppara—key genes involved in lipid metabolism and insulin sensitivity—were also upregulated, indicating improved metabolic homeostasis [29,30,31]. These effects were further supported by GO and pathway enrichment analyses, which identified cytokine–cytokine receptor interactions, GPCR signaling, and AhR nuclear complex as significantly enriched pathways. In particular, GPCR ligand binding was recognized as an enriched Reactome pathway, highlighting the role of GPCR-mediated signal transduction in adipocyte inflammatory and metabolic regulation [29]. This is supported by previous reports demonstrating that GPCRs transmit extracellular cues, including chemokines and hormones, into intracellular cascades linked to obesity and inflammation [32]. Taken together with cytokine receptor and JAK–STAT pathway enrichment, these findings suggest a convergence of AhR signaling with canonical immune regulatory axes, such as NF-κB and JAK–STAT [33,34], both of which are central to metabolic inflammation. Beyond the AhR nuclear complex, STRING-based cluster enrichment also implicated chemokine receptor binding, CXCR signaling, and the JAK–STAT axis [5,35]. This network-level overlap illustrates a multifaceted interplay between AhR modulation by flavonoids and immune signaling cascades, suggesting that citrus flavonoids regulate both inflammatory and metabolic responses through convergent transcriptional hubs [36,37]. STRING-based PPI network analysis revealed IL-6 and Pparg as central hubs bridging inflammatory and adipogenic modules. It was demonstrated that AhR cofactors, including Arnt, Aip, and Hsp90ab1, form a cohesive regulatory unit. This supports the hypothesis that AhR is a key integrator of immune-metabolic responses in adipocytes [38,39,40,41]. Docking studies further validated that HES and NAR directly bind to AhR’s ligand-binding domain [42], forming hydrogen bonds and hydrophobic contacts with conserved residues Ser140, Gln150, and Tyr137. Previous studies have shown that the natural flavonoid Urolithin A interacts with the AhR [43]. These structural interactions align with transcriptomic trends, thereby reinforcing the proposed mechanism of action [43,44,45,46]. Together, our data support a model in which citrus flavonoids act as SAhRMs, modulating AhR signaling to suppress obesity-associated inflammation while promoting adipocyte metabolic health.
4. Materials and Methods
4.1. Chemicals and Reagents
Dulbecco’s Modified Eagle Medium (DMEM), fetal bovine serum (FBS), and penicillin-streptomycin were purchased from Thermo Fisher Scientific (Waltham, MA, USA). Flavonoids including HES, NAR, NOB, SIN, and TAN were obtained from Sigma-Aldrich (St. Louis, MO, USA). Other reagents such as 3-isobutyl-1-methylxanthine (IBMX), dexamethasone, bovine serum albumin (BSA), and insulin were also procured from Sigma-Aldrich. All reagents used were of analytical grade.
4.2. 3T3-L1 Cell Culture and Differentiation
Mouse 3T3-L1 preadipocytes (KCLB-42835, Korean Cell Line Bank, Seoul, Korea) were seeded in 6-well plates at a density of 3 × 10³ cells/well and maintained in DMEM containing 10% FBS and 1% penicillin-streptomycin under standard conditions (37°C, 5% CO₂). Upon reaching confluence, adipocyte differentiation was induced using a two-step protocol [23]. First, cells were treated for 24 h with differentiation induction medium composed of DMEM supplemented with 10% FBS, 0.5 mM IBMX, 0.5 µM dexamethasone, and 10 µg/mL insulin. This was followed by 48 h of treatment with differentiation progression medium containing DMEM, 10% FBS, and 10 µg/mL insulin. Cells were then maintained in DMEM with 10% FBS, refreshed every 2 days, until full differentiation. In this study, Cells maintained in an undifferentiated state were referred to as the 'Normal' group, whereas those subjected to the full adipogenic differentiation protocol were designated as the 'DIM' group. Flavonoid treatment groups (e.g., HES group) received the respective compound during the differentiation period. Chemical structures of the flavonoids are presented in Figure 1A, and the experimental timeline is illustrated in Figure 1B.
4.3. RNA Sequencing and Data Analysis
Total RNA was extracted using the Easy-BLUE Total RNA Extraction Kit (iNtRON Biotechnology, Seongnam, Korea). RNA quality was assessed using an Agilent 2100 Bioanalyzer (Agilent Technologies, Santa Clara, CA, USA). Library preparation was performed [23] with the QuantSeq 3′ mRNA-Seq Library Prep Kit (Lexogen, Vienna, Austria), and sequencing was conducted on an Illumina NextSeq 500 platform (Illumina, CA, USA). Raw reads were aligned using Bowtie2 (v2.1.0), and differential gene expression analysis was performed using the EdgeR package (v3.2.2) in R (Bioconductor). Data normalization was conducted using the quantile method in Genowiz software (version 4.0.5.6, Ocimum Biosolutions, India). Genes were categorized based on annotation information from the Medline database provided by the National Center for Biotechnology Information (NCBI, Maryland, USA).
4.4. Gene Ontology and Pathway Enrichment Analysis
Differentially expressed genes (DEGs) were identified using the EdgeR package (v3.2.2) in R (Bioconductor) and filtered with thresholds of false discovery rate (FDR) ≤ 0.001 and absolute log₂ fold change ≥ 2. DEGs were subjected to Gene Ontology (GO) and pathway enrichment analyses using the Kyoto Encyclopedia of Genes and Genomes (KEGG), Reactome, WikiPathways, and local network cluster enrichment via the STRING database (v11.0; https://string-db.org). Enrichment was assessed within GO level 4 terms, spanning biological process, molecular function, and cellular component categories. Significance was determined using Fisher’s exact test followed by Holm–Bonferroni correction, and the top 10 enriched GO terms and pathways were reported. Gene expression clustering was performed using the k-means method based on relative expression levels.
4.5. Protein–Protein Interaction Network Analysis
DEGs identified in trait-linked hub modules were subjected to protein–protein interaction (PPI) network construction using the web-based STRING database (v11.0; https://string-db.org). Interactions were constructed using a medium confidence threshold (interaction score > 0.4) and visualized using Cytoscape software (v3.8.2). Hub genes were identified based on network centrality metrics, and overlapping DEGs across treatment groups were designated as hub DEGs. These hub genes were subsequently used to define functional gene clusters.
4.6. Molecular Docking Analysis
The crystal structure of the AhR ligand-binding domain (PDB ID: 5NJ8) was retrieved from the RCSB Protein Data Bank (https://www.rcsb.org/). Water molecules and unwanted heteroatoms were removed to prepare the receptor structure. Three-dimensional structures of HES, NAR, NOB, SIN, and TAN were downloaded from PubChem (https://pubchem.ncbi.nlm.nih.gov) in SDF format and converted using Open Babel [23]. Molecular docking was conducted using PyRx software (v0.8, The Scripps Research Institute, CA) with AutoDock Vina [24]. A grid box (25 Å × 29 Å × 35 Å) was defined around the ligand-binding site based on key active residues. Best poses were selected based on the lowest binding energies and stable interactions. Hydrogen bonding and hydrophobic interactions were visualized using PyMOL (v2.5.0; Schrödinger, NY), UCSF Chimera, and LigPlot+ software.
5. Conclusions
This study provides compelling evidence that citrus flavonoids—especially hesperidin and narirutin—selectively modulate AhR signaling and downstream gene networks in adipocytes. Through an integrated analysis of RNA sequencing, pathway enrichment, PPI networks, and molecular docking, we identified a dual mechanism by which these compounds suppress inflammation and enhance lipid metabolism. These findings advance our understanding of how dietary flavonoids, through AhR -centered immunometabolic regulation, may serve as nutraceuticals for managing obesity-associated inflammation and metabolic dysfunction.
Supplementary Materials
The following supporting information can be downloaded at the website of this paper posted on Preprints.org, Figure S1: title; Table S1: title; Video S1: title.
Author Contributions
Conceptualization: P.N, Y.J.L; Data curation: P.N; Investigation: P.N, Y.J.L; Resources: Y.J.L; Software: R.P, Y.A.J.; Supervision: Y.J.L.; S.S.K; Visualization: P.N, Y.J.L; Writing-original draft: P.N; Writing-review & editing: Y.A.J, R.P. All authors have read and agreed to the published version of the manuscript.
Funding
This research received no external funding.
Institutional Review Board Statement
Not applicable
Informed Consent Statement
Not applicable
Data Availability Statement
We encourage all authors of articles published in MDPI journals to share their research data. In this section, please provide details regarding where data supporting reported results can be found, including links to publicly archived datasets analyzed or generated during the study. Where no new data were created, or where data is unavailable due to privacy or ethical restrictions, a statement is still required. Suggested Data Availability Statements are available in section “MDPI Research Data Policies” at https://www.mdpi.com/ethics.
Acknowledgments
The authors declare no acknowledgements
Conflicts of Interest
The authors declare no conflicts of interest
Abbreviations
The following abbreviations are used in this manuscript:
| AhR | Aryl Hydrocarbon Receptor |
| DEGs | Differentially expressed genes |
| DIM | Differentiated adipocyte model |
| FDR | False discovery rate |
| GO | Gene ontology |
| HES | Hesperidin |
| KEGG | Kyoto Encyclopedia of Genes and Genomes |
| NAR | Narirutin |
| NOB | Nobiletin |
| PPI | Protein–protein interaction |
| SAhRMs | Selective AhR modulators |
| SIN | Sinensetin |
| STRING | Search Tool for the Retrieval of Interacting Genes/Proteins |
| TAN | Tangeretin |
References
- Xu, C.X.; Wang, C.; Zhang, Z.M.; Jaeger, C.D.; Krager, S.L.; Bottum, K.M.; Liu, J.; Liao, D.F.; Tischkau, S.A. Aryl hydrocarbon receptor deficiency protects mice from diet-induced adiposity and metabolic disorders through increased energy expenditure. Int J Obes (Lond) 2015, 39, 1300–1309. [Google Scholar] [CrossRef]
- Bock, K.W. Aryl hydrocarbon receptor (AHR), integrating energy metabolism and microbial or obesity-mediated inflammation. Biochem Pharmacol 2021, 184, 114346. [Google Scholar] [CrossRef]
- Beischlag, T.V.; Luis Morales, J.; Hollingshead, B.D.; Perdew, G.H. The aryl hydrocarbon receptor complex and the control of gene expression. Crit Rev Eukaryot Gene Expr 2008, 18, 207–250. [Google Scholar] [CrossRef] [PubMed]
- Tian, J.; Feng, Y.; Fu, H.; Xie, H.Q.; Jiang, J.X.; Zhao, B. The Aryl Hydrocarbon Receptor: A Key Bridging Molecule of External and Internal Chemical Signals. Environ Sci Technol 2015, 49, 9518–9531. [Google Scholar] [CrossRef] [PubMed]
- Guarnieri, T.; Abruzzo, P.M.; Bolotta, A. More than a cell biosensor: aryl hydrocarbon receptor at the intersection of physiology and inflammation. Am J Physiol Cell Physiol 2020, 318, C1078–C1082. [Google Scholar] [CrossRef]
- Xu, L.; Lin, L.; Xie, N.; Chen, W.; Nong, W.; Li, R. Role of aryl hydrocarbon receptors in infection and inflammation. Front Immunol 2024, 15, 1367734. [Google Scholar] [CrossRef] [PubMed]
- Shinde, R.; McGaha, T.L. The Aryl Hydrocarbon Receptor: Connecting Immunity to the Microenvironment. Trends Immunol 2018, 39, 1005–1020. [Google Scholar] [CrossRef]
- Rothhammer, V.; Quintana, F.J. The aryl hydrocarbon receptor: an environmental sensor integrating immune responses in health and disease. Nat Rev Immunol 2019, 19, 184–197. [Google Scholar] [CrossRef]
- Khanna, D.; Khanna, S.; Khanna, P.; Kahar, P.; Patel, B.M. Obesity: A Chronic Low-Grade Inflammation and Its Markers. Cureus 2022, 14, e22711. [Google Scholar] [CrossRef]
- Esser, N.; Legrand-Poels, S.; Piette, J.; Scheen, A.J.; Paquot, N. Inflammation as a link between obesity, metabolic syndrome and type 2 diabetes. Diabetes Res Clin Pract 2014, 105, 141–150. [Google Scholar] [CrossRef]
- Saltiel, A.R.; Olefsky, J.M. Inflammatory mechanisms linking obesity and metabolic disease. J Clin Invest 2017, 127, 1–4. [Google Scholar] [CrossRef] [PubMed]
- Wen, X.; Zhang, B.; Wu, B.; Xiao, H.; Li, Z.; Li, R.; Xu, X.; Li, T. Signaling pathways in obesity: mechanisms and therapeutic interventions. Signal Transduct Target Ther 2022, 7, 298. [Google Scholar] [CrossRef] [PubMed]
- Chen, L.; Chen, R.; Wang, H.; Liang, F. Mechanisms Linking Inflammation to Insulin Resistance. Int J Endocrinol 2015, 2015, 508409. [Google Scholar] [CrossRef] [PubMed]
- Zatterale, F.; Longo, M.; Naderi, J.; Raciti, G.A.; Desiderio, A.; Miele, C.; Beguinot, F. Chronic Adipose Tissue Inflammation Linking Obesity to Insulin Resistance and Type 2 Diabetes. Front Physiol 2019, 10, 1607. [Google Scholar] [CrossRef]
- Chavakis, T.; Alexaki, V.I.; Ferrante, A.W., Jr. Macrophage function in adipose tissue homeostasis and metabolic inflammation. Nat Immunol 2023, 24, 757–766. [Google Scholar] [CrossRef]
- Li, X.; Ren, Y.; Chang, K.; Wu, W.; Griffiths, H.R.; Lu, S.; Gao, D. Adipose tissue macrophages as potential targets for obesity and metabolic diseases. Front Immunol 2023, 14, 1153915. [Google Scholar] [CrossRef]
- Debnath, M.; Agrawal, S.; Agrawal, A.; Dubey, G.P. Metaflammatory responses during obesity: Pathomechanism and treatment. Obes Res Clin Pract 2016, 10, 103–113. [Google Scholar] [CrossRef]
- Jin, X.; Qiu, T.; Li, L.; Yu, R.; Chen, X.; Li, C.; Proud, C.G.; Jiang, T. Pathophysiology of obesity and its associated diseases. Acta Pharm Sin B 2023, 13, 2403–2424. [Google Scholar] [CrossRef]
- Murray, I.A.; Perdew, G.H. How Ah Receptor Ligand Specificity Became Important in Understanding Its Physiological Function. Int J Mol Sci 2020, 21. [Google Scholar] [CrossRef]
- Bock, K.W. Aryl hydrocarbon receptor (AHR) functions: Balancing opposing processes including inflammatory reactions. Biochem Pharmacol 2020, 178, 114093. [Google Scholar] [CrossRef]
- Parhiz, H.; Roohbakhsh, A.; Soltani, F.; Rezaee, R.; Iranshahi, M. Antioxidant and anti-inflammatory properties of the citrus flavonoids hesperidin and hesperetin: an updated review of their molecular mechanisms and experimental models. Phytother Res 2015, 29, 323–331. [Google Scholar] [CrossRef]
- Benavente-García, O.; Castillo, J.; Marin, F.R.; Ortuño, A.; Del Río, J.A. Uses and properties of citrus flavonoids. Journal of agricultural and food chemistry 1997, 45, 4505–4515. [Google Scholar] [CrossRef]
- Natraj, P.; Rajan, P.; Jeon, Y.A.; Kim, S.S.; Lee, Y.J. Antiadipogenic effect of citrus flavonoids: Evidence from RNA sequencing analysis and activation of AMPK in 3T3-L1 adipocytes. Journal of Agricultural and Food Chemistry 2023, 71, 17788–17800. [Google Scholar] [CrossRef]
- Rajan, P.; Natraj, P.; Ranaweera, S.S.; Dayarathne, L.A.; Lee, Y.J.; Han, C.-H. Anti-adipogenic effect of the flavonoids through the activation of AMPK in palmitate (PA)-treated HepG2 cells. Journal of Veterinary Science 2021, 23, e4. [Google Scholar] [CrossRef] [PubMed]
- Pohjanvirta, R. AHR in energy balance regulation. Current Opinion in Toxicology 2017, 2, 8–14. [Google Scholar] [CrossRef]
- Jin, U.-H.; Park, H.; Li, X.; Davidson, L.A.; Allred, C.; Patil, B.; Jayaprakasha, G.; Orr, A.A.; Mao, L.; Chapkin, R.S. Structure-dependent modulation of aryl hydrocarbon receptor-mediated activities by flavonoids. Toxicological Sciences 2018, 164, 205–217. [Google Scholar] [CrossRef]
- Bungsu, I.; Kifli, N.; Ahmad, S.R.; Ghani, H.; Cunningham, A.C. Herbal Plants: The Role of AhR in Mediating Immunomodulation. Front Immunol 2021, 12, 697663. [Google Scholar] [CrossRef]
- Goya-Jorge, E.; Jorge Rodriguez, M.E.; Veitia, M.S.; Giner, R.M. Plant Occurring Flavonoids as Modulators of the Aryl Hydrocarbon Receptor. Molecules 2021, 26. [Google Scholar] [CrossRef]
- Dou, H.; Duan, Y.; Zhang, X.; Yu, Q.; Di, Q.; Song, Y.; Li, P.; Gong, Y. Aryl hydrocarbon receptor (AhR) regulates adipocyte differentiation by assembling CRL4B ubiquitin ligase to target PPARgamma for proteasomal degradation. J Biol Chem 2019, 294, 18504–18515. [Google Scholar] [CrossRef]
- Zhang, S.; Cui, Y.; Gao, X.; Wei, C.; Wang, Q.; Yang, B.; Sun, W.; Luo, Y.; Jiang, Q.; Huang, Y. Resveratrol inhibits the formation and accumulation of lipid droplets through AdipoQ signal pathway and lipid metabolism lncRNAs. The Journal of Nutritional Biochemistry 2023, 117, 109351. [Google Scholar] [CrossRef]
- Peters, K.E.; Beilby, J.; Cadby, G.; Warrington, N.M.; Bruce, D.G.; Davis, W.A.; Davis, T.M.; Wiltshire, S.; Knuiman, M.; McQuillan, B.M. A comprehensive investigation of variants in genes encoding adiponectin (ADIPOQ) and its receptors (ADIPOR1/R2), and their association with serum adiponectin, type 2 diabetes, insulin resistance and the metabolic syndrome. BMC Medical Genetics 2013, 14, 1–12. [Google Scholar] [CrossRef] [PubMed]
- Li, H.Z.; Wu, H.; Song, K.K.; Zhao, H.H.; Tang, X.Y.; Zhang, X.H.; Wang, D.; Dong, S.L.; Liu, F.; Wang, J.; et al. Transcriptome analysis revealed enrichment pathways and regulation of gene expression associated with somatic embryogenesis in Camellia sinensis. Sci Rep 2023, 13, 15946. [Google Scholar] [CrossRef]
- Feng, X.; Weng, D.; Zhou, F.; Owen, Y.D.; Qin, H.; Zhao, J.; Wen, Y.; Huang, Y.; Chen, J.; Fu, H.; et al. Activation of PPARgamma by a Natural Flavonoid Modulator, Apigenin Ameliorates Obesity-Related Inflammation Via Regulation of Macrophage Polarization. EBioMedicine 2016, 9, 61–76. [Google Scholar] [CrossRef]
- Snyder, M.; Wang, Z.; Lara, B.; Fimbres, J.; Pichardo, T.; Mazzilli, S.; Khan, M.M.; Duggineni, V.K.; Monti, S.; Sherr, D.H. The aryl hydrocarbon receptor controls IFN-γ-induced immune checkpoints PD-L1 and IDO via the JAK/STAT pathway in lung adenocarcinoma. The Journal of Immunology 2025, 214, 413–432. [Google Scholar] [CrossRef]
- Ishihara, Y.; Kado, S.Y.; Bein, K.J.; He, Y.; Pouraryan, A.A.; Urban, A.; Haarmann-Stemmann, T.; Sweeney, C.; Vogel, C.F. Aryl hydrocarbon receptor signaling synergizes with TLR/NF-κB-signaling for induction of IL-22 through canonical and non-canonical AhR pathways. Frontiers in toxicology 2022, 3, 787360. [Google Scholar] [CrossRef] [PubMed]
- Cannon, A.S.; Nagarkatti, P.S.; Nagarkatti, M. Targeting AhR as a Novel Therapeutic Modality against Inflammatory Diseases. Int J Mol Sci 2021, 23. [Google Scholar] [CrossRef]
- Yin, Q.; Wang, L.; Yu, H.; Chen, D.; Zhu, W.; Sun, C. Pharmacological Effects of Polyphenol Phytochemicals on the JAK-STAT Signaling Pathway. Front Pharmacol 2021, 12, 716672. [Google Scholar] [CrossRef] [PubMed]
- Bock, K.W. Aryl hydrocarbon receptor (AHR)-mediated inflammation and resolution: Non-genomic and genomic signaling. Biochemical pharmacology 2020, 182, 114220. [Google Scholar] [CrossRef]
- Oliveira Da Rocha, G.H.; Müller, C.; Przybylski-Wartner, S.; Schaller, H.; Riemschneider, S.; Lehmann, J. P0145 Role of PPARg on anti-inflammatory effects mediated by AhR ligands in a Caco-2/THP-1 in vitro “inflamed gut” model. Journal of Crohn's and Colitis 2025, 19, i535–i535. [Google Scholar] [CrossRef]
- Wen, J.; Wang, L. Identification of key genes and their association with immune infiltration in adipose tissue of obese patients: a bioinformatic analysis. Adipocyte 2022, 11, 401–412. [Google Scholar] [CrossRef]
- Wang, J.; Mijiti, Y.; Chen, Y.; Liu, Z. Aryl hydrocarbon receptor is a prognostic biomarker and is correlated with immune responses in cervical cancer. Bioengineered 2021, 12, 11922–11935. [Google Scholar] [CrossRef] [PubMed]
- Li, F.; Li, X.; Liu, X.; Zhang, L.; You, L.; Zhao, J.; Wu, H. Docking and 3D-QSAR studies on the Ah receptor binding affinities of polychlorinated biphenyls (PCBs), dibenzo-p-dioxins (PCDDs) and dibenzofurans (PCDFs). Environmental toxicology and pharmacology 2011, 32, 478–485. [Google Scholar] [CrossRef]
- Shen, P.X.; Li, X.; Deng, S.Y.; Zhao, L.; Zhang, Y.Y.; Deng, X.; Han, B.; Yu, J.; Li, Y.; Wang, Z.Z.; et al. Urolithin A ameliorates experimental autoimmune encephalomyelitis by targeting aryl hydrocarbon receptor. EBioMedicine 2021, 64, 103227. [Google Scholar] [CrossRef] [PubMed]
- Safe, S.; Jin, U.H.; Park, H.; Chapkin, R.S.; Jayaraman, A. Aryl Hydrocarbon Receptor (AHR) Ligands as Selective AHR Modulators (SAhRMs). Int J Mol Sci 2020, 21. [Google Scholar] [CrossRef] [PubMed]
- Mosa, F.E.; El-Kadi, A.O.; Barakat, K. Targeting the aryl hydrocarbon receptor (AhR): a review of the in-silico screening approaches to identify AhR modulators. High-Throughput Screening for Drug Discovery 2021. [Google Scholar] [CrossRef]
- Faber, S.C.; Giani Tagliabue, S.; Bonati, L.; Denison, M.S. The cellular and molecular determinants of naphthoquinone-dependent activation of the aryl hydrocarbon receptor. International Journal of Molecular Sciences 2020, 21, 4111. [Google Scholar] [CrossRef]
Figure 2.
Correlation analyses of gene expression in 3T3-L1 adipocytes following flavonoid treatments. (A) Venn diagram illustrating overlaps among differentially expressed genes between HES and NAR treatment groups. (B) Venn diagram depicting gene overlaps among polymethoxylated flavones—NOB, SIN, and TAN—compared to Normal group. Italic numbers indicate upregulated genes, underlined numbers represent downregulated genes, and red numbers denote contra-regulated genes. (C) Polar heat map dendrogram displaying normalized gene expression profiles across flavonoid treatments. The circular dendrogram visualizes clustering patterns of 45 key DEGs associated with AhR signaling, inflammation, and obesity. Expression levels are color-coded (blue = low, red = high). Rings represent distinct treatment groups, and gene clusters denote expression similarity. Insets highlight representative genes from each functional category, illustrating pathway-specific modulation.
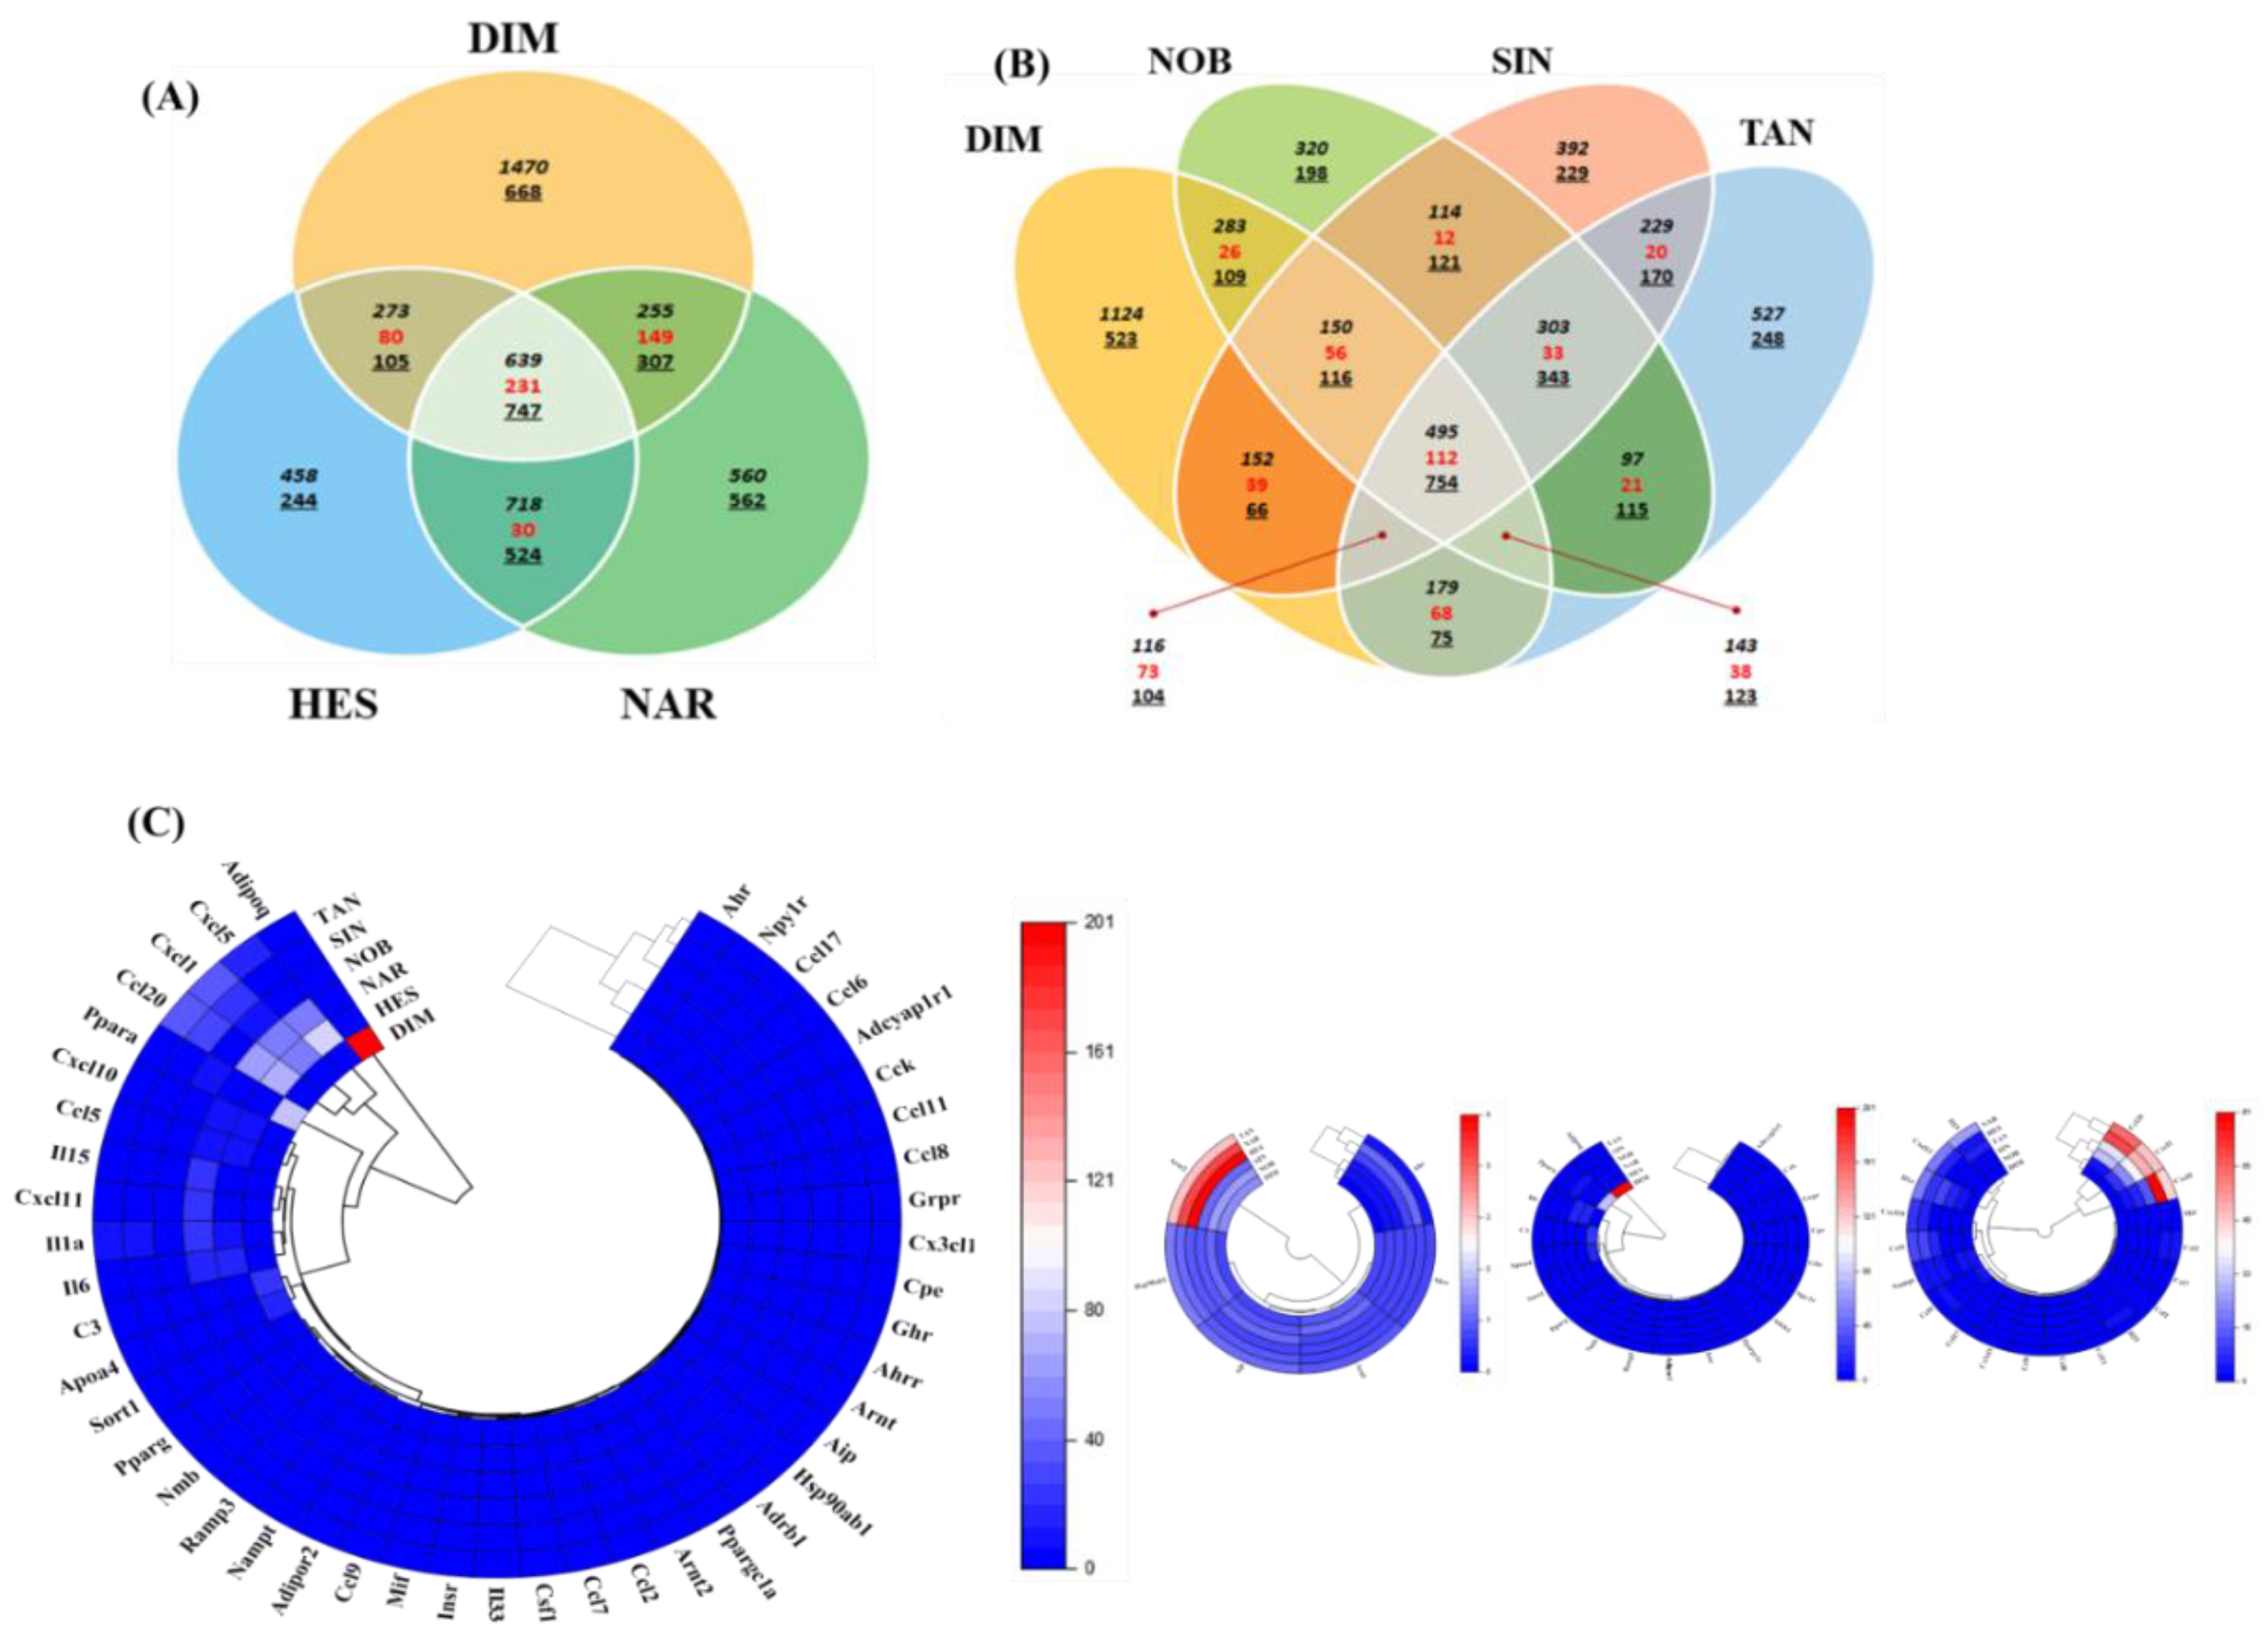
Figure 3.
Gene Ontology (GO) analysis of differentially expressed genes (DEGs) in flavonoid-treated 3T3-L1 adipocytes. (A) Pie chart illustrating the distribution of DEGs across functional categories, including obesity-related genes, adipogenesis, inflammatory response, inflammatory cytokine receptors, and inflammasome pathways. (B) GO enrichment of biological processes. (C) Molecular function enrichment. (D) In panels (B–D), the top 10 significantly enriched GO terms (FDR ≤ 0.05) are presented. Bubble size represents the number of DEGs associated with each GO term, while color intensity indicates the adjusted false discovery rate (FDR); darker colors denote greater statistical significance.
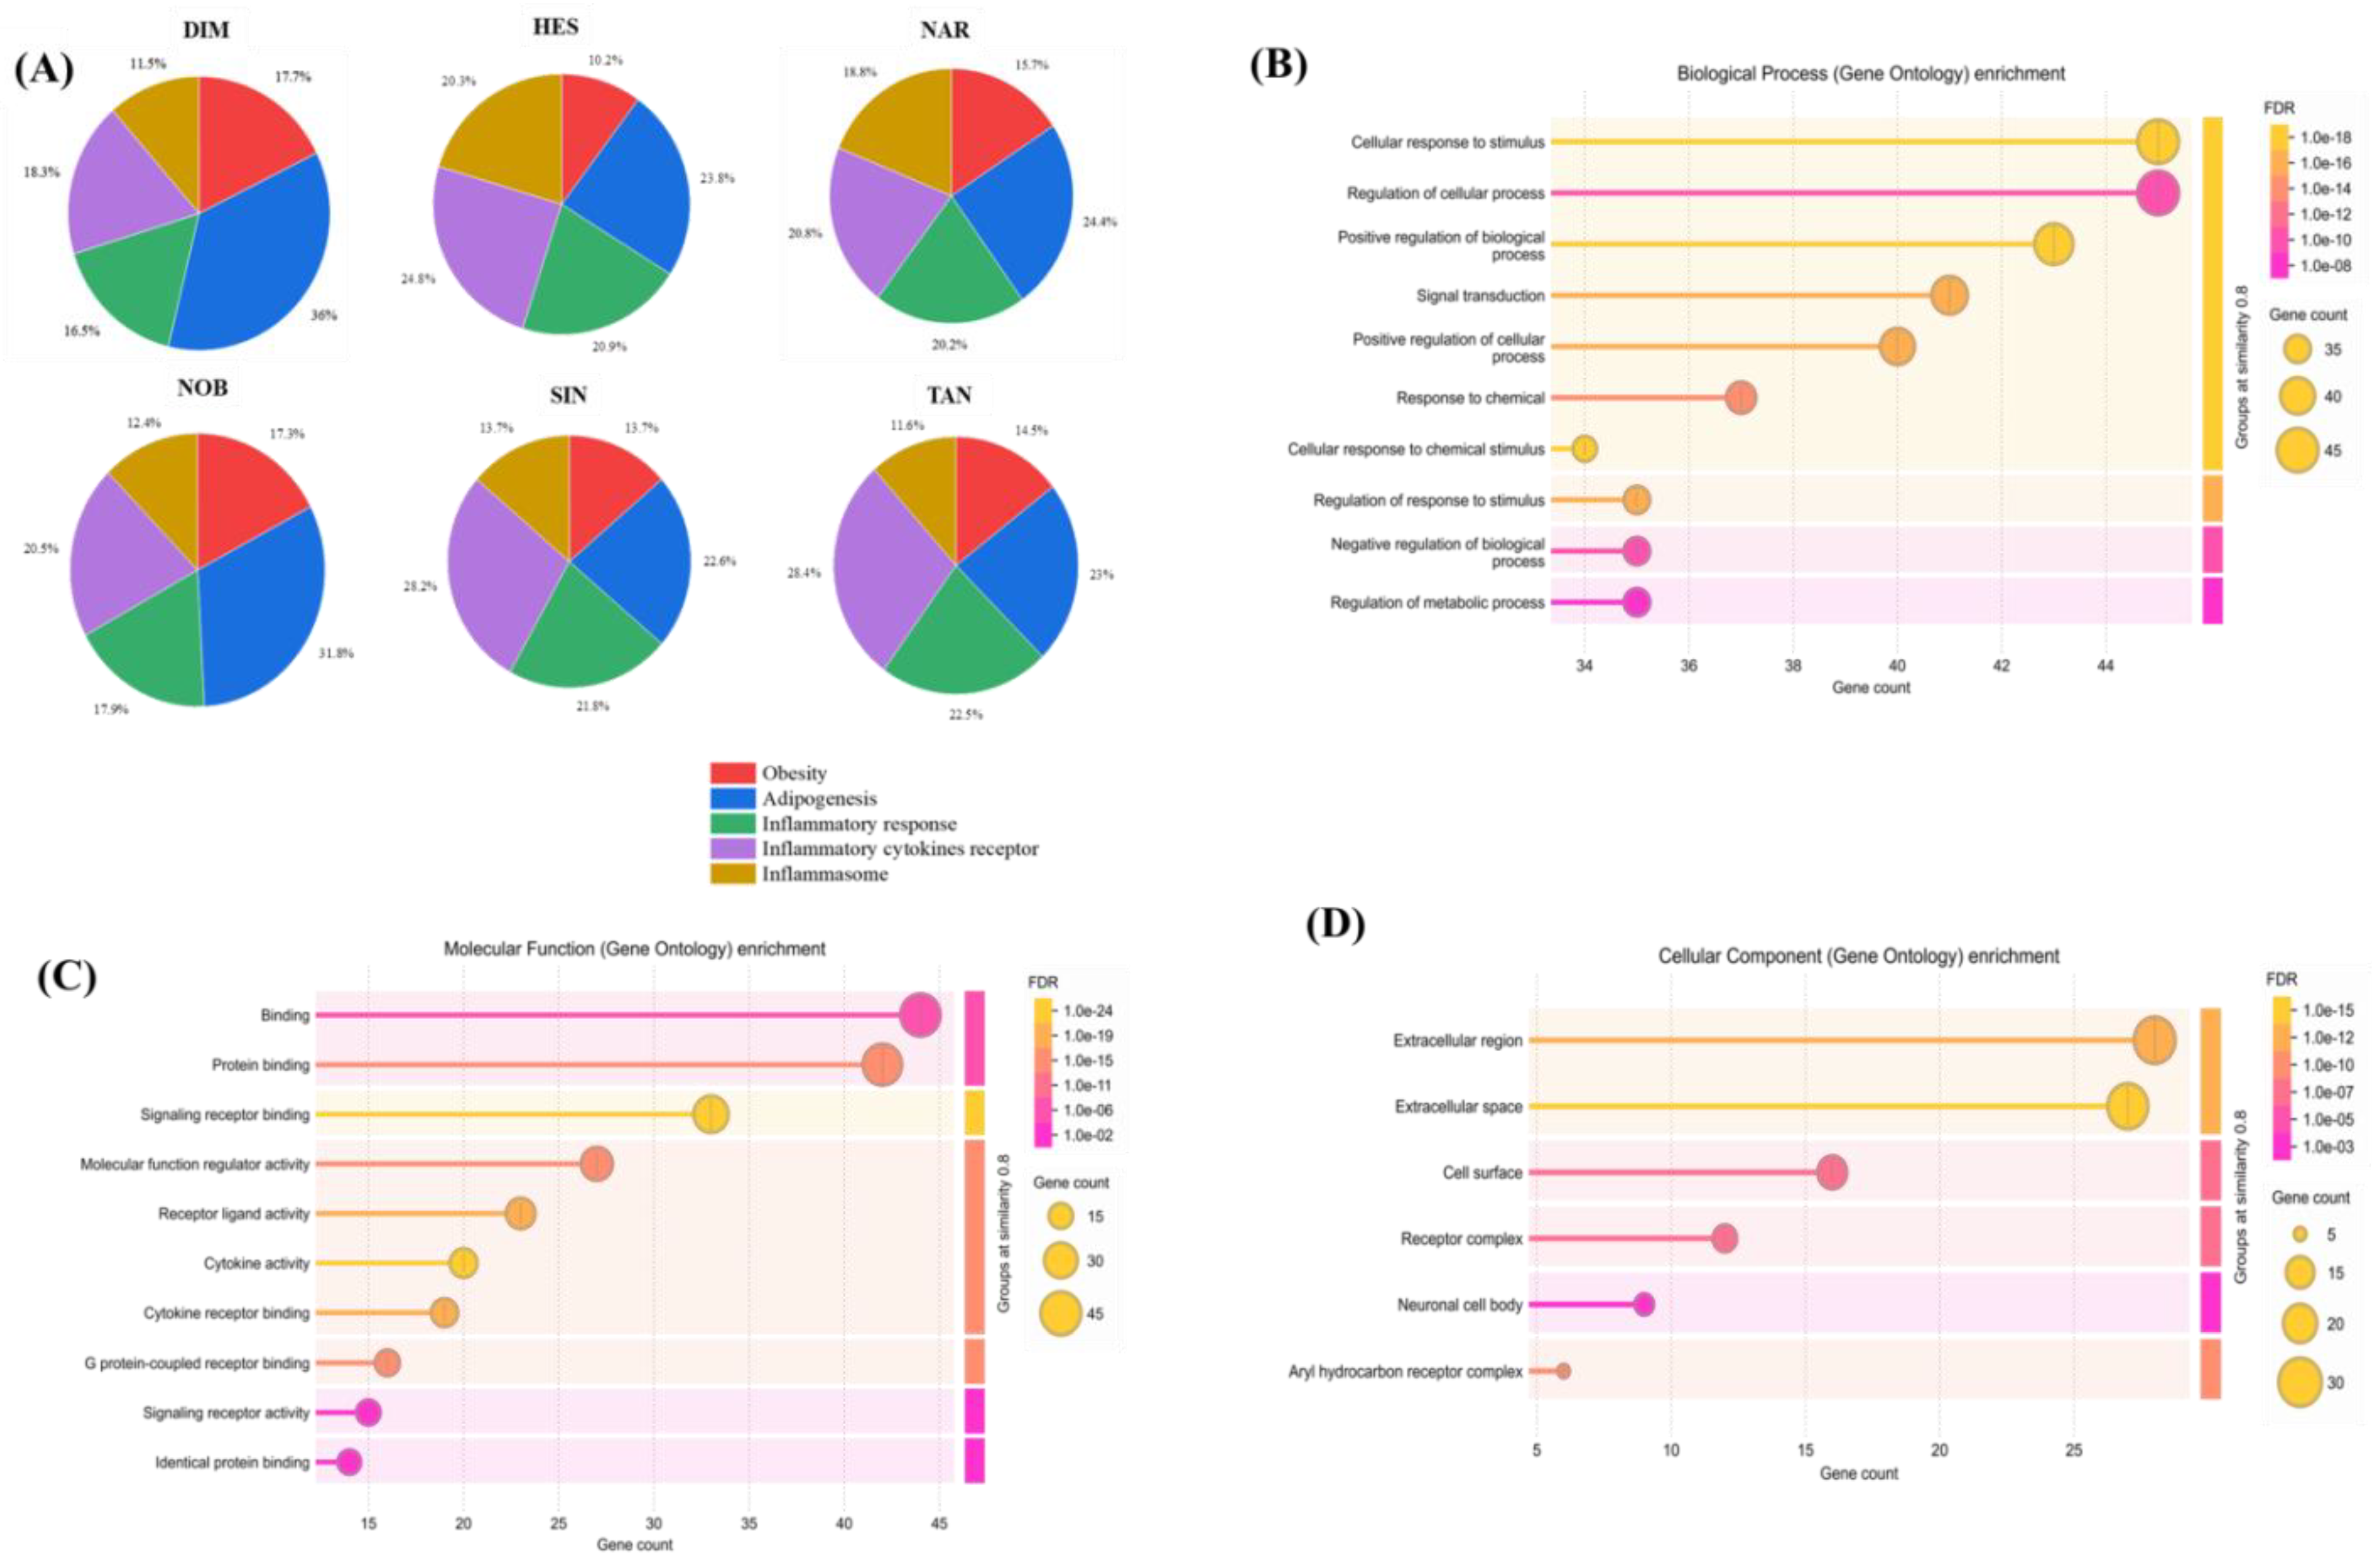
Figure 4.
Pathway enrichment analysis of differentially expressed genes (DEGs) (A) Kyoto Encyclopedia of Genes and Genomes (KEGG) pathway enrichment highlighting key metabolic and signaling cascades. (B) Reactome pathway analysis emphasizing major biological processes, including GPCR ligand binding and downstream signaling. (C) WikiPathways enrichment showcasing regulatory networks pertinent to inflammation and adipogenesis. (D) STRING-based enrichment of local functional clusters, underscoring potential protein–protein interactions, notably involving JAK–STAT and AhR nuclear complex pathways. In each bubble plot, pathways are ranked along the x-axis by gene ratio. Bubble size indicates the number of associated DEGs, while color intensity corresponds to statistical significance (false discovery rate, FDR), with darker colors denoting stronger enrichment.
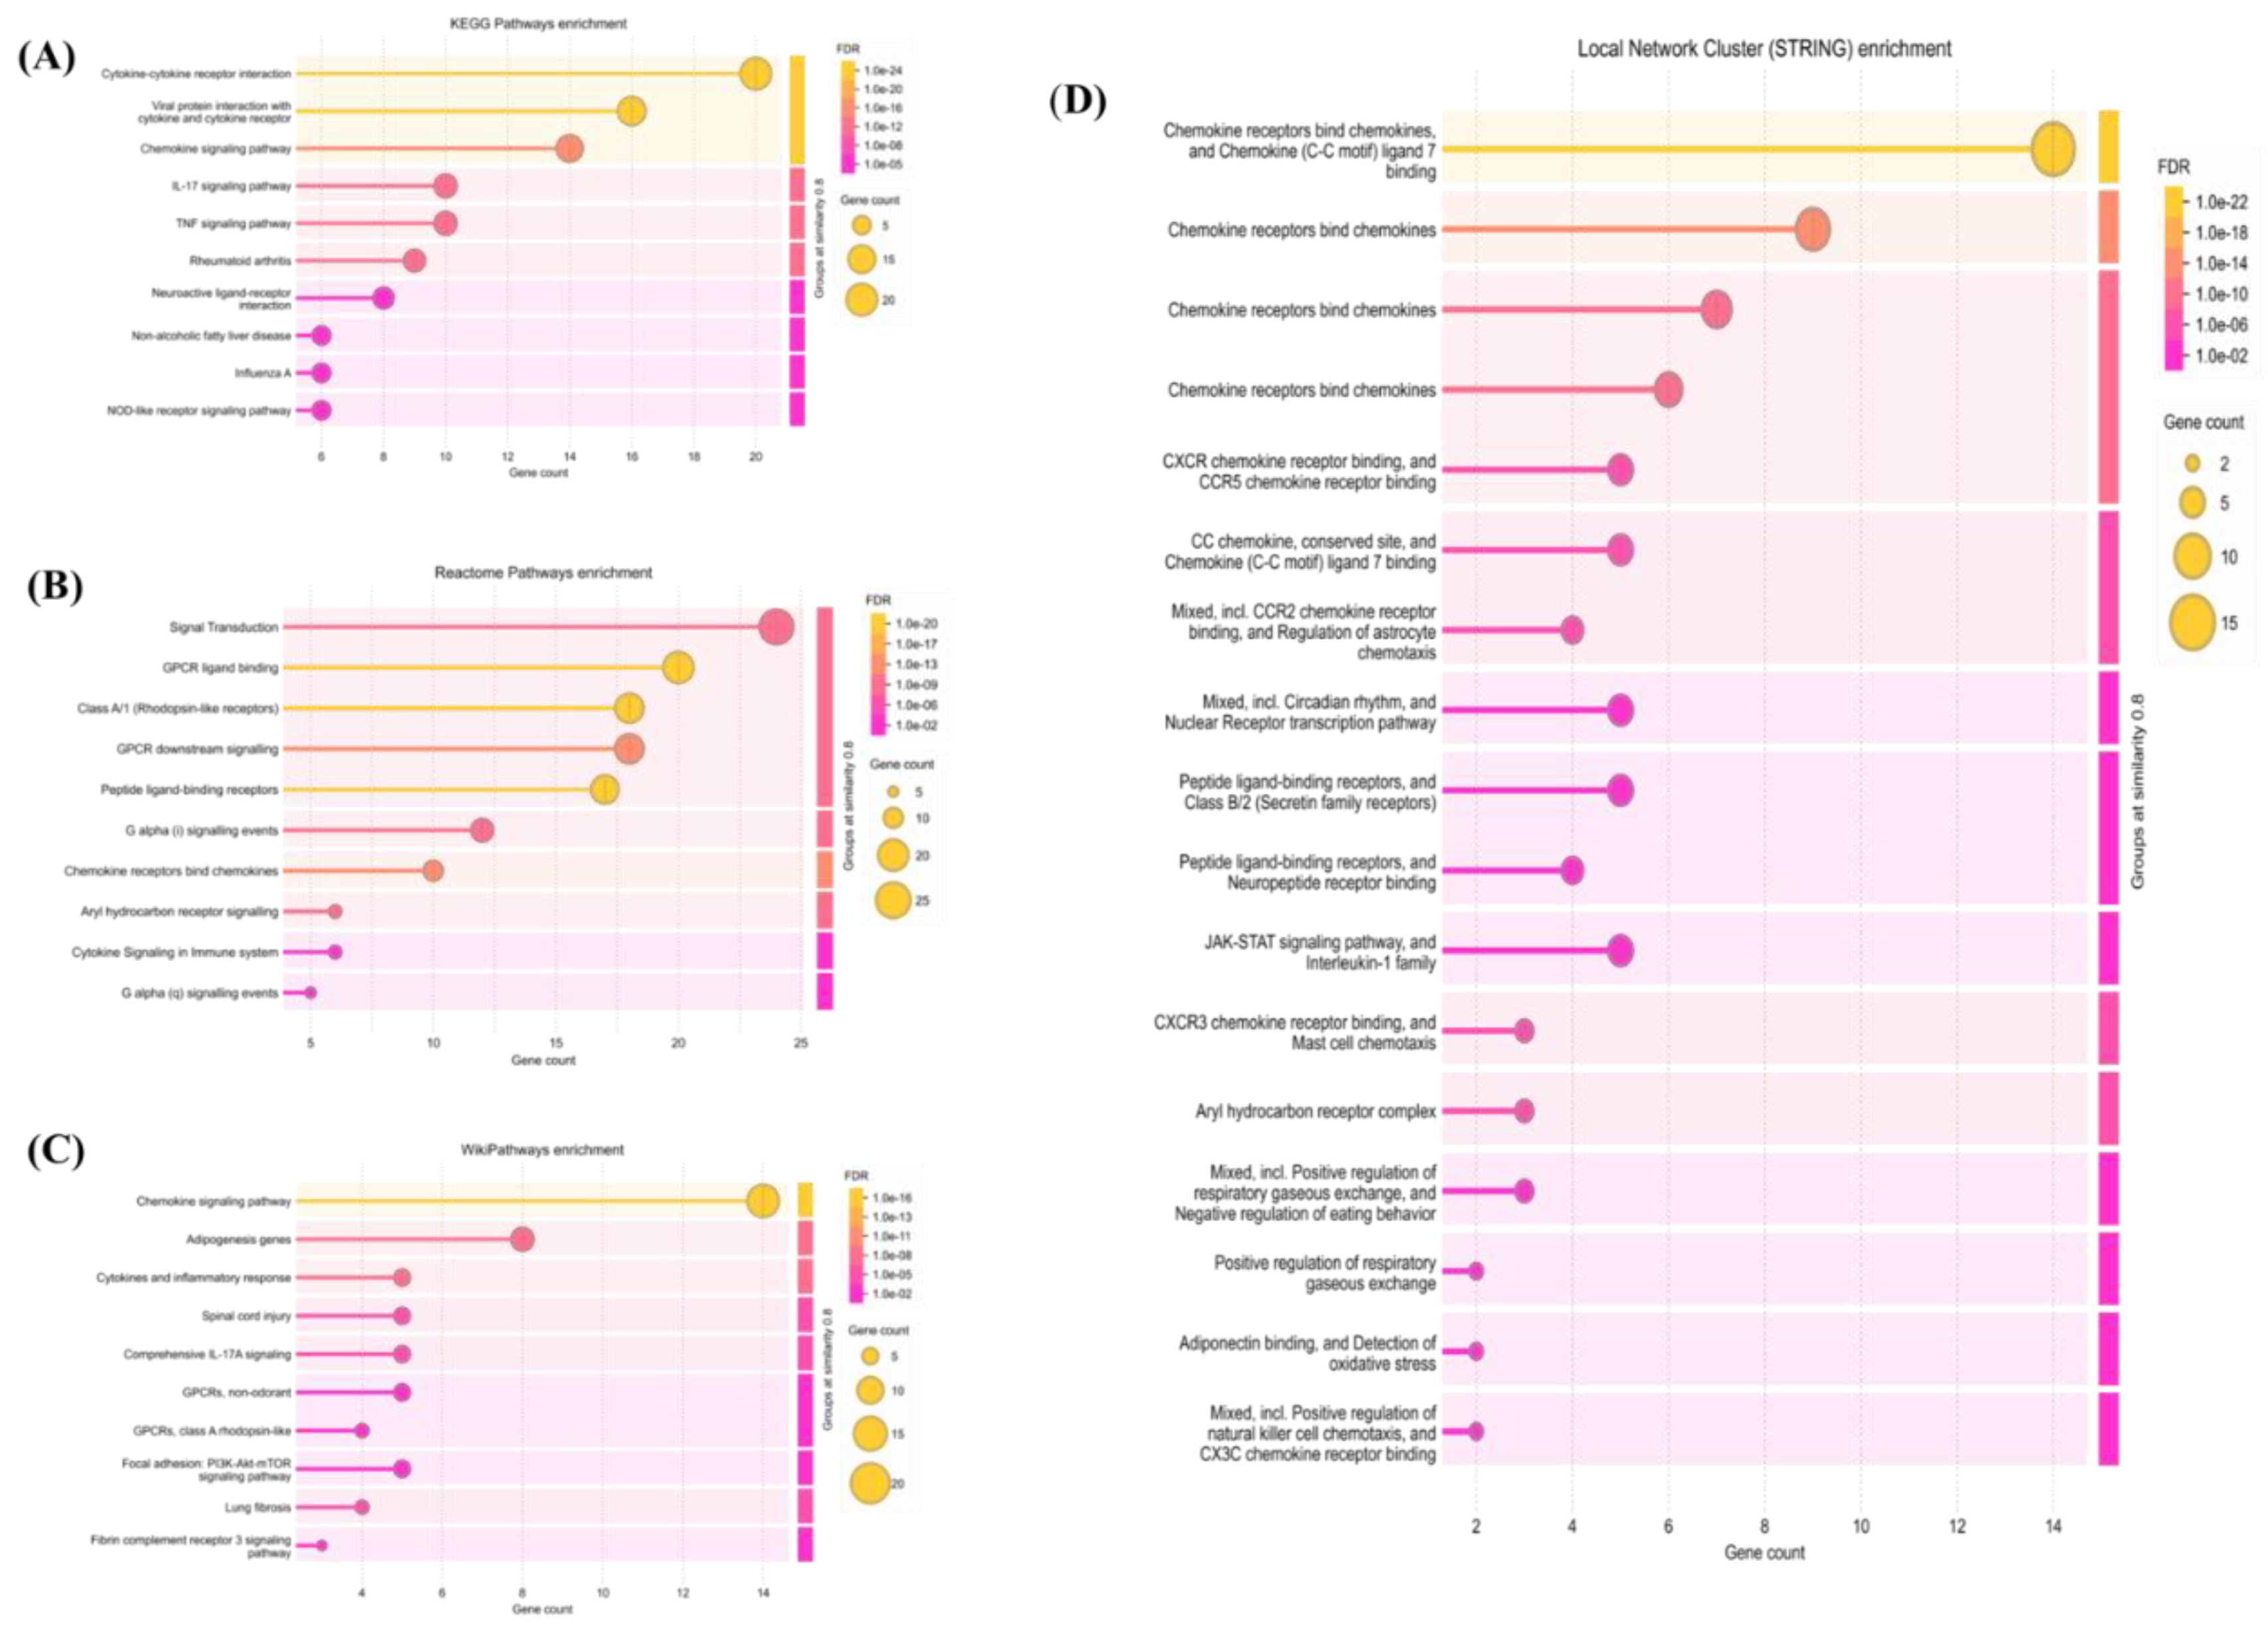
Figure 5.
Protein–protein interaction (PPI) network of DEGs related to AhR signaling, obesity, and inflammation in flavonoid-treated 3T3-L1 adipocytes. The network was constructed using the STRING database and visualized with Cytoscape. Nodes represent proteins encoded by DEGs, and edges indicate predicted interactions with confidence scores. Key hub proteins, including AhR, Arnt2, Ccl20, IL-6, and Adipoq, are highlighted, illustrating interconnected clusters involved in immune–metabolic regulation.
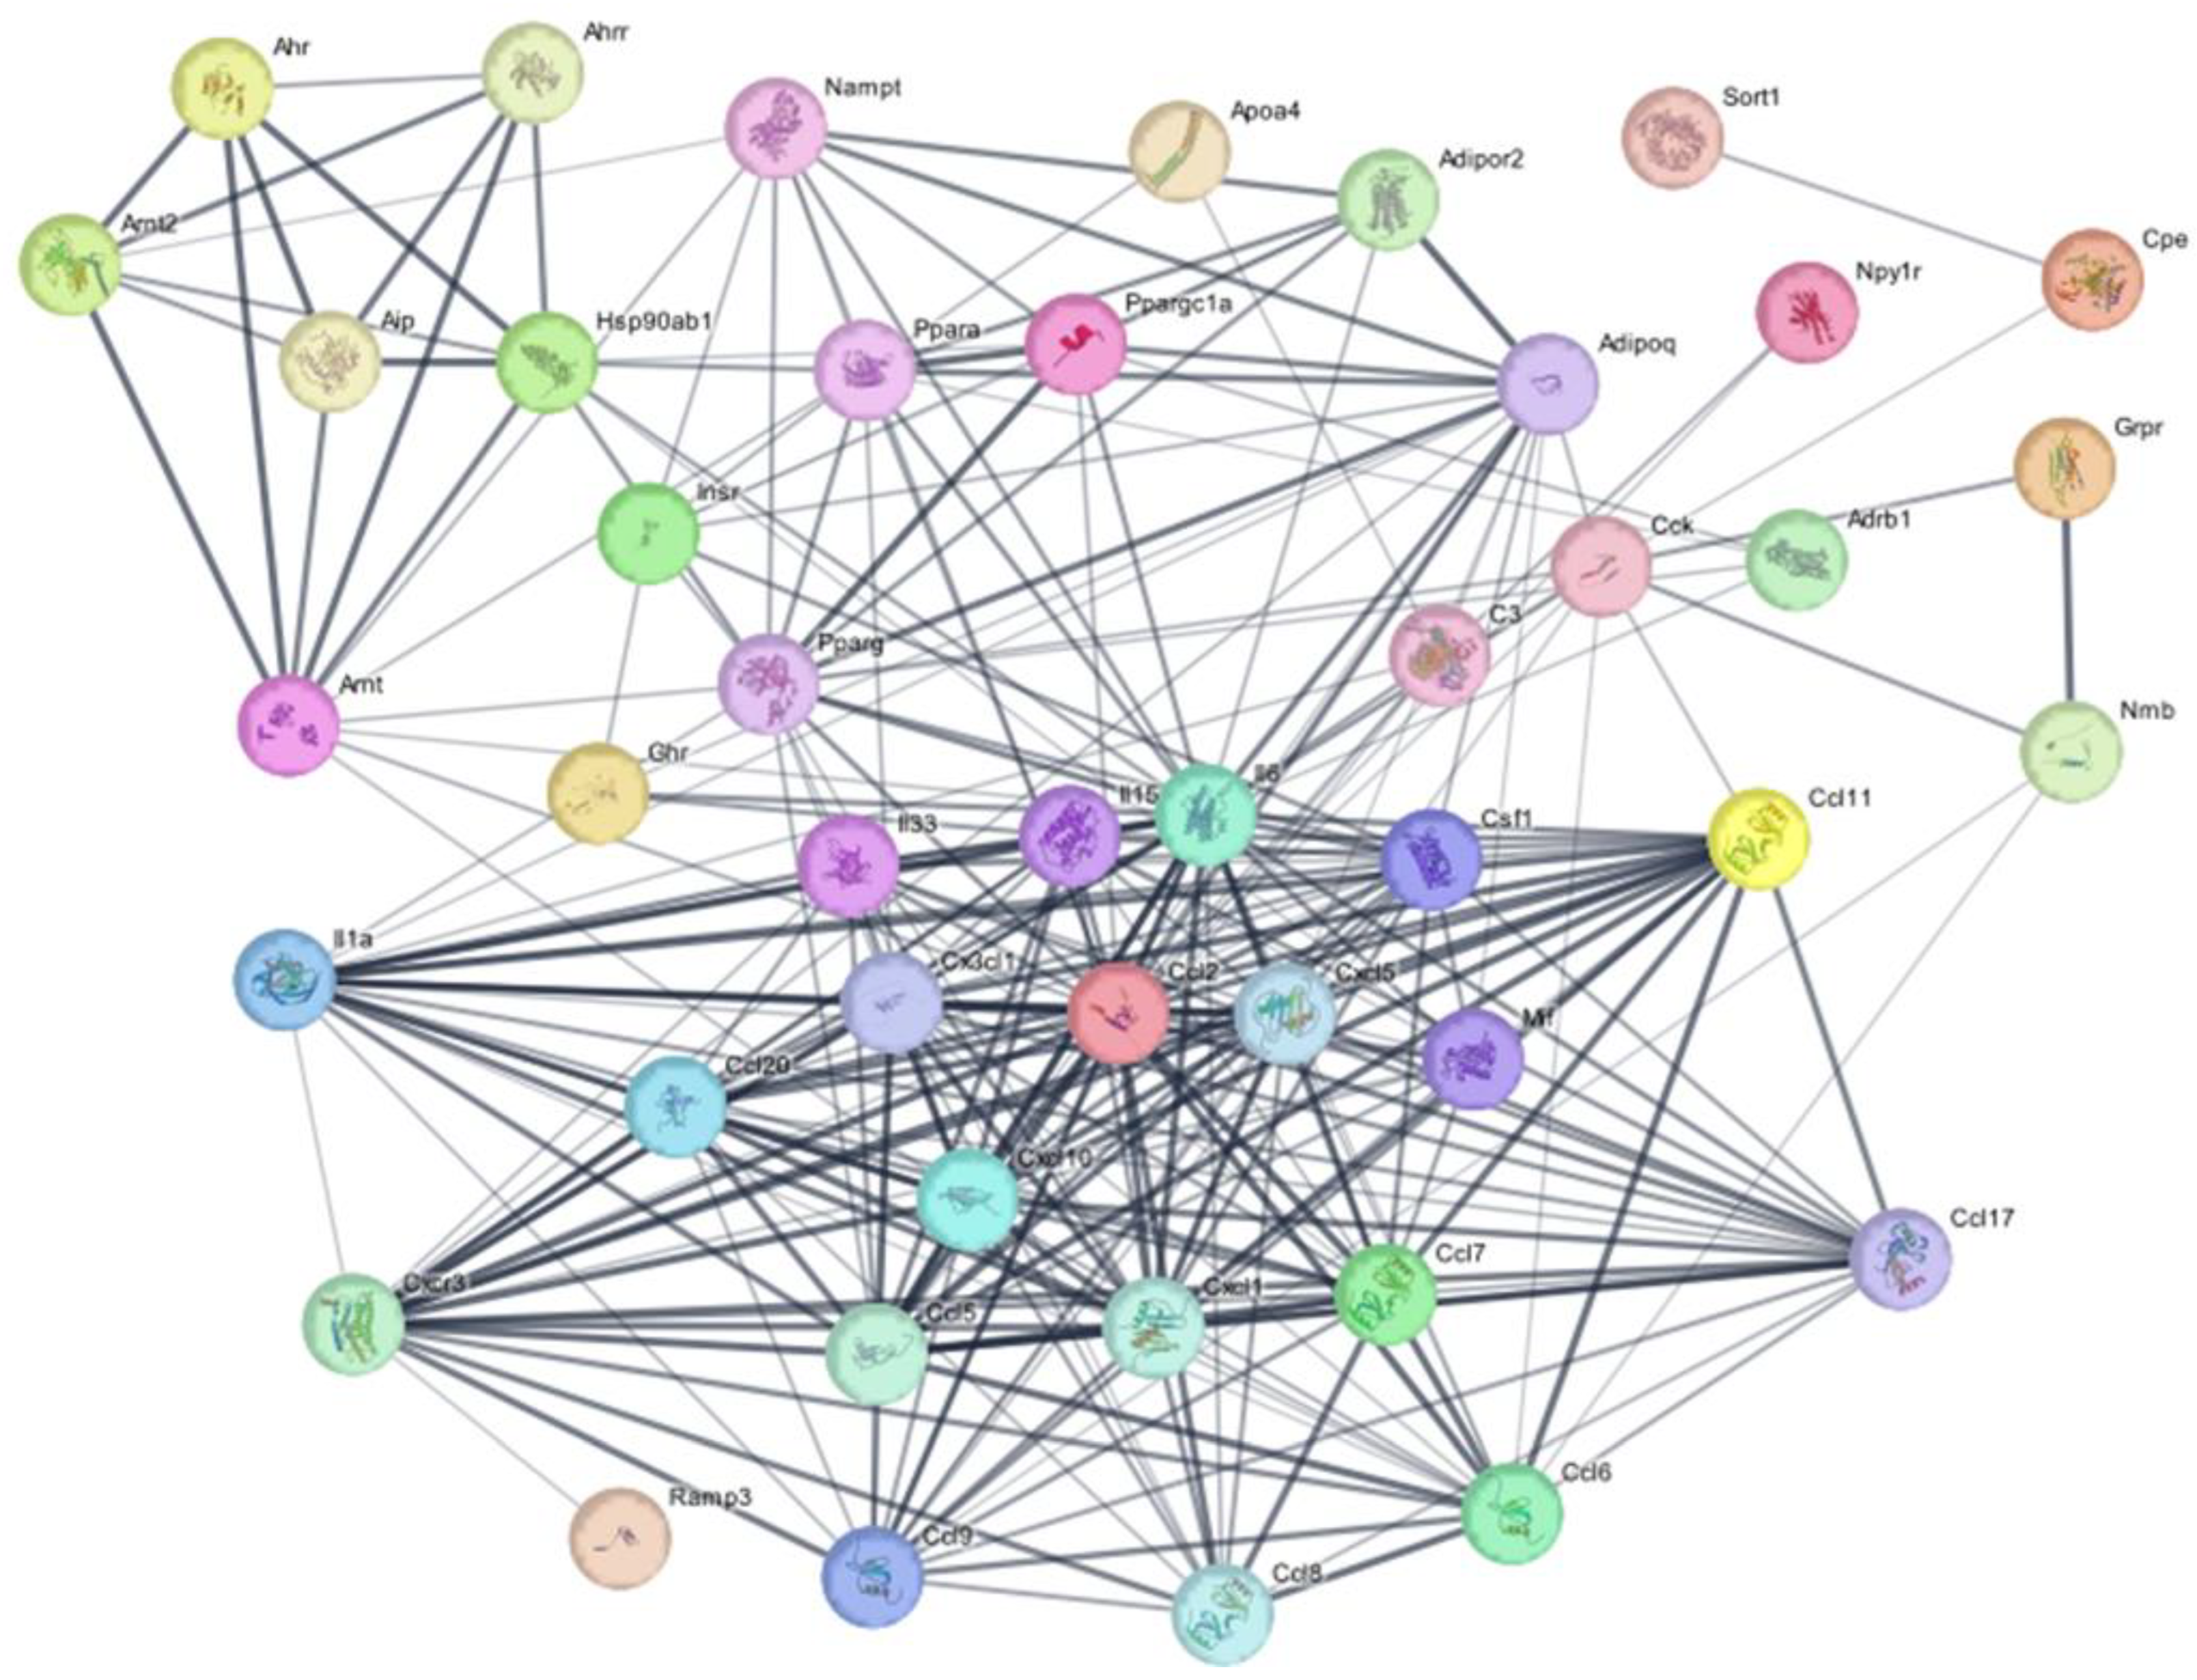
Figure 6.
Molecular docking of citrus flavonoids with AhR ligand-binding domain. Binding poses of (A) HES, (B) NAR, (C) NOB, (D) SIN, and (E) TAN within the AhR pocket. Binding affinities and ligand–residue interactions were visualized using LigPlot+, PyMOL, and UCSF Chimera. Hydrophobic contacts are shown as red semi-circles, and hydrogen bonds are indicated with dashed lines. Key interactions involve conserved AhR residues such as Ser140, Gln150, and Tyr137.
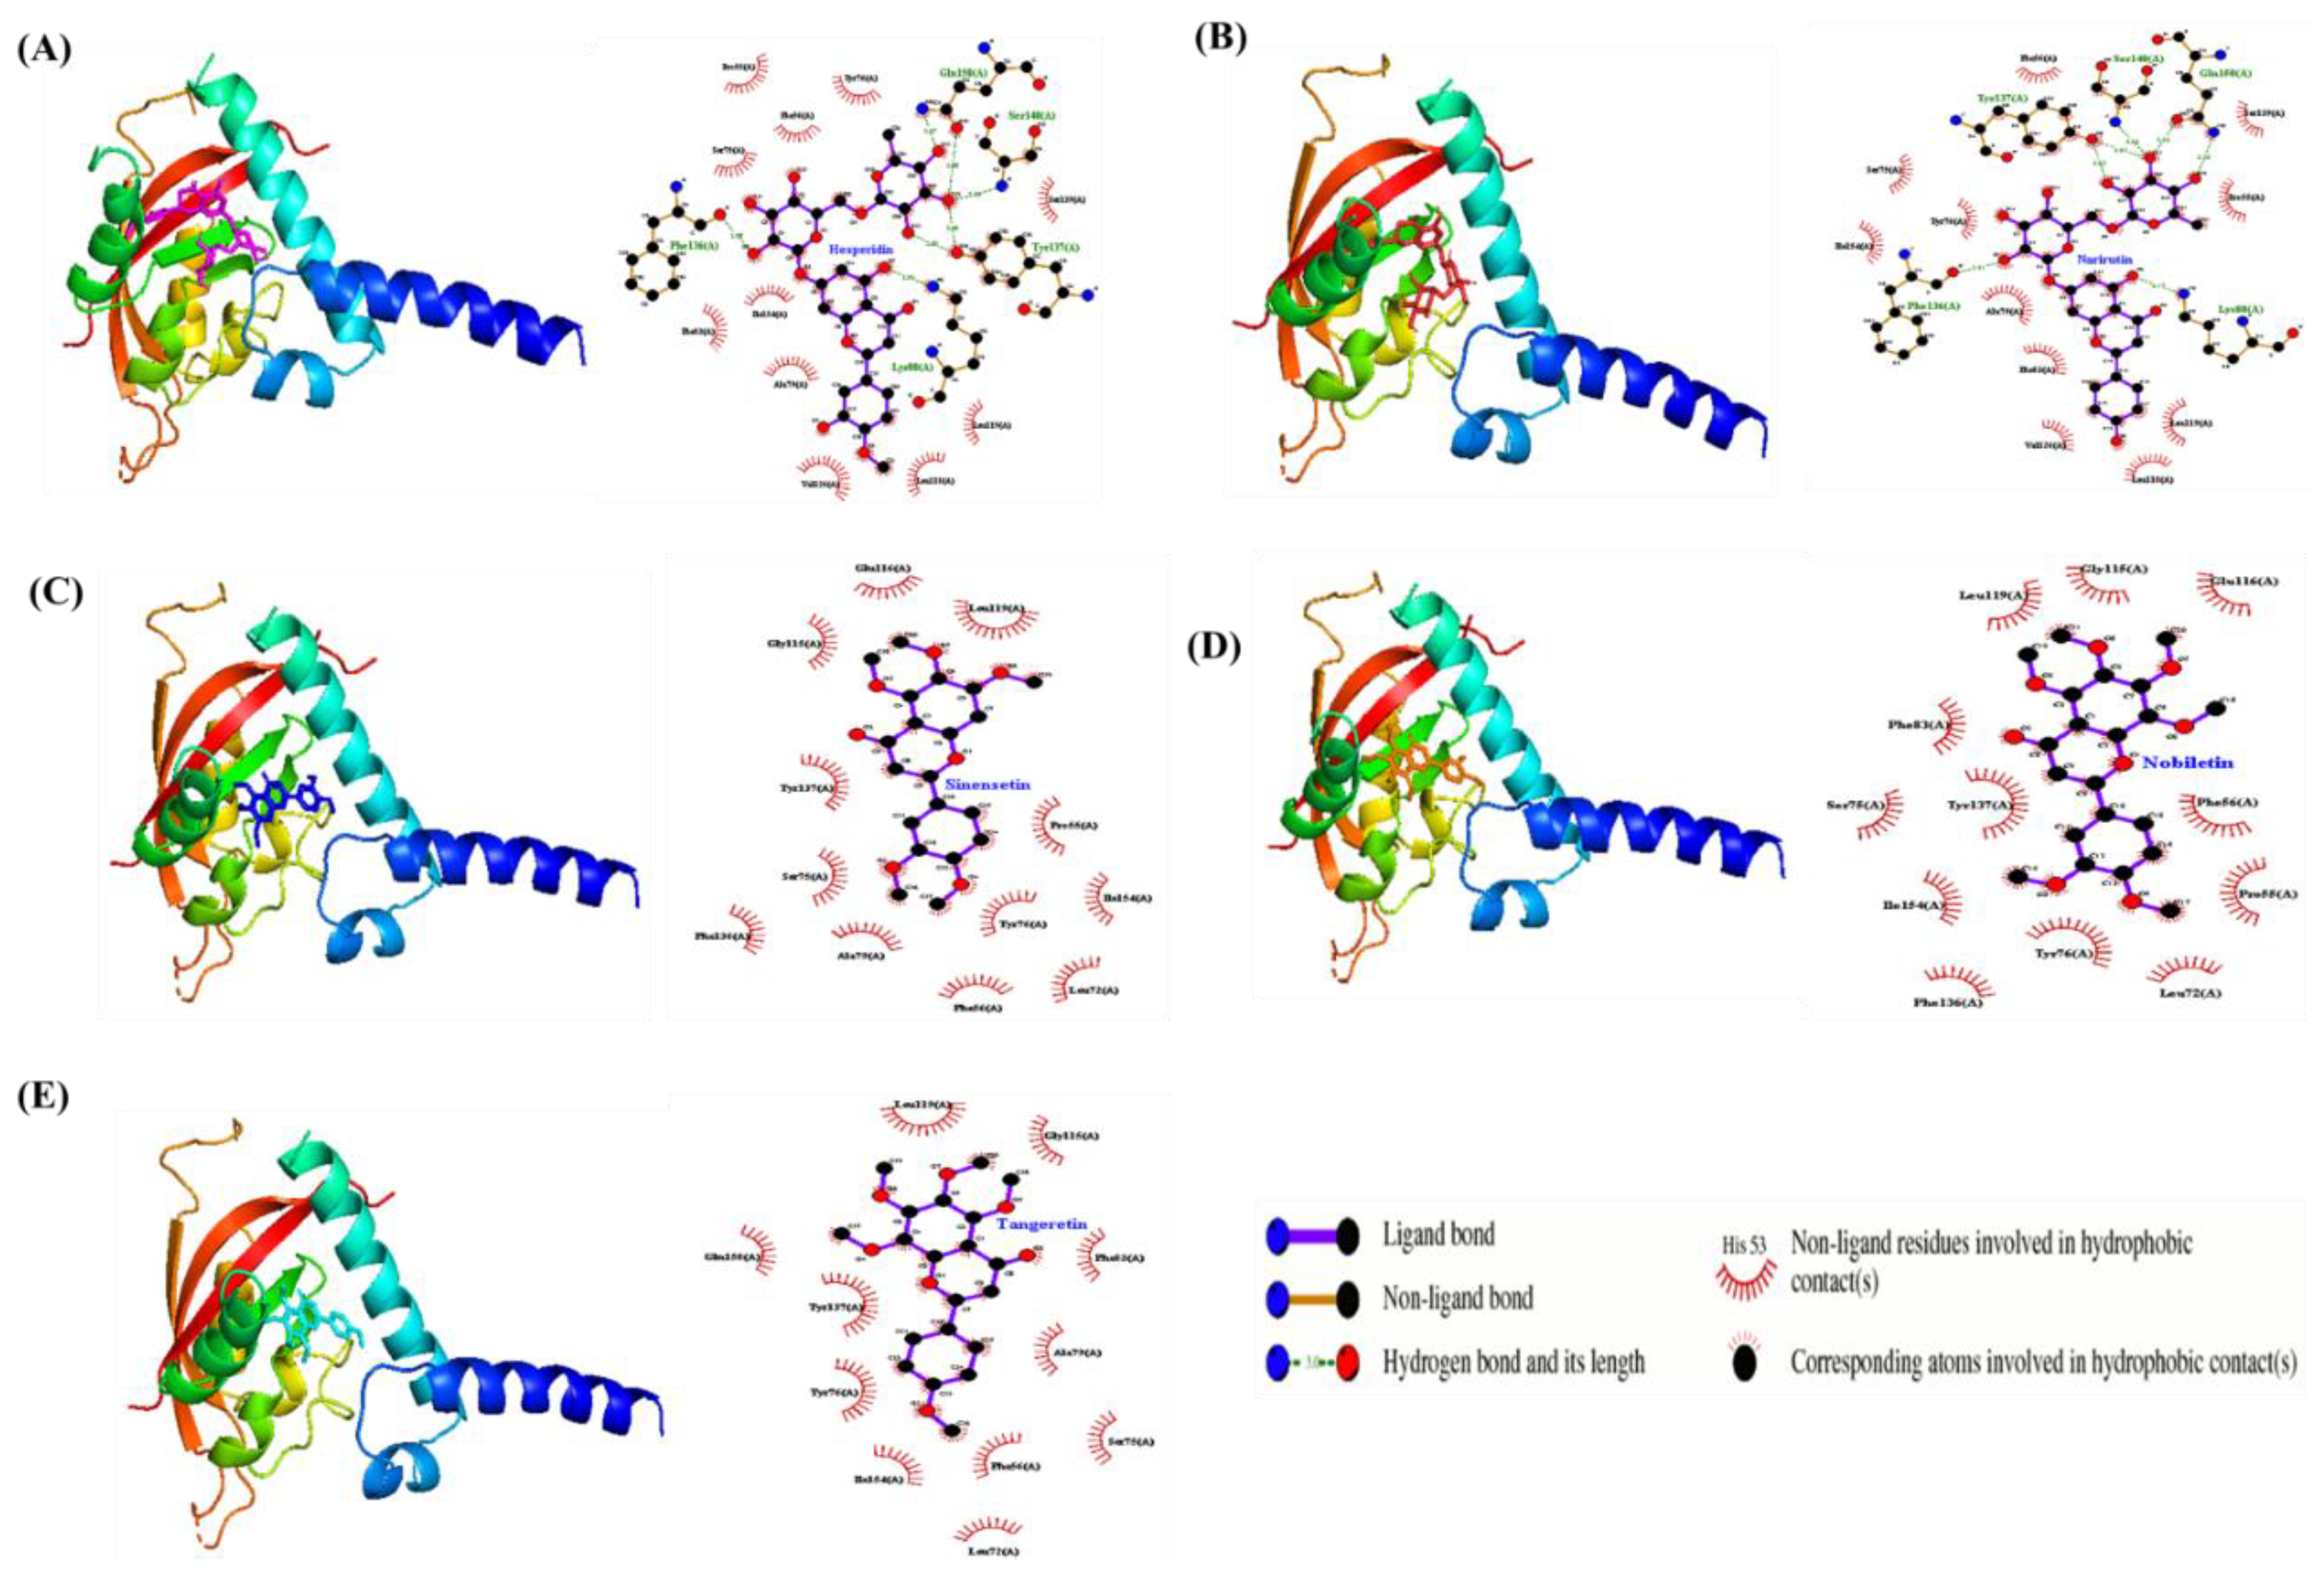
Figure 1.
(A) Chemical structures of five citrus-derived flavonoids and schematic of the 3T3-L1 cell differentiation protocol. (A) Structural formulas of hesperidin (HES), narirutin (NAR), nobiletin (NOB), sinensetin (SIN), and tangeretin (TAN). (B) Experimental workflow showing the timeline for cell seeding, differentiation induction, flavonoid treatment, and RNA sequencing.
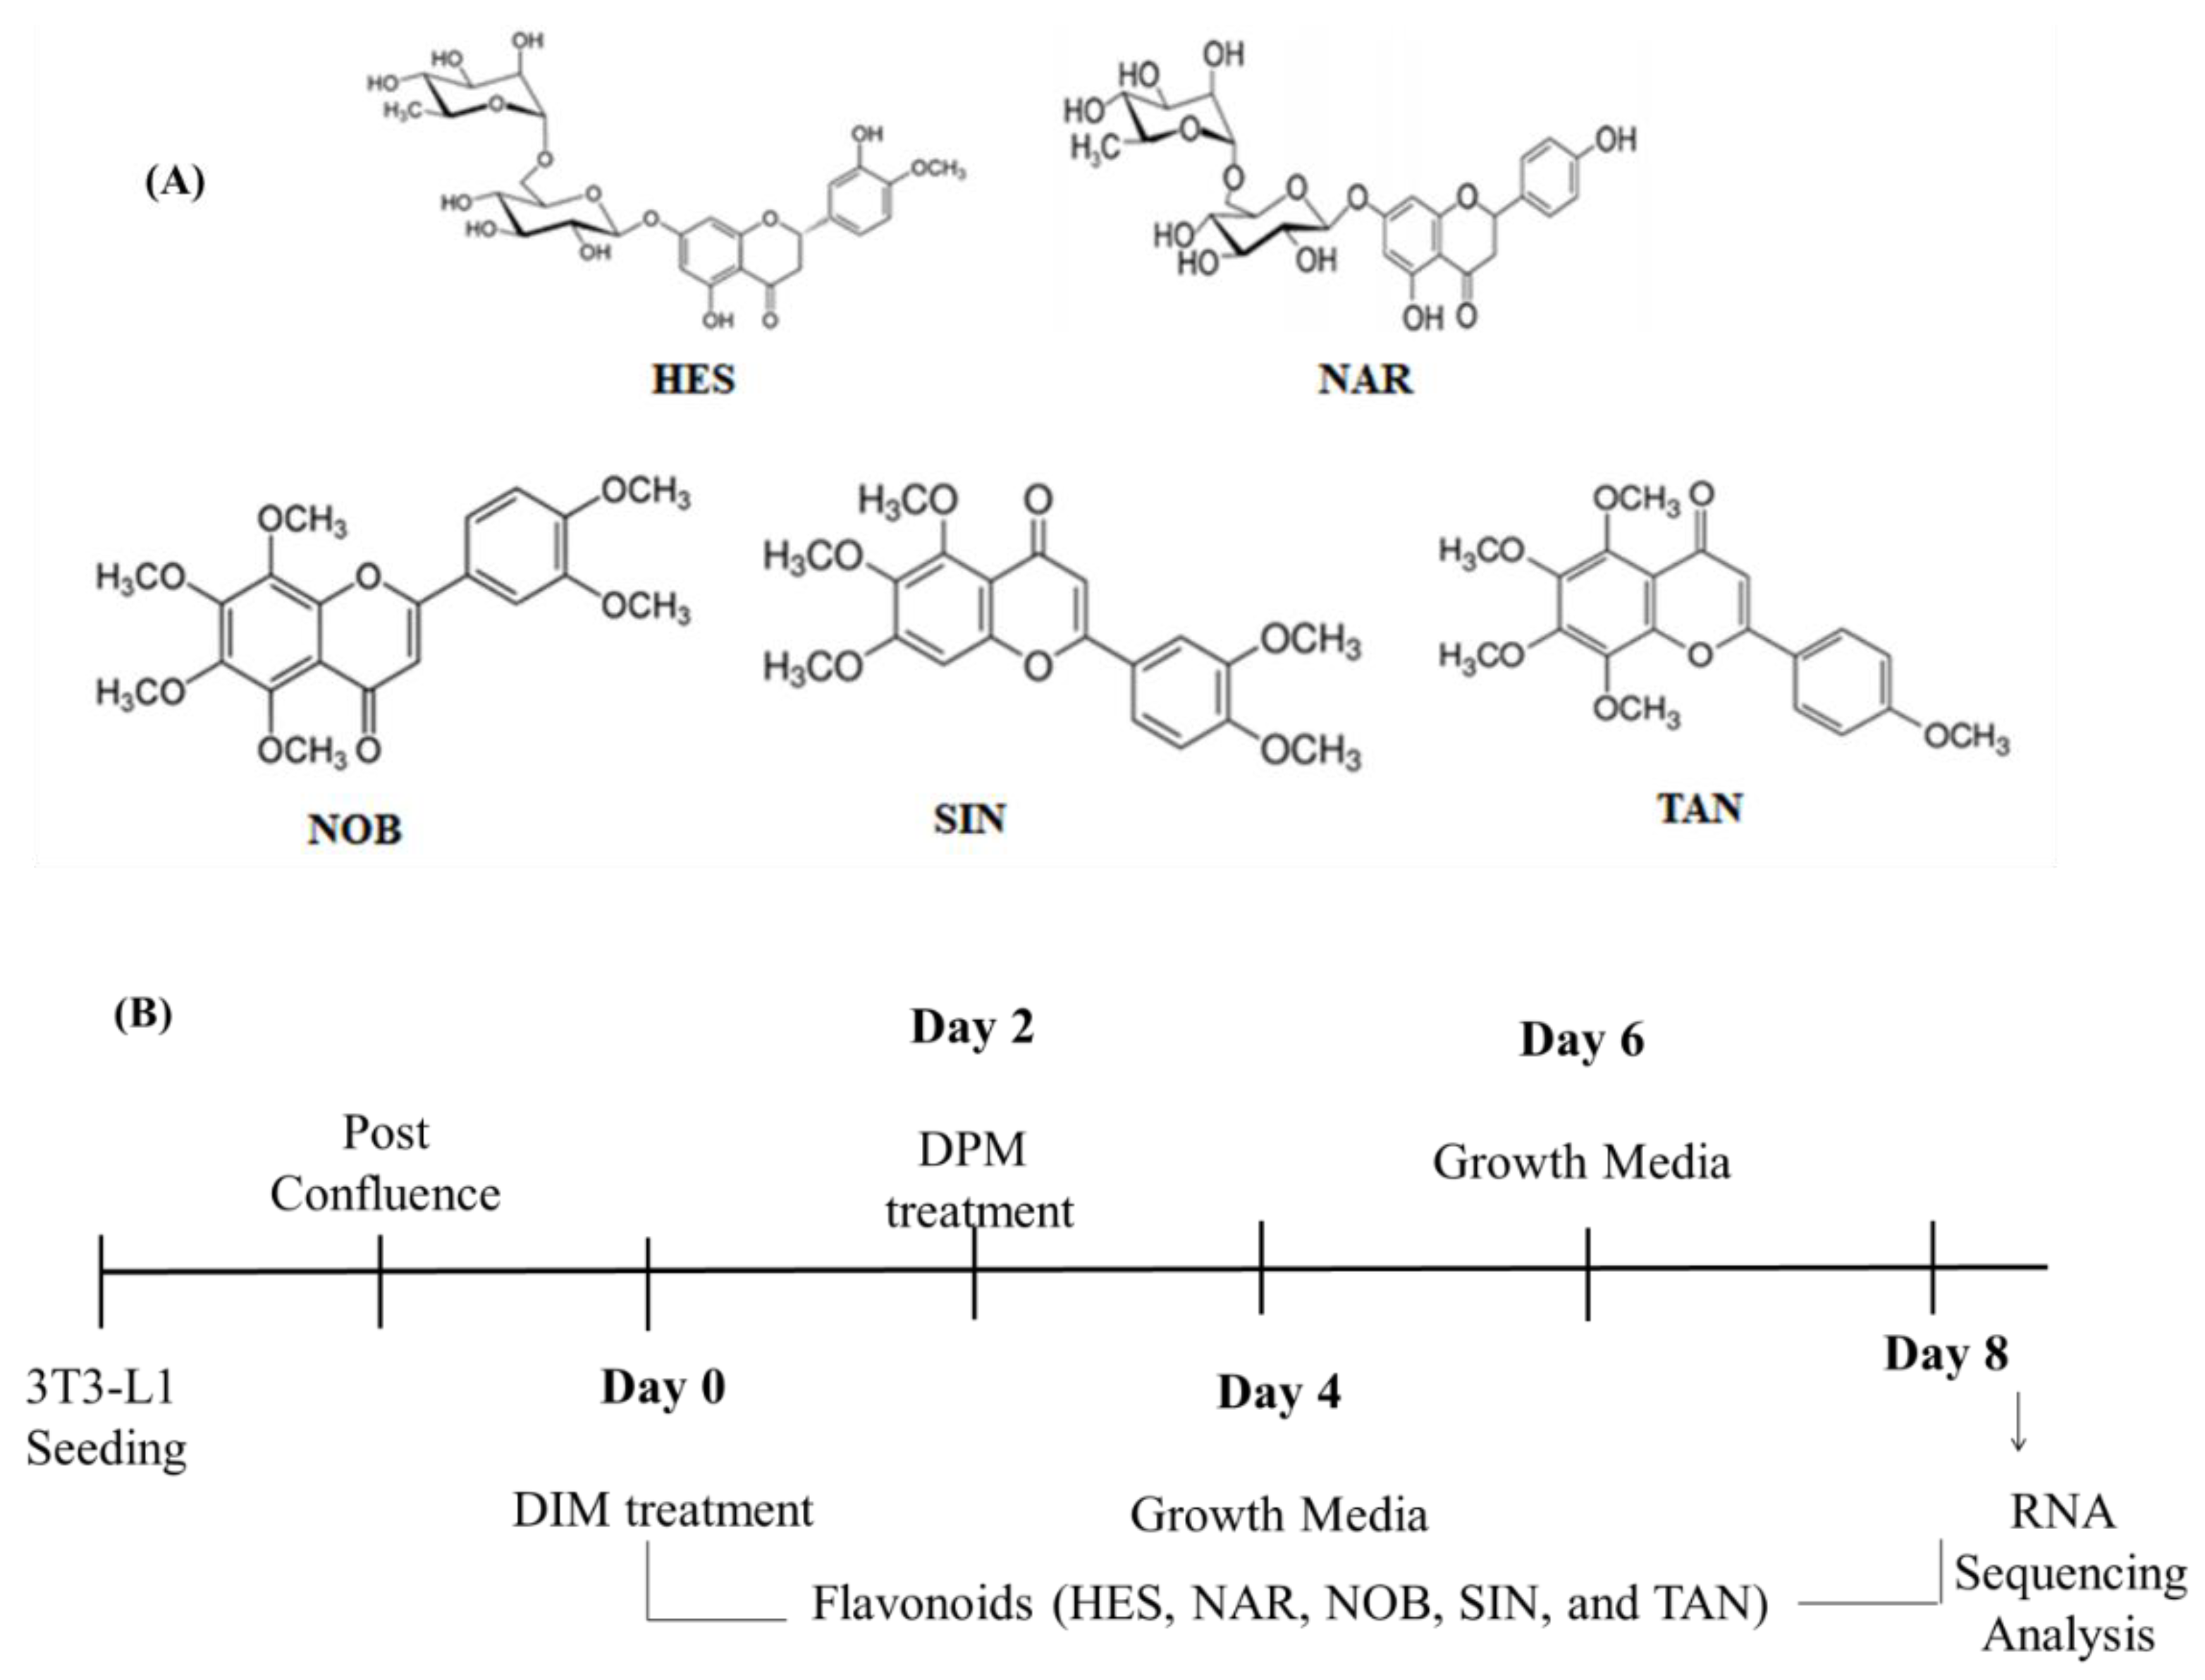

Table 1.
AhR-related gene expression changes in 3T3-L1 adipocytes1.
| Gene | DIM | HES | NAR | NOB | SIN | TAN | Description |
|---|---|---|---|---|---|---|---|
| Ahr | 0.416 | 0.988 | 1.214 | 0.537 | 0.582 | 0.568 | aryl-hydrocarbon receptor |
| Ahrr | 1.000 | 1.000 | 1.000 | 1.000 | 1.000 | 1.000 | aryl-hydrocarbon receptor repressor |
| Aip | 0.955 | 0.961 | 1.033 | 1.061 | 1.2 | 1.139 | aryl-hydrocarbon receptor-interacting protein |
| Arnt | 1.102 | 0.973 | 0.936 | 1.194 | 1.004 | 1.048 | aryl hydrocarbon receptor nuclear translocator |
| Arnt2 | 1.439 | 4.046 | 3.471 | 1.559 | 1.248 | 2.681 | aryl hydrocarbon receptor nuclear translocator 2 |
| Hsp90ab1 | 0.975 | 1.126 | 1.232 | 1.174 | 1.072 | 1.267 | heat shock protein 90 alpha (cytosolic), class B member 1 |
1DIM: Adipocyte differentiation induced using a two –step protocol consisting of induction and progression media; citrus flavonoids were applied throughout the differentiation phase. Normal: Undifferentiated preadipocytes; HES: Hesperidin; NAR; Narirutin; NOB: Nobiletin; SIN; Sinensetin; TAN: Tangeretin. Fold changes are relative to the Normal group.
Table 2.
Expression of obesity-related genes in 3T3-L1 adipocytes1.
| Gene | DIM | HES | NAR | NOB | SIN | TAN | Description |
|---|---|---|---|---|---|---|---|
| Adcyap1r1 | 0.557 | 0.071 | 0.009 | 0.035 | 0.106 | 0.044 | adenylate cyclase activating polypeptide 1 receptor 1 |
| Adipoq | 200.049 | 0.186 | 0.406 | 2.73 | 0.055 | 0.18 | adiponectin, C1Q and collagen domain containing |
| Adipor2 | 5.596 | 3.039 | 3.764 | 3.79 | 3.004 | 2.828 | adiponectin receptor 2 |
| Adrb1 | 2.375 | 0.143 | 0.143 | 0.418 | 0.156 | 0.668 | adrenergic receptor, beta 1 |
| Apoa4 | 19.218 | 1.000 | 1.000 | 1.95 | 1.096 | 1.116 | apolipoprotein A-IV |
| C3 | 20.91 | 5.389 | 4.011 | 1.479 | 1.001 | 1.255 | complement component 3 |
| Cck | 0.191 | 0.377 | 0.057 | 0.099 | 0.06 | 0.4 | cholecystokinin |
| Cpe | 0.313 | 0.473 | 0.453 | 0.916 | 0.512 | 0.55 | carboxypeptidase E |
| Ghr | 0.487 | 0.536 | 0.467 | 0.478 | 0.403 | 0.309 | growth hormone receptor |
| Grpr | 0.341 | 0.815 | 0.057 | 0.057 | 0.327 | 0.203 | gastrin releasing peptide receptor |
| IL-6 | 1.127 | 16.345 | 19.068 | 4.612 | 1.994 | 6.532 | interleukin 6 |
| Insr | 1.82 | 1.551 | 1.83 | 2.045 | 1.574 | 1.553 | insulin receptor |
| Nmb | 2.361 | 1.803 | 3.986 | 6.027 | 2.739 | 2.124 | neuromedin B |
| Npy1r | 0.288 | 1.422 | 0.835 | 0.309 | 0.371 | 0.383 | neuropeptide Y receptor Y1 |
| Ppara | 78.683 | 0.597 | 0.597 | 8.704 | 0.703 | 1.47 | peroxisome proliferator activated receptor alpha |
| Pparg | 5.735 | 0.681 | 0.492 | 2.228 | 1.033 | 1.085 | peroxisome proliferator activated receptor gamma |
| Ppargc1a | 2.11 | 0.118 | 0.113 | 1.707 | 0.701 | 0.582 | peroxisome proliferative activated receptor, gamma, coactivator 1 alpha |
| Ramp3 | 4.255 | 1.803 | 2.387 | 4.022 | 4.775 | 2.48 | receptor (calcitonin) activity modifying protein 3 |
| Sort1 | 6.212 | 0.633 | 0.461 | 4.361 | 0.716 | 0.627 | sortilin 1 |
¹ Same definitions as Table 1.
Table 3.
Expression of inflammation-related genes in 3T3-L1 adipocytes1.
| Gene | DIM | HES | NAR | NOB | SIN | TAN | Description |
|---|---|---|---|---|---|---|---|
| Ccl20 | 2.482 | 70.47 | 64.112 | 3.881 | 32.516 | 35.877 | chemokine (C-C motif) ligand 20 |
| Mif | 1.736 | 1.977 | 2.061 | 2.159 | 1.811 | 1.779 | macrophage migration inhibitory factor |
| Ccl11 | 0.053 | 0.083 | 0.171 | 0.031 | 0.035 | 0.036 | chemokine (C-C motif) ligand 11 |
| Ccl17 | 0.265 | 1.256 | 0.615 | 0.101 | 0.058 | 0.059 | chemokine (C-C motif) ligand 17 |
| Ccl2 | 0.218 | 3.893 | 3.602 | 0.464 | 0.68 | 1.229 | chemokine (C-C motif) ligand 2 |
| Ccl5 | 0.491 | 11.7 | 11.249 | 1.53 | 0.697 | 6.501 | chemokine (C-C motif) ligand 5 |
| Ccl6 | 0.913 | 1.2 | 0.127 | 0.332 | 0.067 | 0.104 | chemokine (C-C motif) ligand 6 |
| Ccl7 | 0.385 | 1.876 | 1.806 | 0.283 | 0.351 | 0.614 | chemokine (C-C motif) ligand 7 |
| Ccl8 | 0.042 | 0.465 | 0.487 | 0.063 | 0.046 | 0.186 | chemokine (C-C motif) ligand 8 |
| Ccl9 | 3.265 | 4.79 | 0.747 | 1.218 | 0.715 | 0.554 | chemokine (C-C motif) ligand 9 |
| Csf1 | 0.434 | 2.595 | 2.388 | 0.948 | 1.111 | 1.329 | colony stimulating factor 1 (macrophage) |
| Cx3cl1 | 0.574 | 0.752 | 0.455 | 0.09 | 0.111 | 0.253 | chemokine (C-X3-C motif) ligand 1 |
| Cxcl1 | 0.667 | 52.143 | 50.38 | 10.686 | 24.211 | 40.167 | chemokine (C-X-C motif) ligand 1 |
| Cxcl10 | 0.843 | 7.685 | 10.55 | 0.084 | 0.099 | 2.648 | chemokine (C-X-C motif) ligand 10 |
| Cxcl11 | 1.000 | 6.312 | 20.456 | 1.956 | 1.073 | 2.313 | chemokine (C-X-C motif) ligand 11 |
| Cxcl5 | 0.16 | 81.203 | 48.136 | 3.01 | 5.966 | 15.186 | chemokine (C-X-C motif) ligand 5 |
| Il15 | 2.537 | 5.296 | 26.586 | 1.000 | 1.108 | 5.917 | interleukin 15 |
| Il1a | 1.00 | 10.557 | 20.857 | 3.888 | 8.128 | 11.901 | interleukin 1 alpha |
| Il33 | 0.379 | 3.836 | 1.749 | 0.027 | 0.376 | 0.74 | interleukin 33 |
| Nampt | 3.857 | 3.437 | 3.692 | 3.04 | 2.645 | 2.719 | nicotinamide phosphoribosyltransferase |
¹ Same definitions as Table 1.
Table 4.
Binding affinity and Interaction profile of citrus flavonoids with AhR1.
| Target | Ligand | Binding affinity (kcal/mol) |
Interaction | |
| Hydrophobic | Hydrogen bond | |||
| AhR |
HES | -8.9 | Ala79, Ile154, Leu118, Leu119, Phe56, Phe83, Pro55, Ser139, Ser75, Tyr76, Val126 |
Gln150, Lys80, Phe136, Ser140,Tyr137 |
| NAR | -8.7 | Ala79, Ile154, Leu118, Leu119, Phe56, Phe83, Pro55, Ser139, Ser75, Tyr76, Val126, |
Gln150, Lys80, Phe136, Ser140,Tyr137 | |
| NOB | -6.6 | Glu116, Gly115, Ile154, Leu199, Leu72, Phe136, Phe56, Phe83, Pro55, Ser75, Tyr137, Tyr76 |
- | |
| SIN | -6.8 | Ala79, Glu116, Gly115, Ile154, Leu119, Leu72, Phe136, Phe56, Pro55, Ser75, Tyr137, Tyr76 |
- | |
| TAN | -6.7 | Ala79, Gln150, Gly115, Ile154, Leu119, Leu72, Phe56, Phe83, Ser75, Tyr137,Tyr76 |
- | |
1 Binding energies (kcal/mol) were calculated using Auto Dock Vina. Key interaction residues were identified via LigPlot+, PyMOL, and Chimera visualization. Higher negative values indicate stronger binding affinity. HES: Hesperidin; NAR; Narirutin; NOB: Nobiletin; SIN; Sinensetin; TAN: Tangeretin; AhR: Aryl Hydrocarbon Receptor.
Disclaimer/Publisher’s Note: The statements, opinions and data contained in all publications are solely those of the individual author(s) and contributor(s) and not of MDPI and/or the editor(s). MDPI and/or the editor(s) disclaim responsibility for any injury to people or property resulting from any ideas, methods, instructions or products referred to in the content. |
© 2025 by the authors. Licensee MDPI, Basel, Switzerland. This article is an open access article distributed under the terms and conditions of the Creative Commons Attribution (CC BY) license (http://creativecommons.org/licenses/by/4.0/).
Copyright: This open access article is published under a Creative Commons CC BY 4.0 license, which permit the free download, distribution, and reuse, provided that the author and preprint are cited in any reuse.


