
Submitted:
28 April 2025
Posted:
29 April 2025
You are already at the latest version
Abstract
This paper introduces an innovative mobile-assisted language learning (MALL) system that harnesses deep learning technology to analyze pronunciation patterns and deliver real-time, personalized feedback. Drawing inspiration from how the human brain processes speech through neural pathways, our system analyzes multiple speech features spectrograms, mel-frequency cepstral coefficients (MFCCs), and formant frequencies in a manner that mirrors the auditory cortex's interpretation of sound. The core of our approach utilizes a convolutional neural network (CNN) to classify pronunciation patterns from user-recorded speech. To enhance assessment accuracy and provide nuanced feedback, we integrate a fuzzy inference system (FIS) that helps learners identify and correct specific pronunciation errors. Experimental results demonstrate that our multi-feature model achieves 87% accuracy in accent classification across diverse linguistic contexts. User testing revealed statistically significant improvements in pronunciation skills, with learners showing 5-20% enhancement in accuracy after using the system. The proposed MALL system offers a portable, accessible solution for language learners while establishing a foundation for future research in multilingual functionality and mobile platform optimization. By combining advanced speech analysis with intuitive feedback mechanisms, this system addresses a critical challenge in language acquisition and promotes more effective self-directed learning.
Keywords:
speech recognition
; accent classification
; convolutional neural networks
; fuzzy inference systems
1. Introduction
In an increasingly globalized world, English has established itself as the primary language for international communication, attracting learners from various linguistic backgrounds. Language learning encompasses not only grammar and vocabulary, but also accent and pronunciation, which significantly affect communicative competence and speech standardization [1]. Regional accents, shaped by speakers’ native languages, often introduce challenges in achieving clear and comprehensible English. Recent advancements in deep learning technologies have accelerated the development of speech analysis systems, demonstrating their potential to enhance language learning outcomes. However, regional accents, often influenced by a speaker’s native language, introduce challenges in achieving clear and comprehensible English. Recent advances in deep learning technology have fueled the development of sophisticated speech analysis systems, offering potential for improving language learning outcomes through enhanced pronunciation feedback [2,4]. Furthermore, pronunciation is a fundamental component of effective communication, yet it remains one of the most challenging aspects for language learners. nonnative speakers often substitute phonemes with those familiar from their native languages, producing distinct accents that can impede mutual understanding [1,7]. Addressing pronunciation through targeted learning tools not only enhances learners’ speech intelligibility but also fosters confidence and fluency in language use [2,6]. Convolutional neural networks (CNNs), in particular, have proven to be effective in feature extraction and classification tasks within speech recognition [3,6]. These models can discern intricate patterns in audio data, making them highly suitable for accent recognition and pronunciation analysis. Nevertheless, the majority of studies focus on major English accents, such as American and British, with limited exploration and application for a broader array of nonnative accents [4,5,8]. Machine learning techniques, including Mel frequency cepstral coefficients (MFCCs) and spectrogram-based feature extraction, have shown promise in classifying and assessing nonnative pronunciation [7,11]. Such approaches enable more precise identification of speech characteristics, contributing to personalized feedback systems designed to support accent improvement and language learning. Deep learning-powered speech analysis systems offer a refined approach to evaluating pronunciation and accent, providing feedback with greater accuracy. By utilizing models trained on diverse linguistic data, these systems offer feedback tailored to learners’ unique needs, encouraging an iterative learning process [8,9]. This focus on accent adaptation and enhancement is crucial for supporting language acquisition and reducing communication barriers among nonnative speakers. Despite substantial progress, current speech recognition and analysis systems encounter limitations, particularly in handling a wide range of accents with the same efficacy as native accents [5]. Most models are optimized for standard American and British English, leading to an underrepresentation of nonnative accents [4,11]. Additionally, noise sensitivity and variations in pronunciation reduce the effectiveness of these systems in real-world scenarios [3,5].
In a study by Ensslin et al. [6], deep learning was investigated for speech accent detection within video games, with a focus on sociolinguistic aspects, such as stereotypical accent usage and related social judgments. AlexNet was trained on the Speech Accent Archive data and applied to audio from a video game. To optimize the model, experiments were conducted with varying parameters, including epochs, batch sizes, time windows, and frequency filters, resulting in an optimal test accuracy of 61%. Following training, 75% accuracy was achieved on the Speech Accent Archive data and 52.7% accuracy on game audio samples, with accuracy improving to 60% in low-noise conditions. Limitations in speech analysis systems, which are typically optimized for American and British English, were addressed by Upadhyay and Lui [4]. A model capable of classifying nonnative accents was developed. Audio signals were pre-processed and converted to MFCCs. Four classification methods were tested: Random Forest, Gradient Boosting, CNN, and Multi-layer Perceptron (MLP). Among these methods, the CNN model demonstrated the highest accuracy, achieving rates between 80% and 88%, significantly outperforming traditional approaches.
Foreign-accented English classification was explored by Russell and Najafian [5] to determine speakers’ countries of origin. A corpus of 30 speakers from six countries was developed, and MFCC features were used with a Deep Belief Network (DBN) classifier. After noise cancellation and normalization, the DBN model, consisting of two hidden layers with 1000 nodes 90 each, achieved 90.2% accuracy for two accents and 71.9% for six accents, outperforming conventional classifiers like SVM, k-NN, and Random Forest. Pronunciation quality in English learners was assessed by Nicolao et al. [10] using deep neural network features and phoneme-specific discriminative classifiers. A system was introduced to provide phoneme-level scoring based on teacher-annotated error patterns. Learner pronunciation was compared with a reference, and pronunciation scores were generated based on phoneme duration and similarity.
For mobile-assisted pronunciation learning, the Smartphone-Assisted Pronunciation Learning Technique (SAPT) was proposed by Lee et al. [9]. Pronunciation errors were detected, and words were recommended for practice. Processing was offloaded to an Internet of Things (IoT) system to address the constraints of low-computation devices. Through a seven-step process, user speech was analyzed, phoneme correlations were evaluated, and practice words were suggested. Finally, pronunciation variation across English varieties was addressed by Kasahara et al. [8]. A structure-based method to predict pronunciation distances was proposed. Support Vector Regression (SVR) and Bhattacharyya Distances (BDs) were used to represent pronunciation differences. Local contrasts and phonetic class features were identified as significant contributors to accurate pronunciation distance predictions, as indicated by high correlation scores. In [26], MALL was proposed as a tool to enhance student motivation and readiness, promoting flexibility and engagement in language learning for achieving positive outcomes. However, the study faced limitations, including a restricted sample from Indian universities, hardware constraints affecting speaking and listening tasks, a narrow focus on English. Liu et al. [27] proposed a knowledge based intelligence program to address pronunciation challenges. The proposed methods achieved significant accuracy in classifying correct and incorrect pronunciations. However, the study’s limitations include a small dataset and its generalizability to other phonemes and real-world contexts. Recently, Rukwong and Pongpinigpinyo [28] introduced an innovative approach to computer-assisted pronunciation training (CAPT) for Thai vowel recognition, leveraging CNN and acoustic features such as Mel spectrograms. Their system effectively addresses key challenges in Thai vowel pronunciation training, including the reliance on expert intervention and the complexity of traditional manual methods. While the system demonstrated impressive accuracy of 98.61%, its limitations include a reliance on a narrowly focused dataset of standard Thai speakers in controlled environments, raising concerns about its adaptability and robustness in diverse real-world scenarios.
Although significant progress has been demonstrated in accent classification and pronunciation analysis, several limitations remain. Most systems prioritize American and British English accents, with limited application to nonnative or regional varieties. Few studies address the challenges of deploying these systems on resource-constrained mobile platforms [9]. Additionally, current systems rarely accommodate multiple languages or integrate multimodal inputs, which limits their adaptability.
Pronunciation, a fundamental component of language proficiency, remains one of the most challenging aspects for nonnative speakers to master. Current speech feedback systems often lack the precision, accessibility, and personalization needed to significantly improve pronunciation skills. This study addresses these limitations by introducing a novel Mobile-Assisted Language Learning (MALL) application that leverages deep learning technology to analyze nonnative English accents with unprecedented accuracy. Our system employs advanced pre-processing techniques and multiple feature extraction methods, including mel-frequency cepstral coefficients (MFCCs) and spectrograms, to create a robust framework for accent identification and customized pronunciation feedback. By prioritizing inclusivity and accuracy within a user-friendly mobile interface, the proposed MALL application bridges the critical gap between self-guided learning and professional pronunciation training. The system's interactive and adaptive approach enables learners to practice independently while receiving clear, actionable feedback that facilitates continuous improvement. This research not only enhances the technological capabilities of pronunciation assessment but also transforms the learning experience for nonnative speakers by making expert-level guidance accessible anytime and anywhere through mobile technology.
2. Materials and Methods
2.1. System Architecture
The proposed system adopts a client-server architecture tailored to support efficient speech processing and analysis. The client component, a mobile application developed using React Native, enables users to record their speech and submit audio files to the server for processing. This design ensures cross-platform compatibility on both iOS and Android devices. On the server side, a Python-based framework facilitates comprehensive audio pre-processing, feature extraction, and analysis using deep learning models. The server leverages Flask, a lightweight web framework, to efficiently manage data requests and audio processing tasks. Figure 1 provides a visual representation of the system’s architecture, detailing the data flow between the client and server. This illustration highlights the transfer, processing, and analysis of audio files, culminating in the delivery of real-time feedback to the user. Such a configuration fosters a seamless user experience, enhancing engagement in language learning by delivering instant feedback on pronunciation and accent classification.
The results of this research are presented through a system consisting of both client-side and server-side components, implemented in a simple client-server architecture, as shown in Figure 2. The mobile application captures the user’s voice input, which is then sent to the server as a .wav file. Once the server processes the input signal, the analyzed results are returned to both the mobile and desktop applications.
The diagram delineates the step-by-step workflow from initial user input through server-side processing, emphasizing a modular architecture that facilitates straightforward updates and the integration of additional features. This design enhances scalability and supports the maintenance of real-time interactions, which are essential for mobile-assisted language learning applications. The proposed system was implemented using Python within the PyCharm 2018.1 development environment. A variety of libraries, detailed in Table 1, were utilized during the implementation process. The development and experimental evaluations were performed on a personal computer with the following specifications: Intel Core i5-8400 CPU (2.80 GHz), 24 GB of RAM, and a 64-bit operating system.
2.2. Pre-Processing Techniques
The primary goal of these pre-processing techniques is to standardize the recorded speech into a consistent input format, thereby minimizing variability that could interfere with accurate analysis. By aligning the input format across all audio samples, pre-processing reduces fluctuations caused by inconsistencies in the recording environment, speaker volume, or background noise. Additionally, achieving a clean, noise-free condition is crucial to focus the model on the essential features of the speech itself rather than irrelevant environmental artifacts. This uniformity and clarity in the input data enhance the reliability and accuracy of feature extraction, model training, and subsequent analysis. Therefore, in this study, these pre-processing techniques employed the following processes.
2.2.1. Speech Signal Normalization
This ensures consistency across audio samples, preventing variations in amplitude from impacting analysis. The initial pre-processing step involves adjusting the audio signal so that its mean value is zero. This stabilization minimizes baseline fluctuations that could interfere with feature extraction. Amplitude normalization scales the audio signal to a standardized range, typically between -1 and 1, by dividing each value by the signal’s maximum absolute value. This process removes any baseline offset, centering the signal around zero to stabilize it for further analysis.
2.2.2. Speech Segmentation
To ensure consistency and optimize neural network processing, the speech signal is standardized to a predetermined length, creating uniform input data. Signal power calculation aids in isolating significant speech segments by distinguishing vocalized parts from silence, allowing the analysis to focus on relevant portions of the speech. This process involves computing the standard deviation within a fixed window size (e.g., 256 samples) to identify speech segments. A threshold is applied to exclude non-speech portions, retaining only meaningful speech for feature extraction. Segments with standard deviation values above the threshold are classified as speech. Speech segmentation further divides the signal into smaller, analyzable units based on these thresholding criteria. Additionally, an error-removal step eliminates small, noisy sections mistakenly classified as speech. This refinement produces cleaner and more accurate inputs for feature extraction, thereby enhancing the reliability of model training and the overall analysis process.
2.3. Feature Extraction and Model Training
The pre-processed speech data allowed for precise extraction of salient features, enabling the construction of both one-dimensional and two-dimensional arrays tailored for specific analytical objectives. Our approach is informed by neuroscientific understanding of human speech processing, where the auditory cortex interprets sound through complex neural pathways using time-frequency representations [20]. This biological inspiration directly influenced our feature extraction methodology.
2.3.1. Spectrogram Analysis
Spectrograms provide time-frequency representations of audio signals through Short Time Fourier Transform (STFT). This method captures both temporal and spectral characteristics of speech by segmenting the signal into smaller sections (N=256 samples per segment in our implementation) and calculating frequency components over time [9]. The mathematical representation of STFT is:
where is the STFT of the signal at time frame n and frequency bin is the discrete-time signal at sample m, is the rectangular window function applied to the segment centered at n, is the complex exponential for the frequency bin k, and N is the total number of samples in one windowed segment. The spectrogram,, is commonly represented as the magnitude squared of the STFT:
2.3.2. Mel-Frequency Cepstral Coefficients
MFCCs mimic human auditory perception by mapping the power spectrum onto the mel scale, which approximates how humans perceive pitch. The computation involves three primary steps.
- Applying a mel-scale filter bank to map the linear frequency scale onto a non-linear mel scale.
- Taking the logarithm of the mel-filtered spectrum to compress dynamic range.
- Applying Discrete Cosine Transform (DCT) to obtain the final coefficients.
The mathematical representation for the DCT calculation of MFCCs is:
where is the c-th MFCC, L is the number of Mel filters, and L[k] is the log Mel-filtered spectrum. The result is a set of MFCCs, which represent the frequency content of the signal in a form that is more closely aligned with human auditory perception.
2.3.3. Formant Frequency Analysis
Formant frequencies represent the resonant frequencies of the vocal tract and are crucial for identifying vowel and consonant sounds. By extracting the first three formants (,,), we complement the information from spectrograms and MFCCs, creating a more comprehensive feature set that better characterizes pronunciation patterns.
2.3.4. Model Training and Optimization
Our dataset comprised audio recordings from both native and nonnative English speakers with diverse accent profiles. To enhance model generalization and mitigate overfitting, we applied data augmentation techniques including pitch shifting and time stretching [18]. These methods improved the model's adaptability to varied speech inputs and enhanced classification performance.
The training configuration consisted of:
- -
- Loss function: Cross-entropy
- -
- Optimizer: Adam (learning rate: 0.001)
- -
- Epochs: 50
- -
- Batch size: 32
- -
- Dataset split: 75% training, 15% validation, 15% testing
Hyperparameters were optimized through grid search to balance processing efficiency and model performance. This methodical optimization process resulted in a model configuration that achieved optimal accuracy while maintaining reasonable training time requirements.
3. Results
The pre-processing phase is essential for enhancing the quality and consistency of audio signals before feature extraction and classification. Figure 3 shows the preprocessing stages, how the original audio signal undergoes transformations such as zero-mean normalization, fixed-length segmentation, and noise removal to improve clarity and uniformity.
Figure 4 highlights the impact of preprocessing on the audio signal, illustrating significant improvements in clarity and consistency. These enhancements directly affect the quality of extracted features, which form the basis of the classification model.
Figure 5 provides an overview of the extracted features used for classification, including spectrograms, MFCCs, and formant frequencies. These features serve as critical inputs for the CNN model and contribute to its high classification accuracy, as demonstrated in [19]. The proposed method involves a feature extraction procedure aimed at identifying salient characteristics from a pre-processed signal to form a two-dimensional array with unique properties. These two-dimensional representations-Spectrogram and MFCC-are then used as input data for the CNN model, both as array data and image data, formatted with a resolution of 640x480 pixels.
3.1. Data Preparation
The dataset used in this study was sourced from the OSCAAR (Open Speech Corpus for Accent 270 Recognition), which contains a scripted reading scenario. In this scenario, participants clearly enunciated a scripted list of words one at a time. This dataset proved valuable during the pre-processing step, where we segmented individual word utterances from the original speech recording. The segmentation produced a collection of word-level utterances, which were then used for further feature extraction and analysis.
In addition to the Hoosier database of native and nonnative speech, this database includes digital audio recordings of both native and nonnative English speakers reading words, sentences, and paragraphs, providing a diverse range of speech samples for our study. The Hoosier Database1 of Native and nonnative Speech consists of 27 speakers, representing the aforementioned seven native language backgrounds. These speakers produced a total of 1,139 recordings across the various tasks listed in Table 2 and Table 3.
This study also includes a group of Chinese-accented subjects who participated in the experiment. A total of 50 participants were selected (25 male and 25 female), with ages ranging from 18 to 30 years. None of the subjects had any prior background in English proficiency tests. The audio signals were recorded in a soundproof studio, ensuring a high signal-to-noise ratio (SNR) of 60 dB or higher, in line with the standard for high-quality studio sound recordings. The recordings were captured at Dali University, where all participants gave their informed consent to take part in the study. The inclusion of this additional accent category serves two primary purposes: first, to explore the development of a system designed to help native Chinese speakers learn other languages, and second, to investigate how variations in the dataset may influence the performance of deep learning models. This research aims to measure the impact of these differences on the model’s accuracy and robustness. The participants were selected from a group of native Chinese individuals with no history of exposure to environments that might influence their pronunciation, such as attending international schools from a young age or engaging in prolonged daily interactions with foreigners. For the recordings, a sampling rate of 44,100 Hz was used. The recordings were made in a mono-channel configuration, with a 16-bit resolution, ensuring high-quality, precise sound capture.
3.2. Model Training and Test Results
The approach employed in this study leverages deep learning techniques to develop a reference-based model for word pronunciation. This model functions as a classifier to analyze, assess, and classify pronunciation accuracy from speech or word input. The proposed method utilizes a CNN model to achieve this task. The data used to train the deep learning model consists of the extracted features from the pronunciation audio of words or speech, which are represented through corresponding spectrograms, MFCCs, and formant frequencies. The CNN model was trained with different feature sets, including MFCCs, spectrograms, and formant frequencies.
The results, summarized in Table 4, highlight the effectiveness of MFCCs and spectrograms, with test accuracies peaking at 73.89% and 74.27%, respectively. As demonstrated by previous research, MFCCs can achieve high precision when used for accent classification. In this study, we aim to investigate how the chosen dataset and pre-processing methods impact the classification results across eight distinct accent classes.
Figure 6 (a) illustrates the average accuracy across all parameters during the training of the classification model using the MFCC dataset with a 0.005 threshold over 30 epochs. After the 15th epoch, the model began to overfit: while the training accuracy continued to improve, the testing accuracy plateaued and remained stagnant. Figure 6 (b) presents the confusion matrix for the MFCC-based model. The distribution of correctly predicted accents is relatively uniform across the different accent classes, with most classes having a prediction frequency exceeding 300 instances in the test dataset. This discrepancy is attributed to the unequal distribution of data, as the German-accented speech data were approximately 20% less than other accent data, leading to a slight imbalance in predictions. The spectrogram-based model demonstrated superior performance, achieving a peak test accuracy of 79% when optimized network parameters were applied, as shown in Table 4. This underscores the ability of spectrograms to capture more detailed temporal and frequency-related information, providing a more comprehensive representation of the speech signal compared to MFCCs alone.
In Table 5, the highest precision achieved by the model was 0.829, while the lowest precision across all parameters derived from MFCC-based data was 0.7878. These results indicate that the spectrogram approach consistently outperformed the MFCC method.
Figure 7 (a) illustrates the average accuracy across all parameters while training the classification model using the spectrogram dataset with a threshold of 0.005 and 30 epochs. After approximately the 24th epoch, the accuracy stabilized and ceased to improve. Figure 7 (b) shows the prediction map for all classes from the classification model trained using spectrograms. The pattern is consistent across all classes, with a very high prediction rate, except for the German accent, which showed lower accuracy. The highest classification accuracy, approximately 87%, was achieved by combining MFCCs and spectrograms. This approach leverages both the frequency emphasis from MFCCs and the temporal detail from spectrograms, optimizing the model’s classification capabilities for accent detection.
3.3. Period of Phonetic (PoP)
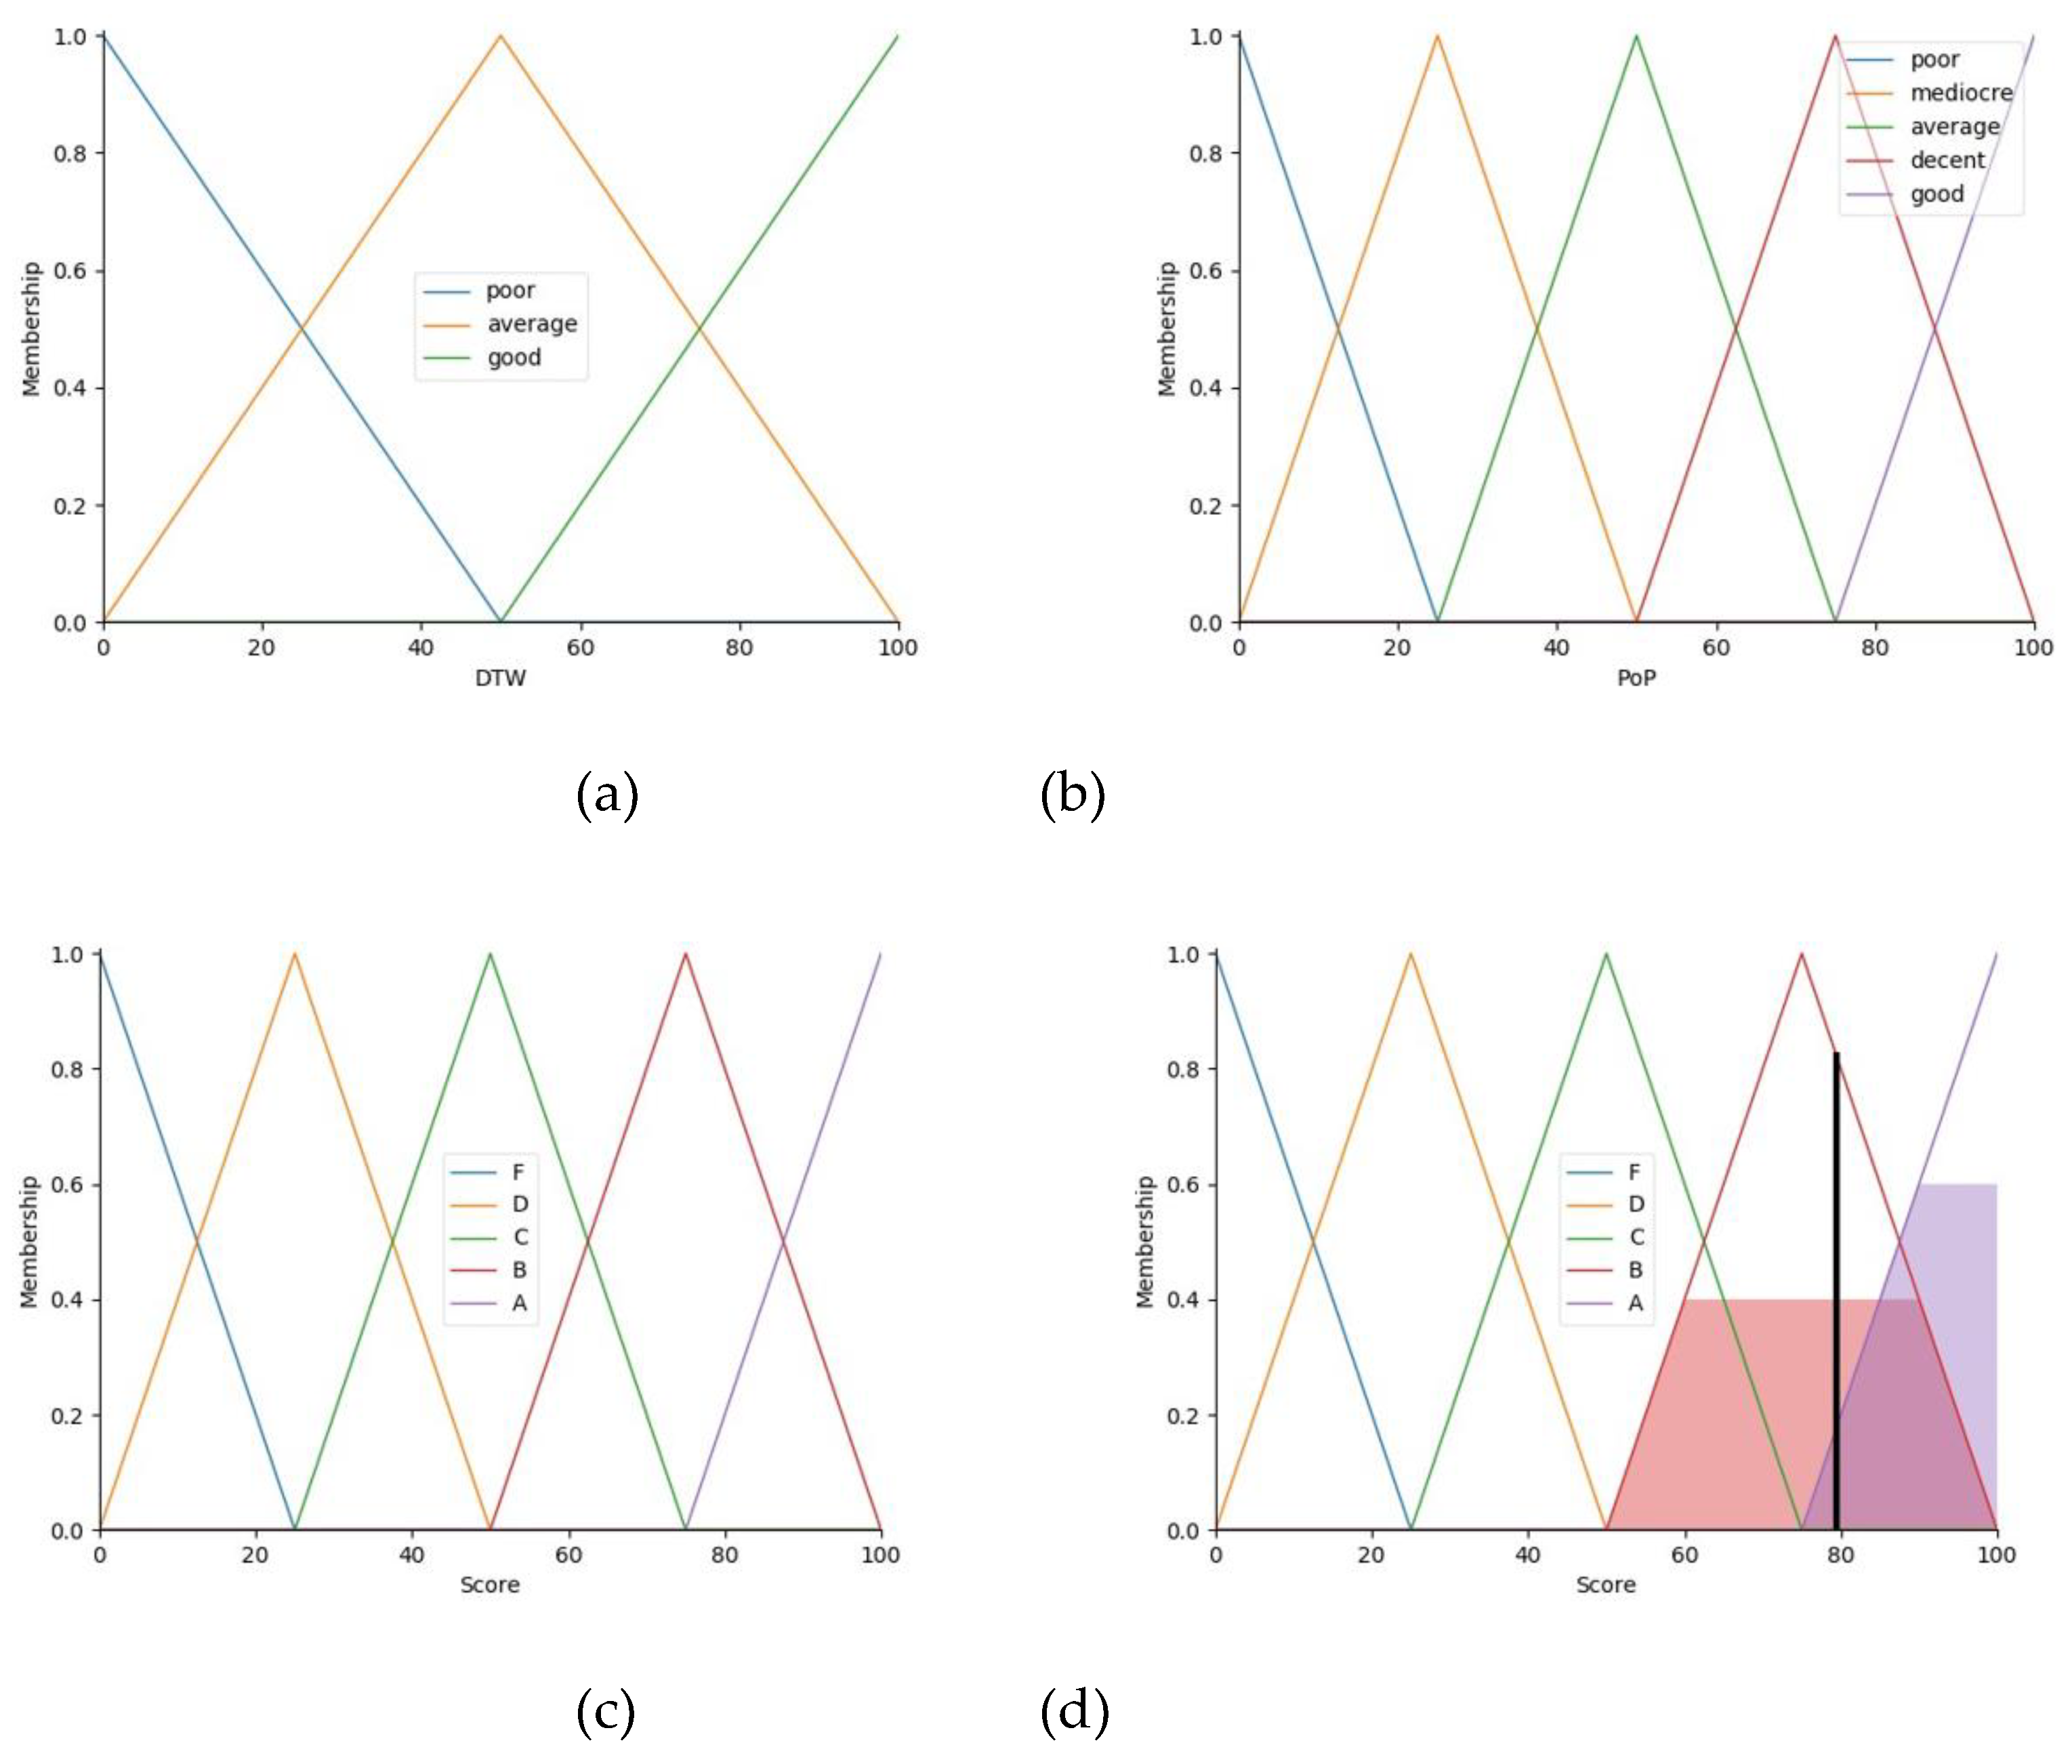
PoP approach begins by segmenting the phonetic components of the sample signal using a preprocessing method. The resulting PoP value represents the time (in seconds) of each segmented part of the sample signal, as compared to each corresponding template segment. During the segmentation process, a single threshold is insufficient to achieve optimal segmentation results. Therefore, an adaptive thresholding method is employed, which spans values from 0.001 to 0.017. The PoP values are constrained within a range of 0 to 1 second. PoP is converted into five sets of fuzzy since its value can distinguish the range of similarity better including poor, mediocre, average, decent, and good.
3.4. Dynamic Time Warping (DTW)
DTW is used to extract features from the MFCCs of both the template and sample signals. DTW measures the similarity between the temporal sequences of the signals, producing a normalized distance value. DTW is converted into three sets of fuzzy due to the large boundary of its value including poor, average, and good.
3.5. Knowledge Base
This section stores IF-THEN rules in the format illustrated in Table 6, which represents a matrix of DTW values and PoP values. In Figure 9 (d), the score obtained from evaluation is shown. The centroid estimation method, used to find the center of the graph area, computes the result. For this example, the final decision using the center of gravity is approximately 79.39.
The proposed system features a server monitoring interface, as shown in Figure 8, which presents overview of the entire processing. This includes the preprocessing and feature extraction steps, ensuring that the system not only provides immediate feedback to the user but also performs real-time assessment and analysis in the background. This integrated approach helps maintain the accuracy and consistency of the pronunciation evaluation throughout the process.
Figure 8.
Server Monitoring Interface of the Proposed System. This interface provides a comprehensive overview of the entire processing workflow, including preprocessing and feature extraction steps. It enables real-time evaluation and feedback of pronunciation accuracy while maintaining system performance and consistency in analysis.
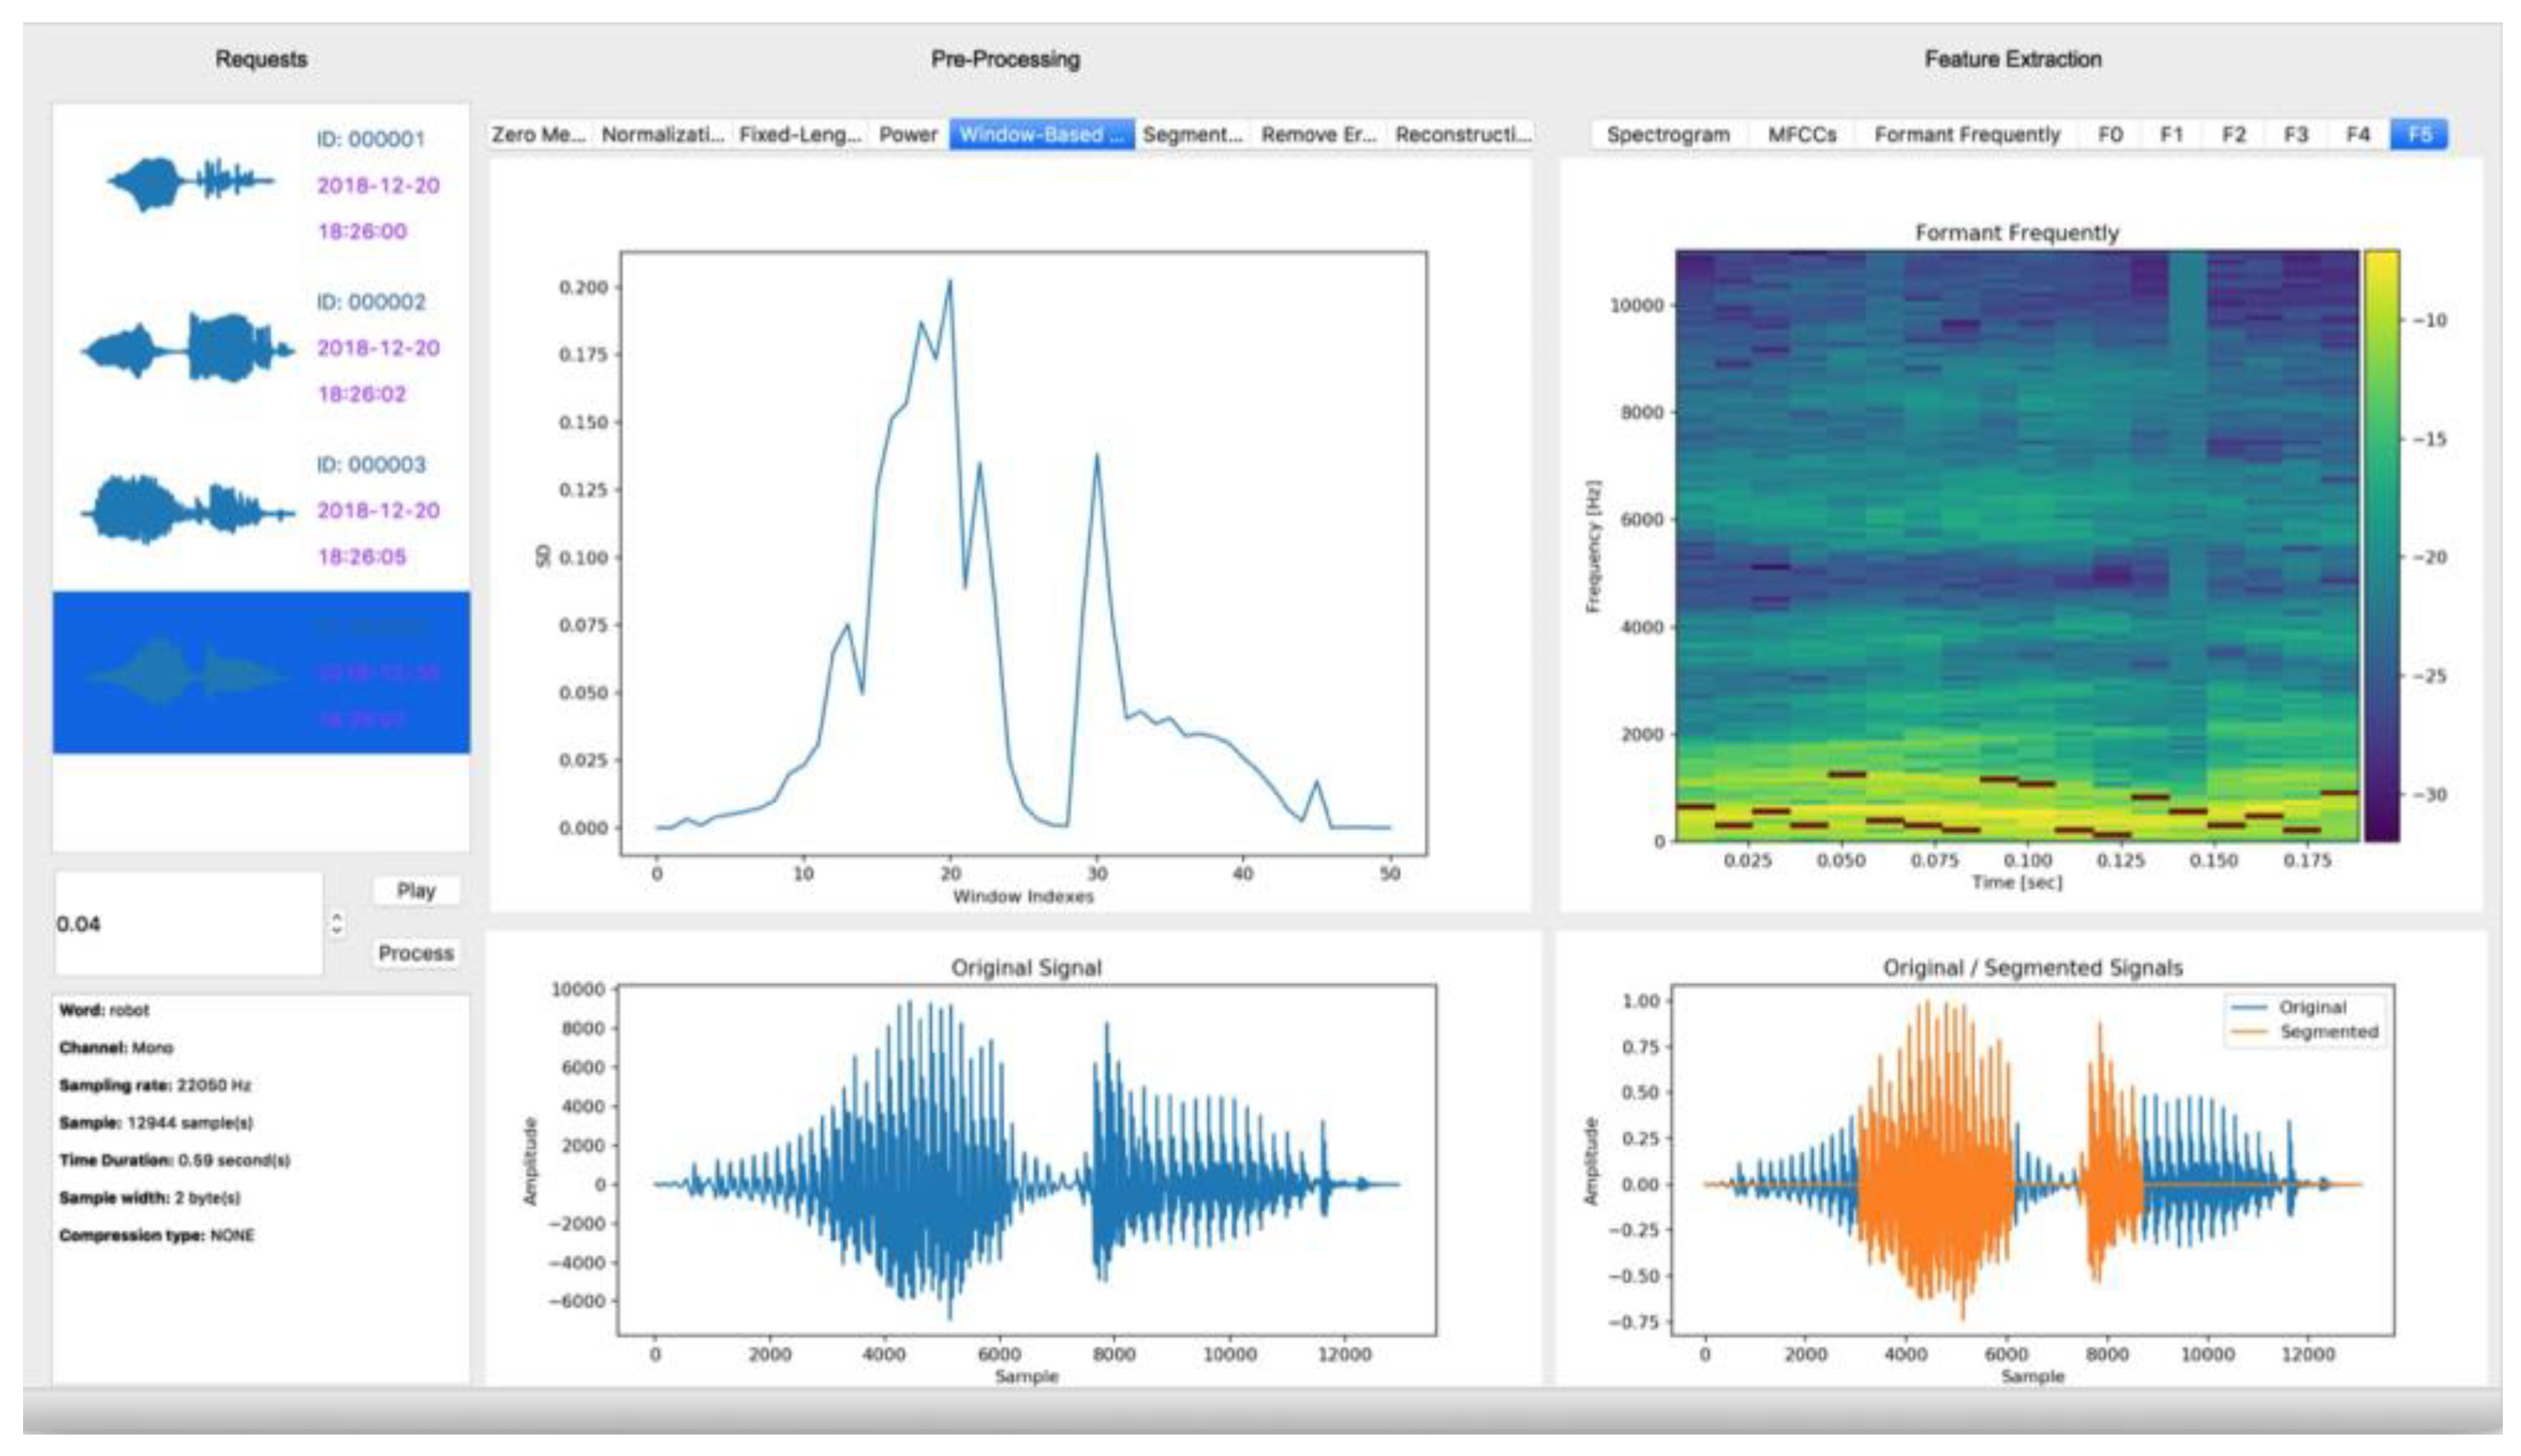
Figure 9.
Membership functions and final score evaluation: (a) DTW, (b) PoP, (c) Score, and (d) Final score after evaluation.
Figure 9.
Membership functions and final score evaluation: (a) DTW, (b) PoP, (c) Score, and (d) Final score after evaluation.
3.6. Mobile-Assisted Language Learning (MALL)
To implement a mobile platform interface showcasing the system’s workflow, we utilized the React Native framework, a hybrid mobile development framework that enables efficient development while ensuring compatibility with both Android and iOS platforms. Figure 10 (a) presents the main page, where users can interact with the MALL system by pressing the microphone button to record audio. The recorded audio is automatically sent to the server for processing. Figure 10 (b) displays the list of available words that can be assessed using the proposed method.
Figure 11 illustrates the results of 10 selected subjects, chosen from a total of 50 participants, who attempted to pronounce 10 words with 5 trials per word. The scores range from 55 to 80, compared to the native speakers’ scores, which range from 80 to 100. The standard deviations are represented by the error bars. Notably, all selected subjects had studied in an international program, which may have contributed to their relatively high initial scores.
Before using the MALL proposed system, the subjects’ pronunciation correctness was significantly lower, with scores trailing the native speech data by 5% to 20%. After utilizing the MALL system, which provided real-time feedback and detailed pronunciation assessments, all subjects showed notable improvement in their pronunciation accuracy. The increased scores highlight the system’s effectiveness in bridging the gap between nonnative and native pronunciation, demonstrating its potential as a powerful tool for language learning and accent refinement.
4. Discussion
This study makes several significant contributions to the field of mobile-assisted language learning and pronunciation analysis. First, we demonstrate that combining multiple complementary feature extraction methods—spectrograms, MFCCs, and formant frequencies—achieves superior accent classification accuracy (87%) compared to single-feature approaches. Second, we introduce a novel integration of fuzzy inference systems with deep learning models to provide nuanced, interpretable feedback that accommodates natural speech variability. Third, our mobile implementation makes sophisticated pronunciation assessment accessible outside traditional learning environments, addressing a critical gap in self-directed language learning. Fourth, our experimental results confirm that this approach leads to measurable improvements in pronunciation accuracy (5-20%), validating the practical effectiveness of our system. These advances collectively represent a meaningful step forward in making pronunciation training more personalized, accessible, and effective for nonnative language learners. The following sections examine these contributions in the context of existing research and practical applications.
4.1. Comparison of Study Findings with Existing Literature
The findings of this study align closely with existing research on the application of deep learning techniques in speech analysis, particularly within MALL contexts. The high accuracy rates achieved by the CNN model in this study are consistent with prior work emphasizing CNNs’ effectiveness in speech classification tasks. For example, Lesnichaia et al. [18] demonstrated that CNNs excel at managing complex speech patterns and distinguishing subtle pronunciation variations due to their capacity to extract hierarchical features from input data. Similarly, Mikhailava et al. [19] highlighted the robustness of CNN models in handling sparse and crowd sourced speech data, further validating their applicability in diverse linguistic settings. The use of spectrograms and MFCCs as input features corroborates established literature on the effectiveness of combining time-frequency representations with perceptually relevant spectral data. Sejdic et al. [7] and Zhang and Liu [2] demonstrated that the integration of MFCCs with spectrograms significantly enhances classification performance, as the two feature types provide complementary information. This study confirmed these findings, showing that the combination of spectrograms and MFCCs increased model accuracy to approximately 87%, outperforming the individual contributions of each feature set.
Furthermore, the inclusion of formant frequencies added phonetic depth to the analysis, particularly for distinguishing vowel sounds. This finding aligns with Kasahara et al. [8], who emphasized the importance of formant frequencies in differentiating phonetic elements. While formants alone did not achieve the accuracy of spectrograms or MFCCs, their integration into a multi-feature approach enhanced overall robustness, reinforcing the argument that combining diverse features yields more comprehensive results. The application of fuzzy logic for pronunciation assessment represents a novel contribution to the fuzzy logic in managing uncertainty in speech processing tasks [17]. The FIS implemented in this study facilitated flexible, interpretable pronunciation feedback, making it well-suited for user-centric language learning applications. By enabling context-aware evaluations, the system provided a more nuanced alternative to rigid scoring mechanisms. In summary, this study validates and extends existing literature by demonstrating that a well-integrated approach, i.e., combining CNN models, multi-feature extraction methods, and fuzzy logic assessment, can substantially enhance pronunciation analysis
4.2. System Potential and Challenges in Practical Application
The system developed in this study demonstrates significant potential for enhancing language learning by providing personalized feedback and real-time pronunciation analysis. By leveraging deep learning models, such as CNNs, the system effectively classifies accents and delivers targeted improvement recommendations. The mobile-assisted approach enhances accessibility, enabling users to practice pronunciation anytime and anywhere, thereby supporting the democratization of language education [18,19].
However, challenges persist in real-world deployment. One primary concern is the system’s performance in noisy environments, which can impact the accuracy of speech recognition and classification. While pre-processing techniques such as noise reduction and signal normalization help mitigate these issues, achieving consisten [18,19] performance across varied real-world scenarios remains complex. Johnson and Wang [22] noted similar challenges, emphasizing the need for robust noise-handling mechanisms.
Another challenge involves addressing variability in user accents and speech rates, requiring the model to handle diversity effectively to provide reliable feedback [2]. Incorporating advanced data augmentation techniques and expanding the training dataset to include more diverse accents could further improve model performance in this regard. User engagement and feedback interpretability are also critical considerations. Ensuring users understand and act on the system’s feedback necessitates clear, intuitive interfaces, as demonstrated in Figure 5 and Figure 3, which illustrate how processed results and detailed analyses are presented. Overcoming these challenges is essential for the practical adoption and sustained use of pronunciation learning tools.
4.3. Importance of Improved Pronunciation Feedback
The proposed system demonstrates remarkable accuracy in classifying nonnative English accents. By leveraging spectrograms and MFCCs as core features, the model achieved classification accuracies exceeding more than 80%, aligning with prior studies that emphasize the effective ness of these features in speech analysis [3,18]. The integration of adaptive thresholding and advanced feature extraction techniques bolstered the model’s robustness, enabling reliable differentiation across eight accent classes, including a newly introduced class of Chinese-accented English speakers. This outcome validates the system’s potential for practical applications in accent classification, comparable to findings in existing literature on robust speech systems [23].
The study highlights the complementary effectiveness of spectrograms, MFCCs, and formant frequencies in accent classification. Spectrogram-based features, known for capturing intricate temporal and frequency nuances, delivered superior classification performance compared to MFCCs alone. Additionally, the integration of DTW enhanced the system’s ability to align speech features across varying speaking speeds, improving the identification of subtle pronunciation variations [18]. These findings underscore the importance of combining diverse feature extraction methods for higher accuracy and consistency in pronunciation analysis [24].
The system’s real-time feedback mechanism, inspired by neural and cognitive processes of the human brain, significantly contributed to users’ improvement in pronunciation skills. By offering detailed assessments and visual feedback on phoneme accuracy and intonation patterns, users could iteratively refine their pronunciation [20]. Experimental results revealed that subjects improved their pronunciation correctness by 5% to 20% after using the system, corroborating neuroscientific findings on the auditory cortex’s role in processing time-frequency representations, similar to those in spectrograms [22,25]. This study effectively bridges cognitive neuroscience principles with technological applications, facilitating impactful language learning outcomes.
4.4. Limitations and Future Directions
A primary limitation of the system lies in its adaptability to different languages. Although the model was trained on a diverse dataset encompassing various English accents, its performance may not be as robust for languages with significantly different phonetic structures, such as Mandarin or Thai. The system’s reliance on feature extraction methods optimized for English pronunciation, such as MFCCs and spectrograms, could restrict its effectiveness in languages requiring distinct acoustic emphases [18]. Additionally, the feedback mechanism, fine-tuned for English-specific pronunciation nuances, may need reconfiguration to cater to other languages. Addressing these challenges would necessitate adapting feature extraction techniques and retraining the model on multilingual datasets to broaden its applicability beyond English [23].
Another limitation is related to the dataset’s scale and diversity, which could impact the generalizability of the model’s performance. While the dataset includes a variety of English accents, its relatively constrained size and controlled recording conditions may not fully represent real-world scenarios [19]. Incorporating larger datasets with more speakers and a broader range of pronunciation variations, including data from nonnative speakers with varying proficiency levels, would improve the model’s robustness and practical utility [24]. Expanding the dataset to include recordings from diverse languages, dialects, and real-life settings is a critical step for future research [20].
Deploying deep learning models, such as CNNs, on mobile platforms also presents challenges related to processing power and energy consumption. Mobile devices, while convenient for language learning, often have limited computational resources compared to desktops. Running complex models on mobile devices can lead to increased battery usage and longer response times potentially affecting user interface and experience. Techniques such as model pruning, quantization, and cloud-based processing could help optimize the model for mobile use, balancing resource efficiency and model complexity [17].
5. Conclusions
This study introduces a comprehensive mobile-assisted pronunciation analysis system that leverages convolutional neural networks and fuzzy inference to provide personalized, real-time feedback for language learners. Through the integration of advanced pre-processing techniques and multiple complementary feature extraction methods—spectrograms, MFCCs, and formant frequencies—our system effectively analyzes and classifies pronunciation patterns across diverse accent profiles. The incorporation of a fuzzy inference system enables context-aware assessment that accommodates the natural variability inherent in human speech, providing feedback that is both precise and interpretable.
Our experimental results demonstrate the power of feature fusion in improving classification accuracy, achieving approximately 87% when combining spectrograms and MFCCs—significantly outperforming single-feature approaches. User testing confirmed the system's practical effectiveness, with participants showing measurable improvements in pronunciation accuracy after using the application. These findings align with existing research on the importance of robust feature extraction while extending the practical application of deep learning in educational technology.
The mobile platform implementation addresses accessibility needs in language education, allowing learners to practice pronunciation independently and receive immediate feedback regardless of location. Despite its current capabilities, limitations in multilingual support and computational efficiency on mobile platforms indicate promising directions for future research. Expanding the system to support additional languages, incorporating adaptive learning mechanisms that personalize feedback based on learner progress, and optimizing performance on resource-constrained devices represent important next steps. These advancements would further enhance the system's impact as an effective tool for self-directed language learning in our increasingly globalized world.
Funding
This research was partially funded by the Basic and Applied Research Project, the Faculty of En-gineering at Sriracha, Kasetsart University, Fiscal Year B.E. 2568.
Acknowledgments
The authors would like to thank all the participants who generously took part in the experiment and contributed their time and effort to this study.
Conflicts of Interest
The authors declare no conflict of interest.
References
- Amano, T.; Ram´ırez-Castan˜eda, V.; Berdejo-Espinola, V.; Borokini, I.; Chowdhury, S.; Golivets, M.; Gonz´alez-Trujillo, J.D.; Montan˜o-Centellas, F.; Paudel, K.; White, R.L.; Ver´ıssimo, D. The manifold costs of being a nonnative English speaker in science. PLoS Biology 2023, 21, e3002184. [Google Scholar] [CrossRef] [PubMed]
- Chen, Y.; Liu, Z. WordDecipher: Enhancing Digital Workspace Communication with Explainable AI for nonnative English Speakers. CoRR 2024. [Google Scholar]
- Huang, C.; Chen, T.; Chang, E. Accent Issues in Large Vocabulary Continuous Speech Recognition. International Journal of Speech Technology, 2004, 7, 141–153. [Google Scholar] [CrossRef]
- Upadhyay, R.; Lui, S. ; editor, Foreign English Accent Classification Using Deep Belief Networks. In Proceedings of the 2018 IEEE 12th International Conference on Semantic Computing (ICSC), Laguna Hills, CA, USA, 31 Jan. - 02 Feb. 2018. [Google Scholar]
- Russell, M.; Najafian, M. editor. Modelling Accents for Automatic Speech Recognition. In Proceedings of the 23rd European Signal Processing Conference (EUSIPCO), 2015, 1568.
- Ensslin, A.; Goorimoorthee, T.; Carleton, S.; Bulitko, V.; Hernandez, S. Deep Learning for Speech Accent Detection in Videogames. The Workshops of the Thirteenth AAAI Conference on Artificial Intelligence and Interactive Digital Entertainment, 2017, 13, 59–74. [Google Scholar] [CrossRef]
- Sejdic, E.; Djurovic, I.; Jiang, J. Time-Frequency Feature Representation Using Energy Concentration: An Overview of Recent Advances. Digital Signal Processing, 2009, 19, 153–183. [Google Scholar] [CrossRef]
- Kasahara, S.; Minematsu, N.; Shen, H.; Saito, D.; Hirose, K. Structure-Based Prediction of English Pronunciation Distances and Its Analytical Investigation. In Proceedings of the 2014 4th IEEE International Conference on Information Science and Technology, Shenzhen, China, 26-28 April 2014. [Google Scholar]
- Lee, J.; Lee, C.H.; Kim, D.; Kang, B. Smartphone-Assisted Pronunciation Learning Technique for Ambient Intelligence. IEEE Access, 2017, 5, 312–325. [Google Scholar] [CrossRef]
- Nicolao, M.; Beeston, A.V.; Hain, T. Automatic Assessment of English Learner Pronunciation Using Discriminative Classifiers. In Proceeding of the Speech and Signal Processing (ICASSP), 2015 IEEE International Conference on. 40th IEEE International Conference on Acoustics, Speech and Signal Processing (ICASSP), Brisbane, Australia, 19-24 Apr 2015. [Google Scholar]
- Chanamool, N.; Unhalekajit, B.; Phothisonothai, M. Computer Software for Phonetic Analyzing of Thai Language Using Speech Processing Techniques. KMUTT Research and Development Journal, 2010, 33, 319–328. [Google Scholar]
- Grenander, U. Some Non-Linear Problems in Probability Theory. In Probability and Statistics: The Harald Cram´er Volume; Almqvist Wiksell: Stockholm, 1959; pp. 353–365. [Google Scholar]
- Sheng, L.; Edmund, M. Deep Learning Approach to Accent Classification. Machine Learning Stanford, 2017. https://cs229.stanford.edu/proj2017/final-reports/5244230.pdf.
- Lee, A.; Zhang, Y.; Glass, J. Mispronunciation Detection via Dynamic Time Warping on Deep Belief Network-Based Posteriorgrams. In Proceedings of the IEEE International Conference on Acoustics, Speech and Signal Processing (ICASSP), Vancouver, BC, Canada, 26-31 May 2013. [Google Scholar]
- Campbell, W.; Reynolds, D.; Campbell, J.; Brady, K. Estimating and Evaluating Confidence for Forensic Speaker Recognition. In Proceedings of the IEEE International Conference on Acoustics, Speech, and Signal Processing (ICASSP), Philadelphia, PA, USA, 23-23 March 2005. [Google Scholar]
- Scikit-Fuzzy. Available online: https://pythonhosted.org/ scikit-fuzzy/overview.html. (accessed on 24 December 2024].
- Rashmi, M.; Yogeesh, N.; Girija, D.K.; William, P. Robust Speech Processing with Fuzzy Logic-Driven Anti-Spoofing Techniques. In Proceedings of the 2023 International Conference on Self Sustainable Artificial Intelligence Systems (ICSSAS), Erode, India, 18-20 October 2023. [Google Scholar]
- Lesnichaia, M.; Mikhailava, V.; Bogach, N.; Lezhenin, I.; Blake, J.; Pyshkin, E. Classification of Accented English Using CNN Model Trained on Amplitude Mel-Spectrograms. Interspeech, 2022, 3669–3673.
- Mikhailava, V.; Lesnichaia, M.; Bogach, N.; Lezhenin, I.; Blake, J.; Pyshkin, E. Language Accent Detection with CNN Using Sparse Data from a Crowd-Sourced Speech Archive. Mathematics, 2022, 10, 2913. [Google Scholar] [CrossRef]
- Hamilton, L.S. Neural Processing of Speech Using Intracranial Electroencephalography: Sound Representations in the Auditory Cortex. Oxford Research Encyclopedia of Neuroscience, 2024.
- Asswad, R.; Boscain, U.; Turco, G.; Prandi, D.; Sacchelli, L. An Auditory Cortex Model for Sound Processing. Lecture Notes in Computer Science, 2021, 12829, 56–64. [Google Scholar]
- Wang, R.; Wang, Y.; Flinker, A. Reconstructing Speech Stimuli From Human Auditory Cortex Activity Using a WaveNet Approach. Frontiers in Neuroscience, 2018, 12, 422. [Google Scholar] [CrossRef] [PubMed]
- Al-Jumaili, Z.; Bassiouny, T.; Alanezi, A.; Khan, W.; Al-Jumeily, D.; Hussain, A.J. Classification of Spoken English Accents Using Deep Learning and Speech Analysis. In Intelligent Computing Methodologies, 2022, 277–287.
- Bartelds, M.; de Vries, W.; Sanal, F.; Richter, C.; Liberman, M.; Wieling, M. Neural Representations for Modeling Variation in Speech. Journal of Phonetics. 2020, 92, 101137. [Google Scholar] [CrossRef]
- Tourville, J.A.; Reilly, K.J.; Guenther, F.H. Neural mechanisms underlying auditory feedback control of speech. NeuroImage, 2008, 39, 1429–1443. [Google Scholar] [CrossRef] [PubMed]
- Habib, S.; Haider, A.; Suleman, S.S.M.; Akmal, S.; Khan, M.A. Mobile As sisted Language Learning: Evaluation of Accessibility, Adoption, and Perceived Outcome among Students of Higher Education. Electronics, 2022, 11, 1113. [Google Scholar] [CrossRef]
- Liu, L.; Li, W.; Morris, S.; Zhuang, M. Knowledge-Based Features for Speech Analysis and Classification: Pronunciation Diagnoses. Electronics, 2023, 12, 2055. [Google Scholar] [CrossRef]
- Rukwong, N.; Pongpinigpinyo, S. An Acoustic Feature-Based Deep Learning Model for Automatic Thai Vowel Pronunciation Recognition. Applied Sciences, 2022, 12, 6595. [Google Scholar] [CrossRef]
Figure 1.
Client-server architecture of the proposed system.
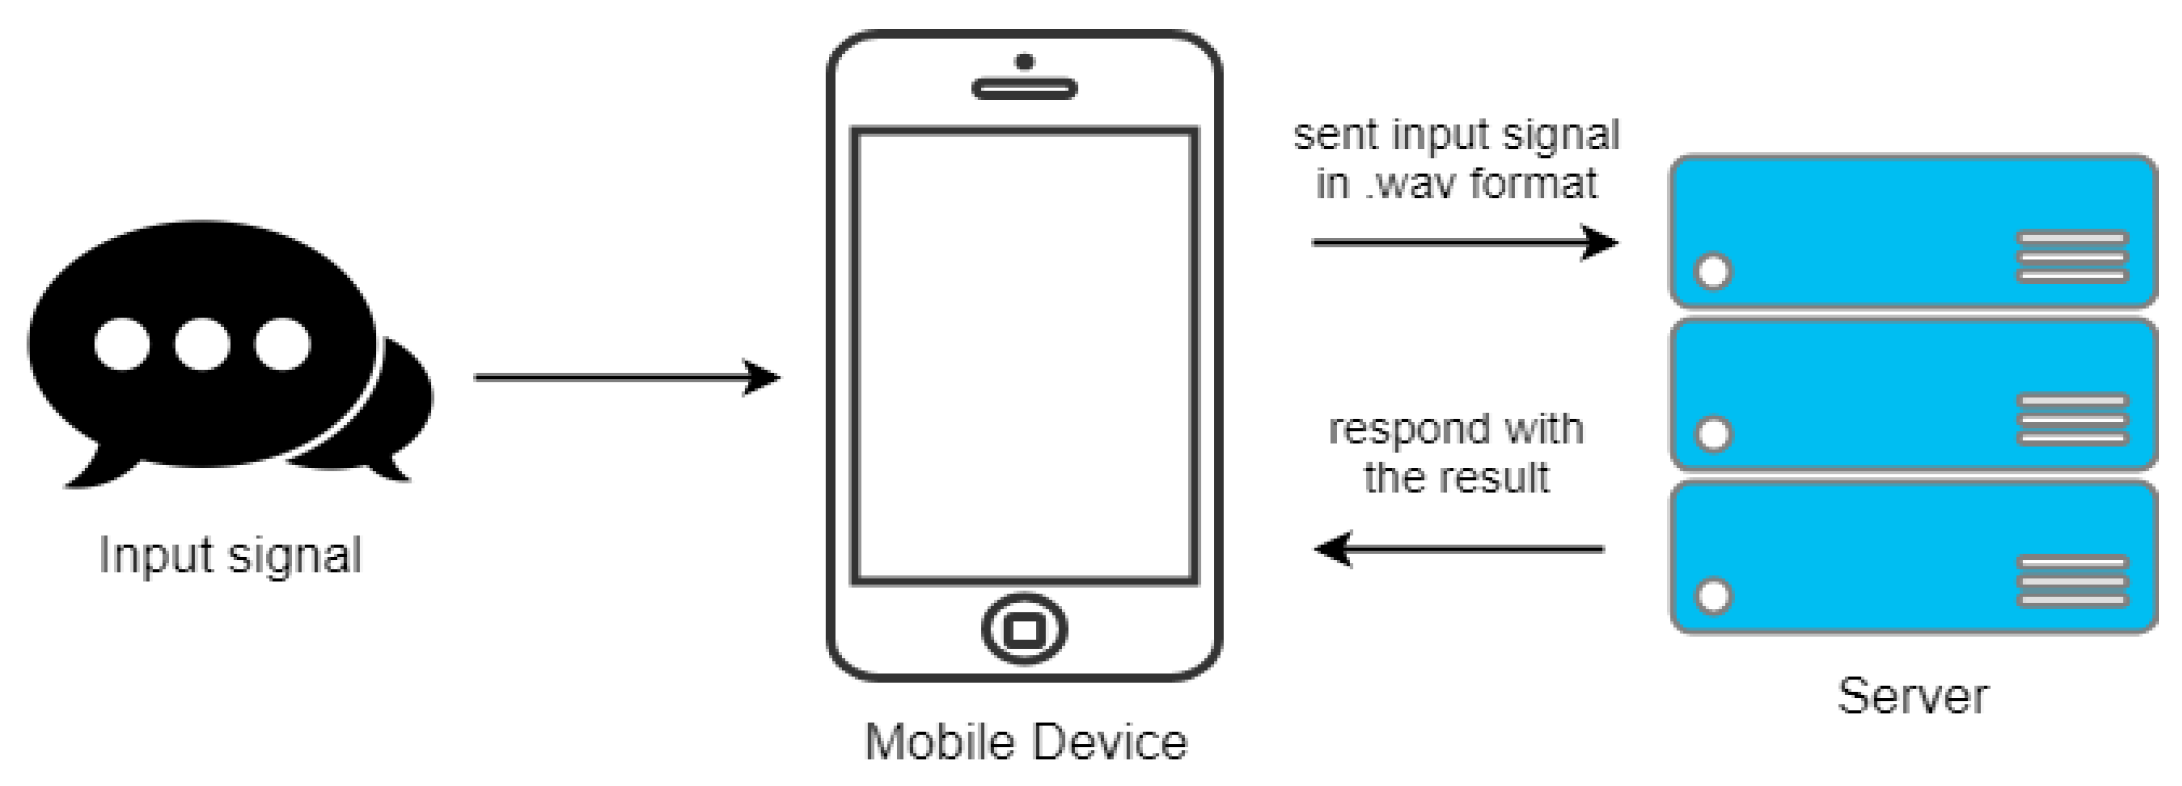
Figure 2.
System overview of the proposed method.
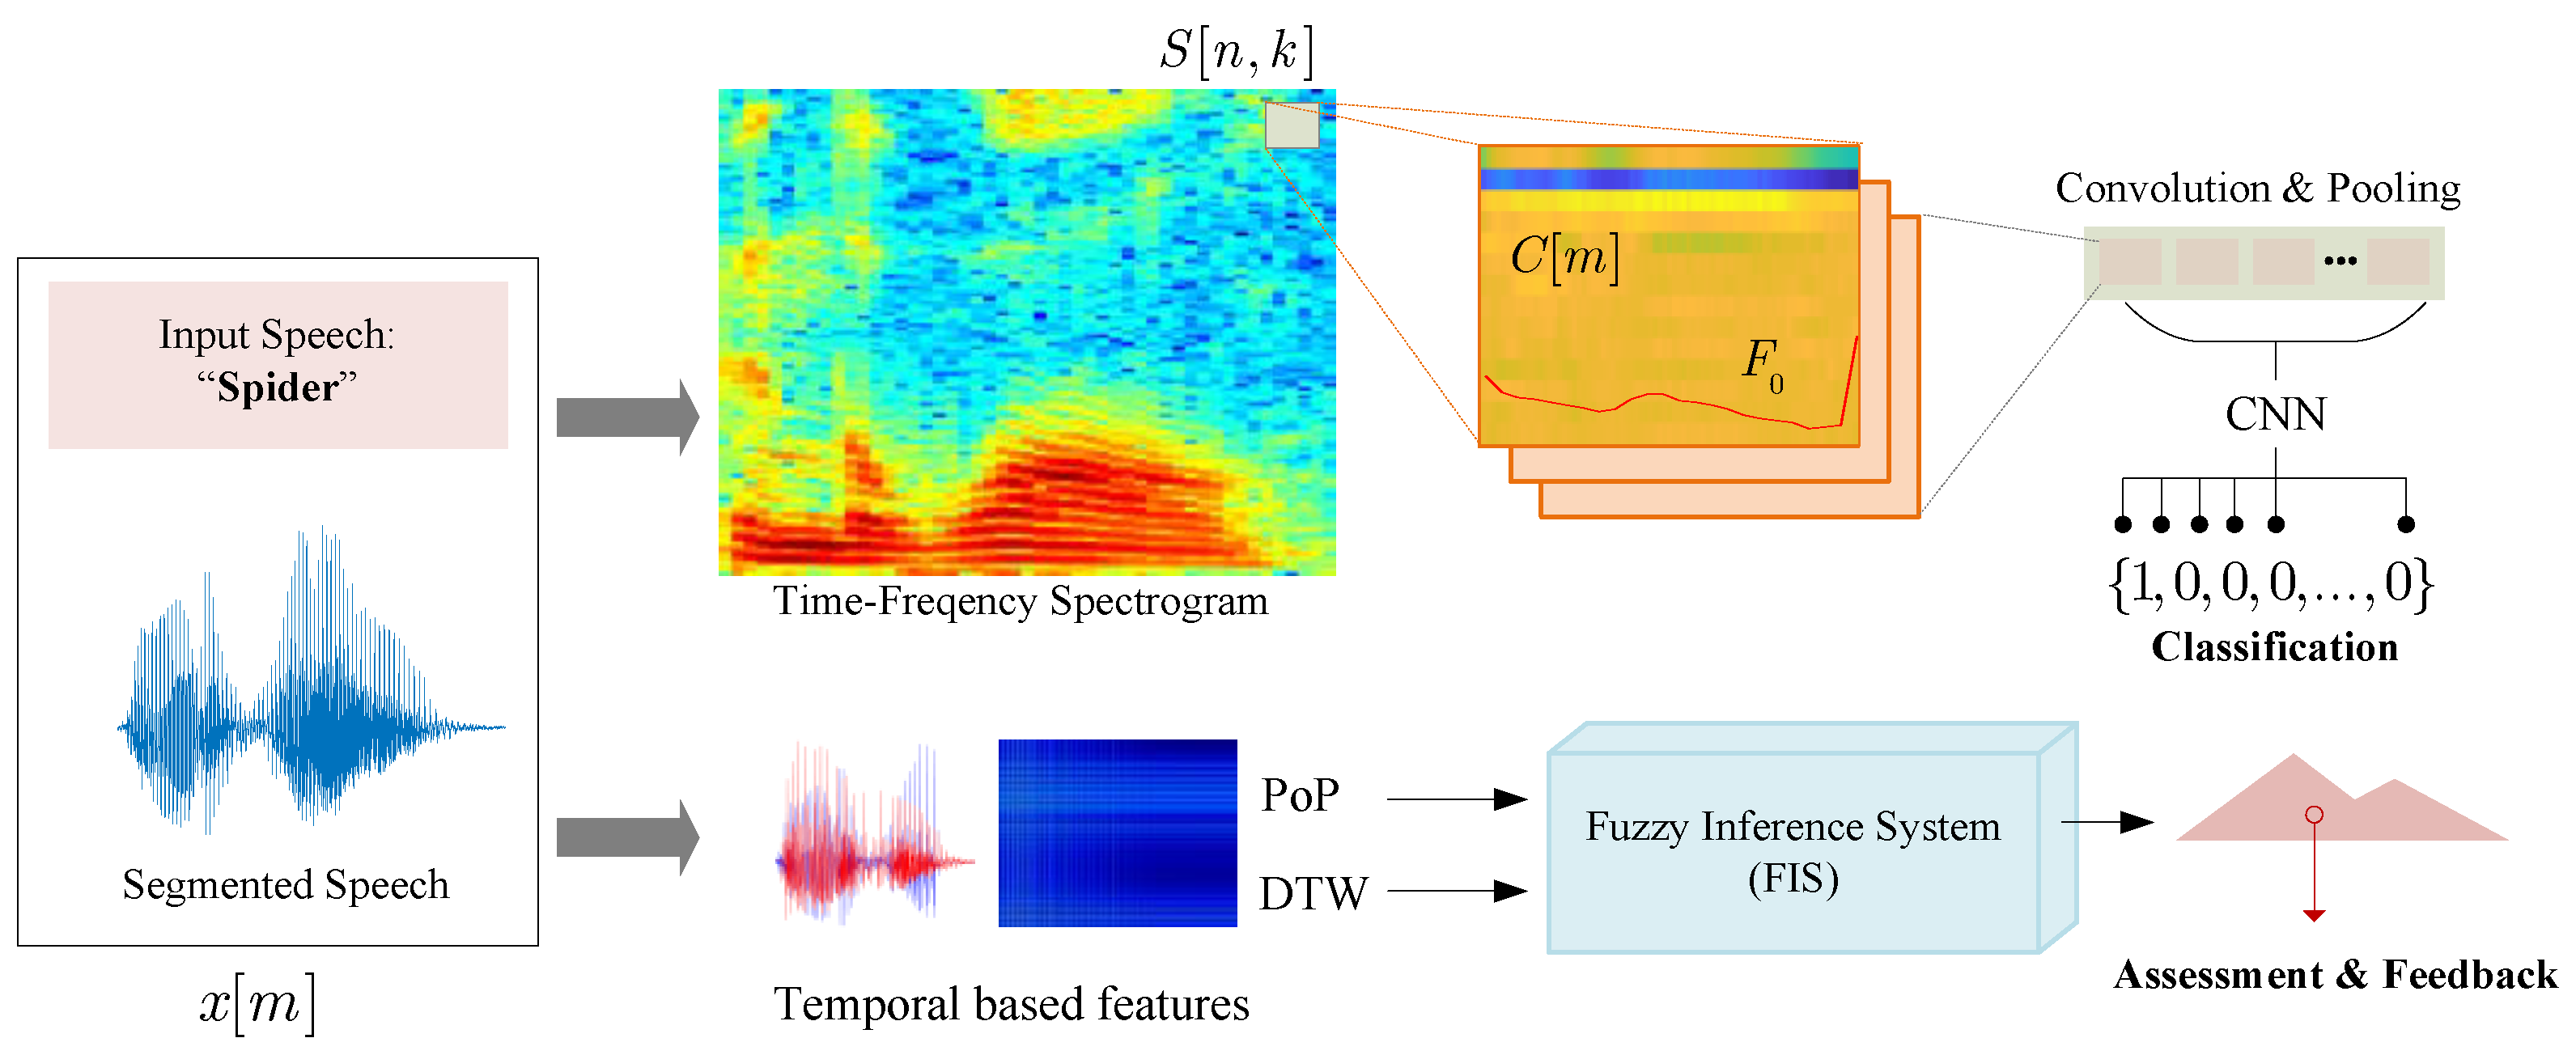
Figure 3.
Step-by-step preprocessing of the original speech signal to the segmented signal, they should be listed as: (a) Normalization; (b) Fixed-Length; (c) Power; (d) Window-based SD; (e) Speech Segmentation; (f) Removing Error; (g) Speech Reconstruction and (h) Pre-Processed Signal.
Figure 3.
Step-by-step preprocessing of the original speech signal to the segmented signal, they should be listed as: (a) Normalization; (b) Fixed-Length; (c) Power; (d) Window-based SD; (e) Speech Segmentation; (f) Removing Error; (g) Speech Reconstruction and (h) Pre-Processed Signal.
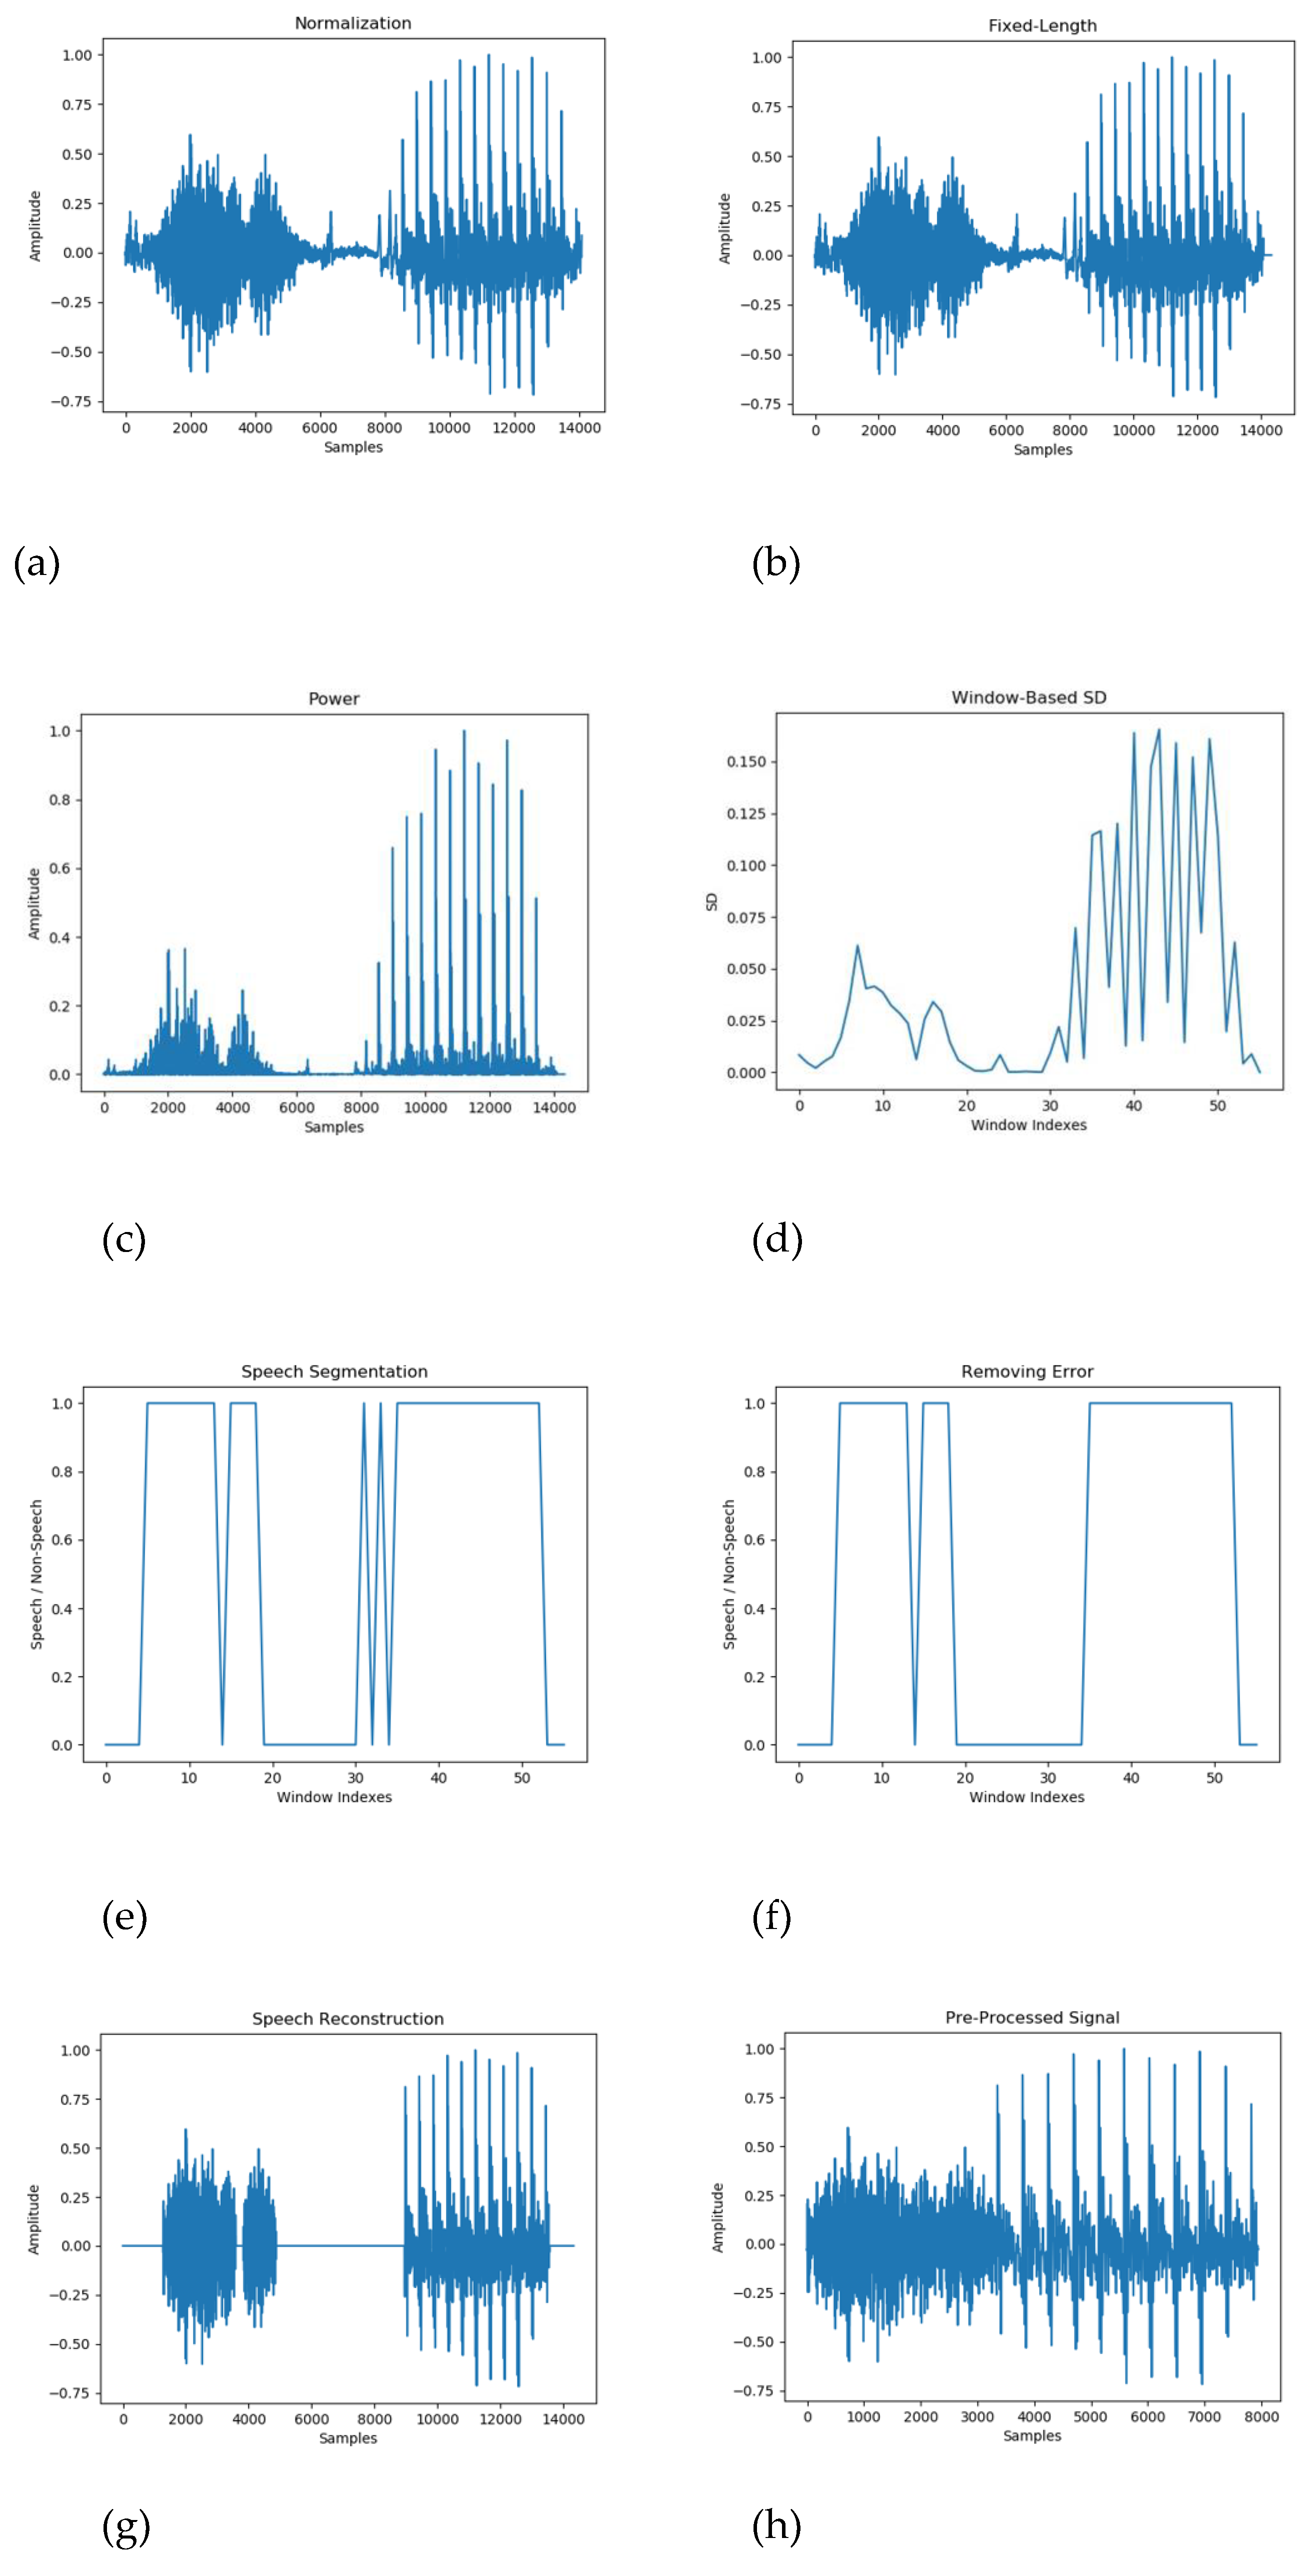
Figure 4.
Comparison of the original signal before and after preprocessing.
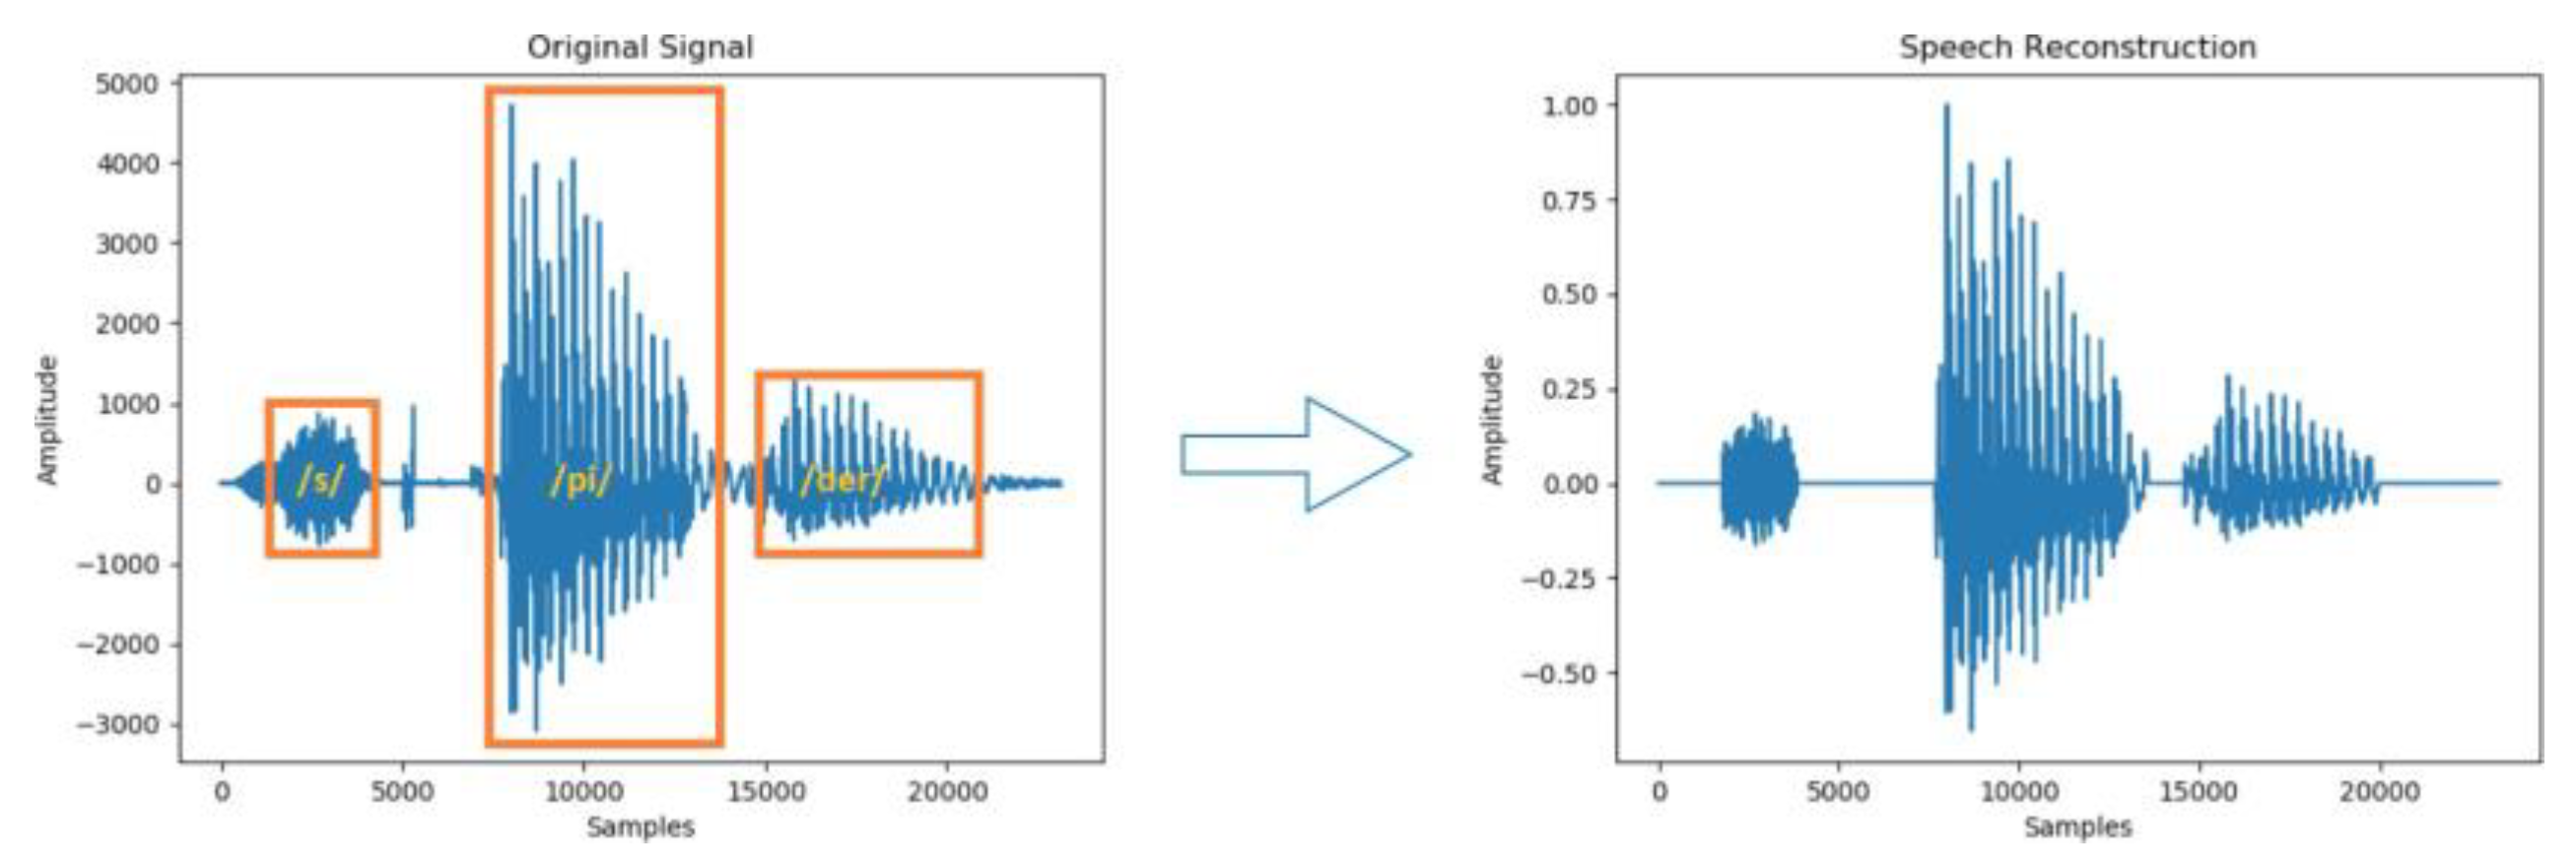
Figure 5.
Extracted features in this study, they should be listed as: (a) Pre-processed speech signal; (b) Spectrogram feature; (c) MFCC feature and (d) Formant Frequency.
Figure 5.
Extracted features in this study, they should be listed as: (a) Pre-processed speech signal; (b) Spectrogram feature; (c) MFCC feature and (d) Formant Frequency.
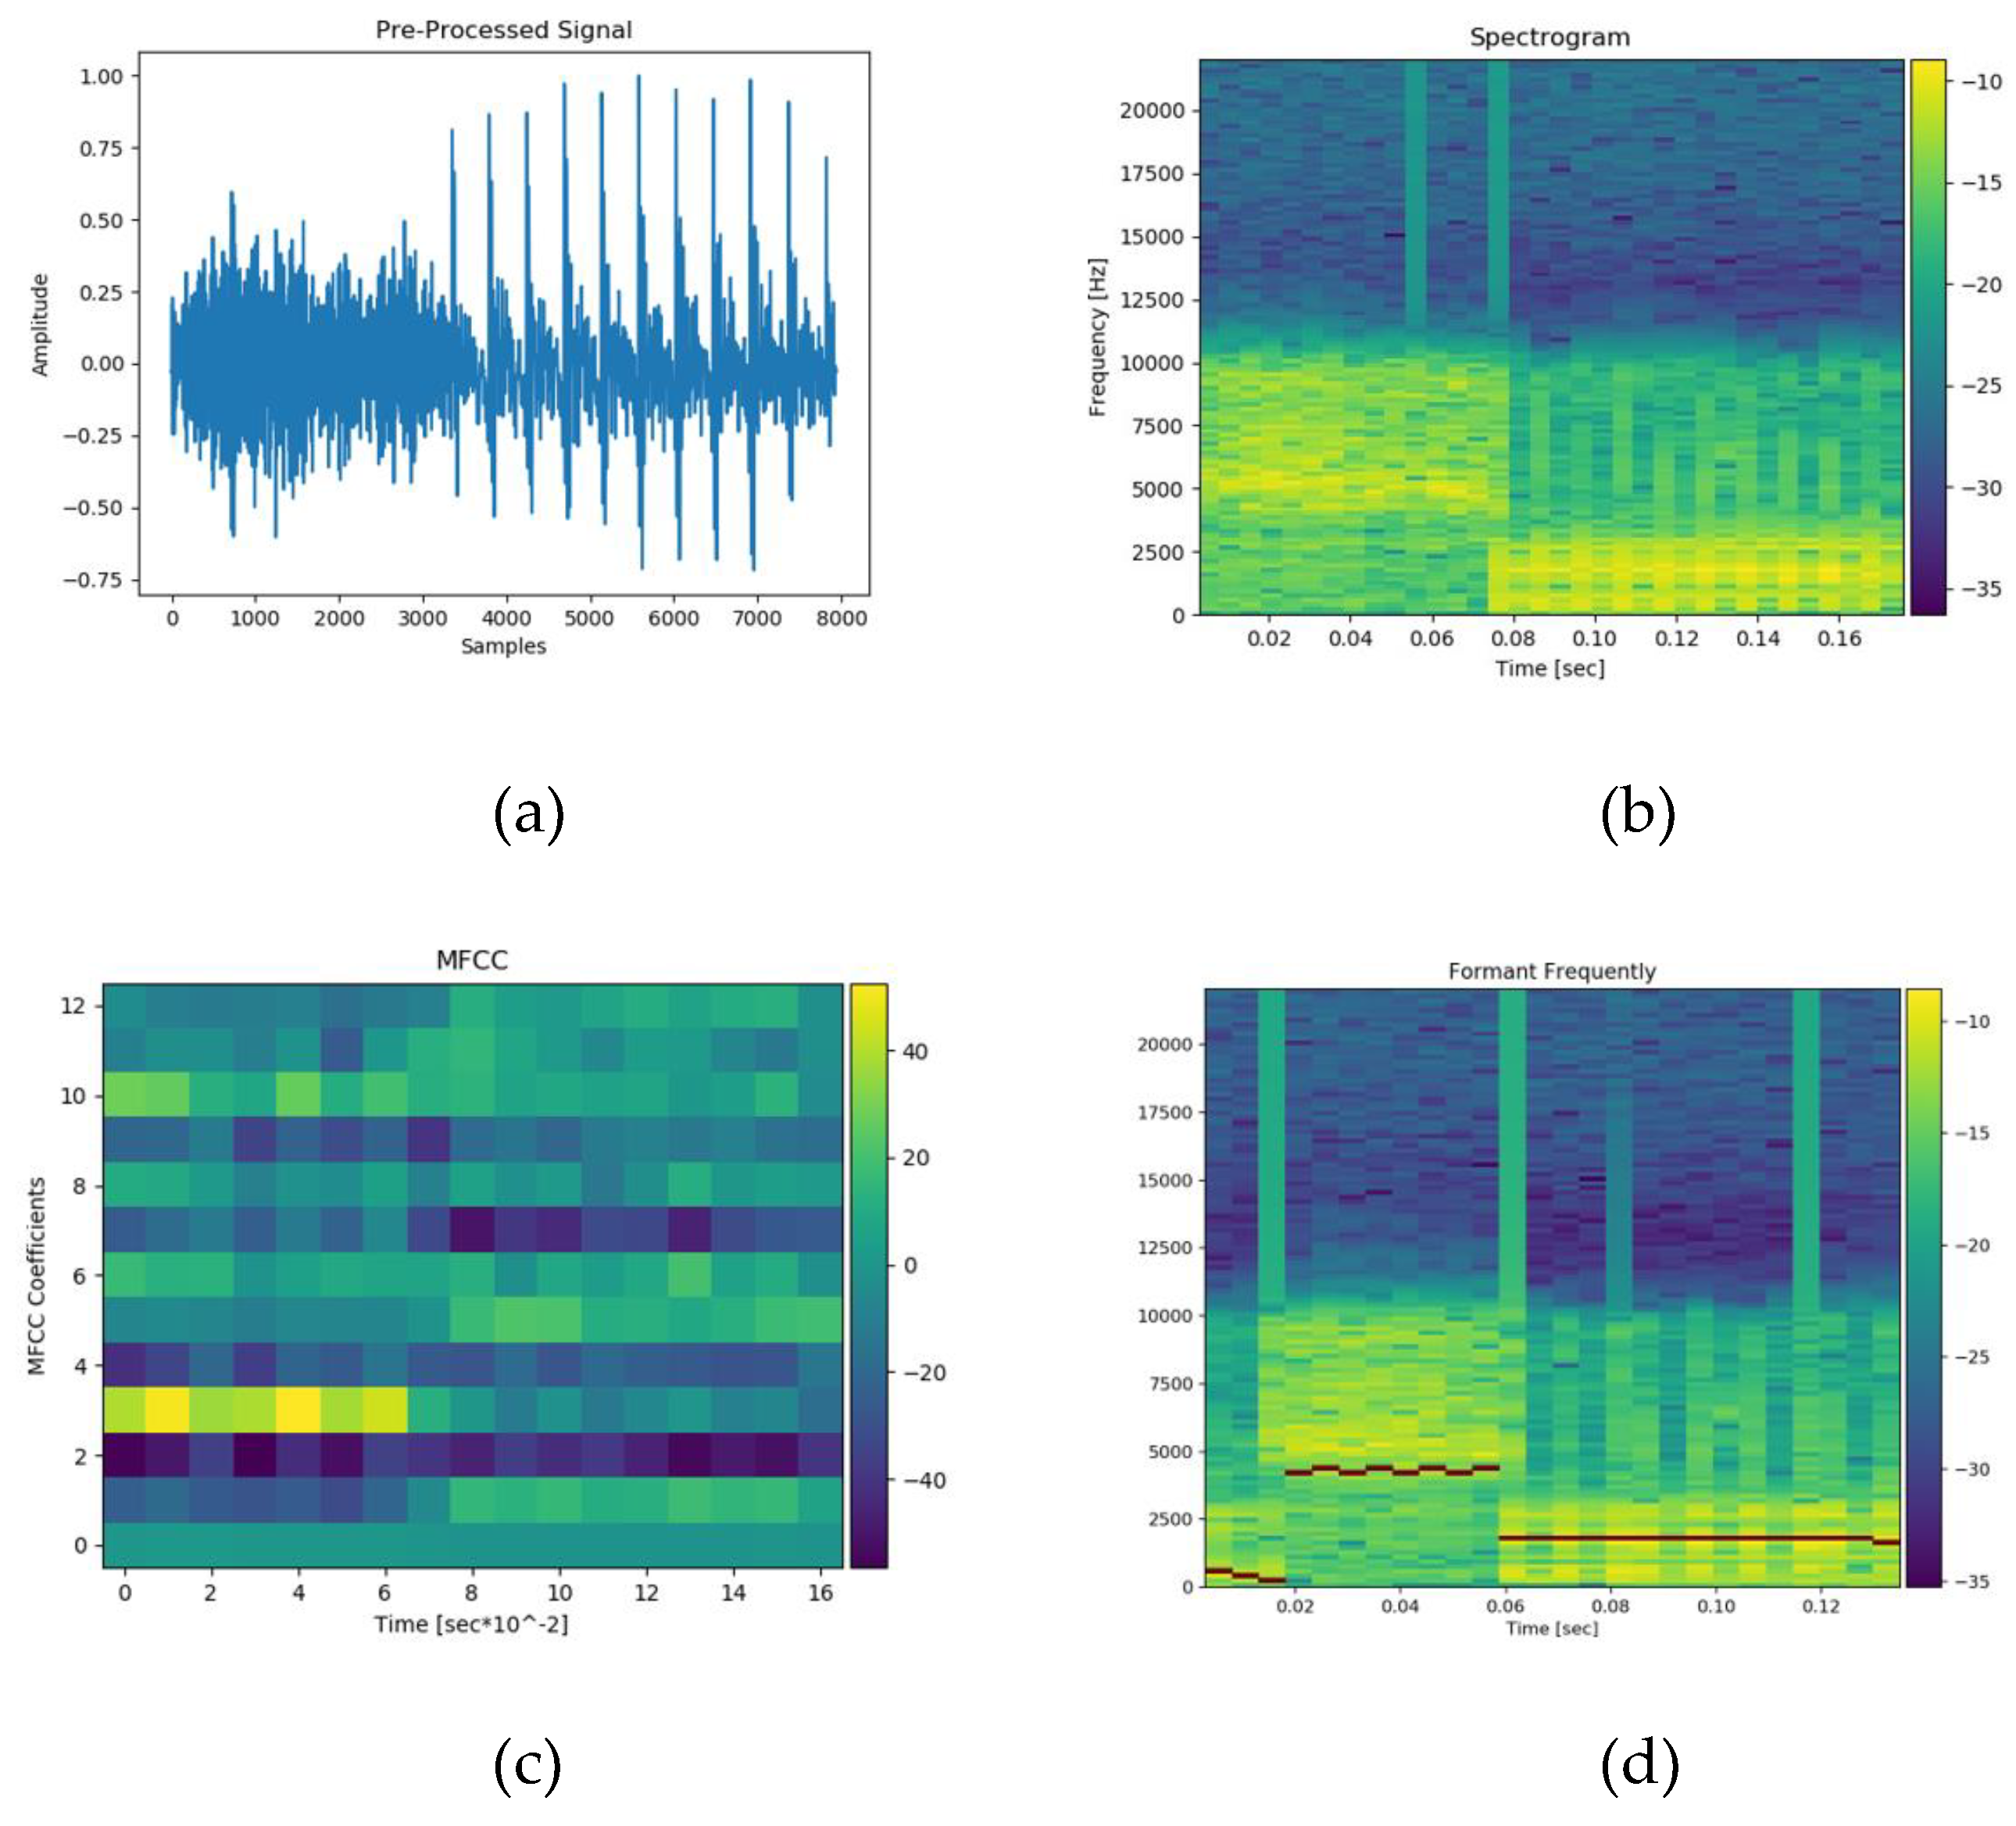
Figure 6.
Training Results for MFCC and Confusion Matrix for MFCC with 0.005 Threshold (a) Training Results for MFCC, (b) Confusion Matrix for MFCC.
Figure 6.
Training Results for MFCC and Confusion Matrix for MFCC with 0.005 Threshold (a) Training Results for MFCC, (b) Confusion Matrix for MFCC.
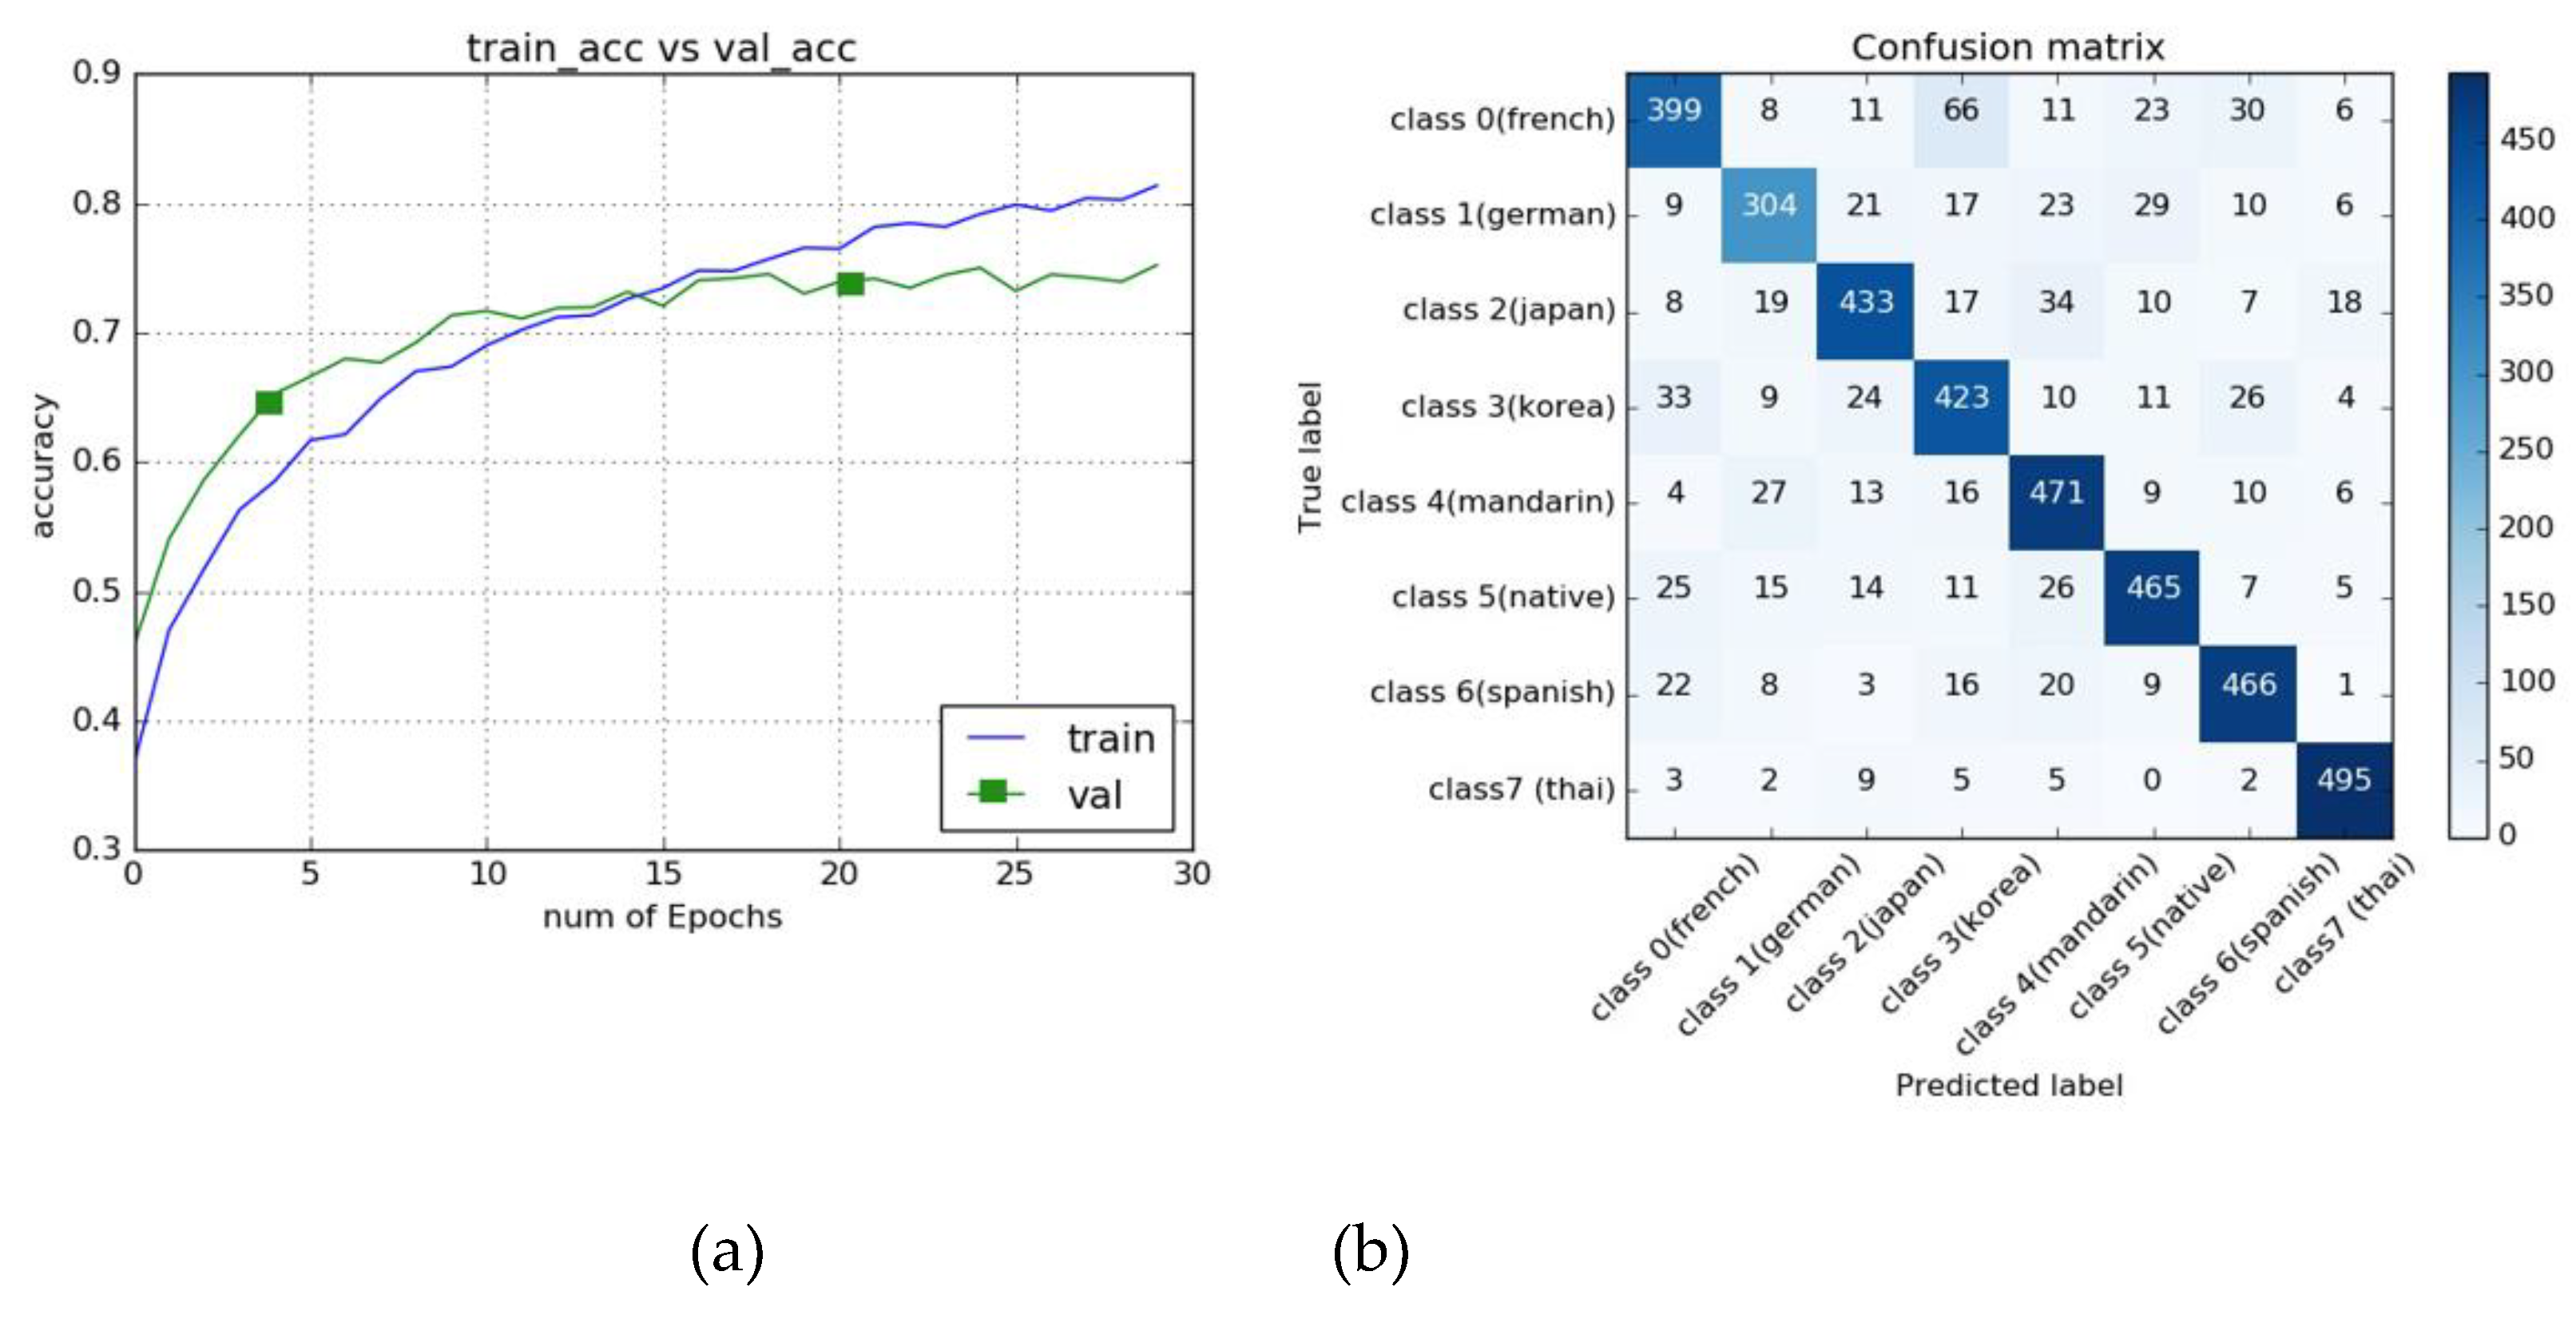
Figure 7.
Training Results for Spectrogram and Confusion Matrix for Spectrogram with a Threshold of 0.005, (a) Training Results for Spectrogram, (b) Confusion Matrix for Spectrogram.
Figure 7.
Training Results for Spectrogram and Confusion Matrix for Spectrogram with a Threshold of 0.005, (a) Training Results for Spectrogram, (b) Confusion Matrix for Spectrogram.
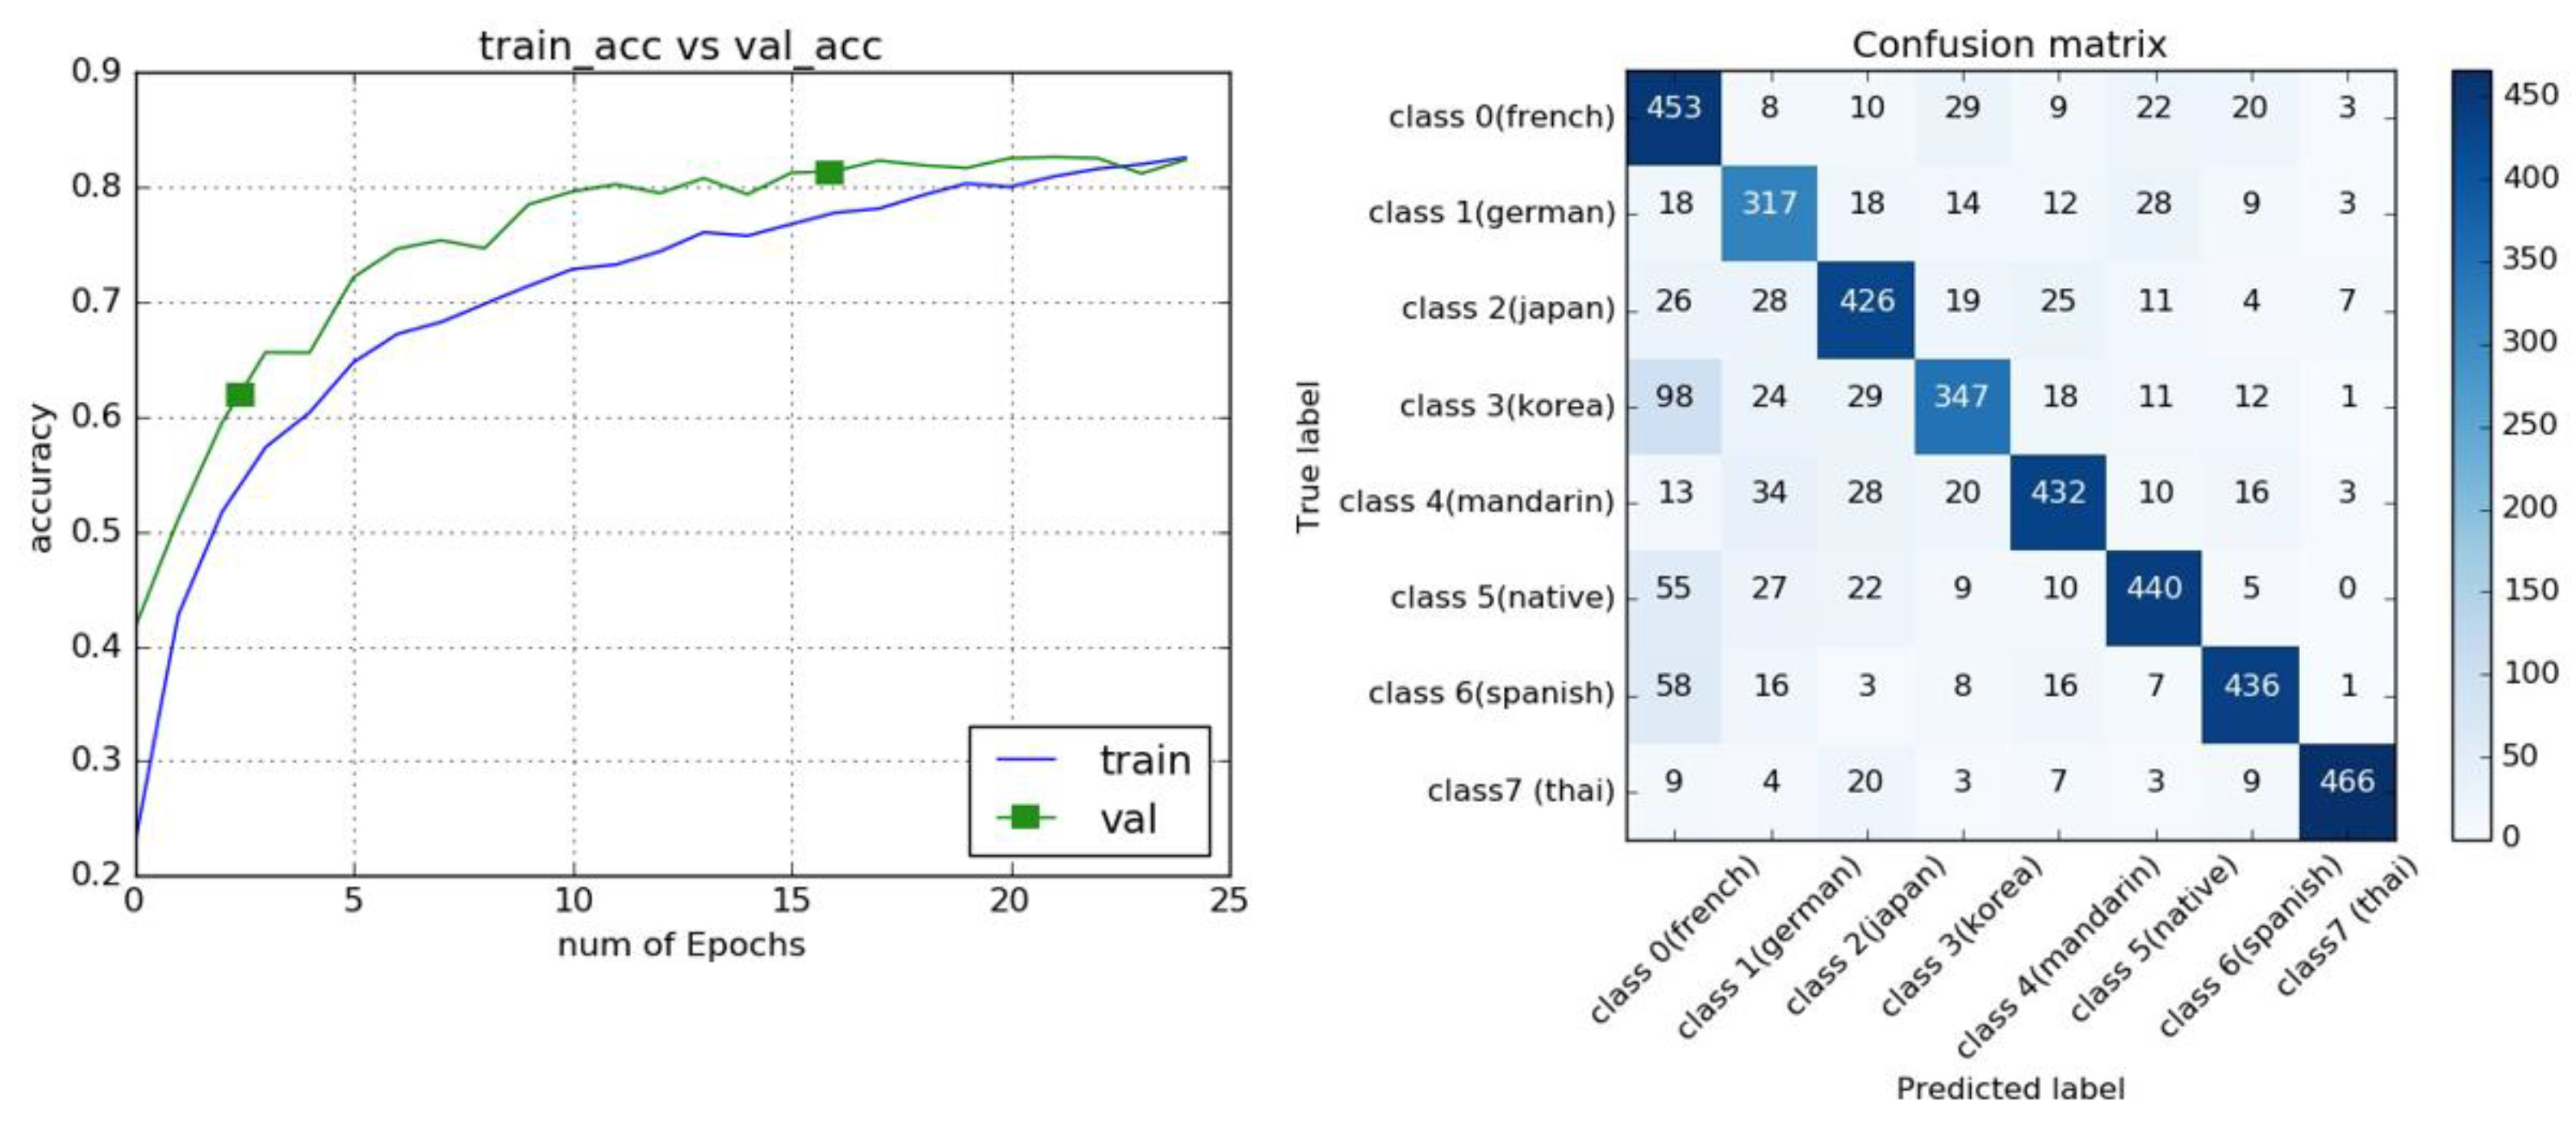
Figure 10.
Overview of the MALL system, highlighting its main functionalities: (a) audio recording, (b) word selection, (c) result processing, and (d) detailed feedback.
Figure 10.
Overview of the MALL system, highlighting its main functionalities: (a) audio recording, (b) word selection, (c) result processing, and (d) detailed feedback.
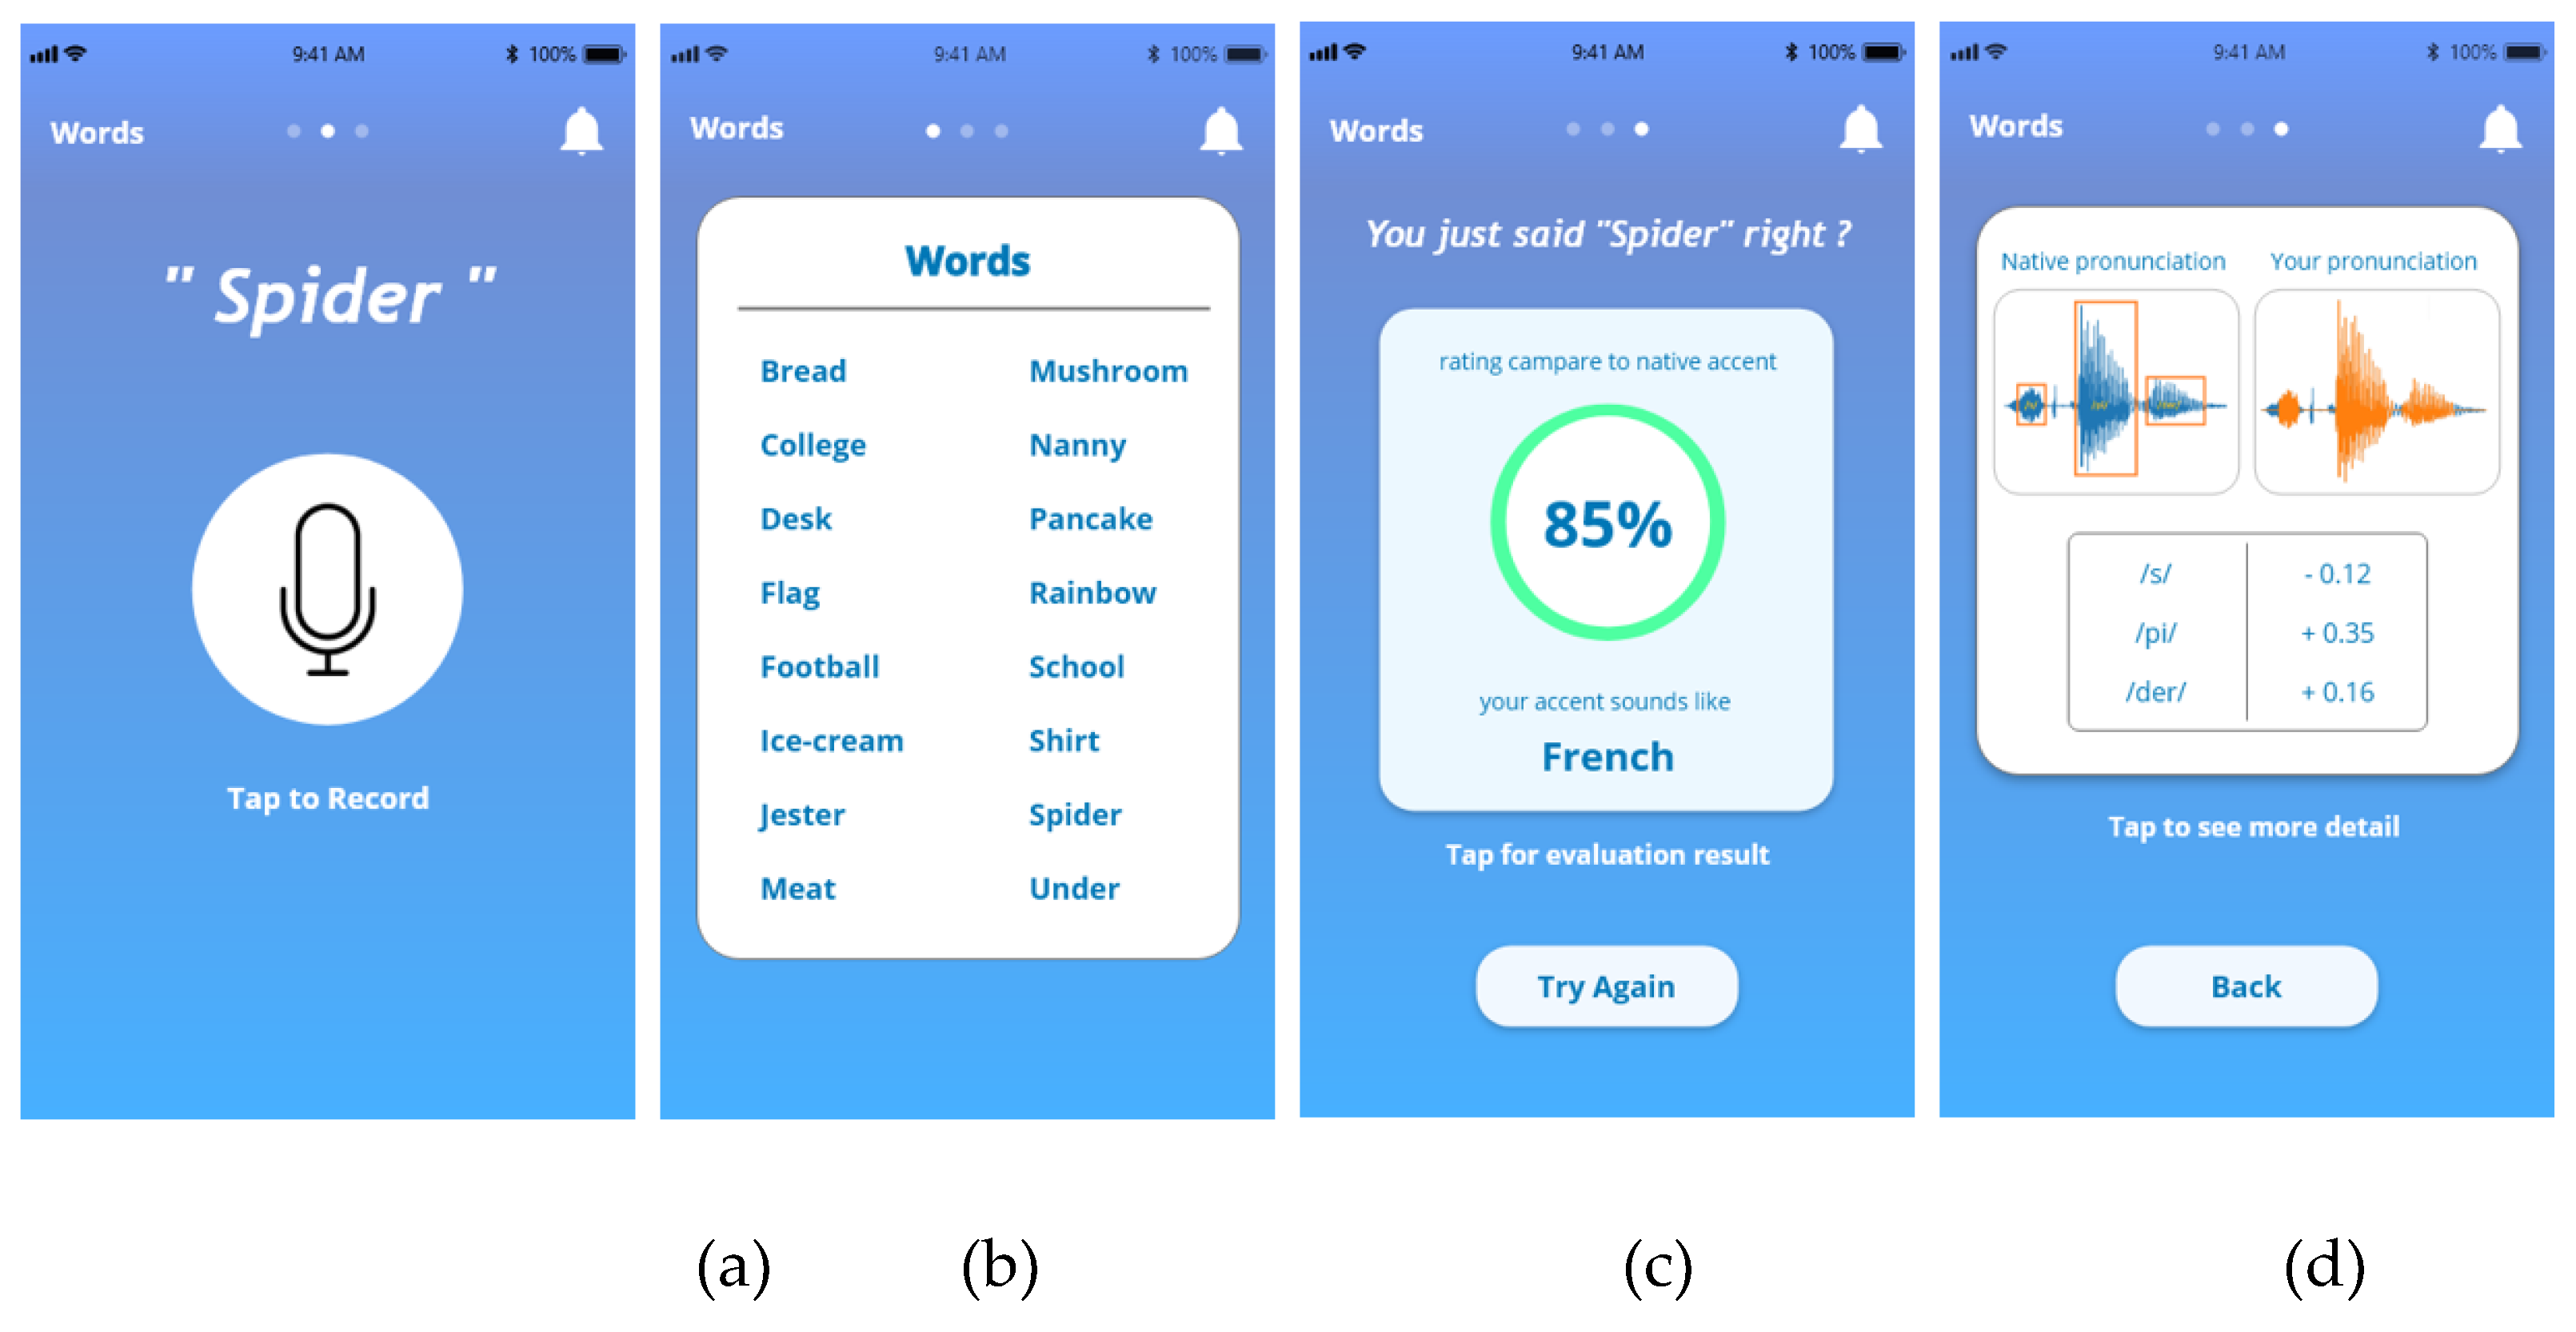
Figure 11.
Assessment results showing pronunciation average scores in percentage.
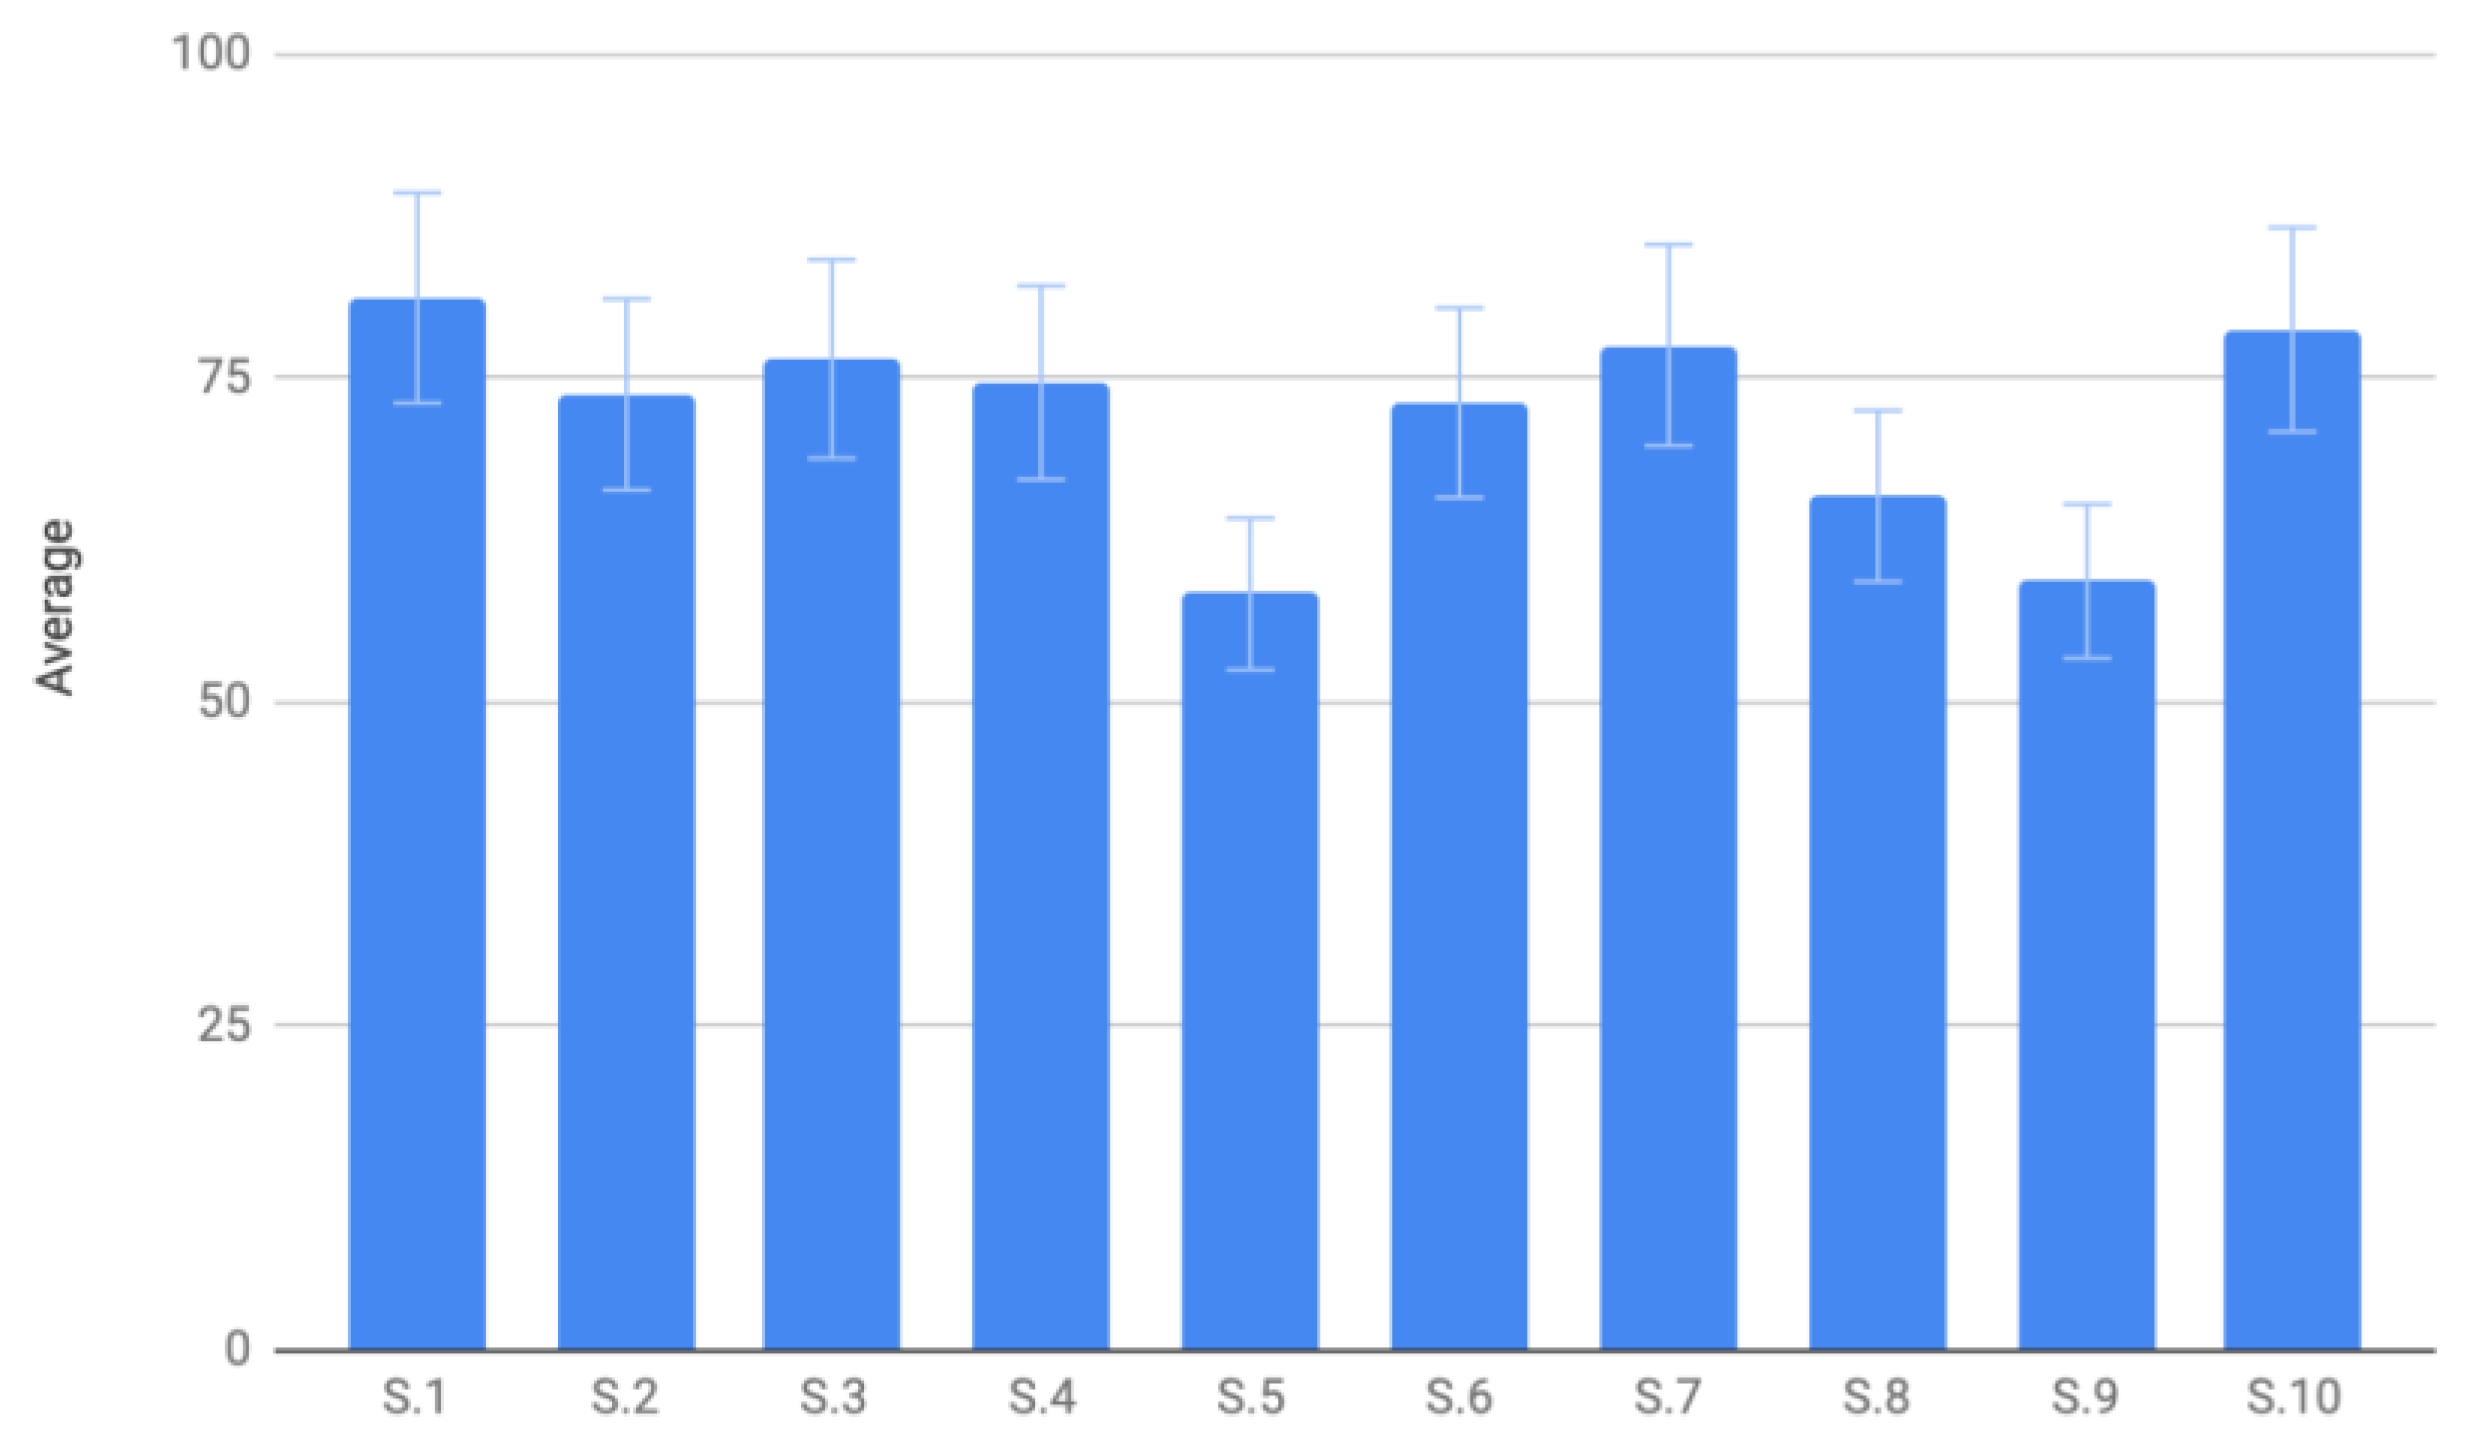

Table 1.
Libraries utilized in the implementation process.
| Library | Version | Purpose |
| TensorFlow | 1.13.1 | Machine learning library |
| Keras | 2.2.4 | High-level neural network API written in Python |
| SciPy | 1.10 | Data management and computation |
| PythonSpeechFeatures | 0.6 | Extraction of MFCCs and filterbank energies |
| Matplotlib | 3.0.0 | Plotting library for generating figures |
| Flask | 1.0.2 | RESTful request dispatching |
| NumPy | 2.0 | Core library for scientific computing |
Table 2.
Number of recordings for each accent category.
| Category | Number of recordings |
| Native | 2200 |
| French | 2150 |
| German | 1650 |
| Mandarin | 2200 |
| Spanish | 2200 |
| Japanese | 2200 |
| Korean | 2200 |
| Thai | 2195 |
| Total | 16995 |
Table 3.
Tasks in the Hoosier database of native and nonnative Speech.
| Category | Number of recordings |
| 160 | Hearing in Noise Test for Children sentences |
| 10 | Digit words |
| 48 | Multi-syllabic Lexical Neighborhood Test words |
| 50 | Northwestern University-Children’s Perception of Speech words |
| 100 | Lexical Neighborhood Test words |
| 50 | Lexical Neighborhood Sentence Test sentences |
| 40 | Pediatric Speech Intelligibility sentences |
| 20 | Pediatric Speech Intelligibility words |
| 339 | Bamford-Kowal-Bench sentences |
| 150 | Phonetically Balanced Kindergarten words |
| 72 | Spondee words |
| 100 | Word Intelligibility by Picture Identification words |
Table 4.
Tasks in the Hoosier database of native and nonnative Speech.
| MFCC: 28×28 | MFCC: 64×48 | MFCC: 128×48 | |||||
| Iter. | Test Acc. [%] | Time [s] | Test Acc. [%] | Time [s] | Test Acc. [%] | Time [s] | |
| 1 | 40.48 | 26 | 45.37 | 123 | 45.21 | 552 | |
| 5 | 57.73 | 130 | 60.16 | 612 | 60.43 | 2734 | |
| 10 | 64.21 | 261 | 65.54 | 1231 | 63.94 | 5467 | |
| 15 | 67.67 | 391 | 69.45 | 1830 | 66.40 | 8251 | |
| 20 | 70.29 | 522 | 70.72 | 2421 | 67.05 | 11024 | |
| 30 | 73.89 | 781 | 74.27 | 3636 | 67.51 | 16591 | |
Table 5.
Tasks in the Hoosier database of native and nonnative Speech.
| MFCC: 28×28 | MFCC: 64×48 | MFCC: 128×48 | ||||
| Iter. | Test Acc. [%] | Time [s] | Test Acc. [%] | Time [s] | Test Acc. [%] | Time [s] |
| 1 | 34.21 | 26 | 38.51 | 122 | 38.29 | 552 |
| 5 | 63.48 | 130 | 71.62 | 615 | 68.43 | 2734 |
| 10 | 70.45 | 260 | 76.19 | 1231 | 77.13 | 5467 |
| 15 | 75.11 | 390 | 78.35 | 1846 | 80.84 | 8251 |
| 20 | 76.83 | 520 | 79.97 | 2459 | 81.94 | 11024 |
| 30 | 78.78 | 780 | 81.16 | 3690 | 82.86 | 16591 |
Table 6.
DTW and PoP features for the rule-based FIS decision.
| DTW \ PoP | Poor (0-20) |
Mediocre (20-40) | Average (40-60) | Decent (60-80) | Good (80-100) |
|---|---|---|---|---|---|
| Poor (0-33) |
F | F | D | D | D |
| Average (34-66) |
C | C | B | A | A |
| Good (67-100) |
C | B | A | A | A |
Disclaimer/Publisher’s Note: The statements, opinions and data contained in all publications are solely those of the individual author(s) and contributor(s) and not of MDPI and/or the editor(s). MDPI and/or the editor(s) disclaim responsibility for any injury to people or property resulting from any ideas, methods, instructions or products referred to in the content. |
© 2025 by the authors. Licensee MDPI, Basel, Switzerland. This article is an open access article distributed under the terms and conditions of the Creative Commons Attribution (CC BY) license (http://creativecommons.org/licenses/by/4.0/).
Copyright: This open access article is published under a Creative Commons CC BY 4.0 license, which permit the free download, distribution, and reuse, provided that the author and preprint are cited in any reuse.


