
Submitted:
28 April 2025
Posted:
29 April 2025
You are already at the latest version
Abstract
Breast cancer is a heterogeneous disease with distinct molecular subtypes that require precise classification for personalized treatment strategies. This study proposes an integrative methodology combining unsupervised and supervised learning techniques (hybrid learning) to classify breast cancer subtypes using gene expression data from the Gene Expression Omnibus (GEO) repository. Hierarchical clustering is employed as an exploratory unsupervised approach, using both Euclidean distance and Pearson correlation to reveal intrinsic data structures. For supervised classification, four machine learning models—Logistic Regression, Support Vector Machine (SVM), Random Forest, and Multilayer Perceptron (MLP)—are applied. These models are further optimized via the Optuna framework to enhance performance through hyperparameter tuning. SHAP values are used to assess the importance of features, contributing to model interpretability. The results show that supervised and unsupervised approaches are complementary, offering both accuracy and insight into subtype differentiation. Notably, models optimized by Optuna significantly outperformed non-optimized counterparts. The findings emphasize the potential of combined methodologies in supporting early and accurate diagnosis of breast cancer subtypes.
Keywords:
Hierarchial clustering
; Machine learning
; Breast cancer subtypes
; Gene expression data
; Optimization of hyperparameters
1. Introduction
Breast cancer is the most frequently diagnosed malignancy among women worldwide and remains a leading cause of cancer-related mortality. According to the World Health Organization (WHO) 1, more than 2.3 million new cases and 670,000 deaths were recorded globally in 2022 alone [31]. The disease is known for its biological complexity and heterogeneity, which complicates diagnosis and treatment planning. Among the several known molecular subtypes of breast cancer—including Luminal A, Luminal B, HER2-enriched, Basal-like, and Normal-like—each presents distinct gene expression profiles and clinical behaviors [22]. Accurate classification of these subtypes is vital for effective prognosis and therapeutic decision-making, for selecting the most effective treatment and predicting patient outcomes.
With the advent of advanced genomic sequencing technologies, gene expression profiling has emerged as an important analytical tool for improving cancer subtype classification. However, the high dimensionality and inherent noise in gene expression data still pose difficulties for computational analysis. Traditional classification approaches commonly rely on supervised learning methods [15,24,29,32], but the intrinsic complexity of gene expression data suggests that unsupervised techniques may offer additional relationships, and interpretations. In this context, Hierarchical clustering [16] is particularly useful for grouping samples based on similarities in gene expression profiles.
Machine learning techniques offer robust solutions to these challenges by identifying patterns and relationships within complex datasets. Supervised models such as Logistic Regression, Support Vector Machines (SVM), Random Forest, and Multilayer Perceptrons (MLP) [1] have shown high accuracy in subtype classification tasks. At the same time, unsupervised methods like hierarchical clustering can uncover latent structures and validate groupings without prior labeling, providing valuable complementary insights.
Furthermore, hyperparameter tuning is essential for optimizing the performance of machine learning models. Automated frameworks such as Optuna [3] employ advanced search strategies to identify optimal model configurations. In addition, explainable AI tools like SHAP (SHapley Additive exPlanations) [19] have become critical for interpreting model predictions and understanding the influence of specific genes on subtype classification.
In this context, this study presents an integrative pipeline that combines unsupervised and supervised learning methods, in a hybrid approach, to classify breast cancer subtypes using data from the Gene Expression Omnibus (GEO) 2. By incorporating PCA for dimensionality reduction, Optuna for hyperparameter optimization, and SHAP for feature interpretation, both accurate and interpretable classification results are provided. The proposed framework contributes to the ongoing efforts in precision oncology by providing tools that enhance diagnostic reliability and therapeutic decision-making.
The main contributions include the following: a comparative study of hierarchical clustering using different similarity metrics; application of four machine learning algorithms with and without hyperparameter tuning; and Use of SHAP to interpret model predictions and assess feature relevance. In this way, this study provides a robust framework and a hybrid appoach for the effective classification and interpretation of breast cancer subtypes using gene expression data.
2. Related Work
Numerous studies have used machine learning for breast cancer classification, showing high accuracy, especially with models such as SVM and Random Forest. Parallelly, unsupervised clustering methods, particularly hierarchical clustering with Pearson correlation, have revealed hidden biological structures in gene expression data.
Progress in computational methodologies, including machine learning and deep learning, has significantly advanced the analysis of complex biological datasets [15,24,29,32]. Hierarchical clustering, in particular, has proven effective in capturing tumor heterogeneity by unveiling latent structures within gene expression profiles. Approaches such as clustering algorithms, neural networks, and supervised classification techniques have been extensively utilized to elucidate molecular signatures implicated in breast cancer [11,18,30].
Gene expression analysis has proven to be a powerful tool in identifying molecular patterns associated with different types of diseases, especially tumors. The use of Naive Bayes and KNN classifiers for breast cancer categorization is discussed in [2]. In this paper, a comparative analysis between these two approaches is proposed in order to evaluate their accuracy through cross-validation. The results reveal a superior accuracy of 97.51% for KNN and 96.19% for Naive Bayes. Following this line of investigation on algorithm performance and accuracy, [29] employs Decision Trees, Random Forest, KNN, and Logistic Regression in a Wisconsin dataset. Their results indicate that KNN outperforms Logistic Regression, Random Forest, and Decision Tree in terms of precision and recall, while Logistic Regression achieves the lowest false positive rate.
An application of machine learning and deep learning methods is presented in [30] to a multiclass classification of genes associated with breast cancer, considering gene expression datasets. In addition, an evaluation of the predictive performance of these methods is developed. Moreover, interpretability in classification models has been improved through features selection and relevance analysis tools such as SHAP, facilitating the identification of critical biomarkers associated with different subtypes of breast cancer [19].
In addition to traditional approaches, more recent techniques have imployed autoencoders for dimensionality reduction in conjunction with latent space-based clustering algorithms. These advanced frameworks have provided high precision in classifying tumor subtypes using DNA methylation data, achieving remarkable performance in breast tissue analysis [4].
Interpretability has gained attention with tools like SHAP [19], which decompose predictions into individual feature contributions, aiding in biomarker discovery. Despite these developments, a gap is still identified in effectively integrating unsupervised clustering with optimized supervised learning strategies. The present study aims to address this limitation by incorporating hierarchical clustering into a machine learning pipeline, enhancing model performance through hyperparameter tuning with Optuna and improving transparency and interpretability based on SHAP analysis.
Finally, the problems are complex, demanding hybrid systems capable of integrating different approaches, since all methods have inherent limitations, which can be mitigated or even eliminated by the hybrid combination of algorithms. The context of developing hybrid algorithms emerges as a promising solution, taking advantage of the potential and particularities of different techniques (such as optimization and supervised and unsupervised machine learning) to create more robust, efficient solutions with advances in research, under different paradigms to face complex challenges, as highlighted by [5].
3. Materials and Methods
This section provides a comprehensive overview of the dataset employed in the present study, including the number of samples and features (columns) and data preprocessing steps taken prior to analysis.
Following the dataset description, the methodological framework adopted for breast cancer subtype classification is described and illustrated, for both supervised and unsupervised machine learning strategies, along with a description of the specific algorithms implemented, their configurations, and the evaluation metrics applied to assess their performance.
By combining both learning machine approaches, this study aims to explore the potential advantages of each in capturing distinct patterns and improving the accuracy and interpretability of cancer subtype classification, within a data-driven philosophy applied to health and cancer biology knowledge.
3.1. GEO Dataset Description
The Gene Expression Omnibus (GEO) is a well established public repository that aggregates large-scale gene expression datasets. This platform hosts data generated through array-based expression profiling, with specific selection protocols to identify samples associated with breast cancer. These datasets originate from collaborative research initiatives aimed at mapping genomic variations linked to different cancer types. The GEO data are authentic and openly accessible, enabling researchers worldwide to leverage them for various scientific investigations.
In this study, data extraction was conducted using the GEOparse library in Python, which facilitated structured access to the dataset. After retrieval, the information underwent a merging and reorganization process to ensure consistency across columns and prepare the dataset for subsequent analysis.
The dataset used in this study encompassing 508 breast cancer samples and 22,283 gene expression features. Subtypes include Luminal A, Luminal B, HER2-enriched, Basal-like, and Normal-like The next phase involved data preprocessing. This included evaluating and handling missing values, identifying outliers, and correcting values outside expected intervals. Normalization procedures were applied to avoid skewed influence from features with extreme values, thereby ensuring balanced representation across variables. Such preprocessing steps prepares the dataset for reliable machine learning modeling and classification, as shown in Figure 1.
Given the high-dimensional nature of gene expression data—where the number of features often exceeds the number of observations—dimensionality reduction was an essential step to make the machine learning methods feasible. To address this, Principal Component Analysis (PCA) was employed. PCA transforms the original feature space into a new set of uncorrelated components that retain the majority of the variance in the data. This technique not only reduces computational complexity, but also aids in uncovering hidden structure and relationships among variables, enhancing both model performance and interpretability.
After applying the PCA method, the dataset presents 508 samples and 260 features, enabling the application of machine learning methods, as illustrated in Figure 1. In addition, in this work, the principal components preserved approximately 80% of the original variance, ensuring that most relevant information was maintained, reducing dimensionality, and providing improved performance of the learning methods without loss of relevant information.
3.2. Unsupervised Approach: Hierarchical Clustering
Hierarchical clustering was applied using two distance metrics: Euclidean and Pearson correlation [12,28]. The clustering structure was visualized using dendrograms. The Mojena stopping rule was adopted to determine the optimal number of clusters based on agglomeration coefficients, with a scaling constant of 1.25. Pearson correlation, while more sensitive to subtle trends, yielded lower cluster purity, whereas the Euclidean distance produced clearer subtype separation [12].
Hierarchical clustering was applied in this study to explore underlying structures in gene expression data, as shown in Figure 2. To measure the similarity between samples, both Euclidean distance and Pearson correlation were employed as dissimilarity metrics [28]. The clustering outcomes were represented through dendrograms, which illustrate how individual samples or clusters merge at successive levels of similarity.
To define the most suitable number of clusters, the Mojena stopping rule was adopted [12]. This statistical technique analyzes the agglomeration coefficients (also known as fusion levels), derived from the hierarchical merging steps displayed in the dendrogram [21]. According to the Mojena criterion, the optimal number of clusters is established at the point j (where ) that satisfies the inequality . Here, denotes the agglomeration coefficient in step , is the mean of the agglomeration coefficients and is their unbiased standard deviation. The constant k is a scaling factor, set to 1.25 in this analysis as recommended in the literature [20].
Furthermore, to assess the composition of the resulting clusters, a frequency distribution matrix was constructed to verify how the known breast cancer subtypes were distributed among the identified clusters, making it possible to determine which subtypes are prevalent in each group.
3.3. Supervised Learning Approaches
In this work, a set of supervised machine learning algorithms was applied to perform the classification of breast cancer subtypes based on gene expression profiles, as shown in Figure 3. The selected models included Support Vector Machines (SVM), Logistic Regression (LR), Random Forest (RF), and Multilayer Perceptrons (MLP). These techniques were chosen for their proven effectiveness in handling high-dimensional biological data, particularly in cancer genomics, as evidenced in various previous studies [1,7,8,17,23].
The Support Vector Machine is a widely adopted algorithm designed to identify an optimal decision boundary—or hyperplane—that best separates data classes within a multidimensional space [1]. To handle non-linearly separable data, SVM leverages kernel functions such as linear, polynomial, and radial basis function (RBF) kernels [7]. These kernels project the data into higher-dimensional spaces, where class separation becomes more tractable. Moreover, SVM includes regularization mechanisms that help mitigate overfitting, which is especially beneficial in gene expression analysis.
Logistic Regression is a classical statistical approach commonly used for binary and multiclass classification problems [17]. It models the probability of a class label using a logistic function, which transforms a linear combination of input variables into a bounded probability score. Owing to its simplicity and interpretability, Logistic Regression often serves as a baseline model in biomedical data analysis and remains useful in structured data environments.
Random Forest, an ensemble-based algorithm, operates by constructing a collection of decision trees—each trained on random subsets of features and data samples [8]. The final classification is determined by majority voting among all trees, a strategy that enhances generalization and reduces model variance. Its robustness and ability to capture non-linear patterns make it well-suited for complex datasets like gene expression matrices. Multilayer Perceptron (MLP), a form of feedforward artificial neural network, was also used in this study [14]. The MLP architecture consists of input, hidden, and output layers, with fully connected neurons across adjacent layers. Training is carried out through the backpropagation algorithm, which iteratively updates model weights to minimize classification error using gradient descent. MLPs are known for their ability to model intricate, non-linear relationships, especially when multiple hidden layers are included.
Each of these models offers distinct strengths and their performances were systematically compared in the context of classifying breast cancer subtypes using transcriptomic data. To enhance the performance of these models, hyperparameter tuning was conducted using the Optuna framework [3]. This library facilitates efficient exploration of the hyperparameter search space by employing the Tree-structured Parzen Estimator (TPE) algorithm [6]. For each algorithm, a specific set of parameters was optimized: the regularization term in Logistic Regression and SVM, the number and depth of trees in Random Forest, and architecture-related parameters for MLP, such as the number of hidden layers, neurons per layer, learning rate, and dropout rate. The optimization process aimed to maximize performance metrics like accuracy and F1-score during cross-validation. Figure 3 illustrates the methodological path of the supervised methods approach, which will be compared with the process of optimizing the hyperparameters of the models.
Furthermore, to interpret the models’ decisions and assess feature relevance, SHAP (SHapley Additive exPlanations) analysis was performed [19]. Based on concepts from cooperative game theory, SHAP provides a consistent framework to measure the impact of each input feature on the model’s output, even for complex, nonlinear models. It assigns each feature a contribution value, known as a SHAP value, that reflects its marginal effect on the prediction outcome. This allows for a detailed understanding of which genes or components influence classification outcomes most significantly.
In this study, SHAP values were obtained for the principal components derived from PCA. This approach enabled the identification of the most influential components across different models, highlighting the biological relevance of certain gene clusters in subtype discrimination. Despite differences in modeling strategies, some principal components were consistently deemed relevant, underscoring their potential role as key biomarkers in breast cancer classification.
3.4. Evaluation Metrics
In order to train the models and assess their effectiveness, the dataset was partitioned into two subsets: 80% of the data was reserved for training purposes, while the remaining 20% was designated for testing. This split adheres to the commonly used Pareto distribution. Following this partition, a 10-fold cross-validation procedure was employed to ensure a more robust and generalizable evaluation of model performance [1]. This technique involves dividing the training set into ten equal parts, iteratively training the model on nine parts while validating it on the remaining one. After all iterations, the evaluation metrics obtained in each fold were averaged, providing a more stable estimate of the predictive model capacity on new data.
Model performance was examined through standard evaluation tools, such as the confusion matrix, overall accuracy, and cross-validation scores [1,7], adding Recall, Precision and F1-score. All computational experiments were conducted using Python version 3.11, selected for its performance and versatility in data analysis tasks. Statistical analyses were performed at a significance level of 5%, ensuring consistency with conventional thresholds for hypothesis testing.
4. Results and Discussion
This section presents the results of hierarchical clustering and machine learning methods, including a comparative analysis of classification models with and without hyperparameter optimization using the model parameter tuning in Optuna library.
4.1. Unsupervised Learning
Table 1 presents the results of hierarchical clustering using Euclidean distance (on the left) and Pearson correlation (on the right). The metrics indicate that clustering based on Pearson correlation provides slightly better performance compared to the Euclidean distance.
The results indicate that hierarchical clustering with both Euclidean distance and Pearson correlation did not produce well-separated clusters, as evident from the overlapping groups in the dendrograms presented in Figure 4, for Euclidean distance, and Figure 5, for Pearson Correlation. In these dendrograms, the number of clusters is defined by the Mojena method, as described in Section 2.2. Using , the Mojena method identified 23 clusters based on Euclidean distance and 24 clusters based on Pearson correlation.
In the Euclidean distance dendrogram (Figure 4), a more fragmented tree structure with a wide range of linkage heights can be observed. The branches are highly irregular, suggesting that the Euclidean metric may be overly sensitive to the absolute magnitudes of expression levels. This can result in clustering based more on overall intensity than on the shape or trend of gene expression profiles. Consequently, the clusters appear to be less biologically meaningful, and the separation between them is not well defined.
In contrast, the Pearson correlation dendrogram (Figure 5) shows a more balanced tree structure, with clearer and more symmetrical clusters. Since Pearson correlation evaluates the similarity in expression patterns regardless of scale, it captures relationships between genes or samples based on co-expression trends rather than absolute differences. This method produces clusters that are potentially more consistent with underlying biological patterns, although separation between clusters is still limited, due to the inherent noise and complexity of gene expression data.
Following the Mojena criterion, 43 clusters were produced using Euclidean distance and 38 clusters with Pearson correlation. These results reflect the different behaviors of distance measures in capturing structures in high-dimensional gene expression data. Therefore, Pearson correlation provides better cluster coherence in this context, even though neither method achieves high cluster separability.
To assess the composition of the resulting clusters, a frequency distribution matrix was constructed, visualized by the heatmap in Figure 6, of the frequency distribution matrix for Pearson correlation (red) and Euclidean distance (blue), respectively. Which allows visualizing how the known subtypes of breast cancer were distributed among the identified clusters, making it possible to determine which subtypes were predominant in each group.
Euclidean distance, which measures similarity considering the absolute magnitude of differences between gene expression values, presents strong concentrations of high frequencies in some clusters. However, Pearson’s correlation, which measures similarity considering relative trends between genes, presents more concentrated and less diffuse high frequencies, proving to be a more promising application for distinguishing between breast cancer subtypes using the dataset from GEO.
4.2. Supervised Learning
In this section, the results of the applied supervision learning models are presented on the dataset obtained from the GEO repository. The analysis emphasizes a comparison of model performance based on statistical evaluation metrics. Additionally, the results are evaluated both before and after the implementation of hyperparameter tuning, allowing a clearer understanding of the impact of optimization on model effectiveness.
Due to the high dimensionality of the original data, Principal Component Analysis (PCA) was applied to reduce the number of features, obtaining a transformed dataset with 260 components. It is worth noting that each sample corresponds to an individual biological observation, whereas the features reflect gene expression levels.
Table 2 presents the numerical results for key statistical metrics, including precision, recall, F1-score and accuracy [1]. It also includes the results obtained from 10-fold cross-validation, based on the classification models (Logistic Regression, SVM, Randon Forest and MLP) evaluated with their default parameter configurations, as follows. For Logistic Regression, the maximum number of iterations was set to 6500 to ensure proper convergence. The SVM model was implemented using the RBF kernel without further parameter adjustments, while the Random Forest algorithm was executed using its default settings. The MLP model was structured with 4 hidden layers containing 100, 75, 50, and 25 neurons, respectively, employing ReLU activation functions in the hidden layers and a softmax function in the output layer. Training was conducted for up to 500 iterations using the Adam optimizer. To maintain class balance across folds, stratified cross-validation was performed using StratifiedKFold with 10 folds.
In order to complement the evaluation of model performance, confusion matrices are presented in Figure 7. A concentration of high values along the main diagonal suggests that most predictions matched the actual class labels in the test dataset. The class labels follow the order: 0 for LumA, 1 for Normal, 2 for Basal, 3 for LumB, and 4 for Her2.
The analysis of the confusion matrix revealed some difficulty in classifying the ’Normal’ class, which can be attributed to the fact that this class has a smaller number of samples than the others. This inequality in the amount of data makes it more difficult for the models to capture the specific patterns of each class, resulting in incorrect classifications.
The application of hyperparameter optimization of the models is necessary to improve the performance of the classification of breast cancer subtypes. Table 3 presents the results obtained after the optimization process, which consists of the process of tuning the hyperparameters of the classifiers, using the Optuna library.
For the Logistic Regression model, hyperparameter tuning resulted in an optimal value of , with the solver set to newton-cg. The Support Vector Machine (SVM) model showed the best performance with , using the RBF kernel. Regarding the Random Forest classifier, the optimal configuration included 182 trees, a maximum depth of 46, and a minimum of 3 samples required to split an internal node.
After tuning the hyperparameters, the MLP model was configured with two hidden layers containing 27 and 110 neurons, respectively. The activation function used was logistic, the solver was set to sgd, and the initial learning rate was defined as 0.0059. Moreover, the regularization parameter was set to . Once again, Cross-validation for the Logistic Regression, SVM, Random Forest, and MLP models was performed using StratifiedKFold with 10 folds.
The Confusion Matrix with optimization of hyperparameter values can be seen in Figure 8. As before, the classes in the confusion matrix are ordered as: LumA (0), Normal(1), Basal(2), Lum(3) e Her2(4).
For the SVM model, the initial accuracy was 0.7647, which slightly improved to 0.7745 after hyperparameter tuning. Although the gain was modest, it indicates that the adjustments performed by Optuna contributed positively to the model’s performance. In contrast, Logistic Regression maintained an accuracy of 0.8039 both before and after optimization, suggesting that the model was already well adjusted.
The MLP neural network initially achieved an accuracy of 0.6863 without tuning. After applying Optuna, its accuracy increased significantly to 0.8039, surpassing the results of the other classifiers. On the other hand, the Random Forest model experienced a slight decline in accuracy, from 0.7005 to 0.6961 after optimization. This drop may be explained by the inherent robustness of the model, which can make it less responsive to hyperparameter adjustments. It is also possible that the parameter search space defined for optimization did not effectively capture configurations that could enhance the performance of the models.
4.3. Feature Importance
Figure 9 illustrates the importance values of the input variables for the data from the GEO repository, initially without the optimization of the hyperparameters of the classification models: (a) SVM, (b) Logistic Regression, (c) Random Forest and (d) MLP, with the analysis of the importance of the attributes performed using the SHAP library [19]. The dimensionality reduction by the PCA method was also performed previously, and the representations show the contribution of each of the principal components to the prediction of each sample.
The analysis of variable importance using SHAP provided additional information on which principal components had the most significant impact on the classifiers’ predictions. Without hyperparameter optimization, principal components 1 and 2 emerged as the most relevant across all models, suggesting that they capture fundamental information for data variation.
Similarly, using hyperparameter optimization of classification models with the Optuna library, Figure 10 presents the contributions of the input variables to the optimized classifiers: (a) SVM, (b) Logistic Regression, (c) Random Forest and (d) MLP. The optimization process further refined the identification of relevant variables, with some variables showing higher consistency across different models, suggesting a positive impact on the performance of the classifiers.
After implementing Optuna, a remarkable stability in the important variables across models can be observed. This continuity suggests that, while hyperparameter optimization is generally beneficial, the underlying variables that impact predictions remain consistent across the GEO data, demonstrating robust structure in the relationships between features and classes.
5. Conclusions
The classification of breast cancer subtypes using an integrative unsupervised and supervised learning approach offers a promising way to improve the effectiveness and accuracy of diagnostic and treatment practices.
In addition to a machine learning approach, this work contributes to the accurate classification of the most aggressive breast cancer subtypes (LumA and LumB), as demonstrated in confusion matrices. The hybrid (supervised and unsupervised) approach proposed in this work has the potential to provide a more comprehensive understanding of breast cancer subtypes, increase classification accuracy, and support robust predictive models. By combining both learning approaches, we can improve and evolve analytical methods in real-world data analysis.
Advances resulting from these efforts have the potential to improve the care of patients affected by breast tumors, representing an important step toward a future with better clinical outcomes and quality of life for those affected by this condition.
For future work, imaging data can be incorporated to enrich the analysis and improve model performance, based on a metadata framework and Universal Learning Machine (ULM) models. The integration of imaging data with gene expression profiles would allow considering multimodal metadata, combining heterogeneous data acquisition sources. In this case, Hybrid Learning Model (HLM) methods can reveal patterns that are not detectable when using a single data type, contributing to deeper insights in precision oncology.
Funding
This work was supported by the Coordination for the Improvement of Higher Education Personnel (CAPES), Brazil – Finance Code 001.
Data Availability Statement
The Python scripts used for this analysis are available on GitHub, accessible through the following link https://github.com/anabev/breastcancer-classification.
Conflicts of Interest
The authors declare no conflicts of interest.
References
- Aggarwal, C. C. Data classification. New York: Springer International Publishing, 2015.
- Amrane, M., Oukid, S., Gagaoua, I., Ensari, T. Breast cancer classification using machine learning. In: 2018 Electric Electronics, Computer Science, Biomedical Engineerings’ Meeting (EBBT), pp. 1-4, 2018.
- Akiba, T., Sano, S., Yanase, T., Ohta, T., Koyama, M. Optuna: A next-generation hyperparameter optimization framework. In Proceedings of the 25th ACM SIGKDD international conference on knowledge discovery and data mining, pp. 2623-2631, 2019.
- Amor, R. D., Colomer, A., Monteagudo, C., Naranjo, V. A deep embedded refined clustering approach for breast cancer distinction based on DNA methylation. Neural Computing and Applications, 1-13, 2022. [CrossRef]
- Azevedo, B. F., Rocha, A. M. A., & Pereira, A. I. Hybrid approaches to optimization and machine learning methods: a systematic literature review. Machine Learning, 113(7), 4055-4097, 2024. [CrossRef]
- Bergstra, J., Bardenet, R., Bengio, Y., Kégl, B. Algorithms for hyper-parameter optimization. Advances in neural information processing systems, 24, 2011.
- Bishop, C. M. Pattern recognition and machine learning. Springer Google Scholar, 2, 645-678, 2006.
- Breiman, L. Random forests. Machine learning. 45:5-32, 2001.
- Carlin, B. P., Louis, T. A. Bayesian methods for data analysis. 3rd edn. CRC press, Boca Raton, USA, 2008.
- Dianatinasab, M., Mohammadianpanah, M., Daneshi, N., Zare-Bandamiri, M., Rezaeianzadeh, A., Fararouei, M. Socioeconomic factors, health behavior, and late-stage diagnosis of breast cancer: considering the impact of delay in diagnosis. Clin. Breast Cancer, 18(3), 239–245, 2018. [CrossRef]
- Do, J. H., Choi, D. K. Clustering approaches to identifying gene expression patterns from DNA microarray data. Molecules and cells, 25(2), 279-288, 2008. [CrossRef]
- Everitt, B. S., Landau, S., Leese, M., Stahl, D. Hierarchical clustering. Wiley Interdisciplinary Reviews: Computational Statistics, 3(4), 374-379, 2011.
- Gelman, A., Carlin, J. B., Stern, H. S., Rubin, D. B. Bayesian data analysis. 1st edn. Chapman and Hall/CRC, New York, EUA (1995).
- Haykin, S. S. Neural Networks and Learning Machines. New York: Pearson International Edition, 2009.
- Iparraguirre-Villanueva, O., Epifanía-Huerta, A., Torres-Ceclén, C., Ruiz-Alvarado, J., Cabanillas-Carbonel, M. Breast cancer prediction using machine learning models. International Journal of Advanced Computer Science and Applications, 14(2), 610–620, 2023.
- Jain, A. K., Murty, M. N., Flynn, P. J. Data clustering: a review. ACM computing surveys (CSUR), 31(3), 264-323, 1999.
- Lemeshow, S., Hosmer, D. W. Logistic regression analysis: applications to ophthalmic research. American journal of ophthalmology, 147(5), 766-767, 2009. [CrossRef]
- Lin, I. H., Chen, D. T., Chang, Y. F., Lee, Y. L., Su, C. H., Cheng, C., ... Hsu, M. T. Hierarchical clustering of breast cancer methylomes revealed differentially methylated and expressed breast cancer genes. PloS one, 10(2), e0118453, 2015. [CrossRef]
- Lundberg, S. M., Lee, S-I. A unified approach to interpreting model predictions. In 31st Conference on Neural Information Processing Systems (NIPS), 2017. arXiv preprint arXiv:1705.07874.
- Milligan G.W., Cooper M.C. An Examination of Procedures for Determining the Number of Clusters in a Data Set. Psychometrika. 50(2):159-179, 985. [CrossRef]
- Mojena, R. Hierarchical grouping methods and stopping rules: an evaluation, The Computer Journal, 20(4):359–363, 1977. [CrossRef]
- Perou, C. M., et al. Molecular portraits of human breast tumours. Nature, 406(6797), 747-752, 2000. [CrossRef]
- Quinlan, J. R. Learning decision tree classifiers. ACM Computing Surveys (CSUR), 28(1), 71-72, 1996.
- Rabiei, R., M., A. S., Sohrabei, S., Esmaeili, M., and Atashi, A. Prediction of breast cancer using machine learning approaches. J Biomed Phys Eng, 12(3), 297–308, 2022. [CrossRef]
- Rencher, A. C. Methods of Multivariate Analysis. Wiley, 2002. (Wiley series in probality and mathematical statistics). IISB 0-471-41889-7.
- Shieh, S. H., Hsieh, V. C. R., Liu, S. H., Chien, C. R., Lin, C. C., Wu, T. N. Delayed time from first medical visit to diagnosis for breast cancer patients in Taiwan. J. Formos. Med. Assoc., 113(10), 696–703, 2014. [CrossRef]
- Sun, C., Liu, Z. P. Discovering explainable biomarkers for breast cancer anti-PD1 response via network Shapley value analysis. Computer Methods and Programs in Biomedicine, 257, 108481, 2024. [CrossRef]
- Tan, P. N., Steinbach, M., Kumar, V. Introduction to data mining. 2nd edn. Pearson Education, New York, 2018.
- Tewari, Y., Ujjwal, E., Kumar, L. Breast cancer classification using machine learning. In 2nd International Conference on Advance Computing and Innovative Technologies in Engineering (ICACITE), IEEE, Greater Noida, India, 01-04, 2022.
- Valentin, A. B. M., Bressan, G. M., Lizzi, E. A. S., Canuto Jr., L. Optimized Learning Methods for Classifying Breast Cancer Subtypes Based on Gene Expression Data. Applied Mathematics & Information Sciences, 19(4), 819–830, 2025.
- World Health Organization. Global breast cancer initiative implementation framework: assessing, strengthening, and scaling-up of services for the early detection and management of breast cancer. World Health Organization, 2023.
- Yue, W., Wang, Z., Chen, H., Payne, A., Liu, X. Machine learning with applications in breast cancer diagnosis and prognosis. Designs, 2(2), 13, 2018. [CrossRef]
| 1 | |
| 2 |
Figure 1.
Preprocessing and preparation of the dataset for classification and clustering methods
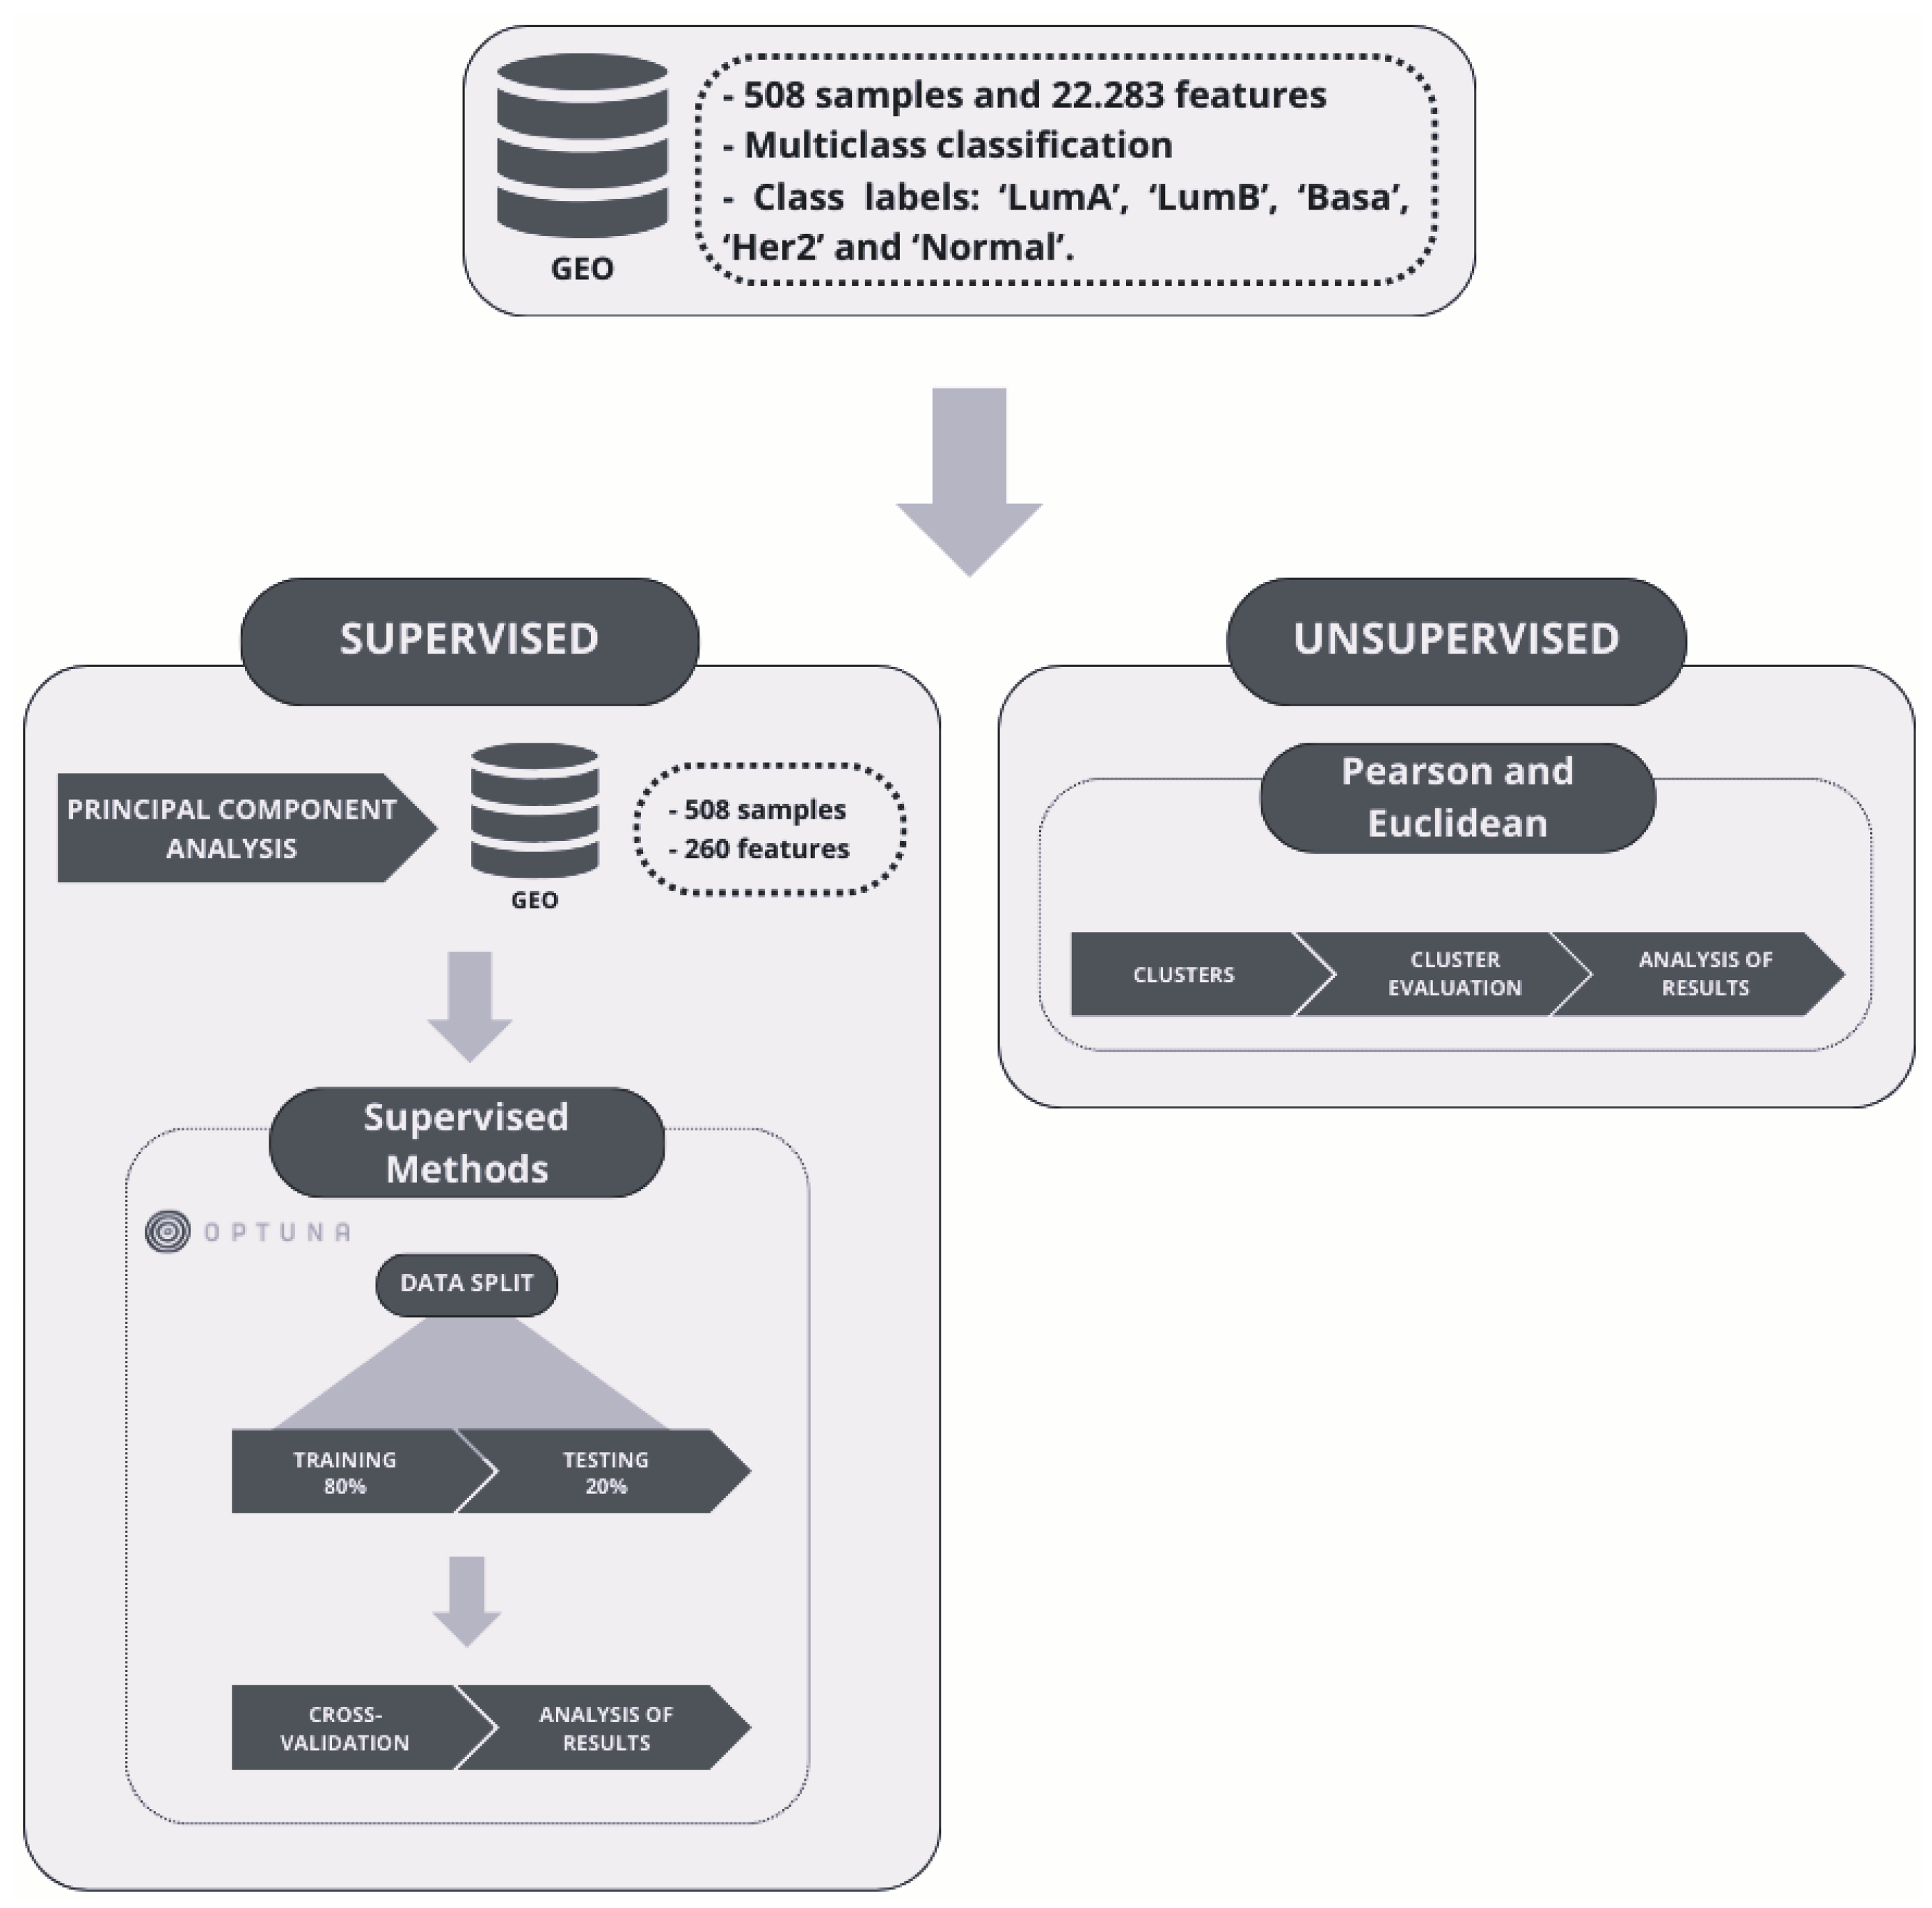
Figure 2.
Workflow of the unsupervised approach: Hierarchial Clustering
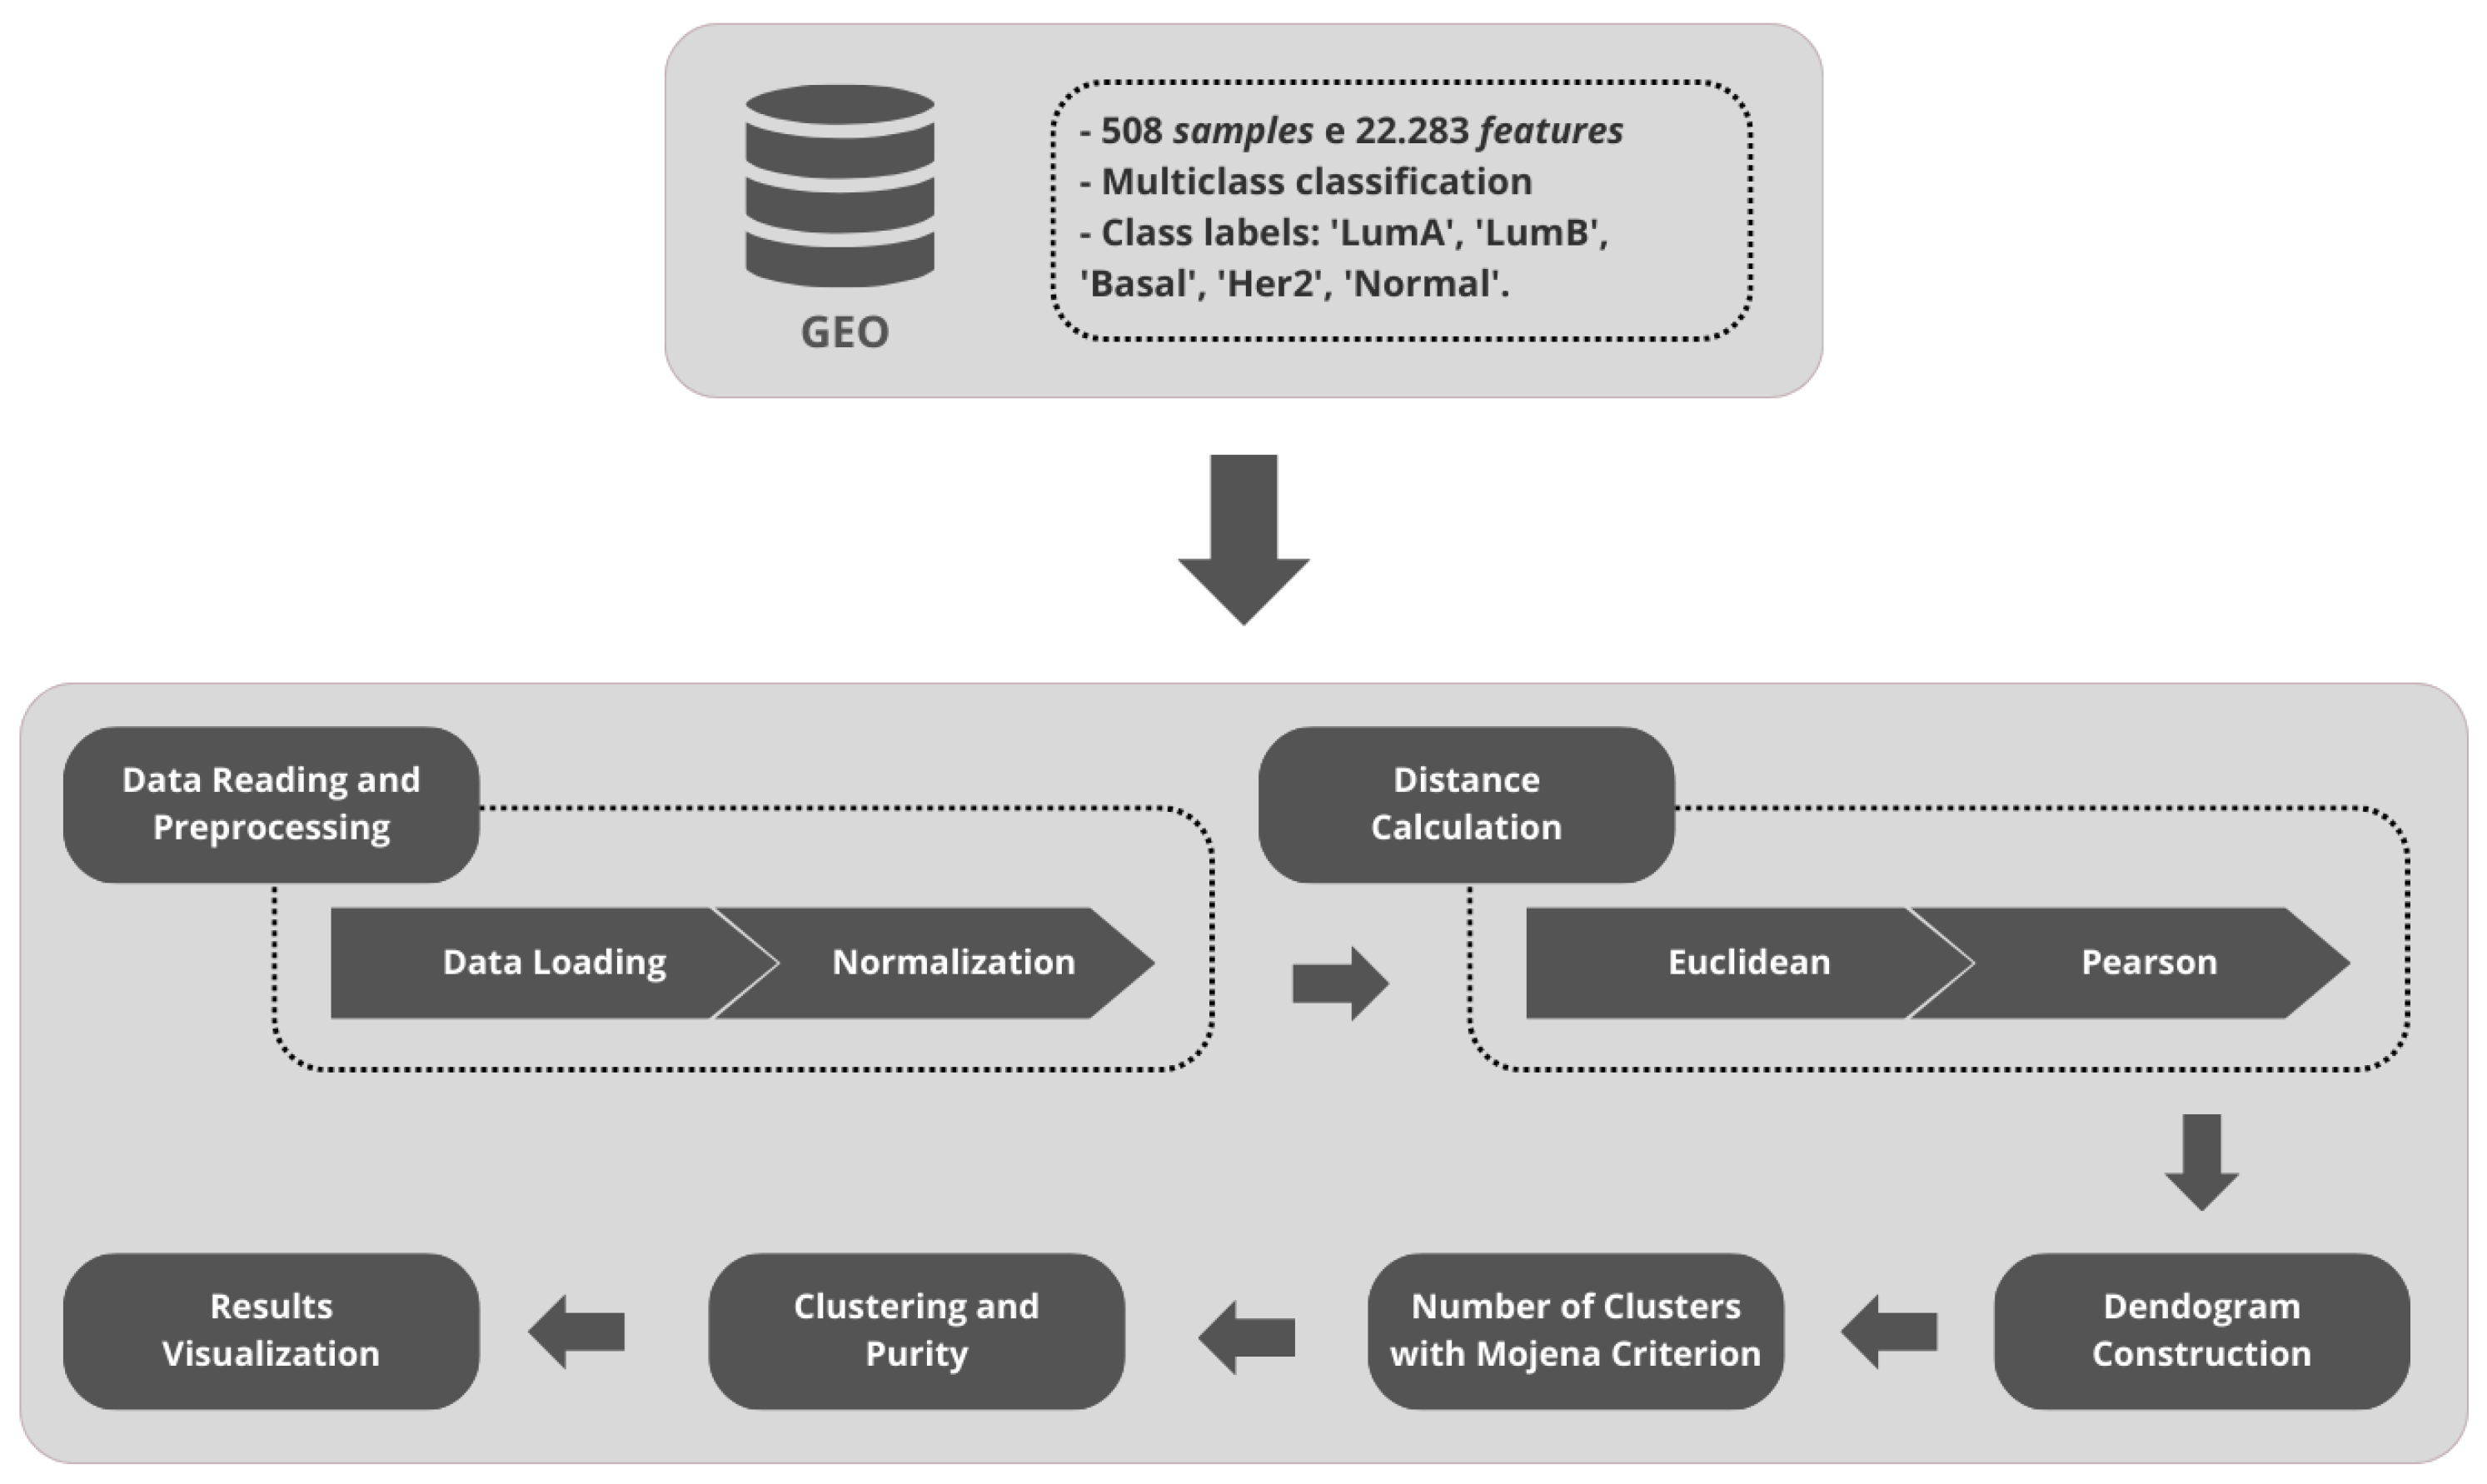
Figure 3.
Workflow of the supervised approach: Machine Leaning Methods
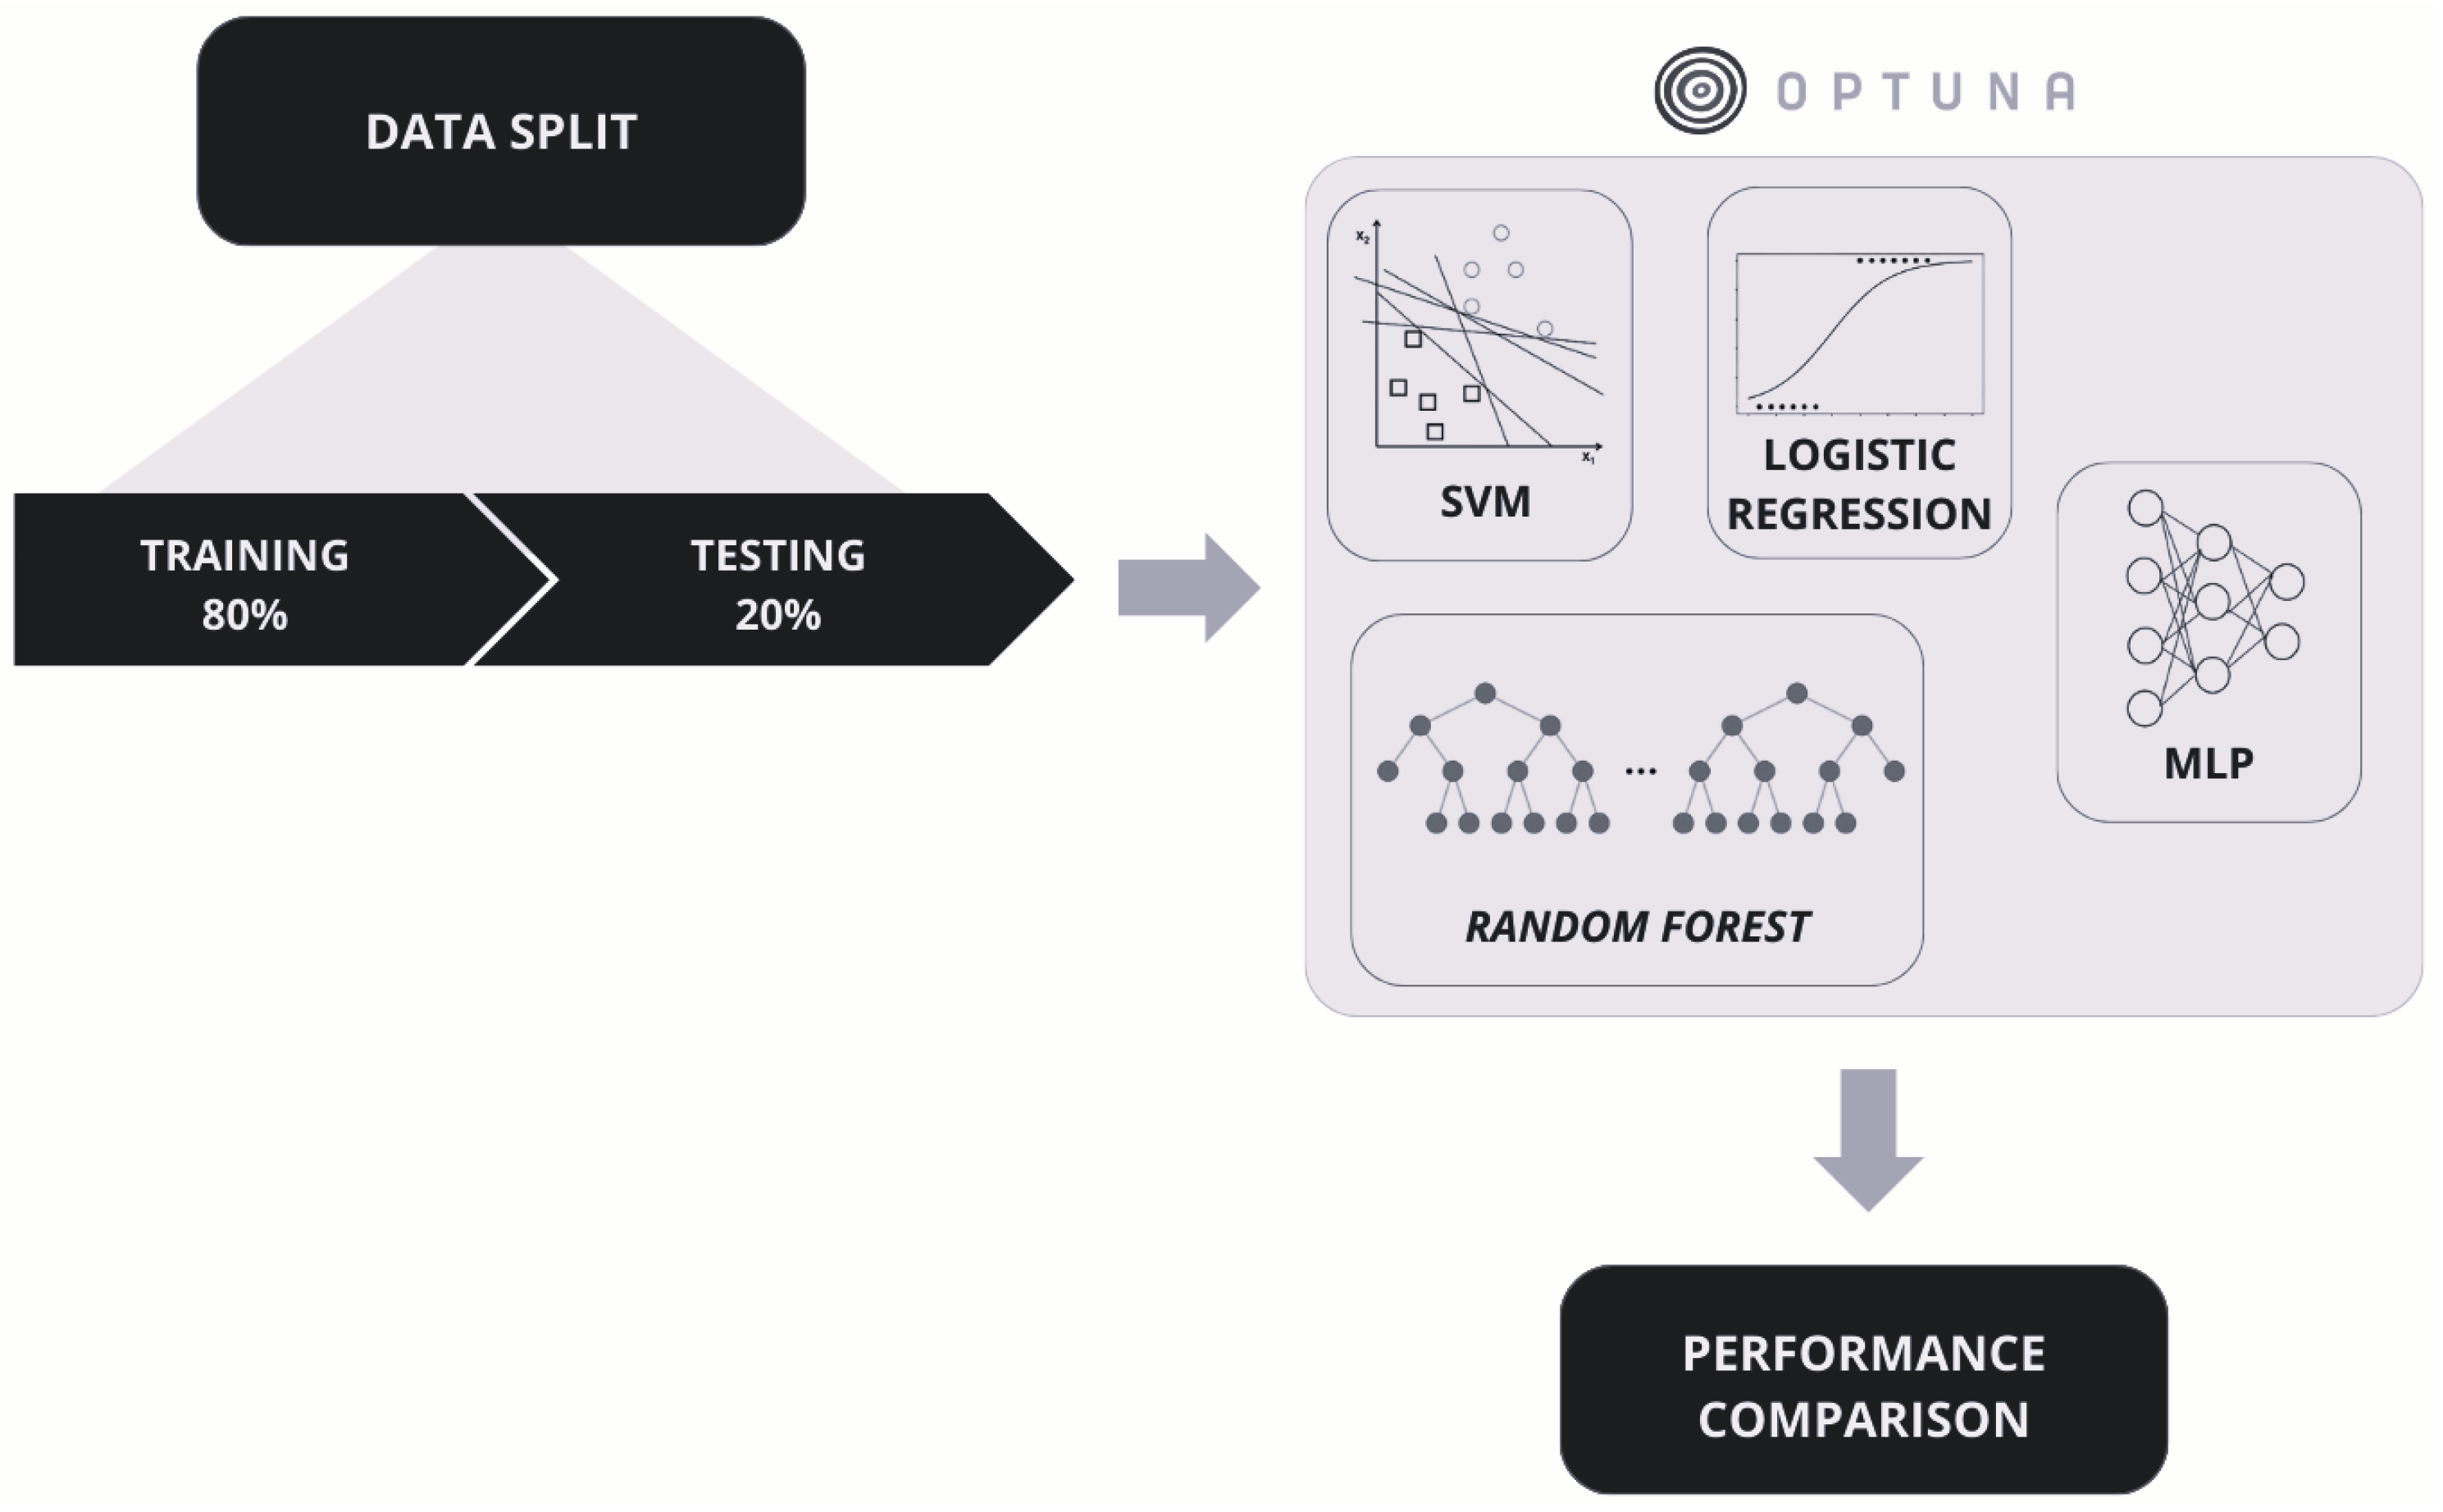
Figure 4.
Dendrogram - Euclidean Distance
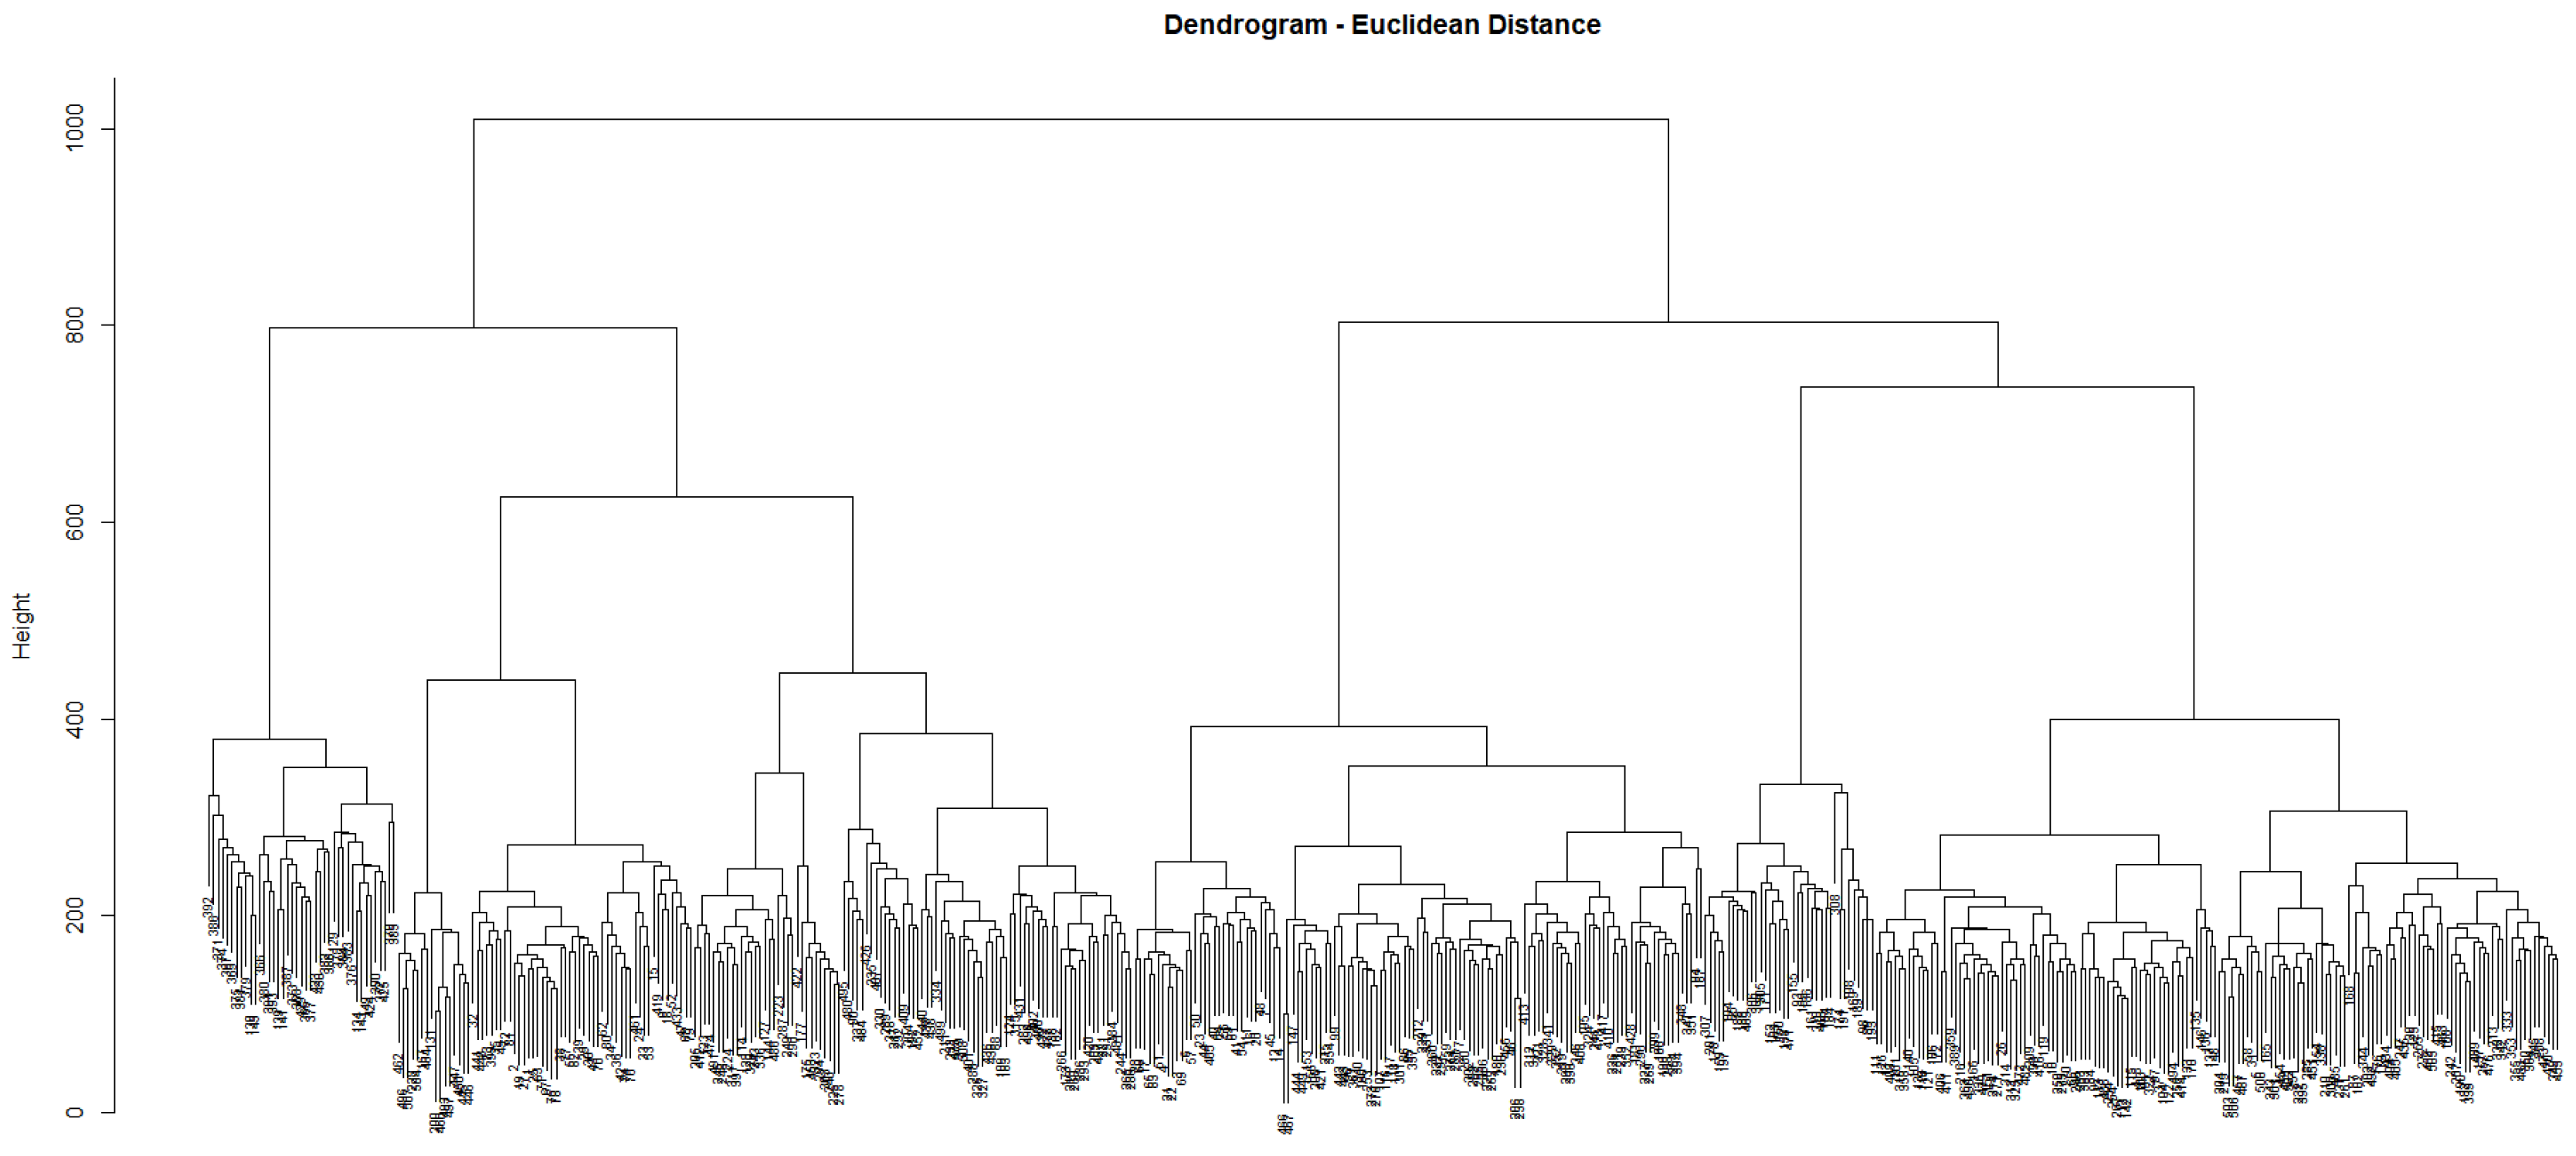
Figure 5.
Dendrogram - Pearson Correlation
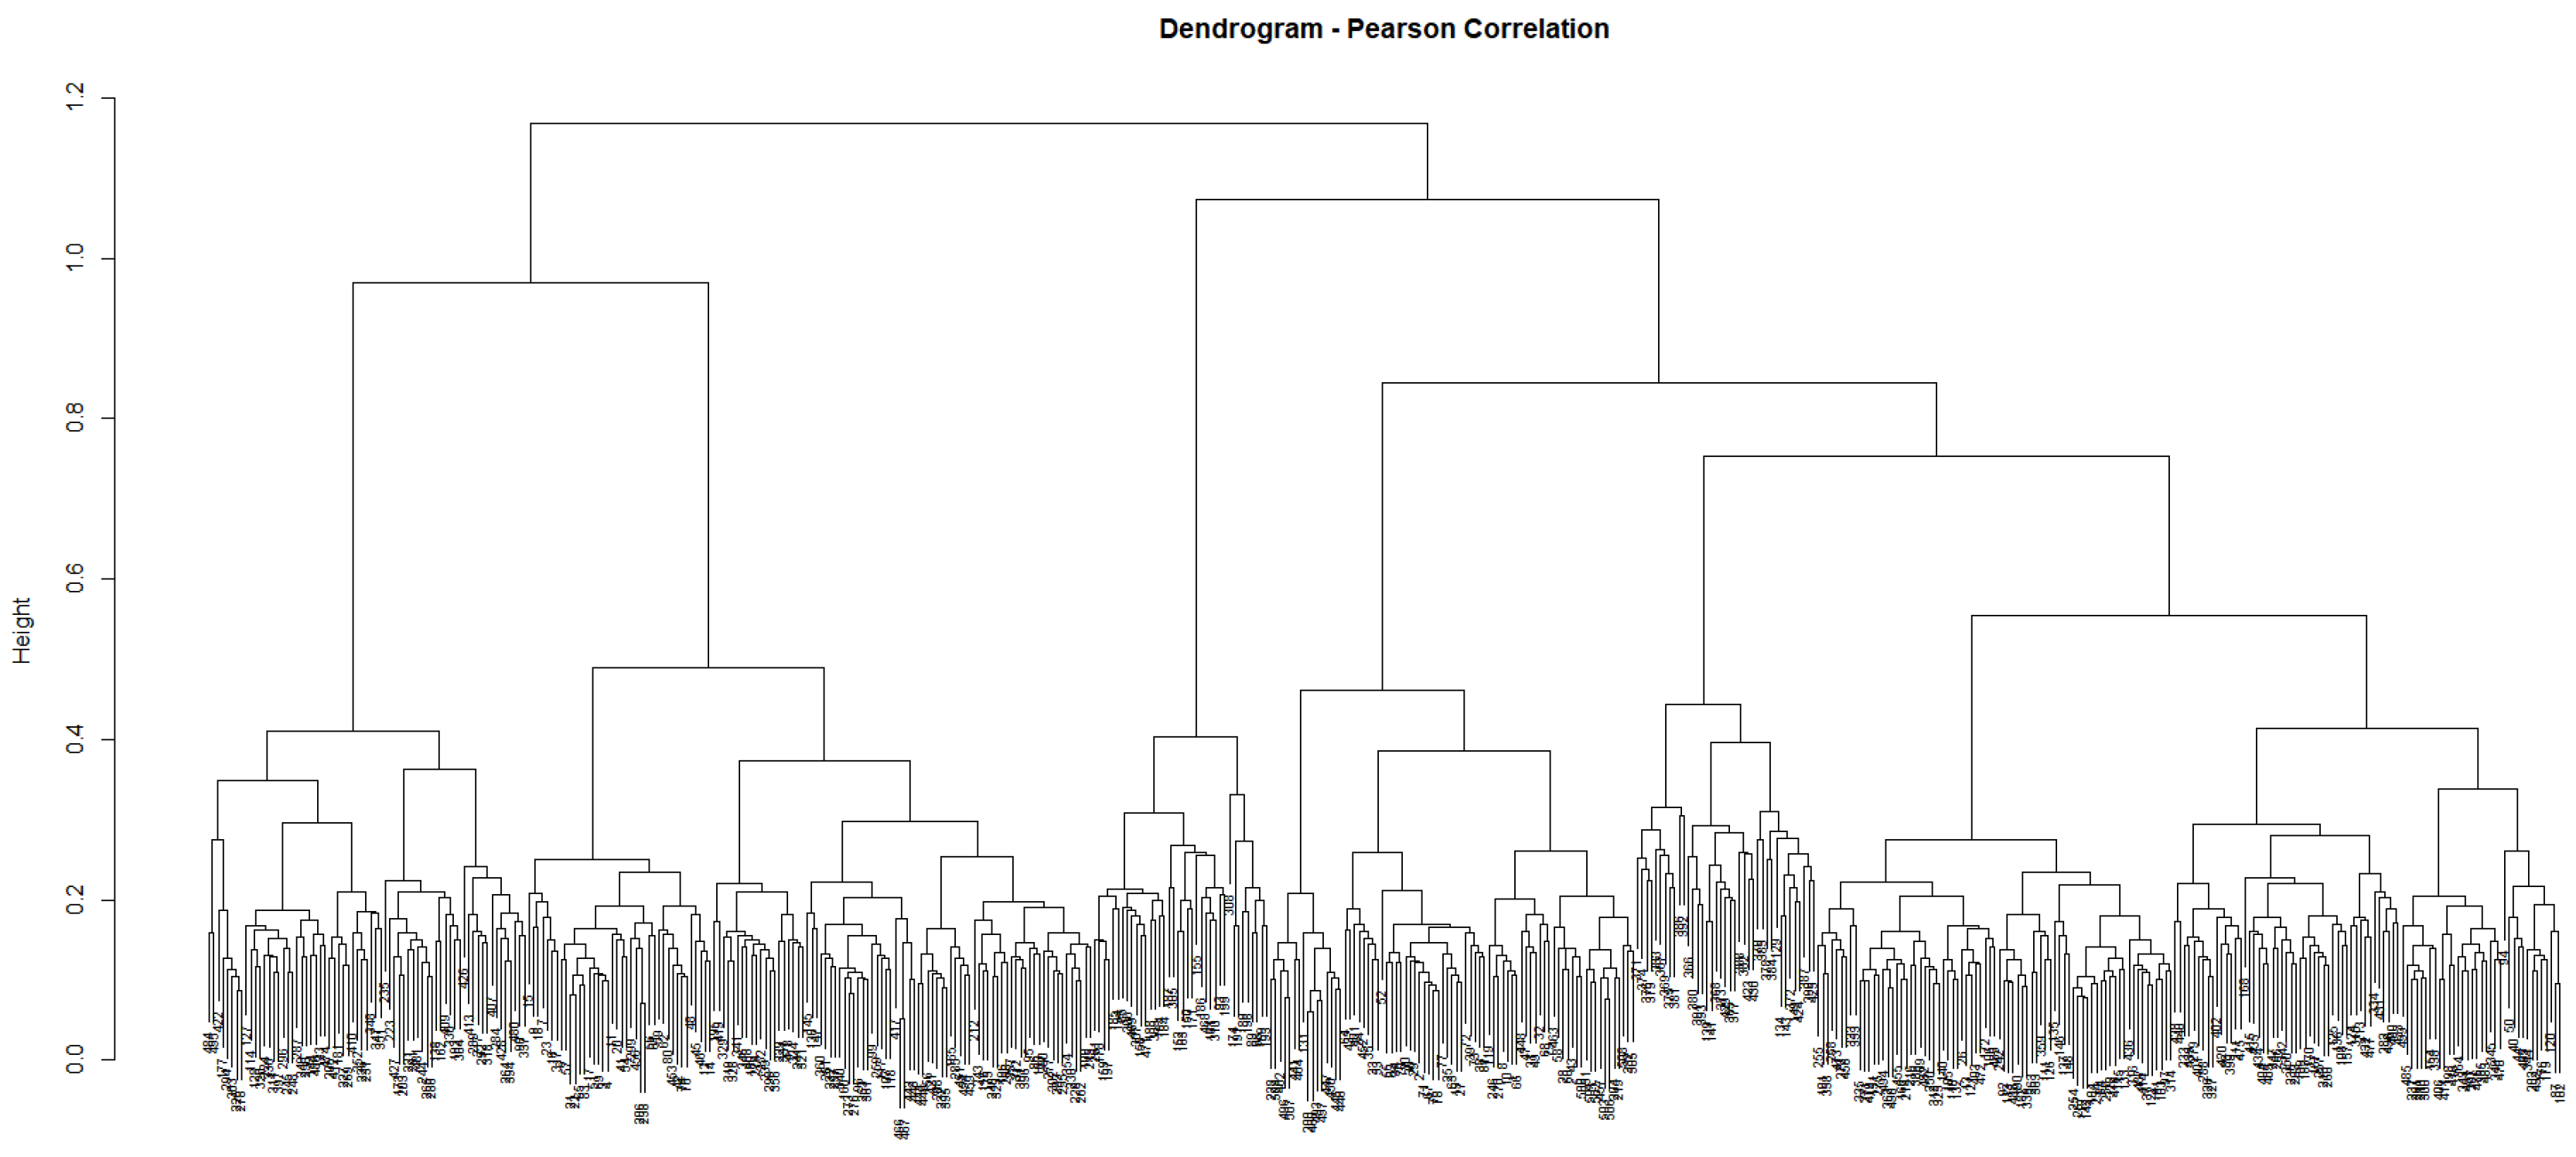
Figure 6.
Heatmap of the frequency distribution matrix for Pearson correlation and Euclidean distance,
Figure 6.
Heatmap of the frequency distribution matrix for Pearson correlation and Euclidean distance,
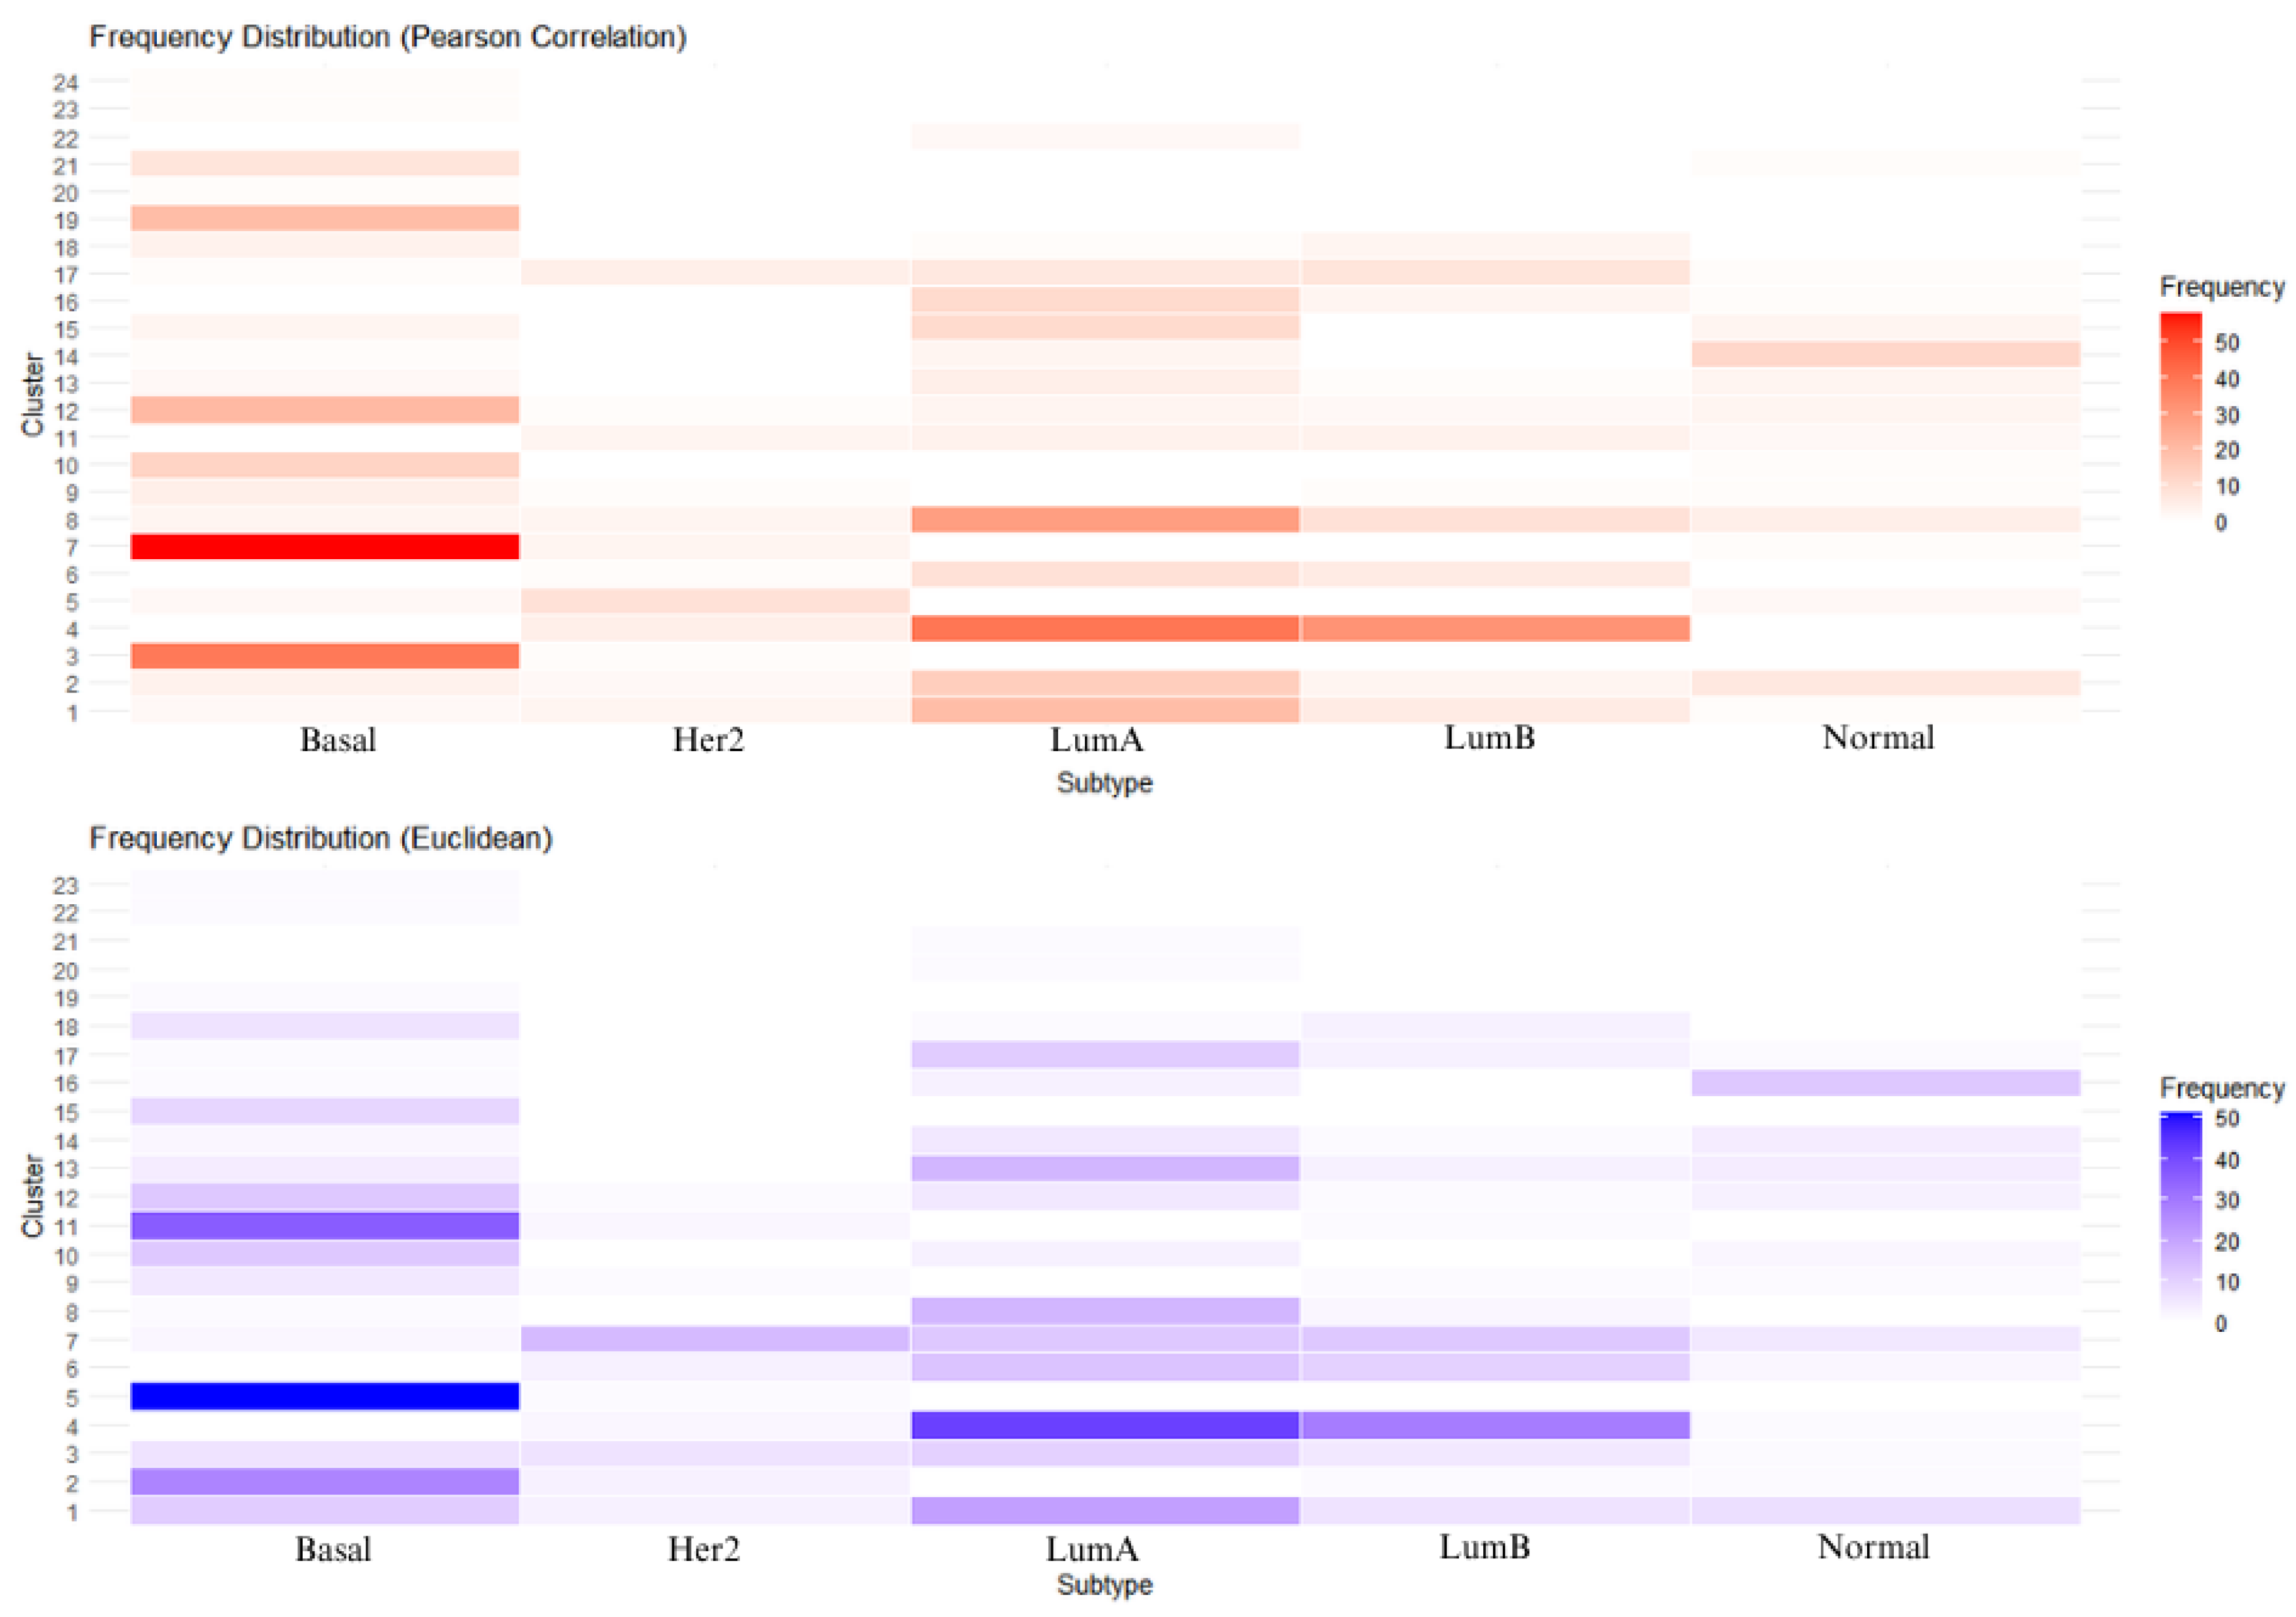
Figure 7.
Confusion matrix
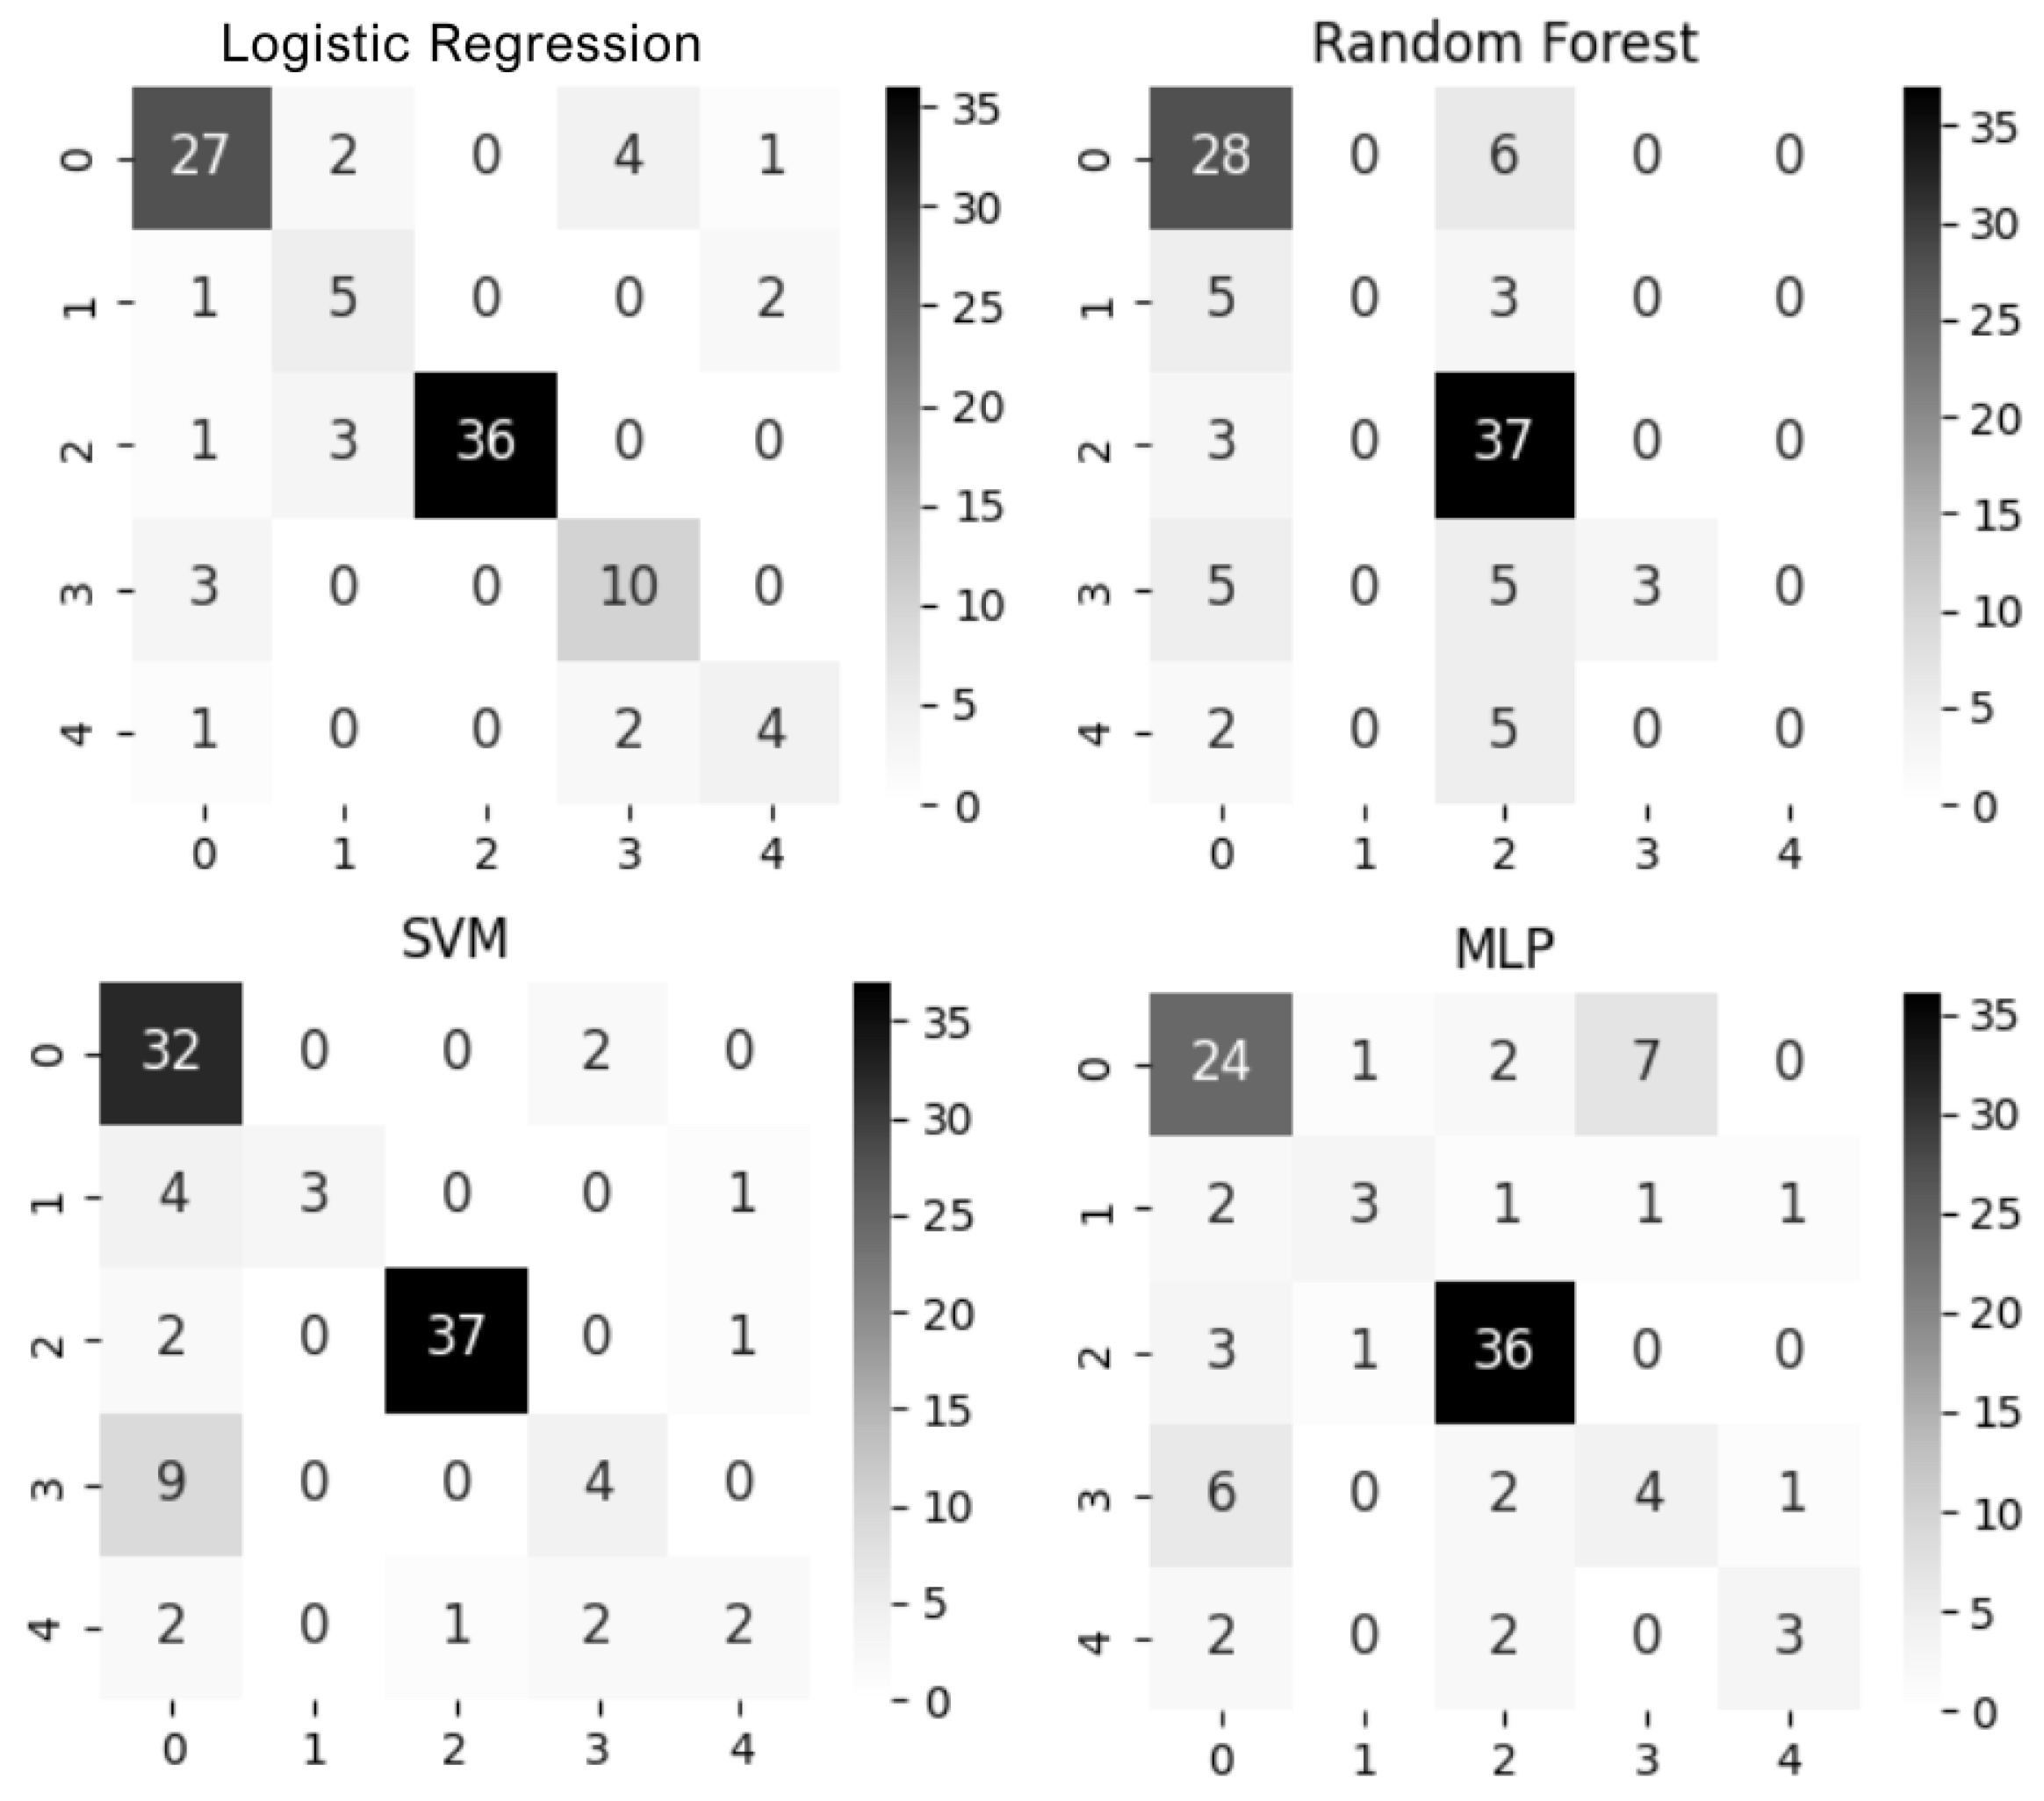
Figure 8.
Confusion matrix
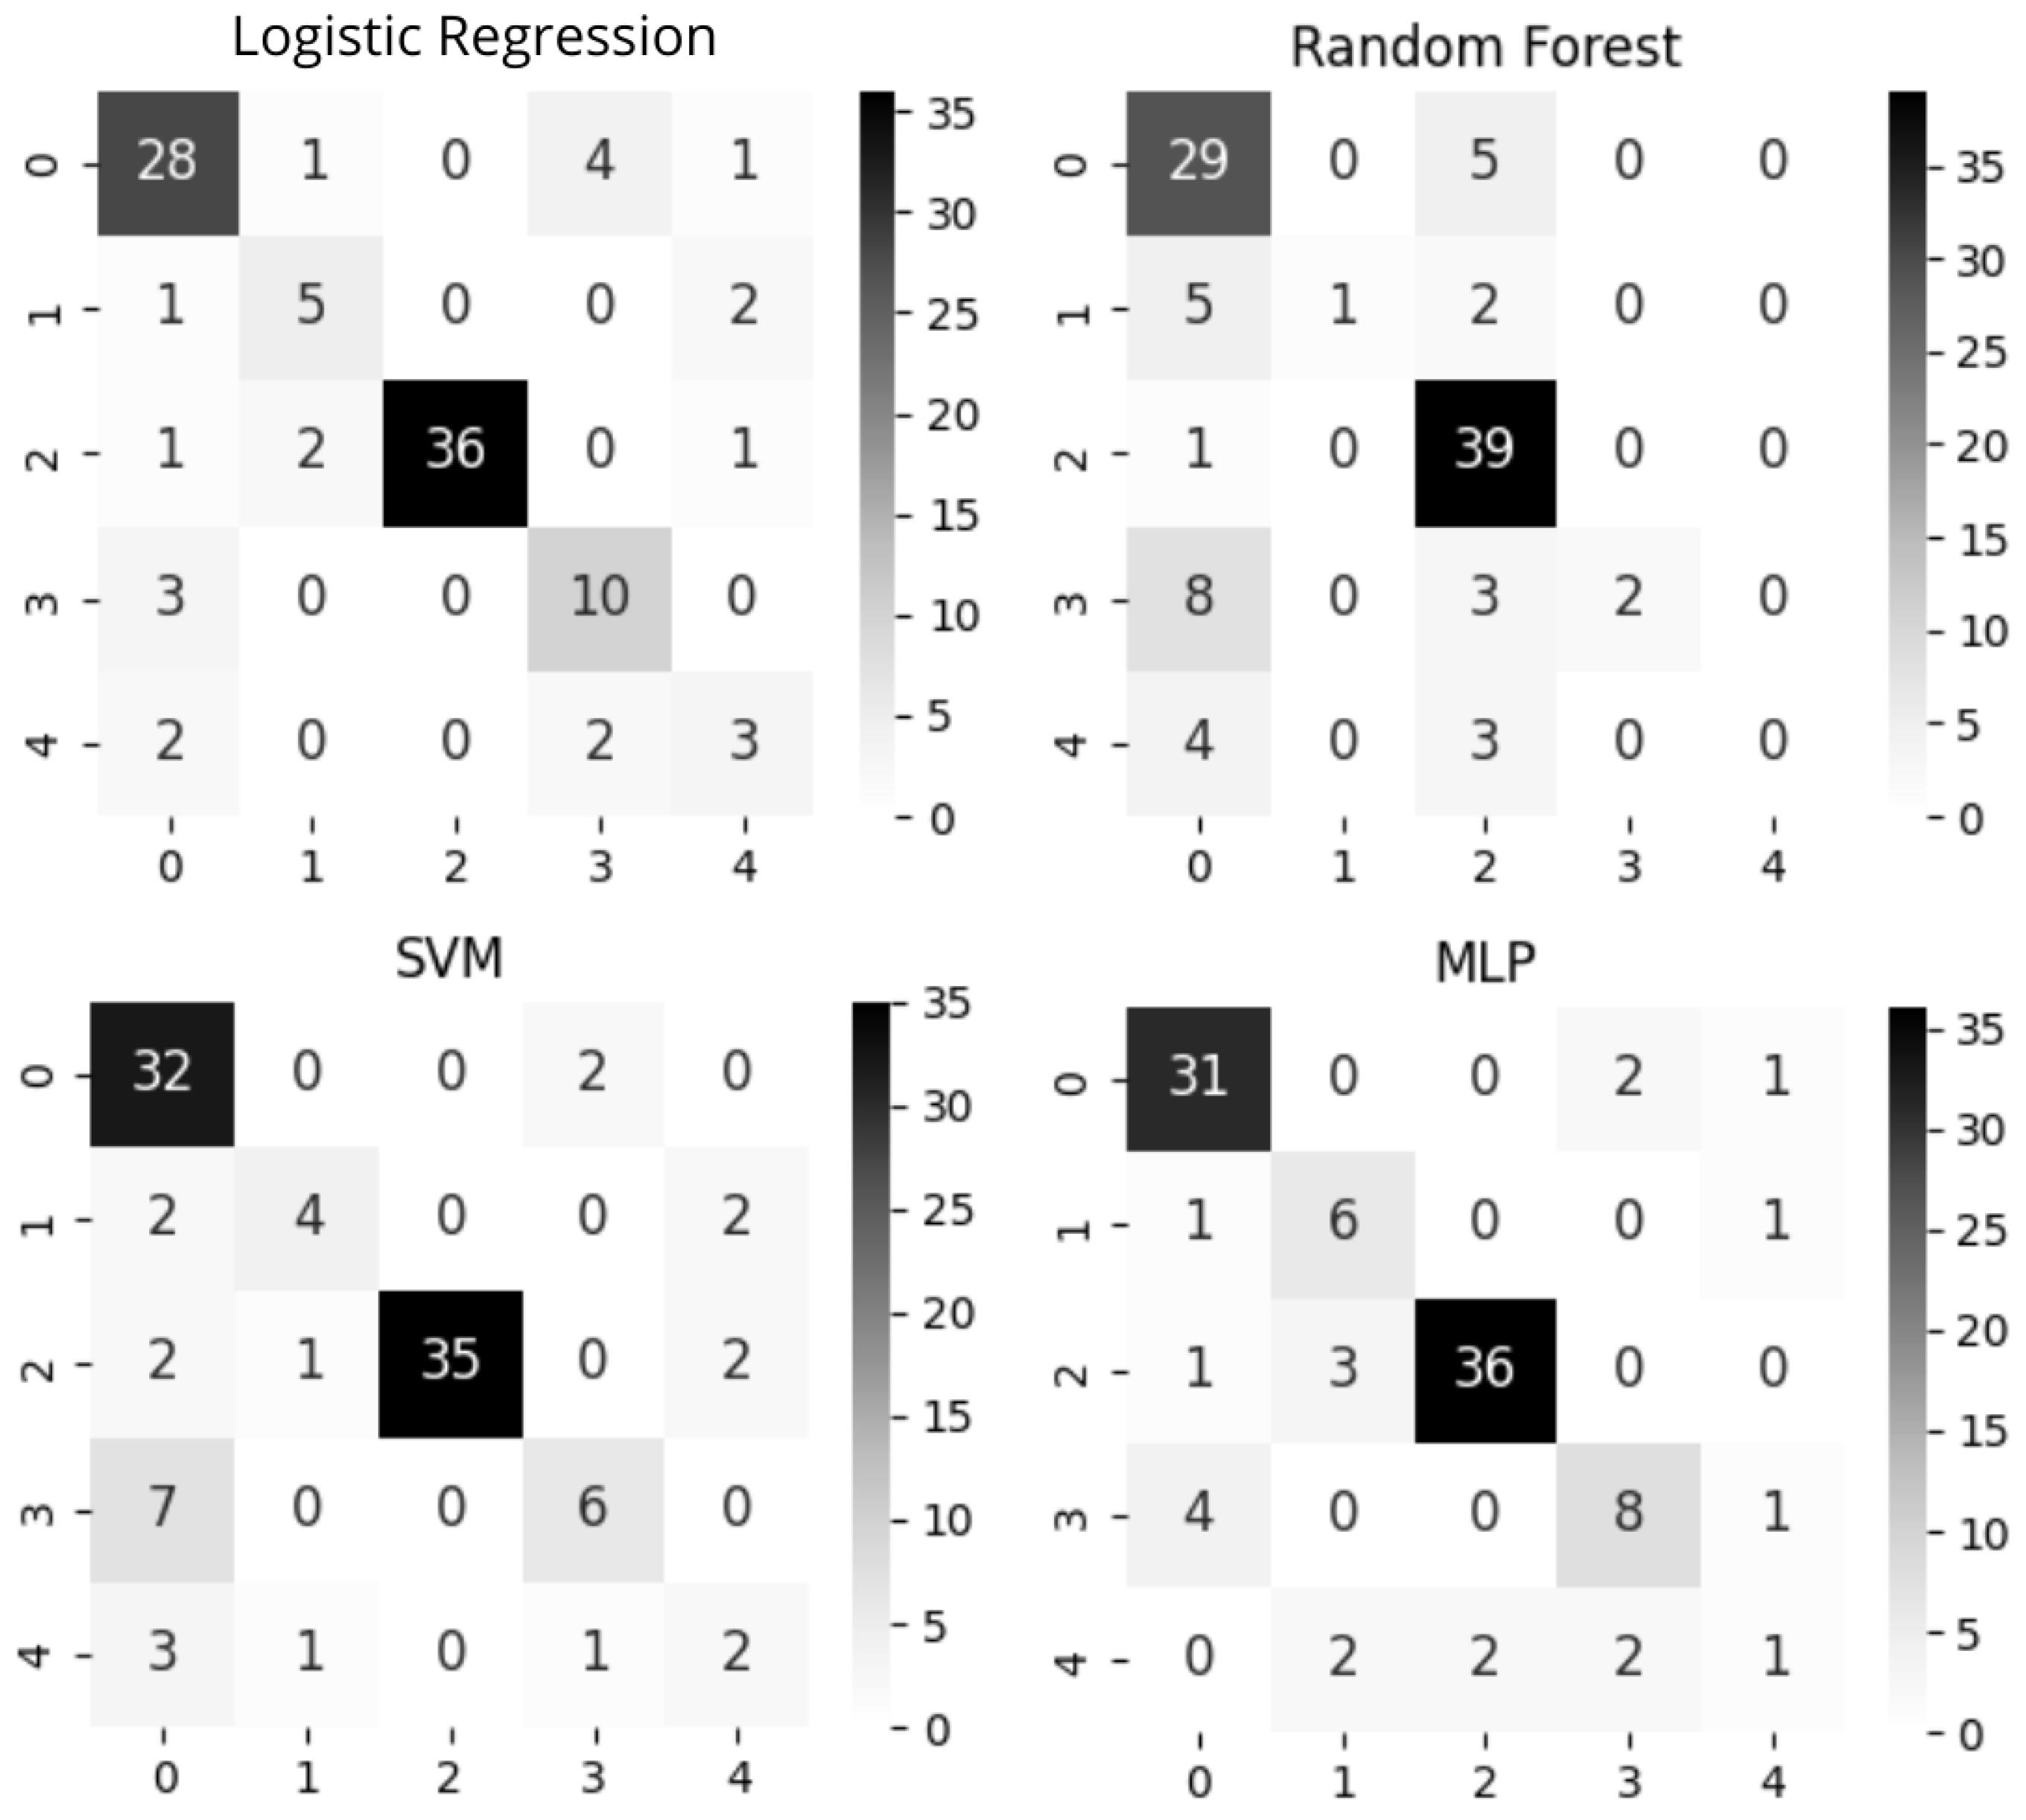
Figure 9.
Feature importance analysis - without Optuna
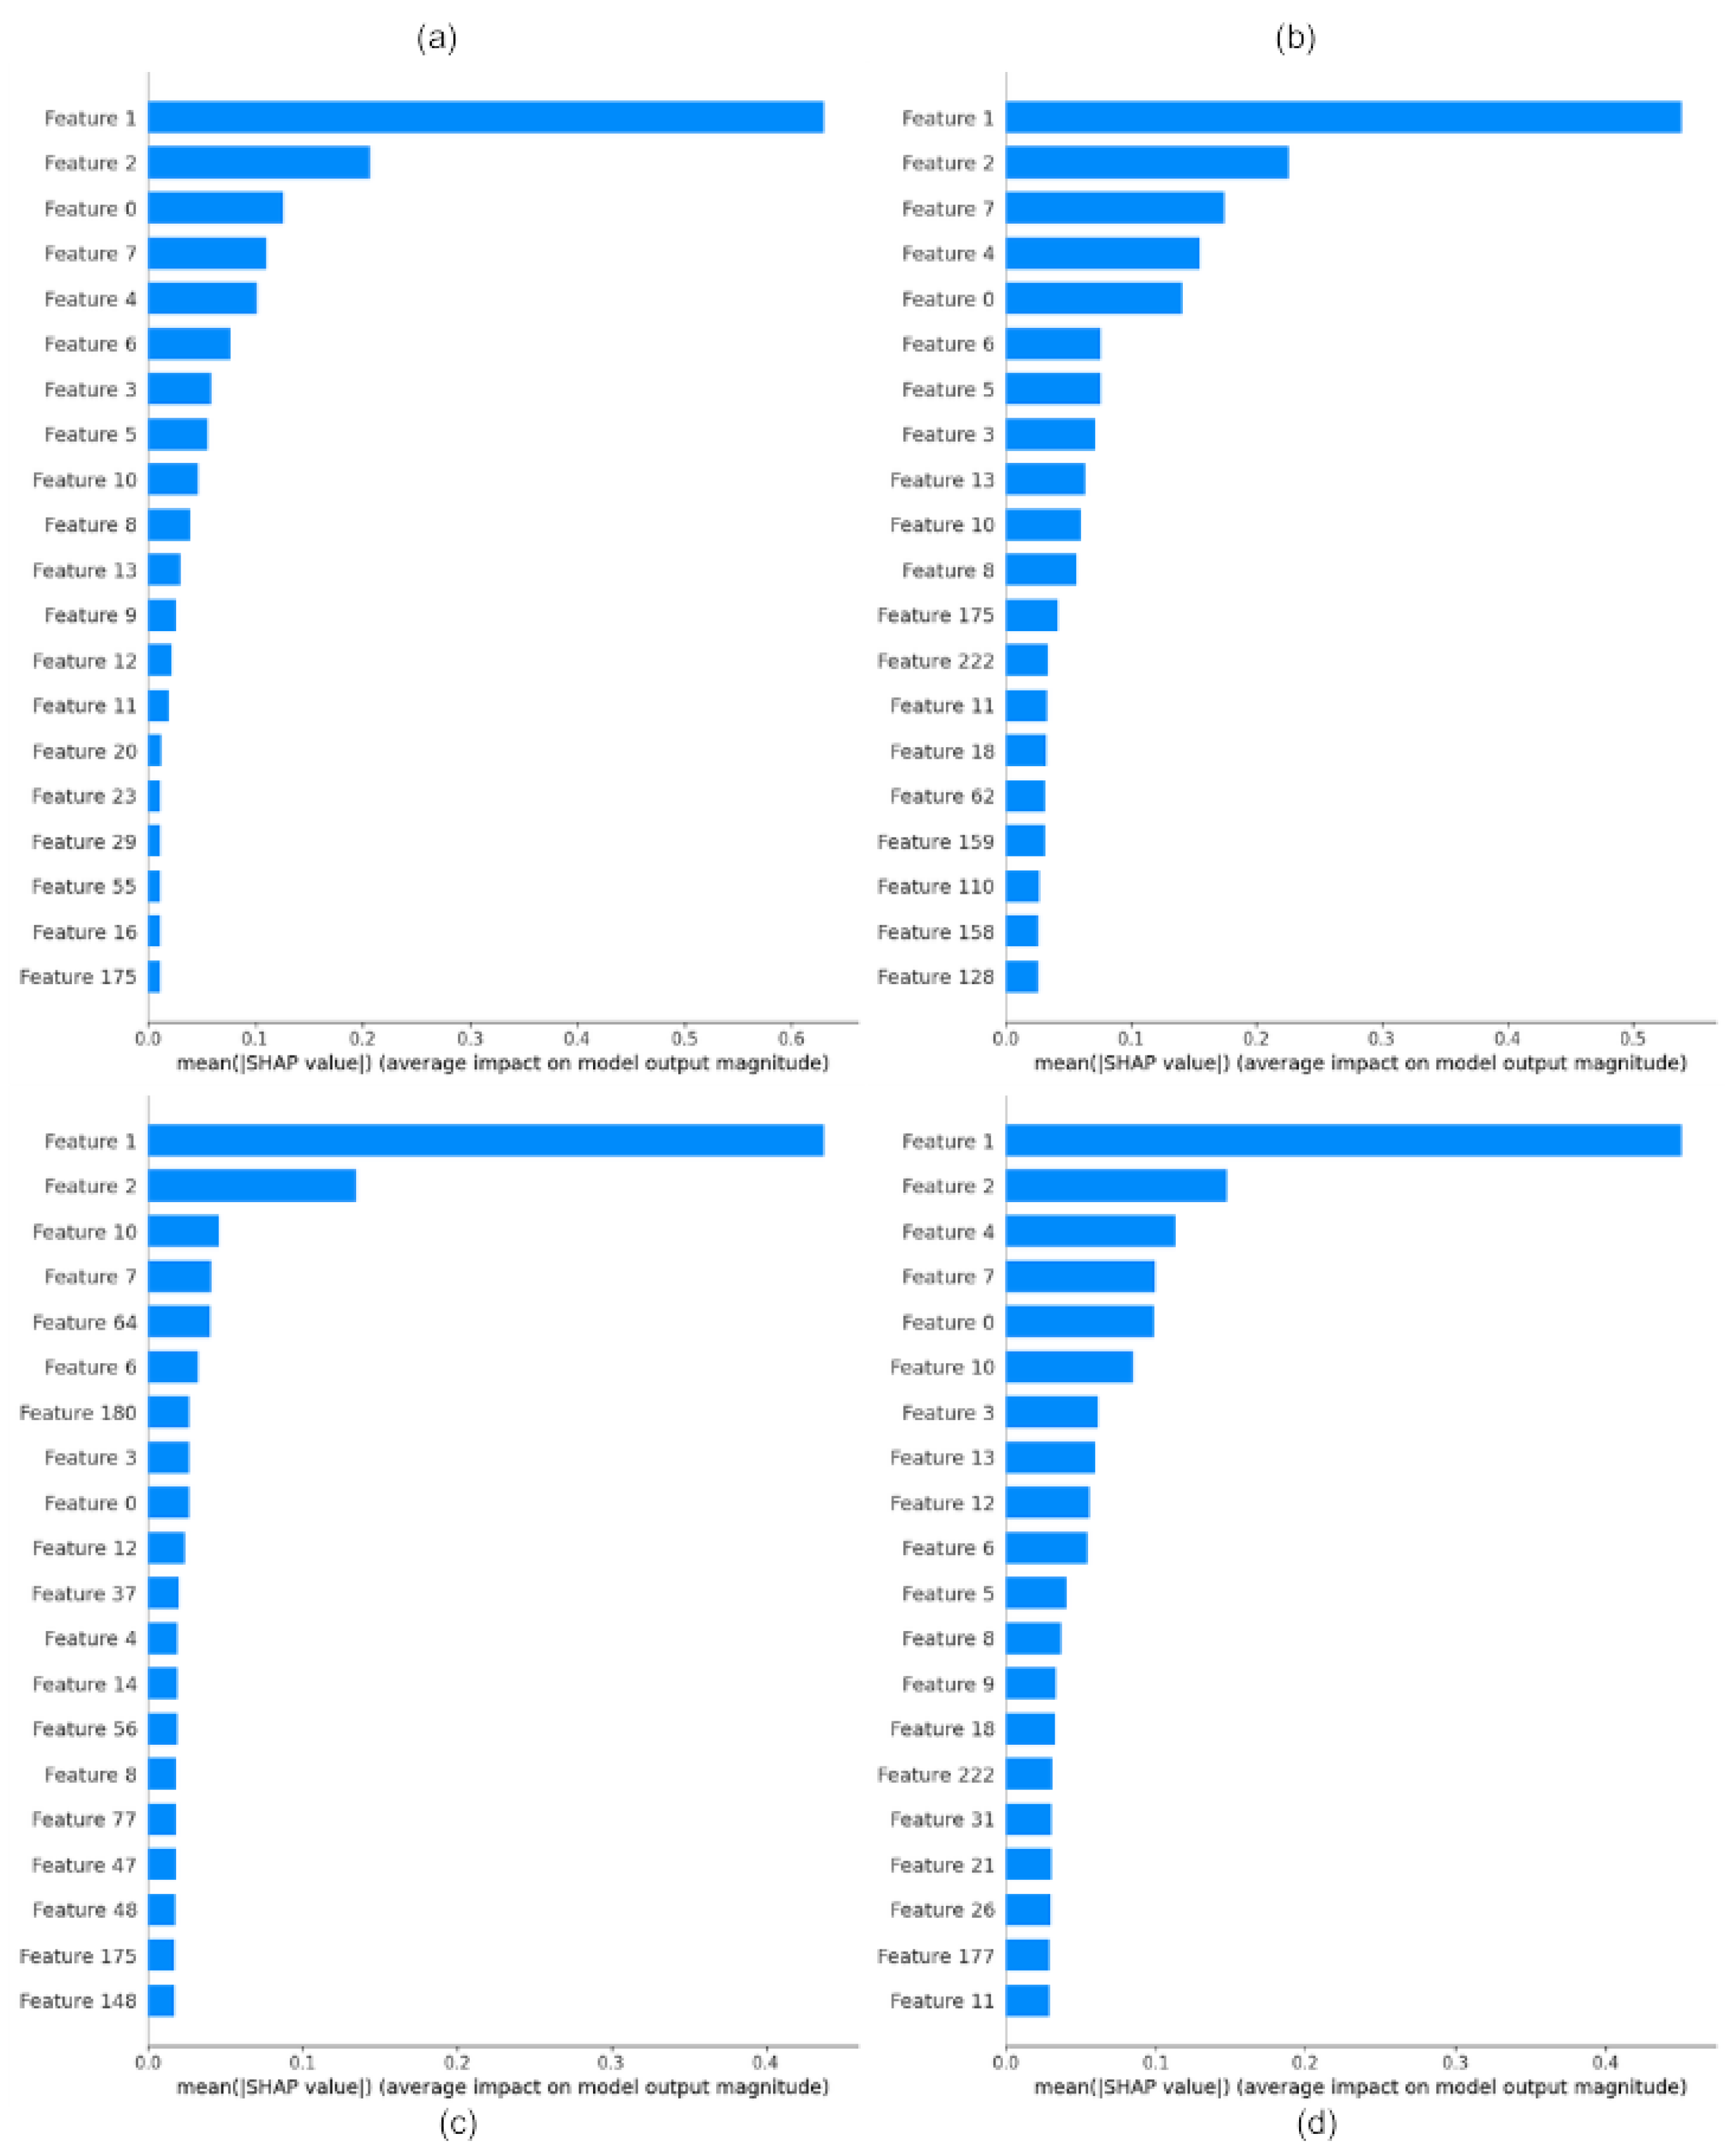
Figure 10.
Feature importance analysis - with Optuna
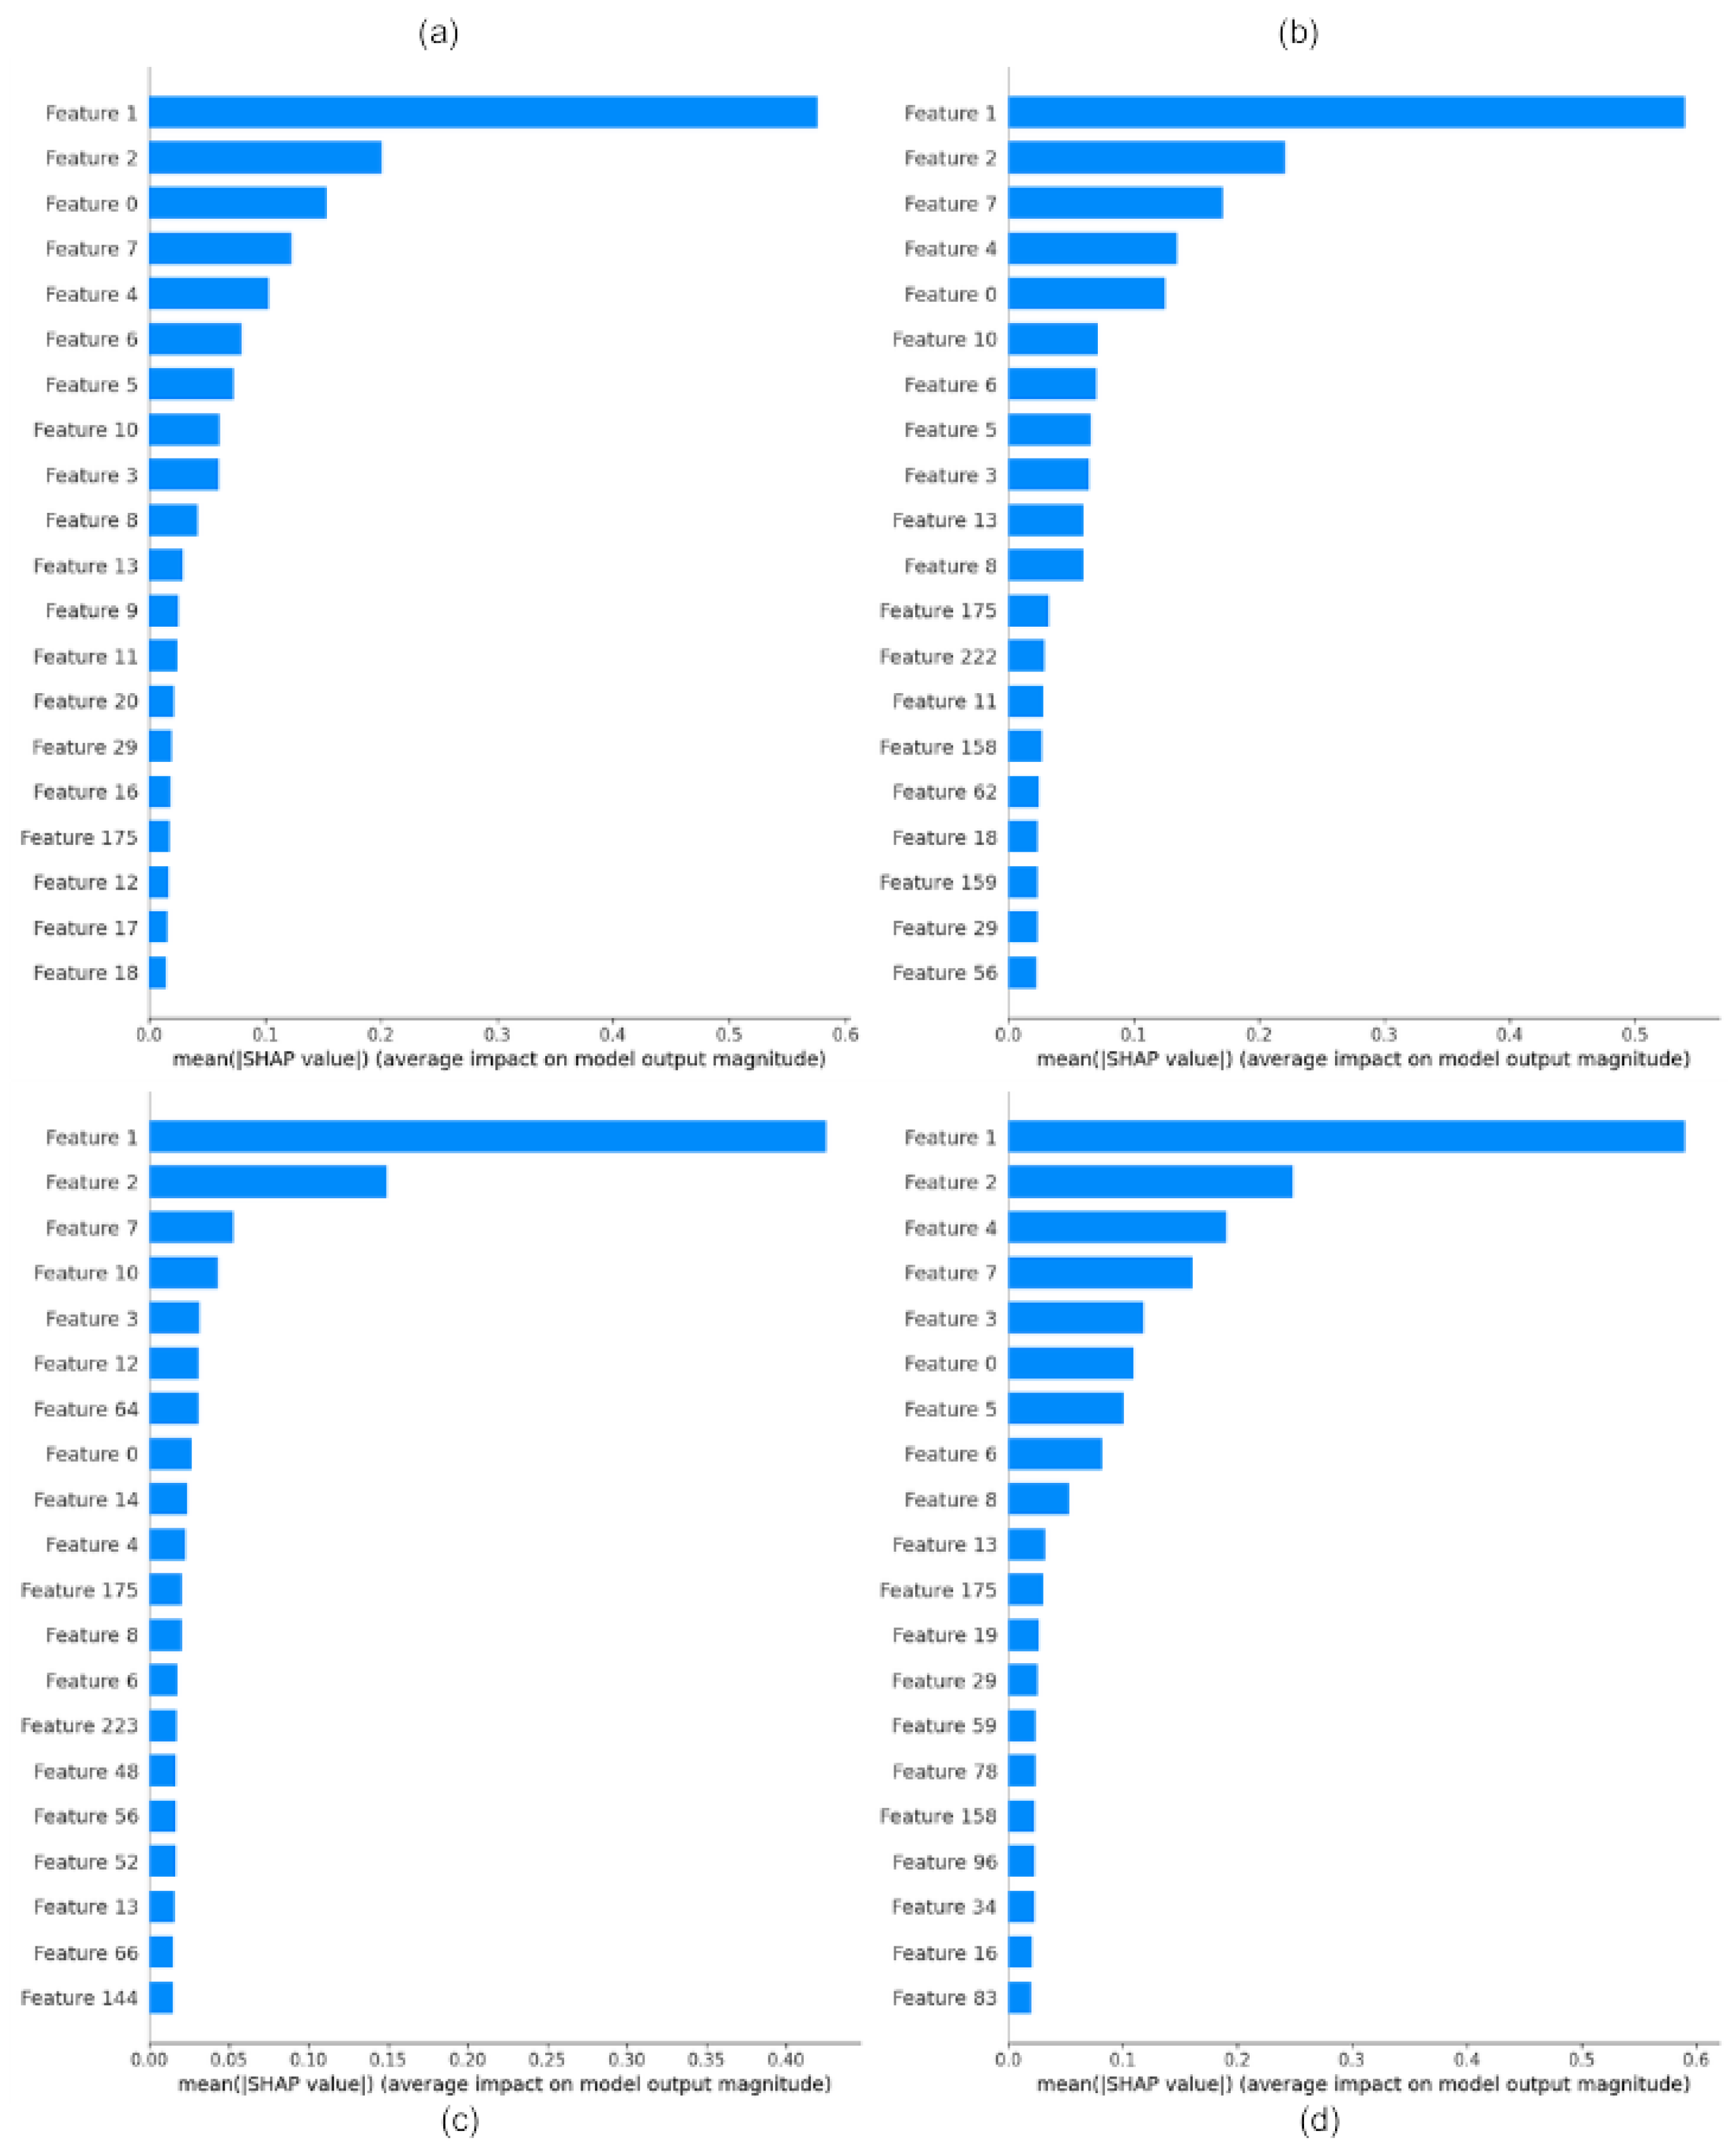

Table 1.
Results of hierarchical clustering using Euclidean distance (on the left) and Pearson correlation (on the right).
Table 1.
Results of hierarchical clustering using Euclidean distance (on the left) and Pearson correlation (on the right).
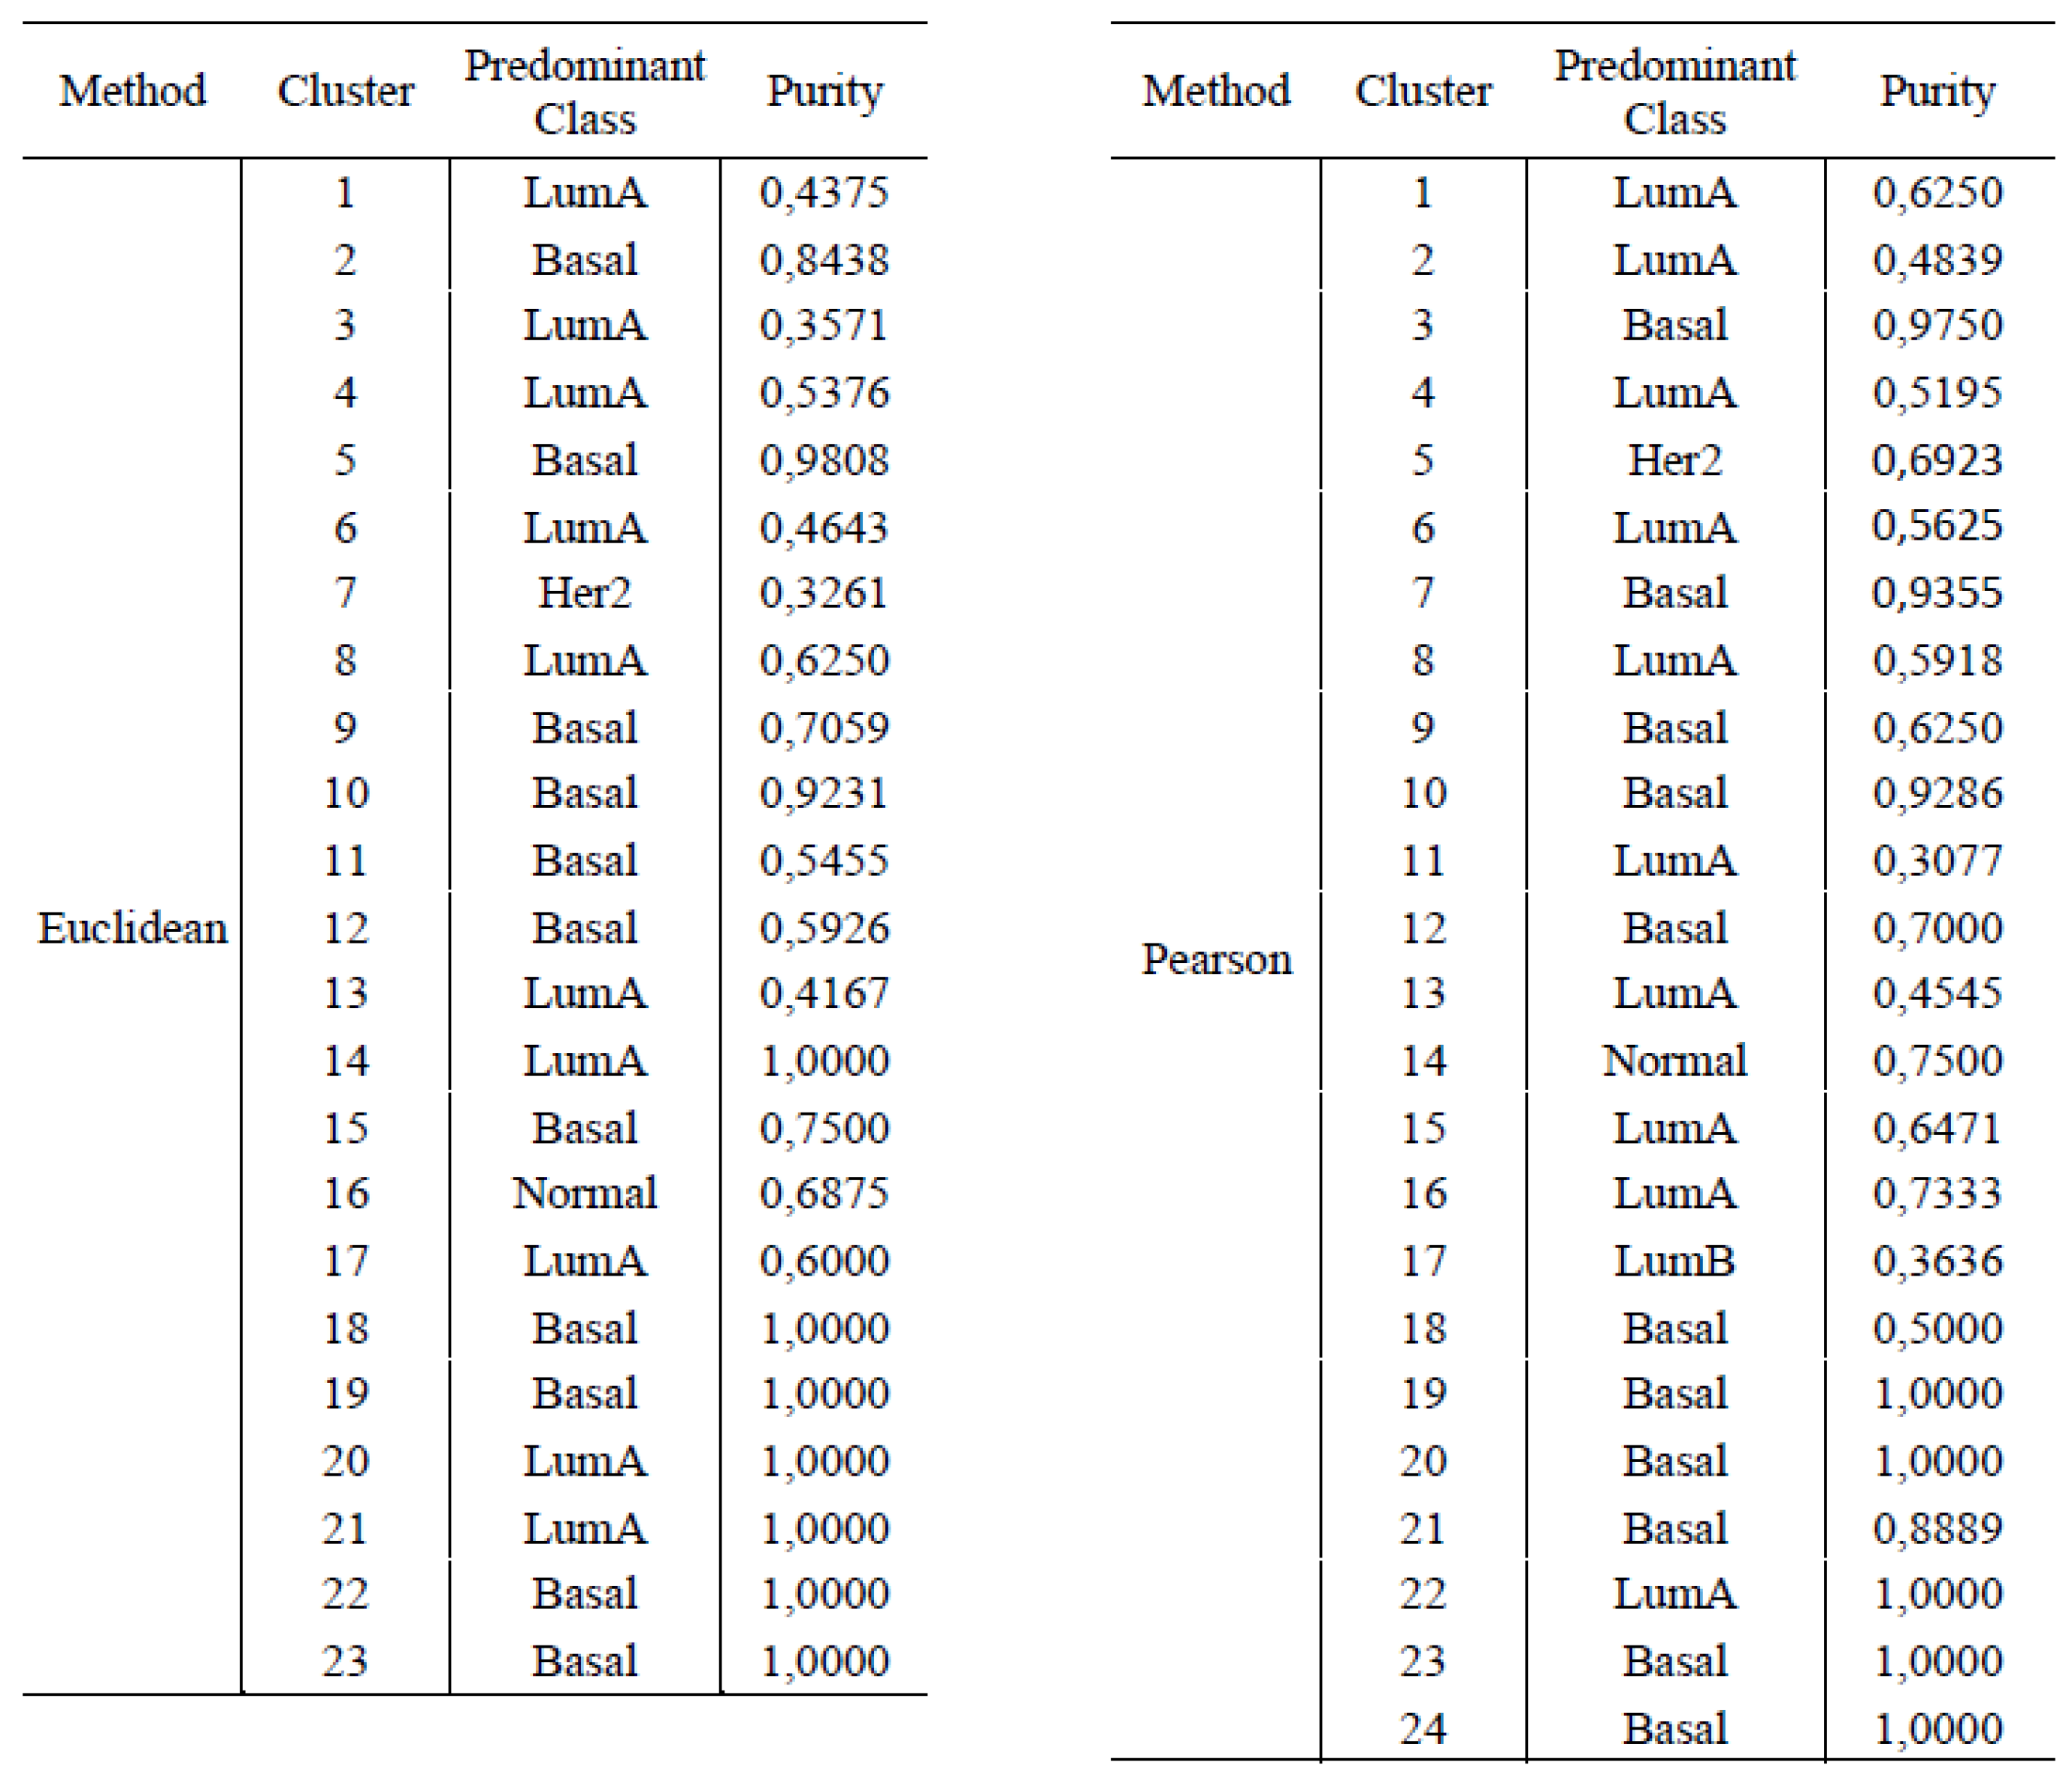
Table 2.
Supervised classification models performance
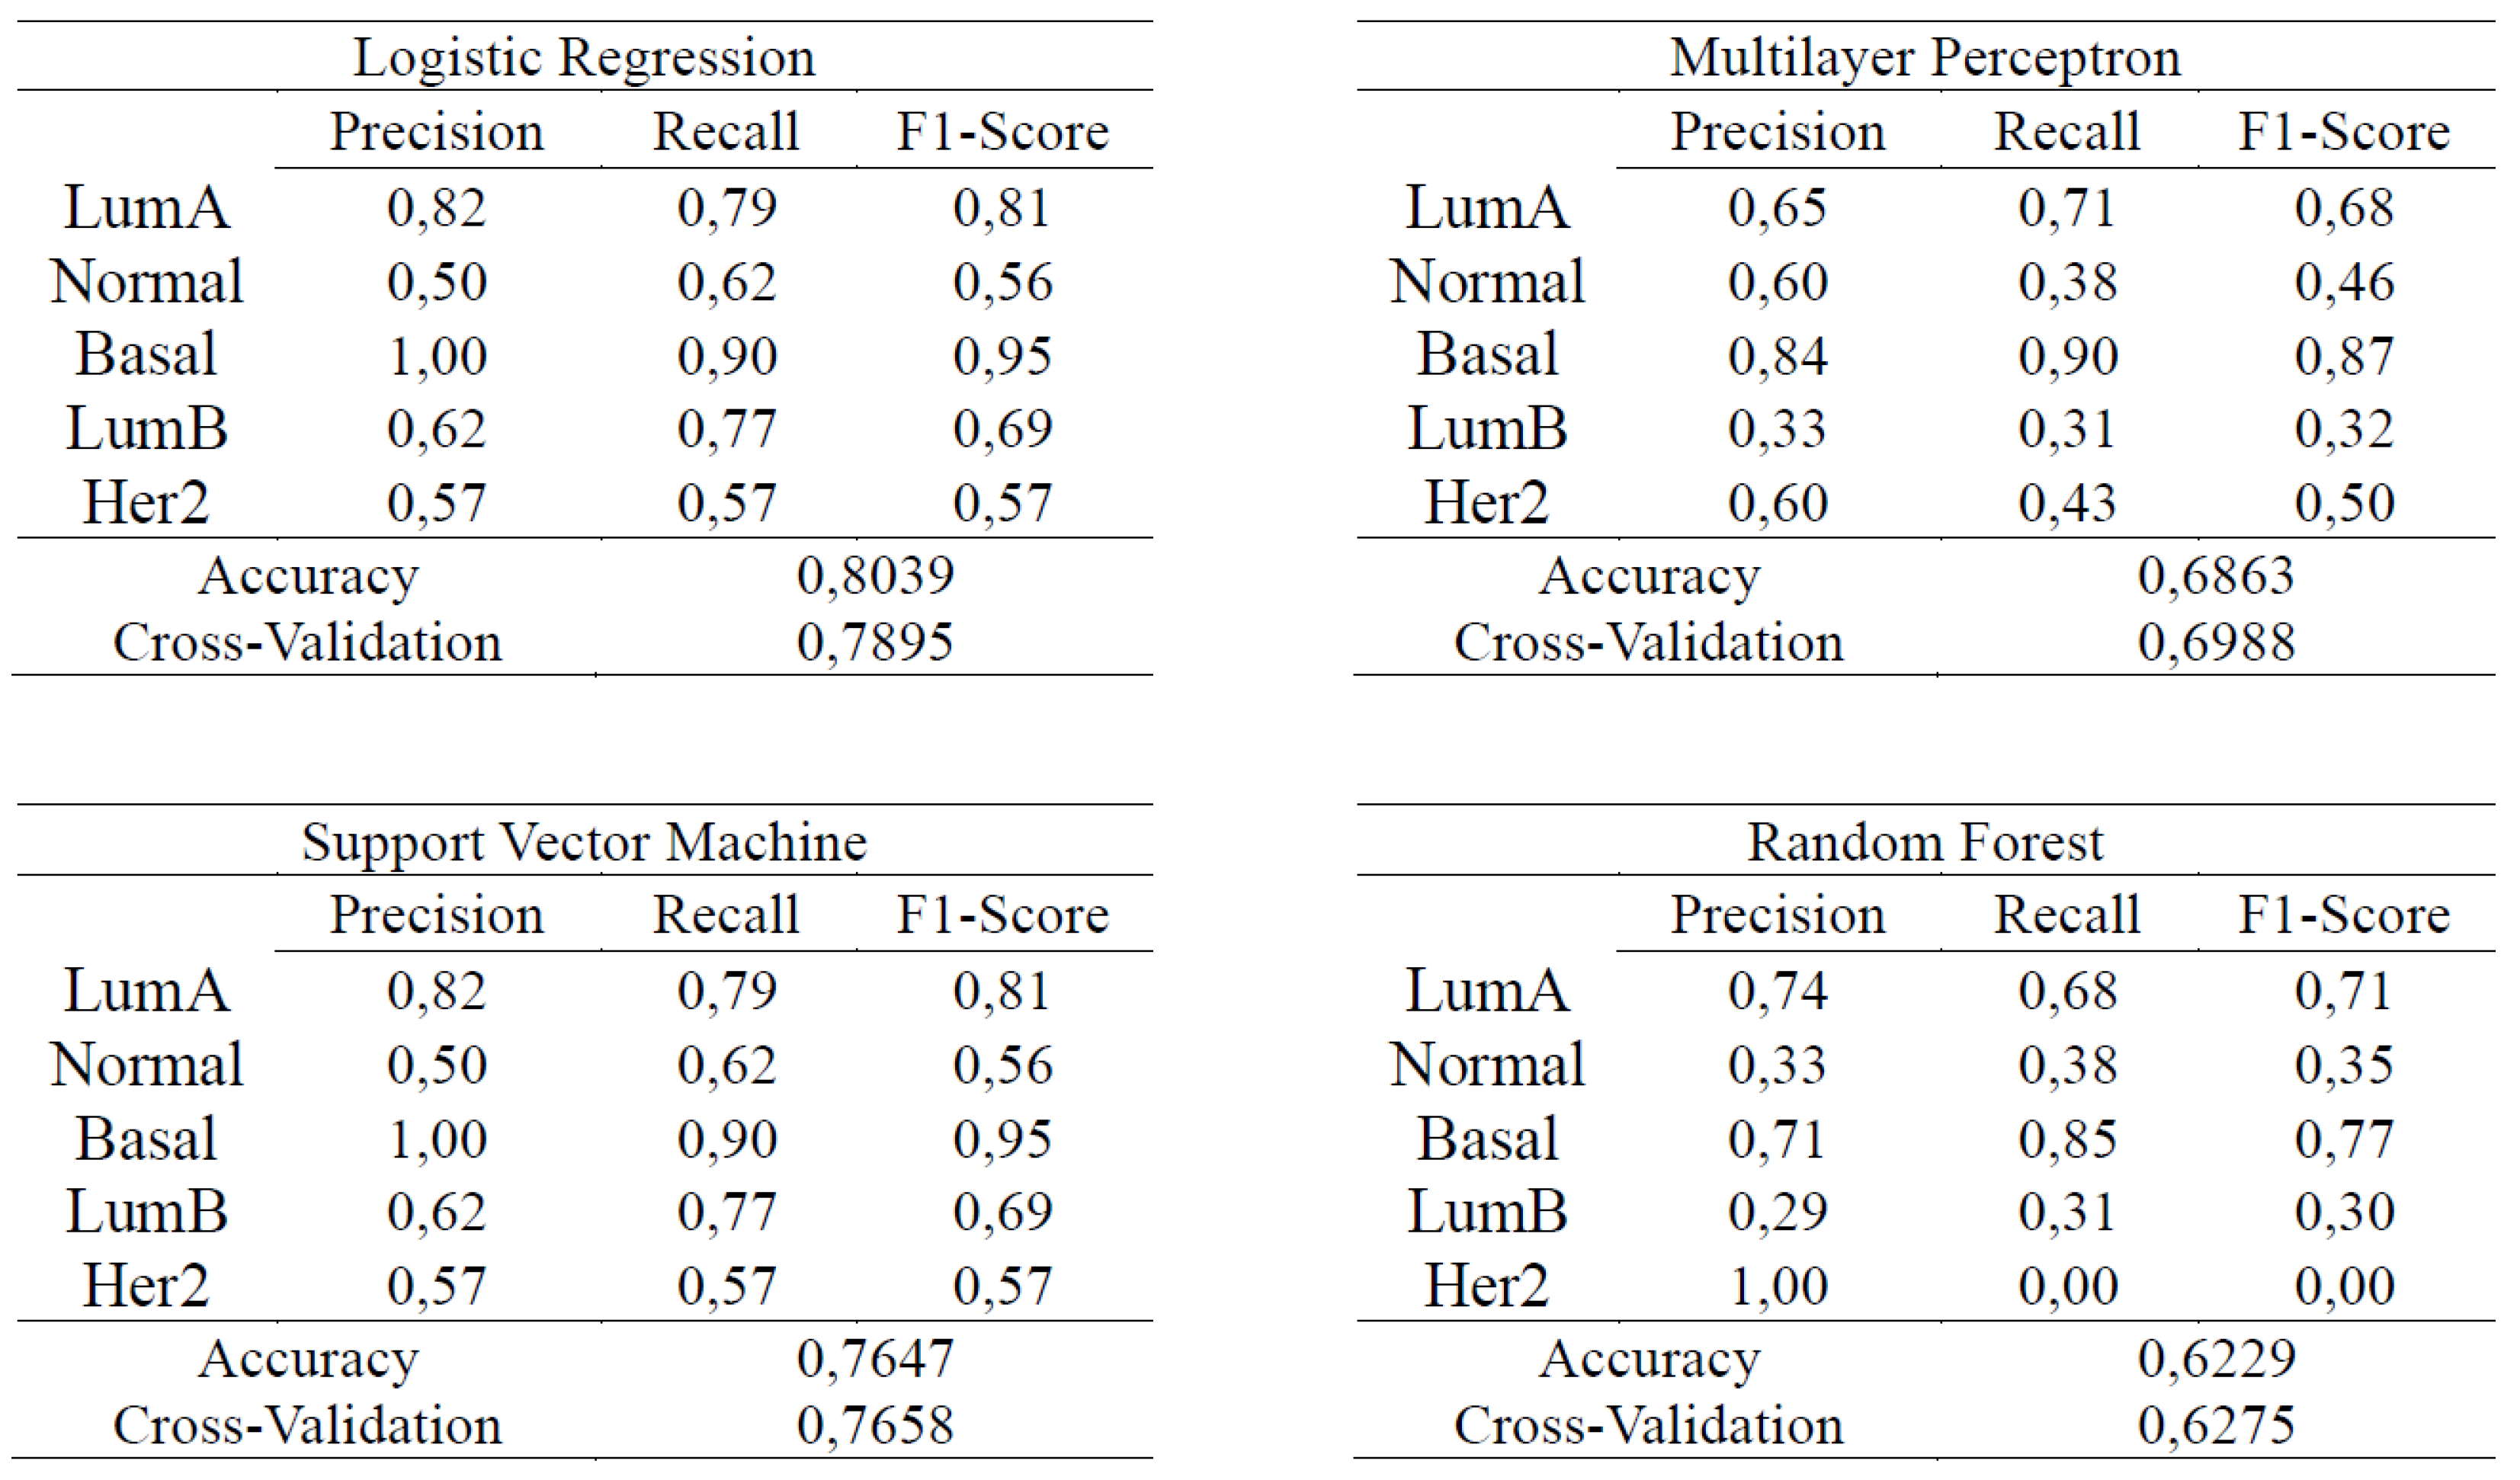
Table 3.
Supervised classification models performance with hyperparameters optimization

Disclaimer/Publisher’s Note: The statements, opinions and data contained in all publications are solely those of the individual author(s) and contributor(s) and not of MDPI and/or the editor(s). MDPI and/or the editor(s) disclaim responsibility for any injury to people or property resulting from any ideas, methods, instructions or products referred to in the content. |
© 2025 by the authors. Licensee MDPI, Basel, Switzerland. This article is an open access article distributed under the terms and conditions of the Creative Commons Attribution (CC BY) license (http://creativecommons.org/licenses/by/4.0/).
Copyright: This open access article is published under a Creative Commons CC BY 4.0 license, which permit the free download, distribution, and reuse, provided that the author and preprint are cited in any reuse.


