
Submitted:
28 April 2025
Posted:
29 April 2025
You are already at the latest version
Abstract
The processing of dimension stones for the construction sector involves transforming rock blocks into slabs via sawing and polishing. This process generates a fine-grained waste composed largely of rock powder derived from the processed rock. Several studies indicate that the rock powder produced as a processing waste can release Ca, Mg, and K. However, alongside the release of macronutrients, there is the possibility of releasing undesirable constituents, such as Na, which is also a component of the min-erals forming silicate rocks. This study aimed to analyze the risk of salinization that these materials may cause to soil if applied without a thorough evaluation of their composition. Samples were analyzed in terms of physical, chemical, and mineralogical parameters; exchangeable inorganic constituents; percentage of exchangeable sodium; and sodium adsorption ratio. The data indicate that residues stored in landfills in a random and unsorted manner do not fully meet the criteria established by Brazilian regulations for soil remineralizers. However, their characteristics suggest good poten-tial for use in the agricultural sector, although this would require blending with other agricultural inputs and/or segregating residues from certain types of rocks to comply with current regulations.
Keywords:
soil remineralizer
; rock powder
; abrasive slurry
; use of waste
; mining waste
1. Introduction
The use of rock powder as a soil remineralizer may serve as an alternative to conventional fertilization methods and the maintenance of degraded soils in tropical regions [1]. Studies have shown that soluble K is released from powders of rocks such as verdite [2], basalt [3], and phonolite [4], which are rich in minerals that are not resistant to weathering, such as glauconite, plagioclase, and olivine. However, these lithotypes are not the most commonly found in Brazil. On the other hand, granitic and gneissic rocks are very common in various regions of Brazil and widely used as dimension stones for the domestic market and export for use in the construction sector. Brazil has a prominent position in the international ornamental rock market, with the State of Espírito Santo responsible for around 82% of Brazilian rocks [5]. Therefore, the need for sustainable production in this region is highlighted.
The processing of dimension stones consists of transforming rock blocks into slabs via sawing and polishing. This process generates a fine-grained residue that comprises the fines from dimension stone processing (FDSP), as defined by the Normative Instruction No. 12-N/2023 and 13-N/2023 of the Instituto Estadual de Meio Ambiente do Espírito Santo (IEMA – State Institute of the Environment of Espírito Santo) [6,7], which amended IN 11/2016 of the same agency [8]. FDSP is composed largely of rock powder derived from the processed rock itself, along with the inputs used.
Silicate rocks such as granites and gneisses are composed mainly of quartz, feldspars, and micas, which although rich in elements important for the soil, such as K, show low solubility and are resistant to weathering. However, studies show that the rock powder generated as a residue from rock processing can release Ca, Mg, and K [9,10]. The physical properties of soil can also be modified by the application of rock flour, as demonstrated using marble and granite powder for stabilizing clayey soils [11].
In Brazil, for a material to be considered a soil remineralizer, it is necessary to demonstrate that the product influences the geochemical characteristics and productivity of plants, in accordance with Law No. 12,890/2013 [12] which amends Law No. 6,894/1980 [13] and includes remineralizers as a category of input intended for agriculture. Soil remineralizers are mineral-origin materials that have undergone only particle size reduction by mechanical processes and that alter soil fertility indices by adding macro- and micronutrients for plants, thereby improving the physical, chemical, or biological activity of the soil. Normative Instruction No. 05/2016 of the Brazilian Ministry of Agriculture, Livestock, and Supply (MAPA) [14] establishes the minimum specifications and guarantees for soil remineralizers, such as the sum of bases, K₂O content, pH, free silica content, among others. The rock waste generated from the disposal of FDSP has characteristics that make it a viable candidate to be classified in this category. However, alongside the release of macronutrients such as Ca, Mg, and K, there is the possibility of releasing undesirable constituents, such as Na, which is also a component of the minerals forming silicate rocks.
Excess Na can cause soil salinization and harm to plants [15], particularly where the water table is shallow and evaporation near the surface accumulates salts in the plant root zone [16]. Although parameters related to Na were not included in Normative Instruction 05/2016 of MAPA, we consider it crucial to evaluate the risks involved in using rock powder as a soil remineralizer. Therefore, the objective of this work was to analyze the risk of salinization that these materials may cause if applied without a careful evaluation of their composition. FDSP samples were analyzed for physical, chemical, and mineralogical parameters; solubilizable inorganic constituents; percentage of exchangeable sodium; and sodium adsorption ratio. Sampling was conducted in deposits of wastes where storage is performed randomly, without prior selection or compositional sorting. This reflects the current reality of existing landfills and, if the use of these materials proves viable, the deposits could provide ultrafine rock powder to formulate agricultural inputs, thereby transforming environmental liabilities into sources of raw material.
2. Materials and Methods
2.1. Sample Collection
Samples were collected from three FDSP waste deposits located in the municipality of Cachoeiro de Itapemirim, in the southern region of Espírito Santo State, Southeast Brazil (Figure 1). Deposits 1 and 3 (D1 and D3) are licensed and active landfills, where the waste is disposed of after dehydration in accordance with regulations. Deposit 2 (D2) is a clandestine waste deposit that was deactivated because it was too close to a stream and the water table is shallow at the site; it mainly received waste from polishing and marble processing. For reasons of confidentiality and agreements with the landowners, the exact locations and names of these sites will not be disclosed.
Sampling was performed using boreholes that penetrated the deposits to their base, in contact with the subsoil. A total of 56 samples were collected and stored at approximately 4°C for preservation until analysis.
2.2. Physical, Chemical, and Mineralogical Analysis
In the laboratory, a subsample from each sample was homogenized, quartered, and dried in an oven at 60°C. Then, 100 g on a dry basis were de-aggregated, sieved using a 2.00 mm opening sieve, and placed into 200 mL plastic bottles containing ultrapure water. The bottles were agitated for 6 hours in a non-volatile rotary shaker. Then, the samples were passed through a series of sieves with openings: 60 mesh (0.250 mm), 115 mesh (0.125 mm), 170 mesh (0.090 mm), 200 mesh (0.075 mm), and 270 mesh (0.053 mm). The fractions were dried again and weighed to estimate the percentage of each fraction.
To define the chemical composition, subsamples of each sample were homogenized, cut into four parts and dried in an oven at a controlled temperature of 42°C. Approximately 8 g were ground in an agate mortar until the material passed through a 325 mesh (0.044 mm) sieve. Fused pellets were prepared using 1 g of sample, 9 g of lithium tetraborate, and 1.5 g of lithium carbonate for analysis by X-ray fluorescence (XRF). The chemical data are expressed as weight percentages of oxides: SiO₂, Al₂O₃, Fe₂O₃, CaO, MgO, K₂O, Na₂O, TiO₂, SO₃, P₂O₅, MnO, SrO, ZrO₂, CuO, Cr₂O₃, BaO, ZnO, and Br. Loss on ignition was determined by the mass loss during the calcination process.
For the mineralogical study, approximately 2 g of each sample, after grinding and sieving, were analyzed by X-ray diffraction (XRD) using a goniometer equipped with a copper tube, over a 2θ range of 4° to 70°, with a step size of 0.02° and a scanning rate of 4° min-1. Mineral phase identification was performed using X’Pert HighScore Plus software (Malvern Panalytical) with the associated database, and relative quantification was conducted using the Rietveld refinement method.
For pH an electrical conductivity (EC) measurement, 10 cm3 of sample were placed in a 50 mL flask and 25 mL of distilled water were added. The mixture was agitated in a horizontal shaker at 200 rpm for 5 min and then left to rest for 60 min. EC and pH were measured with a multiparameter calibrated with standard solutions.
2.3. Estimation of Exchangeable Sodium Percentage (ESP) and Sodium Adsorption Ratio (SAR)
The ESP is used to assess sodicity in soils impacted by salts [17] and is estimated using Equation 1:
in which the sum of cations in the denominator corresponds to the Cation Exchange Capacity (CEC) and represents the total cations that the soil can retain on its colloidal surface and that are available for plant uptake [18]. Soil sodicity was classified following the criteria showed in Table 1 [17].
For the ESP calculation [19], the levels of Ca and Mg were determined using a KCl extractor and an SrCl₂ solution, with measurements taken by atomic absorption spectrophotometry. The concentrations of Na and K were obtained following extraction with Mehlich-1 solution and measurement by flame emission spectrophotometry. The H+Al parameter was obtained by extraction using calcium acetate and titration with NaOH.
The SAR considers the levels of Ca, Mg, and Na to assess the relative activity of sodium ions in cation exchange reactions with the soil. When combined with electrical conductivity (EC), the SAR allows to classify the risk that a solution poses to the soil’s infiltration capacity, considering the dispersive effects of sodium [15].
SAR was determined using Equation 2, in which Ca, Mg, and Na correspond to the concentrations of these elements in the solution, in mEq L−1. The SAR levels, correlated with the EC values, allow us to infer the influence of a solution on the salinity and infiltration capacity of the soil, as shown in Table 2 [15].
3. Results
3.1. Granulometry and Composition of FDSP Residues
The FDSP residues collected from the studied deposits exhibit a silt-clay granulometry, with approximately 80% of the particles smaller than 0.053 mm (Figure 2) (raw data are presented as supplemental material in Table S1).
The predominant chemical composition includes SiO₂, Al₂O₃, Fe₂O₃, CaO, MgO, Na₂O, and K₂O (Figure 3) (raw data in Table S2), that are common components of the silicate rocks (granites and gneisses). The addition of inputs, such as lime, contributes to a significant increase in calcium concentration, and the use of slag during sawing directly impacts the iron concentration. Deposit D2 stands out for having a higher MgO concentration compared to D1 and D3, as well as a greater loss on ignition (LOI), due to the deposition of marble powder - a rock essentially composed of carbonates. The contents of Ca, Mg, and LOI demonstrate some compositional heterogeneity among the deposits, which may occur randomly depending on the type of rock being processed at the time of disposal, a factor controlled by market considerations.
The following mineral phases were identified in the samples (Figure 4): biotite [K(Mg,Fe)₃(AlSi₃O₁₀)(OH)₂], vermiculite [(Mg,Fe)₃(Si,Al)₄O₁₀(OH)₂·4H₂O], microcline (KAlSi₃O₈), quartz (SiO₂), albite (NaAlSi₃O₈), muscovite [KAl₂(Si₃Al)O₁₀(OH,F)₂], kaolinite [Al₂Si₂O₅(OH)₄], and dolomite (CaMgCO₃).
The quantitative mineralogical composition (Table 3) (raw data in Table S3) is quite heterogeneous among the studied deposits and reflects the composition of the processed rocks. Although quartz is the predominant mineral in all deposits, followed by the feldspars (albite and microcline) and micas (biotite and muscovite), the latter two groups vary in abundance. Dolomite and calcite, which are the main components of marbles, occur in small percentages - except in D2, where dolomite is the second most abundant mineral. Magnetite and vermiculite occur in lesser amounts, with few exceptions. Muscovite and microcline contain potassium in their mineral structures, whereas albite contains sodium. Kaolinite is a clay mineral typically formed by the alteration of feldspars, such as microcline; however, kaolinite is not expected in unweathered igneous and metamorphic rocks, which are most commonly used in Espírito Santo as ornamental stones. Thus, the presence of kaolinite indicates that chemical weathering is acting on the deposits, altering the stored material’s mineralogical composition.
3.2. Comparison with the Requirements of Normative Instruction 05/2016 by the Brazilian Ministry of Agriculture, Livestock, and Supply (MAPA)
According to Normative Instruction No. 05/2016 of the MAPA [14], remineralizers must show a sum of bases (the sum of CaO, MgO, and K₂O contents) of at least 9% and a K₂O content of at least 1%. Most analyzed samples exhibited values within the required range (Figure 5) (raw data in Table S4), with few exceptions in the sample set. Regarding free silica content, a maximum limit of 25% is permitted for remineralizers; however, in this case, most samples did not meet the requirement, with rare exceptions. Moreover, pH is another parameter considered in IN No. 05/2016 of MAPA, which, although not having a predetermined value, must be reported. In this regard, the FDSP residue exhibits alkaline characteristics, which may be desirable for liming soils.
3.3. Restrictions Regarding to Influence in Salinity, Infiltration of Water, and ESP
Figure 6 shows the values of the Sodium Adsorption Ratio (SAR), electrical conductivity (EC), and Exchangeable Sodium Percentage (ESP) measured and calculated in the FDSP residue samples stored in the three studied deposits (D1, D2, and D3) (raw data in Table S5 and Table S6).
The analyzed samples generally do not present restrictions regarding salinity; in a few cases, salinity is moderate (Table 4) (raw data in Table S5 and Table S6). On the other hand, the restriction regarding the infiltration capacity is mainly moderate to severe, with a few cases of no restriction, implying a risk of altering the soil structure and porosity with the application of in natura FDSP. All samples exhibited ESP values exceeding the 30% limit, thereby classifying them as excessively sodic. The elevated ESP values indicate a risk of soil salinization with the continuous application of FDSP without careful dosage, particularly over the medium to long term.
4. Discussion
This study focused on the risks of soil salinization arising from the use of FDSP residues in rock meal - that is, in the mineral enrichment of soils. SAR, EC, and ESP are parameters considered in the classification of salt-affected soils [20], which allow inferences regarding salinity restrictions, the impact on the soil’s infiltration capacity, and the sodicity of the soil saturation extract. The material analyzed here is in its natural state (in natura FDSP), whose chemical and mineralogical composition underscores the importance of evaluating the presence of Na if these residues are to be applied to soils. The data suggest that, along with the release of elements essential for mineral enrichment of soils - such as Ca, Mg, and K - the powder derived from siliceous igneous and metamorphic rocks may also release Na in sufficient quantities to cause considerable damage. The risk of soil salinization, combined with the severe restriction on infiltration, necessitates careful management and preemptive correction strategies for its composition. This finding also highlights the importance of considering Na as an applicability criterion in the regulations for remineralizers, as current regulations do not address this type of risk.
FDSP residues are classified as non-inert with respect to several constituents, including Na [21]. Excess Na in the soil can displace essential cations (such as Ca and Mg) from soil particles, impairing the soil’s capacity to retain water and nutrients [22]. In a study with phonolite-derived rock powder, the release of a considerable amount of Na was also reported, which disrupted the soil-improving effect and indicated that caution is required when using siliceous rock powder with sodium content [23].
The Na levels present in the FDSP residue may be released by siliceous minerals common in various rock types, such as plagioclase and micas, but they may also derive from inputs used in the rock processing, which in this case are highly soluble. The liquid phase of the FDSP in form of sludge has several soluble components in high concentrations, which differentiate it from the solid phase composed essentially of rock powder [24]. If wastes are disposed of without drying, these solutions can be more easily released into the environment. As shown by the PCA analysis (Figure 7) involving several parameters presented earlier, samples from D1 and D3 are grouped together due their siliceous composition - particularly the presence of the mineral albite (sodium plagioclase) - and the percentage of Na₂O determined by XRF (total composition). This composition provides higher SAR values for some samples. In contrast, D2 exhibits a distinct grouping of samples, which is explained by the higher concentration of carbonate minerals such as dolomite and the elevated levels of Ca, Mg, and LOI. D2 also stands out for its higher EC and ESP. It is known that in D2 there was prioritized storage of marble processing residues - especially residues from slab polishing, and that it is close to a water body and in contact with groundwater. This situation favors dissolution of waste constituents.
The data presented in this study demonstrate that the FDSP residues stored in the investigated deposits do not fully meet the criteria established by Normative Instruction No. 05 of Brazilian Ministry of Agriculture, Livestock, and Supply [14] for classification as soil remineralizers. Most rocks processed in Espírito Santo, the major Brazilian producer and exporter of dimension stones, are igneous and metamorphic with a siliceous composition rich in quartz. The percentage of quartz found in most samples, with few exceptions, exceeds 25%, maximum value permitted by the regulation for a material to be considered a remineralizer. However, if specific rock types are selected, it is possible to find free silica levels below the maximum required value. The composition of FDSP residues reflects the constitution of the processed rocks, except in the case of conventional loom sawdust, in which the use of certain inputs increases the levels of Fe, Ca, Mg, Ti, P, Mn, and LOI [25]. Notably, the residue generated from processing rocks in diamond-wire (or multi-wire) saws is composed almost entirely of the rock powder and water, provided that there is no mixing between the sawing and polishing effluents, as the latter may introduce potentially toxic elements and substances.
The fine granulometry of FDSP favors the release of ions into the aqueous medium. The silt-clay granulometry of the particles - resulting from the comminution of the rock during sawing - facilitates the release of chemical elements previously fixed in the crystalline structure of the minerals, which in turn may accelerate the availability of nutrients in the soil [26]. The alkaline pH of FDSP residues is another positive characteristic, indicating potential use as an ameliorant for acidic soils. It is important to note that the pH values do not reach levels that could classify the material as corrosive, in accordance with NBR 10.004/2004 [27]. Corrosiveness is a characteristic that can render a residue hazardous, which is why this parameter has been extensively studied in FDSP. Several authors have measured pH values ranging from 9.0 to 11.0 [28,29,30], although values above 12.0 have also been reported [21,31]. However, it is noteworthy that the pasty state of FDSP - rich in processing fluids - differs from the residue stored in deposits after dehydration by filter press [24]. In the deposited material, an outstanding stabilization of the pH over time occurs due to interactions with atmospheric CO₂ [32]. Being below the hazardous threshold, the pH of FDSP residues may be beneficial for acidic soils. Marble sawdust residues have already been tested as an ameliorant for the natural acidity of soils [33,34] in place of the lime (CaO) traditionally used in liming. As already reported [35], comparatively to an acidic medium, an alkaline medium favors the solubilization of K from verdite - a sedimentary rock that can be used as a potash fertilizer.
Therefore, although the FDSP residue deposited randomly in storage facilities and in its original form (in natura) does not fully meet the criteria of a soil remineralizer, its excellent potential for releasing Ca, Mg, and K indicates possibilities for other agricultural and environmental applications, such as an ameliorant for acidic soils [34], as a component of substrates, and as technosoil for the rehabilitation of degraded areas [36]. It is important to highlight that there is compositional heterogeneity in the material stored in the deposits - for example, in D2, where despite the high quartz content, there is also calcite, dolomite, and an alkaline pH, which may be beneficial for acidic and degraded soils. Therefore, the use of FDSP as a soil remineralizer will require mixing and homogenization with other materials and/or segregation prior to storage, followed by analysis to verify compliance with the regulatory guidelines. Regarding salinity, some mixing alternatives should also be investigated, such as the application of gypsum, as already tested in saline-sodic soils, which increases the availability of P and Ca while reducing pH and Na levels [37].
The random deposition of residues in storage facilities, without any selection or segregation, leads to variations in the chemical and mineralogical composition of the stored material, which may hinder the prediction and control of its influence on the soil if rock dusting is intended. By working with residues segregated according to the type of rock processed and the processing method, it will be possible to control the composition of the desired material based on its potential use. It has already been demonstrated that the rate of K and Na release in FDSP residues is related to the mineral associations found in each rock type [26], such as micas and potassic feldspars (e.g., microcline) [38], which are among the most abundant minerals in the lithotypes used by the dimension stone sector, especially in Espírito Santo State.
An important requirement stipulated in Normative Instruction No. 05/2016 of MAPA is the content of potentially toxic elements (As, Cd, Hg, and Pb), which have maximum permitted values listed in ppm in the regulation. However, there is ambiguity regarding these analyses, as the extraction method to be used is not specified and the provided values do not make sense if the analysis is performed on the mass composition of the solid material. This is a key point that requires revision or clarification in the regulation.
It is recommended that future studies focus on FDSP residues segregated by the type of rock sawn and that greenhouse studies be conducted to evaluate crop performance. Leaching studies in soil columns to assess salt mobility and experiments to optimize management practices are also useful. Proper management of FDSP residues plays a fundamental role from both economic and environmental perspectives.
5. Conclusions
FDSP residues stored in deposits randomly and without segregation do not fully meet the criteria established by Normative Instruction (IN) No. 05 of MAPA for classification as soil remineralizers. In some cases, the sum of bases (SB) and the K₂O content were below the levels required by the Normative Instruction, and the free silica levels were consistently above the maximum permitted for remineralizers.
The results of the Exchangeable Sodium Percentage (ESP) indicate that these materials exhibit high concentrations of Na, classifying them as “excessively sodic” in some cases. The Na content represents a risk of soil salinization if applied without any prior study, dilution treatment, or dosage evaluation. The SAR values show that the soil’s infiltration capacity may be severely compromised. The risk of soil salinization due to high Na concentration, coupled with the severe restriction on infiltration, requires careful management and corrective strategies if this material is to be used in rock meal. This finding also underscores the importance of considering Na as a relevant parameter in the regulations for remineralizers, as current regulations do not address this type of risk.
Nonetheless, the characteristics of FDSP residues indicate promising potential for agricultural use; however, this would require mixing with other agricultural inputs and/or segregating residues derived from certain rock types to meet current regulatory requirements.
Author Contributions
Conceptualization, Mirna A. Neves; methodology, Mirna A. Neves, Eduardo B. Duarte.; validation, Mirna A. Neves; formal analysis, Gabriella T. Mateus, Diego L. Burak; investigation, Gabriella T. Mateus, Diego L. Burak; data curation, Mirna A. Neves, Gabriella T. Mateus, Eduardo B. Duarte, Diego L. Burak; writing—original draft preparation, Mirna A. Neves; writing—review and editing, Mirna A. Neves; visualization, Mirna A. Neves; supervision, Mirna A. Neves; project administration, Mirna A. Neves; funding acquisition, Mirna A. Neves. All authors have read and agreed to the published version of the manuscript.
Funding
This research was funded by Fundação de Amparo à Pesquisa e Inovação do Espírito Santo (FAPES), grant number 84322853.
Data Availability Statement
The research data can be found in supplementary material.
Conflicts of Interest
The authors declare no conflicts of interest. The funders had no role in the design of the study; in the collection, analyses, or interpretation of data; in the writing of the manuscript; or in the decision to publish the results.
References
- Theodoro, S.; Medeiros, F.P.; Ianniruberto, M.; Jacobson, T.K.B. Soil remineralization and recovery of degraded areas: An experience in the tropical region. J. South Am. Earth Sci. 2021, 107, 103014. [Google Scholar] [CrossRef]
- Santos, W.O.; Mattiello, E.M.; Costa, L.M.; Abrahão, W.A.P.; Novais, R.F.; Cantarutti, R.B. Thermal and chemical solubilization of verdete for use as potassium fertilizer. Int. J. Miner. Process. 2015, 140, 72–78. [Google Scholar] [CrossRef]
- Hendronursito, Y.; Barus, J.; Amin, M.; Muttaqii, M.A.; Rajagukguk, T.O.; Isnugroho, K.; Birawidha, D.C. The local mineral potential from East Lampung - Indonesia: the use of basalt rock as a stone meal for cassava plant. JDMLM 2019, 7, 1977–1985. [Google Scholar] [CrossRef]
- Wilpert, K.V.; Lukes, M. Ecochemical effects of phonolite rock powder, dolomite, and potassium sulfate in a spruce stand on an acidified glacial loam. Nutr. Cycling Agroecosyst. 2003, 65, 115–127. [Google Scholar] [CrossRef]
- Abirochas - Associação Brasileira da Indústria de Rochas Ornamentais. Balanço do setor brasileiro de rochas ornamentais e de revestimento em 2024. Informe ABIROCHAS 2025, 01/2015, 1–19. Available online: https://abirochas.com.br/wp-content/uploads/2025/03/Informe-01_2025-Exportacoes-2024-1.pdf (accessed on 17 April 2025).
- Espírito Santo. Secretaria do Meio Ambiente e Recursos Hídricos. Instituto Estadual de Meio Ambiente e Recursos Hídricos – IEMA. Instrução Normativa nº 012-N de 22 de agosto de 2023. Diário Oficial dos Poderes do Estado do Espírito Santo 2023, 39–42.
- Espírito Santo. Secretaria do Meio Ambiente e Recursos Hídricos. Instituto Estadual de Meio Ambiente e Recursos Hídricos – IEMA. Instrução Normativa nº 013-N de 22 de agosto de 2023. Diário Oficial dos Poderes do Estado do Espírito Santo 2023, 38–39.
- Espírito Santo. Secretaria do Meio Ambiente e Recursos Hídricos. Instituto Estadual de Meio Ambiente e Recursos Hídricos – IEMA. Instrução Normativa nº 11, de 11 de outubro de 2016. Diário Oficial dos Poderes do Estado do Espírito Santo 2016, 51. [Google Scholar]
- Barral Silva, M.T.; Hermo, B.S.; Garcia-Rodeja, E.; Freire, N.V. Reutilization of granite powder as an amendment and fertilizer for acid soils. Chemosphere 2005, 61, 993–1002. [Google Scholar] [CrossRef]
- Machado, R.V.; Andrade, F.V.; Passos, R.R.; Ribeiro, R.C.C.; Mendonça, E.S.; Mesquita, L.F. Characterization of ornamental rock residue and potassium liberation via organic acid application. RBCS 2016, 40, e0150153. [Google Scholar] [CrossRef]
- Sivrikaya, O.; Koray, R. Kiyildi, K.R.; Karaca, Z. Recycling waste from natural stone processing plants to stabilize clayey soil. Environ. Earth Sci. 2014, 71, 4397–4407. [Google Scholar] [CrossRef]
- Brasil. Presidência da República. Casa Civil. Subchefia para Assuntos Jurídicos. Lei Nº 12890, de 10 de dezembro de 2013. Altera a Lei Nº 6894, de 16 de dezembro de 1980, para incluir os remineralizadores como uma categoria de insumo destinado à agricultura, e dá outras providências. Casa Civil: Brasília, DF, Brazil, 2013. Available in: . Accessed on 17th Apr. 2025. .
- Brasil. Presidência da República. Casa Civil. Subchefia para Assuntos Jurídicoss. Lei Nº 6894, de 16 de dezembro de 1980. Dispõe sobre a inspeção e a fiscalização da produção e do comércio de fertilizantes, corretivos, inoculantes, estimulantes ou biofertilizantes, remineralizadores e substratos para plantas, destinados à agricultura, e dá outras providências. Casa Civil: Brasília, DF, Brazil, 1980. Available in: https://www.planalto.gov.br/ccivil_03/_ato2011-2014/2013/lei/l12890.htm. Accessed on 17th Apr. 2025. .
- Brasil. Ministério da Agricultura, Pecuária e Abastecimento - MAPA. Instrução Normativa Nº 5, de 10 de março de 2016. Estabelece as regras sobre definições, classificação, especificações e garantias, tolerâncias, registro, embalagem, rotulagem e propaganda dos remineralizadores e substratos para plantas, destinados à agricultura. MAPA: Brasília, DF, Brazil, 2016. Available in: https://www.planalto.gov.br/ccivil_03/leis/1980-1988/l6894.htm. Accessed on: 17th Apr. 2025.
- Ayers, R.S.; Westcot, D.W. Water Quality for Agriculture; FAO - Food and Agriculture Organization of the United Nations: Rome, Italy, 1985. Available in http://www.fao.org/DOCREP/003/T0234E/T0234E00.htm#TOC. Accessed on 08th Dec. 2024.
- Abrol, I.P.; Yadav, J.S.P.; Massoud, F.I. Salt-Affected Soils and their Management. FAO - Food and Agriculture Organization of the United Nations: Rome, Italy, 1988. Available in https://www.fao.org/4/x5871e/x5871e00.htm#Contents. Accessed on 28th Nov. 2024.
- De Amorim, J. R. A.; Cruz, M. A. S.; Resende, R. S.; Bassoi, L. H.; Silva Filho, J. G. Espacialização da Porcentagem de Sódio Trocável do Solo no Perímetro Irrigado Califórnia, em Canindé de São Francisco, Sergipe. Embrapa Tabuleiros Costeiros: Aracaju, Sergipe, Brazil, 2010; 17p.
- Embrapa. Manual de Métodos de Análise de Solos, 2nd ed.; Embrapa-CNPS: Rio de Janeiro, Brazil, 1997; 212 p. [Google Scholar]
- Teixeira, P.C.; Donagemma, G.K.; Fontana, A.; Teixeira, W.G. Manual de Métodos de Análise de Solo, 3rd ed.; Embrapa: Brasília, DF, Brazil, 2017; 574p, Available online: https://www.infoteca.cnptia.embrapa.br/handle/doc/1085209> (accessed on 12 February 2025).
- Sobral, L.F.; Barretto, M.C.V.; Silva, A.J.; Anjos, J.L. Guia Prático para Interpretação de Resultados de Análises de Solo; Embrapa Tabuleiros Costeiros: Aracaju, Sergipe, Brazil, 2015; 13 pp. Available in www.bdpa.cnptia.embrapa.br. Accessed on 30th Oct. 2024.
- Braga, F.S.; Buzzi, D.C.; Couto, M.C.L.; Lange, L.C. Caracterização ambiental de lamas de beneficiamento de rochas ornamentais. Eng. Sanit. Ambient. 2010, 5, 237–244. [Google Scholar] [CrossRef]
- Kawasaki, T.; Akiba, T.; Moritsugu, M. Effects of high concentrations of sodium chloride and polyethylene glycol on the growth and ion absorption in plants. I. Water culture experiments in a greenhouse. Plant Soil 1983, 75, 75–85. [Google Scholar] [CrossRef]
- Wilpert, K.V.; Lukes, M. Ecochemical effects of phonolite rock powder, dolomite and potassium sulfate in a spruce stand on an acidified glacial loam. Nutr. Cycling Agroecosyst. 2003, 65, 115–127. [Google Scholar] [CrossRef]
- Neves, M.A.; Nascimento, W.A.R.; Horn, A.H. Dimension stone processing sludge at different stages of production: insights for waste management. Minerals 2025, 15, 39. [Google Scholar] [CrossRef]
- Neves, M. A.; Prado, A. C. A.; Marques, R. A.; Fonseca, A. B.; Machado, M. E. S. Lama de beneficiamento de rochas ornamentais processadas no Espírito Santo: composição e aproveitamento. Geociências 2021, 40, 1–123. [Google Scholar] [CrossRef]
- Duarte, E. B.; Da Silva Nascimento, A. P.; Da Silva Gandine, S. M.; De Carvalho, J. R.; Burak, D. L.; Neves, M. A. Liberação de potássio e sódio a partir de resíduos do beneficiamento de rochas ornamentais. Pesqui. em Geocienc. 2021, 48, 101373. [Google Scholar] [CrossRef]
- Associação Brasileira de Normas Técnicas - ABNT. NBR 10004: Resíduos Sólidos – Classificação.; ABNT: Rio de Janeiro, Brazil, 2004; pp. 1–71. [Google Scholar]
- Barrientos, V.; Delgado, J.; Navarro, V.; Juncosa, R.; Falcón, I.; Vázquez, A. Characterization and geochemical–geotechnical properties of granite sawdust produced by the dimension stone industry of O Porriño (Pontevedra, Spain). QJEGH 2010, 43, 141–155. [Google Scholar] [CrossRef]
- Bertossi, A.P.A.; Cardoso, M.S.N.; Prado, A.C.A.; Polidoro, J.C.; Garcia, G. O.; Neves, M. A. Influência de resíduos de serragem de mármore na condutividade hidráulica do solo e na qualidade da água. Rev. Ciênc. Agrár. 2011, 34, 123–134. [Google Scholar] [CrossRef]
- Bertossi, A.P.A.; Neves, M.A.; Cardoso, M.S.N.; Prado, A.C.A.; Ribeiro, C.A.D.; Polidoro, J.C. Influência da utilização do resíduo fino de beneficiamento de rochas ornamentais silicáticas na qualidade do solo e da água. Geociências 2012, 31, 185–195, Available in https://www.revistageociencias.com.br/geociencias-arquivos/31_2/Art04_Bertossi_et_al.pdf Accessed on 16th Mar. 2025. [Google Scholar]
- Freitas, J.J.G.; Raymundo, V.; Jesus, H.C. Características químicas dos resíduos de serragem segregados de rochas ornamentais do estado do Espírito Santo. RBGeoc. 2012, 42, 615–624. [Google Scholar] [CrossRef]
- Neves, M. A.; Nadai, C. P.; Fonseca, A. B.; Prado, A. C. A.; Giannotti, J. D. G.; Raymundo, V. pH e umidade dos resíduos finos de beneficiamento de rochas ornamentais. REM 2013, 66, 239–244. [Google Scholar] [CrossRef]
- Tozsin, G.; Oztas, T.; Arol, A. I.; Kalkan, E. Changes in the chemical composition of an acidic soil treated with marble quarry and marble cutting wastes. Chemosphere 2015, 138, 664–667. [Google Scholar] [CrossRef]
- Raymundo, V.; Neves, M. A.; Cardoso, M. S. N.; Bregonci, I. S.; Lima, J. S. S.; Fonseca, A. B. Resíduos de serragem de mármores como corretivo da acidez de solo. Rev. Bras. Eng. Agric. Ambient. 2013, 17, 47–53. [Google Scholar] [CrossRef]
- Santos, W.O.; Mattiello, E.M.; Costa, L.M.; Abrahão, W.A.P.; Novais, R.F.; Cantarutti, R.B. Thermal and chemical solubilization of verdete for use as potassium fertilizer. Int. J. Miner. Process. 2015, 140, 72–78. [Google Scholar] [CrossRef]
- Pérez-Sirvent, C.; García-Lorenzo, M.L.; Martínez-Sánchez, M.J.; Navarro, M.C.; Marimón, J.; Bech, J. Metal-contaminated soil remediation by using sludges of the marble industry: toxicological evaluation. Environ. Int. 2007, 33, 502–504. [Google Scholar] [CrossRef]
- Vital, A.F.M.; Santos, R.V.; Cavalcante, L.F.; Souto, J.S. Comportamento de atributos químicos de um solo salino-sódico tratado com gesso e fósforo. Rev. Bras. Eng. Agric. Ambient. 2005, 9, 30–36. [Google Scholar] [CrossRef]
- Chaves, E.; Pedron, F.A.; Melo, V.F.; Dalmolin, R.S.D. Reserva mineral de K por diferentes métodos em argissolos subtropicais. RBCS 2015, 39, 1088–1099. [Google Scholar] [CrossRef]
Figure 1.
(a) Aerial image of one of the deposits where samples were collected; (b) view of an active deposit; (c) abandoned deposit; and (d) borehole for collecting FDSP waste samples.
Figure 1.
(a) Aerial image of one of the deposits where samples were collected; (b) view of an active deposit; (c) abandoned deposit; and (d) borehole for collecting FDSP waste samples.
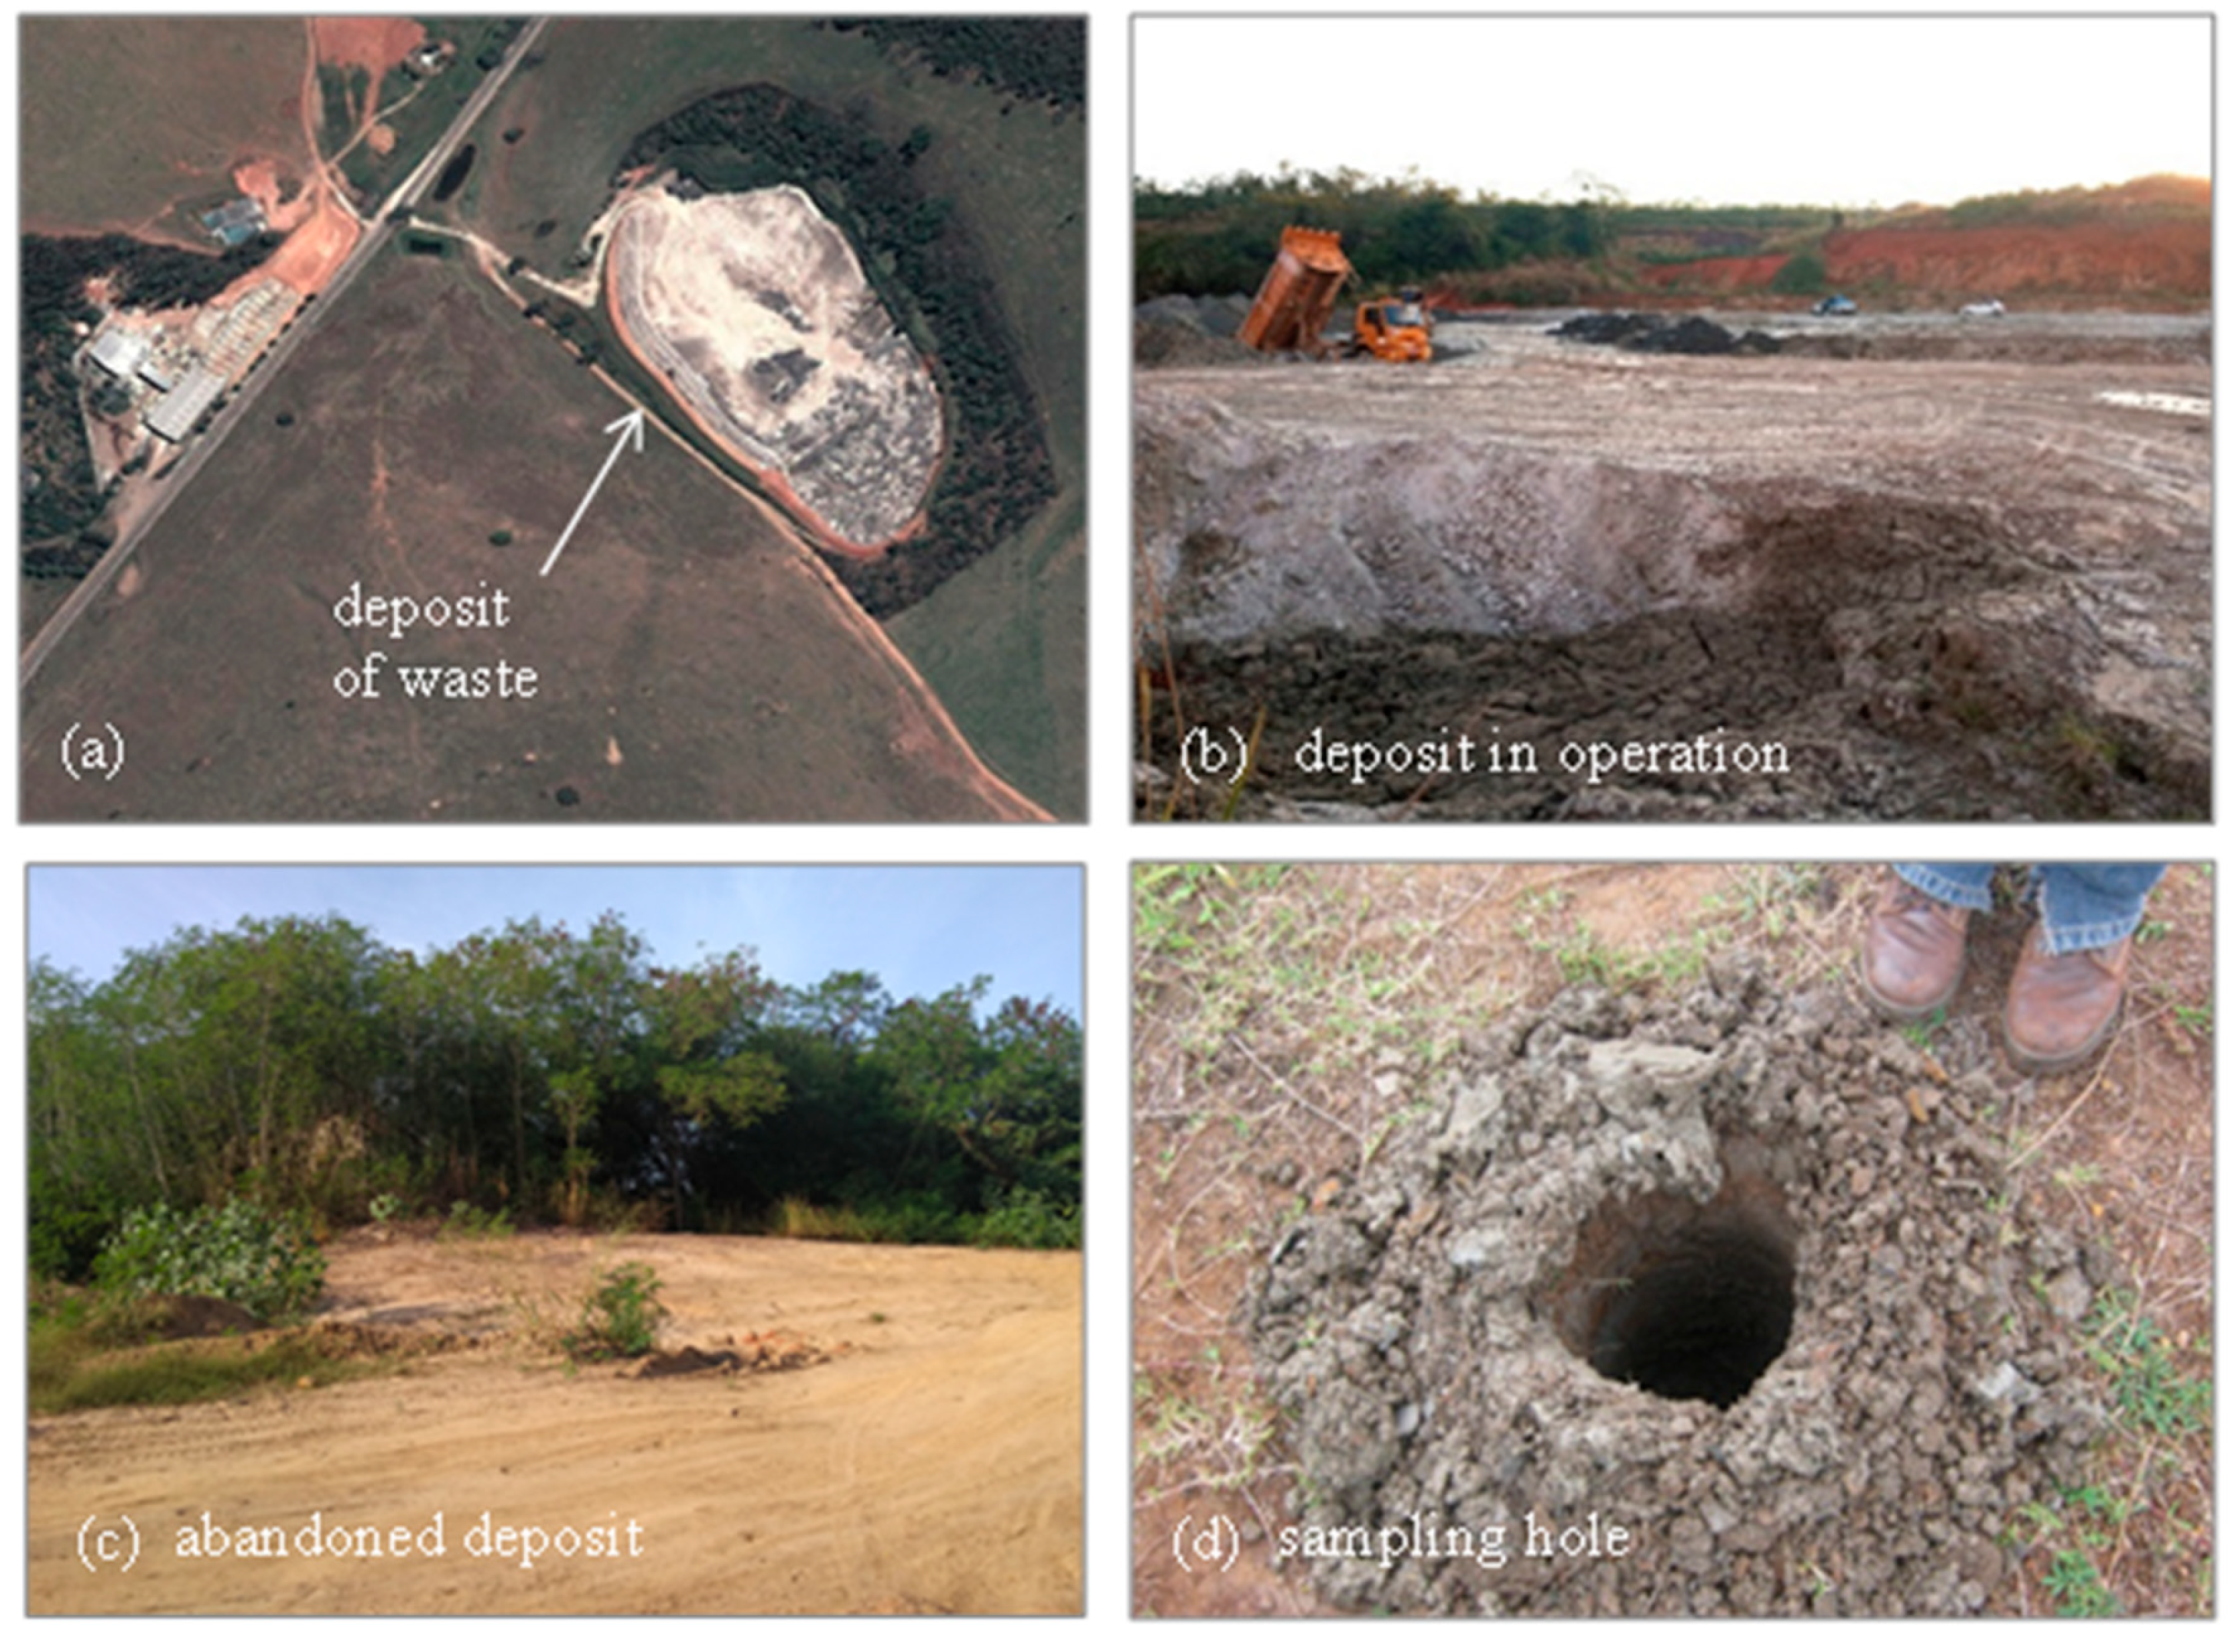
Figure 2.
Grain size distribution of 56 FDSP residue samples stored in the studied deposits (D1, D2, and D3).
Figure 2.
Grain size distribution of 56 FDSP residue samples stored in the studied deposits (D1, D2, and D3).
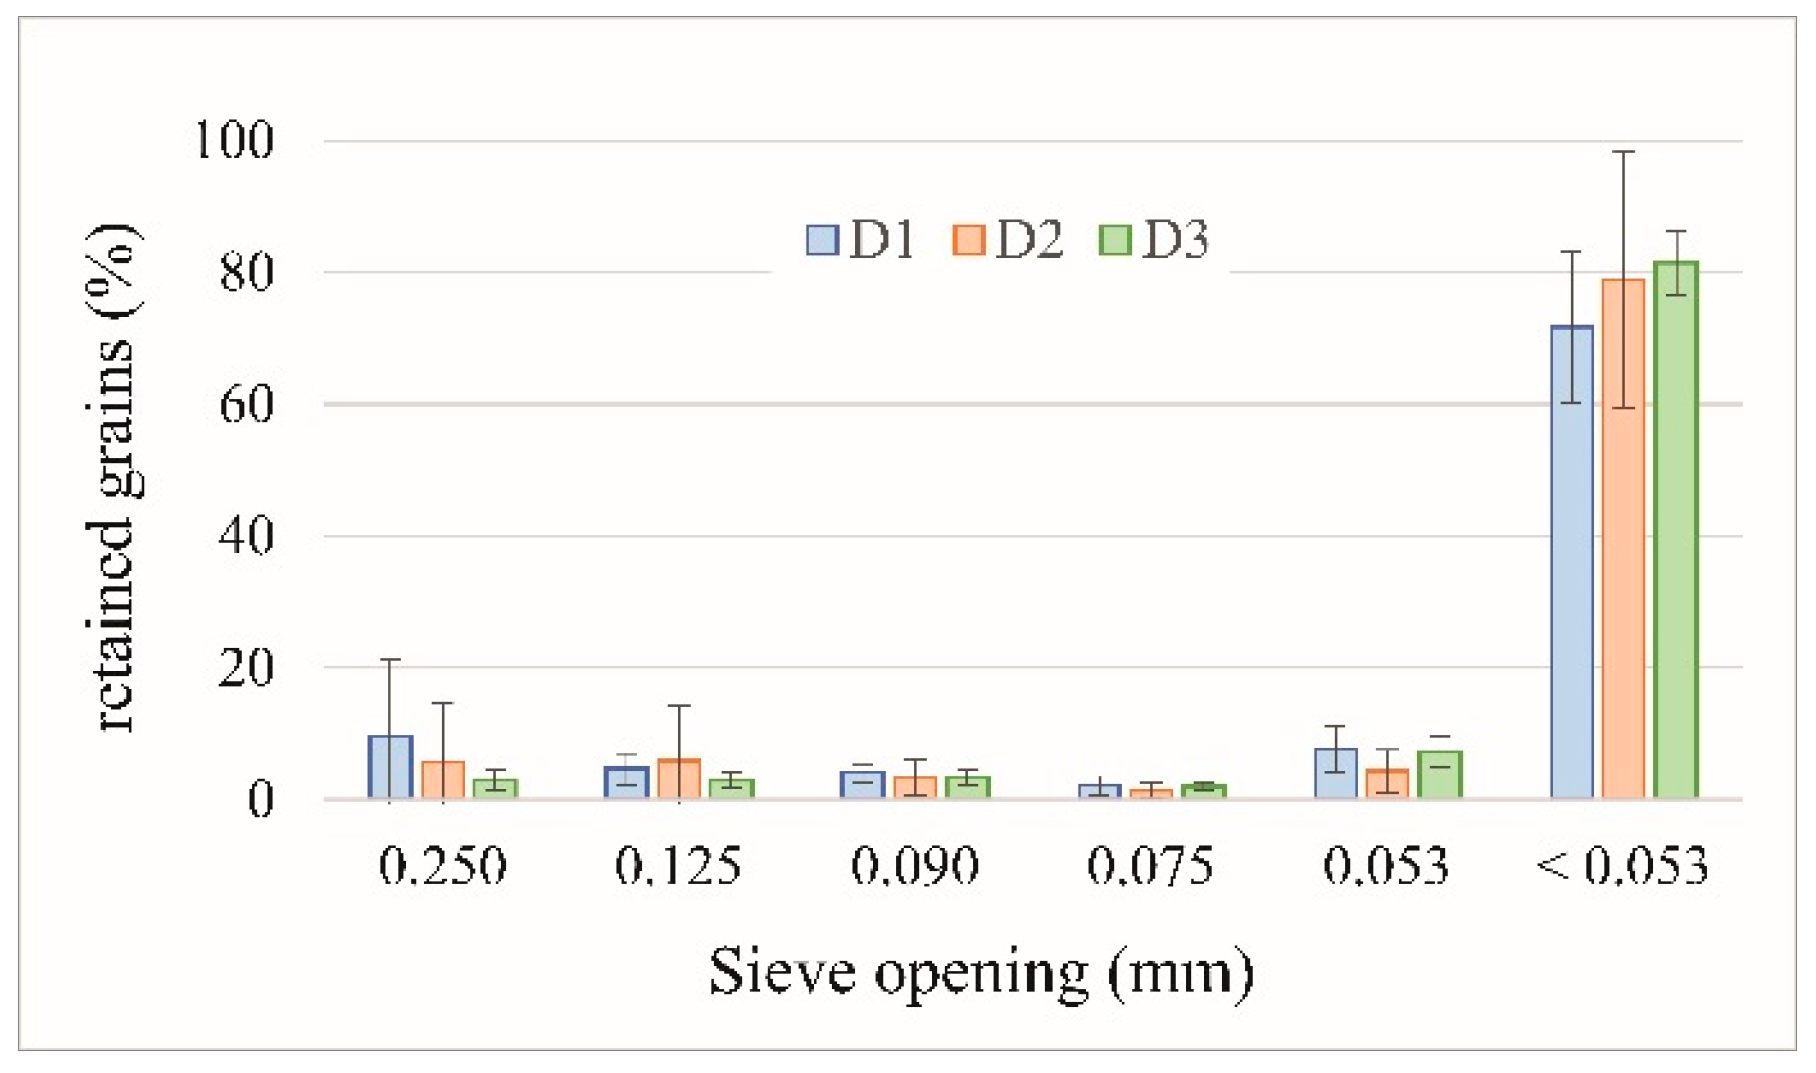
Figure 3.
Total chemical composition of the FDSP residue samples collected from the studied deposits (D1, D2, and D3).
Figure 3.
Total chemical composition of the FDSP residue samples collected from the studied deposits (D1, D2, and D3).
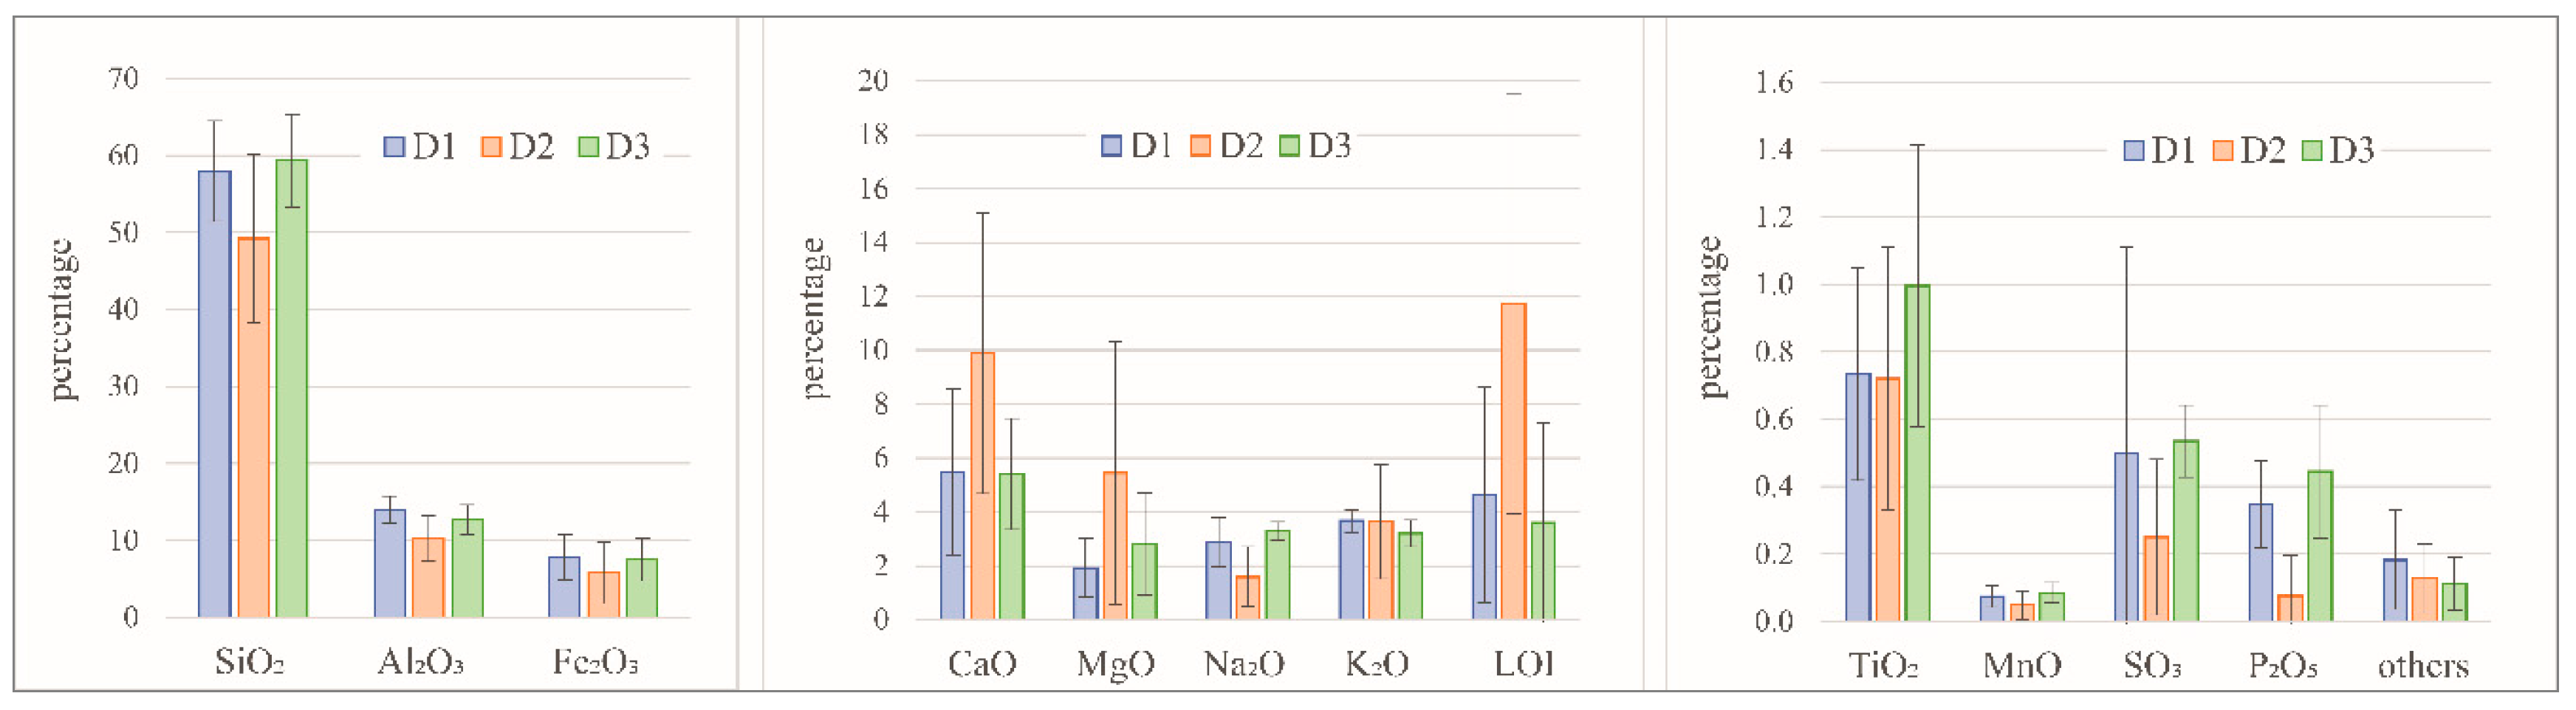
Figure 4.
Representative diffractograms of the FDSP residue samples collected from the studied deposits (D1, D2, and D3).
Figure 4.
Representative diffractograms of the FDSP residue samples collected from the studied deposits (D1, D2, and D3).
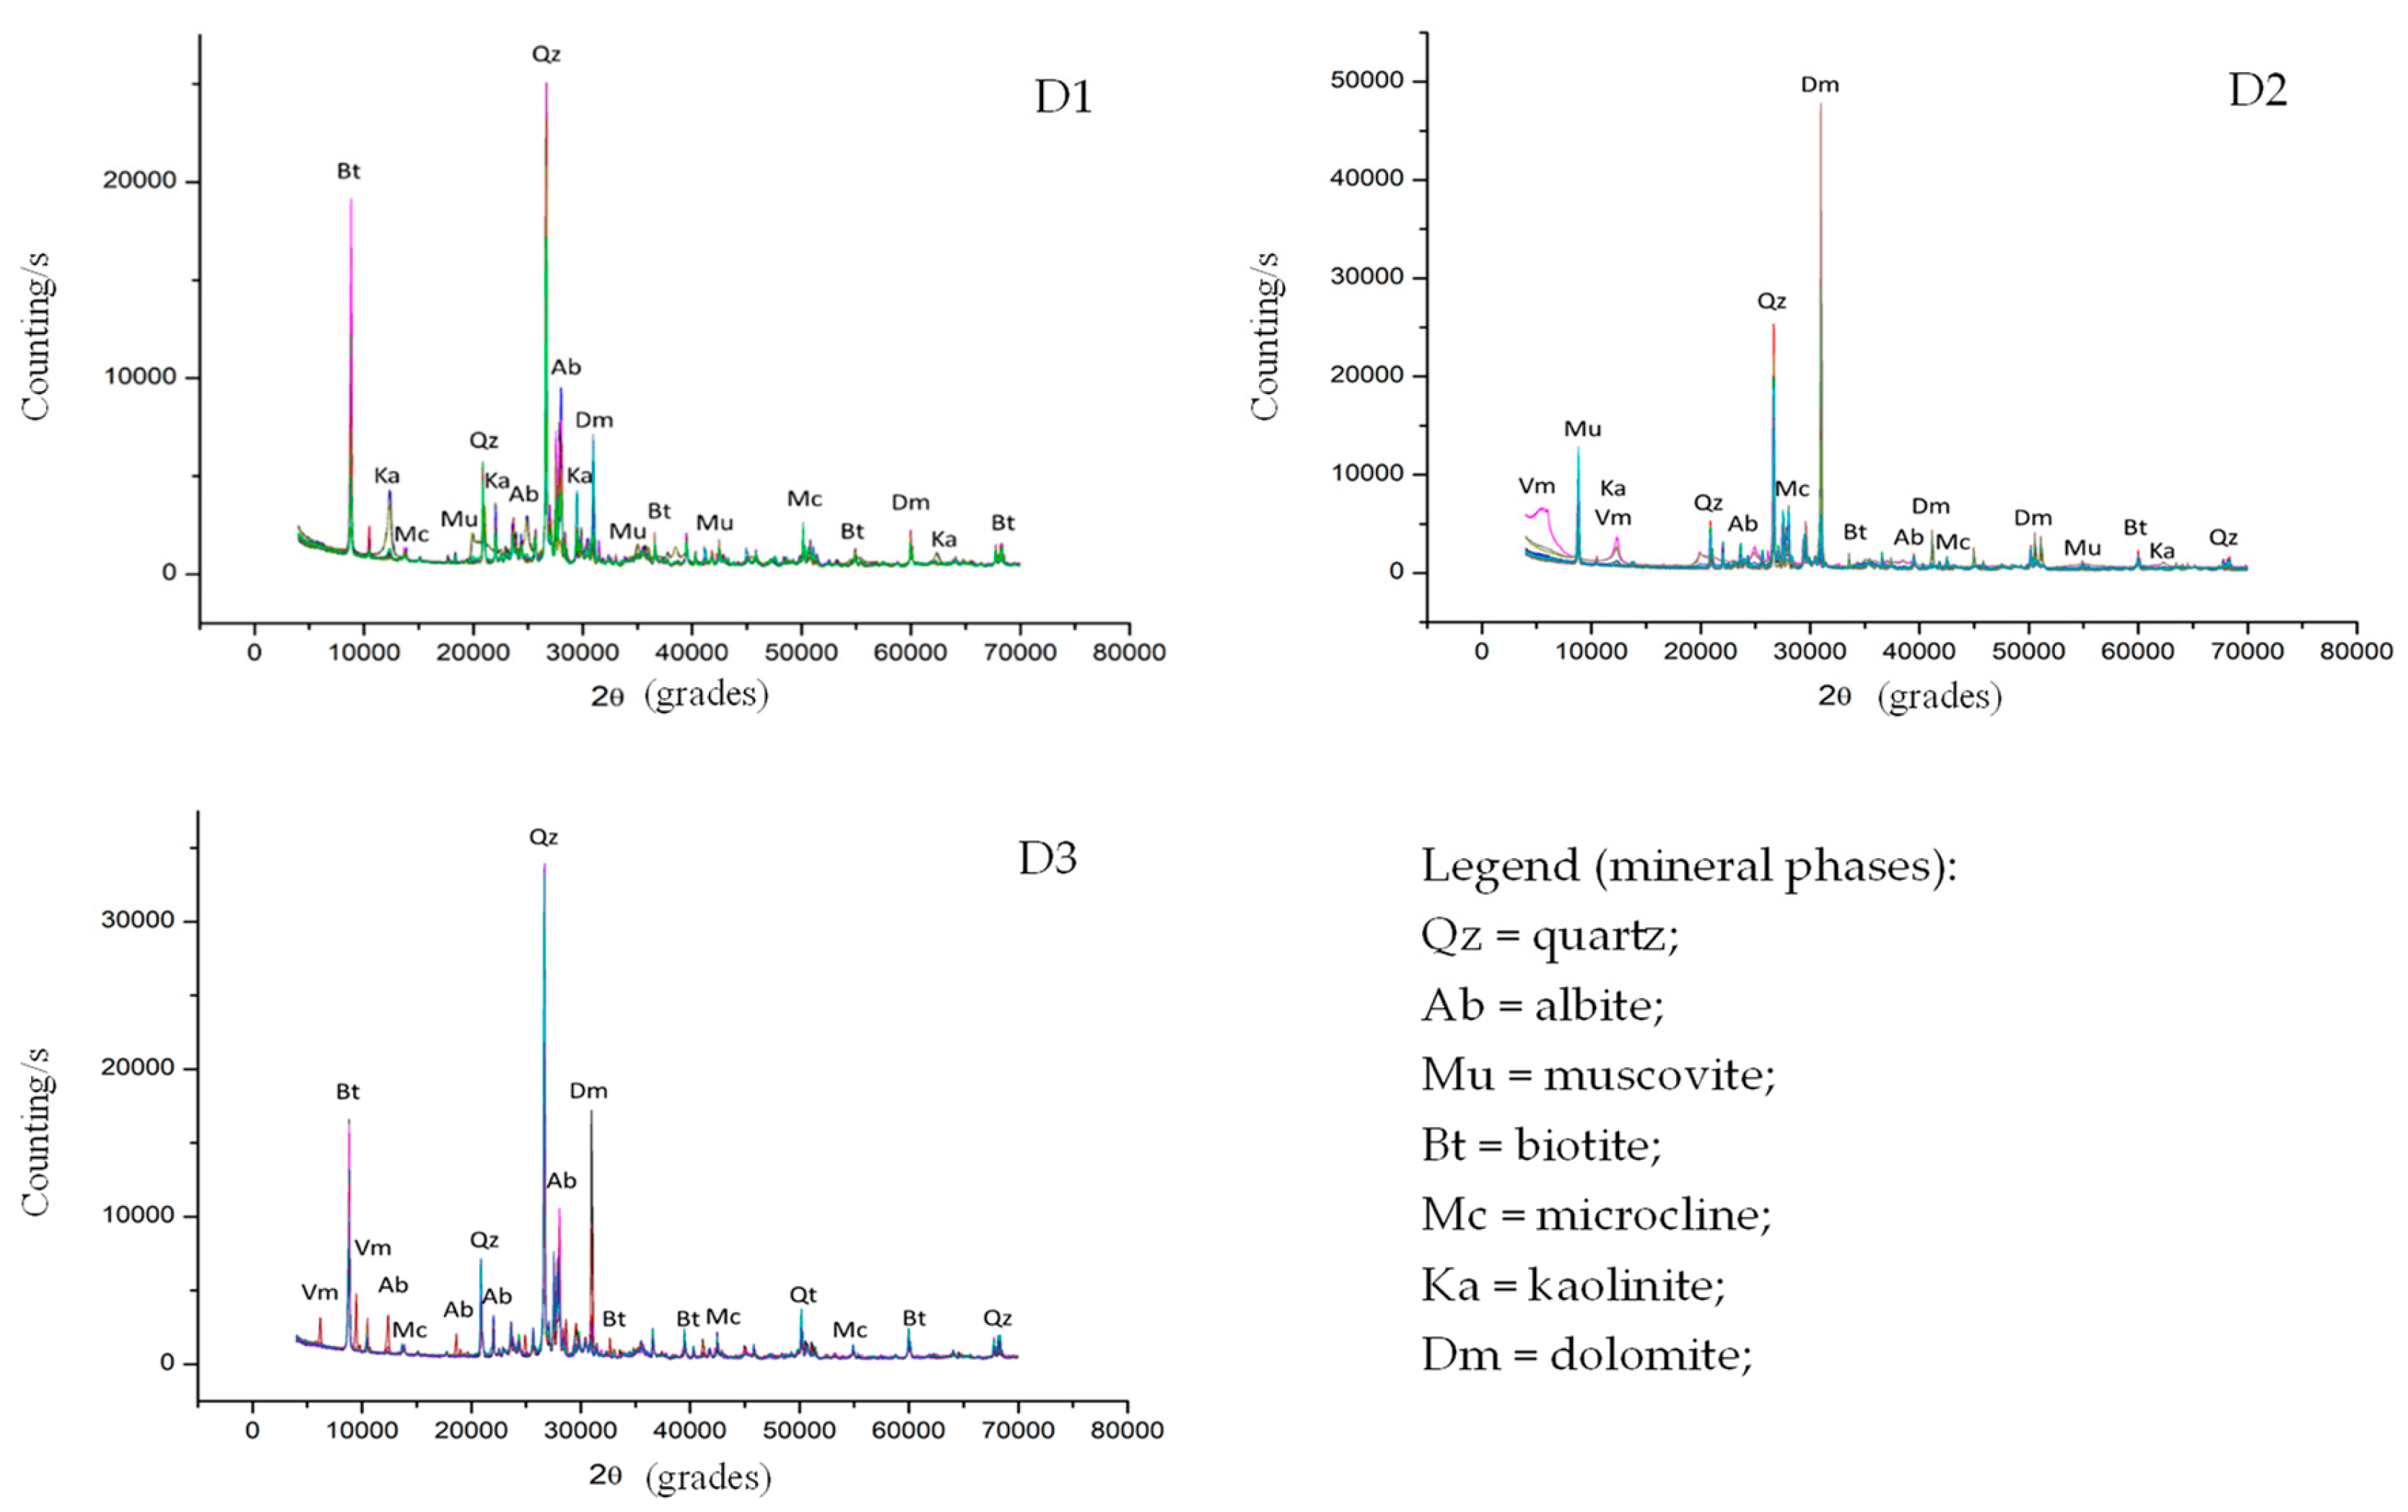
Figure 5.
Sum of bases (SB), K₂O content, free silica (FS), and pH of the FDSP samples collected from deposits D1, D2, and D3. The red dotted line indicates the minimum required value, and the red solid line indicates the maximum allowed by IN No. 05/2016 of MAPA for a material to be considered a soil remineralizer.
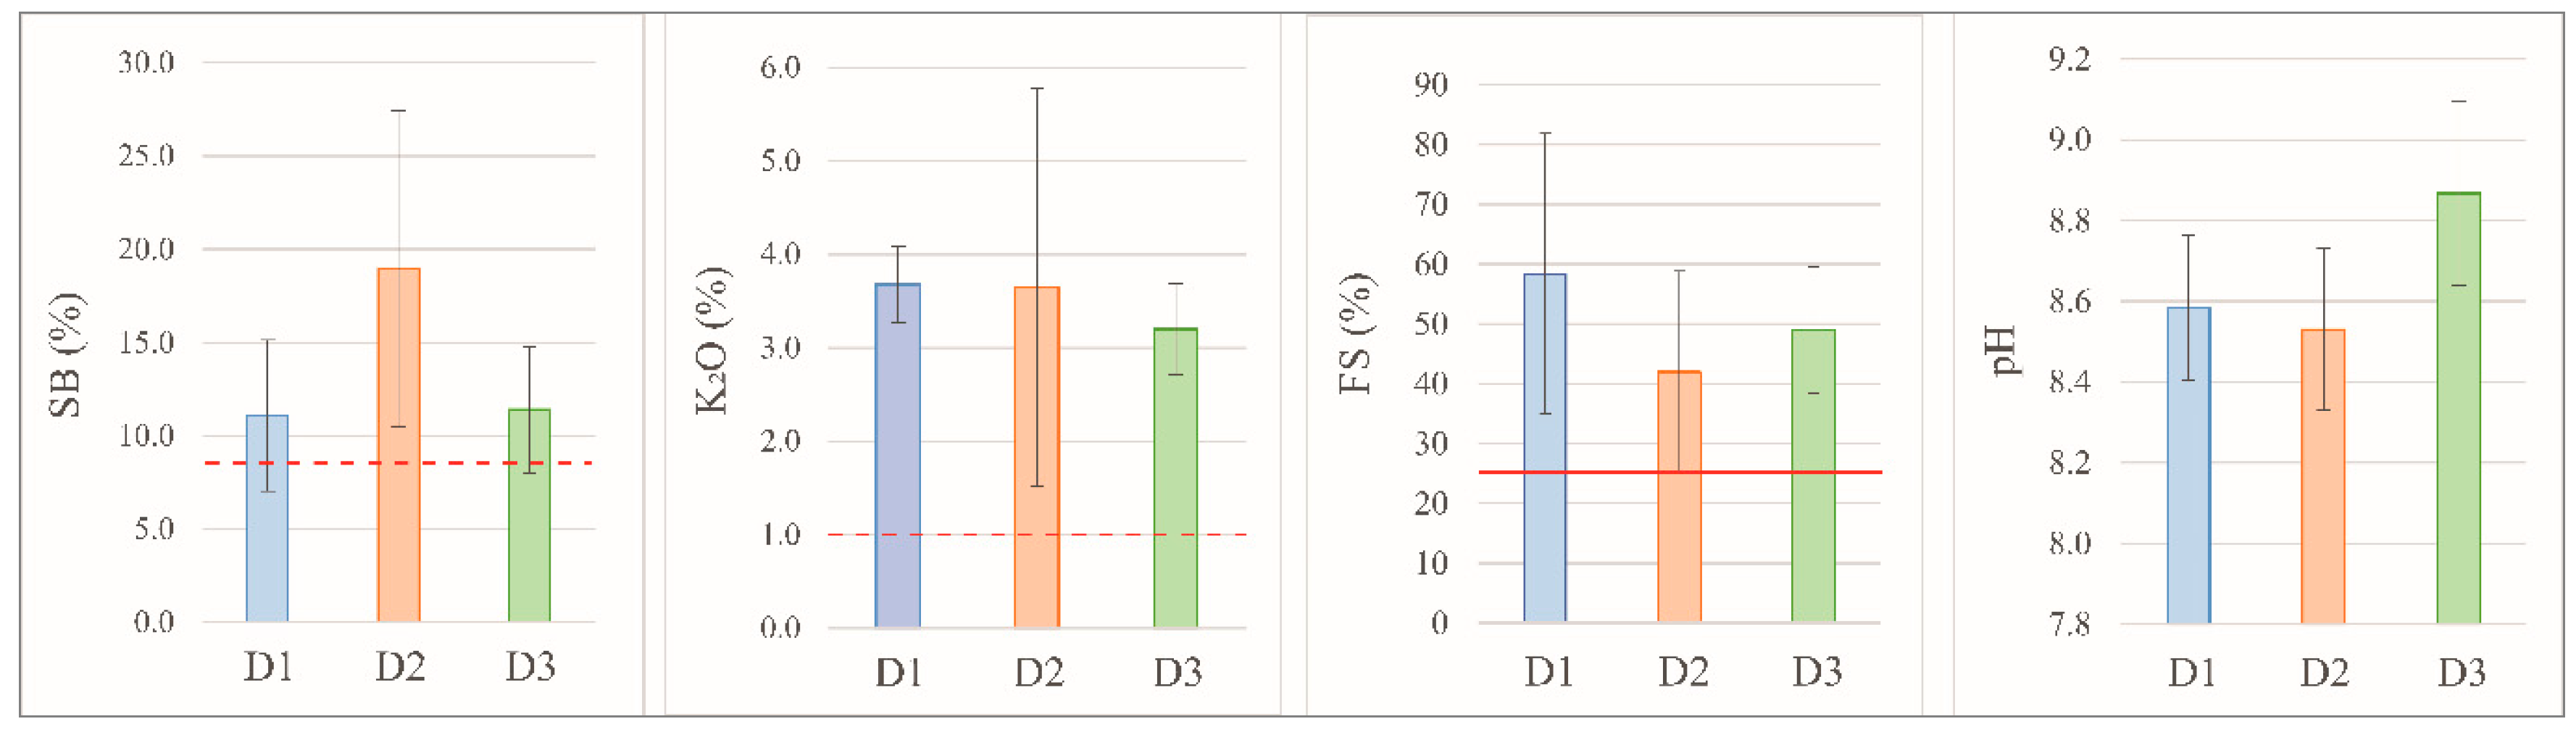
Figure 6.
Sodium Adsorption Ratio (SAR), electrical conductivity (EC), and Exchangeable Sodium Percentage (ESP) estimated and measured in the FDSP residue samples stored in the three deposits studied (D1, D2, and D3). The red line (ESP = 30%) indicates the limit above which a soil is considered excessively sodic.
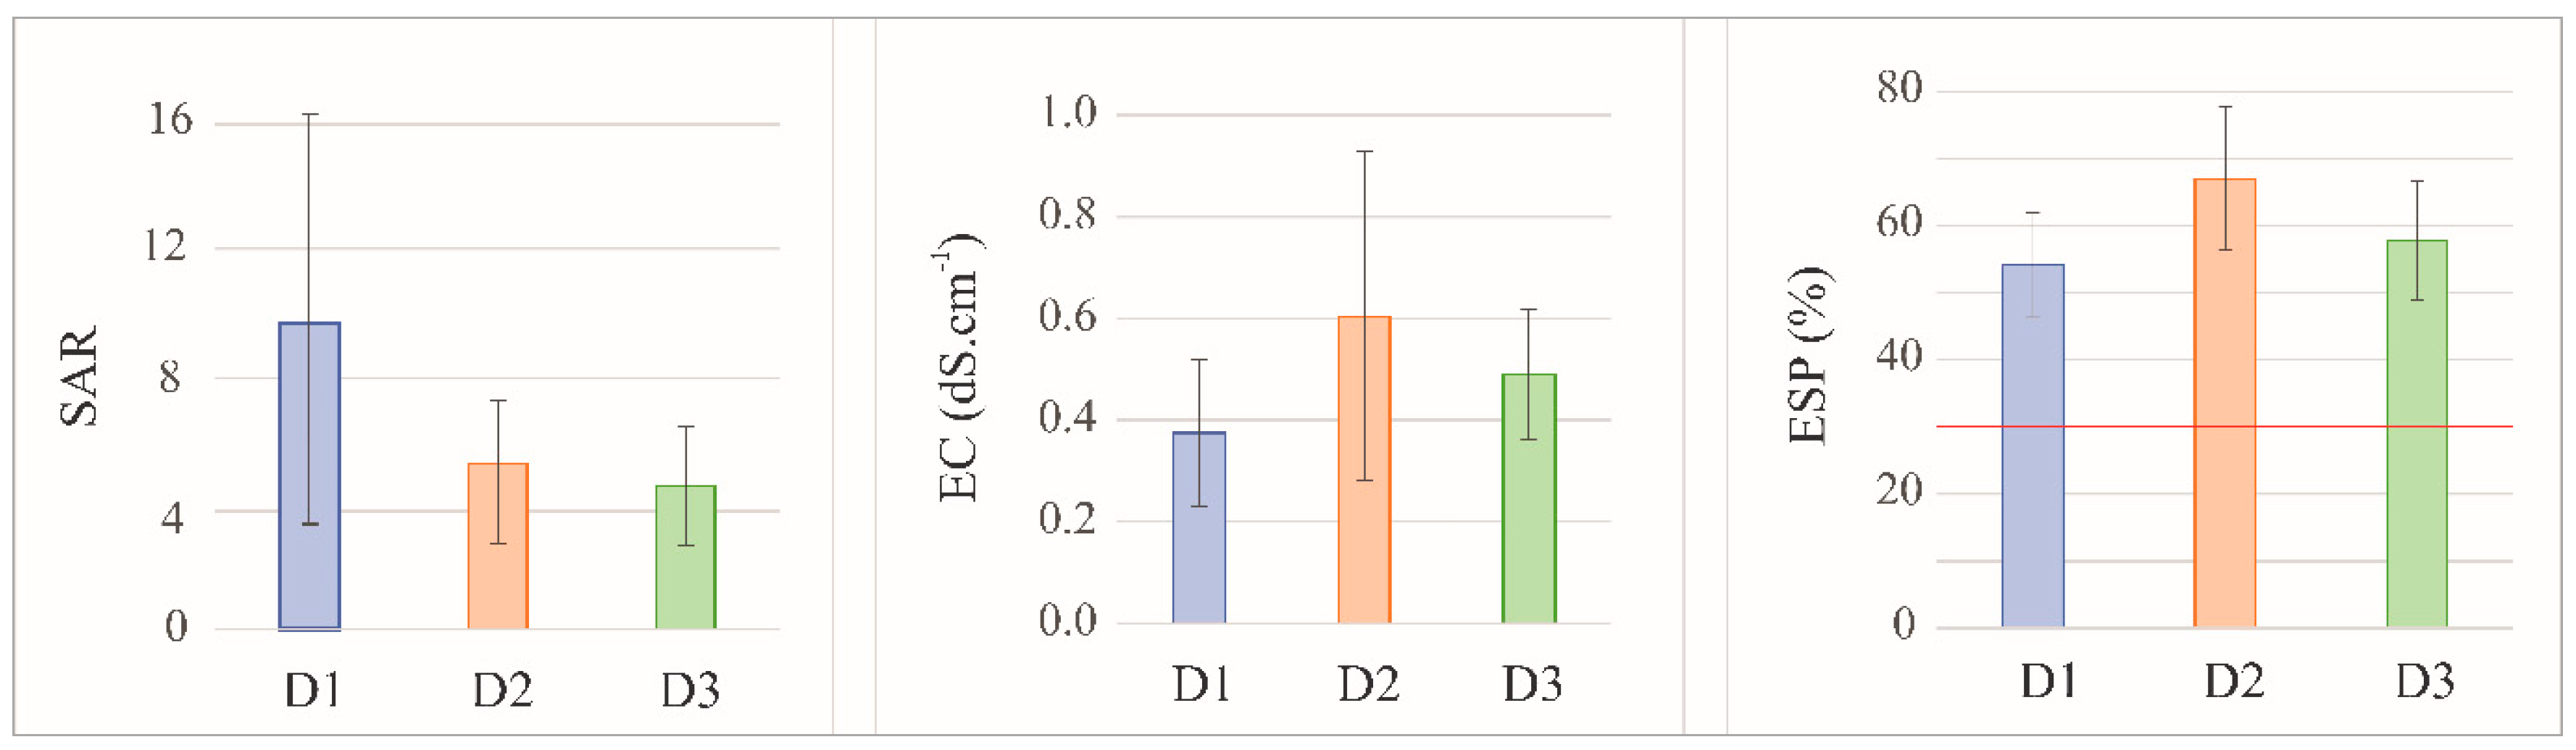
Figure 7.
Principal component analysis involving total Na content (expressed as Na₂O measured by XRF) and soluble Na concentration (measured as exchangeable Na), together with the levels of albite (Ab), Exchangeable Sodium Percentage (ESP), and Sodium Adsorption Ratio (SAR).
Figure 7.
Principal component analysis involving total Na content (expressed as Na₂O measured by XRF) and soluble Na concentration (measured as exchangeable Na), together with the levels of albite (Ab), Exchangeable Sodium Percentage (ESP), and Sodium Adsorption Ratio (SAR).
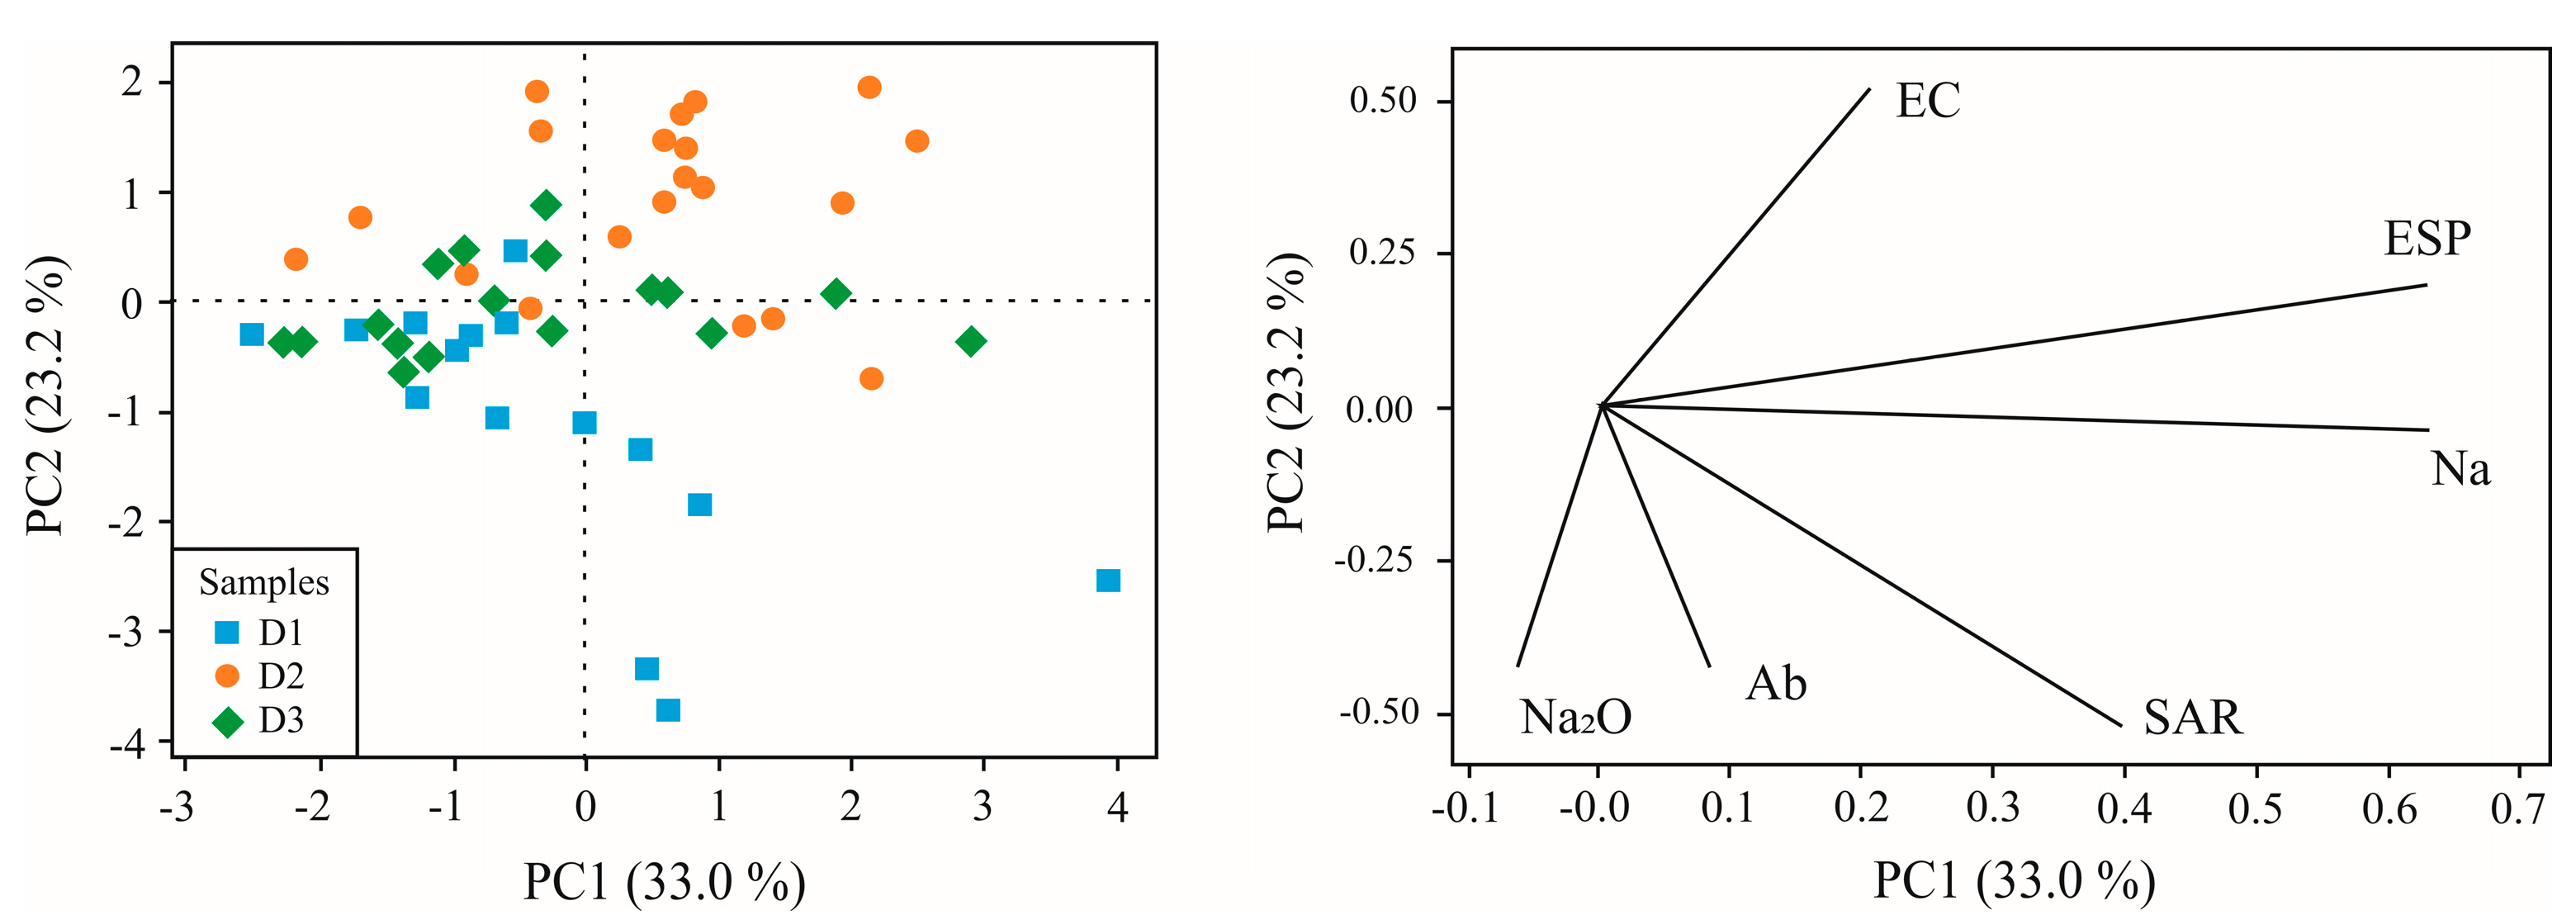

Table 1.
Classification of soils by Exchangeable Sodium Percentage (ESP).
| Class | ESP (%) |
|---|---|
| Non-sodic | < 7 |
| Slightly sodic | 7 – 10 |
| Moderately sodic | 11 – 20 |
| Strongly sodic | 21 – 30 |
| Excessively sodic | > 30 |
Table 2.
Guidelines for interpreting the influence of a solution in salinity and infiltration capacity of soil based on Sodium Adsorption Rate (SAR) and Electrical Conductivity (EC, in dS m−1), adapted from [15].
Table 2.
Guidelines for interpreting the influence of a solution in salinity and infiltration capacity of soil based on Sodium Adsorption Rate (SAR) and Electrical Conductivity (EC, in dS m−1), adapted from [15].
| Salinity | None | Moderate | Severe |
|---|---|---|---|
| EC | < 0.7 | 0.7 – 3.0 | > 3.0 |
| Infiltration | None | Moderate | Severe |
| SAR 0 – 3 and EC | > 0.7 | 0.7 – 0.2 | < 0.2 |
| SAR 3 – 6 and EC | > 1.2 | 1.2 – 0.3 | < 0.3 |
| SAR 6 – 12 and EC | > 1.9 | 1.9 – 0.5 | < 0.5 |
| SAR 12 – 20 and EC | > 2.9 | 2.9 – 1.3 | < 1.3 |
| SAR 20 – 40 and EC | > 5.0 | 5.0 – 2.9 | < 2.9 |
Table 3.
Mineralogical composition of the FDSP residues collected from the studied deposits (values in percentage).
Table 3.
Mineralogical composition of the FDSP residues collected from the studied deposits (values in percentage).
| Deposit | Qz | Ab | Mu | Bt | Mc | Ka | Dm | Cc | Mt | Vm | |
|---|---|---|---|---|---|---|---|---|---|---|---|
| D1 | mean | 58.3 | 15.1 | 4.2 | 6.0 | 2.4 | 2.1 | 9.0 | 0.0 | 2.9 | 0.0 |
| median | 58.6 | 9.7 | 2.6 | 0.0 | 0.0 | 0.0 | 0.0 | 0.0 | 0.0 | 0.0 | |
| st.dev. | 23.5 | 20.5 | 4.6 | 11.2 | 4.8 | 4.7 | 17.8 | 0.0 | 10.9 | 0.0 | |
| min. | 22.3 | 0.0 | 0.0 | 0.0 | 0.0 | 0.0 | 0.0 | 0.0 | 0.0 | 0.0 | |
| max. | 89.5 | 72.5 | 13.8 | 32.2 | 16.7 | 16.9 | 44.5 | 0.0 | 40.8 | 0.0 | |
| D2 | mean | 42.0 | 8.9 | 1.8 | 13.0 | 2.3 | 0.9 | 22.6 | 5.1 | 1.5 | 2.1 |
| median | 40.3 | 7.7 | 1.4 | 0.0 | 0.0 | 0.0 | 13.6 | 0.4 | 0.0 | 0.0 | |
| st.dev. | 16.8 | 7.5 | 2.7 | 16.2 | 4.4 | 2.3 | 23.9 | 8.2 | 7.0 | 9.9 | |
| min. | 17.4 | 0.2 | 0.0 | 0.0 | 0.0 | 0.0 | 0.0 | 0.0 | 0.0 | 0.0 | |
| max. | 76.8 | 36.4 | 11.0 | 49.3 | 17.3 | 9.7 | 59.7 | 30.8 | 33.7 | 47.6 | |
| D3 | mean | 49.0 | 5.4 | 1.2 | 29.1 | 8.8 | 1.1 | 3.5 | 0.0 | 0.0 | 1.8 |
| median | 49.6 | 5.9 | 0.0 | 32.1 | 6.6 | 0.0 | 0.0 | 0.0 | 0.0 | 0.0 | |
| st.dev. | 10.5 | 4.2 | 4.8 | 12.1 | 8.4 | 4.5 | 9.9 | 0.2 | 0.0 | 7.3 | |
| min. | 27.3 | 0.4 | 0.0 | 0.0 | 0.0 | 0.0 | 0.0 | 0.0 | 0.0 | 0.0 | |
| max. | 66.1 | 14.8 | 19.1 | 42.0 | 30.3 | 18.0 | 34.2 | 0.7 | 0.0 | 29.0 | |
* Acronyms - Qz: quartz, Ab: albite, Mu: muscovite, Bt: biotite, Mc: microcline, Ka: kaolinite, Dm: dolomite, Cc: calcite, Mt: magnetite, Hm: hematite, Gt: goethite, Vm: vermiculite.
Table 4.
Restrictions regarding salinization and infiltration capacity of the FDSP samples collected from the studied deposits (n: number of samples; ESP: Exchangeable Sodium Percentage).
Table 4.
Restrictions regarding salinization and infiltration capacity of the FDSP samples collected from the studied deposits (n: number of samples; ESP: Exchangeable Sodium Percentage).
| Deposit | n | Restriction on salinity | Restriction on infiltration | ESP | |||
|---|---|---|---|---|---|---|---|
| None | Moderate | None | Moderate | Severe | Excessive | ||
| D1 | 15 | 93 % | 7 % | 0 % | 27 % | 73 % | 100 % |
| D2 | 22 | 73 % | 27 % | 14 % | 54 % | 32 % | 100 % |
| D3 | 17 | 100 % | 0 % | 0 % | 71 % | 29 % | 100 % |
Disclaimer/Publisher’s Note: The statements, opinions and data contained in all publications are solely those of the individual author(s) and contributor(s) and not of MDPI and/or the editor(s). MDPI and/or the editor(s) disclaim responsibility for any injury to people or property resulting from any ideas, methods, instructions or products referred to in the content. |
© 2025 by the authors. Licensee MDPI, Basel, Switzerland. This article is an open access article distributed under the terms and conditions of the Creative Commons Attribution (CC BY) license (http://creativecommons.org/licenses/by/4.0/).
Copyright: This open access article is published under a Creative Commons CC BY 4.0 license, which permit the free download, distribution, and reuse, provided that the author and preprint are cited in any reuse.


