Submitted:
25 April 2025
Posted:
28 April 2025
You are already at the latest version
Abstract
The balanced control of the synthesis of CoQ along life of the organism is essential to maintain the respiratory capacity at the mitochondria and the antioxidant protection of cell membranes and plasma lipoproteins. For this reason, we determined the levels of the transcripts of the CoQ-synthome along life of mice in comparison with the levels of some antioxidant enzymes and the levels of CoQ in these animals. Surprisingly, we found that some organs such as liver and kidney show great differences in mRNA levels of some COQ-genes along life whereas others such as brain or gastrocnemius muscle do not show differences. Interestingly, these differences were not related to the total amount ot CoQ in these tissues indicating a discrepancy between the transcript activity of the CoQ-synthome and the level of the product, CoQ. Probably this responds to different regulatory levels including mRNA lifespan and CoQ turnover. Further, resveratrol and physical activity in old animals can modulate some of the transcripts but not all of them in an organ-dependent effect indicating a different response to the regulators.
Keywords:
ubiquinone
; coenzyme Q
; aging
; mice
; mitochondria
; antioxidant
1. Introduction
Coenzyme Q (CoQ) is a molecule comprised by a benzoquinone ring associated with a isoprenoid chain and located in all cell membranes [1]. The main role of CoQ in mitochondrial metabolism is to transfer electrons from complexes I or II to III of the OXPHOS complex [2,3,4] but it also is involved in the catabolism of lipids by β-oxidation [5], synthesis of pyridine nucleotides [6] and the one carbon metabolism and sulfide and aminoacid metabolism [7]. In mitochondria, in the rest of cell membranes and in blood plasma lipoproteins, CoQ plays an essential antioxidant role preventing lipid peroxidation being the principal endogenous lipophilic antioxidant in the organism [8,9]. This antioxidant activity depends on membrane associated antioxidant enzymes such as Cytochrome b5 reductase (CYTB5R), NAD(P)H quinone dehydrogenase 1 (NQO1) [10] and ferroptosis suppressor protein 1 (FSP1) [11] that transfer electrons from cytosolic NAD(P)H to membrane oxidized form of CoQ (ubiquinone) to reduce it to the reduced form (ubiquinol) [12]. Ubiquinol transfers electrons to membrane α-tocopherol or directly to oxidized lipids in a reaction in which ubiquinol is oxidized to ubiquinone. Moreover, recently it has been described that an oxidoreductase enzyme bound to the outer side of plasma membrane of hepatocytes is responsible of the maintenance of ubiquinol in blood plasma lipoproteins [13] preventing the oxidation of cholesterol.
CoQ is synthesized in mitochondria [14]. From mitochondria, CoQ is transferred to the rest of cell membranes by a mechanism not yet clarified but depending on the endomembrane secretory cycle [1]. The synthesis of CoQ is a complex process in which more than 13 different enzymes participate, known as CoQ-synthome, mainly modifying the benzene ring [15]. These enzymes are codified by different genes located in different chromosomes in all the organisms and their regulation has not been completely clarified.
Aging is associated with a reduction in the synthesis of CoQ [16] and for this reason, many studies have been carried out to determine the effect of CoQ10 supplementation in humans against aging and age-related diseases [9,17,18,19]. However, to date, no information is available about the transcriptional regulation of the CoQ-synthome along aging and if this regulation affects CoQ synthesis. Post-transcriptional regulation plays an important role in the regulation of the lifespan of mRNA levels of the components of the CoQ-synthome a [20] or protein levels [21,22].
Physical activity (PA) and the stilbene resveratrol (RSV) have demonstrated protective effects against oxidation and inflammation in different organs and tissues [23,24,25]. PA and caloric restriction have demonstrate the capacity to modulate CoQ levels in mice at the same time that regulate antioxidant activities [26]. Further, both PA and RSV exert its effect in an age-dependent manner [25]. We have also found that RSV also changes mitochondrial physiology in mice under high-fat diet conditions [27,28] and RSV affects CoQ levels and activity of CoQ-dependent oxidoreductases in old animals in an organ-dependent effect [23,25,29].
Thus, in the present study we wanted to know how the mRNAs of the members of the CoQ-synthome evolve along lifespan of mice and if this is related with protein levels or CoQ levels. Further, we wanted to know the effect of PA or RSV on the CoQ-synthome transcriptome and if their effect is also organ-dependent in old animals.
2. Materials and Methods
2.1. Animals
This study was performed using male C57BL/6J mice. Three age groups of at least 4 animals per group were studied: young (8 months), mature (18 months) and old (24 months). Animals were maintained in enriched environmental conditions in groups of 4-5 animals per polycarbonate cage. Colony was maintained under a 12 h light/dark cycle (12:00 AM – 12:00 PM) with temperature (22 ± 3 ºC) and humidity constant and controlled. Animals were maintained accordingly to a protocol approved by the Ethical Committee of the University Pablo de Olavide (CEEA 04/12) and following the international rules for animal research.
The group of old animals that were subjected to PA started training procedure two months before the end of the experiment, at 22 months. Animals were trained following a plan consisting in one week of adaptation followed by a 5 days/week exercise on a treadmill (Treadmill Columbus 1055M-E50, Cibertec SA, Spain) with 8% inclination for 20 min/day. The protocol of training consisted of a 3-min warm-up at 5 m/min followed by an increase of the speed until reaching 20 m/min around half of the procedure and maintained until reaching 20 min of training.
In the case of the group treated with RSV, animals were randomly divided into two groups: control and RSV. Treatment started 6 months before the end of the experiment, at 18 months of age. Control group were provided with water containing 0,18% ethanol used as vehicle for RSV (180 µL ethanol/100 mL H2O) whereas in the group treated with RSV water contained RSV (180 µL of 0.1mg/mL trans-RSV in ethanol/100 mL H2O) (Cayman Chemicals, USA) that was provided in opaque bottles to avoid light-dependent decomposition of RSV. Previously we tested that mice drank around 4-5 ml/day and with a weight around 30 g, the calculated dose of RSV was around 500 μg/animal/day (16.5 mg/kg/day).
At the end of the experiment animals were sacrificed by cervical dislocation in fasting conditions (O/N fasting). Organs were immediately removed and frozen in liquid nitrogen and maintained at −80 °C until analysis.
2.2. CoQ-syntome mRNA levels determination
Total mRNA from the different organs was obtained after homogenization with Trizol (Invitrogen, Life Technologies, Carlsbad, California, USA) and extracted and cleaned with RNeasy Mini kit (Qiagen Iberia S.L, Madrid, Spain). The possible remaining DNA was eliminated with RNAse free DNAse I (Sigma Aldrich, Barcelona, Spain). The quality and quantity of the mRNA was determined by a NanoDrop ND-1000 UV spectrophotometer (Thermo Scientific, Waltham, Massachusetts, USA). cDNA was obtained by using the iScript cDNA synthesis system (Bio-Rad USA, Hercules, California, USA).
The levels of mRNA of each gene were determined by quantitative qPCR using a CFX Connect Real-Time PCR Detection System (Bio-Rad, Hercules, California, USA) using the iTaq Universal SYBR Green Supermix (Bio-Rad, Hercules, California, USA). The oligonucleotides were designed through the tested primers published in PrimerBank (https://pga.mgh.harvard.edu/primerbank/) and produced by Eurofins MWG Synthesis GmnH (Ebersberg, Germany) (Table 1).
The best housekeeping gene used for reference was determined among four constitutive genes: β-actin, HSP90, HPRT and 18S by using the RefFinder software [30]. The β-actin mRNA was considered the most reliable housekeeping gene with best score and used for determinations.
2.3. Western blot analysis
Protein homogenates were separated on a PAGE-SDS gel and transferred onto a nitrocellulose membrane. Total protein loading was determined by Ponceau S staining that was recorded for monitored transfer efficiency and quantification of total proteins for reference. Then, membrane was blocked with 5% skim milk dissolved in 0.5 mM Tris–HCl (pH 7.5), 150 mM NaCl, and 0.1% Tween-20 for 1 h at room temperature. Membranes were subsequently incubated with the corresponding primary antibody as indicated in Table 2. After three washes with Tris-buffered saline with 0.1% Tween-20 (TBST), blots were incubated with respective secondary horseradish peroxidase conjugated antibody in TBST with 5% skim milk at a 1:1000 dilution for 1 h at room temperature. Blots were then washed three times in TBST and developed using an enhanced chemiluminescence detection substrate Immobilon Western Chemiluminescent HRP Substrate (Merck Millipore, Spain).
Protein levels were visualized by the ChemiDoc™ XRS+ System and compiled with Image Lab™ 4.0.1 Software (Bio-Rad Laboratories, USA). Immunodetected protein levels were corrected by whole protein loading determined by Ponceau Red staining.
2.4. CoQ Determination
Total CoQ were extracted and determined from brain, gastrocnemius muscle and liver homogenates as indicated previously [31]. One hundred pmol CoQ6 were used as internal control to check extraction efficiency. Sodium dodecyl sulphate (1%) was added to the sample and vortexed immediately during 1 min. Ethanol:isopropanol (95:5) in a proportion 2:1 was added and mixed again during 1 min. For organic extraction, 600 μL hexane were added to the mixture and vortexed again for 1 min. After a centrifugation at 1000 x g for 10 min at 4 °C, the upper organic phase was removed and stored in a clean Eppendorf tube. Organic extraction was repeated twice, and all the upper organic phases mixed. CoQ-containing organic phase was dried by using a speed-vac at 35 °C. After that, dried lipid extract was dissolved in 60 μL ethanol and injected in HPLC system Beckman 166-126 (Beckman Coulter, Brea, California, USA) by using a 20 μL loop. Lipid components were separated through a 15-cm Kromasil C-18 column (Sigma Aldrich, Barcelona, Spain) maintained at 40 °C in a continuous flux of 1 mL/min 65:35 methanol/2-propanol plus 1.42 mM lithium perchlorate mobile phase. Total levels of CoQ were detected by an electrochemical detector and expressed as pmol/mg protein.
2.5. Statistical Analysis
All the results are expressed as mean ± SD, at least n=4 per group. Serial measurements were analyzed by using Student’s paired t-test and two-way ANOVA with Bonferroni’s post hoc test using GraphPrism 8.0.2 program (GraphPad Software Inc., USA). Correlation of the mRNA levels of the genes was determined by a two-tailed Pearson’s correlation. Figures were drawn by using GraphPrism 8.0.2 program. The critical significance level α was 0.05 and then, statistical significance was defined as p<0.05.
3. Results
3.1. An Organ-Dependent Regulation of the mRNA of the CoQ-Synthome Along Aging
We determined the levels of mRNA of the different members of the CoQ-synthome in different organs along mice life. We used young levels as reference and β-actin as the best housekeeping gene indicated by Normfinder software (Figure 1). Interestingly, liver and kidney showed very high differences in the levels of the mRNA of the different genes involved in CoQ synthesis along the life of mice. Mature organisms (18 months) showed higher levels of expression in most of the genes studied in both liver and kidney. On the other hand, brain and gastrocnemius muscle showed very low differences along the lifespan of the animals although in brain some genes showed significant increases in mature animals in comparison with both young and old animals.
Remarkably, in all the organs studied, the levels of expression in old animals (24 months) were very similar to those found in young animals (8 months). mDLP1 mRNA levels showed a rise in mature animals in comparison with young and old animals in liver, kidney and brain but not in gastrocnemius. This increase was very high in the liver and more moderate in the brain. Interestingly, the other component of the mCOQ1 complex, mSPS1, did not show such an increase in mature animals either in liver or in brain indicating an imbalance between the expression of the two components of the mCOQ1-complex. Another interesting characteristic was that mCOQ6 did not show any remarkable variation in all the organs studied. Further, whereas in liver, mCOQ10 did not show significant differences at different ages, although a tendency to decrease in old animals was found, in kidney, this gene did now a clear increase in mature animals.
In summary, all these determinations suggest that the members of the CoQ-synthome show different transcription regulatory mechanisms in different tissues and organs and at different ages.
Taking into consideration these changes, we performed a correlation of the levels of mRNA of the different COQ genes to determine if the genes show any kind of coordinated expression in the different organs. In liver, the cluster of mSPS1, mDLP1, mCOQ2, mCOQ3, mCOQ5, mCOQ7 and mCOQ9 showed high levels of positive and significant correlation (Figure 2). On the other hand, mCOQ8 was the gene whose mRNA showed a lower positive correlation with the other genes followed by mCOQ4 and mCOQ10. Interestingly, in kidney, that also showed high levels of expression in mature animals, this pattern of correlation was different, with a clear cluster of high correlation between mSPS1, mDLP1, mCOQ2, mCOQ3, mCOQ4, mCOQ5, mCOQ9 and mCOQ10 genes but not high correlation with the others. Even mCOQ6 and mCOQ8 mRNA levels showed a negative correlation with many of the other genes (Figure 2).
In the case of post-mitotic organs such as brain and gastrocnemius muscle the correlation between the levels of mRNA were less clear. A positive correlation was found between mCOQ2, mCOQ3, mCOQ4 and mCOQ5 and between mCOQ9 and mCOQ10 but between the mRNA levels of the other genes we did not find any correlation (Figure 2). In the case of gastrocnemius muscle, two pair of genes showed a stronger positive correlation, the two members of mCOQ1, mSPS1 and mDLP1, and mCOQ8 and mCOQ9 between them (Figure 2).
All these relationships demonstrate that the regulation of the expression of the genes of the CoQ-synthome and the control of the mRNA levels depends on the age of the animal and on the tissues or organs studied.
We also determined if some other genes involved in antioxidant protection presented a similar behavior in mRNA along aging. We determined the levels of different antioxidant genes and regulators such as Nuclear factor erythroid 2-related factor 2 (NRF2) and sirtuin 1 (SIRT1) in liver and brain as representatives of the organs that showed higher differences and lower differences respectively in COQ-gene expression along lifespan.
Interestingly, the behavior was similar in some cases. In liver, high differences in mRNA levels were found in H2O2-detoxifying genes such as glutathione peroxidase (GPX) and catalase (CAT) along the life of the mice. However, NRF2, NQO1 and SIRT1 showed a tendency to decrease with age including mature animals. On the other hand, in brain, the differences in expression were lower than in liver, as happened in COQ-genes, and only NQO1 showed higher levels in mature animals in comparison with young animals. Glutathione peroxidase (GPX) and CAT did not show any increase in mature animals and did suffer a great decrease in old animals in comparison with both young and mature animals. No changes were found in NRF2 and SIRT1 genes. Thus, these results indicate that the different behavior in the expression of COQ-genes is also found in other genes and opens the possibility of a different regulation of gene expression in mature animals.
3.2. The Levels of mRNA of the CoQ-Synthome Components Do Not Correspond to the Protein Levels
We wanted to determine if the mRNA levels found in this study also corresponded to variations in the levels of their respective proteins. We used liver extracts to determine the levels of Coq2 and Coq7 proteins whose mRNA levels increased in mature animals, Coq4 whose mRNA decreased in old animals and Coq6 whose mRNA levels did not change along lifespan (Figure 4).
Clearly, protein levels did not correspond to the levels of mRNAs since Coq2 and Coq7 proteins did not increase in mature animals. In the case of the Coq4 protein, its levels did not decrease during aging but, on the contrary, a trend to increase was found in mature and old animals. In the case of Coq6, that did not change at the mRNA level, a clear increase in mature animals and old animals was found. In general, our determinations indicate that protein levels of these proteins do not correspond to the levels of mRNA.
3.3. Total CoQ Levels Are Not Related with the mRNA and Protein Levels of the CoQ-Synthome
We also measured the levels of CoQ9 and CoQ10 in liver, brain and gastrocnemius muscle to determine if the levels of mRNA and/or protein are indicative of the total level of CoQ in these tissues or organs (Figure 5).
CoQ9 and total levels of CoQ in brain decreased in old animals. In liver, a rise in the levels of CoQ9 and total CoQ levels were found in mature animals and maintained in old animals whereas in the case of CoQ10, the increase only was found in old animals. On the other hand, gastrocnemius muscle only showed an increase in both CoQ9 and CoQ10 levels old animals in relationship with young and mature animals.
In general, our results indicate that the levels of CoQ vary along the lifespan of the animals in a tissue and organ-dependent fashion and without any relationship with mRNA or protein levels of the members of the CoQ-synthome.
3.3. PA or RSV Modulate in Different Ways the Expression of COQ-Synthome Genes in Old Animals in an Organ-Specific Way
We also determined the effect of 2 months of PA or 6 months of RSV treatment in the expression of the different genes of the COQ-synthome in the different organs of old animals (Figure 6).
Interestingly, both PA and RSV affected in the same way the levels of mRNAs such as mCOQ10 in brain and liver. In liver, mCOQ9 also responded in the same way to both stimuli. However, mDLP1 responded to RSV with a decrease in liver whereas in brain it increased. Interestingly, in brain, mDLP1 increased after treatment with RSV whereas the mRNA of the other component of the mCOQ1 heterotetramer, mSPS1, did not show variation, indicating a different regulatory profile for both components.
In the case of kidney, only mCOQ3 responded to PA whereas the rest of genes did not show any modification in their levels in comparison with the control. In gastrocnemius muscle, PA produced a trend to increase the levels of many of the genes although this increase was not significant except in the case of gene mCOQ9. Altogether, these results indicate that the response to PA or RSV also depends on the gene and the organ.
When the response of the different genes to PA or RSV was correlated, we found that PA induced a higher positive correlation of mRNA levels in gastrocnemius muscle. In this tissue, mCOQ2, mCOQ3, mCOQ4, mCOQ5, mCOQ6, mCOQ8 and mCOQ9 showed a high correlation between them. On the other hand, mCOQ7 showed a high negative correlation with all of these genes. In the other organs, the correlation was very different depending on the organ, especially in the liver that showed strong positive and negative correlations whereas in kidney, a general positive but modest correlation was found and in brain, mSPS1 showed moderate negative correlation with the other genes similarly to the response found with RSV.
On the other hand, RSV produced a higher coordination response in brain with mDLP1, mCOQ2, mCOQ3, mCOQ4, mCOQ5, mCOQ9 and mCOQ10 showing a high and positive correlation between them whereas mSPS1 and mCOQ7 showed strong negative correlations with the other mRNAs (Figure 7).
In the other organs only fewer genes showed a similar high positive response to RSV. In kidney many of the mRNA levels positively correlated between them but the correlation was mainly low or moderate. In the liver, mCOQ9 and mCOQ10 showed a high positive correlation and mDLP1, mCOQ2 and mCOQ3 showed a low positive correlation. The rest of mRNAs showed a negative correlation with the other genes. In gastrocnemius muscle, a variety of correlations was found between the genes with the higher correlation between mCOQ4, mCOQ5 and mCOQ6 as also was found in kidney.
All these responses indicate a complex profile of regulation affecting the genes of the CoQ-synthome and that the induction of them by PA or RSV depends on the organ studied.
3.3. PA or RSV also modulate in different ways the expression of antioxidant genes in old animals in an organ-specific way.
When we analyzed the levels of mRNA of antioxidant genes, we found that the effect or PA or RSV was higher in liver than in brain. In the liver, only NRF2 mRNA levels increased with both PA and RSV whereas a trend to increase was found in mRNA of CAT and SIRT1 with PA but not with RSV. In the case of the brain, no significant changes or trends were found in any of the mRNAs studied (Figure 8)
3.3. RSV or PA Increase Levels of CoQ in an Organ-Dependent Effect
In brain, both PA and RSV significantly increased CoQ9 and CoQ10 levels reaching double the levels found in old animals (Figure 9). Interestingly, in this organ, both stimuli induced a significant increase in mCOQ10 mRNA levels (Figure 7). On the other hand, in liver, although both PA and RSV increased the mRNA levels of both mCOQ9 and mCOQ10 (Figure 7), only RSV increased the levels of CoQ9 and CoQ10 and then, total CoQ (Figure 9) whereas PA slightly decreased these levels although not significantly. Finally, only PA significantly increased CoQ9 levels without affecting CoQ10 (Figure 9). In gastrocnemius muscle, PA produces a tendency to increase the mRNA levels of many of the genes, this increase was significant with mCOQ9 (Figure 7). Probably this induction of CoQ-synthome genes affected the rise in CoQ9 found in this tissue (Figure 9).
4. Discussion
Defects in CoQ biosynthesis cause CoQ deficiency syndrome [32]. Further, CoQ levels decline in human and rodents tissues during aging and, for this reason, we can consider this decrease as a secondary CoQ-deficiency [33] in which CoQ10 supplementation can be considered as an anti-aging agent therapy [17]. In fact, CoQ10 has shown therapeutic benefits in aging-related disorders, particularly in cardiovascular, metabolic disease and chronic kidney disease [34,35,36]. On the other hand, in some animal models with particular defects in CoQ synthesis, lower levels of CoQ are associated with a longer lifespan [37], although this effect is not found in all the organs [38]. Probably, this effect is due to the maintenance of enough CoQ to maintain physiological activity and the induction of mitohormesis [39].
Our results indicate that the expression of the genes involved in CoQ synthesis shows a complex regulatory profile in which some genes are regulated in a similar way depending on the age, the tissue or organ and the treatment. Probably, this regulatory landscape responds to common regulatory factors that remain to be discovered and also the different location among the chromosomes of the different genes. The effect found in mice can be also extrapolated to human orans since the different genes involved in CoQ synthesis are also located in different chromosomes and only a few shares chromosome and location. Even the mSPS1 and mDLP1 that form a heterotetramer with two proteins of Sps1 and two of Dlp1 to synthesize the isoprenoid chain of CoQ are found in chromosome 2 and 10 respectively and mCOQ8A and B that play a similar function, are located in chromosomes 1 and 7 respectively (Table 3). The same dispersion in the localization of genes of the CoQ10-synthome can be found in humans.
Further, even genes that share chromosome and location such as mPDSS1 and mCOQ4 do not respond in the same way to aging, PA or RSV.
Our results agree with other studies carried out in mutant mice affecting CoQ synthesis or mitochondrial physiology. For example, in two mouse models of COQ9 deficiency, COQ9Q95X and COQ9R239X, COQ9Q95X mice did not produce Coq9 protein, whereas COQ9R239X produced a truncated version of this protein [40]. As in our study, these two different mutations induced different changes in the expression of the CoQ-synthome genes and at the protein levels in an organ-dependent effect. In cerebrum, the lack of the Coq9 protein did not affect COQ7, ADCK3/COQ8 or COQ5 but produced a small decrease in the COQ6 mRNA levels. This decrease was found in ADCK3/COQ8 in kidney and in ADCK3/COQ8 and COQ5 in muscle. In contrast, the truncated protein COQ9R239X did not affect the expression of any of the other CoQ-synthome genes. These results indicate that the lack of expression of one gene of the CoQ-synthome affects distinctively the expression of other genes but in an organ-dependent manner.
Further, in these COQ9-deficient models no relationship between mRNA and protein levels were found. Whereas in kidney, lack of COQ9 reduced ADCK3/COQ8 mRNA levels, the protein was increased. Coq6 protein increased whereas Coq5 protein decreased although their respective mRNA was not affected. Both the absence and the truncated form of COQ9 reduced enormously the protein levels of Coq7 in kidney and muscle. And in muscle, lack of COQ9 and the truncated form also affected Adck3/Coq8, Coq5 and Coq6 protein levels whereas only ADCK3/COQ8 and COQ5 were affected at the mRNA level [40].
Mitochondrial dysfunction is also associated with the regulation of the CoQ-synthome and the synthesis of CoQ. In five different models of OXPHOS dysfunction in heart, both transcriptome and proteome were strongly affected but the changes in protein levels did not reflect the changes at the transcriptional level [41]. In fact, among the 756 mitoproteins studied, nearly half of them changed significantly with age in control animals whereas only less than 15% of the transcripts were affected.
In mutant animals, the levels of most of the proteins involved in CoQ synthesis were severely reduced, indicating that OXPHOS dysfunction drives to CoQ deficiency. Similarly to the findings of our study, in OXPHOS-deficient mutants, many of the members of CoQ-synthesis were down-regulated but the mRNA levels of PDSS2, the ortologue of mDLP1) and ADCK3/COQ8 increased, indicating a different response of the genes to mitochondrial dysfunction [41].
All these results also agree with a previous study of our group in which high-fat diet reduced mRNA levels of all the CoQ-synthome genes whereas neither protein levels nor CoQ levels were affected [42]. Furthermore, this same lack of relationship between mRNA levels and proteins has been found in human muscle, where some proteins do not respond to the increase or decrease of mRNA [43].
We cannot discard that the secondary deficiency of CoQ found in aging activates the induction of a survival mechanism that permits to cells to adapt to the metabolic dysfunction associated with aging in a similar manner to the changes found in CoQ-primary deficiencies [44]. This would explain why the profile of old animals resembles the profile of young animals at the mRNA level.
In relationship with the levels of CoQ, some studies carried out in rats show a similar profile than in our study in which in mature animals there are a net increase in CoQ levels in comparison with young and old animals and a clear decrease is found especially in heart [45]. Thus, the decrease of CoQ levels affect especially to some organs whereas others show increase during aging and not others that increase.
Our results also indicate that PA and RSV can modulate the levels of mRNA of the different members of the CoQ-synthome in an effect that also depends on the organ. Interestingly, the main effect of PA and RSV affects mCOQ9 and mCOQ10 mRNA levels, two proteins that do not catalyze directly the modifications of the benzene ring but show regulatory and distributive functions. However, we cannot secure that these increases are reflected in a rise in protein levels. In fact, physical exercise can increase a rapid and robust increase in mRNA levels, although the debate about if these changes end in modifications at the protein levels continues [46]. In human under several sessions of high intensity interval training during 2-week intervention some of the proteins involved in metabolism respond to the mRNA modifications whereas others increased despite the absence of any increase in the respective mRNA levels, such as PPARα and γ that regulate lipid metabolism. On the other hand, mitochondrial transcript factor mtTFA was increased by exercise without the corresponding increase in protein [47,48].
Furthermore, PA and RSV increase CoQ levels in brain whereas PA affected muscle and RSV liver levels of CoQ. These results indicate that each intervention affects importantly the main organ affected, muscle in the case of PA and liver in the case of a bioactive compound such as RSV.
The use of both inducers could be important in the aging process. It has been suggested that mitochondria lose their ability to produce energy during maximal efforts during aging [49], the increase of CoQ9, the main form of CoQ in rodents and probably involved in OXPHOS activity, would improve this activity. This effect could help to improve walking performance [50] since mitochondrial function is strongly associated with muscle capacity. Probably, for this reason, high levels of CoQ10 in plasma of humans are associated with higher PA capacity in old individuals [51,52]. On the other hand, the increase found in brain could explain why old people maintaining higher PA show higher cognitive capacity than sedentary people [53].
5. Conclusions
We can conclude that the levels of mRNA of the members of the CoQ-synthome show great differences along the life of the animals. They do not present a common regulation of expression along the life of the animals and that the mRNA levels vary depending on the age and stimuli in an organ-dependent response. Probably, the expression of these genes responds to different levels of regulation affecting mitochondrial turnover, mtUPR, regulation of mRNA lifespan and the lifespan of the CoQ product. Clearly, the level of mRNA of these genes does not represent the protein level in the tissue or organ or the levels of the product, CoQ.
Our results indicate that the behavior of the enzymes involved in the synthesis of CoQ and the CoQ levels cannot be extrapolated by the levels of mRNAs of the genes that codify these enzymes. A more complete study must be done including protein levels and CoQ levels.
Author Contributions
Conceptualization, G.L.-L., P.N.; methodology, C.M.-T., I. R-T, T.B.T., C. C-S., E.R.-B. G.L.-L; validation, E.R.-B, P.N., G.L.-L; formal analysis, C.M.-T., I. R-T, T.B.T., C. C-S., .R.-B. G.L.-L; investigation, C.M.-T., I. R-T, T.B.T., C. C-S., E.R.-B. G.L.-L; writing—original draft preparation, G.L.-L.; writing—review and editing, all the authors. All authors have read and agreed to the published version of the manuscript.
Funding
This study has been financed by the PAIDI program of the Junta de Andalucia-FEDER for the group BIO-177 and the DEP2012-39985 grant from the Ministerio de Economía y Competitividad, Spanish Government.
Conflicts of Interest
The authors declare no conflicts of interest.
Abbreviations
The following abbreviations are used in this manuscript:
| CAT | Catalase |
| CoQ | Coenzyme Q |
| COQ | Gene of the CoQ-synthome |
| CYTB5R | Cytochrome b5 reductase |
| FSP1 | Ferroptosis suppressor protein 1 |
| GPX | Glutathione peroxidase |
| NQO1 | NAD(P)H quinone dehydrogenase |
| OXPHOS | Oxidative phosphorylation |
| NRF2 | Nuclear factor erythroid 2-related protein 2 |
| PA | Physical activity |
| RSV | Resveratrol |
References
- Fernandez-Ayala, D.J.; Brea-Calvo, G.; Lopez-Lluch, G.; Navas, P. Coenzyme Q distribution in HL-60 human cells depends on the endomembrane system. Biochim Biophys Acta 2005, 1713, 129–137. [Google Scholar] [CrossRef] [PubMed]
- Wang, Y.; Lilienfeldt, N.; Hekimi, S. Understanding coenzyme Q. Physiol Rev 2024, 104, 1533–1610. [Google Scholar] [CrossRef] [PubMed]
- Staiano, C.; Garcia-Corzo, L.; Mantle, D.; Turton, N.; Millichap, L.E.; Brea-Calvo, G.; Hargreaves, I. Biosynthesis, Deficiency, and Supplementation of Coenzyme Q. Antioxidants (Basel) 2023, 12. [Google Scholar] [CrossRef]
- Alcazar-Fabra, M.; Navas, P.; Brea-Calvo, G. Coenzyme Q biosynthesis and its role in the respiratory chain structure. Biochim Biophys Acta 2016, 1857, 1073–1078. [Google Scholar] [CrossRef] [PubMed]
- Turunen, M.; Olsson, J.; Dallner, G. Metabolism and function of coenzyme Q. Biochim Biophys Acta 2004, 1660, 171–199. [Google Scholar] [CrossRef]
- Loffler, M.; Jockel, J.; Schuster, G.; Becker, C. Dihydroorotat-ubiquinone oxidoreductase links mitochondria in the biosynthesis of pyrimidine nucleotides. Mol Cell Biochem 1997, 174, 125–129. [Google Scholar] [CrossRef]
- Gonzalez-Garcia, P.; Hidalgo-Gutierrez, A.; Mascaraque, C.; Barriocanal-Casado, E.; Bakkali, M.; Ziosi, M.; Abdihankyzy, U.B.; Sanchez-Hernandez, S.; Escames, G.; Prokisch, H.; et al. Coenzyme Q10 modulates sulfide metabolism and links the mitochondrial respiratory chain to pathways associated to one carbon metabolism. Hum Mol Genet 2020, 29, 3296–3311. [Google Scholar] [CrossRef]
- Hernandez-Camacho, J.D.; Bernier, M.; Lopez-Lluch, G.; Navas, P. Coenzyme Q10 Supplementation in Aging and Disease. Front Physiol 2018, 9, 44. [Google Scholar] [CrossRef]
- Lopez-Lluch, G.; Rodriguez-Aguilera, J.C.; Santos-Ocana, C.; Navas, P. Is coenzyme Q a key factor in aging? Mech Ageing Dev 2010, 131, 225–235. [Google Scholar] [CrossRef]
- Bello, R.I.; Kagan, V.E.; Tyurin, V.; Navarro, F.; Alcain, F.J.; Villalba, J.M. Regeneration of lipophilic antioxidants by NAD(P)H:quinone oxidoreductase 1. Protoplasma 2003, 221, 129–135. [Google Scholar] [CrossRef]
- Doll, S.; Freitas, F.P.; Shah, R.; Aldrovandi, M.; da Silva, M.C.; Ingold, I.; Grocin, A.G.; Xavier da Silva, T.N.; Panzilius, E.; Scheel, C.H.; et al. FSP1 is a glutathione-independent ferroptosis suppressor. Nature 2019, 575, 693–698. [Google Scholar] [CrossRef] [PubMed]
- Arroyo, A.; Kagan, V.E.; Tyurin, V.A.; Burgess, J.R.; de Cabo, R.; Navas, P.; Villalba, J.M. NADH and NADPH-dependent reduction of coenzyme Q at the plasma membrane. Antioxid Redox Signal 2000, 2, 251–262. [Google Scholar] [CrossRef] [PubMed]
- Takahashi, T.; Mine, Y.; Okamoto, T. Extracellular coenzyme Q10 (CoQ10) is reduced to ubiquinol-10 by intact Hep G2 cells independent of intracellular CoQ10 reduction. Arch Biochem Biophys 2019, 672, 108067. [Google Scholar] [CrossRef]
- Bentinger, M.; Tekle, M.; Dallner, G. Coenzyme Q--biosynthesis and functions. Biochem Biophys Res Commun 2010, 396, 74–79. [Google Scholar] [CrossRef]
- Aguilaniu, H.; Durieux, J.; Dillin, A. Metabolism, ubiquinone synthesis, and longevity. Genes Dev 2005, 19, 2399–2406. [Google Scholar] [CrossRef] [PubMed]
- Kalen, A.; Appelkvist, E.L.; Dallner, G. Age-related changes in the lipid compositions of rat and human tissues. Lipids 1989, 24, 579–584. [Google Scholar] [CrossRef]
- Gasmi, A.; Bjorklund, G.; Mujawdiya, P.K.; Semenova, Y.; Piscopo, S.; Peana, M. Coenzyme Q(10) in aging and disease. Crit Rev Food Sci Nutr 2024, 64, 3907–3919. [Google Scholar] [CrossRef]
- Hosseini, L.; Majdi, A.; Sadigh-Eteghad, S.; Farajdokht, F.; Ziaee, M.; Rahigh Aghsan, S.; Farzipour, M.; Mahmoudi, J. Coenzyme Q10 ameliorates aging-induced memory deficits via modulation of apoptosis, oxidative stress, and mitophagy in aged rats. Exp Gerontol 2022, 168, 111950. [Google Scholar] [CrossRef]
- Hargreaves, I.P.; Mantle, D. Coenzyme Q10 Supplementation in Fibrosis and Aging. Adv Exp Med Biol 2019, 1178, 103–112. [Google Scholar] [CrossRef]
- Cascajo, M.V.; Abdelmohsen, K.; Noh, J.H.; Fernandez-Ayala, D.J.; Willers, I.M.; Brea, G.; Lopez-Lluch, G.; Valenzuela-Villatoro, M.; Cuezva, J.M.; Gorospe, M.; et al. RNA-binding proteins regulate cell respiration and coenzyme Q biosynthesis by post-transcriptional regulation of COQ7. RNA Biol 2016, 13, 622–634. [Google Scholar] [CrossRef]
- Spinazzi, M.; Radaelli, E.; Horre, K.; Arranz, A.M.; Gounko, N.V.; Agostinis, P.; Maia, T.M.; Impens, F.; Morais, V.A.; Lopez-Lluch, G.; et al. PARL deficiency in mouse causes Complex III defects, coenzyme Q depletion, and Leigh-like syndrome. Proc Natl Acad Sci U S A 2019, 116, 277–286. [Google Scholar] [CrossRef] [PubMed]
- Stefely, J.A.; Pagliarini, D.J. Biochemistry of Mitochondrial Coenzyme Q Biosynthesis. Trends Biochem Sci 2017, 42, 824–843. [Google Scholar] [CrossRef]
- Tung, B.T.; Rodriguez-Bies, E.; Thanh, H.N.; Le-Thi-Thu, H.; Navas, P.; Sanchez, V.M.; Lopez-Lluch, G. Organ and tissue-dependent effect of resveratrol and exercise on antioxidant defenses of old mice. Aging Clin Exp Res 2015, 27, 775–783. [Google Scholar] [CrossRef] [PubMed]
- Tung, B.T.; Rodriguez-Bies, E.; Talero, E.; Gamero-Estevez, E.; Motilva, V.; Navas, P.; Lopez-Lluch, G. Anti-inflammatory effect of resveratrol in old mice liver. Exp Gerontol 2015, 64, 1–7. [Google Scholar] [CrossRef] [PubMed]
- Tung, B.T.; Rodriguez-Bies, E.; Ballesteros-Simarro, M.; Motilva, V.; Navas, P.; Lopez-Lluch, G. Modulation of endogenous antioxidant activity by resveratrol and exercise in mouse liver is age dependent. J Gerontol A Biol Sci Med Sci 2014, 69, 398–409. [Google Scholar] [CrossRef]
- Rodriguez-Bies, E.; Navas, P.; Lopez-Lluch, G. Age-dependent effect of every-other-day feeding and aerobic exercise in ubiquinone levels and related antioxidant activities in mice muscle. J Gerontol A Biol Sci Med Sci 2015, 70, 33–43. [Google Scholar] [CrossRef]
- Baur, J.A.; Pearson, K.J.; Price, N.L.; Jamieson, H.A.; Lerin, C.; Kalra, A.; Prabhu, V.V.; Allard, J.S.; Lopez-Lluch, G.; Lewis, K.; et al. Resveratrol improves health and survival of mice on a high-calorie diet. Nature 2006, 444, 337–342. [Google Scholar] [CrossRef]
- Lagouge, M.; Argmann, C.; Gerhart-Hines, Z.; Meziane, H.; Lerin, C.; Daussin, F.; Messadeq, N.; Milne, J.; Lambert, P.; Elliott, P.; et al. Resveratrol improves mitochondrial function and protects against metabolic disease by activating SIRT1 and PGC-1alpha. Cell 2006, 127, 1109–1122. [Google Scholar] [CrossRef]
- Rodriguez-Bies, E.; Tung, B.T.; Navas, P.; Lopez-Lluch, G. Resveratrol primes the effects of physical activity in old mice. Br J Nutr 2016, 116, 979–988. [Google Scholar] [CrossRef]
- Xie, F.; Wang, J.; Zhang, B. RefFinder: a web-based tool for comprehensively analyzing and identifying reference genes. Funct Integr Genomics 2023, 23, 125. [Google Scholar] [CrossRef]
- Rodriguez-Aguilera, J.C.; Cortes, A.B.; Fernandez-Ayala, D.J.; Navas, P. Biochemical Assessment of Coenzyme Q(10) Deficiency. J Clin Med 2017, 6. [Google Scholar] [CrossRef] [PubMed]
- Alcázar-Fabra, M.; Rodríguez-Sánchez, F.; Trevisson, E.; Brea-Calvo, G. Primary Coenzyme Q deficiencies: A literature review and online platform of clinical features to uncover genotype-phenotype correlations. Free Radical Biology and Medicine 2021, 167, 141–180. [Google Scholar] [CrossRef]
- Navas, P.; Cascajo, M.V.; Alcazar-Fabra, M.; Hernandez-Camacho, J.D.; Sanchez-Cuesta, A.; Rodriguez, A.B.C.; Ballesteros-Simarro, M.; Arroyo-Luque, A.; Rodriguez-Aguilera, J.C.; Fernandez-Ayala, D.J.M.; et al. Secondary CoQ(10) deficiency, bioenergetics unbalance in disease and aging. Biofactors 2021, 47, 551–569. [Google Scholar] [CrossRef] [PubMed]
- Opstad, T.B.; Alexander, J.; Aaseth, J.O.; Larsson, A.; Seljeflot, I.; Alehagen, U. Selenium and Coenzyme Q(10) Intervention Prevents Telomere Attrition, with Association to Reduced Cardiovascular Mortality-Sub-Study of a Randomized Clinical Trial. Nutrients 2022, 14. [Google Scholar] [CrossRef]
- Vrentzos, E.; Ikonomidis, I.; Pavlidis, G.; Katogiannis, K.; Korakas, E.; Kountouri, A.; Pliouta, L.; Michalopoulou, E.; Pelekanou, E.; Boumpas, D.; et al. Six-month supplementation with high dose coenzyme Q10 improves liver steatosis, endothelial, vascular and myocardial function in patients with metabolic-dysfunction associated steatotic liver disease: a randomized double-blind, placebo-controlled trial. Cardiovasc Diabetol 2024, 23, 245. [Google Scholar] [CrossRef]
- Bakhshayeshkaram, M.; Lankarani, K.B.; Mirhosseini, N.; Tabrizi, R.; Akbari, M.; Dabbaghmanesh, M.H.; Asemi, Z. The Effects of Coenzyme Q10 Supplementation on Metabolic Profiles of Patients with Chronic Kidney Disease: A Systematic Review and Meta-analysis of Randomized Controlled Trials. Curr Pharm Des 2018, 24, 3710–3723. [Google Scholar] [CrossRef] [PubMed]
- Diaz-Casado, M.E.; Quiles, J.L.; Barriocanal-Casado, E.; Gonzalez-Garcia, P.; Battino, M.; Lopez, L.C.; Varela-Lopez, A. The Paradox of Coenzyme Q(10) in Aging. Nutrients 2019, 11. [Google Scholar] [CrossRef]
- Rodriguez-Hidalgo, M.; Luna-Sanchez, M.; Hidalgo-Gutierrez, A.; Barriocanal-Casado, E.; Mascaraque, C.; Acuna-Castroviejo, D.; Rivera, M.; Escames, G.; Lopez, L.C. Reduction in the levels of CoQ biosynthetic proteins is related to an increase in lifespan without evidence of hepatic mitohormesis. Sci Rep 2018, 8, 14013. [Google Scholar] [CrossRef]
- Marcheggiani, F.; Cirilli, I.; Orlando, P.; Silvestri, S.; Vogelsang, A.; Knott, A.; Blatt, T.; Weise, J.M.; Tiano, L. Modulation of Coenzyme Q(10) content and oxidative status in human dermal fibroblasts using HMG-CoA reductase inhibitor over a broad range of concentrations. From mitohormesis to mitochondrial dysfunction and accelerated aging. Aging (Albany NY) 2019, 11, 2565–2582. [Google Scholar] [CrossRef]
- Luna-Sanchez, M.; Diaz-Casado, E.; Barca, E.; Tejada, M.A.; Montilla-Garcia, A.; Cobos, E.J.; Escames, G.; Acuna-Castroviejo, D.; Quinzii, C.M.; Lopez, L.C. The clinical heterogeneity of coenzyme Q10 deficiency results from genotypic differences in the Coq9 gene. EMBO Mol Med 2015, 7, 670–687. [Google Scholar] [CrossRef]
- Kuhl, I.; Miranda, M.; Atanassov, I.; Kuznetsova, I.; Hinze, Y.; Mourier, A.; Filipovska, A.; Larsson, N.G. Transcriptomic and proteomic landscape of mitochondrial dysfunction reveals secondary coenzyme Q deficiency in mammals. Elife 2017, 6. [Google Scholar] [CrossRef] [PubMed]
- Meza-Torres, C.; Hernandez-Camacho, J.D.; Cortes-Rodriguez, A.B.; Fang, L.; Bui Thanh, T.; Rodriguez-Bies, E.; Navas, P.; Lopez-Lluch, G. Resveratrol Regulates the Expression of Genes Involved in CoQ Synthesis in Liver in Mice Fed with High Fat Diet. Antioxidants (Basel) 2020, 9. [Google Scholar] [CrossRef] [PubMed]
- Bishop, D.J.; Hoffman, N.J.; Taylor, D.F.; Saner, N.J.; Lee, M.J.; Hawley, J.A. Discordant skeletal muscle gene and protein responses to exercise. Trends Biochem Sci 2023, 48, 927–936. [Google Scholar] [CrossRef] [PubMed]
- Fernandez-Ayala, D.J.; Guerra, I.; Jimenez-Gancedo, S.; Cascajo, M.V.; Gavilan, A.; Dimauro, S.; Hirano, M.; Briones, P.; Artuch, R.; De Cabo, R.; et al. Survival transcriptome in the coenzyme Q10 deficiency syndrome is acquired by epigenetic modifications: a modelling study for human coenzyme Q10 deficiencies. BMJ Open 2013, 3. [Google Scholar] [CrossRef]
- Beyer, R.E.; Burnett, B.A.; Cartwright, K.J.; Edington, D.W.; Falzon, M.J.; Kreitman, K.R.; Kuhn, T.W.; Ramp, B.J.; Rhee, S.Y.; Rosenwasser, M.J.; et al. Tissue coenzyme Q (ubiquinone) and protein concentrations over the life span of the laboratory rat. Mech Ageing Dev 1985, 32, 267–281. [Google Scholar] [CrossRef]
- Perry, C.G.; Lally, J.; Holloway, G.P.; Heigenhauser, G.J.; Bonen, A.; Spriet, L.L. Repeated transient mRNA bursts precede increases in transcriptional and mitochondrial proteins during training in human skeletal muscle. J Physiol 2010, 588, 4795–4810. [Google Scholar] [CrossRef]
- Bonafiglia, J.T.; Edgett, B.A.; Baechler, B.L.; Nelms, M.W.; Simpson, C.A.; Quadrilatero, J.; Gurd, B.J. Acute upregulation of PGC-1alpha mRNA correlates with training-induced increases in SDH activity in human skeletal muscle. Appl Physiol Nutr Metab 2017, 42, 656–666. [Google Scholar] [CrossRef]
- Brandt, N.; Dethlefsen, M.M.; Bangsbo, J.; Pilegaard, H. PGC-1alpha and exercise intensity dependent adaptations in mouse skeletal muscle. PLoS One 2017, 12, e0185993. [Google Scholar] [CrossRef]
- Gonzalez-Freire, M.; Adelnia, F.; Moaddel, R.; Ferrucci, L. Searching for a mitochondrial root to the decline in muscle function with ageing. J Cachexia Sarcopenia Muscle 2018, 9, 435–440. [Google Scholar] [CrossRef]
- Zane, A.C.; Reiter, D.A.; Shardell, M.; Cameron, D.; Simonsick, E.M.; Fishbein, K.W.; Studenski, S.A.; Spencer, R.G.; Ferrucci, L. Muscle strength mediates the relationship between mitochondrial energetics and walking performance. Aging Cell 2017, 16, 461–468. [Google Scholar] [CrossRef]
- de la Bella-Garzon, R.; Fernandez-Portero, C.; Alarcon, D.; Amian, J.G.; Lopez-Lluch, G. Levels of Plasma Coenzyme Q(10) Are Associated with Physical Capacity and Cardiovascular Risk in the Elderly. Antioxidants (Basel) 2022, 11. [Google Scholar] [CrossRef]
- Del Pozo-Cruz, J.; Rodriguez-Bies, E.; Ballesteros-Simarro, M.; Navas-Enamorado, I.; Tung, B.T.; Navas, P.; Lopez-Lluch, G. Physical activity affects plasma coenzyme Q10 levels differently in young and old humans. Biogerontology 2014, 15, 199–211. [Google Scholar] [CrossRef] [PubMed]
- Fernandez-Portero, C.; Amian, J.G.; Bella, R.; Lopez-Lluch, G.; Alarcon, D. Coenzyme Q10 Levels Associated With Cognitive Functioning and Executive Function in Older Adults. J Gerontol A Biol Sci Med Sci 2023, 78, 1–8. [Google Scholar] [CrossRef] [PubMed]
Figure 1.
mRNA levels of COQ-genes in different organs along lifespan of mice. Data represent the mean ± SD of the levels of mRNA of the genes considering as reference the levels found in young animals and using as housekeeping gene, β-actin. Significative differences between the three age groups are indicated: * p<0.05; ** p>0.01; *** p<0.001; *** p>0.0001.
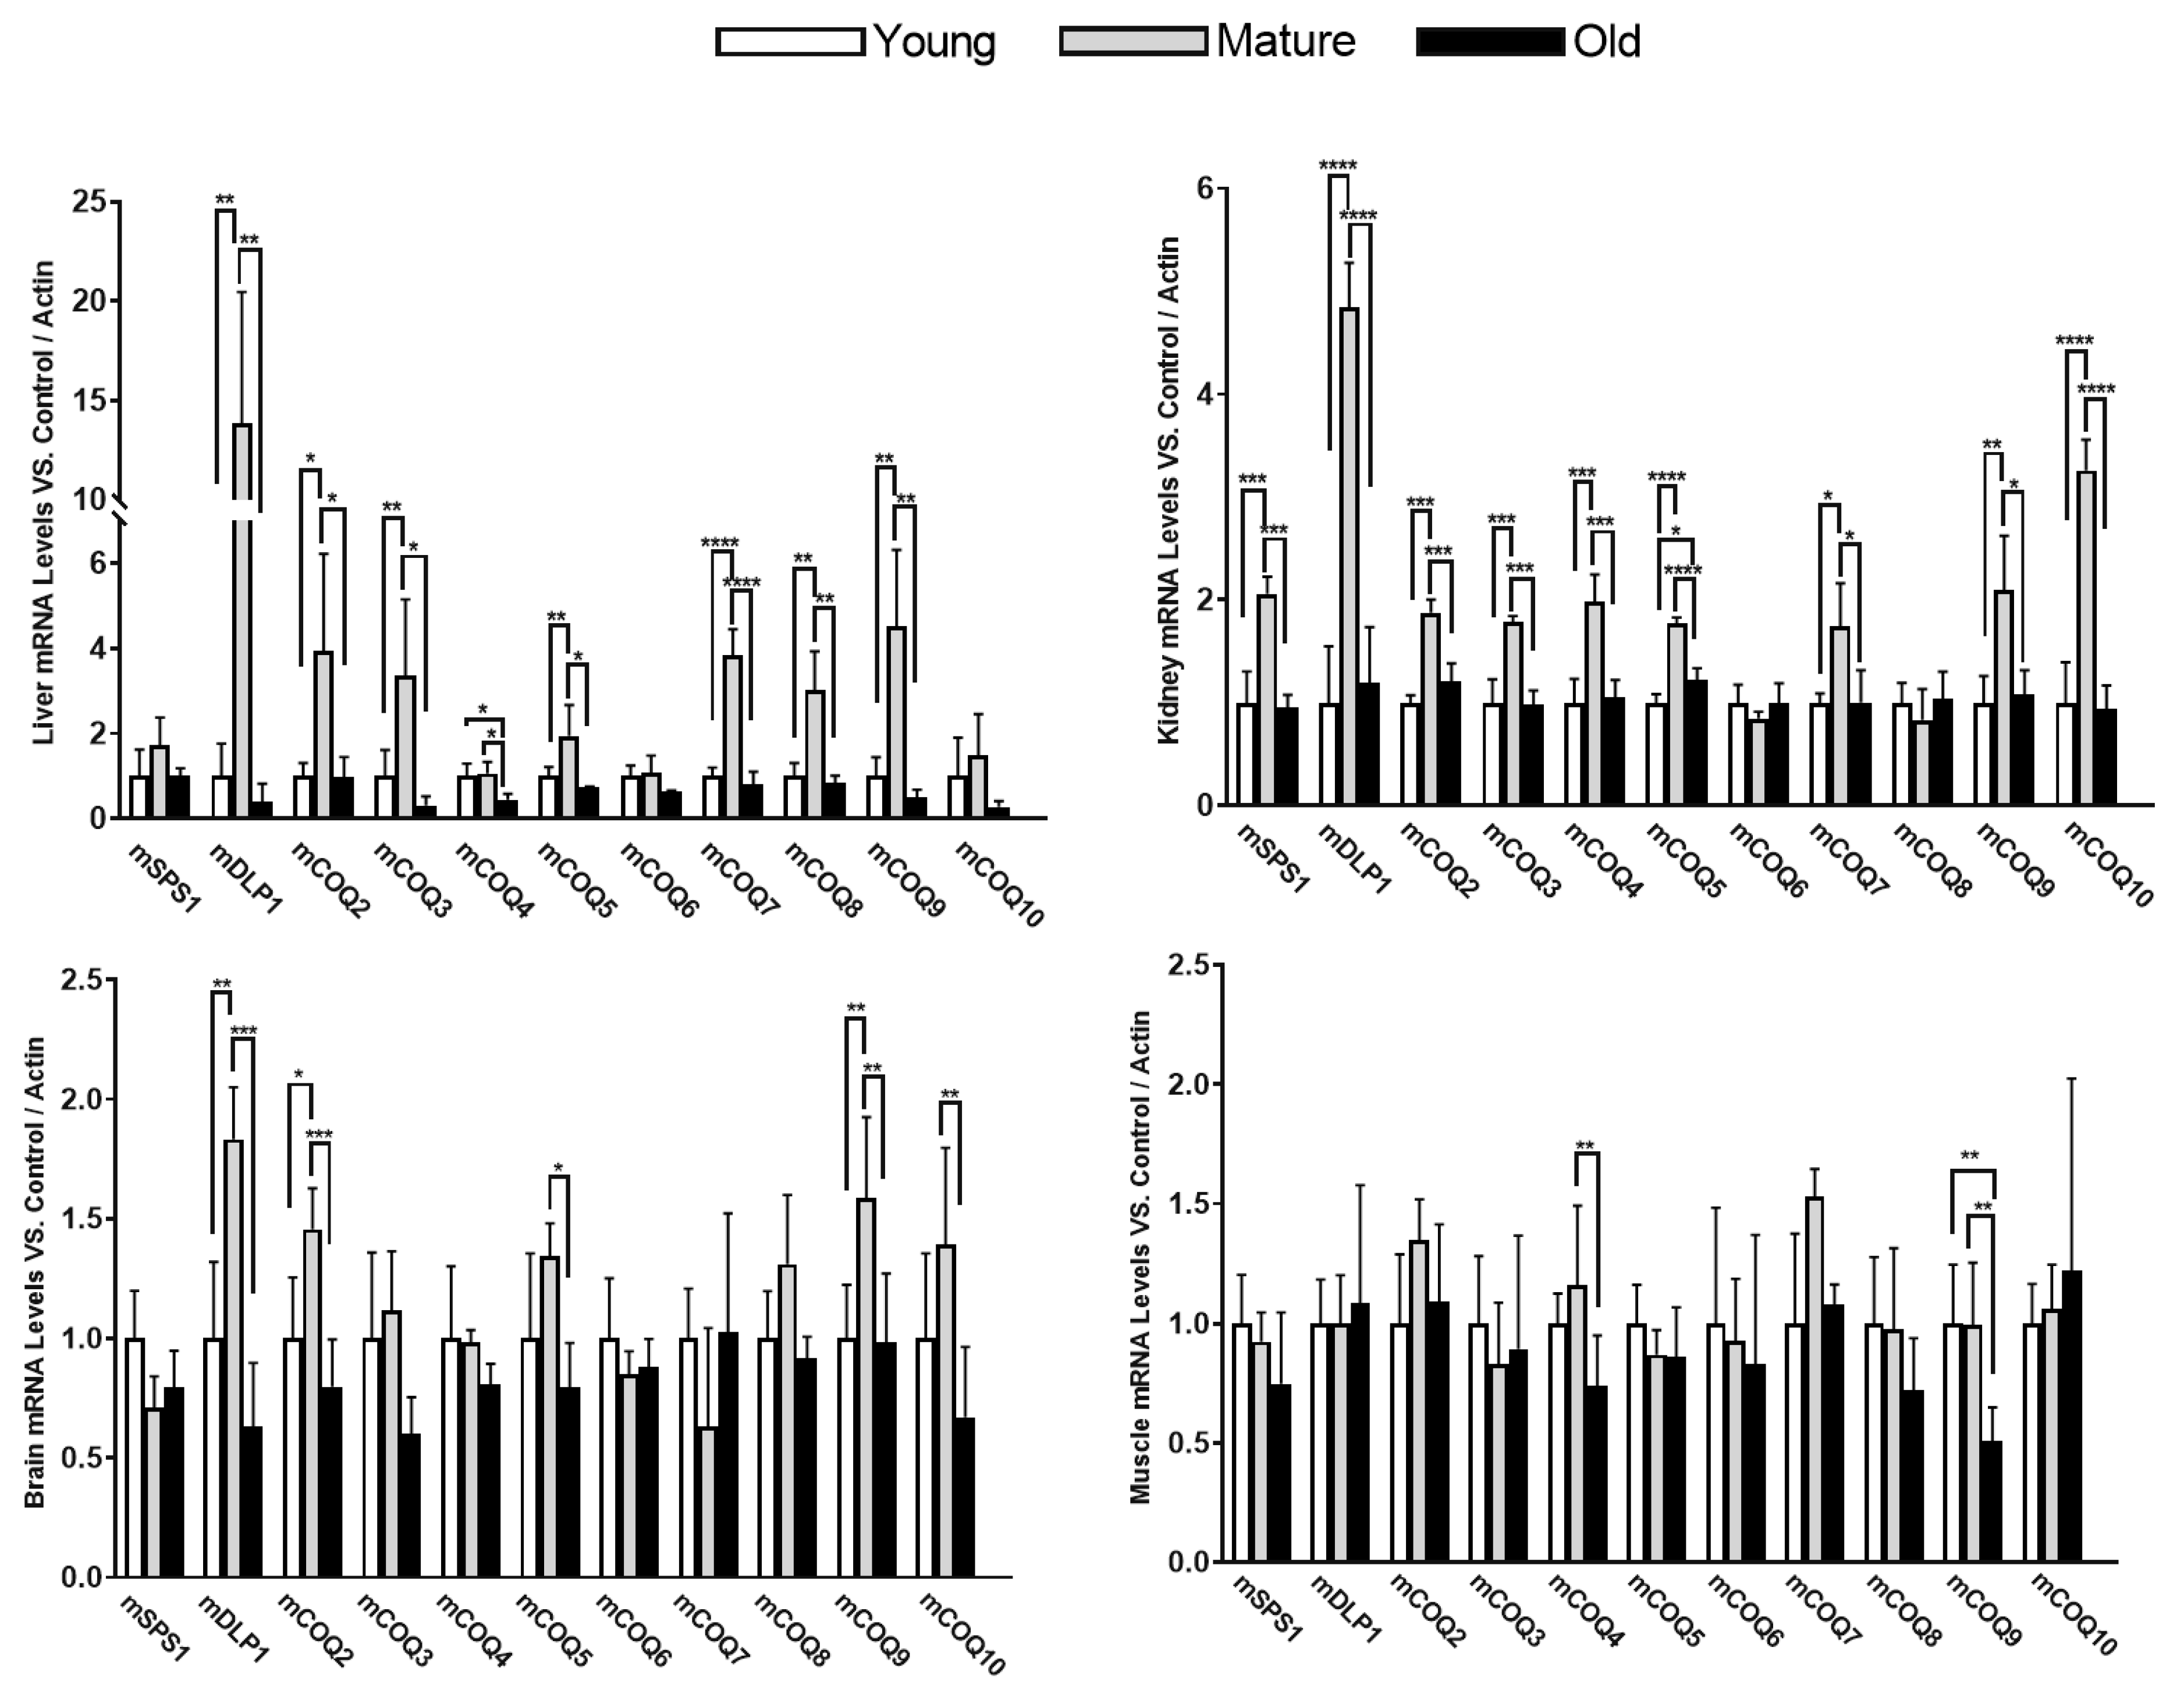
Figure 2.
Correlation between the different COQ-genes in different organs along lifespan of mice. Data represent the level of positive correlation (blue) or negative correlation (red) among the different genes in the different organs.
Figure 2.
Correlation between the different COQ-genes in different organs along lifespan of mice. Data represent the level of positive correlation (blue) or negative correlation (red) among the different genes in the different organs.
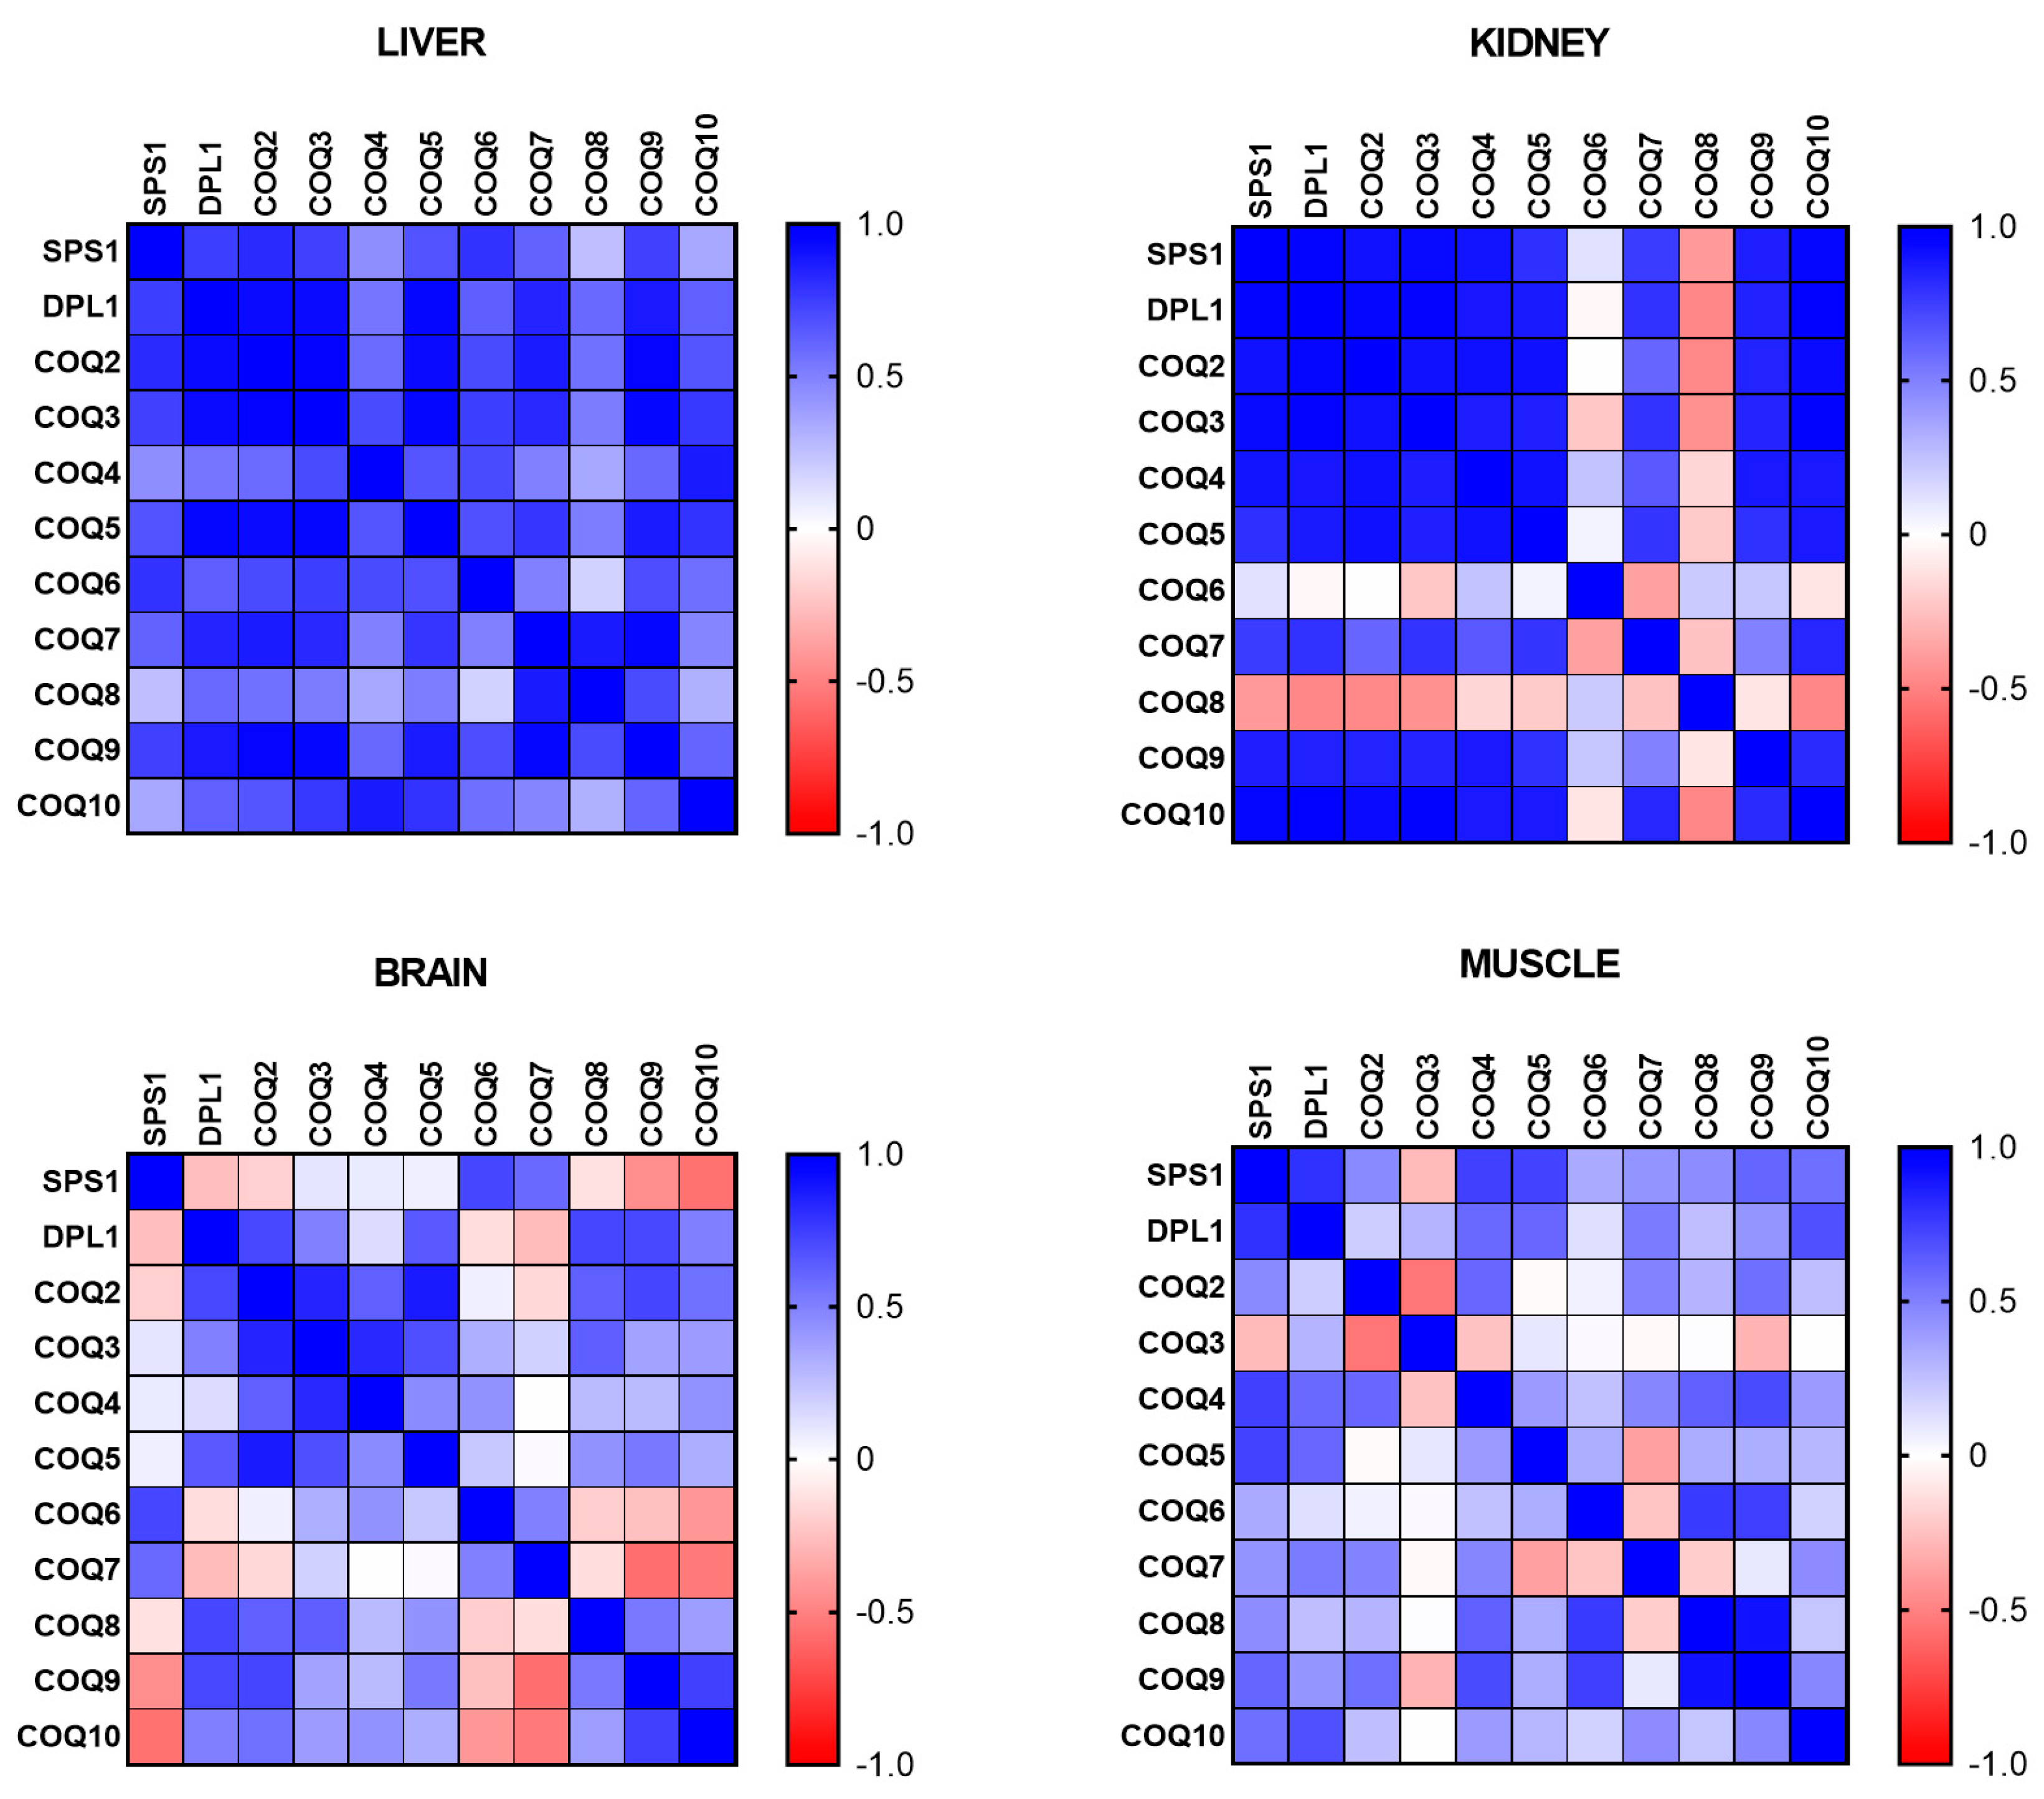
Figure 3.
mRNA levels of antioxidant in different organs along lifespan of mice. Data represents the mean ± SD of the levels of mRNA of the genes considering as reference the levels found in young animals and using as housekeeping gene, β-actin. Significative differences between the three ages are indicated: * p<0.05; ** p>0.01; *** p<0.001; *** p>0.0001.
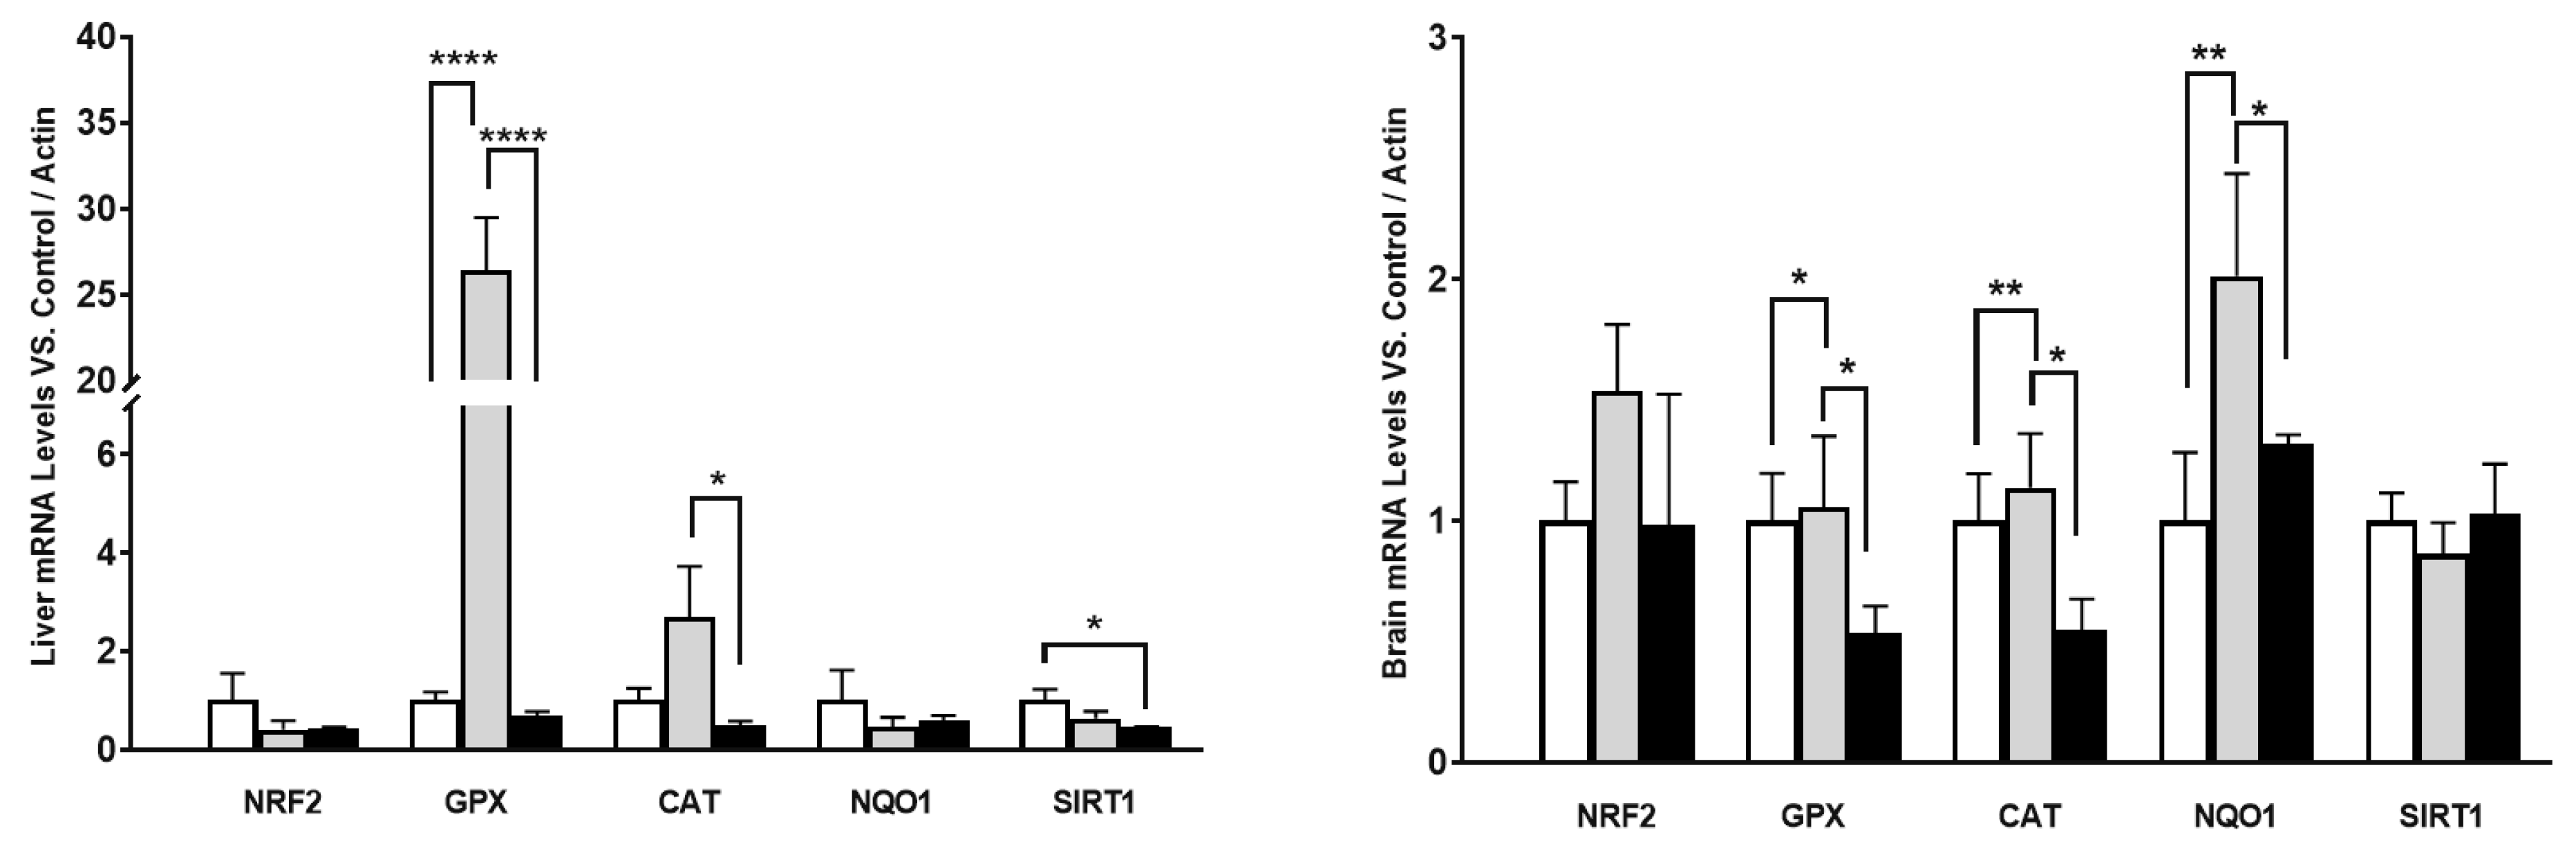
Figure 4.
Liver CoQ-synthome protein levels along lifespan of mice. Representative WBs of Coq2, Coq4, Coq6 and Coq7 proteins in whole extract visualized by Red Ponceau staining. Quantification of WBs in reference to total loading is indicated as the mean ± SD considering as reference the levels found in young animals (n=4 per group). Significative differences between the three ages are indicated: * p<0.05.
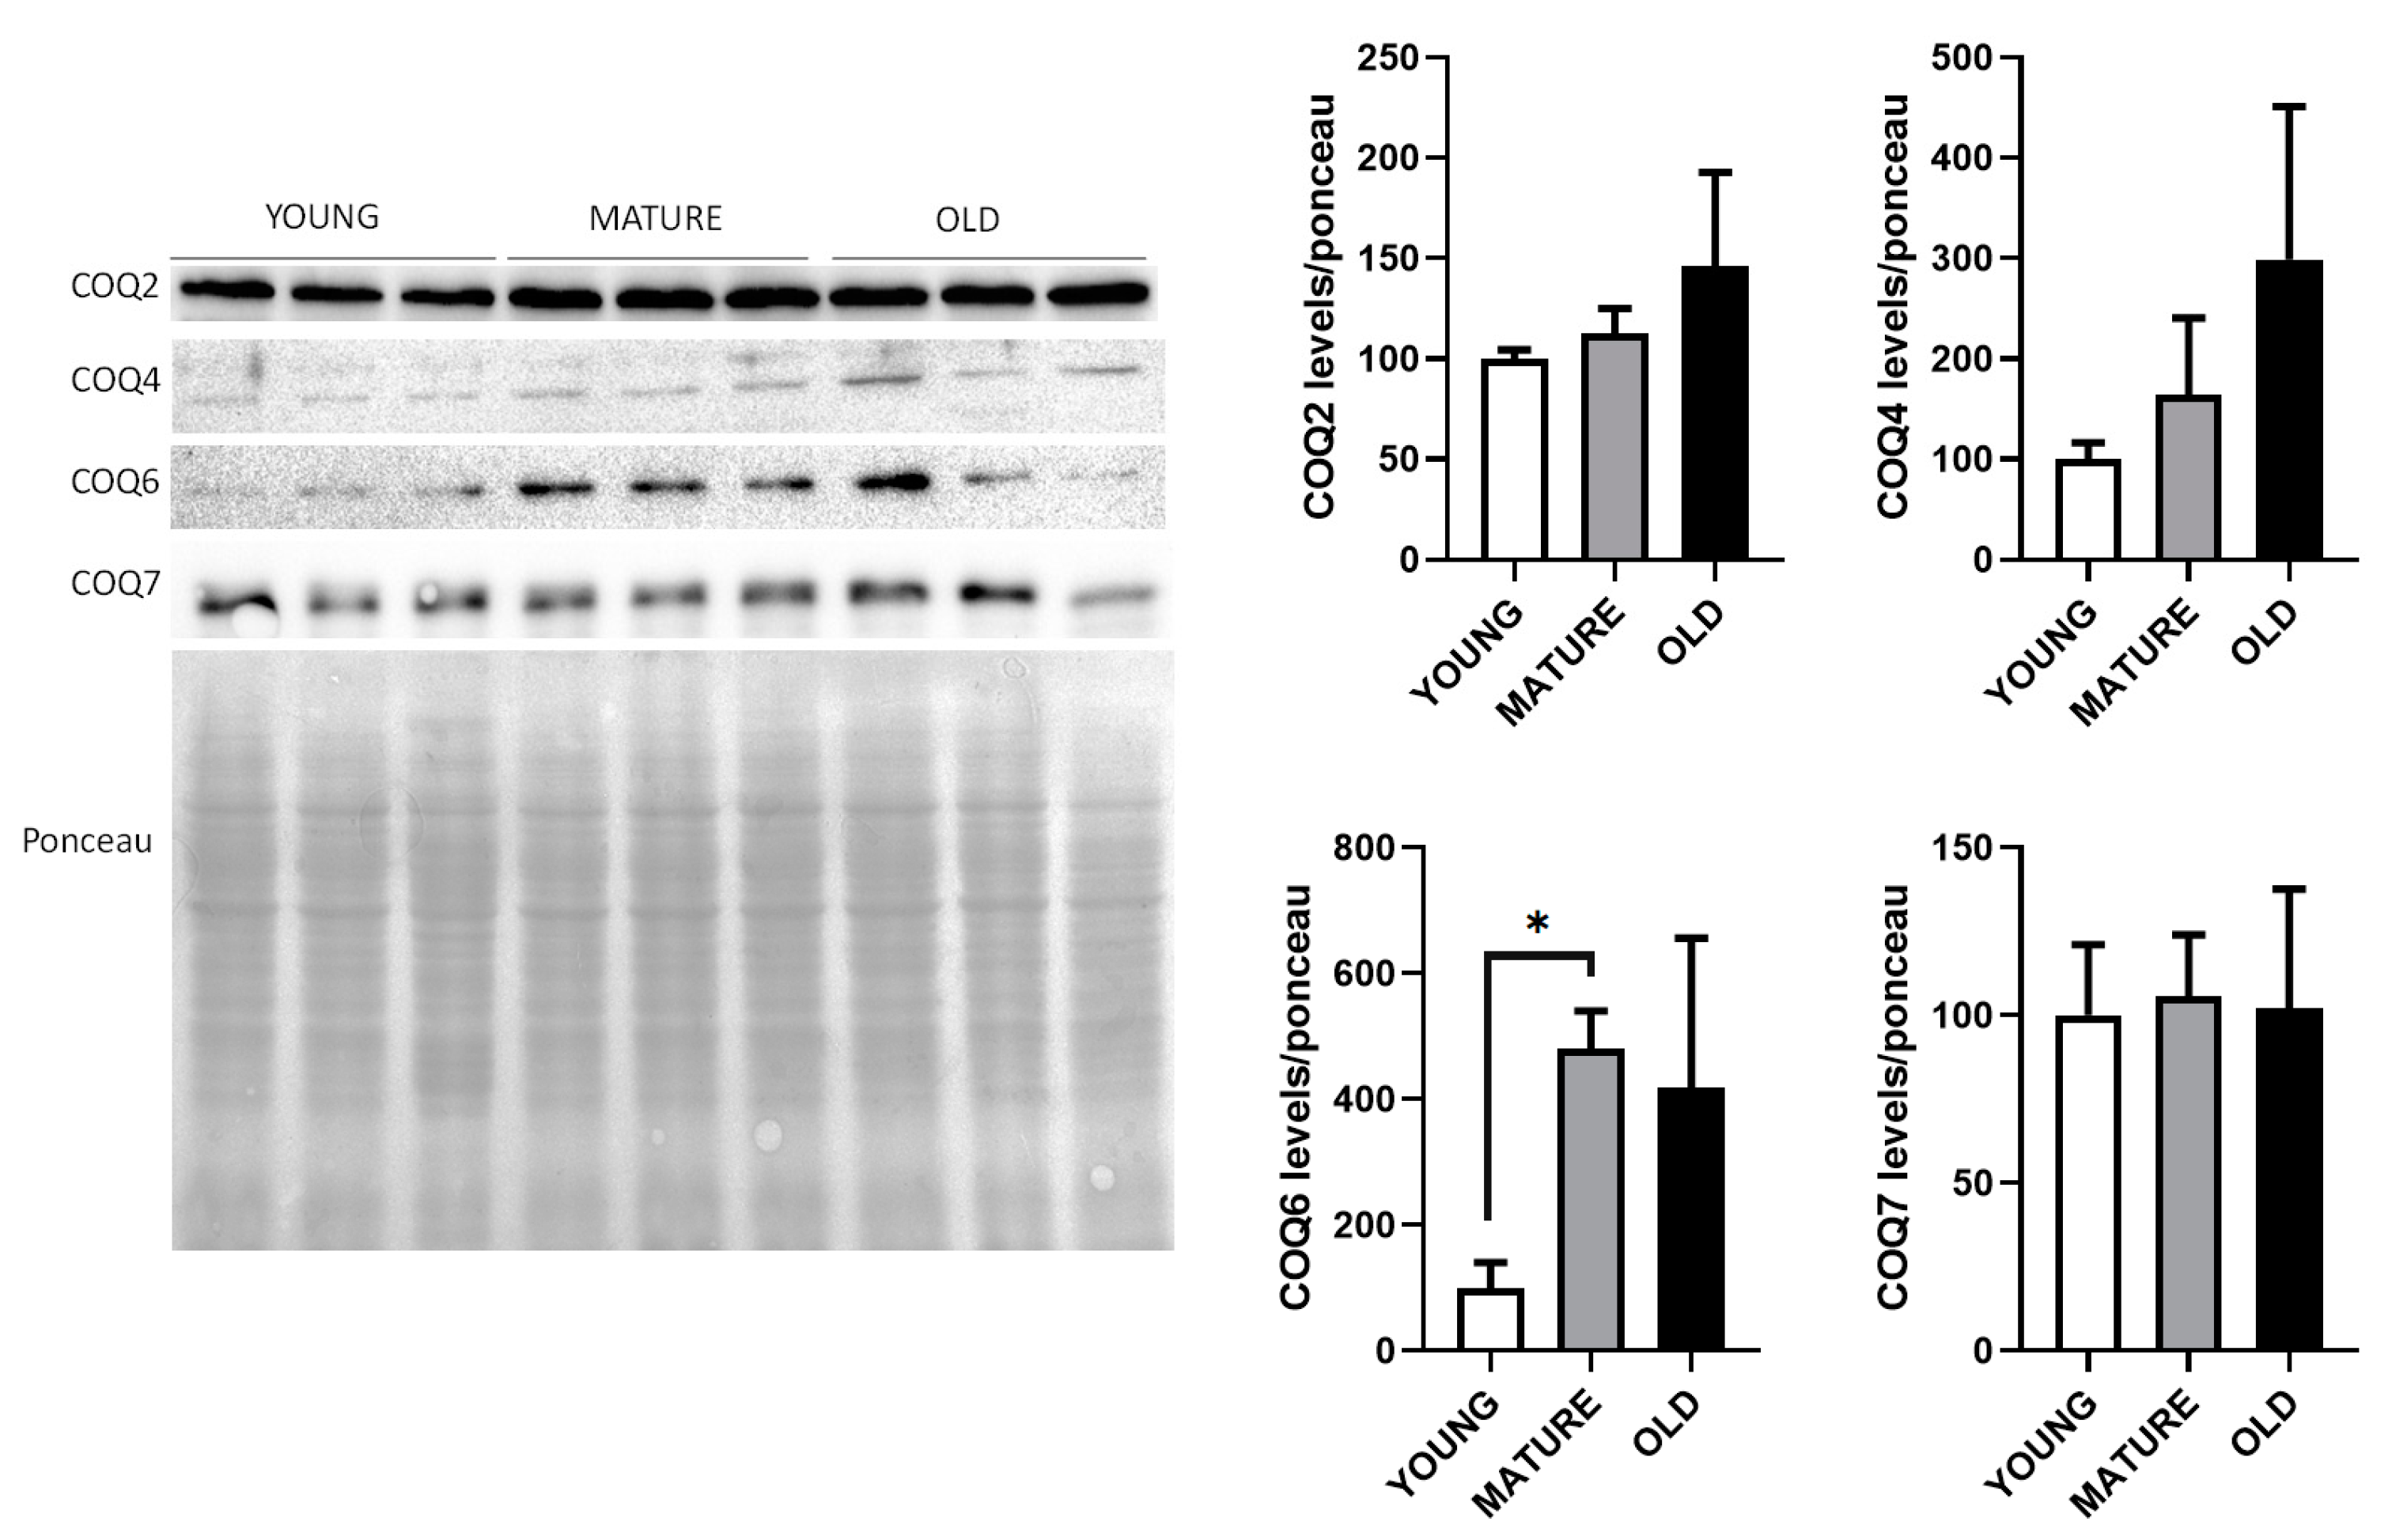
Figure 5.
CoQ levels in brain, liver and gastrocnemius muscle along lifespan. Results indicate the mean ± SD of CoQ9 and CoQ10 in reference to mg of protein of total brain, liver and gastrocnemius muscle (n=4). Significative differences between the three age group are indicated: * p<0.05; p>0.01; *** p<0.001.
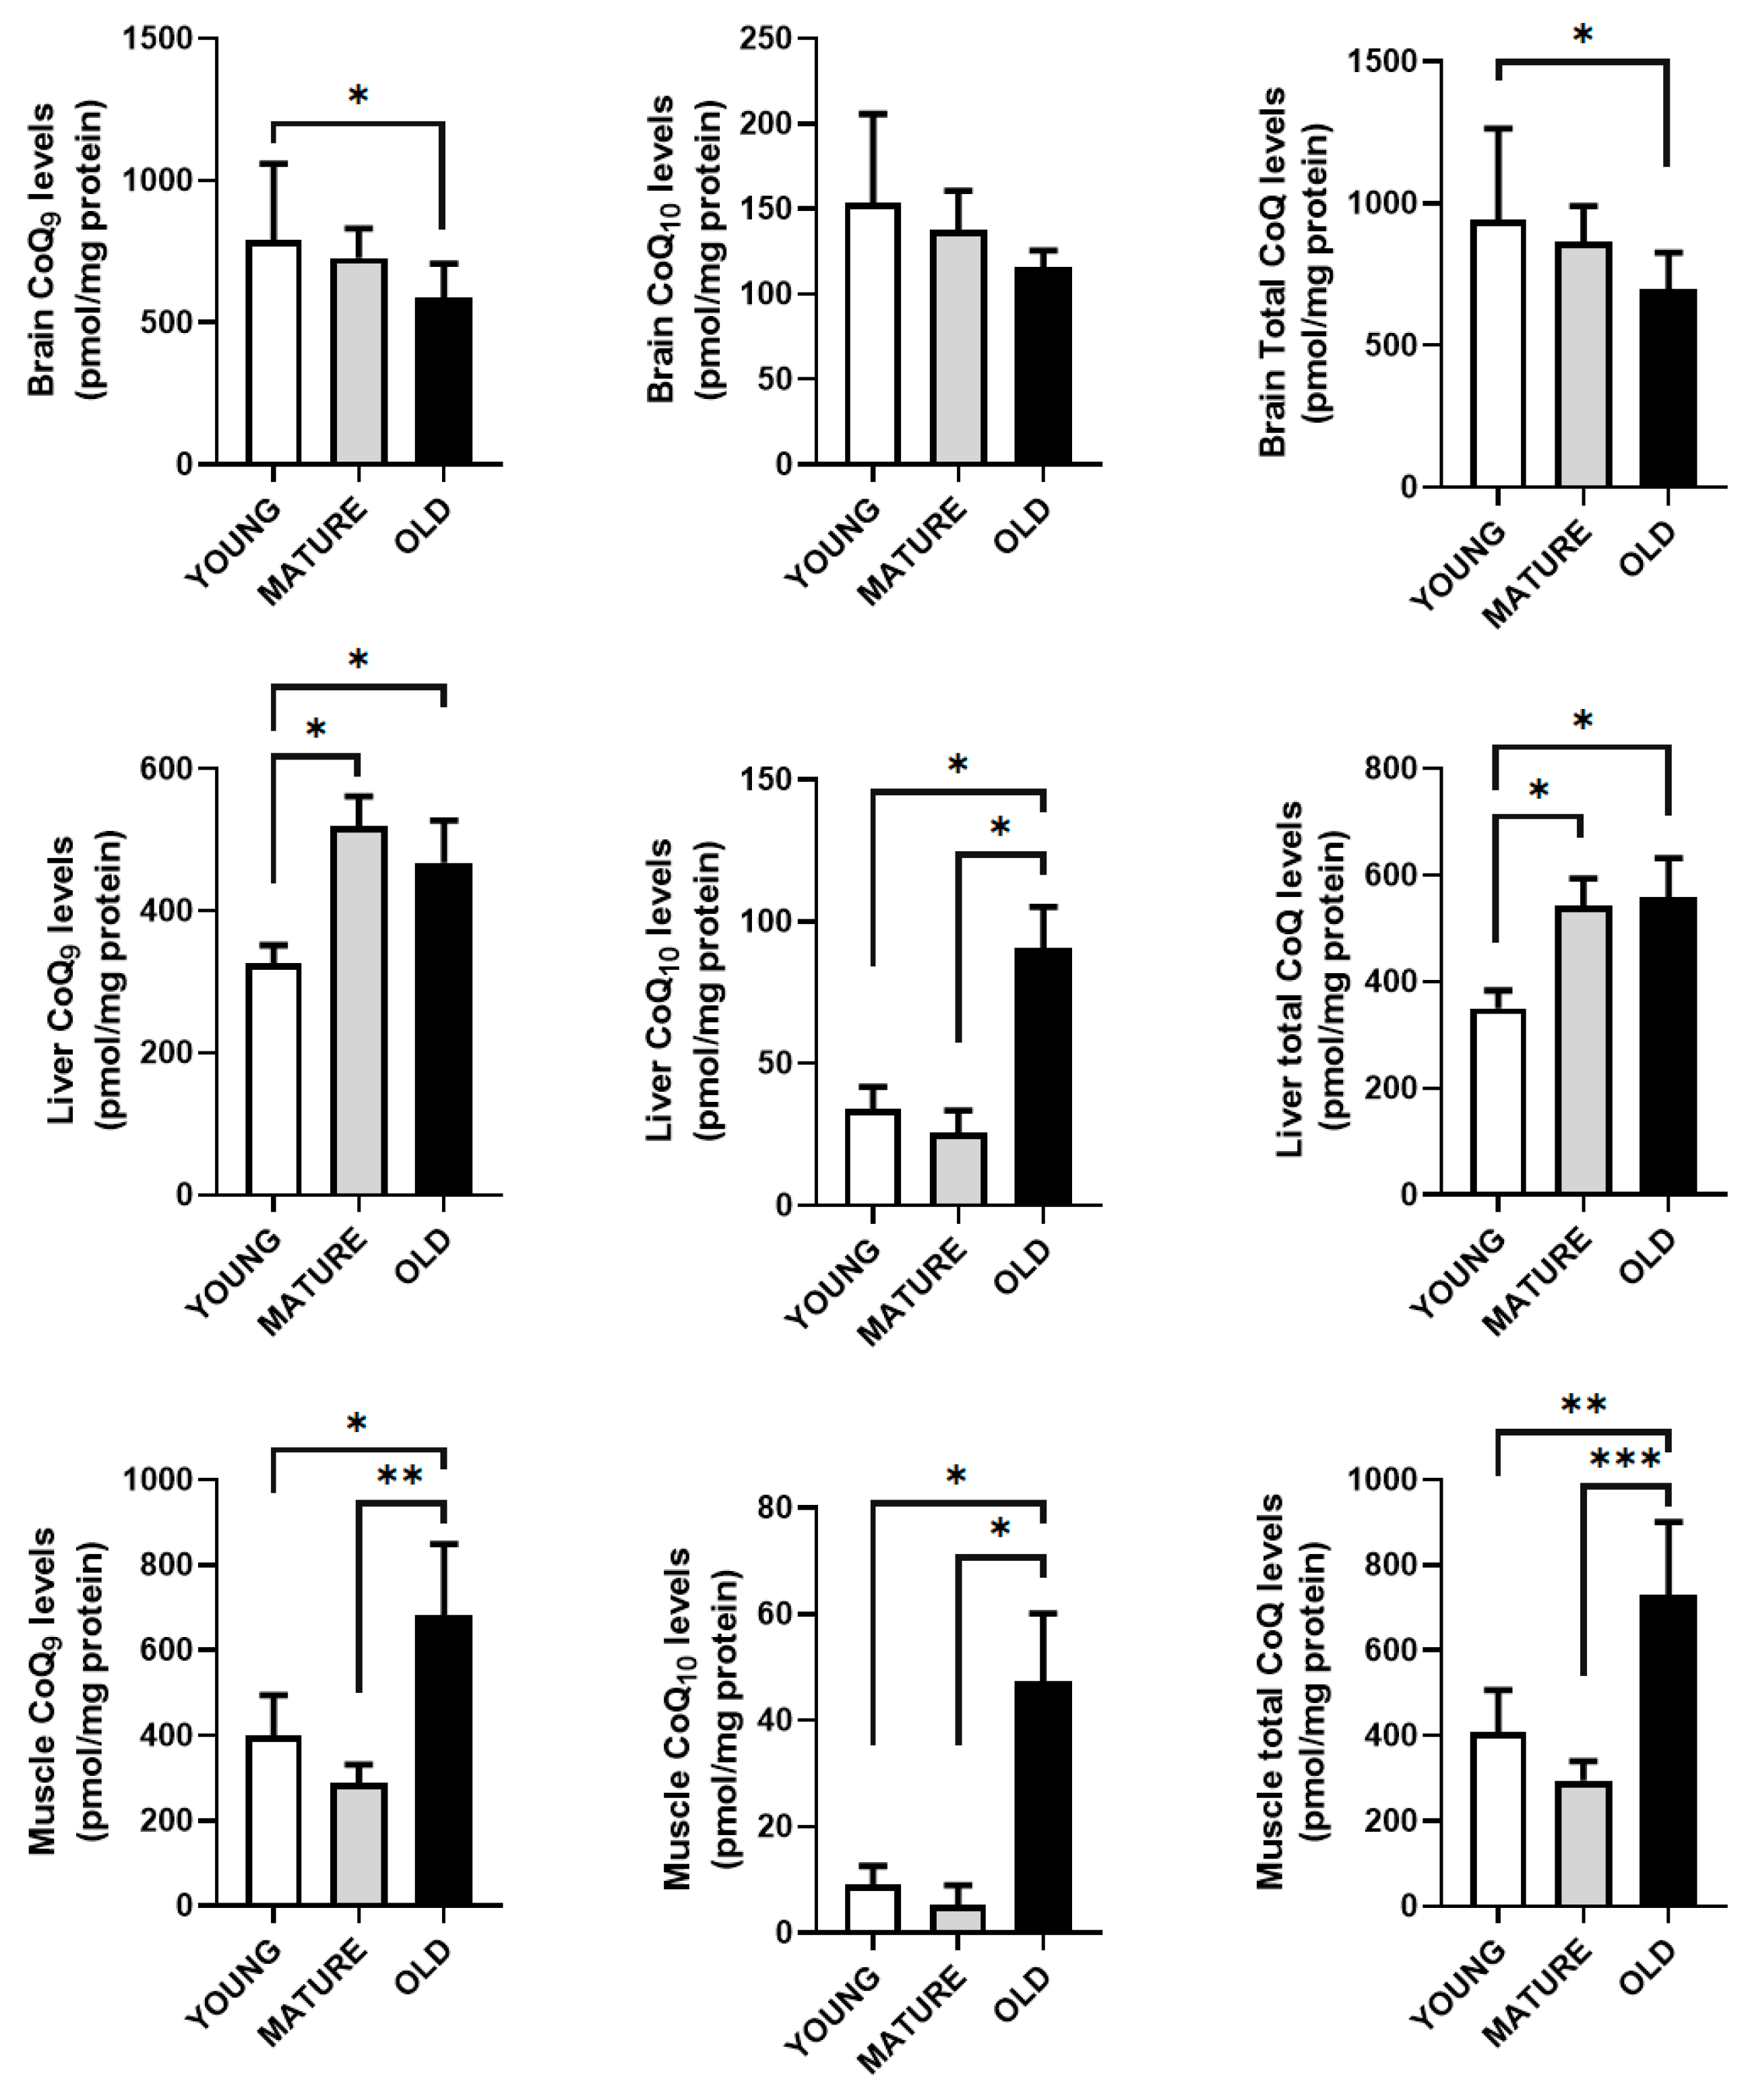
Figure 6.
mRNA levels of COQ-genes in different organs in old mice that were trained (PA) or treated with RSV. Data represent the mean ± SD of the levels of mRNA of the genes considering as reference the levels found in young animals and using as housekeeping gene, β-actin. Significative differences between the three ages are indicated: * p<0.05; ** p>0.01; *** p<0.001; *** p>0.0001.
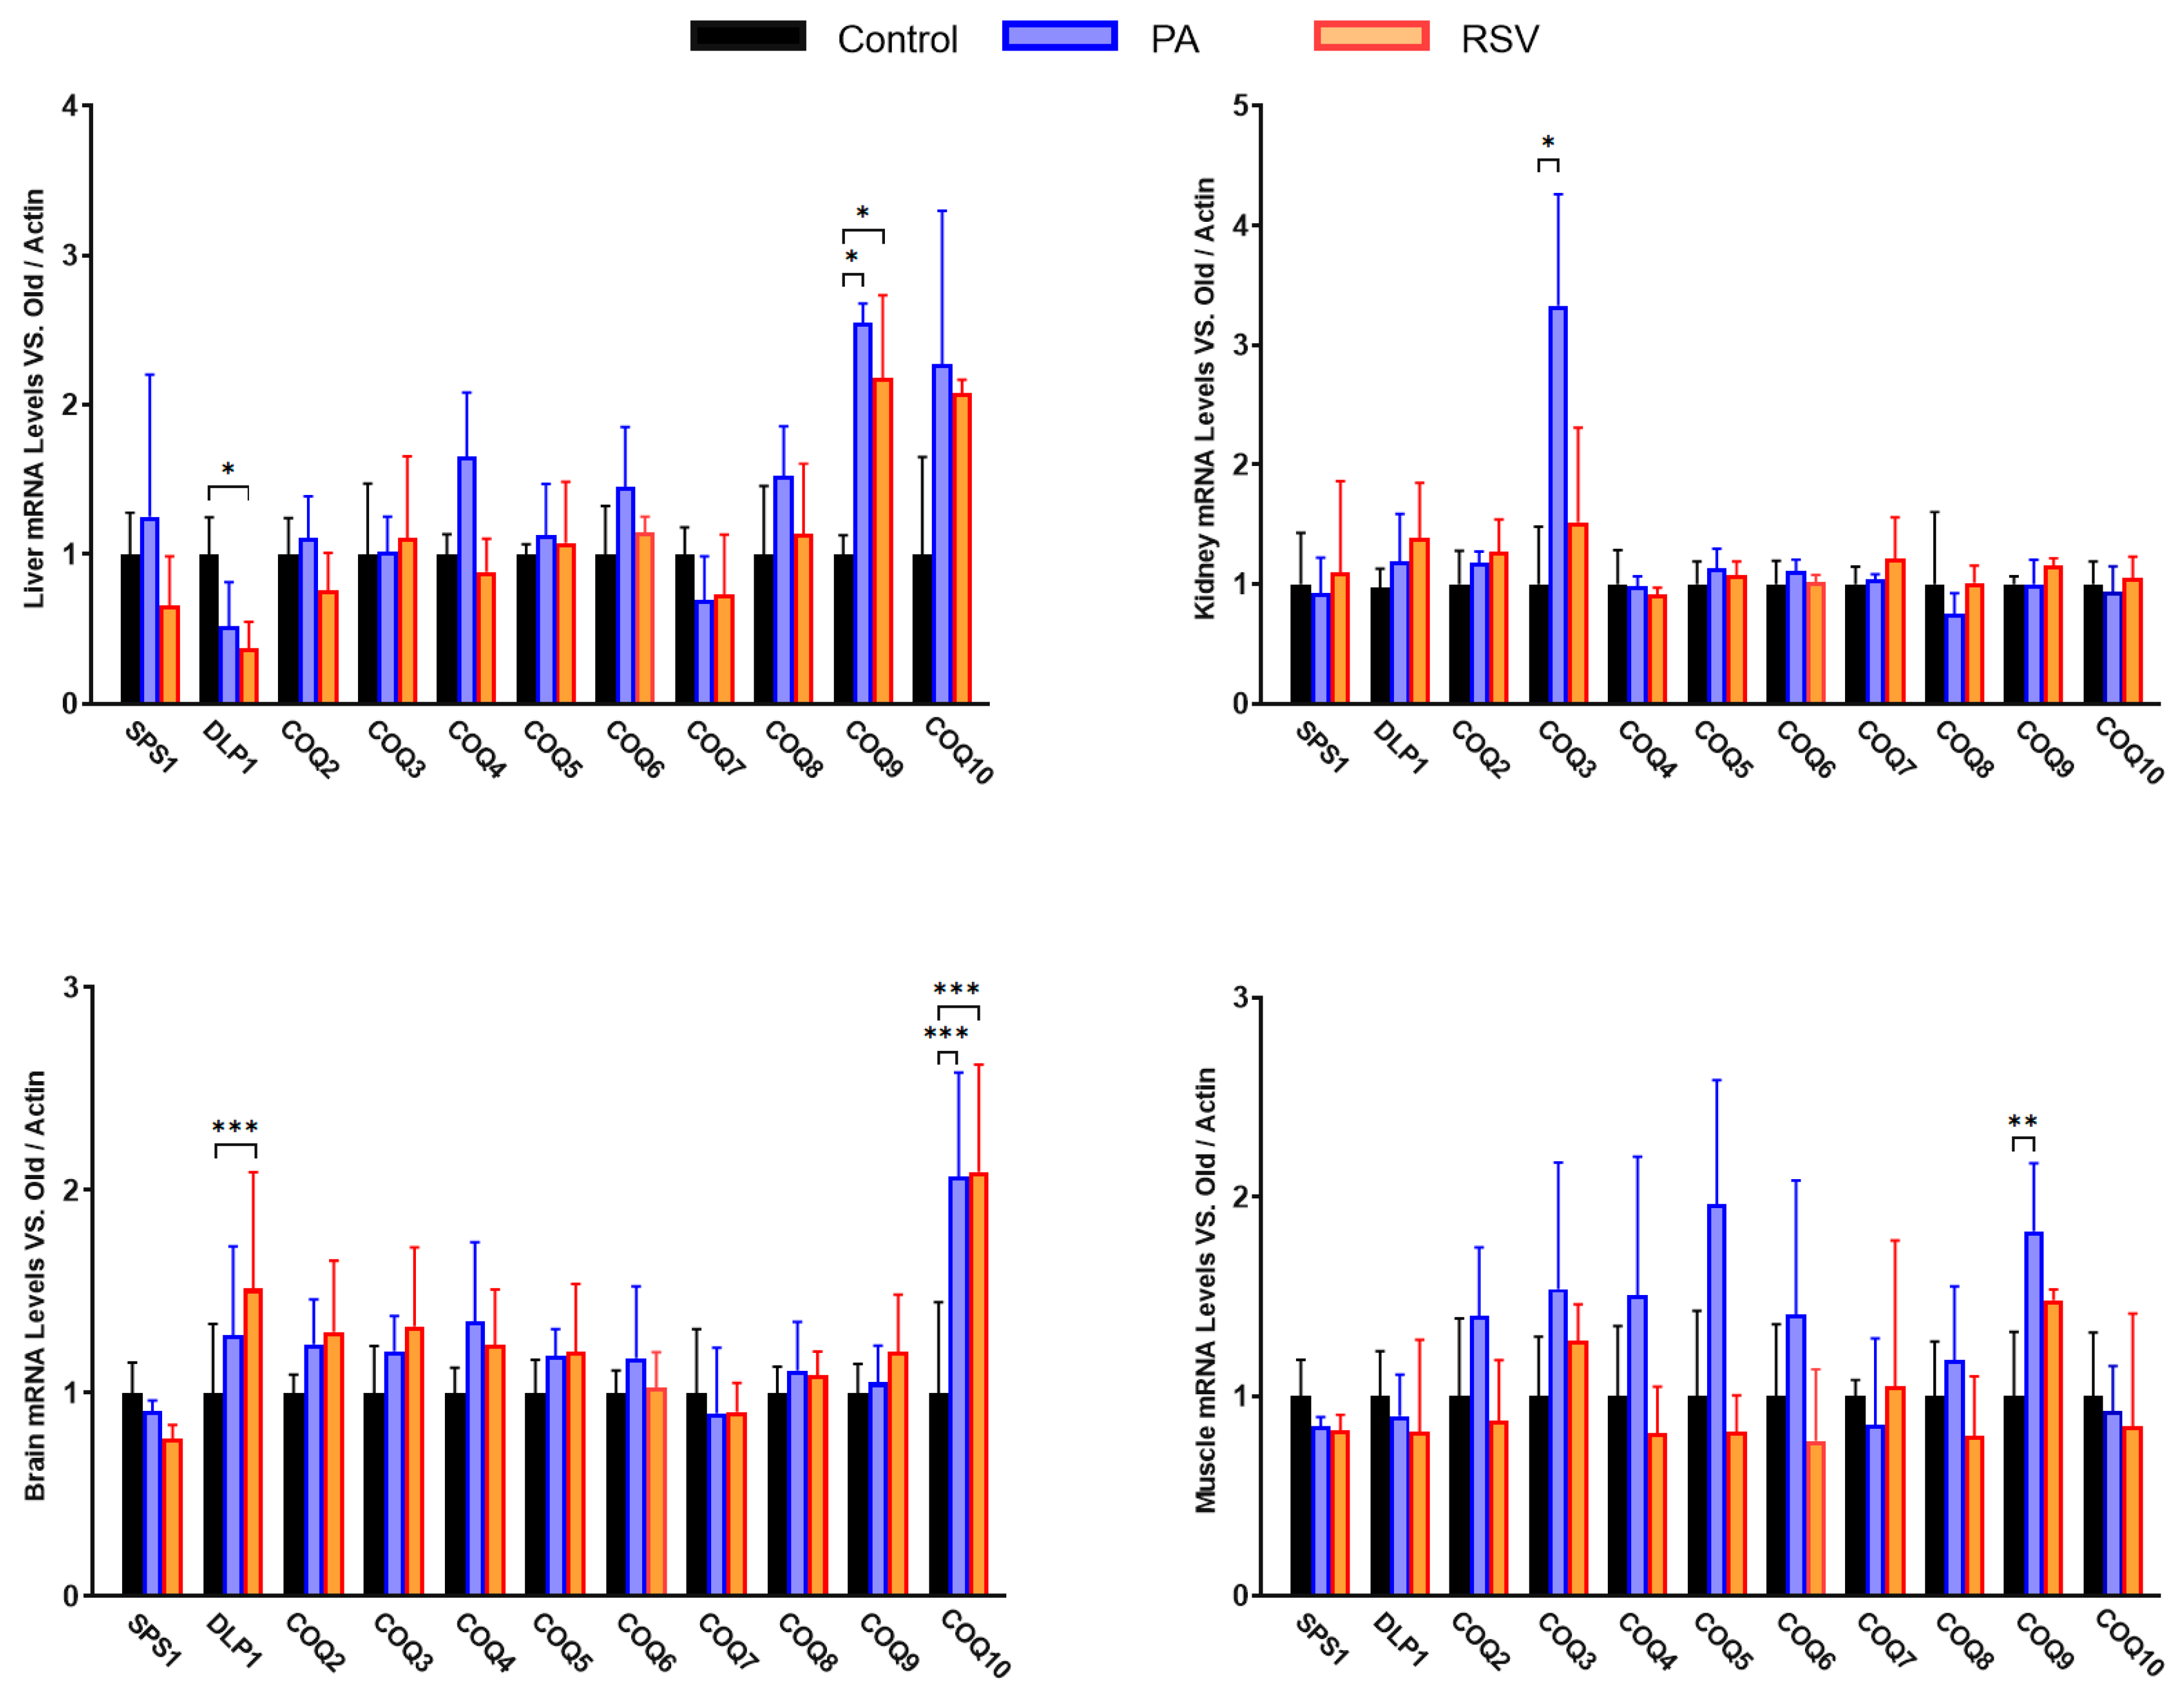
Figure 7.
Correlation between the different COQ-genes in different organs along lifespan of mice. Data represent the degree of positive correlation (blue) or negative correlation (red) among the different genes in the different organs.
Figure 7.
Correlation between the different COQ-genes in different organs along lifespan of mice. Data represent the degree of positive correlation (blue) or negative correlation (red) among the different genes in the different organs.
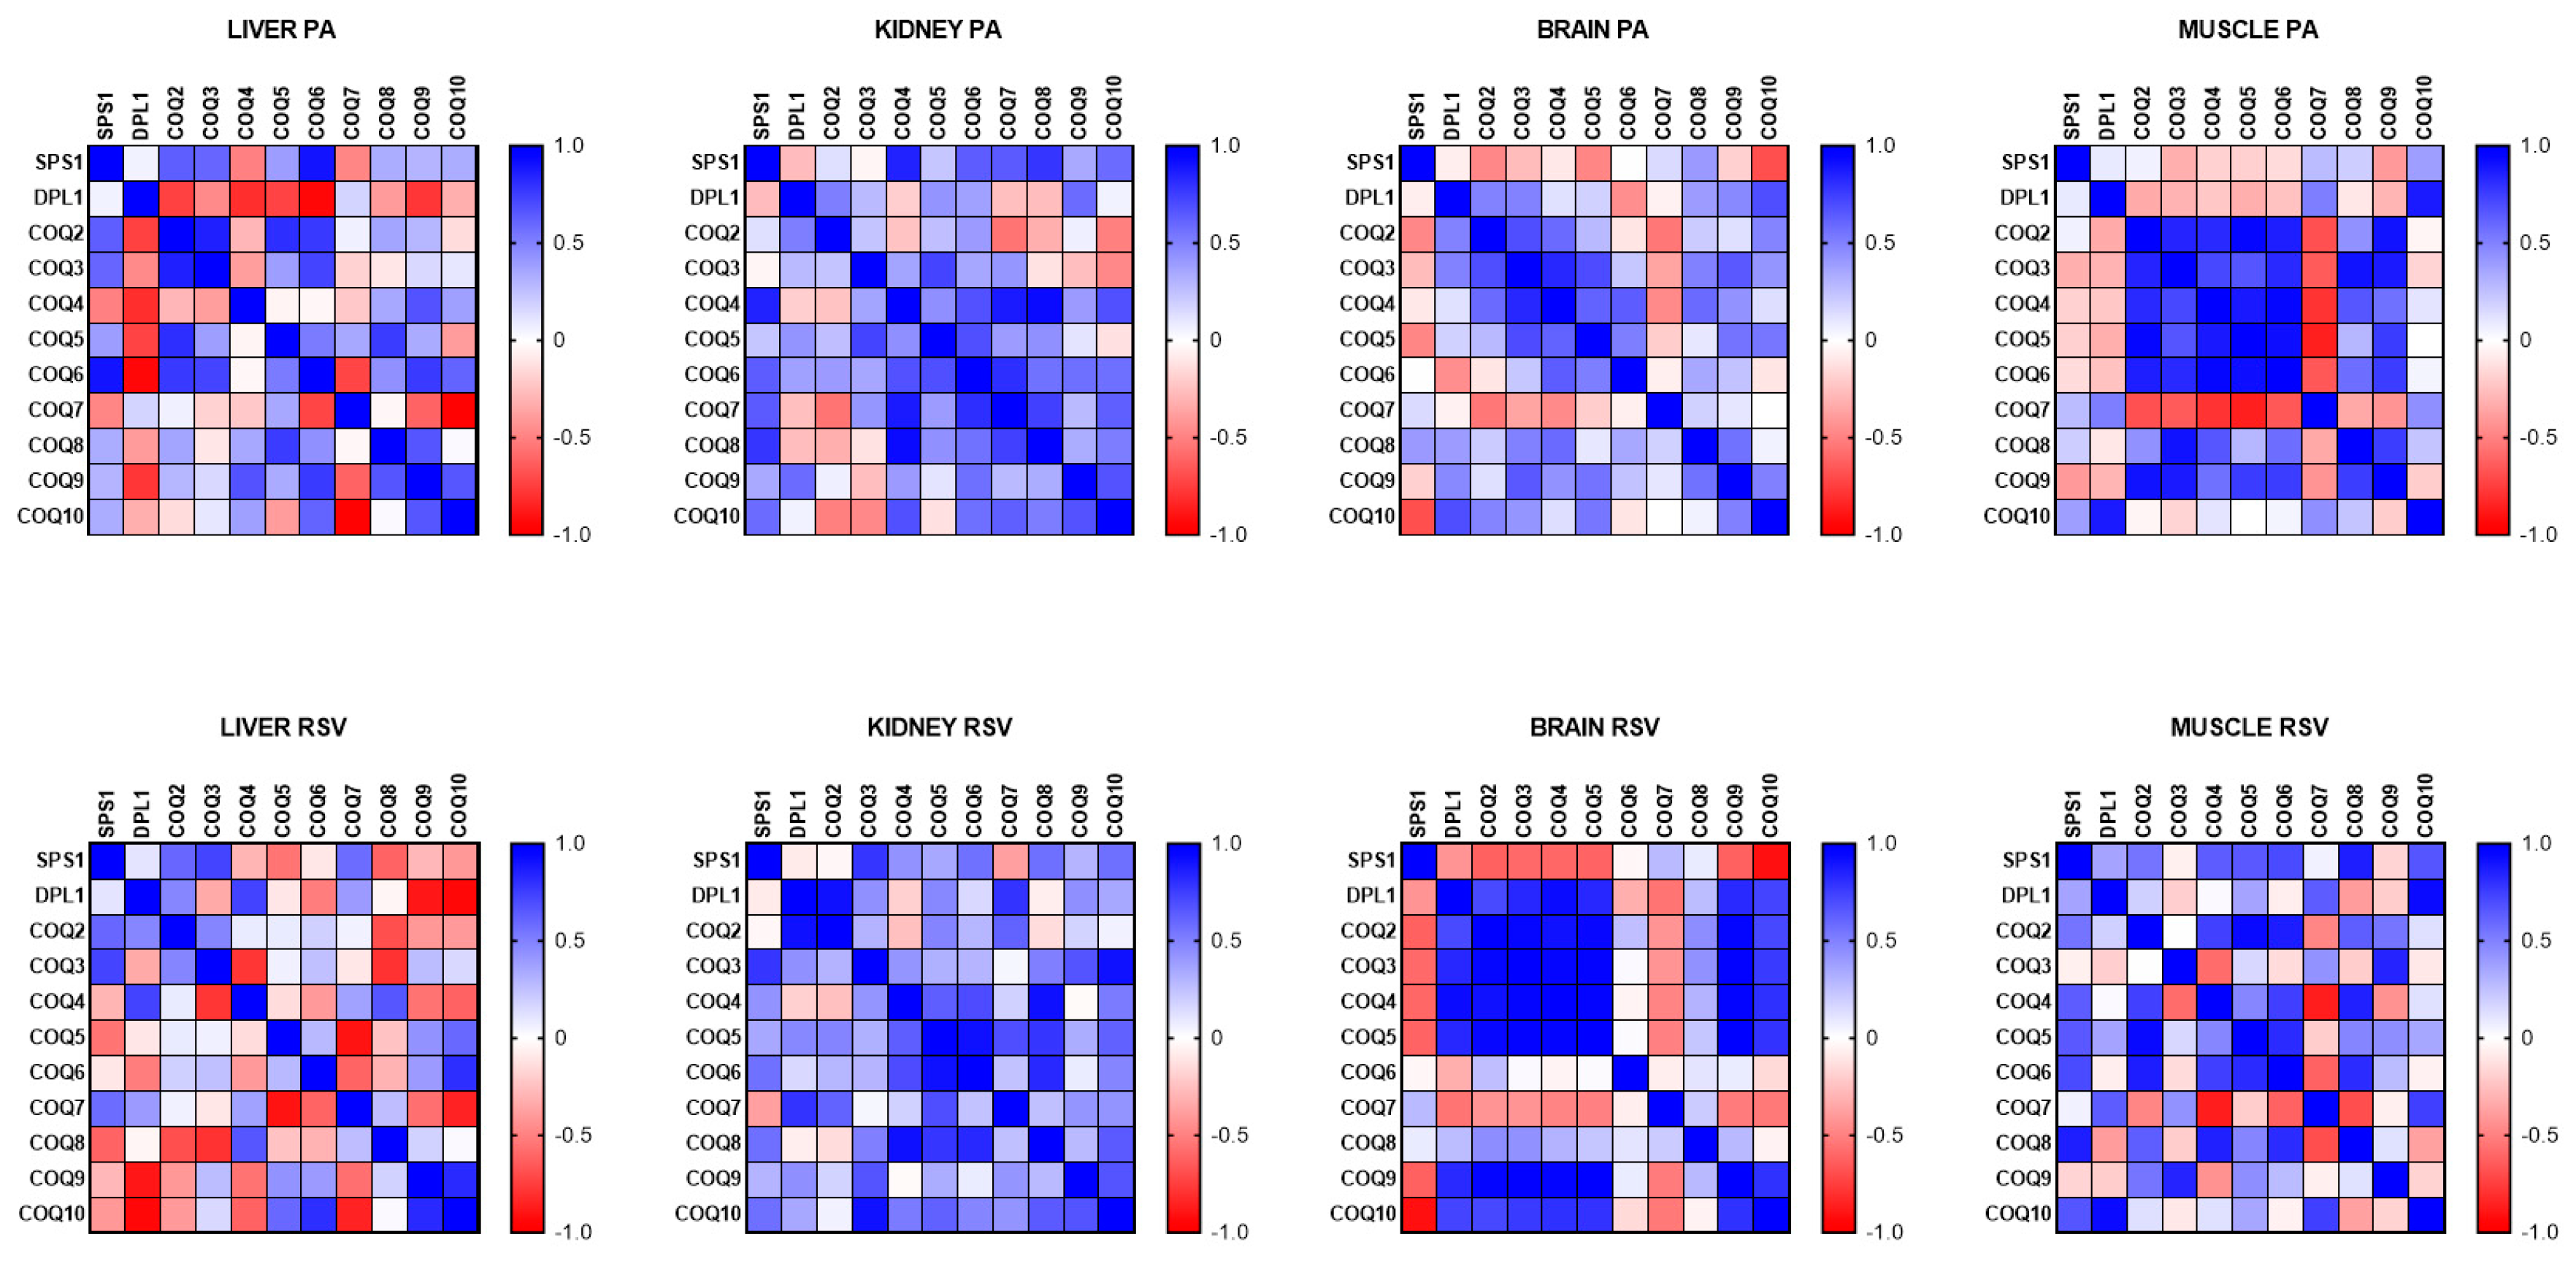
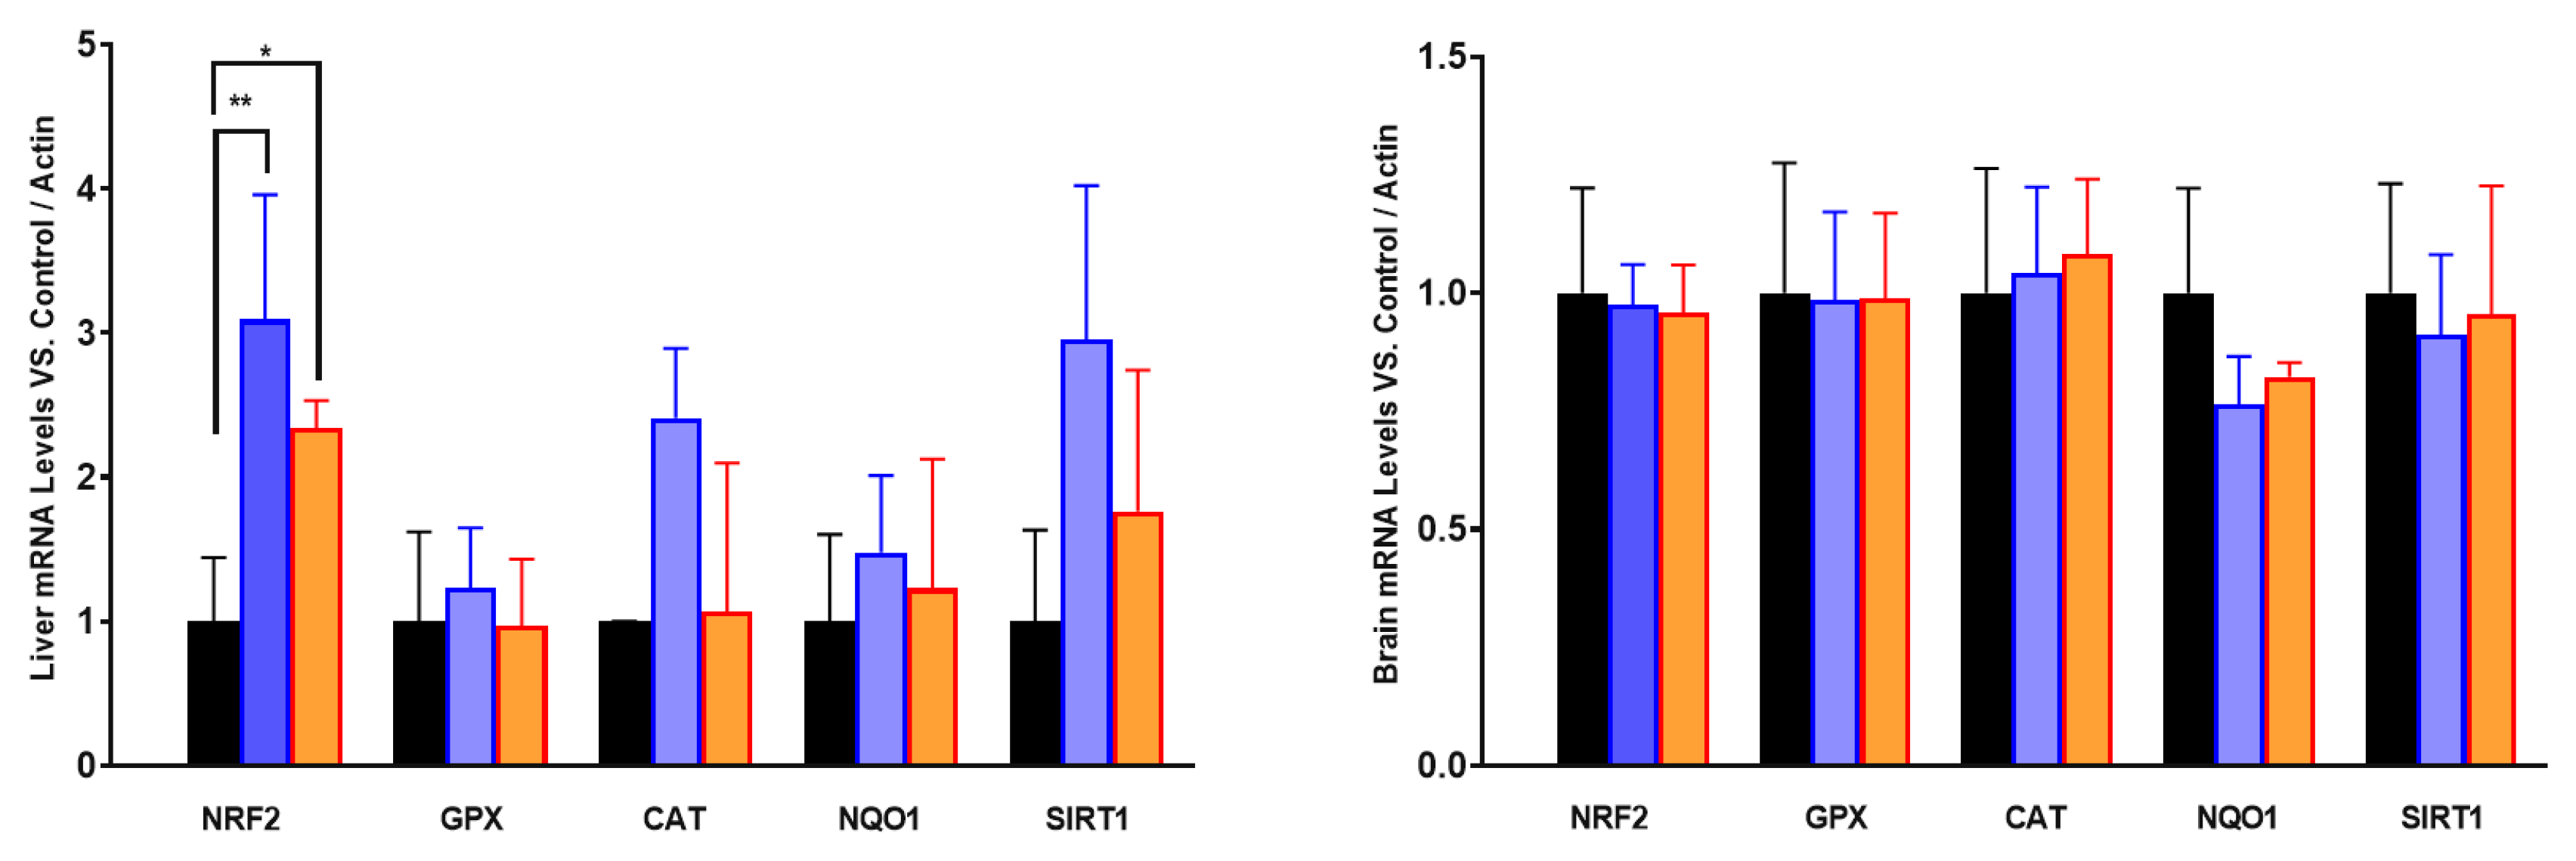
Figure 8.
Levels of mRNA of different antioxidant genes in liver and brain after PA or RSV treatment. Data represent the mean ± SD of the levels of mRNA of the genes considering as reference the levels found in old animals and using actin as housekeeping gene. Significative differences between the three ages are indicated: * p<0.05; ** p>0.01.
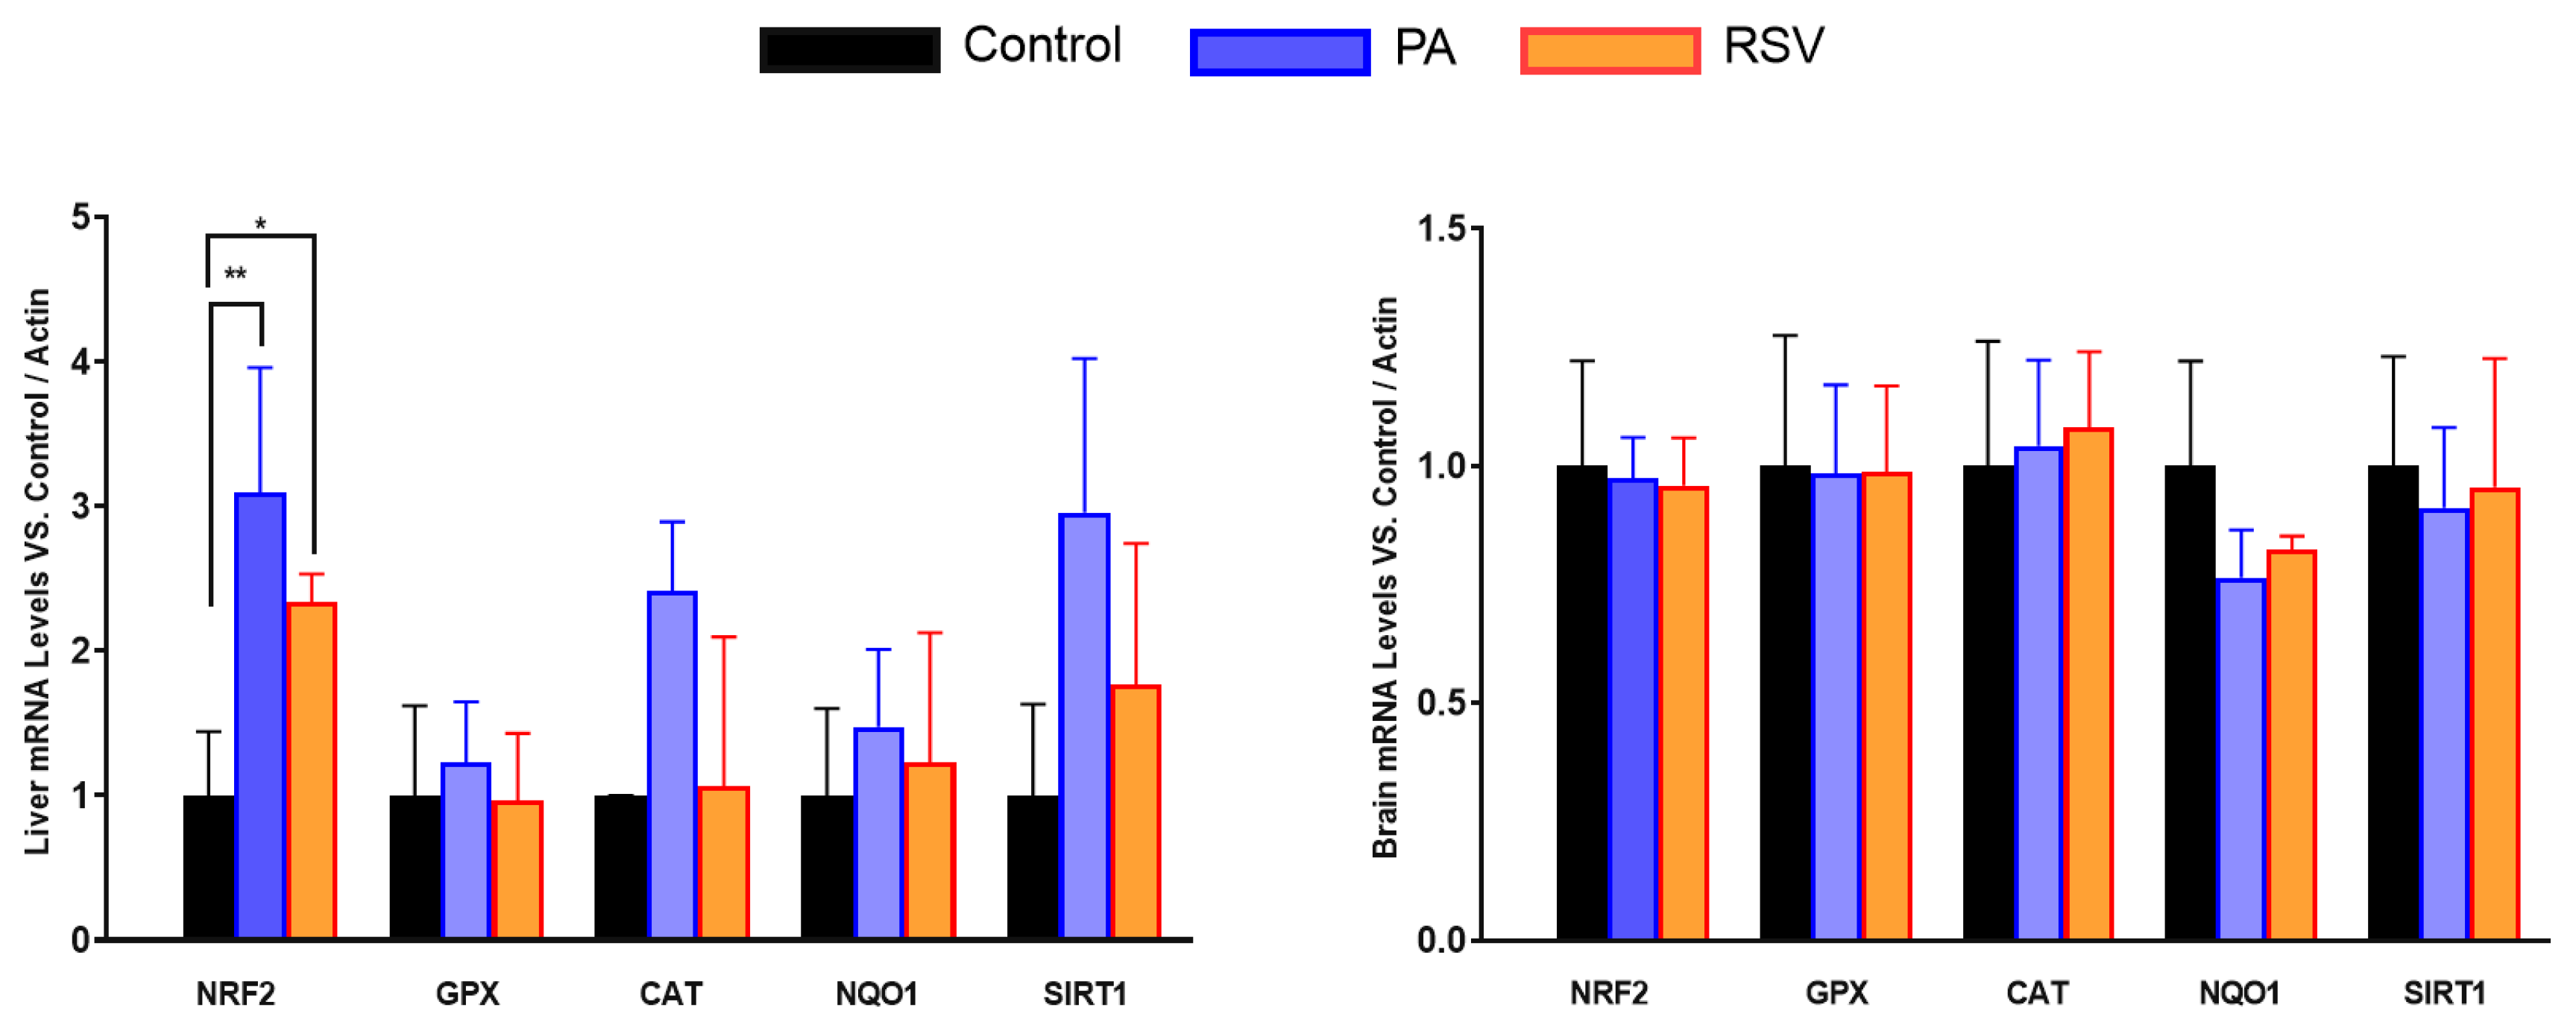
Figure 9.
Levels of CoQ in brain, liver and gastrocnemius muscle after PA or RSV treatment. Data represent the mean ± SD of the levels of CoQ9, CoQ10 and total CoQ. Significative differences between the three ages are indicated: * p<0.05; ** p>0.01.
Figure 9.
Levels of CoQ in brain, liver and gastrocnemius muscle after PA or RSV treatment. Data represent the mean ± SD of the levels of CoQ9, CoQ10 and total CoQ. Significative differences between the three ages are indicated: * p<0.05; ** p>0.01.
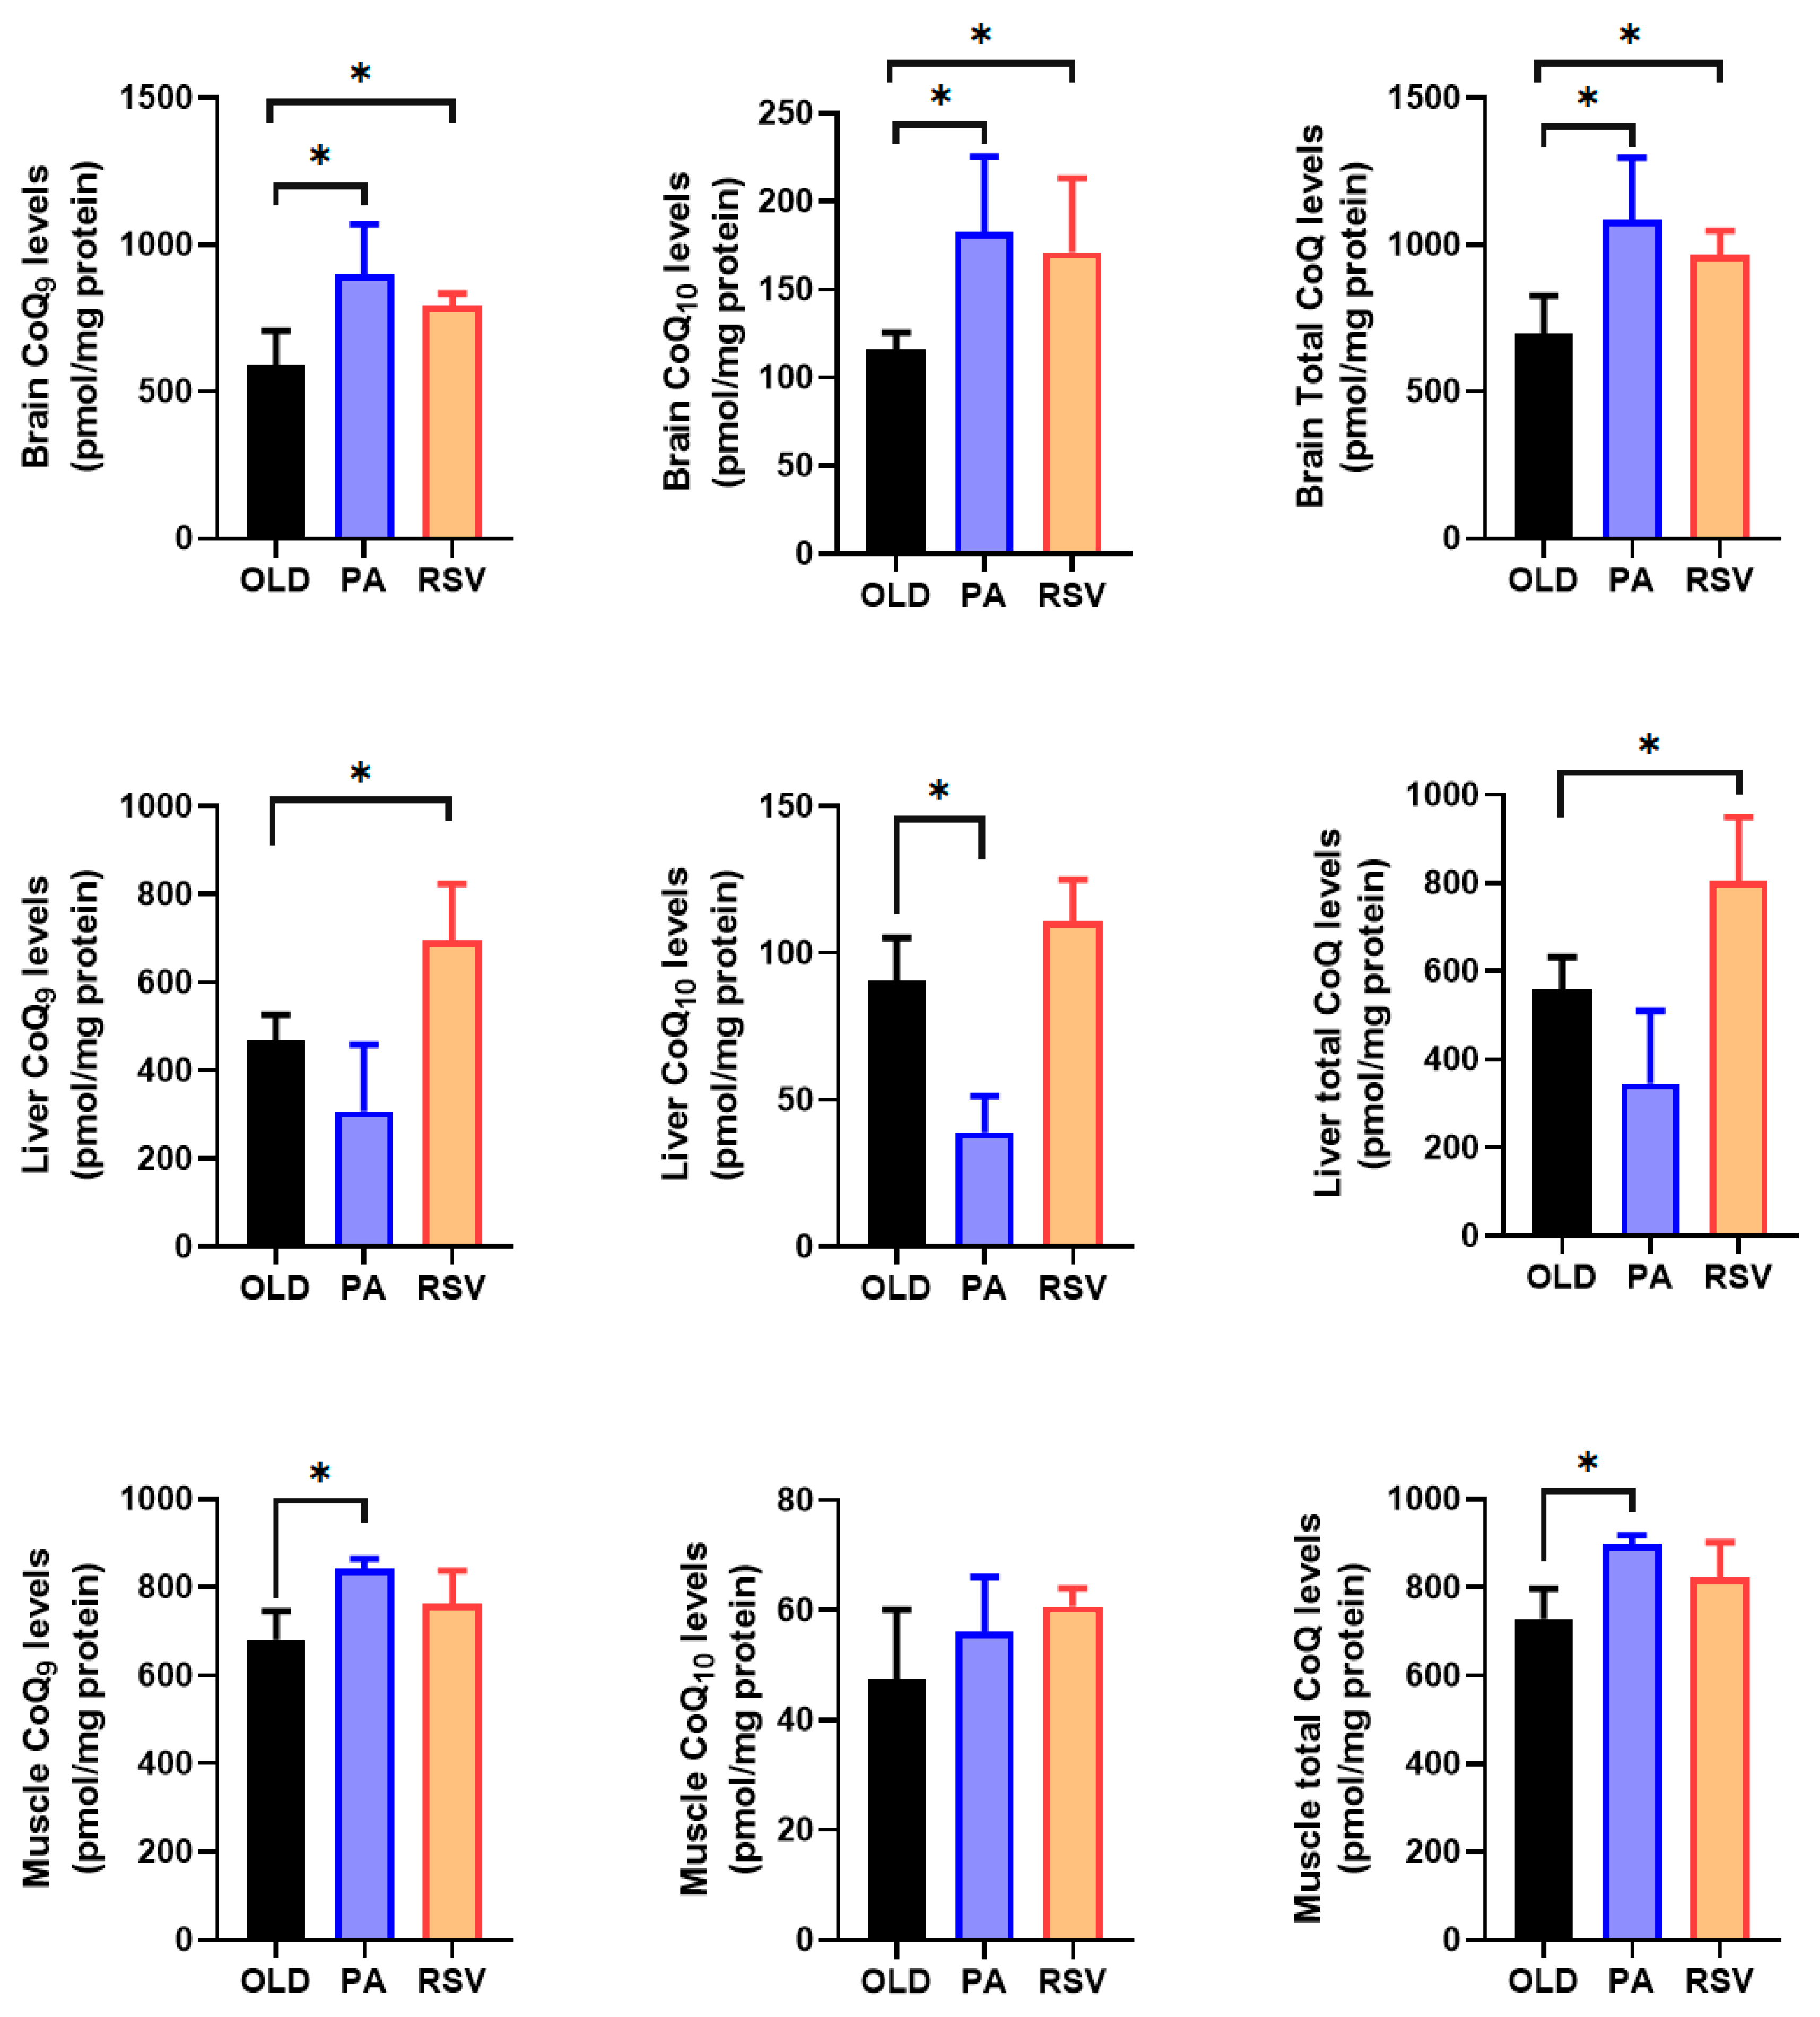

Table 1.
Primers used in this study.
| Gene | Forward (5′–3′) | Reverse (5′–3′) |
|---|---|---|
| mSPS1 | 5′-CATCAAAGGACACCAGCAATGT-3′ | 5′-GCACCACAATAATCGGTCTAAAGG-3′ |
| mDLP1 | 5′-ATGCTGACCTCCAGCCTTTT-3′ | 5′-GTCACACCTTTGCCAGCTTT-3′ |
| mCOQ2 | 5′-GCCCACCAGCAGGACAAGAAAGAC-3′ | 5′-AGCCACAGCAGCGTAGTAGG-3′ |
| mCOQ3 | 5′-GTGAGCCACCTGGAAATGTT-3′ | 5′-CCCACGTATGAGTGCCTTTT-3′ |
| mCOQ4 | 5′-GGGGAGACCACAGGATGC-3′ | 5′-GTCGAGGGTAGACAGCGAGAT-3′ |
| mCOQ5 | 5′-GGATTCCTTGGGAGGTTCA-3′ | 5′-GGGCAGTTCTTCAGCGTCT-3′ |
| mCOQ6 | 5′-CGACGTGGTGGTGTCAGC-3′ | 5′-AGTTTCTCCAGGGCTTTCTTT-3′ |
| mCOQ7 | 5′-TGATGGAAGAGGACCCTGAGAAG-3′ | 5′-GCCTGTATCGTGGTGTTCAAGC-3′ |
| mCOQ8/ADCK3 | 5′-AGCAAGCCACACAAGCAGATG-3′ | 5′-CCAGACCTACAGCCAGACCTC-3′ |
| mCOQ9 | 5′-CCCGAGTTTTCCCGTCC-3′ | 5′-TGGGCTCCTTCAGCAATG-3′ |
| mCOQ10 | 5′-TAAACAGAACCCTTCCACCG-3′ | 5′-CGAAATGCTGATAGTCCTCCA-3′ |
| SIRT1 | 5’-TTGAAGATGCTGTGAAGTTACTG-3’ | 5’-GAAGGGTCTGGAGGGTCTG-3’ |
| GPX | 5’-AGAATGGCAAGAATGAAGA-3’ | 5’-CTCTTCACGCTTCACTTA-3’ |
| CAT | 5’-TTATCCATAGCCAGAAGAG-3’ | 5’-CCAAAGAAAGAACAAGTCA-3’ |
| NRF2 | 5’-CAGCATAGAGCAGGACAT-3’ | 5’-ACTATGATGGCGACAAAG-3’ |
| NQO1 | 5’-CATTCAGAGAAGACATCATTCAACT-3’ | 5’-GCTTAGACTGGAGATACGATACT-3’ |
| SOD1 | 5’-AATTACAGGATTAACTGAAGG-3’ | 5’-TAGGAGTGAGATTCTTTGTA-3’ |
| β-actin | 5′-TGACCGAGCGTGGCTACAG-3′ | 5′-GGGCAACATAGCACAGCTTCT-3′ |
| mHSP90 | 5′-GTGCCTGGAGCTCTTCTCC-3′ | 5′-CGTCGGTTAGTGGAATCTTCAT-3′ |
| mHPRT | 5′-CAGTCAACGGGGGACATAAA-3′ | 5′-AGAGGTCCTTTTCACCAGCAA-3′ |
| m18S | 5′- TGACTCAACACGGGAAACCT-3′ | 5′-AACCAGACAAATCGCTCCAC-3′ |
Table 2.
Primary antibodies used in this study.
| Antibody | Host | Brand (Code) | Dilution |
|---|---|---|---|
| Anti-COQ2 | Chiken | Agrisera (2005-165) | 1:1000 |
| Anti-COQ4 | Rabbit | Proteintech (16654-1-AP) | 1:1000 |
| Anti-COQ6 | Rabbit | Proteintech (12481-1-AP) | 1:1000 |
| Anti-COQ7 | Rabbit | Proteintech (15083-1-A) | 1:1000 |
| Anti-Chiken HRP | Rabbit | Merck (12-341) | 1:10000 |
| Anti-Rabbit HRP | Goat | Thermo Fisher (31460) | 1:3000 |
Table 3.
Mouse genes involved in CoQ synthesis with the chromosome and the location (https://www.ncbi.nlm.nih.gov/gene).
Table 3.
Mouse genes involved in CoQ synthesis with the chromosome and the location (https://www.ncbi.nlm.nih.gov/gene).
| Gen | Name | Gene ID | Chromosome -Location | Protein |
|---|---|---|---|---|
| mSPS1 | Prenyl(Solanesyl)diphosphate syntase subunit 1 | 56075 | Chr2 -NC_000068.8 | Q9CZQ1 |
| mDLP1 | Prenyl(Solanesyl)diphosphate syntase subunit 1 | 71365 | Chr10 -NC_000076.7 | Q33DR3 |
| mCOQ2 | 4-hydroxybenzoate polyprenyltransferase | 71883 | Chr5 -NC_000071.7 | Q66JT7 |
| mCOQ3 | Ubiquinone biosynthesis O-methyltransferase | 230027 | Chr4 -NC_000070.7 | Q8BMS4 |
| mCOQ4 | Ubiquinone biosynthesis protein COQ4 | 227683 | Chr2 -NC_000068.8 | Q8BGB8 |
| mCOQ5 | 2-methoxy-6-polyprenyl-1,4-benzoquinol methylase | 52064 | Chr5 -NC_000071.7 | Q9CXI0 |
| mCOQ6 | Ubiquinone biosynthesis monooxygenase COQ6 | 217727 | Chr12 -NC_000078.7 | Q8R1S0 |
| mCOQ7 | 5-demethoxyubiquinone hydroxylase | 12850 | Chr7 -NC_000073.7 | P97478 |
| mCOQ8A/ADCK3 | Atypical kinase COQ8A | 67426 | Chr1 -NC_000067.7 | Q60936 |
| mCOQ8B/ADCK4 | Atypical kinase COQ8B | 76889 | Chr7 -NC_000073.7 | Q566J8 |
| mCOQ9 | Ubiquinone biosynthesis protein COQ9 | 67914 | Chr8 -NC_000074.7 | Q8K1Z0 |
| mCOQ10A | Coenzyme Q-binding protein COQ10 homolog A | 210582 | Chr10 -NC_000076.7 | Q8BV28 |
| mCOQ10B | Coenzyme Q-binding protein COQ10 homolog B | 80219 | Chr1 -NC_000067.7 | Q3THF9 |
| mADCK2 | AarF domain containing kinase 2 | 57869 | Chr6 -NC_000072.7 | Q6NSR3 |
Disclaimer/Publisher’s Note: The statements, opinions and data contained in all publications are solely those of the individual author(s) and contributor(s) and not of MDPI and/or the editor(s). MDPI and/or the editor(s) disclaim responsibility for any injury to people or property resulting from any ideas, methods, instructions or products referred to in the content. |
© 2025 by the authors. Licensee MDPI, Basel, Switzerland. This article is an open access article distributed under the terms and conditions of the Creative Commons Attribution (CC BY) license (http://creativecommons.org/licenses/by/4.0/).
Copyright: This open access article is published under a Creative Commons CC BY 4.0 license, which permit the free download, distribution, and reuse, provided that the author and preprint are cited in any reuse.


