Submitted:
24 April 2025
Posted:
25 April 2025
You are already at the latest version
Abstract
About one third of all food produced for human consumption is lost or wasted, leading to societal, economic and environmental challenges. This study identifies the most important Food wastage (FW) leverage points and their interrelations with specific food chains. Semi-structured interviews were conducted across four different food chains (milk, poultry, potato and greenhouse-grown fruit vegetables) from primary production to food service. The outcomes of the interviews were summarized via a systems approach and validated during co-creation sessions. A total of 22 FW leverage points were identified across the food chains consisting of 4 major hotspots, 6 patterns of behaviours, 6 structures and 6 mental models. Common transformative leverage points across all food chains were: damaged products, oversupply, regulations and standards that limit product use and lack of prioritization of FW reduction. Additionally, the study found that co-creation sessions with stakeholders from across the food chains could fa-cilitate the formation of coalitions of willing companies, encouraging collaborative efforts to reduce FW.
Keywords:
food systems approach
; food waste hotspots
; food chain
; leverage points
; systemic change
1. Introduction
Globally, about 14 percent of the world’s food continues to be lost after harvest within primary production (FAO et al., 2019), whilst a further 17 percent of our food ends up being wasted in retail, food service and particularly in households (“UNEP Food Waste Index Report 2021 | UNEP - UN Environment Programme,” n.d.). Results show that 186 Mt CO2-eq, can be attributed to food waste in Europe annually(“Sustainability Pathways: Food loss and waste,” n.d.). This is 15% of the entire food supply chain(Scherhaufer et al., 2018). About 6-8% of all human-caused greenhouse gas emissions could be reduced if we stop wasting food (“Fight climate change by preventing food waste | Stories | WWF,” n.d.). This makes reduction of Food wastage (FW) a major sustainability challenge(Thyberg and Tonjes, 2016). Reducing FW prevents the waste of land, water, energy and other resources embedded in food and is therefore essential to improving the sustainability of food systems (Muth et al., 2019). FW can be understood as a symptom of an unsustainable food system. In addition to addressing symptom control, such as reduction and reutilization of food waste streams, interventions aimed at mitigating or preventing food waste should also target the underlying systemic patterns of behaviour, systemic structures and mental models that perpetuate the occurrence of food waste. This means that a systems approach is needed (Bagherzadeh, 2019; Van Berkum and Ruben, n.d.). Currently there is a lack of studies that adopt a systemic approach to account for FW in the food system and more specific within food chains (Caldeira et al., 2019). An earlier literature review by Canali et al. identified the following drivers behind systemic food waste (Canali et al., 2016): (A) inherent characteristics of food; (B) social and economic factors; (C) individual non-readily changeable behaviours; (D) other priorities targeted by private and public stakeholders; (E) diversified factors, such as mismanagement, inefficient legislation, lack of awareness or information; and sub-optimal use of available technologies, which could be more promptly changed. Another literature review by Priefer et al. showed the following drivers behind FW (Priefer et al., 2016): (a) process- and market-based standards, (b) non-compliance with food safety requirements, (c) exceeding expiry dates, (d) marketing standards or logistic constraints, but also (e) consumer preferences and (f) societal trends like growing prosperity, declining food prices, rising number of single households and increasing employment of women(Priefer et al., 2016). Those literature outcomes are quite generic and there is no direct comparison based on case studies between food chains of a specific nature (such as poultry, fresh produce etc.). Another point of attention is that the drivers of FW are identified but they are not placed within the hierarchical context of a systems approach, leading to a lack of insight how specific FW hotspots link to underlying behaviour patterns, structures and mental models. Food waste hotspots are events that result in a considerable amount of food waste and therefore need action (“Voedselverspilling in Nederlandse ziekenhuizen - PDF Gratis download,” n.d.). Current literature reviews provide a too limited understanding of the interrelations within the system in order to identify where an intervention should be targeted and/or could be most effective in the food supply chain. The food supply chain consists of several chain segments: primary production; processing and manufacturing; wholesale, retail & markets and food service. Primary production can be defined as activities that occur at farm/ fish farm / fishing boat level. Processing and manufacturing can be defined as all activities occurring in a food processing industry and carried out in order to obtain a finished product from incoming raw materials. Wholesale can be defined as business-to-business operations that buy and sell large quantities of goods. Retail can be defined as an operator that sells goods to consumers. Food Service comprises of the businesses and people engaged in preparing meals and drinks for consumption outside of the home (“About FUSIONS,” n.d.).
In the project “Reduction of FW in the Dutch food industry”, FW hotpots were explored in a number of fresh food supply chains in the Netherlands (milk, poultry, potato and greenhouse-grown fruit vegetables). Milk, poultry, potato and greenhouse-grown fruit vegetables are frequently consumed goods in the Netherlands and often wasted.
With this work we aim to present the most important FW leverage points and their interrelations. We would also like to show which behaviours, structures and mental models should be targeted for future systemic interventions within the context of different food chains.
This is achieved by presenting our findings in response to the following two questions:
- Which FW leverage points are generically found across the four food chains and chain links?
- Which change in behavioural patterns, structures and mental models could be effective in reducing FW across all food chains?
2. Materials and Methods
2.1. Systems Thinking Approach
Insights from systems theory help to explore possibilities for transitions in a complex system such as the food system. Systems thinking is a perspective that recognizes systems as a set of interrelated components in which the interrelations are as important as the individual components (Monat and Gannon, 2015). Systems thinking can be used to analyze and solve complex problems that cannot be solved by reductionist thinking, precisely because it focuses on the interrelationships of system components that dominate system performance. Although several types of systems approaches can be found in literature, we choose to work with the Iceberg model framework based on the work of Maani and Cavana (2007) as this framework is easy to work with in participatory settings. it helps identify interventions beyond end-of-pipe solutions (e.g. reusing food waste into new products) at the pattern, structures and paradigm level of the system and their interrelations (Maani and Cavana, 2007)). The Iceberg model argues that events that we can observe (‘the tip of the Iceberg’), are caused by the underlying system behaviour, structure and mental models, which are usually hidden (‘under water’). Maani and Cavana embrace a 4-tiered Iceberg model consisting of 1) observable events or symptoms (i.e. food waste) that are caused by 2) patterns, which in turn are caused by 3) systemic structures which develop as a result of 4) mental models or the paradigm of the system. The Iceberg model can be linked to the theory of leverage points (e.g. Meadows (Meadows, 2008)), “places within a complex system where a small shift in one thing can produce big changes in everything” (Meadows, 2008; “Systems Theory,” n.d.). This leverage points theory suggests that the ‘deeper’ the intervention is in these system layers, the more transformative it is on the system. One of the most effective leverage points, according to Meadows, is the paradigm shift, or shift in the mental model of a system (see Figure 1).
This system thinking method forms the basis for the chosen methodology and the Food Systems Approach toolkit was used to define the required steps and in order to develop a semi-structured interview guide (“Lectoraatgroep Future Food Systems – HAS green academy,” n.d.).
Initially the chosen food chains were analyzed per chain segment, following the classification of the efficient protocol (“Efficient Food Loss & Waste Protocol,” n.d.) (see Figure 2). The efficient protocol is a pragmatic and integrated methodology for FW classification, analysis and causes and intervention designs, and gives a clear definition of the chain segments (primary production, processing and manufacturing, retail and markets and food service) (“Efficient Food Loss & Waste Protocol,” n.d.; Kok et al., 2021). Consumer households were excluded from the analysis as the project focused on the industrial food chain production (see Figure 2).
2.2. Food Chains
The selection of the various food chains was guided by the following criteria:
a) relevance to key economic agri-food sectors within the Netherlands;
b) existing collaborative relationships between the selected chains and universities of applied sciences;
c) representation of both animal-based and plant-based food products that constitute a typical daily diet, acknowledging that animal protein chains have historically exhibited lower levels of food waste due to the relatively higher economic value of animal protein;
d) the total number of chains included was constrained by limitations in budget and time.
2.3. Interviews
Semi-structured interviews were conducted with operational experts within four different food chains from primary production to food service (see Appendix A for the interview guide). Table 1 shows the food chain representatives who were interviewed.
In each studied chain segment, the FW hotspots were initially defined by the researchers through literature review and interviews with operational experts. As mentioned above, a FW hotspot is a location in the chain where a significant amount of waste occurs and therefore a place where food waste can be saved (Soethoudt and Timmermans, 2020). Following the classification of the Iceberg model these FW hotspots were marked as “events” (see Figure 1).
The semi-structured interviews were conducted using the laddering interviewing technique (= asking Why? Why? Why? ... are things happening), which has been applied earlier to means-end-chain research regarding FW (Richter and Bokelmann, 2018). This interview technique helped to understand the underlying FW leverage points and their interrelationships. The outcomes of the interviews were summarized in Iceberg models by the authors of this paper.
2.3. Validation and Cocreation of Preferred Future
For each food chain, the Iceberg models were systematically validated during co-creation sessions, which involved a minimum of ten representatives per food chain (“Lectoraatgroep Future Food Systems – HAS green academy,” n.d.). These sessions brought together food chain representatives and research experts to engage in discussions aimed at validating the Iceberg models. Representatives were selected based on their direct involvement in the food chain (e.g., farmers, producers, retailers) or their roles within the broader food system surrounding the chain (e.g., veterinarians, potato seed traders). The selection was intentionally made without focusing on specific specializations, in order to ensure a diverse and comprehensive group. Unfortunately, no retailer participated in the co-creation sessions.
The purpose of the co-creation sessions was to develop a clear overview of potential leverage points for food waste (FW) reduction within the food chain, including insights into mental models, structures, and behavioral patterns. Some outcomes were categorized across multiple levels (events, patterns, structures, and mental models). In such cases, the classification was determined by consensus, reflecting the specific context of the discussed food system. In the first phase of the co-creation process, participants were given the opportunity to provide feedback on the Iceberg models. The models were printed and attendees were invited to attach post-its with their comments directly to the relevant sections of the Iceberg models. Following a group discussion, the final versions of the Iceberg models were established.
The second phase of the co-creation process focused on future backcasting. In this approach, an idealized vision of the future was first articulated. This was accomplished by using printed versions of the Iceberg models and affixing post-its to each layer of the model to represent the envisioned future. Subsequently, the current state of the system was assessed and described. Based on the discrepancies identified between the present and the idealized future, potential solutions were proposed to facilitate the transition from the current state to the desired future scenario.
3. Results
3.1. Primary Production Food Waste Leverage Points
In Figure 3, Figure 4, Figure 5 and Figure 6 the primary production Iceberg models across the four food chains are shown. The arrows show the interlinkages between the events, patterns, structures and mental models. For example milk is contaminated in the milk chain, this is caused by poor hygiene in the barn, laws and regulations make that the product needs to be thrown away because the priority in the chain is human health (see Figure 3).
Common events that were found in all four primary productions:
- Damaged starting materials (animals, eggs, seeds);
- Contaminated animals or products due to diseases/pests/control or protection agents;
- Residual flows resulting from the shortcomings of technical processing (cuts with rinse water/harvesting machines damaged/ machine harvest of unripe or too small crop size).
Common patterns of behaviour that were found in the primary production chain:
- Edible but unknown/unloved part of product is wasted (e.g. vegetables, animal parts);
- Damage to product due to suboptimal handling;
- Higher volume produced than demanded.
Common structures that were found in all primary production chain are:
- Edible but unknown/unloved part of product is wasted (e.g. vegetables, animal parts);
- Product does not meet buyer's quality requirements;
- Laws sometimes unintentionally force to create more FW.
Common mental models behind the FW leverage points in all primary productions were:
- The product always needs to meet the highest quality standards;
- The consumer would like to have perfect products;
- I am not primarily responsible for prevention of FW;
- Investing in better techniques is not profitable;
- It is more important to offer a competitive price than to prevent food waste;
- Food waste is not seen as a way to reduce energy, water and CO2 emissions;
- Food waste is seen as part of the process;
- Speed of working is more important than prevention of FW.
3.2. Processing and Manufacturing Food Waste Leverage Points
Figure 8.
Iceberg model processing and manufacturing (poultry chain).
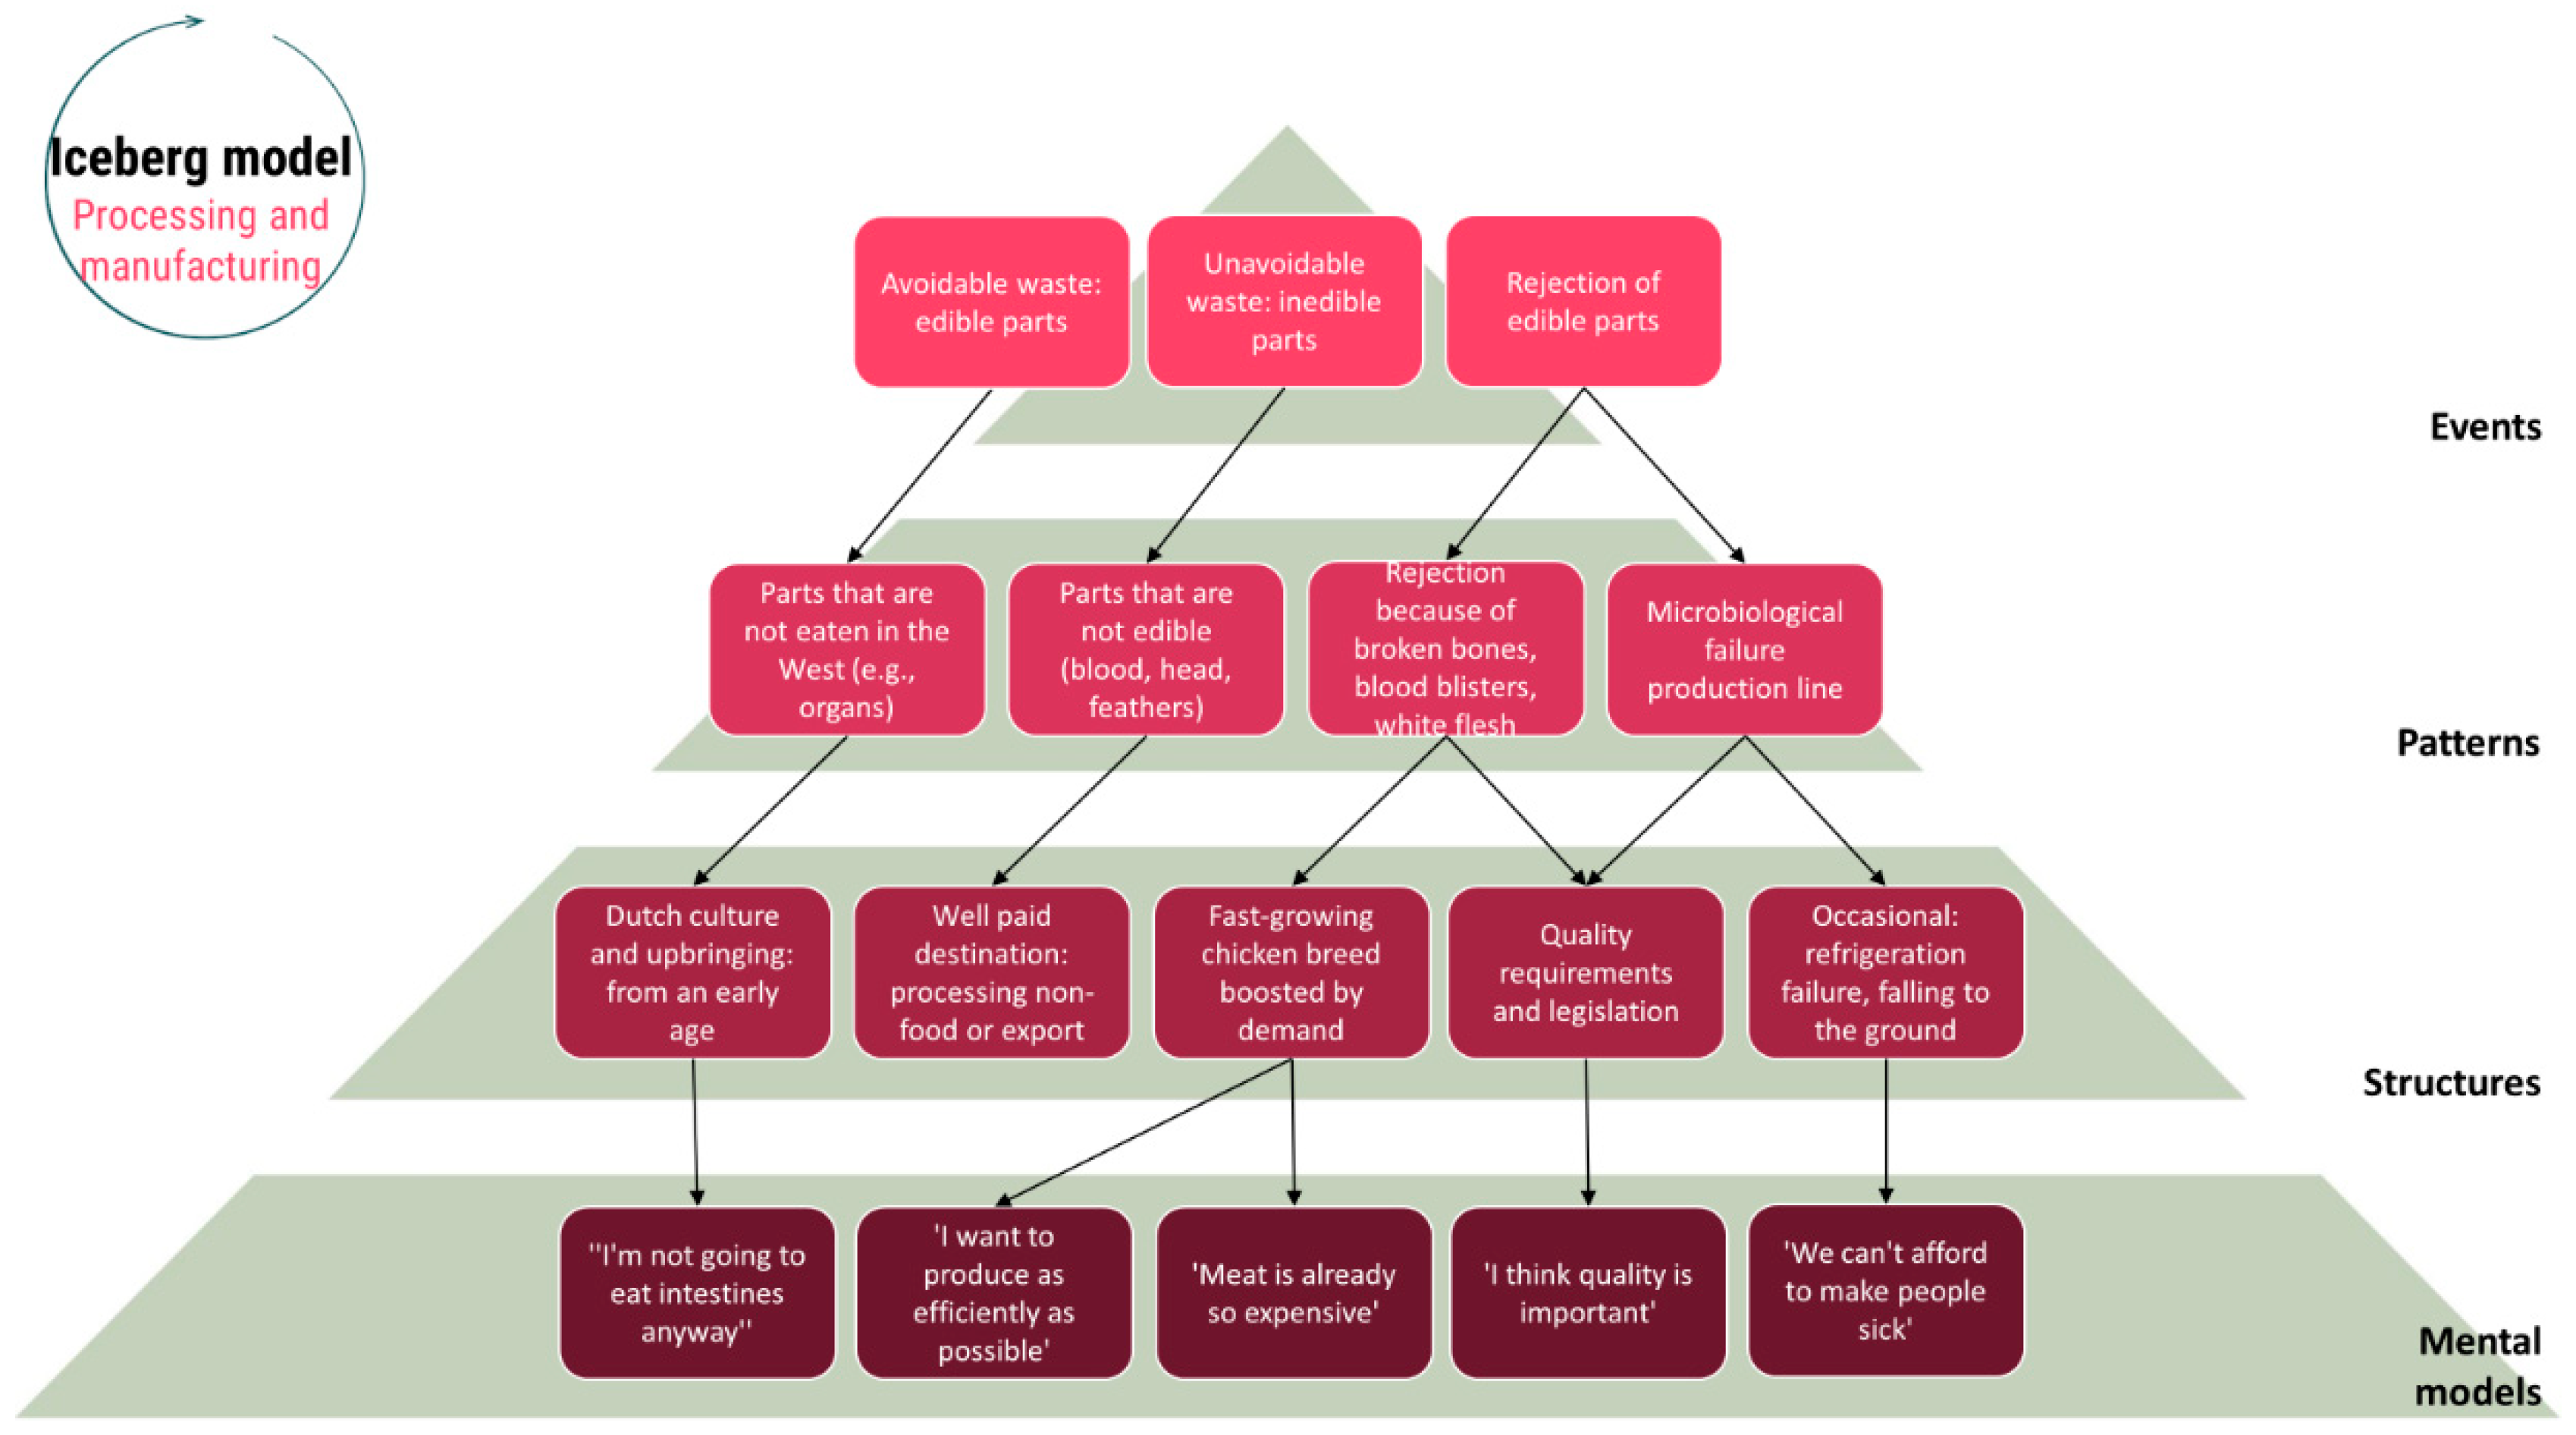
Figure 9.
Iceberg model processing and manufacturing (potato chain).
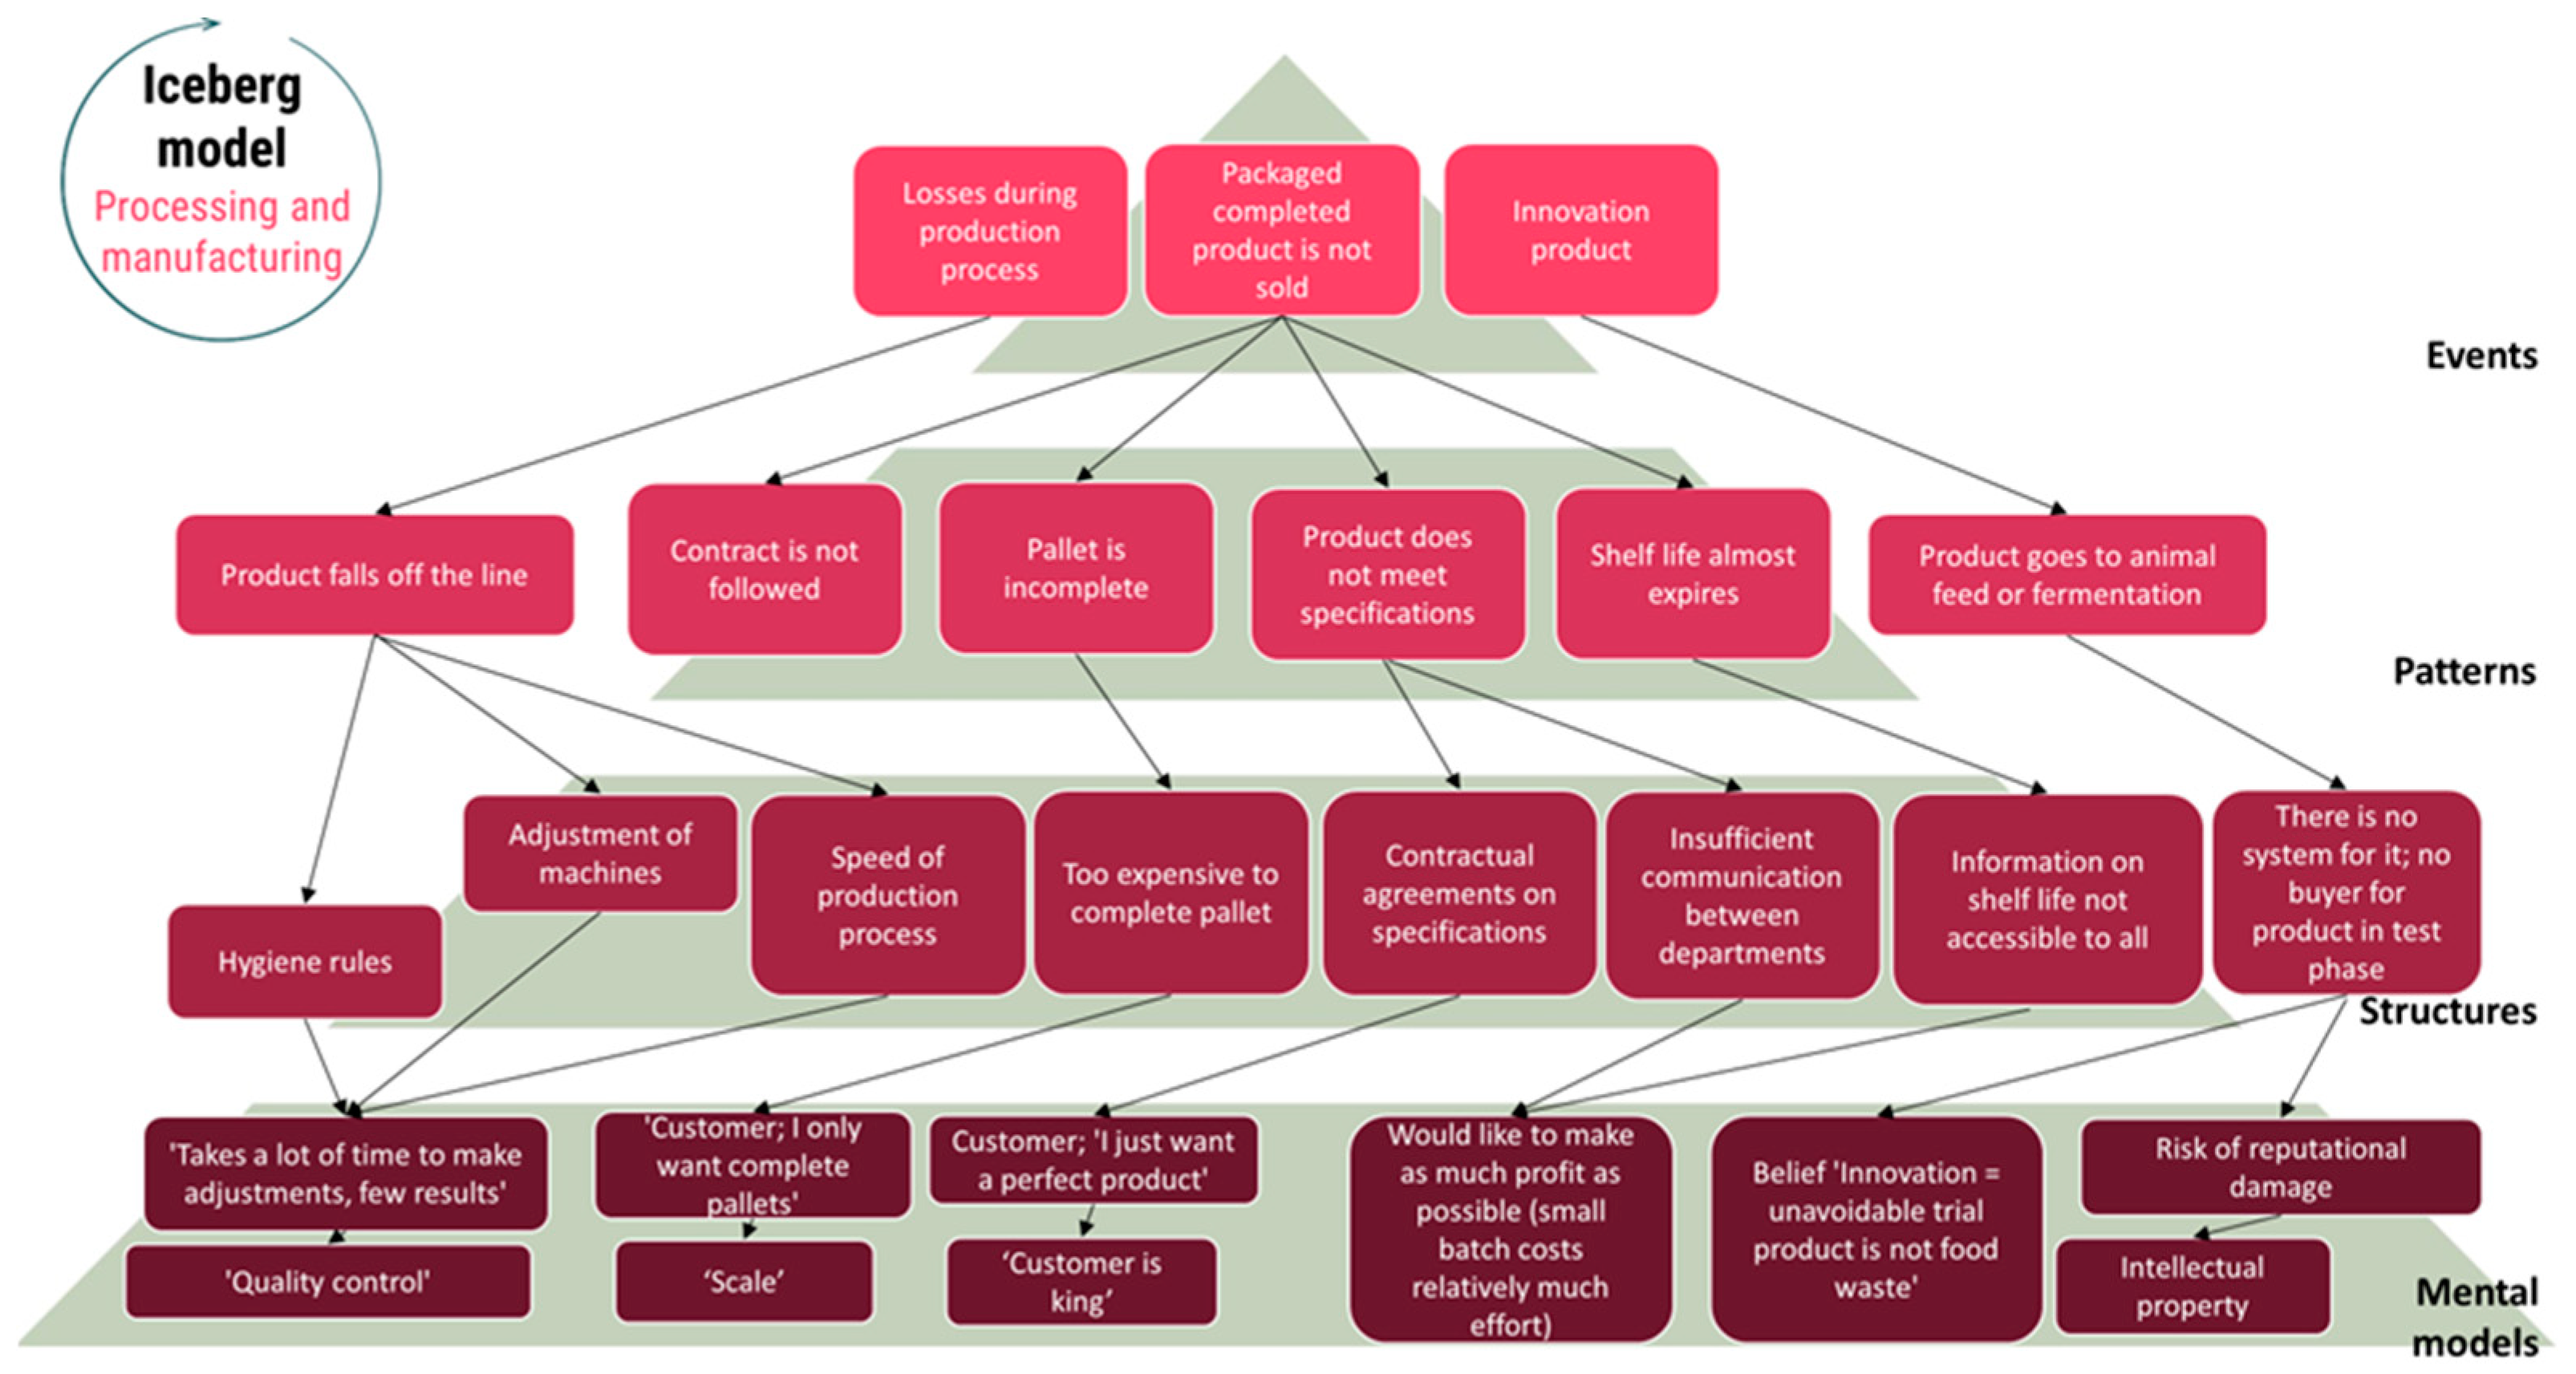
Figure 10.
Iceberg model processing and manufacturing (greenhouse grown fruit vegetables – cutting process).
Figure 10.
Iceberg model processing and manufacturing (greenhouse grown fruit vegetables – cutting process).
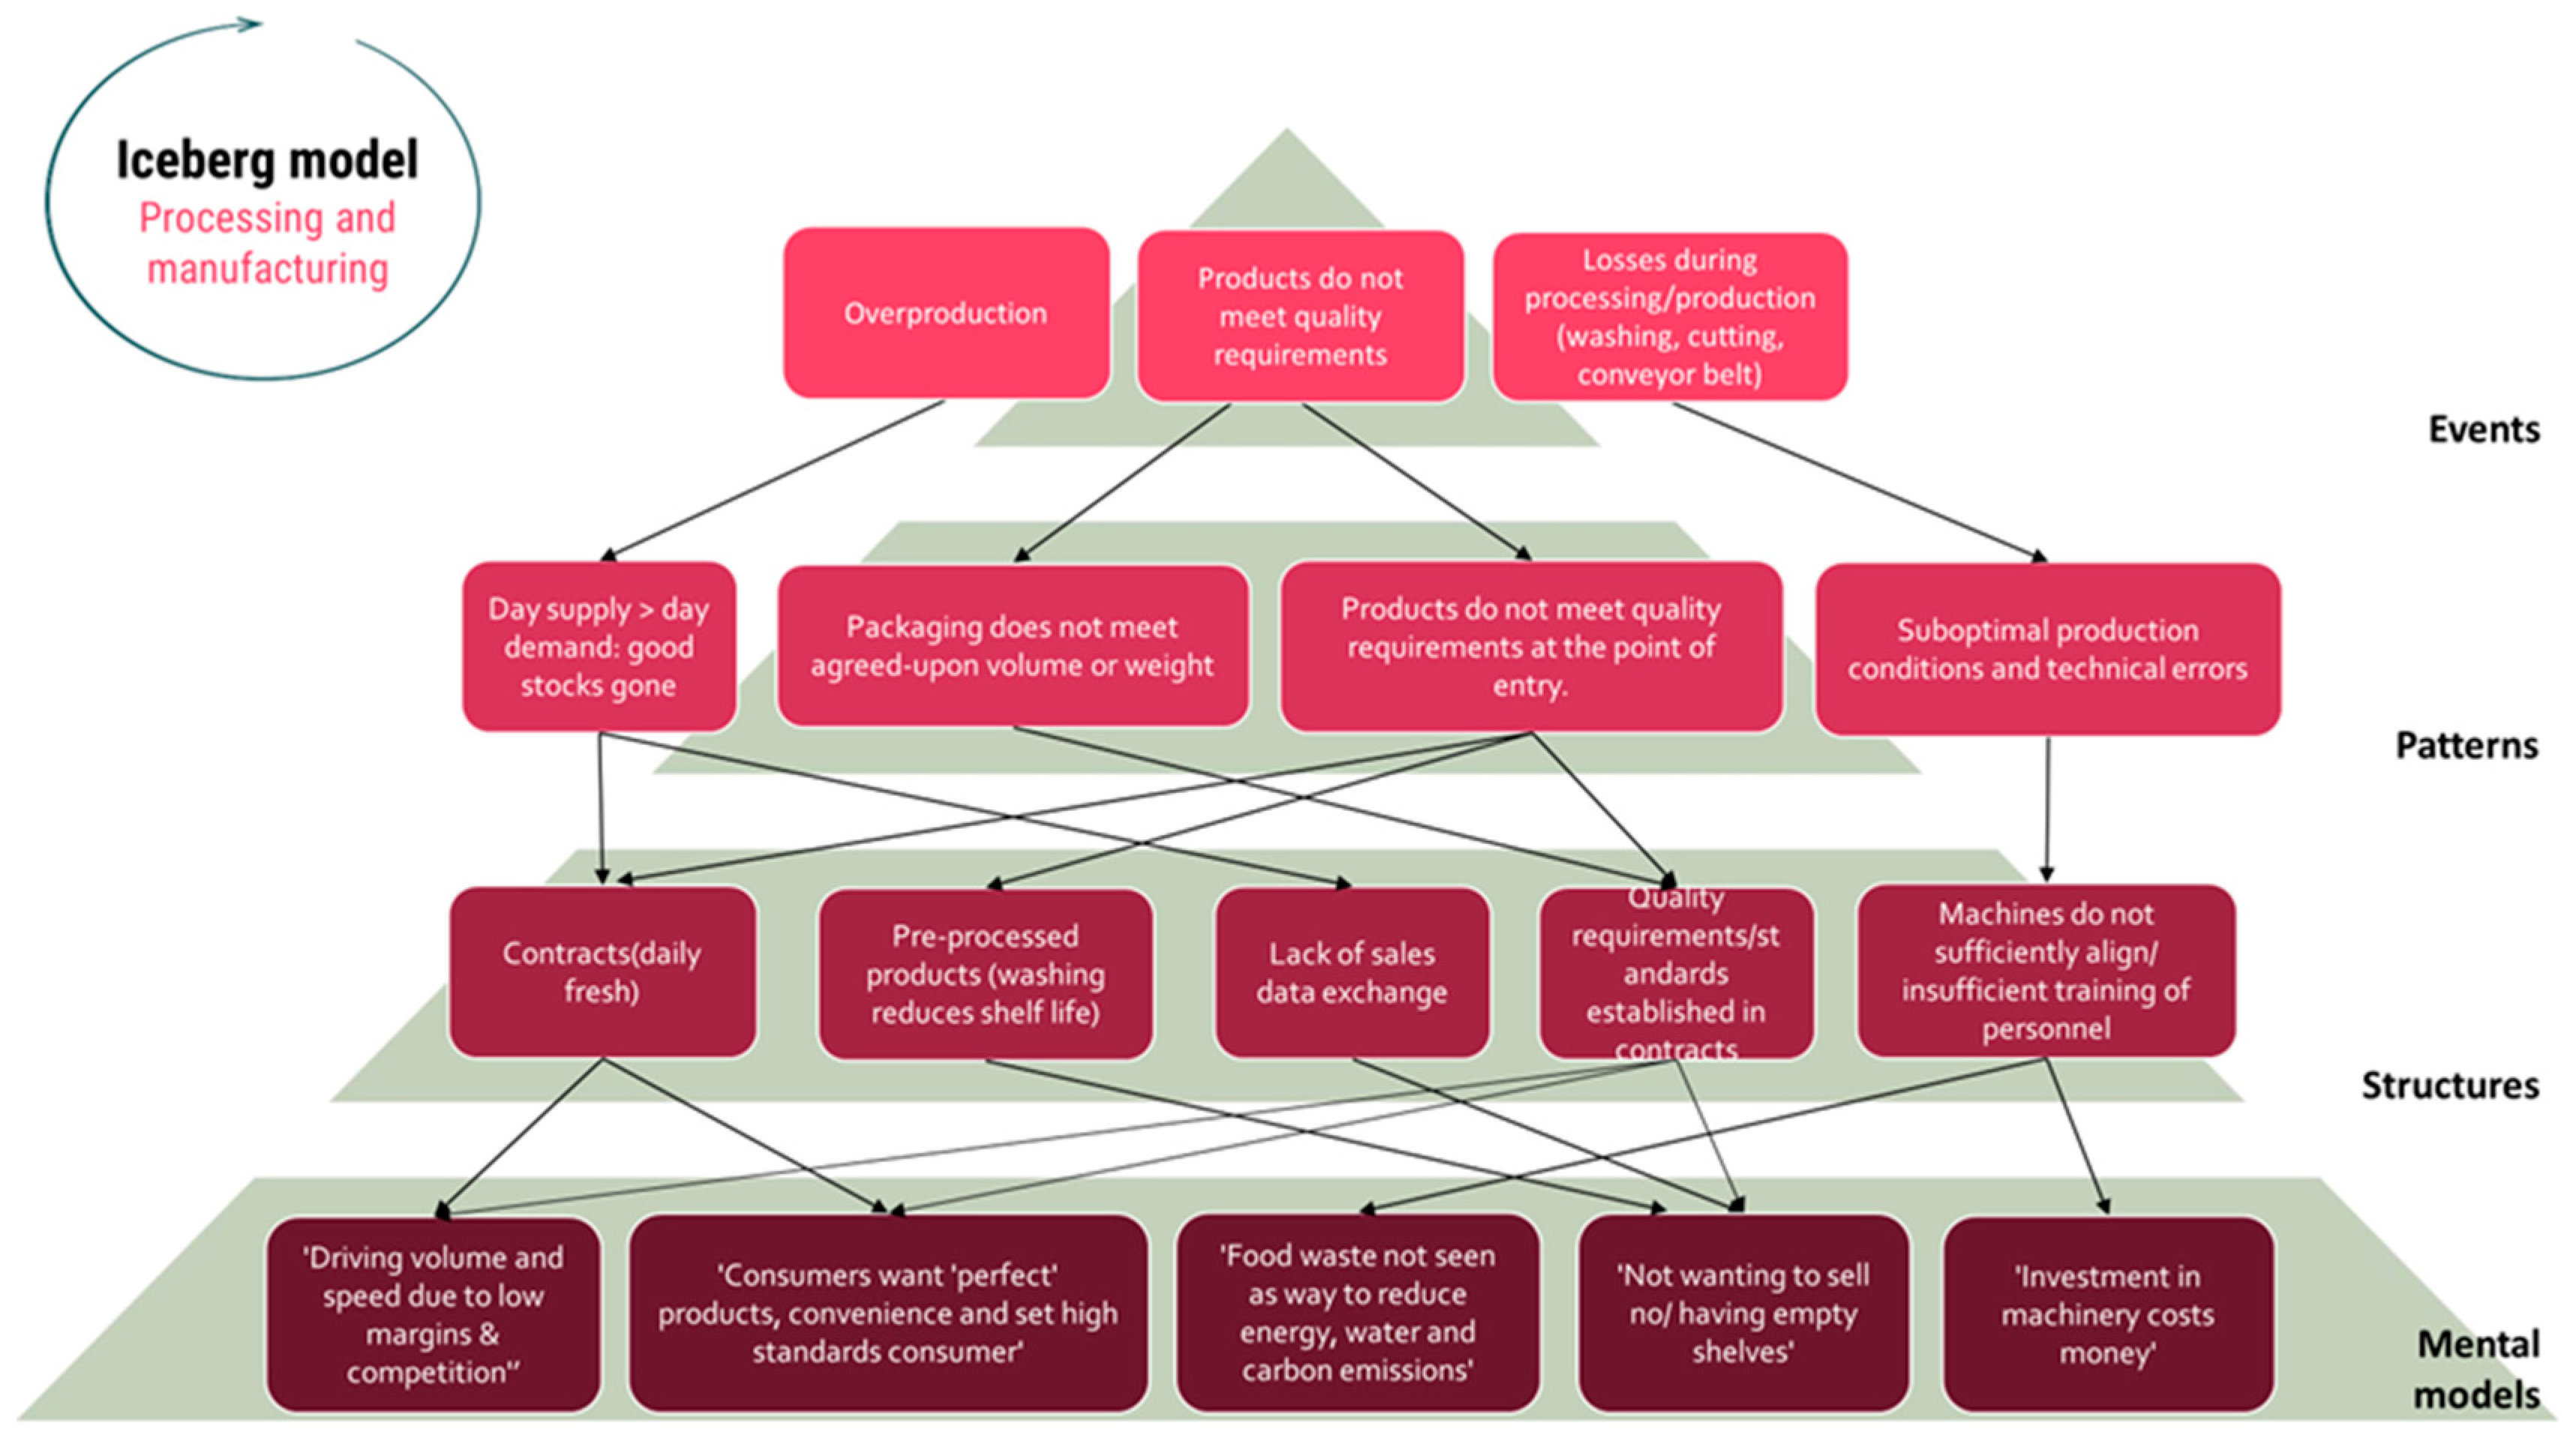
Figure 11.
Iceberg model retail and wholesale markets.
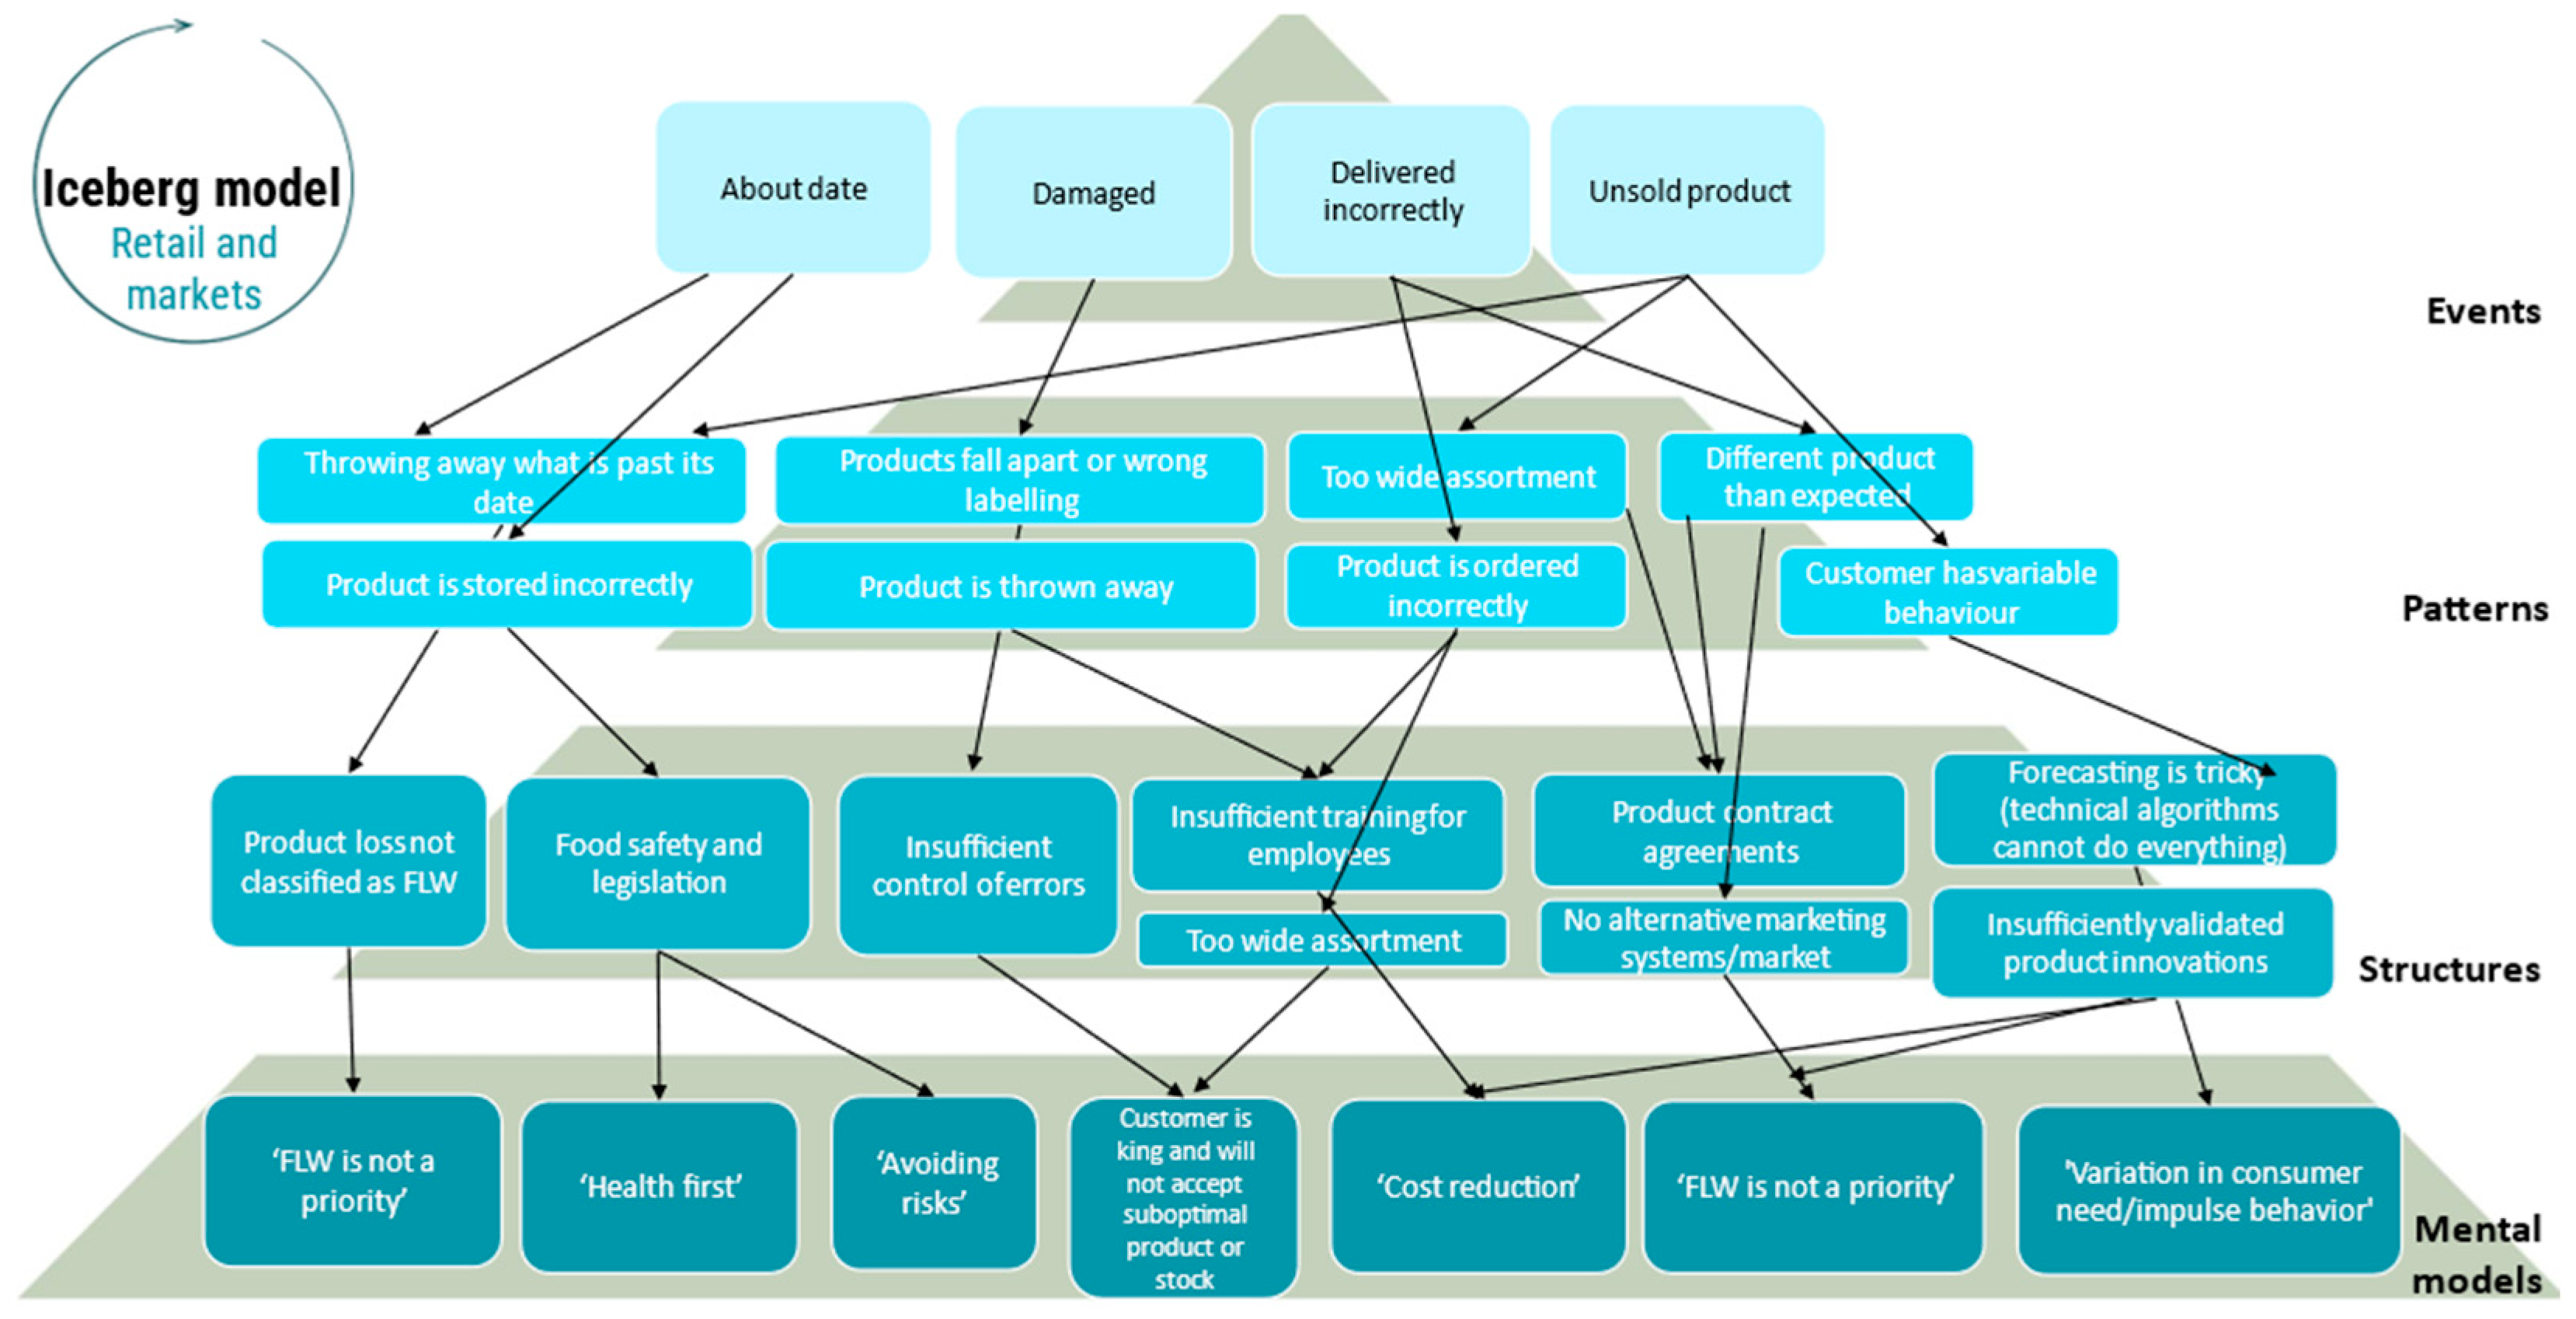
Figure 12.
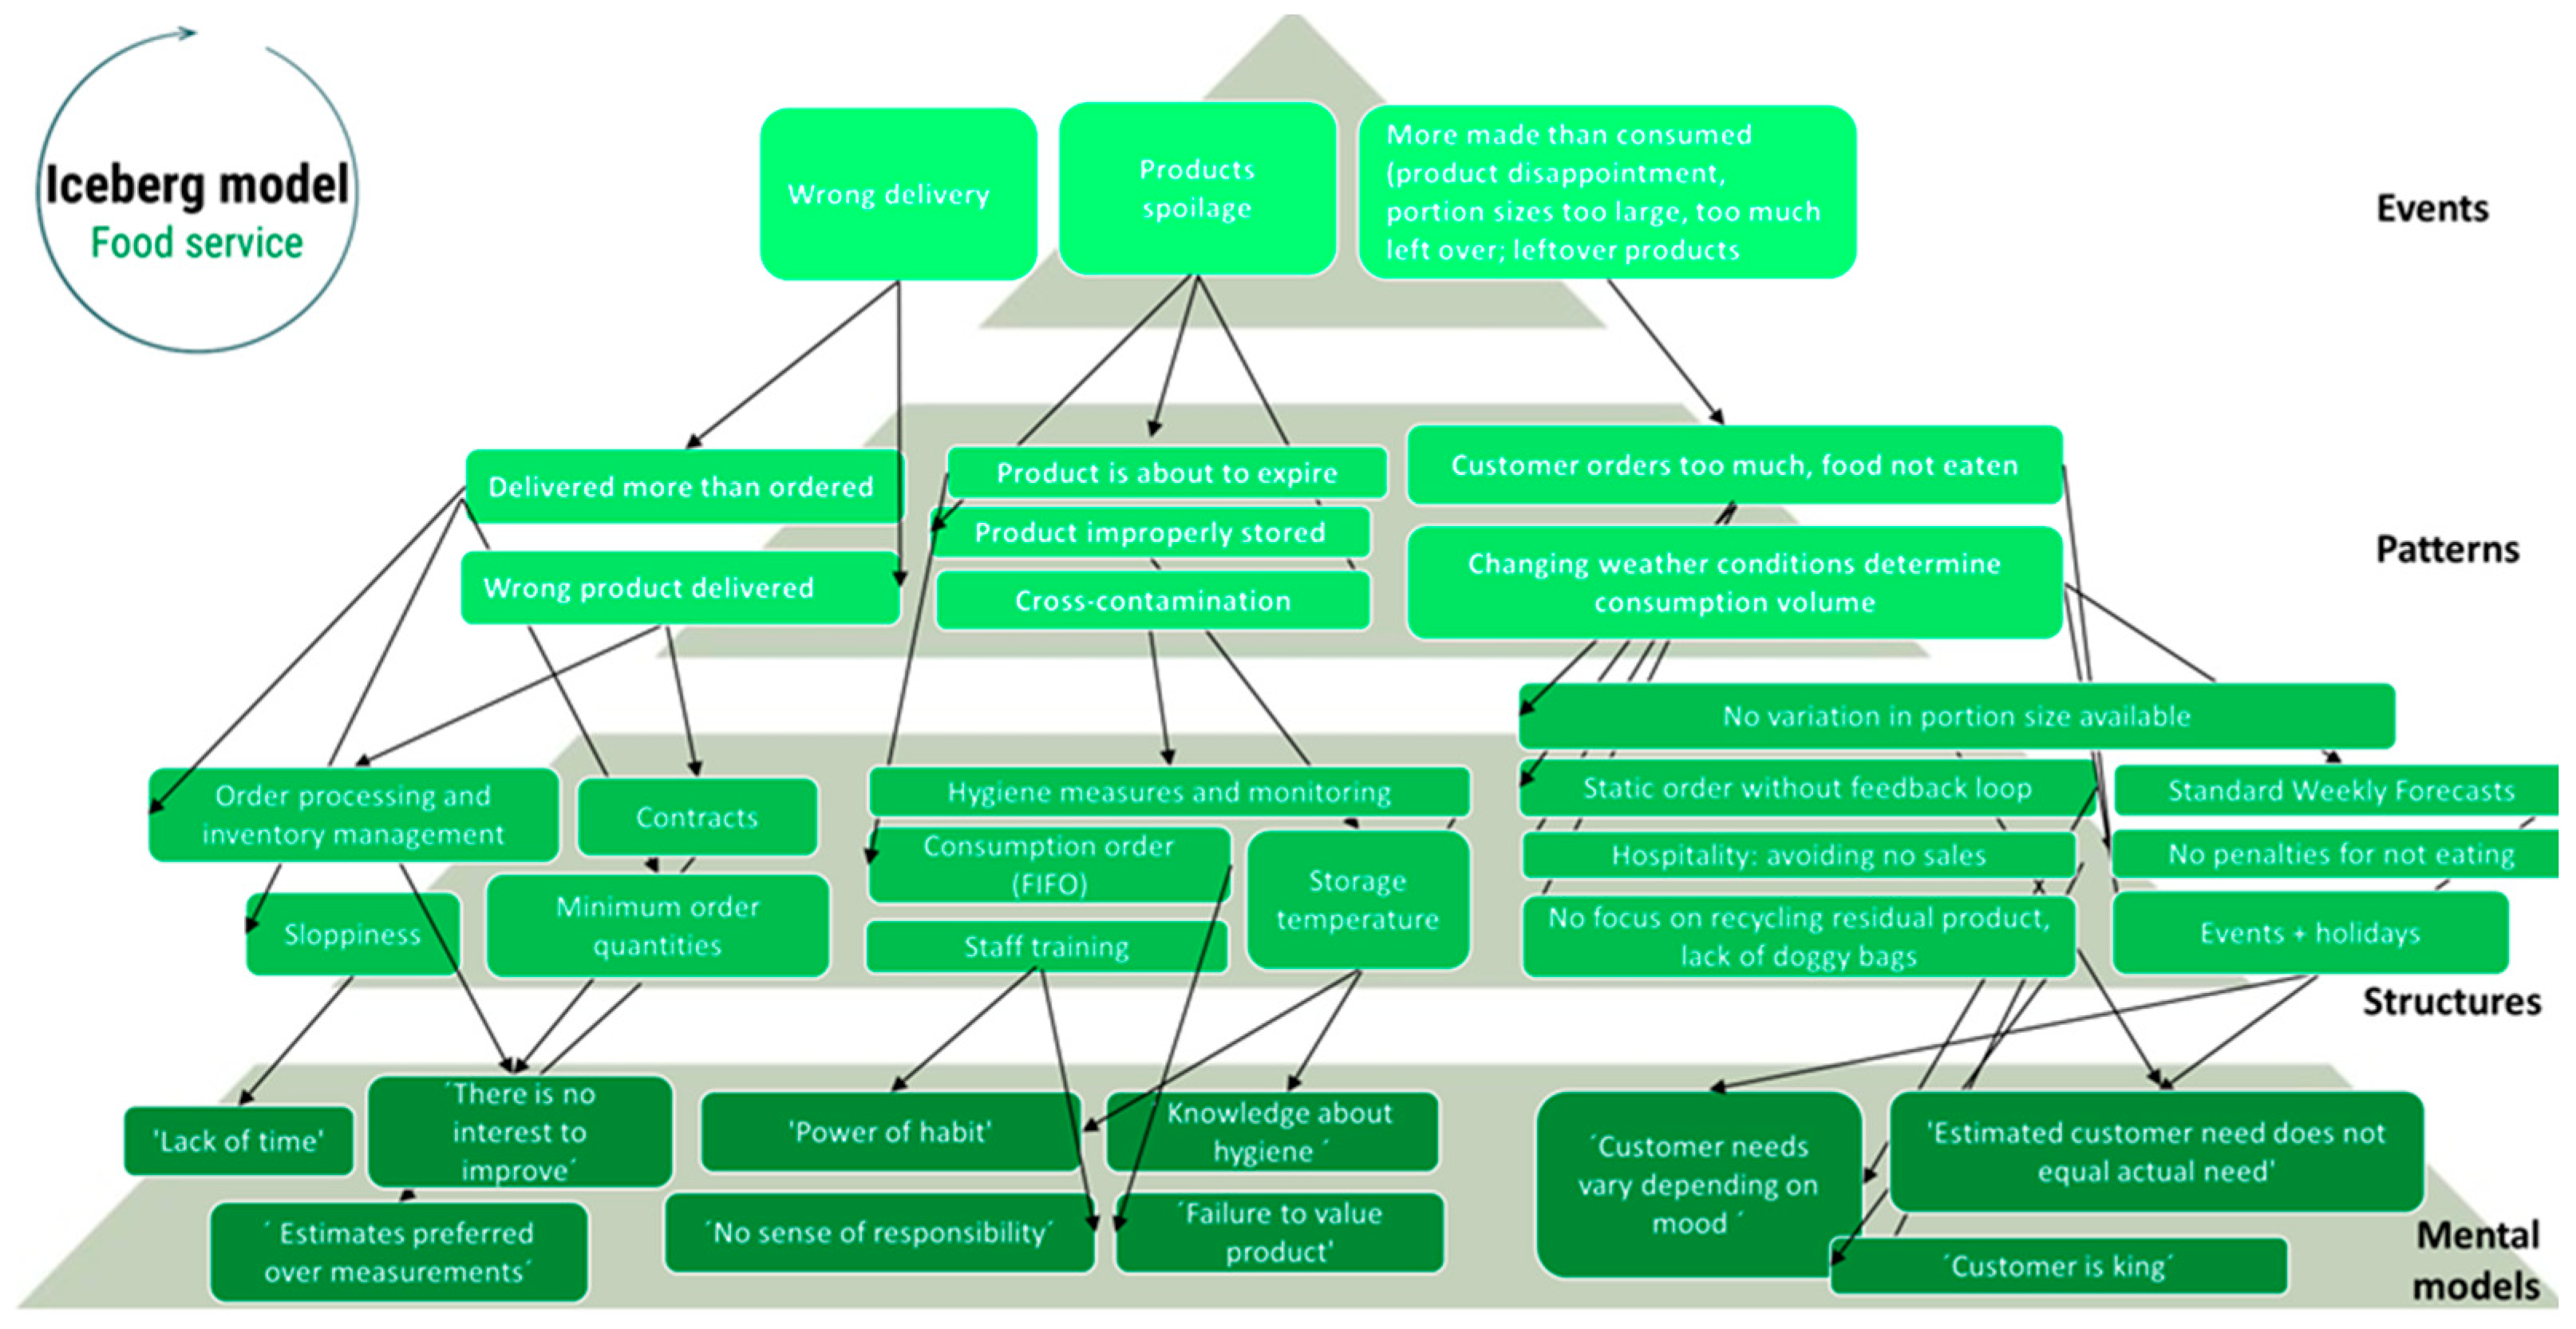
Iceberg model food service.
Common events that were found in processing and manufacturing:
- Product rejected: damaged during primary production or during transport;
- Wrong filling volume in packaging.
Common patterns of behaviour that were found in processing and manufacturing:
- Sampling for quality control;
- Product falls off the line;
- Rejection due to spoilage because of insufficient hygiene or storage measures;
- (Packaged) product is not sold due to logistical reasons (incomplete pallet, breach of contract, stored too long);
- Product is not sold because of overproduction;
- Product is produced but not cleared for market.
Common structures that were found in processing and manufacturing:
- Edible but unknown/unloved part of product is wasted (vegetables/meat);
- Product does not meet buyer's quality requirements;
- Innovation product (product is not sold due to unmet quality standards, proprietary knowledge or risk of image loss);
- Insufficiently trained / skilled personnel.
Common mental models that were found in processing and manufacturing:
- There is no priority to invest in alternative technologies;
- FW is seen as part of the process;
- There is pressure to meet quality and consumer standards;
- Reducing FW is not seen as a way to reduce energy, water and CO2 emissions;
- Volumes need to be high enough to meet customer demand;
- Production should be as efficient as possible.
3.3. Retail and Markets
As all food chains merge in retail, only one Iceberg model is shown. Although a lot of effort went into involving more retailers, we were not able to validate our findings thoroughly in the retail and markets segment.
Common events that were found in retail and wholesale were:
- Products that are past due date;
- Wrong delivery due to wrong order, or different product than expected;
- Damage due to transport / spilling or dropping;
- Unsold product.
Common patterns of behaviour that were found in retail and wholesale were:
- Rejection due to spoilage by insufficient hygiene or storage measures (temperature, first-in-first-out principle); could be summarized as incorrect product handling behaviours;
- Product unsold due to incorrect labelling;
- Unpredictable consumer buying patterns;
- Throwing away products that are past due date;
- Higher volume than demand.
Common structures that were found in retail and wholesale were:
- Product loss is not qualified as FW;
- Insufficient training for employees;
- Forecasting techniques are limited;
- Contractual agreements with regards to high quality.
Common mental models that were found in retail and wholesale were:
- Reducing food waste is not a priority;
- Inability to find trained personnel;
- Desire to please customers;
- Oversupply is the norm.
3.4. Food Service
Common events that were found in food service:
- Wrong delivery/ order;
- Product spoilage;
- Product leftovers (on plates).
Common patterns of behaviour that were found in food service:
- Wrong delivery/ order;
- Incorrect product handling behaviours (storage measures such as temperature, first-in-first-out principle);
- Varying customer needs;
- (Cutting) waste during preparation; obsolete parts are cut away;
- Customers order too much or refuse product (ordered too much, not tasty, too large portion).
Common structures that were found in food service:
- HACCP rules lead to product rejection (in Netherlands, product needs to be discarded / not allowed to be stored after 2 hours outside cooling);
- Demand and volume do not match;
- Limited consequences for the customer when food is not eaten;
- Limited recycling possibility of FW;
- Forecasting techniques are limited.
Common mental models that were found in food service:
- There is a lack of possibilities to reduce food waste (such as time, knowledge, tools);
- Customer wishes are set as a priority;
- Acting because it is a habit rather than taking responsibility to reduce FW.
3.5. Summary Overview of Four Food Chains
Based on all interviews and Iceberg models a summary overview was created for all four food chains. This was done by comparing the chain segments (primary production, processing and manufacturing, retail and markets or food service) at each level (event, patterns of behaviour, structures and mental models) in order to define the recurrent themes.
4. Discussion
In the introduction it was mentioned that literature outcomes of earlier studies are quite generic and there is no direct comparison based on case studies between food chains of a specific nature (such as milk, potato, poultry, fresh produce etc.). By comparing different actual food chains in the Netherlands, a better insight in specific food waste hotspots was created. Each chain has specific challenges regarding FW, for example infectious disease control (i.e. bird flu) is specific for the poultry chain; The milk supply chain is already characterized by a high level of efficiency; however, it also experiences specific losses related to product innovation, particularly in cases where products developed through research and development (R&D) are not approved for market release; the potato chain and greenhouse grown fruit vegetable chain are driven by contractual specifications that often leads to FW. Having this insight helped to feed discussions on how to reduce FW in specific food chains, although we do not show these discussions since they are part of the intellectual property of enterprises. However, understanding food chain-specific challenges helped to set a clear common FW agenda for the chain as a whole and stimulates working together to establish FW reduction targets.
Our hypothesis was that, by placing the drivers of FW in the hierarchical context of system thinking, this would lead to more insights how specific FW hotspots link to underlying patterns of behaviour, structures and mental models of the specific supply chains and thus how interventions at these underlying system structures could be transformative on reducing FW. This was not applied in earlier research after the drivers of FW. Although Canali et al. (Canali et al., 2016) and Priefer et al. (Priefer et al., 2016) mentioned a few specific food waste drivers, we know from the theory that one of the most effective leverage points is the shift in the mental model of a system (van Bruggen et al., 2019). However, only a shift in mental model is not possible without also addressing structures, patterns and events. It is always important to select a mix of interventions in order to cause a paradigm shift(Morone, 2020).
The summary overview (Table 2) gives concrete insights into the most common food waste hotspots and the underlying patterns, structures and mental models. Our findings very much align with the findings of Canali et al. and Priefer et al., and additionally we have given a more in-depth analysis of the relationships between the various levels of food waste leverage points. We have shown which mental models should be shifted according to our findings and supported by literature (Canali et al., 2016; Priefer et al., 2016). The Food Systems Approach toolkit prescribes to define a preferred future (“Lectoraatgroep Future Food Systems – HAS green academy,” n.d.) based on the mental models of the “old system” in order to initiate a shift in the current food system. Based on the earlier mentioned FW leverage points (Table 2) and discussions with operational experts the following preferred future food system could be suggested (Figure 13).
The mental models that require necessary shifts to move towards this preferred future can be envisioned as follows:
Mental models “Reducing FW is not a priority” and "it is more important to offer a competitive price than to prevent food waste”(Nicholes et al., 2019). To shift these mental models, minimizing food waste should be used as part of a competitive food price strategy. The reduction of FW should therefore be top of mind when setting up regulations, procedures, logistics, creating contracts and taking decisions. A first step could be by activating United Nations Sustainable Development Goal 12.3. This goal calls for halving per capita global food waste and retail and consumer levels by 2030, as well as reducing food losses along the production and supply chains (United Nations, n.d.; “Vermindering voedselverspilling | Voeding | Rijksoverheid.nl,” n.d.; Xue et al., 2017). To accelerate the EU's progress towards this goal, the Commission proposes that, by 2030, Member States reduce food waste by 10%, in processing and manufacturing, and by 30% (per capita), jointly at retail and consumption (restaurants, food services and households) (“Food waste reduction targets,” n.d.). Although law and regulation is supportive, a network approach is needed to initiate the right conversations across food chains, such as through the Dutch verspillingsvrije week (“Verspillingsvrije week | Samen Tegen Voedselverspilling,” n.d.) and the International Day of Awareness of FW (“International Day of Awareness of Food Loss and Waste - European Commission,” n.d.). We also think more applied research is needed within and between companies to find tailor-made solutions in order to create a balance between a competitive price and FW reduction.
Mental models “Reducing FW is not seen as a way to make environmental impact” and “there is no intention to invest in alternative techniques if there is no financial incentive”. In order to shift these mental models, the environmental impact of FW should be better explained and financial incentives should be introduced (Cattaneo et al., 2021). Also, investing in new affordable techniques (such as smart monitoring systems, waste tracking, active packaging and AI-driven supply chain solutions) is required to generate possibilities to reduce FW (Aramyan et al., 2021). Chain collaboration is essential in order for certain techniques to be developed. Future interventions should show the positive impact on social and economic factors that could be changed, which was also indicated by Canali et al. as a food waste driver (Canali et al., 2016). For example, in a regulated environment like a greenhouse or barn, it is easier to work with biological protection agents. In the milk chain, there is clear evidence of less wastage due to fewer milk losses as a result of less antibiotic use. The Dutch “better life” chicken is a slower-growing breed which is more resistant to disease, resulting in less chicken drop-out during rearing.
Mental models “there is a lack of employees that have the right skills (to reduce FW)” is often mentioned as a reason for the generation of FW. Canali et al. also mentioned individual non-readily changeable behaviours as a reason for FW (Canali et al., 2016). To shift this, employees could be trained to make a contribution to the reduction of FW by offering them the required skills (Ioannou et al., 2022) and increasing awareness and communication around the topic (Luu, 2020). It is important to note that multinational corporations often find the reduction of food waste to be a worthwhile investment, given the scale of their production operations. In contrast, small and medium-sized enterprises (SMEs) may not perceive the same level of return on investment. When operating on a smaller scale, an investment must pay off against a smaller economic benefit. This is harder within SMEs, where preventing food waste is more often a matter of intrinsic motivation.
The mental models, “oversupply is the norm” (de Visser-Amundson, 2020; Heikkilä et al., 2016; Hennchen, 2019; Okumus et al., 2020; Sakaguchi et al., 2018) and “the pressure to meet quality and consumer criteria lead to overproduction” and therefore a higher supply than demand lead to significant food waste. A related structure, the lack of predictive forecasting techniques could be improved to help reduce FW (Eksoz et al., 2014; Gruber et al., 2016; Teller et al., 2018), requiring chain collaboration in order to succeed. Stimulating supply chain collaboration and aligning ways of working by highlighting the impact of specific actions could help to reduce FW, such as from last minute orders and cancellations. We found that the Dutch dairy, meat and unprocessed fresh produce chains have traditionally been organized through cooperatives. The degree of cooperation per chain seems to depend on the degree of processing in the chain: the dairy and meat chain have a more intensive degree of processing than the fresh produce chain, and tight logistical organization is needed to obtain longer shelf life. Therefore, these chains are much more tightly regulated/organized than in fresh produce where we observed more last-minute orders and cancellations. We also found that organizing the cocreation session with the less organized fruit vegetable chain was successful in creating a new coalition of willing companies that want to reduce FW. It is important to note that a potential drawback of enhanced collaboration within supply chains is that a significant portion of food waste in these chains is attributable to the scaling-up of operations and the increased complexity of food chains. This includes challenges related to transportation and storage. Reducing the number of intermediaries and minimizing transportation between links in the supply chain could potentially mitigate these waste-related issues.
The structure, “quality and consumer criteria leads to FW by excluding certain foods, and making them non-suitable for consumption”. Priefer et al. mentioned process- and market-based standards and non-compliance with food safety requirements as a driver of FW (Priefer et al., 2016). Consumer standards could be influenced by “the sustainability labelling framework” (“Food information to consumers - legislation - European Commission,” n.d.) in order to increase acceptability of small deviations in food products. In addition, the consumer-oriented strategies of companies that develop products tailored to consumer convenience have a significant impact on food waste within supply chains. For example, processing of vegetables has traditionally been focused on preservation, and thus precisely aimed at reducing food waste, but the application in chilled meals and sliced vegetables is a development of the last 10-20 years aimed at consumer convenience. We see that that this convenience trend shifts the food waste from households towards industry. The same is seen in the poultry chain, where expectations around a precise range of meat weight in the packaging lead to product disposure. Canali et al. also mentioned inherent characteristics of food (Canali et al., 2016). Our research in the poultry chain and greenhouse grown fruit vegetable chain shows that certain parts of food were not seen as consumable by consumers (chicken claws, unripe products). In some cases, reintroducing the product or finding alternative processing techniques could help to prevent this FW. A revision of quality standards of products could help to increase acceptance of a wider range of product quality criteria (Jaeger et al., 2018). There is a lot of power within retail and wholesalers, who largely decide for or on behalf of consumers what is sold and therefore what consumers buy. Especially for the fresh produce chain in which less perfect products are thrown away more easily, better acceptance of market alternatives are required such as the development of processed products made with with lesser quality produce (“Food Fellows,” n.d.). The same is seen in the poultry chain, where expectations around a precise range of meat weight in the packaging leads to product disposal. Canali et al. also mentioned inherent characteristics of food (Canali et al., 2016).
In contrary to the results of Priefer et al., in this research societal trends like growing prosperity, declining food prices, rising number of single households and increasing employment of women as drivers behind FW [8] were not found. This is probably due to the fact that households and consumers were excluded from this research.
A new interesting finding that we did not encounter in literature, is the amount of food wasted as a result of new product development processes. For example, one dairy company considers this FW as research and development cost rather than production cost, which makes it possible to overlook this FW hotspot/leverage point. Making companies aware of this hidden FW leverage point may yield new potential areas of food waste reduction for companies.
Several parties in the food chain experience restrictions in regulations that indirectly cause FW (e.g. product release standards, food safety and quality standards, hygiene regulations). Therefore, existing laws (e.g. quality criteria) should be revisited from the perspective of indirect initiation of the generation of food waste (e.g. less perfect cucumbers). Those regulations should be revisited next to the regulations that target reduction of Food wastage directly (“De CSRD komt eraan. En nu? | Grant Thornton,” n.d., EUROPEAN COMMISSION EUROSTAT Directorate E: Sectoral and regional statistics Unit E-2: Environmental statistics and accounts; sustainable development Guidance on reporting of data on food waste and food waste prevention, n.d., “Farm to Fork Strategy,” n.d.). Canali et al. also mentioned other priorities targeted by private and public stakeholders as a driver for FW (Canali et al., 2016), which requires alignment.
Apart from setting the above actions and targets to shift to the preferred future, future research directions should primarily focus on measuring the effectiveness of specific interventions targeting FW reduction as well as the shift in mental models and FW behaviour in practice.
The barriers and proposed interventions above are quite generic, as that was our intention. However diving into each food chain specifically will divulge a more concrete plan of action, that will fit to the specific barriers. We can envisage that rest streams of products are being offered on websites outside of the current food chain, but that will mean that new food chains need to be formed.
5. Conclusions
With this work we have presented the most important FW leverage points, based on uncovered behaviour patterns, structures and mental models in our study across four Dutch food chains. We saw that a few leverage points are generally found across all four food chains, such as:
- Damaged products;
- Oversupply
- Regulations and standards that limit product use;
- Lack of prioritization of FW reduction.
In this paper we have defined key leverage points, and we conclude with the most important interventions to shift the food systems to a preferred future with less FW through combined efforts taken by governments, businesses and individuals:
- Make food waste a priority by setting rules and regulations, but also showing the advantages in financial, social and environmental value; by creating more awareness on food waste in specific business or chain settings;
- Setting sustainability benchmarks and kpi's for food chains as a shared responsibility;
- Setting standards of best practice and sharing best practices in food chains; combined with training food professionals in reducing food waste in companies;
- Setting new mental models in food service in providing just enough instead of too much;
- Revising food quality standards and regulations where possible towards reducing food waste instead of increasing food waste;
- Stimulating cooperation in the food chain by organizing cocreation sessions with food chain representatives in order to start coalitions of willing companies to reduce FW.
With this article we also intended to illustrate the use of a system thinking approach through the Iceberg model in action research, aimed at preventing and reducing food waste. We invite scholars to reflect and build upon this approach and assess its value for action research regarding food system sustainability transitions.
Supplementary Materials
The following supporting information can be downloaded at: Alle materialen van het SIA-project "Voorkomen Voedselverspilling" / Voorkomen Voedselverspilling 2021-2023 - Groen Kennisnet.
Author Contributions
Annelies Verspeek- van der Stelt: Conceptualization, Methodology, formal analysis, investigation, data curation, writing—original draft preparation, writing—review and editing, visualization, supervision. Antien Zuidberg: Conceptualization: Methodology, , formal analysis, investigation, data curation, writing—original draft preparation, writing—review and editing, visualization, supervision, funding acquisition. Evelot Westerink- Duijzer: Validation, , formal analysis, investigation, data curation, writing—review and editing, supervision. Ayella Spaapen: Validation, , formal analysis, investigation, resources, data curation, writing—review and editing, supervision, project administration, Frederike Praasterink: Conceptualization, Methodology, writing—original draft preparation, writing—review and editing, funding acquisition. Woody Maijers: Validation, investigation, data curation, writing—review and editing, supervision.
Funding
'This research is co-financed by Regieorgaan SIA, part of de Dutch Research Council (NWO; Nederlandse Organisatie voor Wetenschappelijk Onderzoek)”.
Informed Consent Statement
Informed consent was obtained from all subjects involved in the study.
Data Availability Statement
All materials are available in section “Alle materialen van het SIA project “Voorkomen Voedselverspilling” at Alle materialen van het SIA-project "Voorkomen Voedselverspilling".
Acknowledgments
All students that worked as part of their bachelor graduation project on the development of the Iceberg models, all contributing companies and stakeholders.
Conflicts of Interest
The authors declare no conflicts of interest. The funders had no role in the design of the study; in the collection, analyses, or interpretation of data; in the writing of the manuscript; or in the decision to publish the results.
Appendix A. Interview Guide
| Vraag | ||
| I | INTRO | Namens een onderzoekssamenwerking tussen diverse hogescholen ben ik vandaag bij u. Mijn naam is…. Mijn functie is…. Wij zijn geïnteresseerd in het in kaart brengen van de zuivel/vlees/AGF keten (de voedsel- en de reststromen). We zijn blij dat u wilt meewerken aan ons onderzoek. |
| 1 | U bent aan ons toegewezen voor het in kaart brengen van de voedings- en reststromen binnen het bedrijf. Zou u uzelf willen voorstellen? Hoe kunnen we gedurende dit proces het beste contact onderhouden? Naam en functie: …………………………… Contactgegevens: …………………………… Afspraken:……………………………………........................................................ ……………………………………......................................................................... ……………………………………......................................................................... |
|
| II | 1 | In hoeverre bent u op de hoogte van het project? |
| toelichting | De hogescholen Aeres, Inholland, HAS, HZ en MBO Lentiz hebben als doelstelling om voor de AFG, Zuivel- en vleesketen beter inzicht te krijgen in de voedselverspilling binnen de diverse ketenschakels. We werken nauw samen met de stichting samen tegen voedselverspilling die meewerkt aan het wereldwijde doel om de voedselverspilling te halveren in het jaar 2030 ten opzichte van 2015. Steeds meer bedrijven zetten doelen, meten en verminderen hun voedselverspilling. U als bedrijf neemt deel aan de keten zuivel / vlees / groente en fruit. | |
| 2 | Zou u de informed consent kunnen ondertekenen? | |
| toelichting |
(indien er nog geen contact is geweest in een eerder gesprek) Kies informed consent op basis van interesse Mogelijke onderdelen:
|
| III | 1a |
Kunt u in de bijgevoegde schets aangeven waar u bent verbonden met andere schakels in de keten?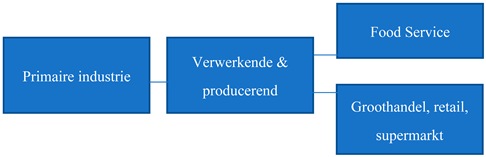
|
|||||||||
| 1b | Van welke type organisaties/bedrijven neemt u af en aan welke type organisaties/bedrijven levert u? | ||||||||||
| 1c | Welke voedselproducten, bijproducten en reststromen worden uitgewisseld? | ||||||||||
| Toelichting 1a/b/c |
Afbakenen welke processen en productielocaties in kaart gebracht worden tijdens dit interview. Na het vaststellen van de keten wordt er gekeken naar voedselproducten, bijproducten en reststromen en of deze worden gevaloriseerd. Ook retouren van andere ketenschakels in dit gesprek meenemen. |
||||||||||
| 2a | Hoe definieert u voedselverspilling binnen uw organisatie? | ||||||||||
|
Consortium definitie van voedselverspilling: Al het voedsel dat bedoeld is voor menselijke consumptie, maar dat niet door mensen wordt geconsumeerd (Soethoudt & Vollebregt, 2020) Uitgangspunt hierbij is dat niet de uiteindelijke benutting maar het oorspronkelijke doel (van het voedsel) centraal staat bij de bepaling of er sprake is van verspilling of niet. 2 voorbeelden noemen:...sinaasappelschillen zijn onderdeel van het voedsel en dus verspilling. |
|||||||||||
| 2b | Hoe hoog acht u de mate van verspilling binnen uw bedrijf/organisatie? | ||||||||||
|
1. geen verspilling |
weinig verspilling | matige verspilling | veel verspilling |
5. erg veel verspilling |
|||||||
| Toelichting | Vraag door: kunt u hierop een toelichting geven? Waarom? |
||||||||||
|
2C |
Hoe hoog acht u de mate van verspilling binnen uw gehele keten? | ||||||||||
| 1. geen verspilling | weinig verspilling | matige verspilling | veel verspilling | 5.erg veel verspilling | |||||||
| Toelichting | Vraag door: kunt u hierop een toelichting geven? Waarom? Definitie keten: zie Terminologie |
||||||||||
| 3a | Hoe relevant is het terugdringen van voedselverspilling voor uw bedrijf? | ||||||||||
|
|||||||||||
| 3b | Welke doelstelling heeft u als bedrijf op het gebied van het terugdringen van voedselverspilling? | ||||||||||
| 4a |
Kunt u opnoemen welke voedsel- en reststromen het meest verspild worden (en welke mogelijk actie vereisen)? Benoem waar in de keten of in het bedrijfsproces deze voedselverspilling ontstaat = verspillingshotspot |
||||||||||
| toelichting | Let op! Deze verspilling kan zowel binnen de ketenschakel als tussen ketenschakels plaatsvinden | ||||||||||
| 4b | Kunt u per verspillingshotspot een inschatting maken hoe hoog deze verspilling is? | ||||||||||
| 1.geen verspilling | weinig verspilling | matige verspilling | veel verspilling | 5. erg veel verspilling | |||||||
| toelichting | |||||||||||
| 4c | Hoe kan deze verspilling worden gedefinieerd? | ||||||||||
| a) Bijproducten / b) potentieel vermijdbaar / c) onvermijdbaar | |||||||||||
| toelichting |
Zie begrippenlijst |
||||||||||
| 4d |
Wat is de economische waarde van deze verspilling? wat betekent dit concreet: in % van een stroom of financiële waarde |
||||||||||
| Hoge waarde | Lage waarde | ||||||||||
| 1 | 2 | 3 | 4 | 5 | 6 | 7 | 8 | 9 | 10 | ||
| toelichting | |||||||||||
| 4e | Vindt deze verspilling constant of incidenteel plaats? | ||||||||||
| toelichting | |||||||||||
| 5 | Waardoor wordt volgens u de verspilling veroorzaakt? | ||||||||||
| 6 | Welke interventie is er mogelijk al toegepast? | ||||||||||
|
Indien Ja, wat was het resultaat, welke aanpak was effectief? Indien Nee, waarom nog niet en welke interventie zou u willen zien? |
|||||||||||
| toelichting | |||||||||||
| 7a | Wat denkt u eruit te kunnen halen door te investeren in het terugdringen van voedselverspilling? | ||||||||||
|
|||||||||||
| 7b | Hoeveel bent u bereid te investeren in het terugdringen van voedselverspilling? | ||||||||||
|
|||||||||||
| 8 |
Als we teruggaan naar de verspillingspunten die we in kaart hebben gebracht. Moeten we dan nog meer partijen / mensen benaderen om de verspillingshotspots beter in kaart te brengen. Zo ja, Wie kunnen we benaderen om dit verspillingspunt verder in kaart te brengen? |
||||||||||
| toelichting |
Toelichting maak specifiek welke samenwerkingsverbanden nodig zijn binnen de ketenschakel en tussen de ketenschakels, en welke contactpersonen daarvoor benaderd moeten worden Toelichting mogelijkheid WP1? |
||||||||||
| 9 | Welk verspillingspunt zou u als bedrijf als eerste willen aanpakken? | ||||||||||
| toelichting | We willen u hartelijk danken voor uw deelname aan dit interview. Wij zullen een samenvatting maken van uw positionering ten behoeve van voedselverspilling en de inventarisatie van voedselverspillingshotspots. Dit document zal ter verificatie naar u opgestuurd worden en vormt de basis van onze keten analyse die we tijdens de co-creatiesessies delen. | ||||||||||
| Question | |||||||||||
| I | INTRO | On behalf of a research collaboration between several applied, I am with you today. My name is.... My job title is.... We are interested in mapping the dairy/meat/fresh produce chain (the food and residual streams). We are glad you would like to participate in our research. |
|||||||||
| 1 | You are assigned to us for mapping the food and residual streams within the company. Would you like to introduce yourself? How can we best maintain contact during this process? Name and position: …………………………… Contact details: …………………………… Agreements:……………………………………..................................................... ……………………………………......................................................................... ……………………………………......................................................................... |
||||||||||
| II | 1 | To what extent are you aware of the project? | |||||||||
| explanation | The universities of applied sciences Aeres, Inholland, HAS, HZ and MBO Lentiz aim to gain better insight into food waste within the various chain links for the fresh produce, dairy and meat chain. We are working closely with the Foundation Together Against Food Wastage on the global goal of halving food waste by the year 2030 compared to 2015. More and more companies are setting goals, measuring and reducing their food waste. You as a company participate in the dairy / meat / fruit and vegetable chain. | ||||||||||
| 2 | Could you please sign the informed consent? | ||||||||||
| explanation |
Choose informed consent based on interest Possible components:
|
||||||||||
| III | 1a |
Can you indicate in the attached sketch where you are connected to other links in the chain?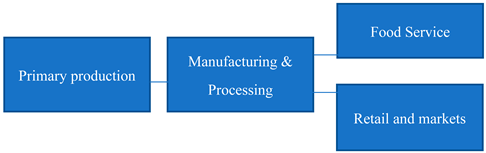
|
|||||||||
| 1b | What type of organizations/companies do you purchase from and what type of organizations/companies do you supply to? | ||||||||||
| 1c | What food products, by-products and residual streams are exchanged? | ||||||||||
| Explanation 1a/b/c |
Delineate which processes and production sites will be mapped during this interview. After defining the chain, look at food products, by-products and residual streams and whether they are valorized. Also include returns from other chain links in this interview. |
||||||||||
| 2a | How do you define food waste within your organization? | ||||||||||
|
Consortium definition of food waste: All food intended for human consumption but not consumed by humans (Soethoudt & Vollebregt, 2020) The premise here is that it is not the final utilization but the original purpose (of the food) that is central in determining whether it is wasted or not. Citing 2 examples:...orange peels are a part of food and therefore wasted. |
|||||||||||
| 2b | How high do you consider the level of waste within your company/organization? | ||||||||||
|
1. No waste |
Little waste | moderate waste | lots of waste |
5. Very much waste |
|||||||
| Explanation | Ask through : can you comment on this? Why? | ||||||||||
|
2C |
How high do you consider the level of waste within your entire supply chain? | ||||||||||
| 1. geen verspilling | weinig verspilling | matige verspilling | veel verspilling | 5.erg veel verspilling | |||||||
| Explanation | Ask through : can you comment on this? Why?Definition chain: see Terminology | ||||||||||
| 3a | How relevant is reducing food waste to your business? | ||||||||||
| o Highly relevant o Relevant o Less relevant o Not relevant |
|||||||||||
| 3b | What goal do you have as a company in terms of reducing food waste? | ||||||||||
| 4a |
Can you list which food and residual streams are most wasted (and which may require action)? Name where in the chain or business process this food waste occurs = food waste hotspot? |
||||||||||
| Explanation | Note! This waste can occur both within the chain link and between chain links | ||||||||||
| 4b | For each food waste hotspot, can you estimate how high this waste is? | ||||||||||
| 1.no waste | little waste | moderate waste | much waste | 5. very much waste | |||||||
| Explanation | |||||||||||
| 4c | How can this waste be defined? | ||||||||||
| By-products / (b) potentially avoidable / (c) unavoidable | |||||||||||
| Explanation | See glossary | ||||||||||
| 4d |
What is the economic value of this wastage? What does this mean specifically: in % of a stream or financial value |
||||||||||
| High value | Low value | ||||||||||
| 1 | 2 | 3 | 4 | 5 | 6 | 7 | 8 | 9 | 10 | ||
| Explanation | |||||||||||
| 4e | Does this waste occur constantly or occasionally? | ||||||||||
| Explanation | |||||||||||
| 5 | What do you think causes food waste? | ||||||||||
| 6 | What intervention may have been used already? | ||||||||||
|
If Yes, what was the result, what approach was effective? If No, why not yet and what intervention would you like to see? |
|||||||||||
| Explanation | |||||||||||
| 7a | What do you think you can gain by investing in reducing food waste? | ||||||||||
| o Cost savings o Sustainability label o The environment is important to our business o Prevention of surpluses o Other, namely ... |
|||||||||||
| 7b | How much are you willing to invest in order to reduce food waste? | ||||||||||
| o The investment must be financially profitable o I am willing to invest even if it does not provide direct financial gain o The investment must be financially profitable o Other , namely .... |
|||||||||||
| 8 |
If we go back to the food waste hotspots we have mapped. Should we then approach more parties/people to better map the food waste hotspots. If yes, Who can we approach to further map this waste point? |
||||||||||
| Explanation |
Explanation make specific which partnerships are needed within the chain link and between the chain links, and which contacts should be approached for this purpose Explanation possibility WP1? |
||||||||||
| 9 | Which food waste hotspot would you, as a company, want to address first? | ||||||||||
| Explanation | We would like to thank you very much for participating in this interview. We will produce summary of your positioning regarding food waste and the food waste hotspots. This document will be sent to you for verification and will form the basis of our chain analysis shared during the co-creation sessions. | ||||||||||
References
- About FUSIONS [WWW Document], n.d. URL http://eu-fusions.org/index.php/about-fusions#work-structure (accessed 11.10.22).
- Aramyan, L. , Grainger, M., Logatcheva, K., Piras, S., Setti, M., Stewart, G., Vittuari, M., 2021. Food waste reduction in supply chains through innovations: a review. Meas. Bus. Excell. 25, 475–492. [CrossRef]
- Bagherzadeh, M. , 2019. A FOOD SYSTEMS’ APPROACH TO FOOD LOSS AND WASTE Open Forum on Resilience in Agriculture.
- Caldeira, C. , De Laurentiis, V., Corrado, S., van Holsteijn, F., Sala, S., 2019. Quantification of food waste per product group along the food supply chain in the European Union: a mass flow analysis. Resour. Conserv. Recycl. 149, 479–488. [CrossRef]
- Canali, M. , Amani, P., Aramyan, L., Gheoldus, M., Moates, G., Östergren, K., Silvennoinen, K., Waldron, K., Vittuari, M., 2016. Food Waste Drivers in Europe, from Identification to Possible Interventions. Sustain. 2017, Vol. 9, Page 37 9, 37. [CrossRef]
- Cattaneo, A. , Federighi, G., Vaz, S., 2021. The environmental impact of reducing food loss and waste: A critical assessment. Food Policy 98, 101890. [CrossRef]
- De CSRD komt eraan. En nu? | Grant Thornton [WWW Document], n.d. URL https://www.grantthornton.nl/toekomstbestendig-ondernemen-csrd/?&utm_medium=cpc&utm_source=google&utm_campaign=20211224_P0153_ENG_N_SL_ADV_Sustainability&utm_content=lp toekomstbestendig ondernemen csrd&utm_term=%5BNL%5D&mkt_medium=cpc&mkt_source=google&mkt_campaign=20211224_P0153_ENG_N_SL_ADV_Sustainability&mkt_term=%5BNL%5D&mkt_content=lp toekomstbestendig ondernemen csrd&gclid=EAIaIQobChMI_Mzer5mGgAMV4YpoCR1Jrg7gEAAYAiAAEgJD7fD_BwE (accessed 7.11.23).
- de Visser-Amundson, A., 2020. A multi-stakeholder partnership to fight food waste in the hospitality industry: a contribution to the United Nations Sustainable Development Goals 12 and 17. https://doi.org/10.1080/09669582.2020.1849232 30, 2448–2475. [CrossRef]
- Efficient Food Loss & Waste Protocol [WWW Document], n.d. URL https://sites.google.com/iastate.edu/phlfwreduction/home/efficient-food-loss-waste-protocol (accessed 7.10.23).
- Eksoz, C. , Mansouri, S.A., Bourlakis, M., 2014. Collaborative forecasting in the food supply chain: A conceptual framework. Int. J. Prod. Econ. 158, 120–135. [CrossRef]
- EUROPEAN COMMISSION EUROSTAT Directorate E: Sectoral and regional statistics Unit E-2: Environmental statistics and accounts; sustainable development Guidance on reporting of data on food waste and food waste prevention, n.d.
- FAO, F. and A.O. of the U.N., IFAD, I.F. for A.D., UNICEF, U.N.C.F., WFP, W.F.P., WHO, W.H.O., 2019. The State of Food Security and Nutrition in the World: Safeguarding against economic slowdowns and downturns. Food Agric. Organ. United Nations 239.
- Farm to Fork Strategy [WWW Document], n.d. URL https://food.ec.europa.eu/horizontal-topics/farm-fork-strategy_nl (accessed 5.8.23).
- Fight climate change by preventing food waste | Stories | WWF [WWW Document], n.d. URL https://www.worldwildlife.org/stories/fight-climate-change-by-preventing-food-waste (accessed 3.11.24).
- Food information to consumers - legislation - European Commission [WWW Document], n.d. URL https://food.ec.europa.eu/safety/labelling-and-nutrition/food-information-consumers-legislation_en (accessed 2.15.24).
- Food waste reduction targets [WWW Document], n.d. URL https://food.ec.europa.eu/safety/food-waste/eu-actions-against-food-waste/food-waste-reduction-targets_en (accessed 7.6.23).
- Gruber, V. , Holweg, C., Teller, C., 2016. What a Waste! Exploring the Human Reality of Food Waste from the Store Manager’s Perspective. https://doi.org/10.1509/jppm.14.095 35, 3-25. [CrossRef]
- Heikkilä, L. , Reinikainen, A., Katajajuuri, J.M., Silvennoinen, K., Hartikainen, H., 2016. Elements affecting food waste in the food service sector. Waste Manag. 56, 446–453. [CrossRef]
- Hennchen, B. , 2019. Knowing the kitchen: Applying practice theory to issues of food waste in the food service sector. J. Clean. Prod. 225, 675–683. [CrossRef]
- International Day of Awareness of Food Loss and Waste - European Commission [WWW Document], n.d. URL https://food.ec.europa.eu/safety/food-waste/international-day-awareness-food-loss-and-waste_en (accessed 2.15.24).
- Ioannou, T. , Bazigou, K., Katsigianni, A., Fotiadis, M., Chroni, C., Manios, T., Daliakopoulos, I., Tsompanidis, C., Michalodimitraki, E., Lasaridi, K., 2022. The “A2UFood Training Kit”: Participatory Workshops to Minimize Food Loss and Waste. Sustain. 2022, Vol. 14, Page 2446 14, 2446. [CrossRef]
- Jaeger, S.R. , Machín, L., Aschemann-Witzel, J., Antúnez, L., Harker, F.R., Ares, G., 2018. Buy, eat or discard? A case study with apples to explore fruit quality perception and food waste. Food Qual. Prefer. 69, 10–20. [CrossRef]
- Kok, M.G. , Castelein, R.B., Broeze, J., Snels, J.C.M.A., 2021. The EFFICIENT protocol: A pragmatic and integrated methodology for food loss and waste quantification, analysis of causes and intervention design. [CrossRef]
- Lectoraatgroep Future Food Systems – HAS green academy [WWW Document], n.d. URL https://www.has.nl/onderzoek/lectoraten/lectoraatgroep-future-food-systems/ (accessed 3.5.24).
- Luu, T.T. , 2020. Reducing food waste behavior among hospitality employees through communication: dual mediation paths. Int. J. Contemp. Hosp. Manag. 32, 1881–1904. [CrossRef]
- Maani, K. , Cavana, R.Y., 2007. Systems thinking, system dynamics : managing change and complexity 278.
- Meadows, D. , 2008. Leverage Points: Places to Intervene in a System - The Donella Meadows Project [WWW Document]. URL https://donellameadows.org/archives/leverage-points-places-to-intervene-in-a-system/ (accessed 5.30.23).
- Monat, J.P., Gannon, T.F., 2015. What is Systems Thinking? A Review of Selected Literature Plus Recommendations. Am. J. Syst. Sci. 2015, 11–26. [CrossRef]
- Morone, P. , 2020. A PARADIGM SHIFT IN SUSTAINABILITY: FROM LINES TO CIRCLES. Acta Innov. 5–16.
- Muth, M.K. , Birney, C., Cuéllar, A., Finn, S.M., Freeman, M., Galloway, J.N., Gee, I., Gephart, J., Jones, K., Low, L., Meyer, E., Read, Q., Smith, T., Weitz, K., Zoubek, S., 2019. A systems approach to assessing environmental and economic effects of food loss and waste interventions in the United States. Sci. Total Environ. 685, 1240–1254. [CrossRef]
- Nicholes, M.J. , Quested, T.E., Reynolds, C., Gillick, S., Parry, A.D., 2019. Surely you don’t eat parsnip skins? Categorising the edibility of food waste. Resour. Conserv. Recycl. 147, 179–188. [CrossRef]
- Okumus, B. , Taheri, B., Giritlioglu, I., Gannon, M.J., 2020. Tackling food waste in all-inclusive resort hotels. Int. J. Hosp. Manag. 88, 102543. [CrossRef]
- Priefer, C. , Jörissen, J., Bräutigam, K.R., 2016. Food waste prevention in Europe – A cause-driven approach to identify the most relevant leverage points for action. Resour. Conserv. Recycl. 109, 155–165. [CrossRef]
- Richter, B. , Bokelmann, W., 2018. The significance of avoiding household food waste – A means-end-chain approach. Waste Manag. 74, 34–42. [CrossRef]
- Sakaguchi, L. , Pak, N., Potts, M.D., 2018. Tackling the issue of food waste in restaurants: Options for measurement method, reduction and behavioral change. J. Clean. Prod. 180, 430–436. [CrossRef]
- Scherhaufer, S. , Moates, G., Hartikainen, H., Waldron, K., Obersteiner, G., 2018. Environmental impacts of food waste in Europe. Waste Manag. 77, 98–113. [CrossRef]
- Soethoudt, H. , Timmermans, T., 2020. Monitor Voedselverspilling. Report.
- Sustainability Pathways: Food loss and waste [WWW Document], n.d. URL https://www.fao.org/nr/sustainability/food-loss-and-waste/en/ (accessed 7.6.23).
- Systems Theory, n.d.
- Teller, C. , Holweg, C., Reiner, G., Kotzab, H., 2018. Retail store operations and food waste. J. Clean. Prod. 185, 981–997. [CrossRef]
- Thyberg, K.L. , Tonjes, D.J., 2016. Drivers of food waste and their implications for sustainable policy development. Resour. Conserv. Recycl. 106, 110–123. [CrossRef]
- UNEP Food Waste Index Report 2021 | UNEP - UN Environment Programme [WWW Document], n.d. URL https://www.unep.org/resources/report/unep-food-waste-index-report-2021 (accessed 7.10.23).
- United Nations, n.d. Food Loss and Waste Reduction | United Nations.
- Van Berkum, S., Ruben, R., n.d. The food systems approach: sustainable solutions for a sufficient supply of healthy food.
- van Bruggen, A., Nikolic, I., Kwakkel, J., 2019. Modeling with Stakeholders for Transformative Change. Sustain. 2019, Vol. 11, Page 825 11, 825. [CrossRef]
- Vermindering voedselverspilling | Voeding | Rijksoverheid.nl [WWW Document], n.d. URL https://www.rijksoverheid.nl/onderwerpen/voeding/vermindering-voedselverspilling (accessed 11.19.24).
- Verspillingsvrije week | Samen Tegen Voedselverspilling [WWW Document], n.d. URL https://samentegenvoedselverspilling.nl/verspillingsvrijeweek (accessed 2.15.24).
- Voedselverspilling in Nederlandse ziekenhuizen - PDF Gratis download [WWW Document], n.d. URL https://docplayer.nl/57513681-Voedselverspilling-in-nederlandse-ziekenhuizen.html (accessed 9.9.22).
- Xue, L. , Liu, G., Parfitt, J., Liu, X., Van Herpen, E., Stenmarck, Å., O’Connor, C., Östergren, K., Cheng, S., 2017. Missing Food, Missing Data? A Critical Review of Global Food Losses and Food Waste Data. Environ. Sci. Technol. 51, 6618–6633. [CrossRef]
Figure 1.
Iceberg model from: https://donellameadows.org/systems-thinking-resources/.
Figure 1.
Iceberg model from: https://donellameadows.org/systems-thinking-resources/.
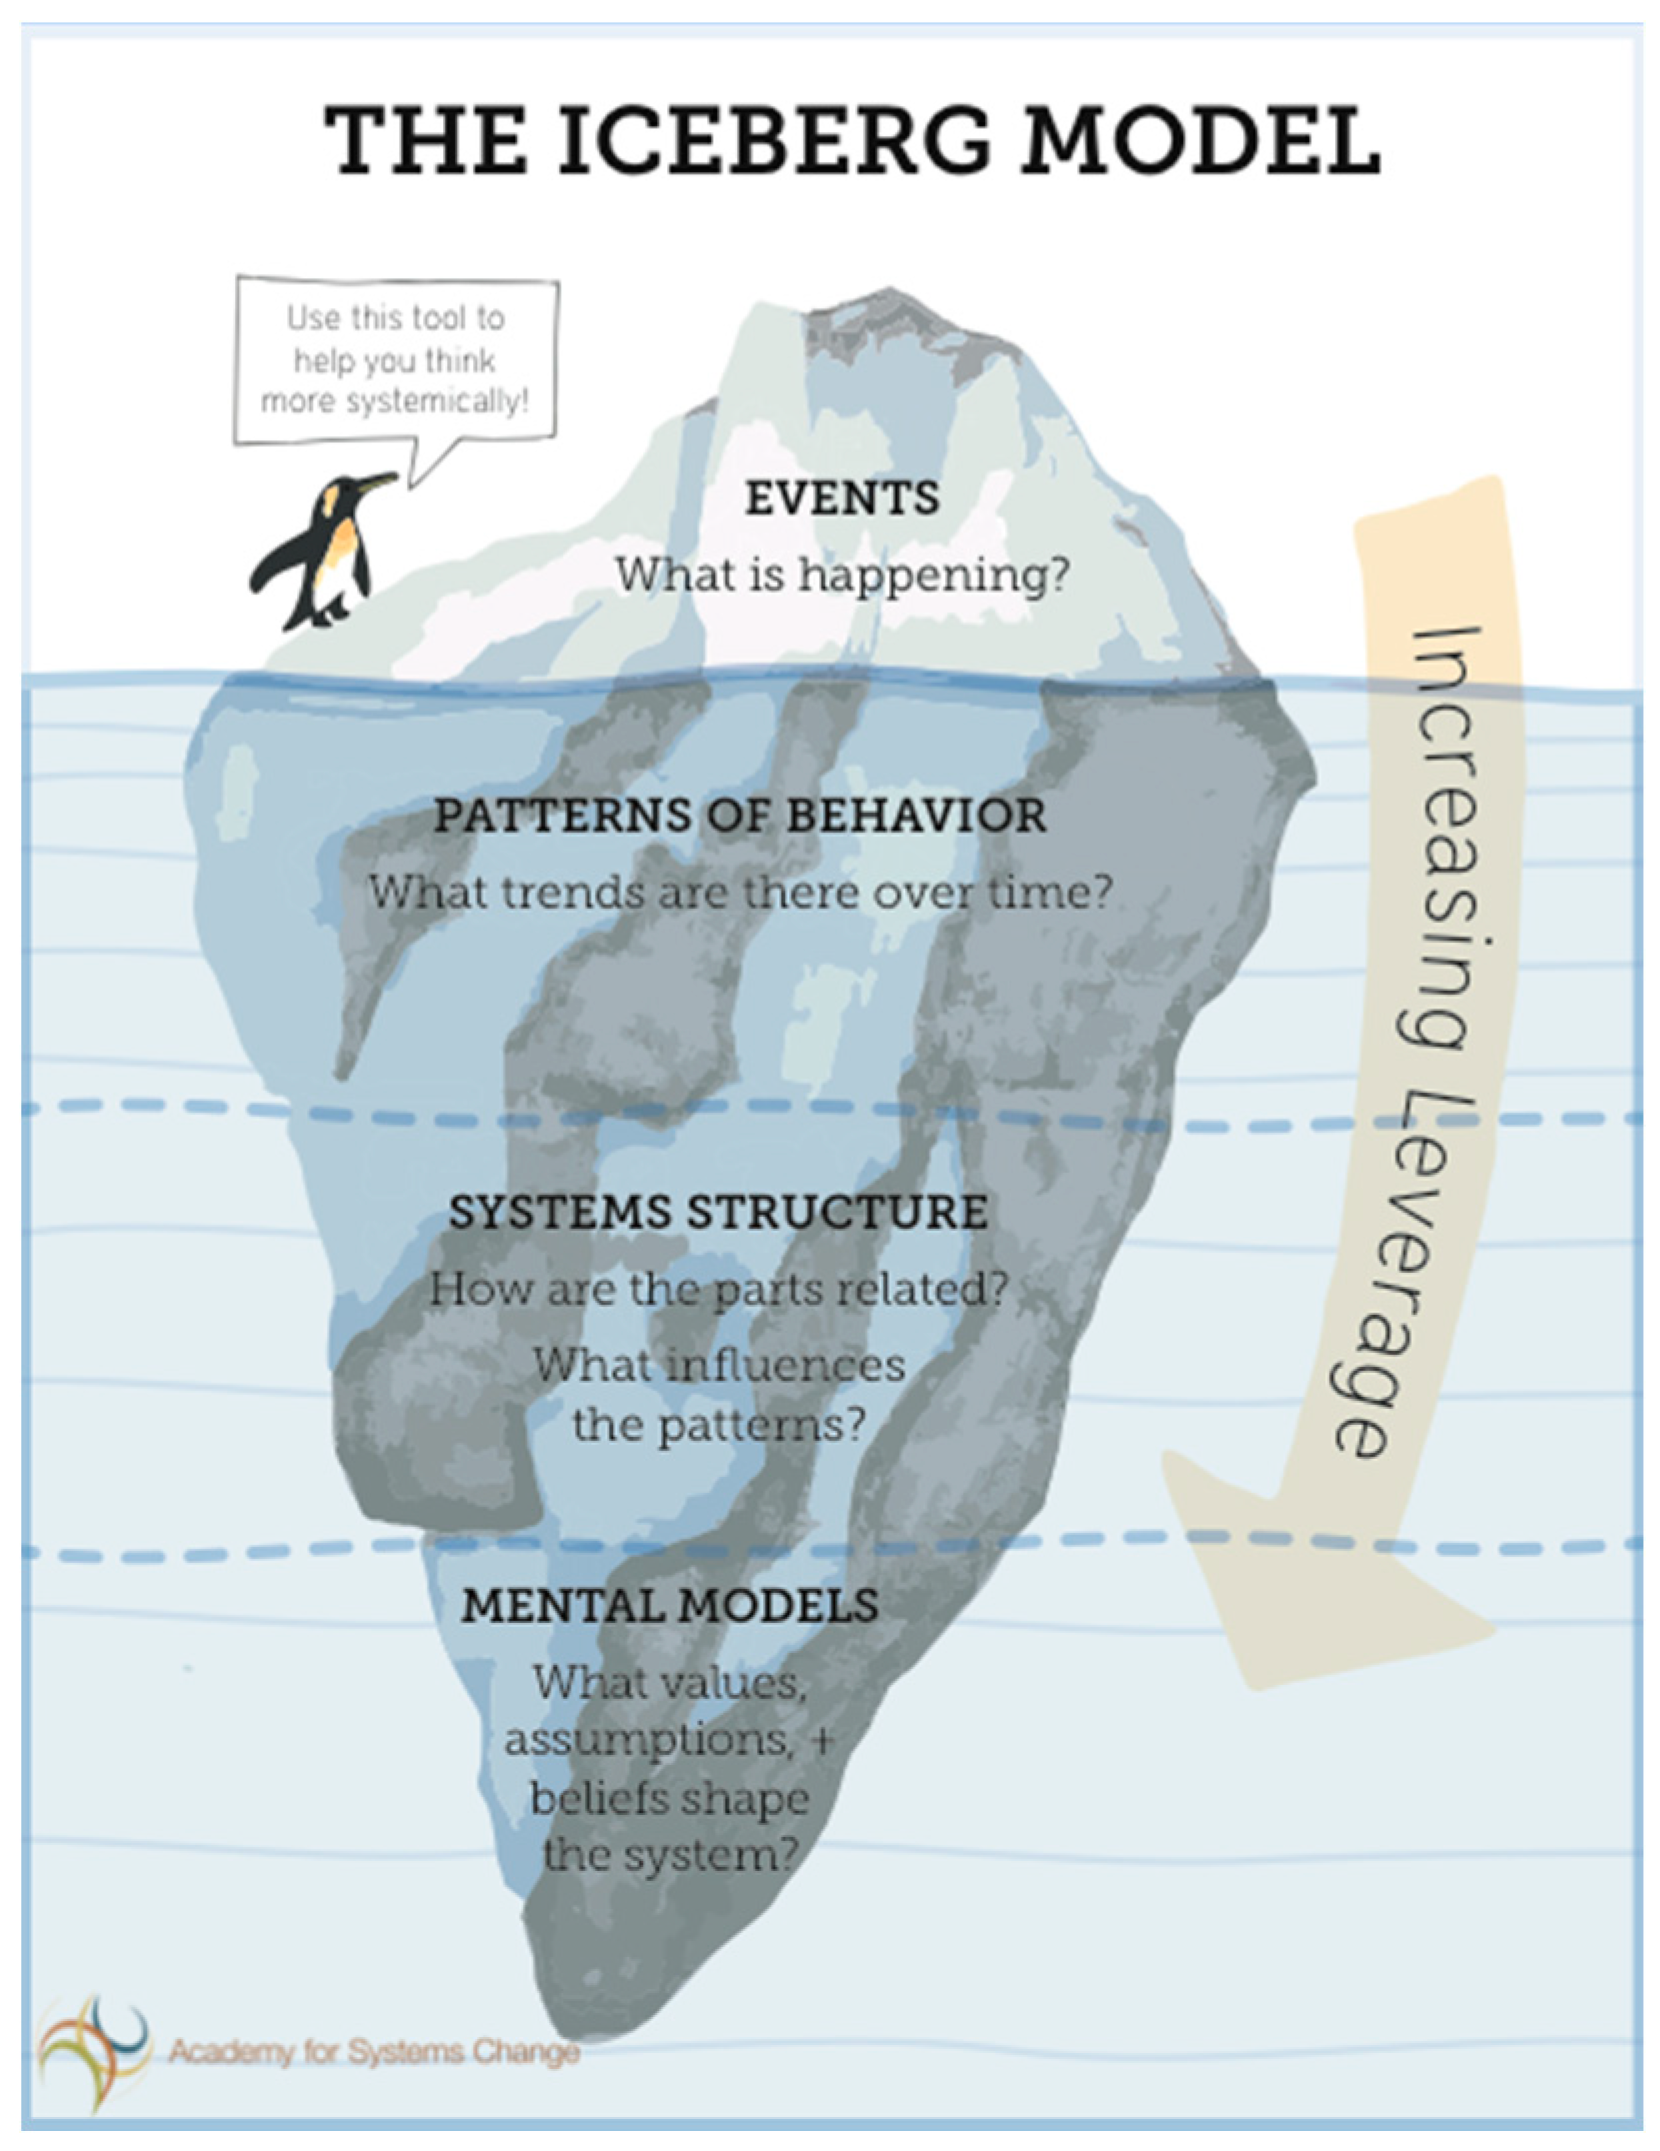
Figure 2.
Studied chain segments.
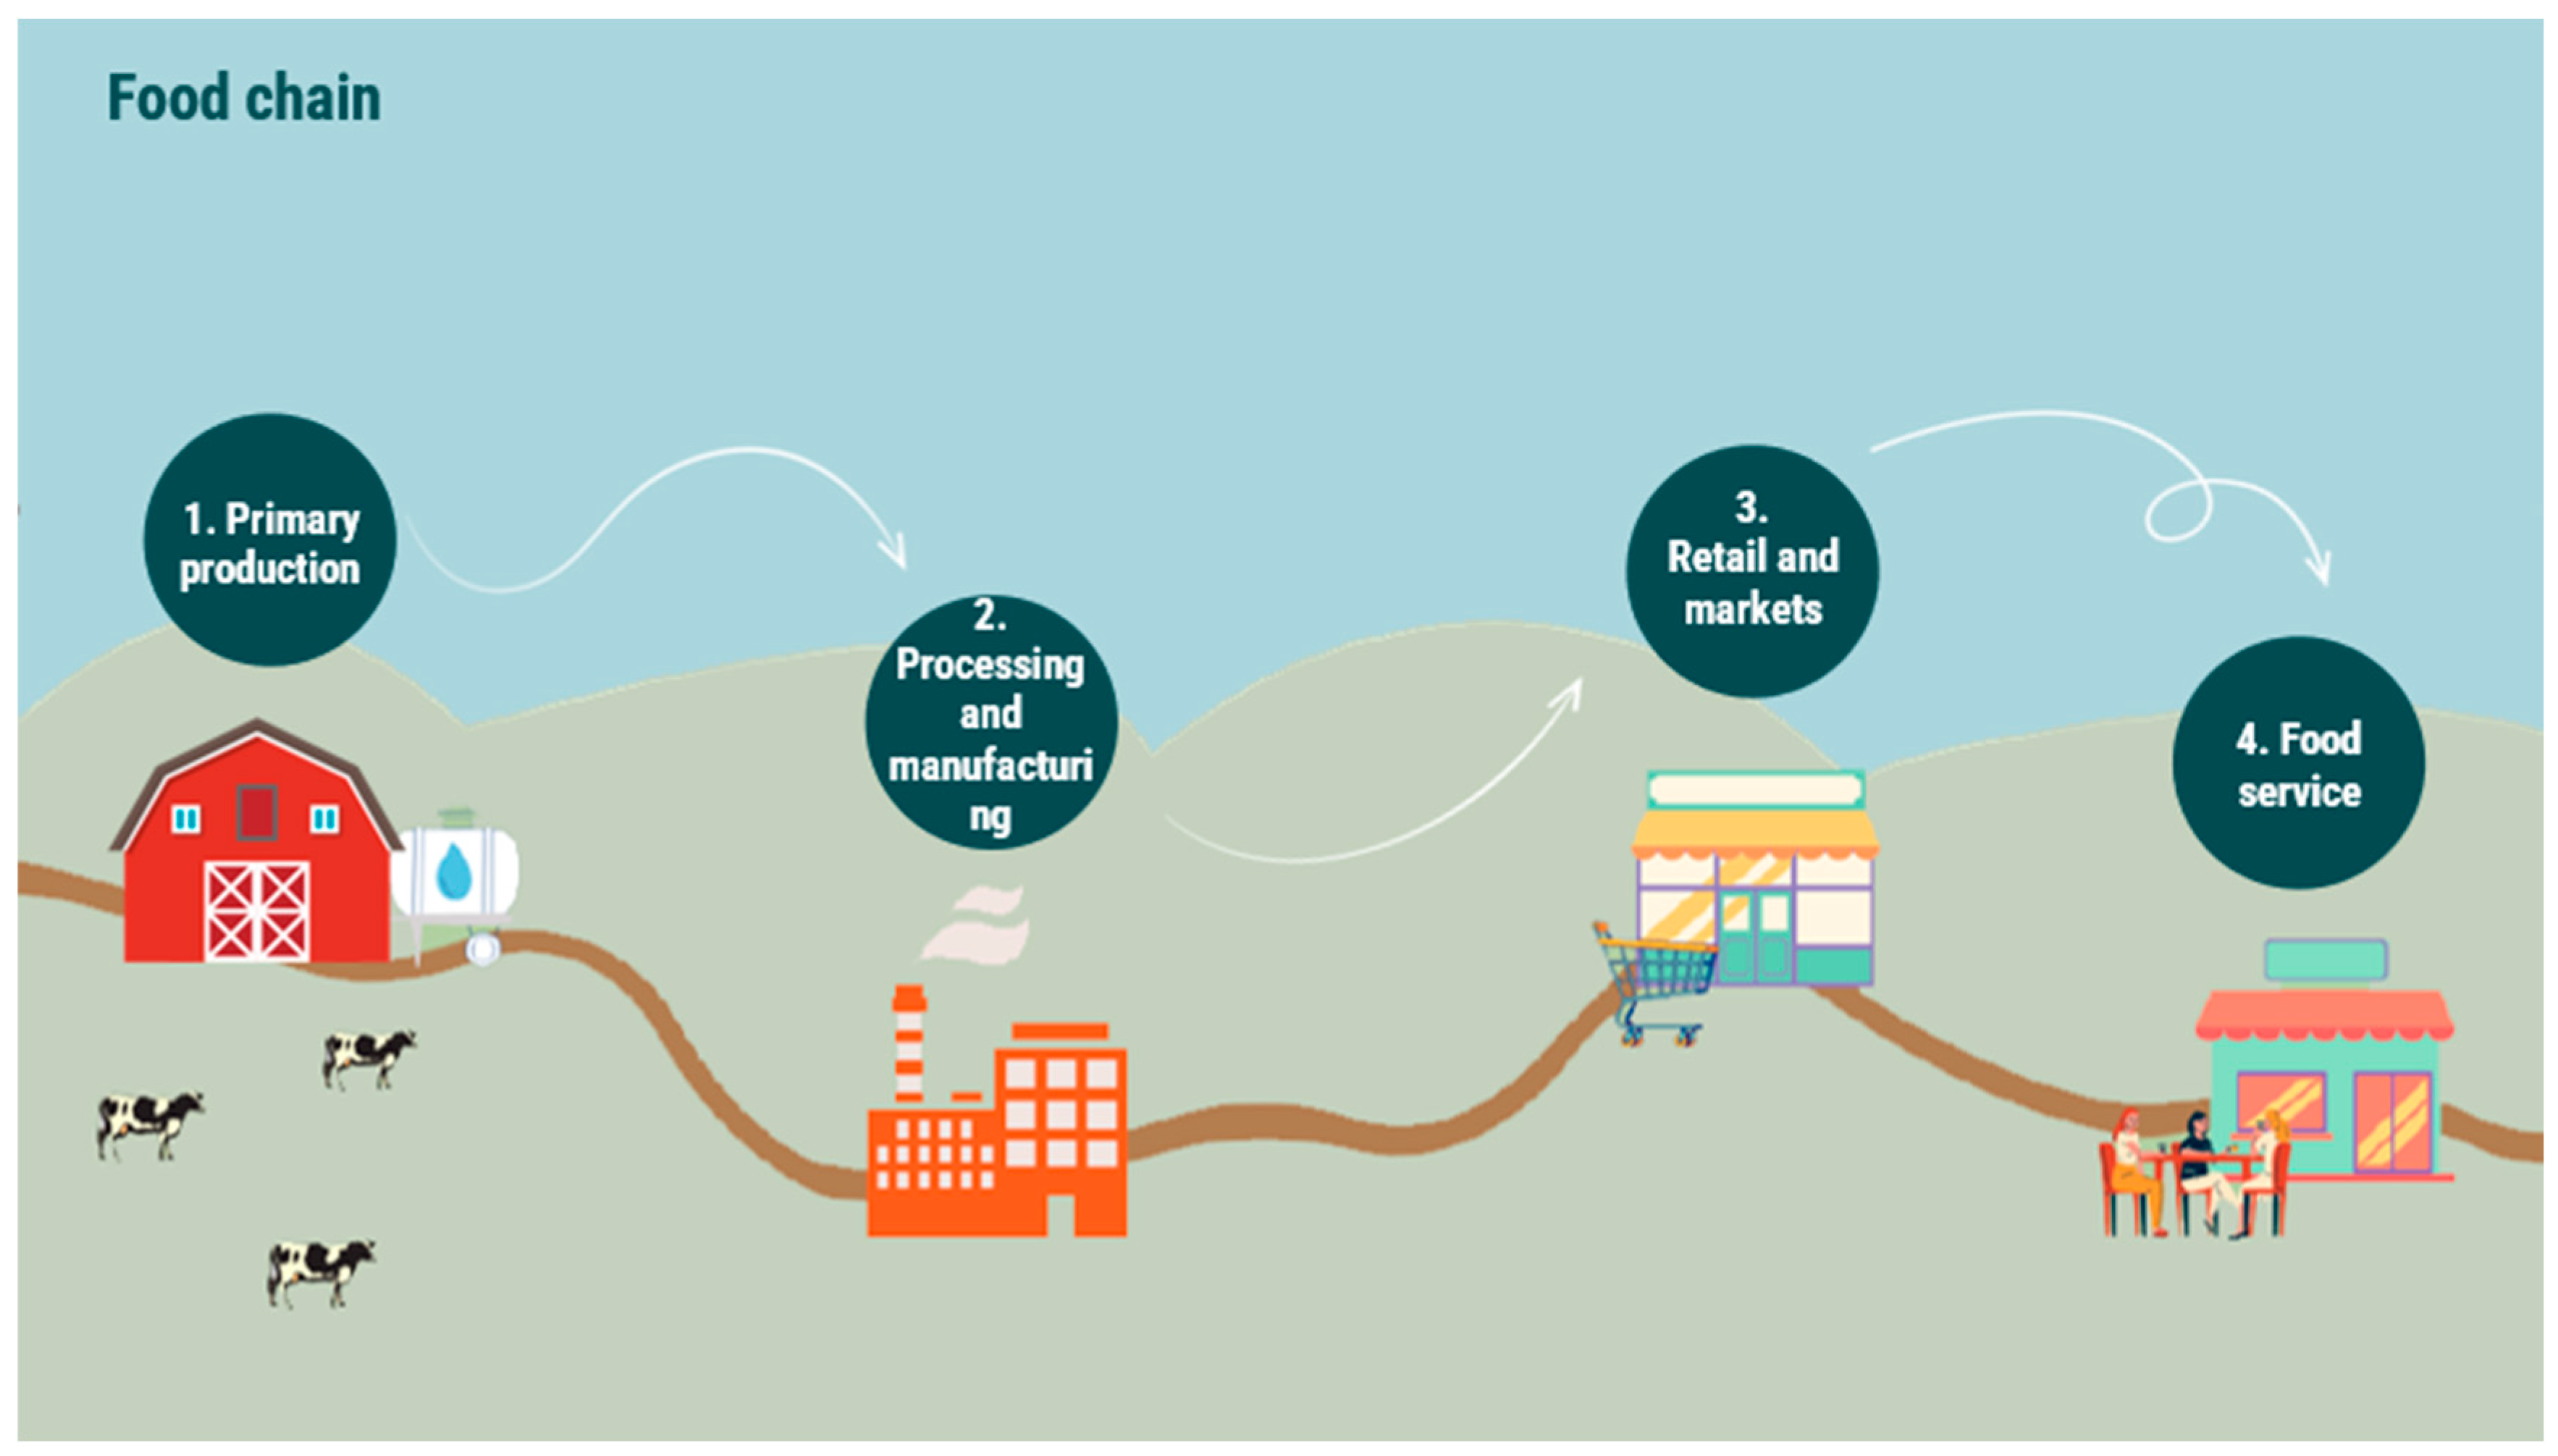
Figure 3.
Iceberg model primary production (milk chain).
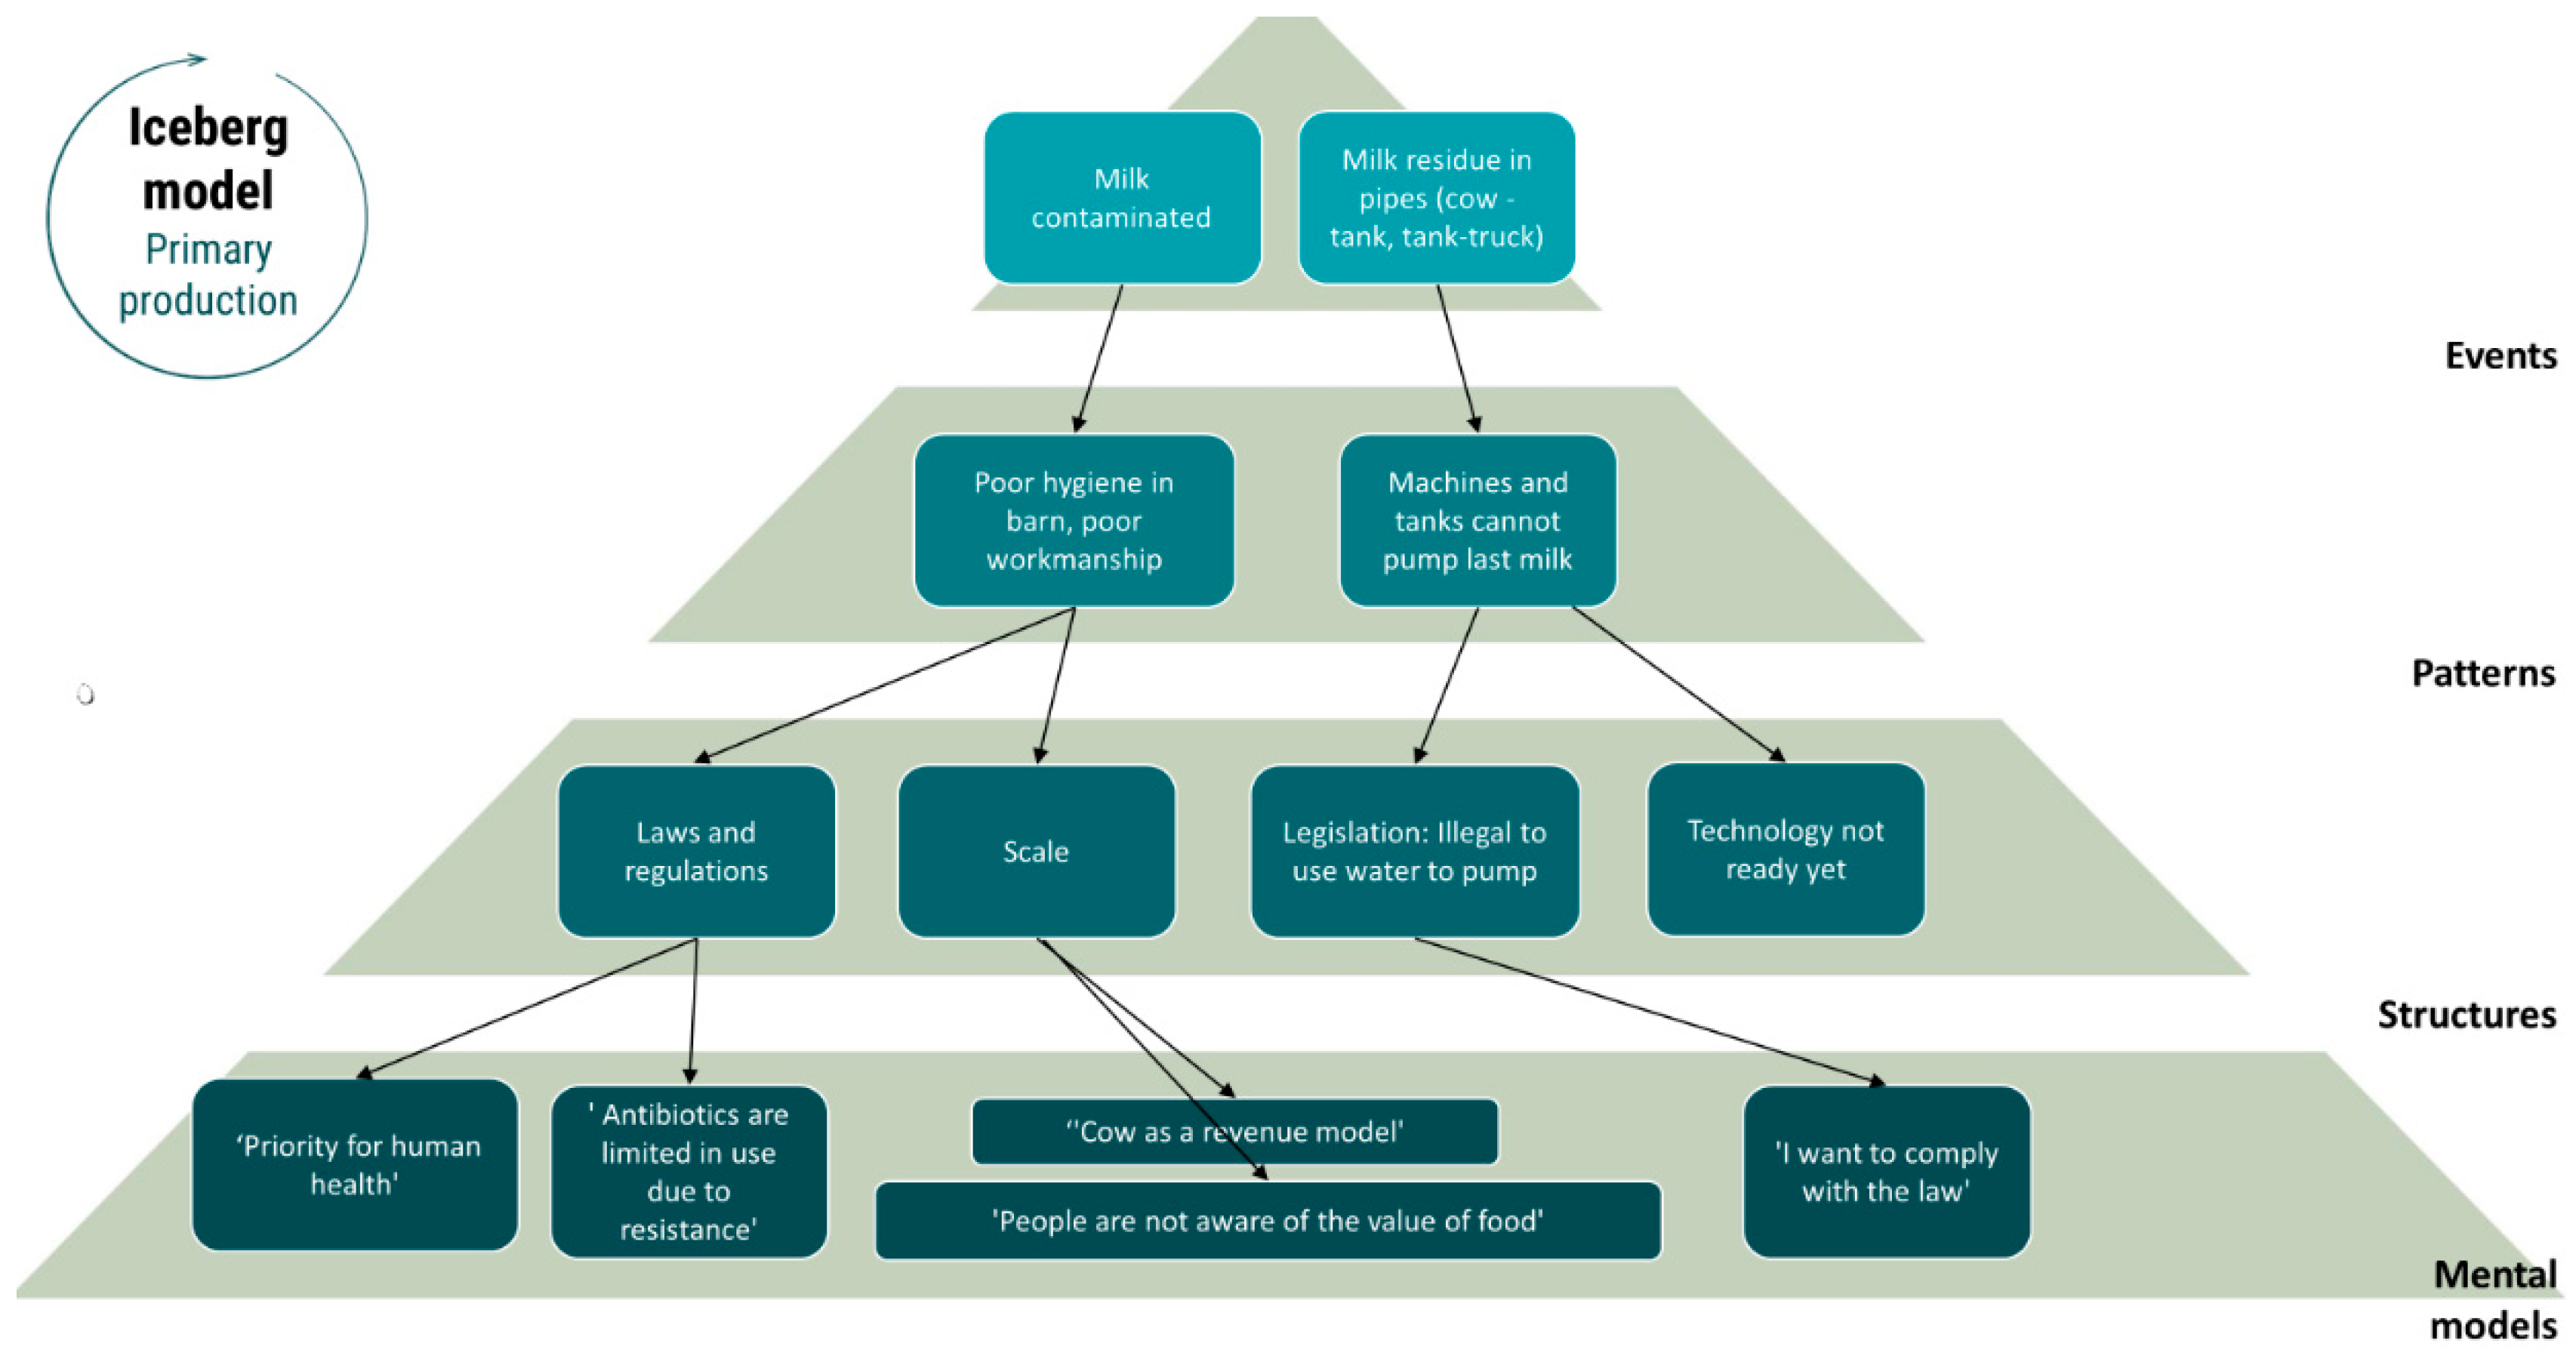
Figure 4.
Iceberg model primary production (poultry chain).
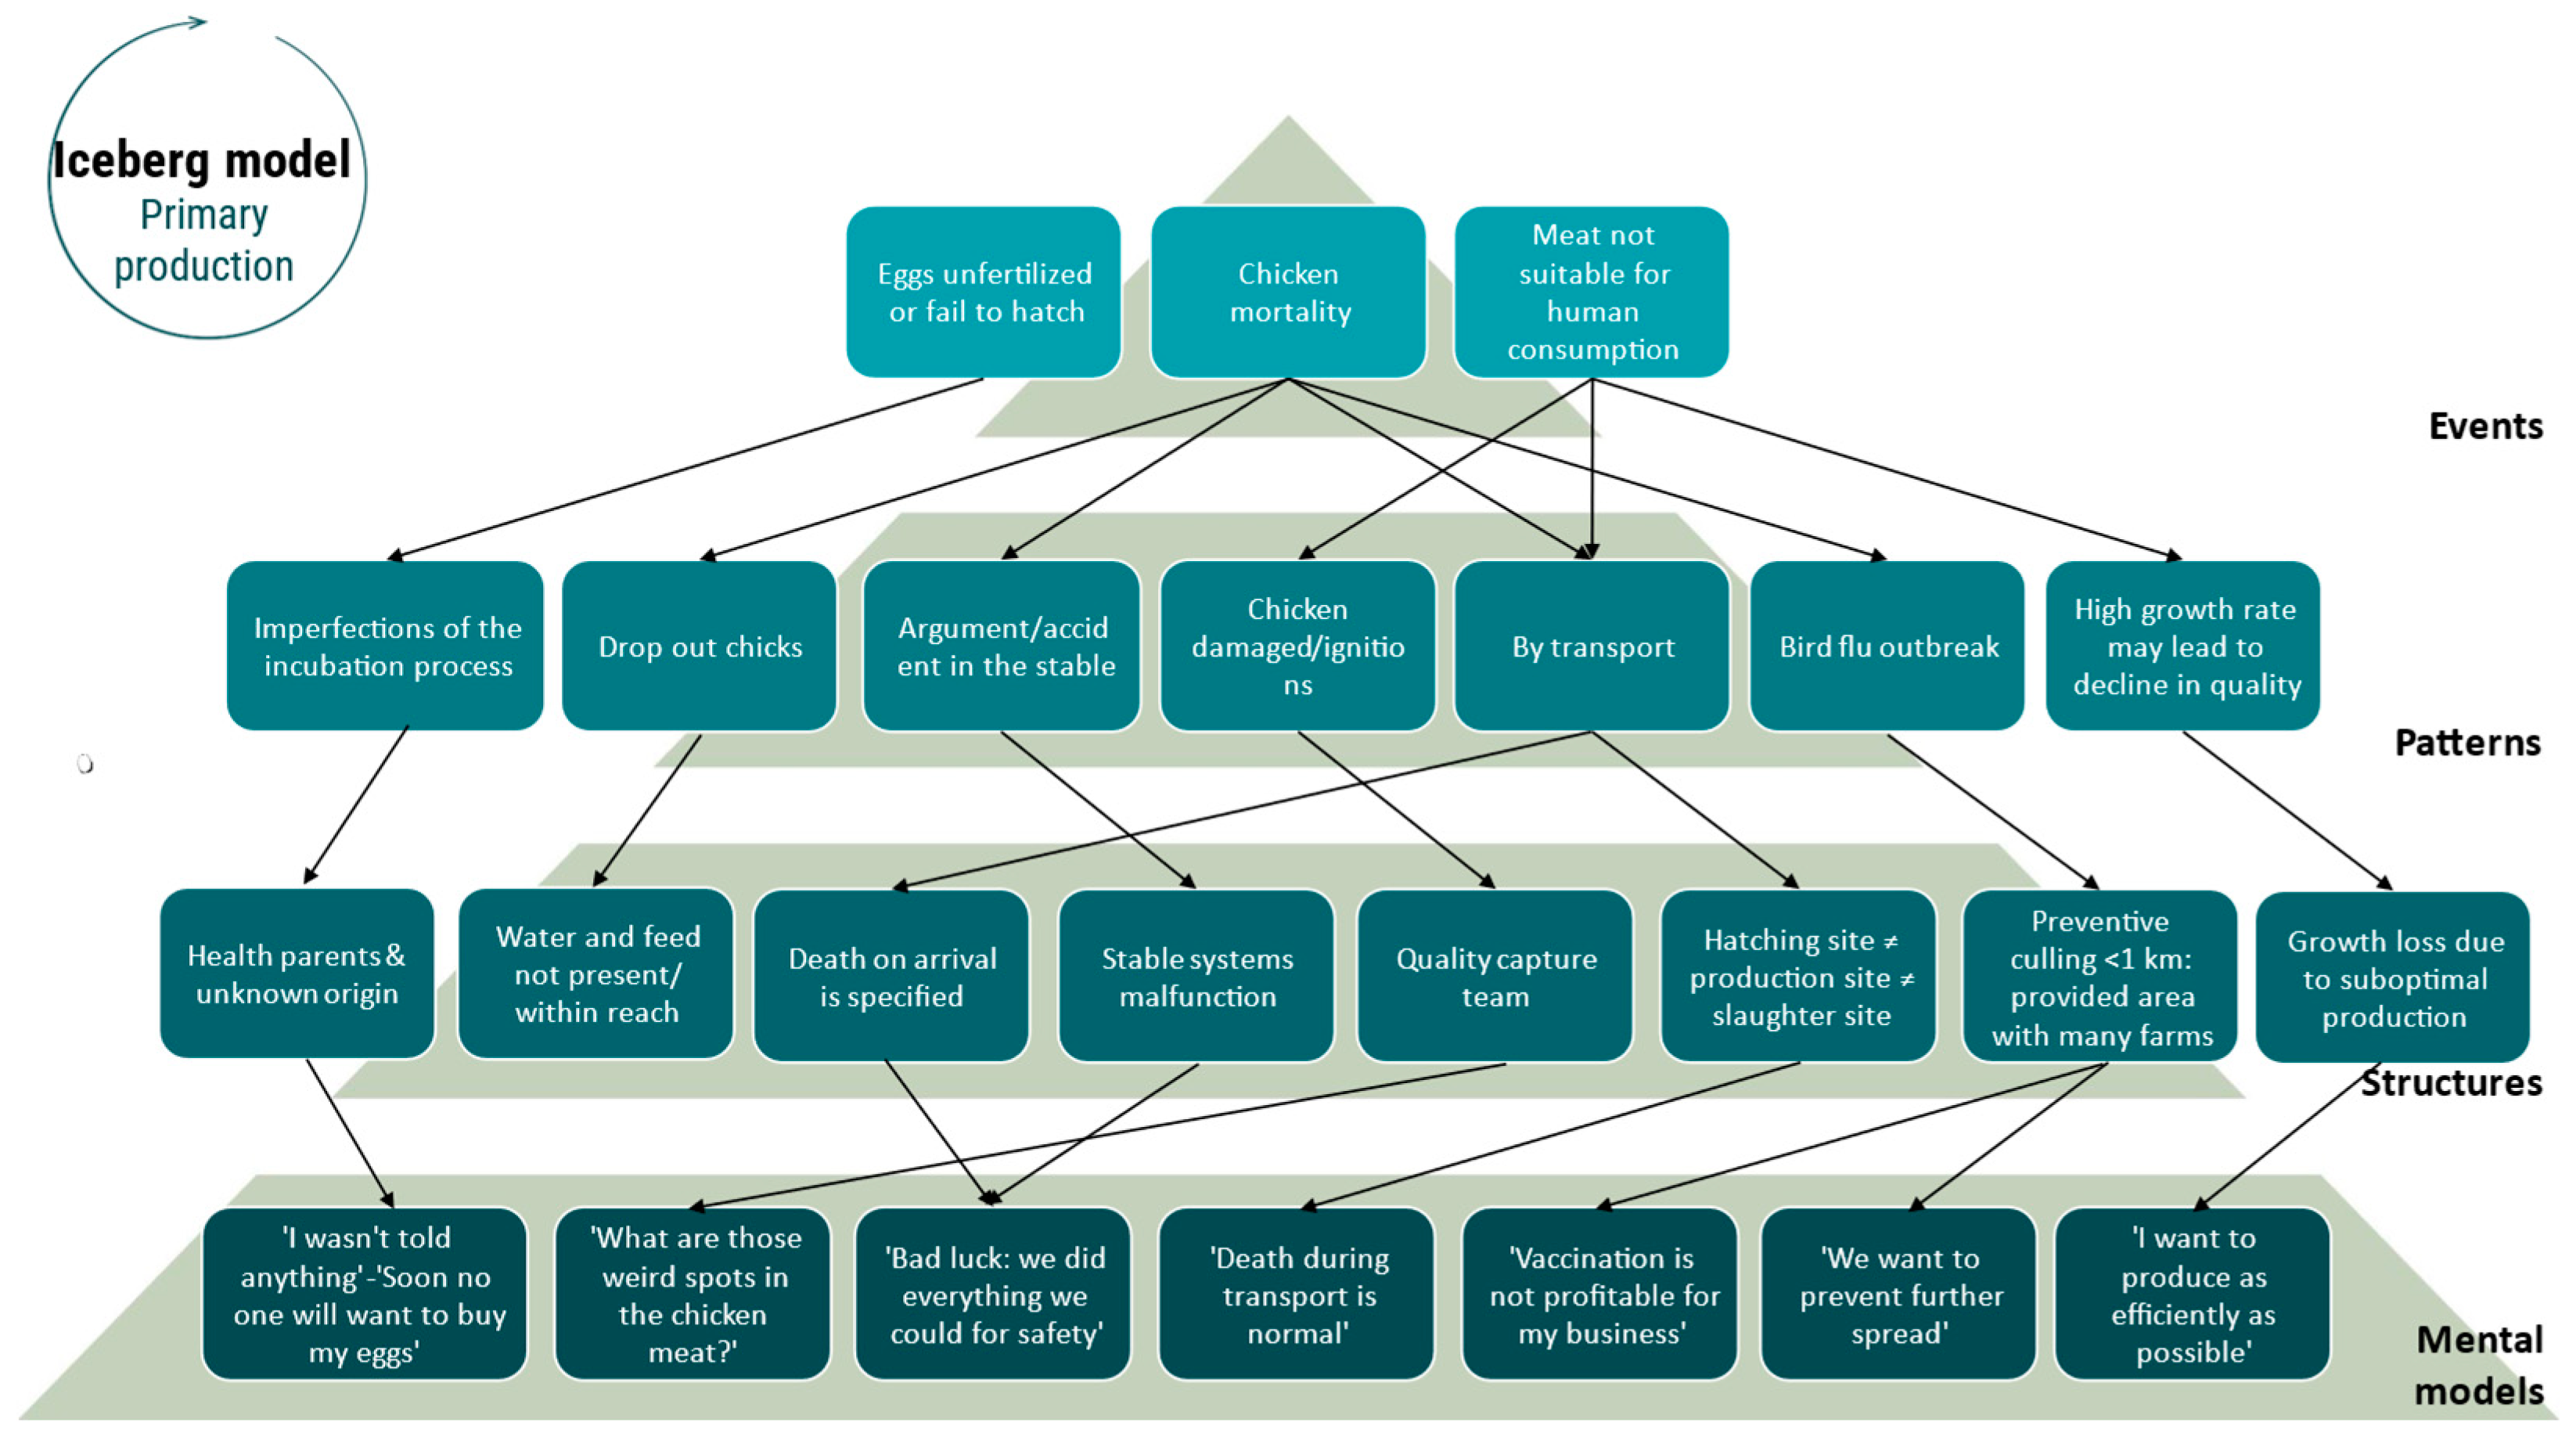
Figure 5.
Iceberg model primary production (potato chain).
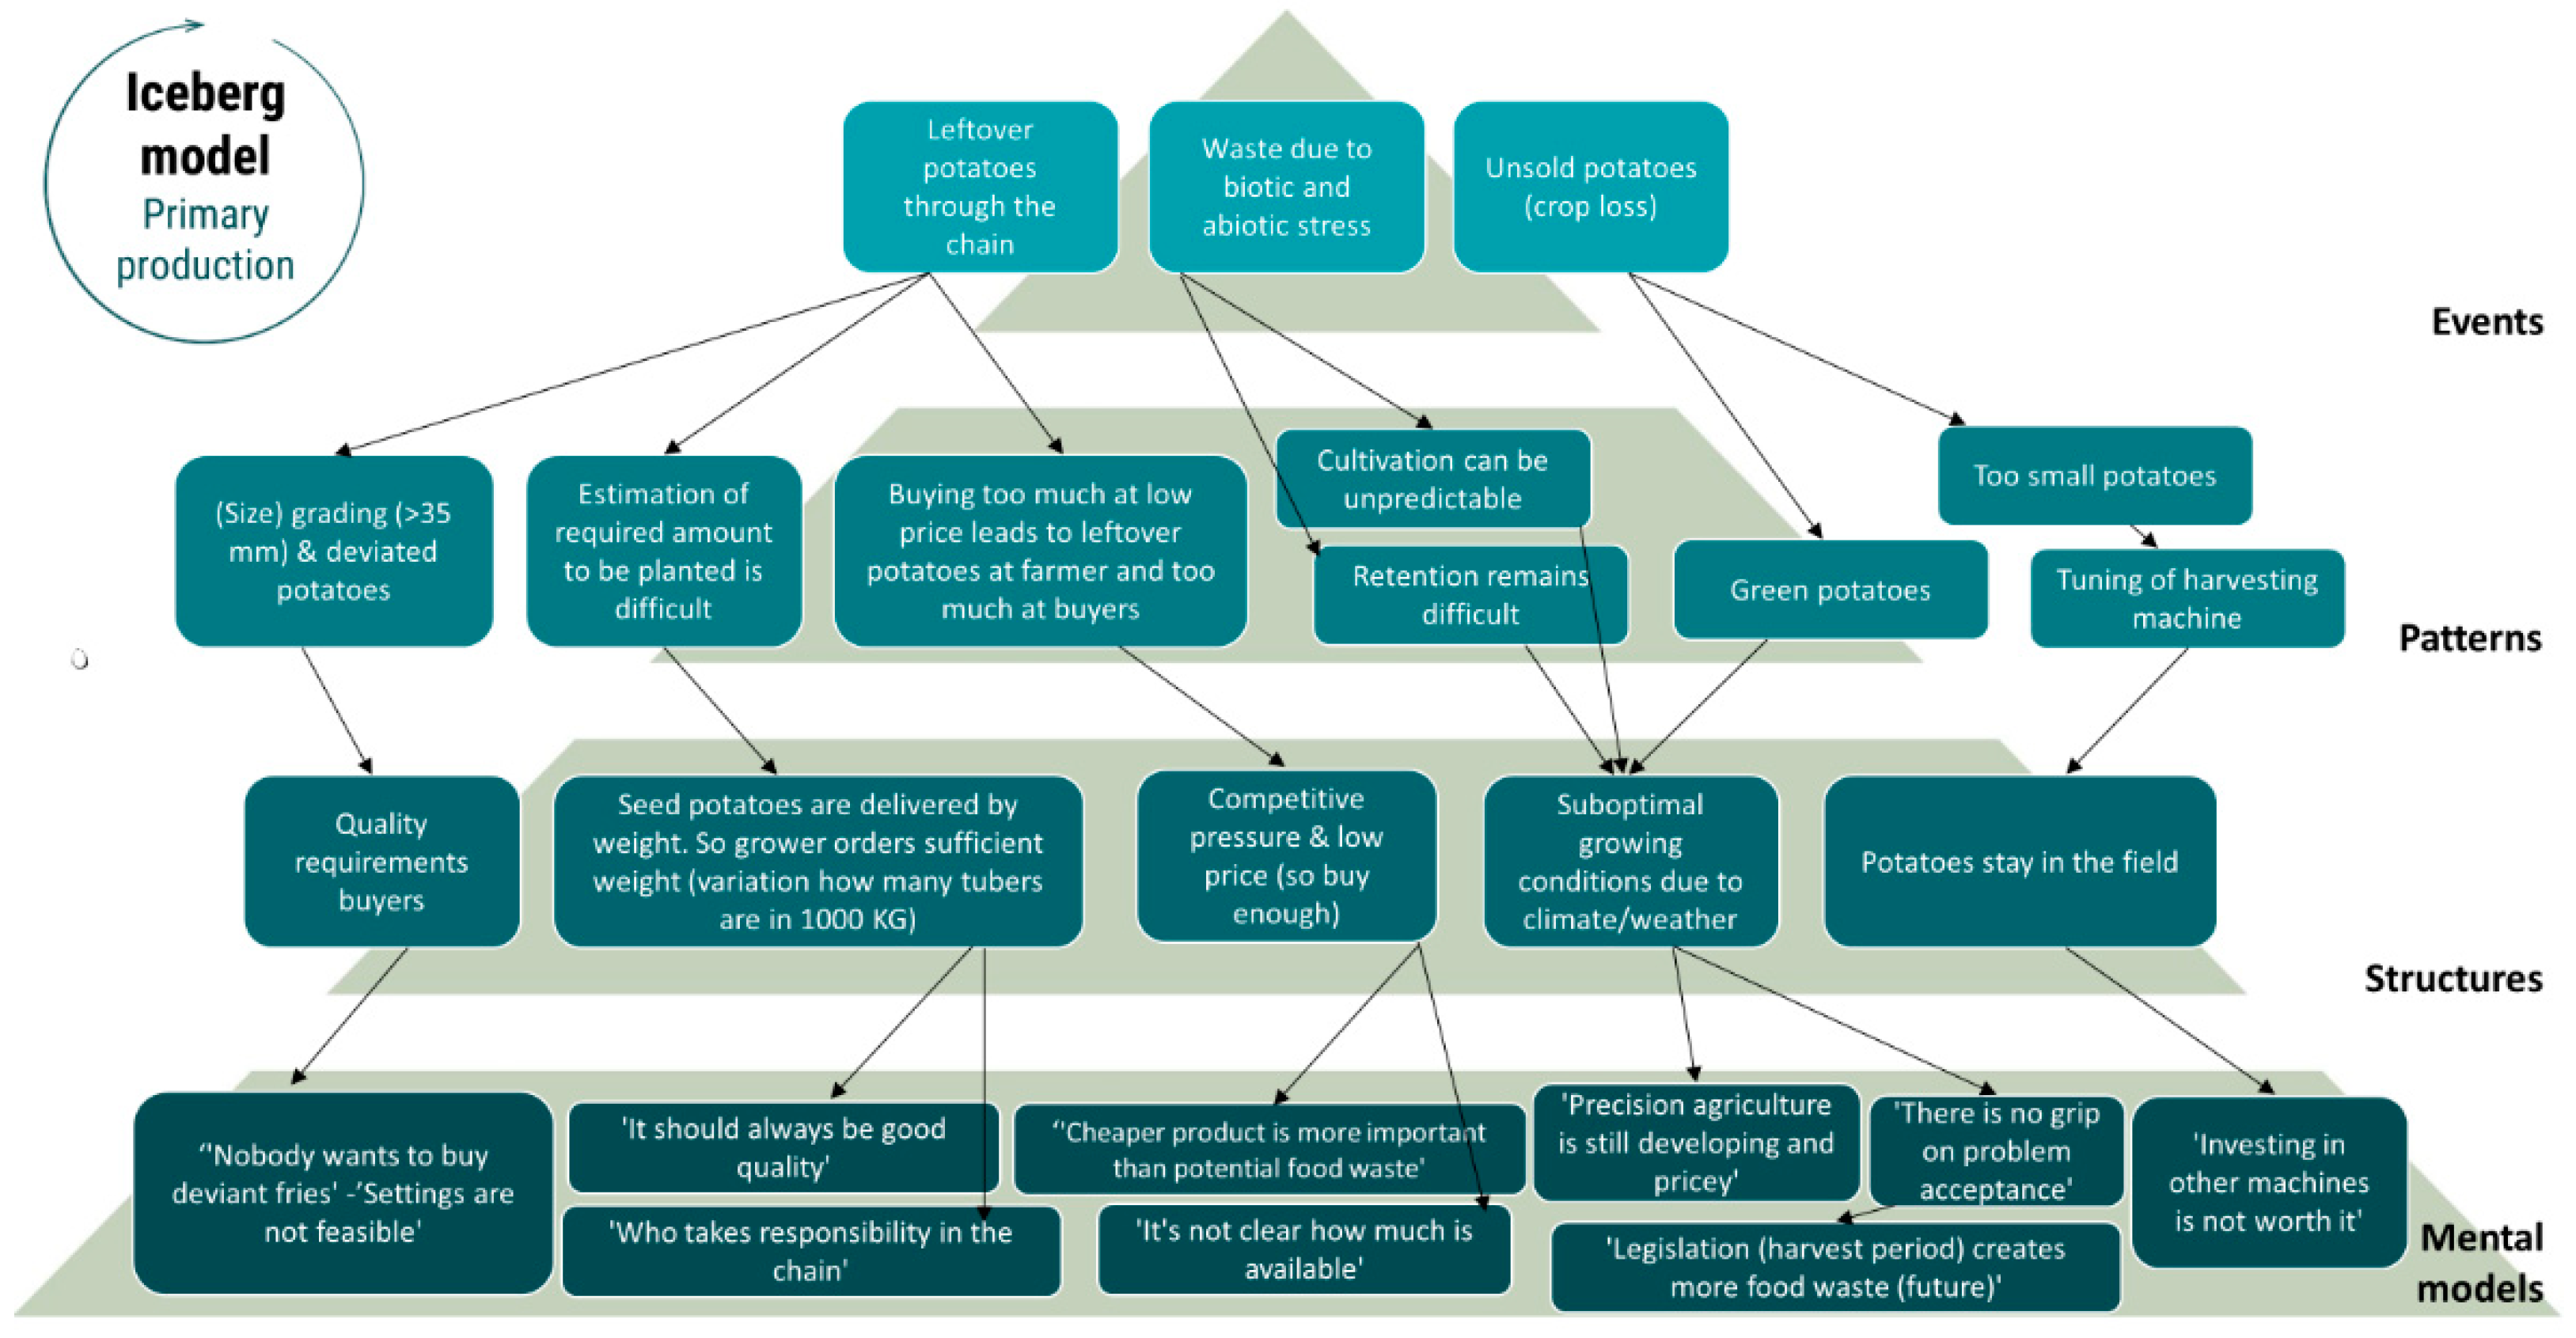
Figure 6.
Iceberg model primary production (greenhouse-grown fruit vegetables).
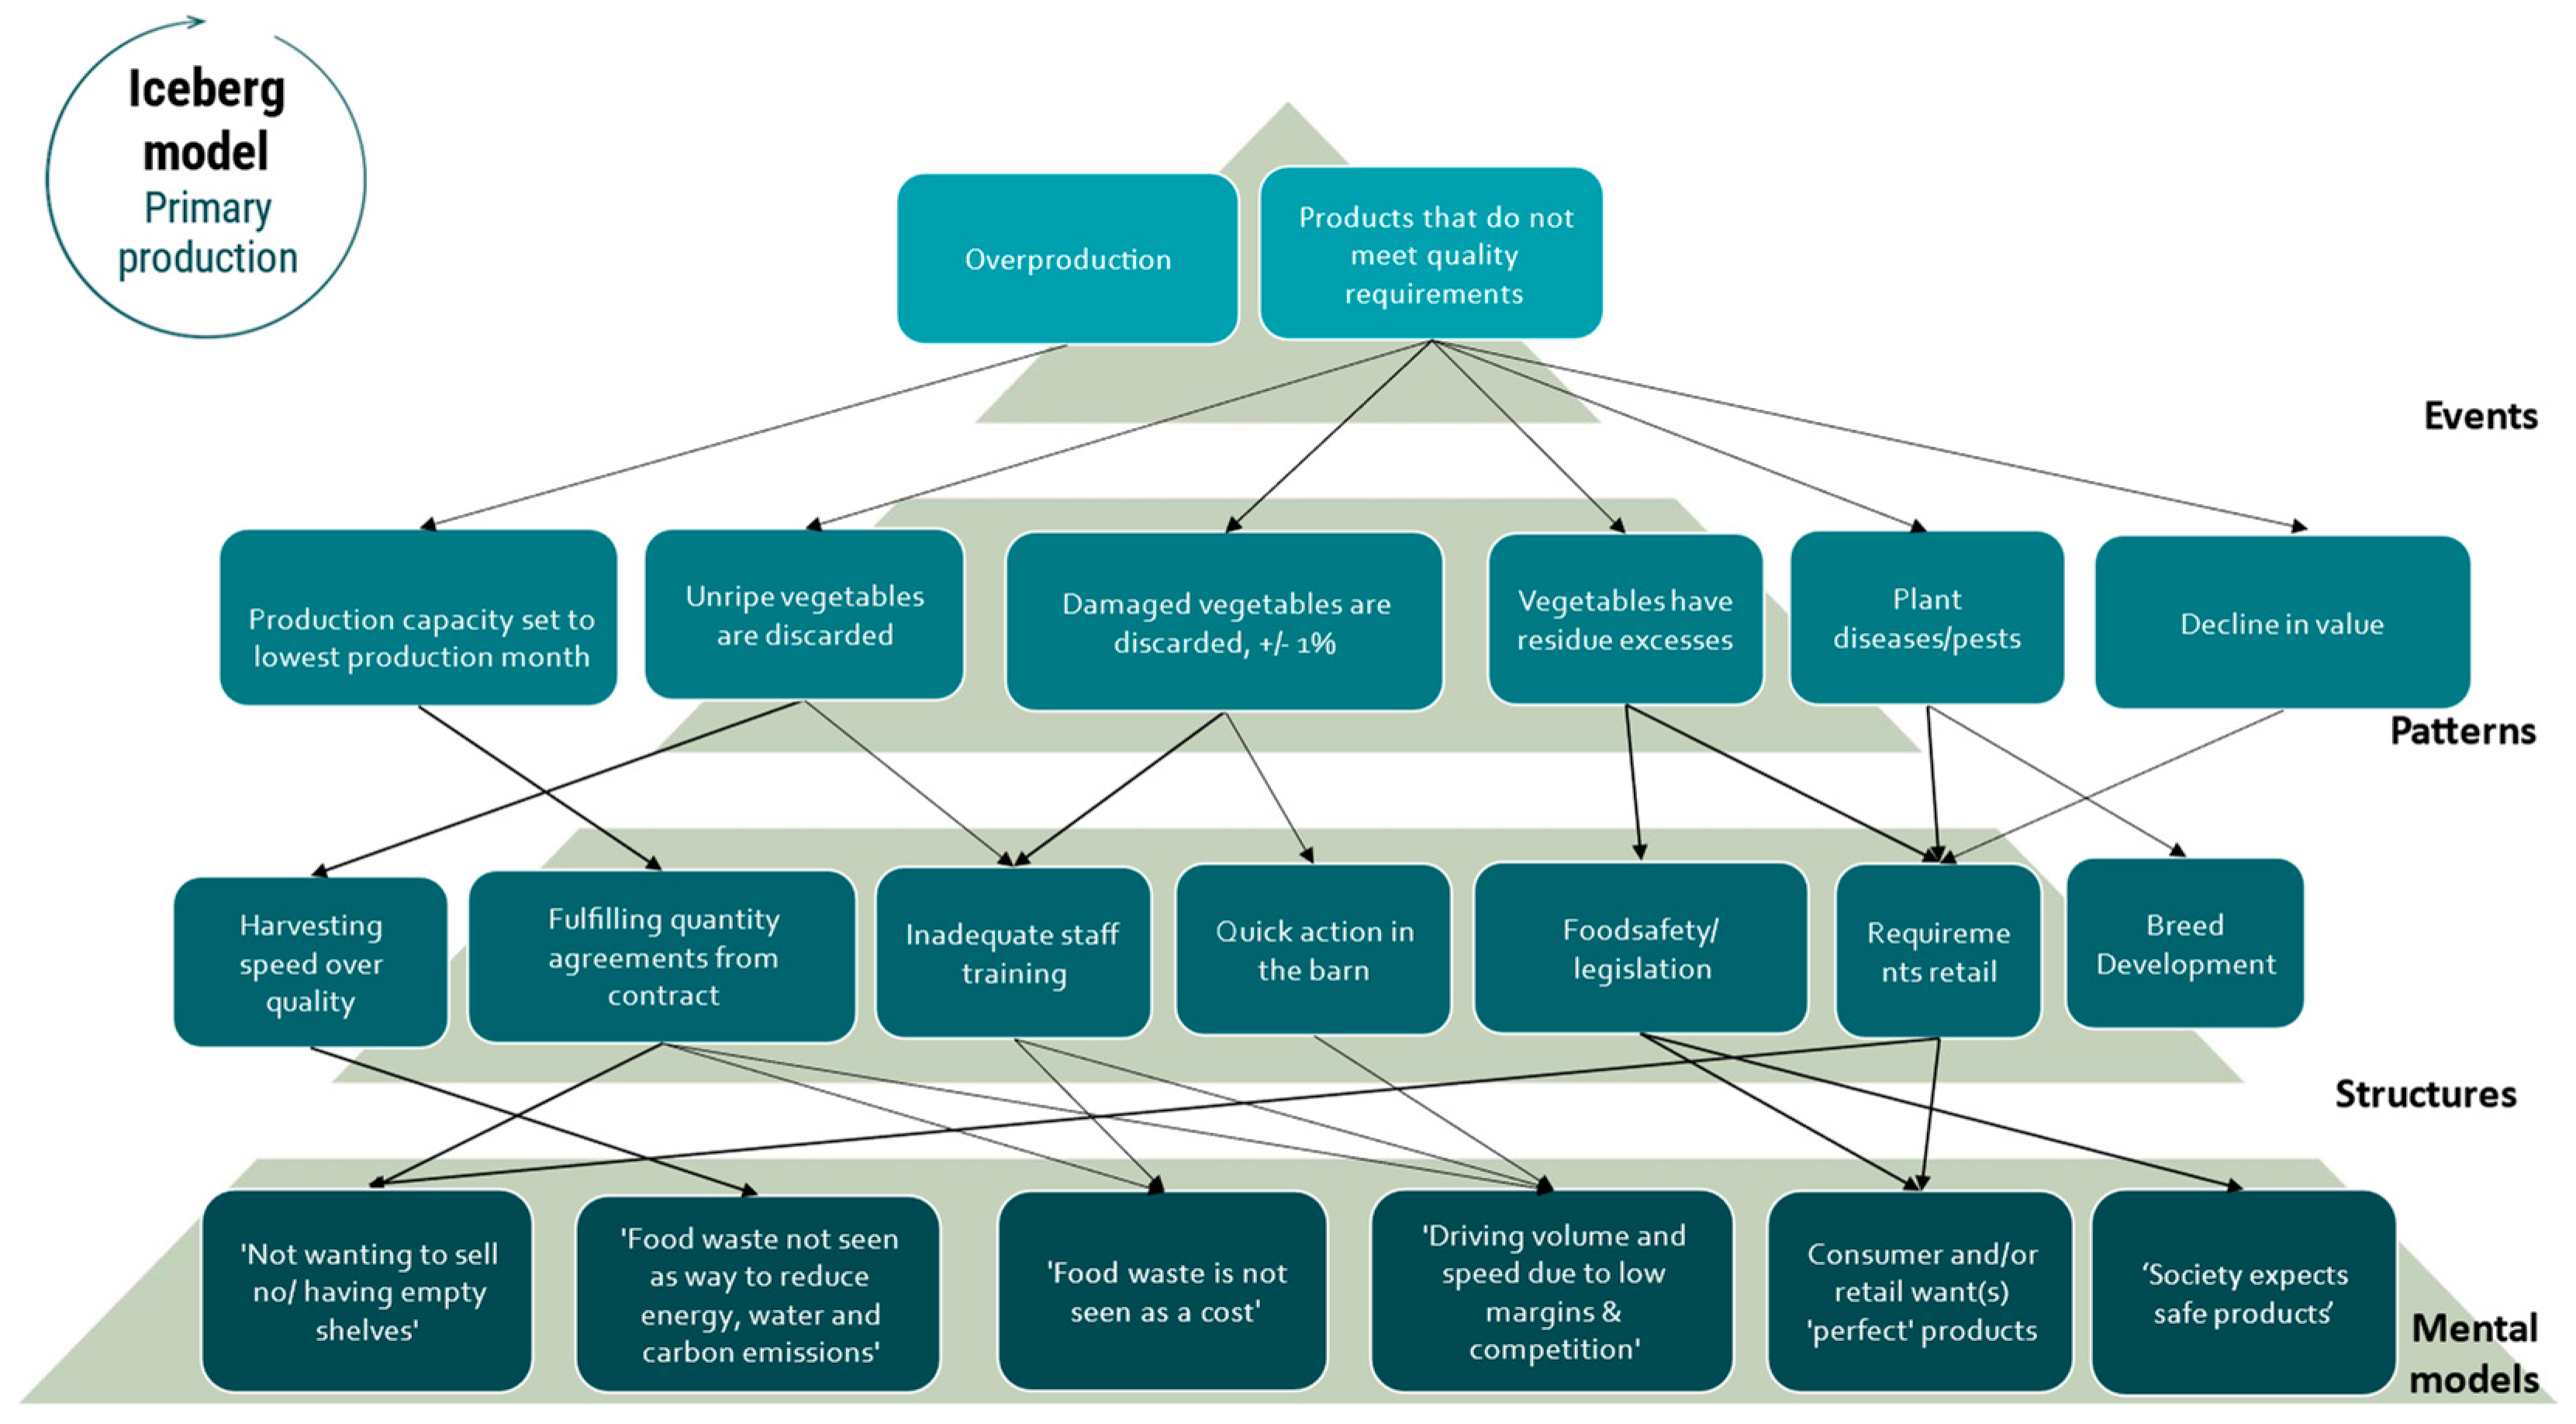
Figure 7.
Iceberg model processing and manufacturing (milk chain).
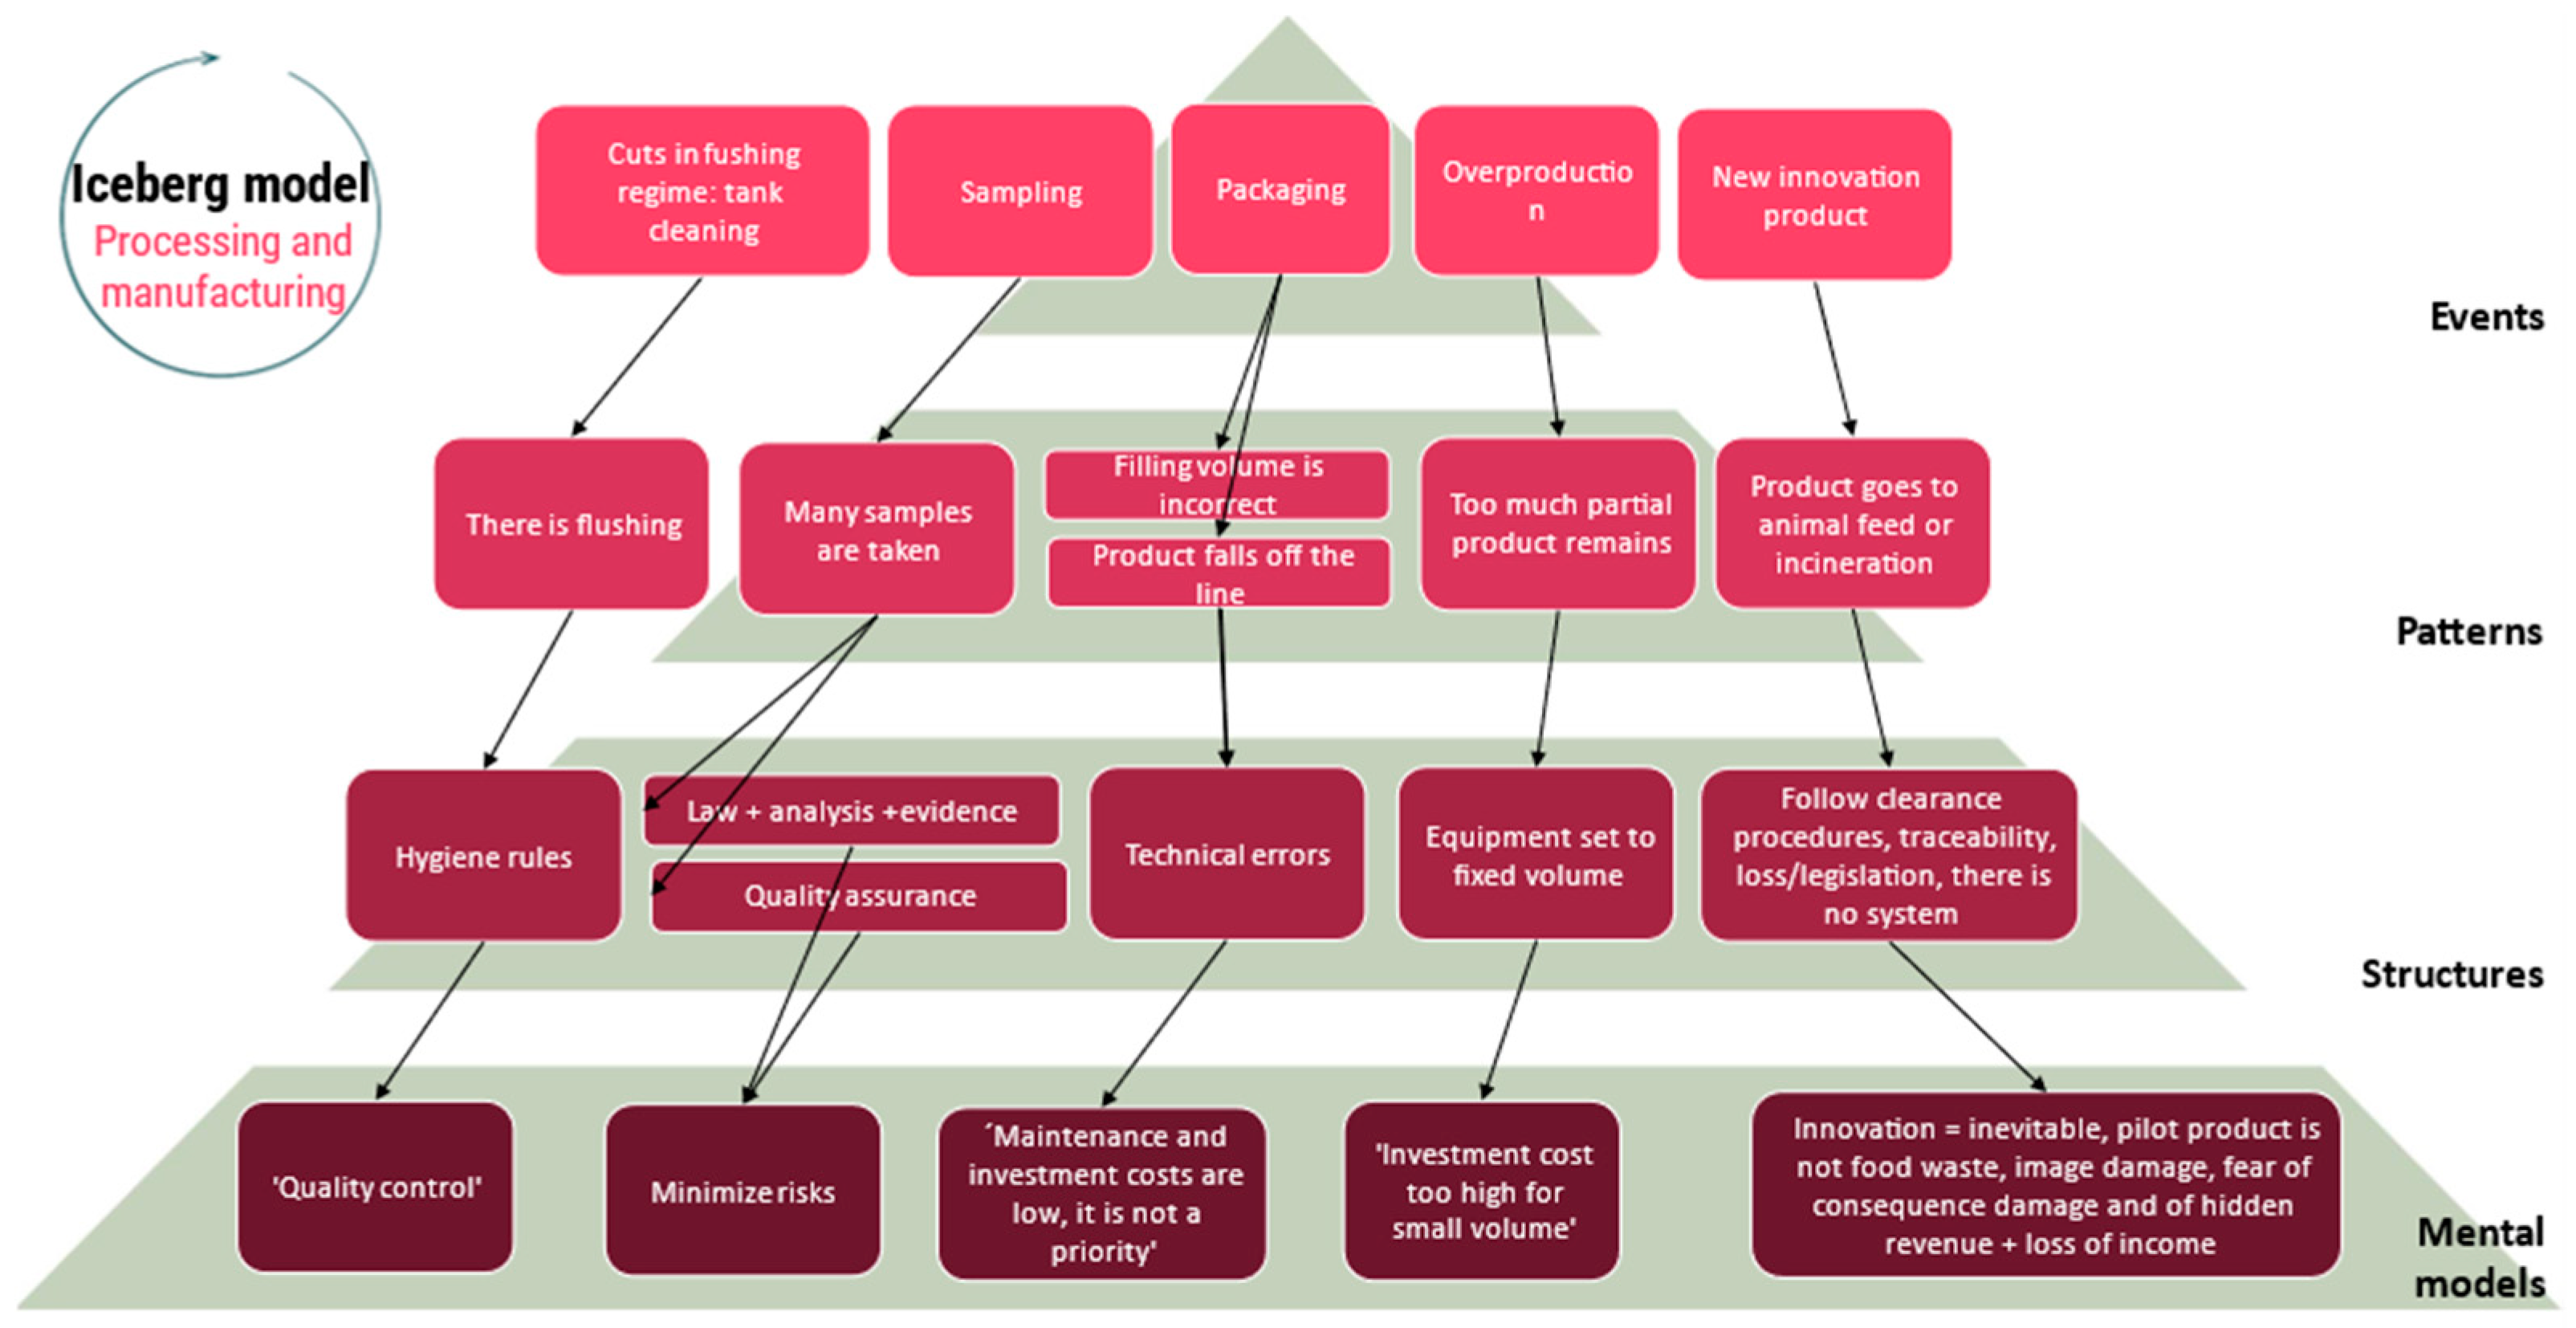
Figure 13.
A preferred future system.
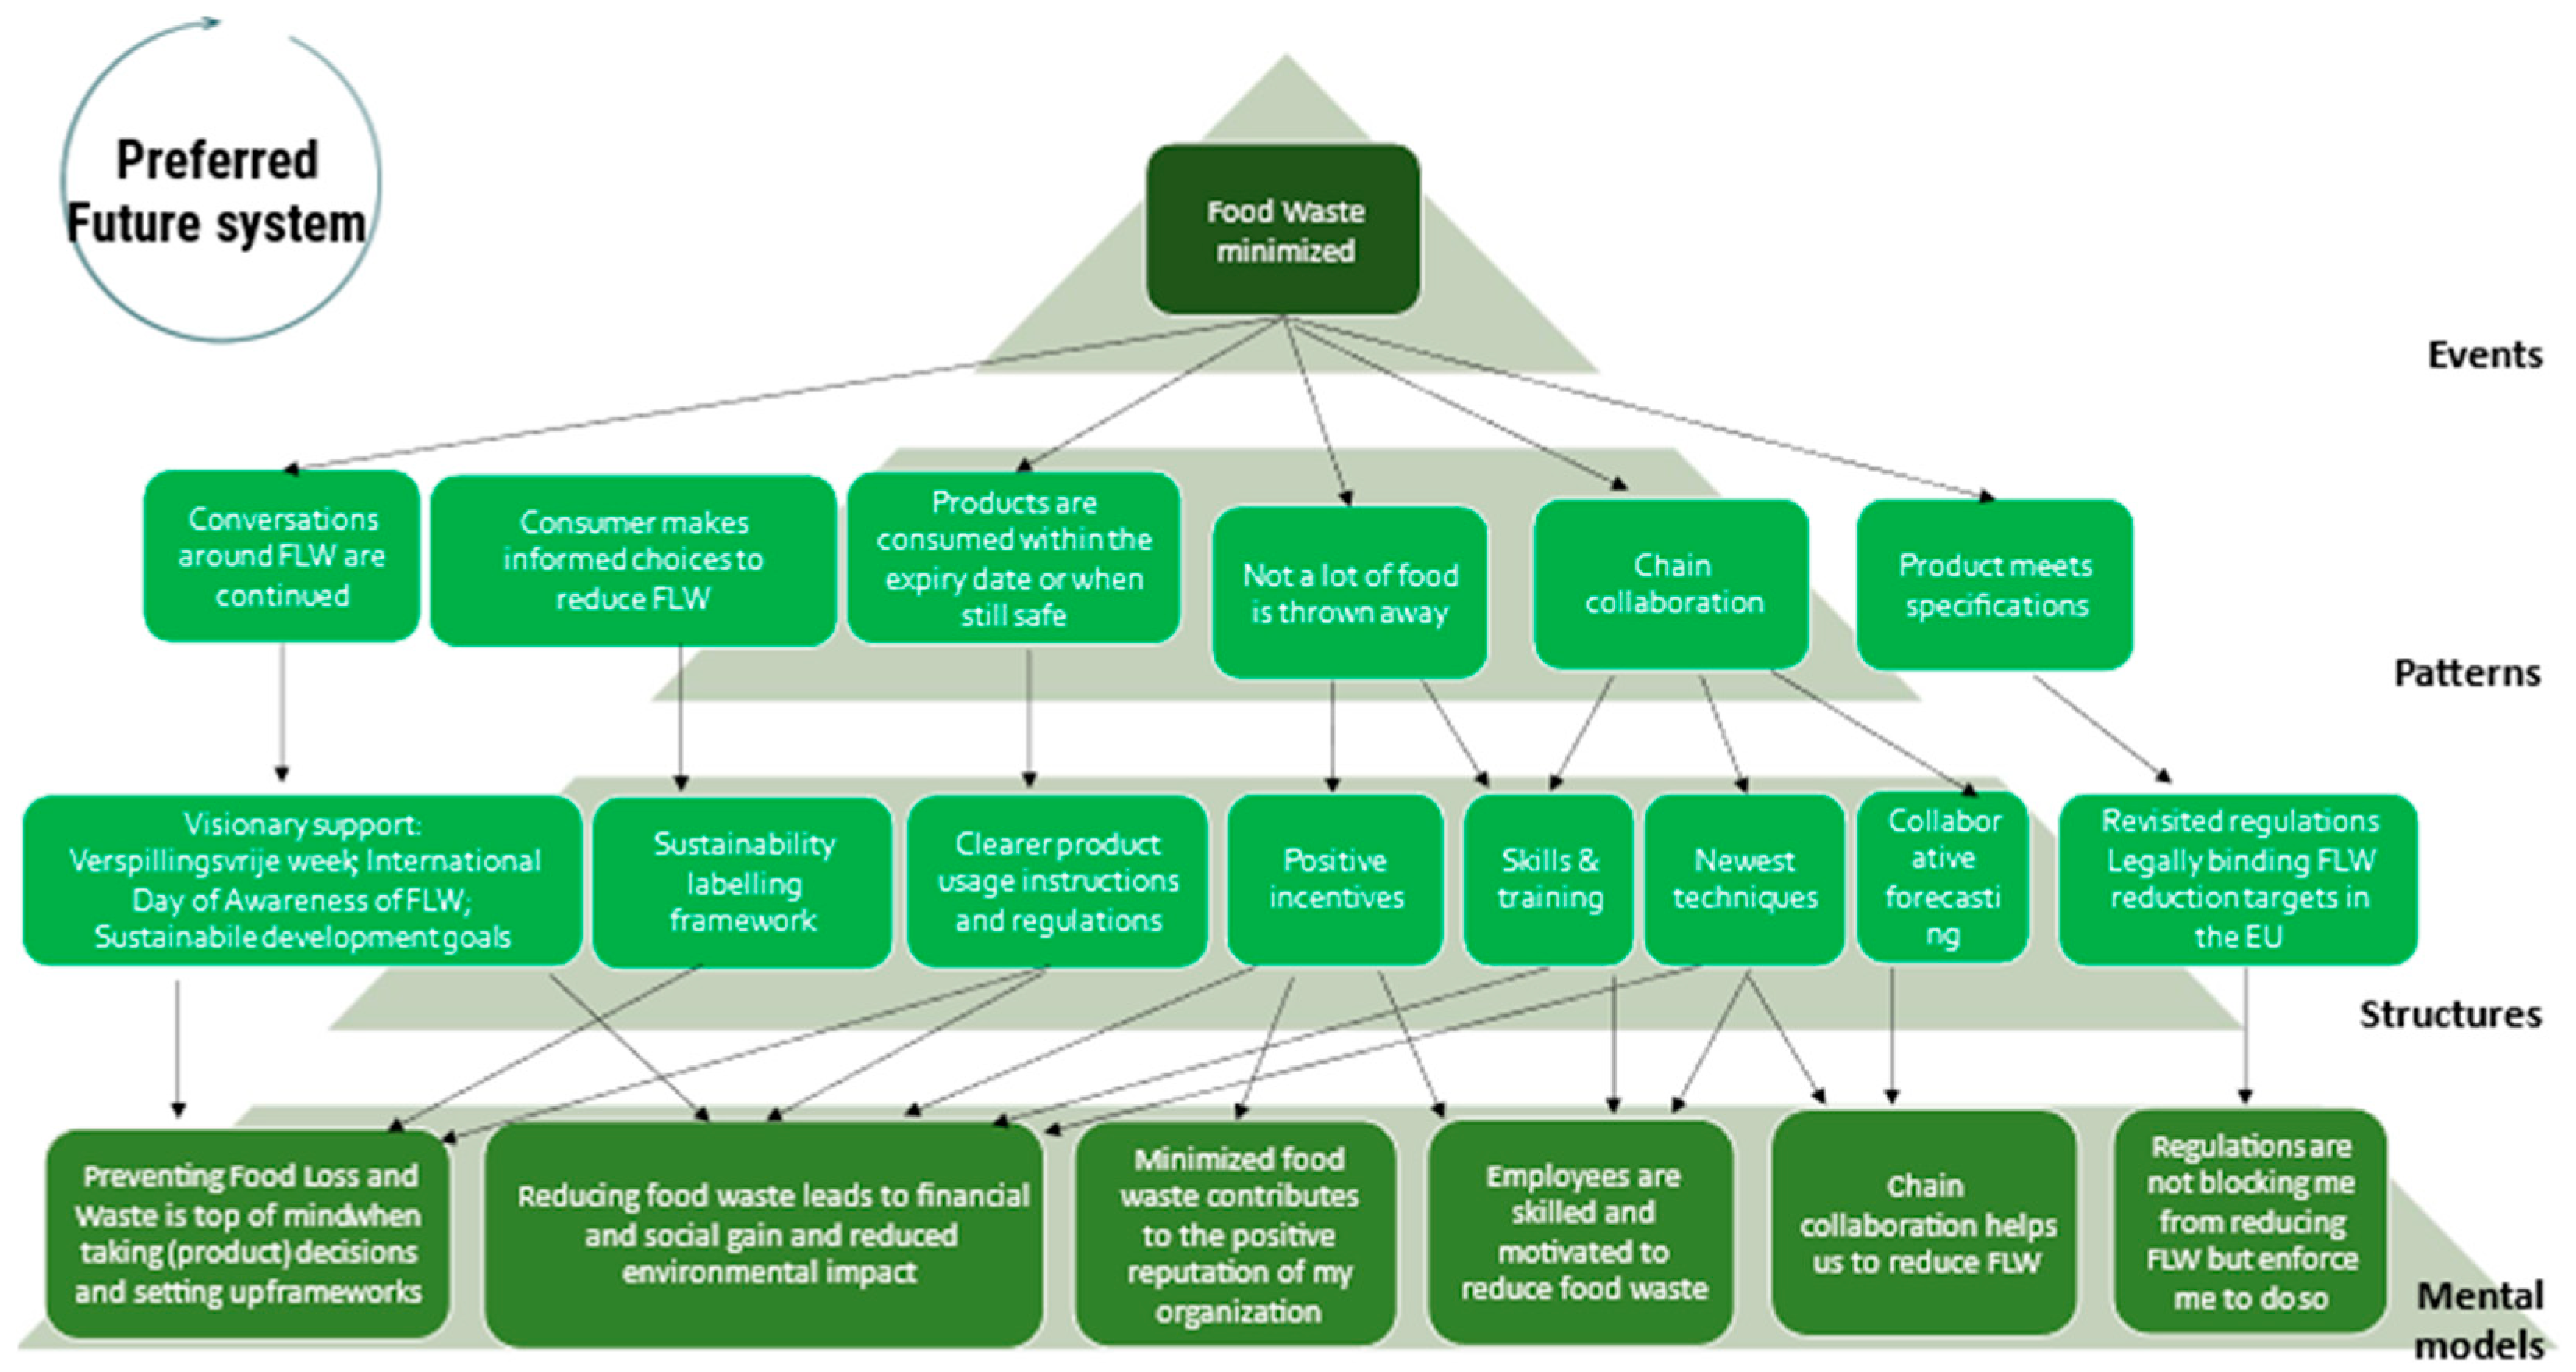

Table 1.
Overview of experts that were interviewed for this study.
| Chain segment | ||||
|
Food Chain |
Primary production | Processing and manufacturing | Retail and Markets | Food Service |
| Milk | 4 milk farmers (2 organic, 2 standard); 1 vet; 1 expert (applied research) |
1 medium milk industry partner (ceo) | 1 franchiser retailer (ceo) | 4 restaurant owners;3 catering managers;2 healthcare institutions (1 ceo, 1 nutrition expert);1 meal box provider (nutrition expert) |
| Poultry | 2 poultry farmers 2 experts (academic research) |
1 large poultry industry professional; 1 large poultry slaughterhouse; 1 carcass processor; 1 expert (applied research) |
1 retailer (owner);1 online retailer | 2 caterers (ceo);2 restaurants (ceo) |
| Potato | 3 farmers; 2 potato seed traders |
1 large potato industry professional (R&D manager) | 1 retailer | 1 food service |
| Green-house grown vegetables | 1 farmer | 1 packaging plant (ceo); 1 vegetable slicing/cutting plant (ceo) |
- | |
Table 2.
Overview of common food leverage points: events (food waste hotspots), patterns, structures and mental models across the four food chains.
Table 2.
Overview of common food leverage points: events (food waste hotspots), patterns, structures and mental models across the four food chains.
| Primary production | Processing and manufacturing | Retail and markets | Food Service | ||
 |
 |
 |
 |
||
| Event / | 1. Defect in starting material | x | |||
| Food waste hotspots |
2. Contaminated animals or products | x | |||
| 3. Physical damage to product | x | x | x | ||
| 4. Deficiency in technical processing | x | x | |||
| Patterns of behaviour | 5. Matching supply/demand: overproduction or cancellation of orders (pattern) | x | x |
x |
x |
| 6. Sampling for quality control | x | ||||
| 7. Packaged product is not sold | x | x | |||
| 8. Wrong delivery / order | x | x | |||
| 9. Human errors | x | x | x | x | |
| 10. Rejection due to spoilage | x | x | x | ||
| 11. Edible but not known as food | x | x | x | ||
| Structures | 12. Customer (quality) requirements | x | x | x | x |
| 13. Logistics | x | x | x | x | |
| 14. Law / Regulation | x | x | x | x | |
| 15. Insufficient training of employees | x | x | x | x | |
| 16. Innovation products cannot be released to market | x | ||||
| Mental models | 17. Reducing FW is not a priority | x | x | x | x |
| 18. Reducing FW is not seen as a way to make environmental impact | x | x | x | x | |
| 19. There is no priority to invest in alternative technologies if there is no financial incentive | x | x | x | x | |
| 20. Lack of FW reduction skills amongst employees | x | x | x | x | |
| 21. There is a pressure to meet quality and consumer standards | x | x | x | x | |
| 22. Oversupply is the norm | x | x | x | x | |
Disclaimer/Publisher’s Note: The statements, opinions and data contained in all publications are solely those of the individual author(s) and contributor(s) and not of MDPI and/or the editor(s). MDPI and/or the editor(s) disclaim responsibility for any injury to people or property resulting from any ideas, methods, instructions or products referred to in the content. |
© 2025 by the authors. Licensee MDPI, Basel, Switzerland. This article is an open access article distributed under the terms and conditions of the Creative Commons Attribution (CC BY) license (http://creativecommons.org/licenses/by/4.0/).
Copyright: This open access article is published under a Creative Commons CC BY 4.0 license, which permit the free download, distribution, and reuse, provided that the author and preprint are cited in any reuse.


