
Submitted:
23 April 2025
Posted:
24 April 2025
You are already at the latest version
Abstract
Dengue, a mosquito-borne viral infection affecting 100–400 million people eachyear, is a serious global health threat, particularly in tropical and subtropical regions. In the absence of specific antiviral treatment, early and accurate detection is critical to effective disease management. In this article, we present a novel detection method approach using photonic crystals to identify dengue related changes in biological components like platelets, haemoglobin, and plasma. Through measuring refractive index and central wavelength shift analysis, this technique gives an extremely sensitive and precise detection mechanism. This proposed structure as a two-dimensional photonic crystal ring resonator demonstrates a Laurentian peak cavity with a high-quality factor, enabling a very high sensitivity of around 1800 nm/RIU with high diagnostic accuracy, highlighting its promise as a tool for combating dengue.
Keywords:
Photonic crystal
; Dengue
; cavity
; optifdtd
1. Introduction
Dengue fever, an infection spread by mosquitoes and caused by the dengue virus (DENV), continues to pose a major threat to health across the globe in warm, humid areas. Each year, it affects between 100 and 400 million people, putting a huge strain on healthcare systems around the world [1]. The illness shows up in many different ways, from no symptoms at all or a mild fever to severe dengue. This serious form leads to leaky blood vessels, bleeding, and damage to organs, which can kill if not treated quickly [2]. Despite decades of research, there is no specific antiviral treatment for dengue, making early detection and accurate diagnosis critical to reducing morbidity and mortality [3,4].
Such traditional dengue diagnostic methods, such as enzyme-linked immunosorbent ELISA) [5] and polymerase chain reaction (PCR) [6] have drawbacks regarding expenditure, intricacy, and time-to-outcomes, especially in resource-resultative settings [7]. These challenges led to the emergence of new diagnostic technologies that are fast and affordable. Among these, photonic crystal-based sensors have emerged as a promising tool for disease detection due to their ability to measure minute changes in the refractive index of biological samples [8,9].
For the early detection of dengue, this study proposes an innovative diagnostic technology using photonic crystals to analyse biological components such as infected platelets, haemoglobin, and plasma. The proposed model takes advantage of the unique optical properties of photonic crystals, which have a Lorentzian peak cavity known by their symmetric, bell-shaped profile centred around a resonance frequency with a high-quality factor that allows for the precise measurement of changes in the refractive index and central wavelength shifts. These changes indicate dengue-related changes in biological samples, enabling highly sensitive and accurate detection [10]. The system achieves a sensitivity of approximately 1800 nm/RIU, this demonstrates its potential as a transformative tool for dengue diagnosis.
A significant advancement in the field is the integration of photonic crystal-based sensors in dengue diagnostics [11]. This technology has the potential to improve patient outcomes, enhance disease surveillance, and reduce the global burden of dengue by providing rapid and accurate detection of dengue-related changes in blood components. However, challenges such as the need for precise manufacturing, calibration, and validation with clinical samples will need to be addressed to ensure its scalability and practical application in a variety of settings [12].
In this paper, we present the development, and evaluation of a photonic crystal based diagnostic system for dengue detection. It detects dengue-related changes in biological components such as infected platelets, haemoglobin, and plasma. with their refractive indices in the human body. To evaluate the band gap, quality factor, and power efficiency of the biosensor, mainly two important methods are used: Plane Wave Expansion method and FDTD method [13,14,15,16,17]. Here, we will detect the transmittance spectra of normal blood components haemoglobin, platelets, and plasma with respect to the infected blood components.
The structure of the paper is as follows. In section 2, the structure and design that supports the proposed method with a detailed description of the design structure. After that, in section 3, an analysis of results is given, including Central wavelength shift according to refractive index, refractive index distribution, and normalized transmission for different wavelengths of platelets, haemoglobin, and plasma. Finally, section 4 is aimed to highlight the main conclusions.
2. Structure and Design
The sensor is formed by two-dimensional photonic crystal ring resonator coupled with two waveguides in order to detecting dengue fever virus in blood components. The structure is composed of circular silicon rods of 170 nm of radius hexagonally distributed in air wafer with a respected lattice constant of 540 nm.
3. Band Gap Calculation
Both the transmission spectra and field distribution are obtained through the complementary roles of the Plane Wave Expansion (PWE) method and the OptiFDTD simulator from the Optiwave package, which is a finite-difference time-domain (FDTD) software based on the numerical solution of Maxwell’s equations. The PWE method is primarily used to calculate the band structure, allowing researchers to identify photonic bandgaps—frequency ranges where light cannot propagate. Afterward, the FDTD method is used to calculate the power transmission spectrum. The applied PWE method reveals two photonic bandgaps; the selected one lies between 1.04 µm and 1.33 µm, as shown in Figure 3.
4. Distribution Field
The structure is surrounded by a Perfectly Matched Layer (PML), which serves as an absorbing boundary condition to truncate the computational domain and prevent back reflections from the boundaries [18].
The mesh size is taken Δx =Δy = 0.05µm where the maximum time step Δt is approximately:
Δt≈1.67×10⁻¹⁶seconds. This value response to the Courant Stability Condition where:
c: Speed of light in the medium (for free space c≈3×10⁸ m/s).
The structure has been excited with a Gaussian pulse centred at 1.25909 µm with TE polarization
Figure 4 represents the distribution field at different simulation time showing: (a) The directional wave propagation before interaction, (b) significant energy localization within the cavity with high-intensity regions, and (c) the structured interference pattern indicating resonance.
The electric field of the bus waveguide is fully transferred to the circular ring cavity because it has been blocked by the four pillars in the middle of the structure where it has been coupled with the resonant cavity. Hence, the signal reaches the output port while some of it is reflected to the input, which reduces the output power (95%).
5. Detection Mechanism
In patients infected with dengue fever, the refractive index (RI) of blood components changes due to plasma leakage, haemoconcentration, and thrombocytopenia, which directly affect plasma, haemoglobin, and platelets. The typical refractive indices for healthy individuals and dengue-infected patients are approximately: plasma – 1.337 (healthy) to 1.35 (infected), haemoglobin – 1.357 to 1.36, and platelets – 1.39 to 1.4 [19].
The structure has been excited with a Gaussian pulse cantered at 1.25909 µm with TE polarization using a laser source and infiltrated with healthy and infected human blood components which are (platelets, haemoglobin, and plasma)
After that using a spectrometer the transmission spectrum shift between healthy and infected blood components has been detected. Figure 5 explains the detection mechanism.
6. Results and Discussion
The transmission spectrum shifts between infected and healthy components detected at the output using a photodetector appears as a symmetrical Lorentzian cavity with high quality factor reached 943.903. Due to the resonator shape which allow a strong localization of light and increases interaction between light and matter, the sensitivity has reached a highest-level of 1800 nm /RIU with haemoglobin detection.
Figure 6 illustrates the transmission spectra of normal Blood platelets Vs. Infected blood platelets at refractive indices 1.337 and 1.35 respectively. The transmission peaks of normal and infected blood platelets are centred at wavelengths 2.02083µm and 2.0297.µm respectively. The corresponding efficiency of normal and infected blood platelets recorded as 95% and 93% respectively.
Figure 7 illustrates the transmission spectra of normal Blood Haemoglobin Vs. Infected blood Haemoglobin at refractive indices 1.357 and 1.36 respectively. The transmission peaks of normal and infected blood haemoglobin are centred at wavelengths 2.03437 µm and 2.03998 µm respectively. The output efficiency of normal and infected blood Haemoglobin recorded as 97% and 95% respectively.
Figure 8 illustrates the transmission spectra of normal Plasma Vs. Infected plasma at refractive indices 1.39 and 1.4 respectively. The transmission peaks of normal and infected plasma are centred at wavelengths 2.05679 µm and 2.06427 µm respectively. The output efficiency of normal and infected RBC recorded as 95 % and 91 % respectively.
Figure 9 illustrates the total normalized transmission of blood components (platelets, haemoglobin, and plasma) in normal and infected states across the infrared range ( 2.00 - 2.20 µm). Distinct transmission peaks between 2.02083 and 2.06427 µm. Infected samples exhibit spectral shifts and variations in intensity, suggesting molecular and structural changes due to infection. Notably, infected haemoglobin and platelets show stronger absorption, likely due to protein modifications or aggregation. These spectral differences highlight the potential of near-infrared spectroscopy as a diagnostic tool for detecting infections based on unique optical signatures.
Figure 10 represents the central wavelength shift according to the refractive index value. The curve consists of three straight lines where their inclination represents the sensitivity. The straight in the coloured area is considered the most inclined one and therefore the most sensitive; and this is confirmed by the highest bar in Figure 10. So, it can be said that this sensor is very sensitive in the refractive index range between 1.357 and 1.36. Which corresponds to haemoglobin refractive index detection. This makes it possible to apply this sensor to detect anaemia in the blood.
Figure 11 shows a variable system sensitivity as a function of the refractive index, with a dominant peak at n = 1.36 (exceeding 1800 nm/RIU), indicating strong resonance. Other indices (1.35, 1.39and1.40) exhibit lower sensitivities, while a lack of significant response is observed between 1.37 and 1.38. This behaviour suggests system optimization for specific refractive indices, potentially useful in biosensing. However, such variability could pose a challenge for applications requiring a linear response. A deeper analysis of optical interactions would help explain these abrupt variations.
Table 1 presents the sensitivity and quality factor (Q) of blood components in dengue cases for different refractive index values. The analysis highlights a strong variation in sensitivity, with a peak at n = 1.36 reaching 1870 mm/RIU. This value indicates a highly amplified sensor response at this refractive index, other refractive indices, such as n = 1.35 and n = 1.357, exhibit significantly lower sensitivities of 682.307mm/RIU and 667.142mm/RIU, respectively. Similarly, indices n = 1.39 and n = 1.4 display lower sensitivities of 560.333mm/RIU and 748mm/RIU, suggesting a weaker sensor response for these values. The quality factor (Q), which represents the efficiency and sharpness of resonance, which is calculated as λ/∆λ (resonant wavelength/full width half maximum). It reaches its maximum at n = 1.357 with Q = 943.309, indicating a more defined resonance with lower energy losses. However, this does not correspond to the highest sensitivity, suggesting that the optimal balance between quality and sensitivity does not necessarily occur at the refractive index with the highest Q. This suggests optical sensor is particularly responsive at n = 1.36, which may correspond to a specific signature of blood components affected by dengue.
To explain the sharp rise in sensitivity noted during haemoglobin sensing Figure 11 illustrates the normalized transmission spectrum of a coupled system consisting of three states: a discrete state, a coupled state, and a continuum state. The coupled state appears as a sharp, amplified peak around 2.04 µm, indicating strong energy localization, while the continuum state exhibits a more gradual increase in transmission. That’s leads to the critical coupling resonator which occurs when all the light from the bus waveguide is coupled into the ring. Intuitively explained, the light incoming from the ring is just right to completely destructively interfere with the light in the input bus waveguide, causing all the light to couple into the resonator. The critical coupling resonator makes this resonance highly sensitive to environmental changes, and this explains the sudden increase in sensitivity observed during haemoglobin detection [20].
7. Conclusions
In conclusion, the study presents a diagnostic technique using photonic crystal sensors to facilitate the early detection of dengue fever. This approach utilizes infected components such as platelets, haemoglobin, and plasma that incorporate changes in refractive index. Therefore, it achieves an unparalleled sensitivity of about 1800 nm/RIU making the detection of any changes related to the dengue virus swift and accurate. It has been shown that this sensor has a great sensitivity to haemoglobin compared to other components due to the critical coupling resonator at its refractive index, this opens the door to the possibility of applying it to detect anaemia in the blood.
References
- S. Bhatt et al. The global distribution and burden of Dengue. Nature 2013, 496, 504–507. [Google Scholar] [CrossRef] [PubMed]
- M. G. Guzman and E. Harris. Dengue. Lancet 2015, 385, 453–465. [Google Scholar] [CrossRef]
- M. G. Guzman, D. J. Gubler, A. Izquierdo, E. Martinez, and S. B. Halstead. Dengue infection. Nat. Rev. Dis. Prim. 2016, 2, 16055. [Google Scholar] [CrossRef]
- J. L. Frazer and R. Norton. Dengue: A review of laboratory diagnostics in the vaccine age. J. Med. Microbiol. 2024, 73, 1–19. [CrossRef]
- S. D. Gan and K. R. Patel. Enzyme Immunoassay and Enzyme-Linked Immunosorbent Assay. J. Invest. Dermatol. 2013, 133, 1–3. [Google Scholar] [CrossRef] [PubMed]
- T. Kanagawa. Bias and artifacts in multitemplate polymerase chain reactions (PCR). J. Biosci. Bioeng. 2003, 96, 317–323. [Google Scholar] [CrossRef] [PubMed]
- R. W. Peeling et al. Evaluation of diagnostic tests: dengue. Nat. Rev. Microbiol. 2010, 8, S30–S37. [Google Scholar] [CrossRef] [PubMed]
- M. Soler, C. M. Soler, C. S’anchez, and L. Lechuga. Label-free plasmonic biosensors for pointof-care diagnostics: a review. Expert Rev. Mol. Diagn. [CrossRef]
- S. Bendib, A. Zegadi, and N. Djeffal. Improved sensitivity of 2D annular photonic crystal biosensor working at THz frequency range. Opt. Quantum Electron. 2016, 48, 1–8. [Google Scholar] [CrossRef]
- S. S. Hegde and B. R. Bhat. Dengue detection: Advances and challenges in diagnostic technology. Biosens. Bioelectron. X 2022, 10, 100100. [CrossRef]
- C¸. S. G¨urel and N. E. Ceylan. High sensitivity photonic crystal biosensor design for real time detection of viruses in infected blood sample. E. Ceylan. High sensitivity photonic crystal biosensor design for real time detection of viruses in infected blood sample. J. Opt. 2024. [CrossRef]
- M. Ghezal, L. Hamza, A. Zoukel, A. Benchiheb, and A. Hocini. High Sensitivity Biosensor Photonic Crystal Focused on Detecting the Concentration of the Biological Analytes. Prog. Electromagn. Res. C 2024, 146, 111–117. [Google Scholar] [CrossRef]
- R. Meade, A. Rappe, K. Brommer, J. Joannopoulos, and O. Alerhand. Erratum: Accurate theoretical analysis of photonic band-gap materials [Phys. Rev. B 48, 8434 (1993)]. Phys. Rev. B. Condens. Matter 1993, 48, 8434–8437. [Google Scholar] [CrossRef]
- Chutinan and, S. Noda. Chutinan, A. & Noda, S. Waveguides and waveguide bends in two-dimensional photonic crystal slabs. Phys. Rev. B 62, 4488-4492. Phys. Rev. B - Condens. Matter Mater. Phys. 2000, 62. [Google Scholar] [CrossRef]
- L. -F. Shen, S.-L. He, and L. Wu. The application of effective-medium theory in the plane-wave expansion method for analyzing photonic crystals. Acta Phys. Sin. -Chinese Ed. 2002, 51, 1137–1138. [Google Scholar]
- S. D. Gan and K. R. Patel. Enzyme Immunoassay and Enzyme-Linked Immunosorbent Assay. J. Invest. Dermatol. 2013, 133, 1–3. [CrossRef]
- Z. Xie et al. Simulation study on improving efficiencies of perovskite solar cell: Introducing nano textures on it. Opt. Commun. 2018, 410, 117–122. [Google Scholar] [CrossRef]
- S. Robinson and R. Nakkeer, ‘Photonic Crystal Ring Resonator Based Optical Filters’, Advances in Photonic Crystals. InTech, Feb. 13, 2013. [CrossRef]
- Sharma, Sanjeev; Kumar, Arun. Design of a Biosensor for the Detection of Dengue Virus Using 1D Photonic Crystals. Plasmonics 2022, 17, 1–6. [Google Scholar]
- Yariv, Amnon. Critical coupling and its control in optical waveguide-ring resonator systems. IEEE Photonics Technology Letters 2002, 14, 483–485.S. [Google Scholar] [CrossRef]
Figure 1.
design structure.
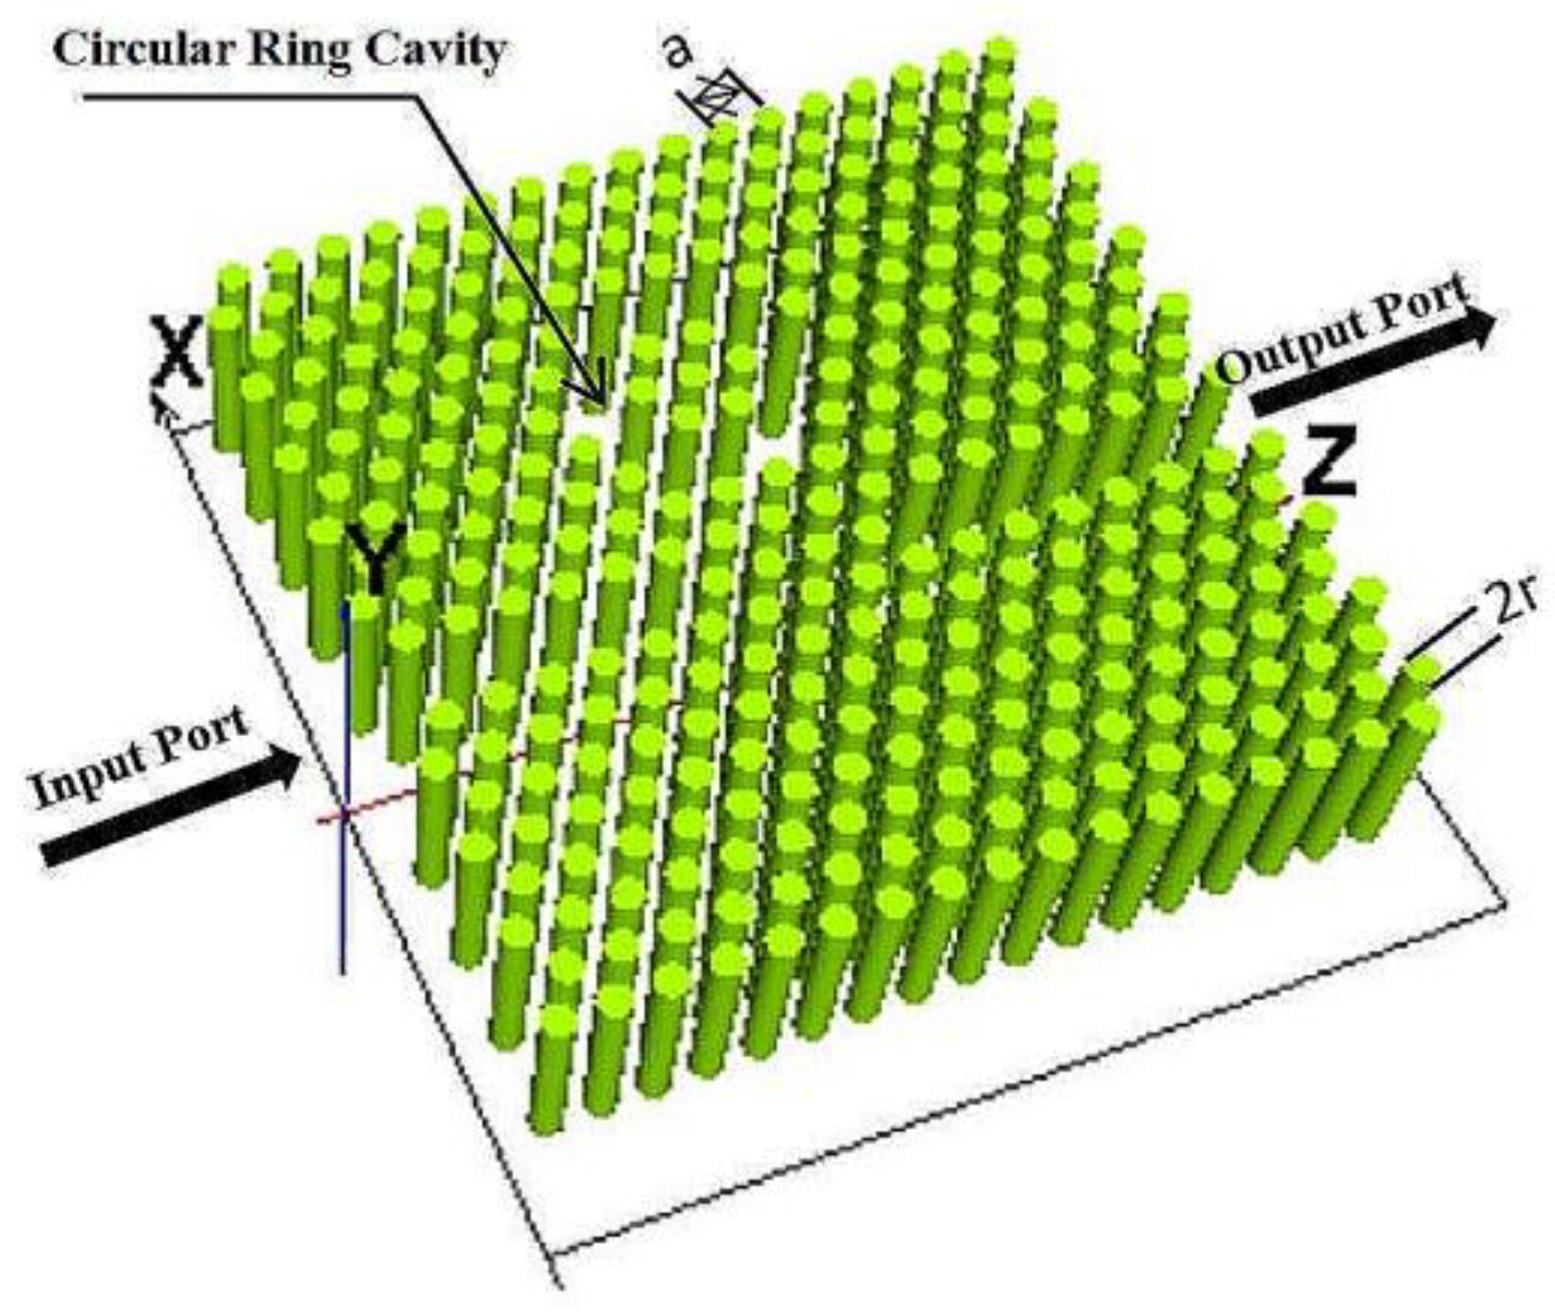
Figure 2.
Refractive index distribution.
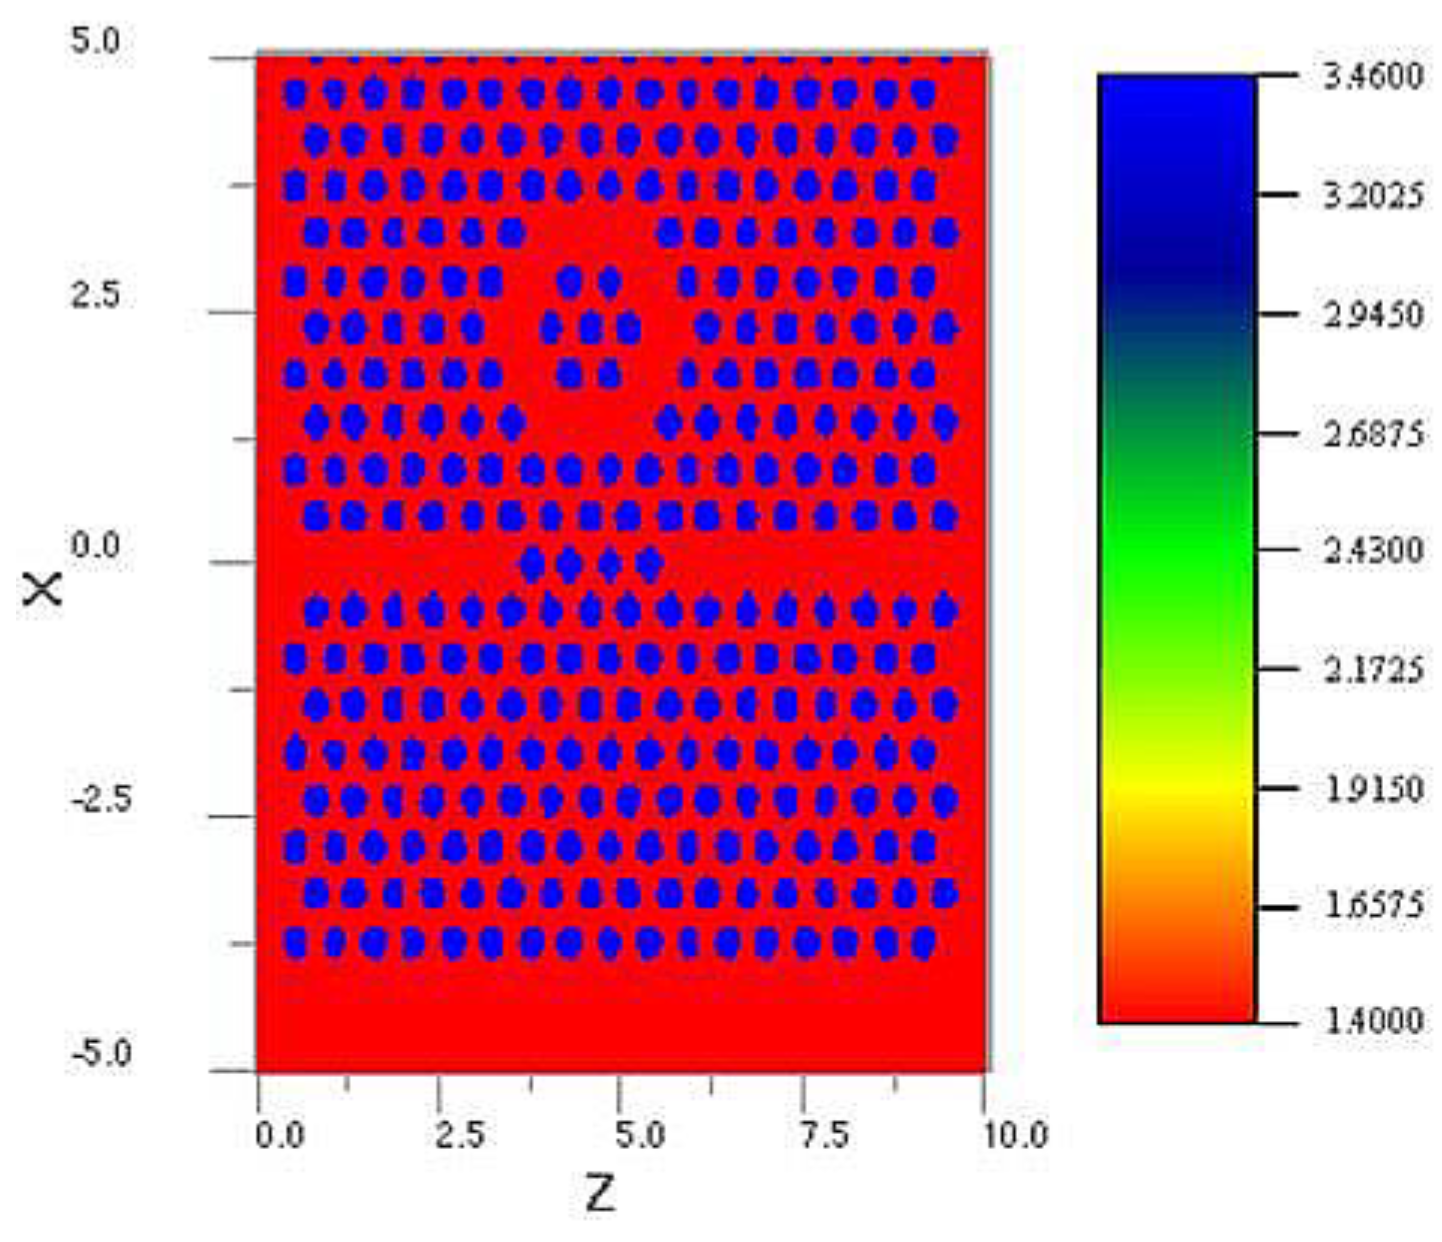
Figure 3.
Bandgap range of the structure.
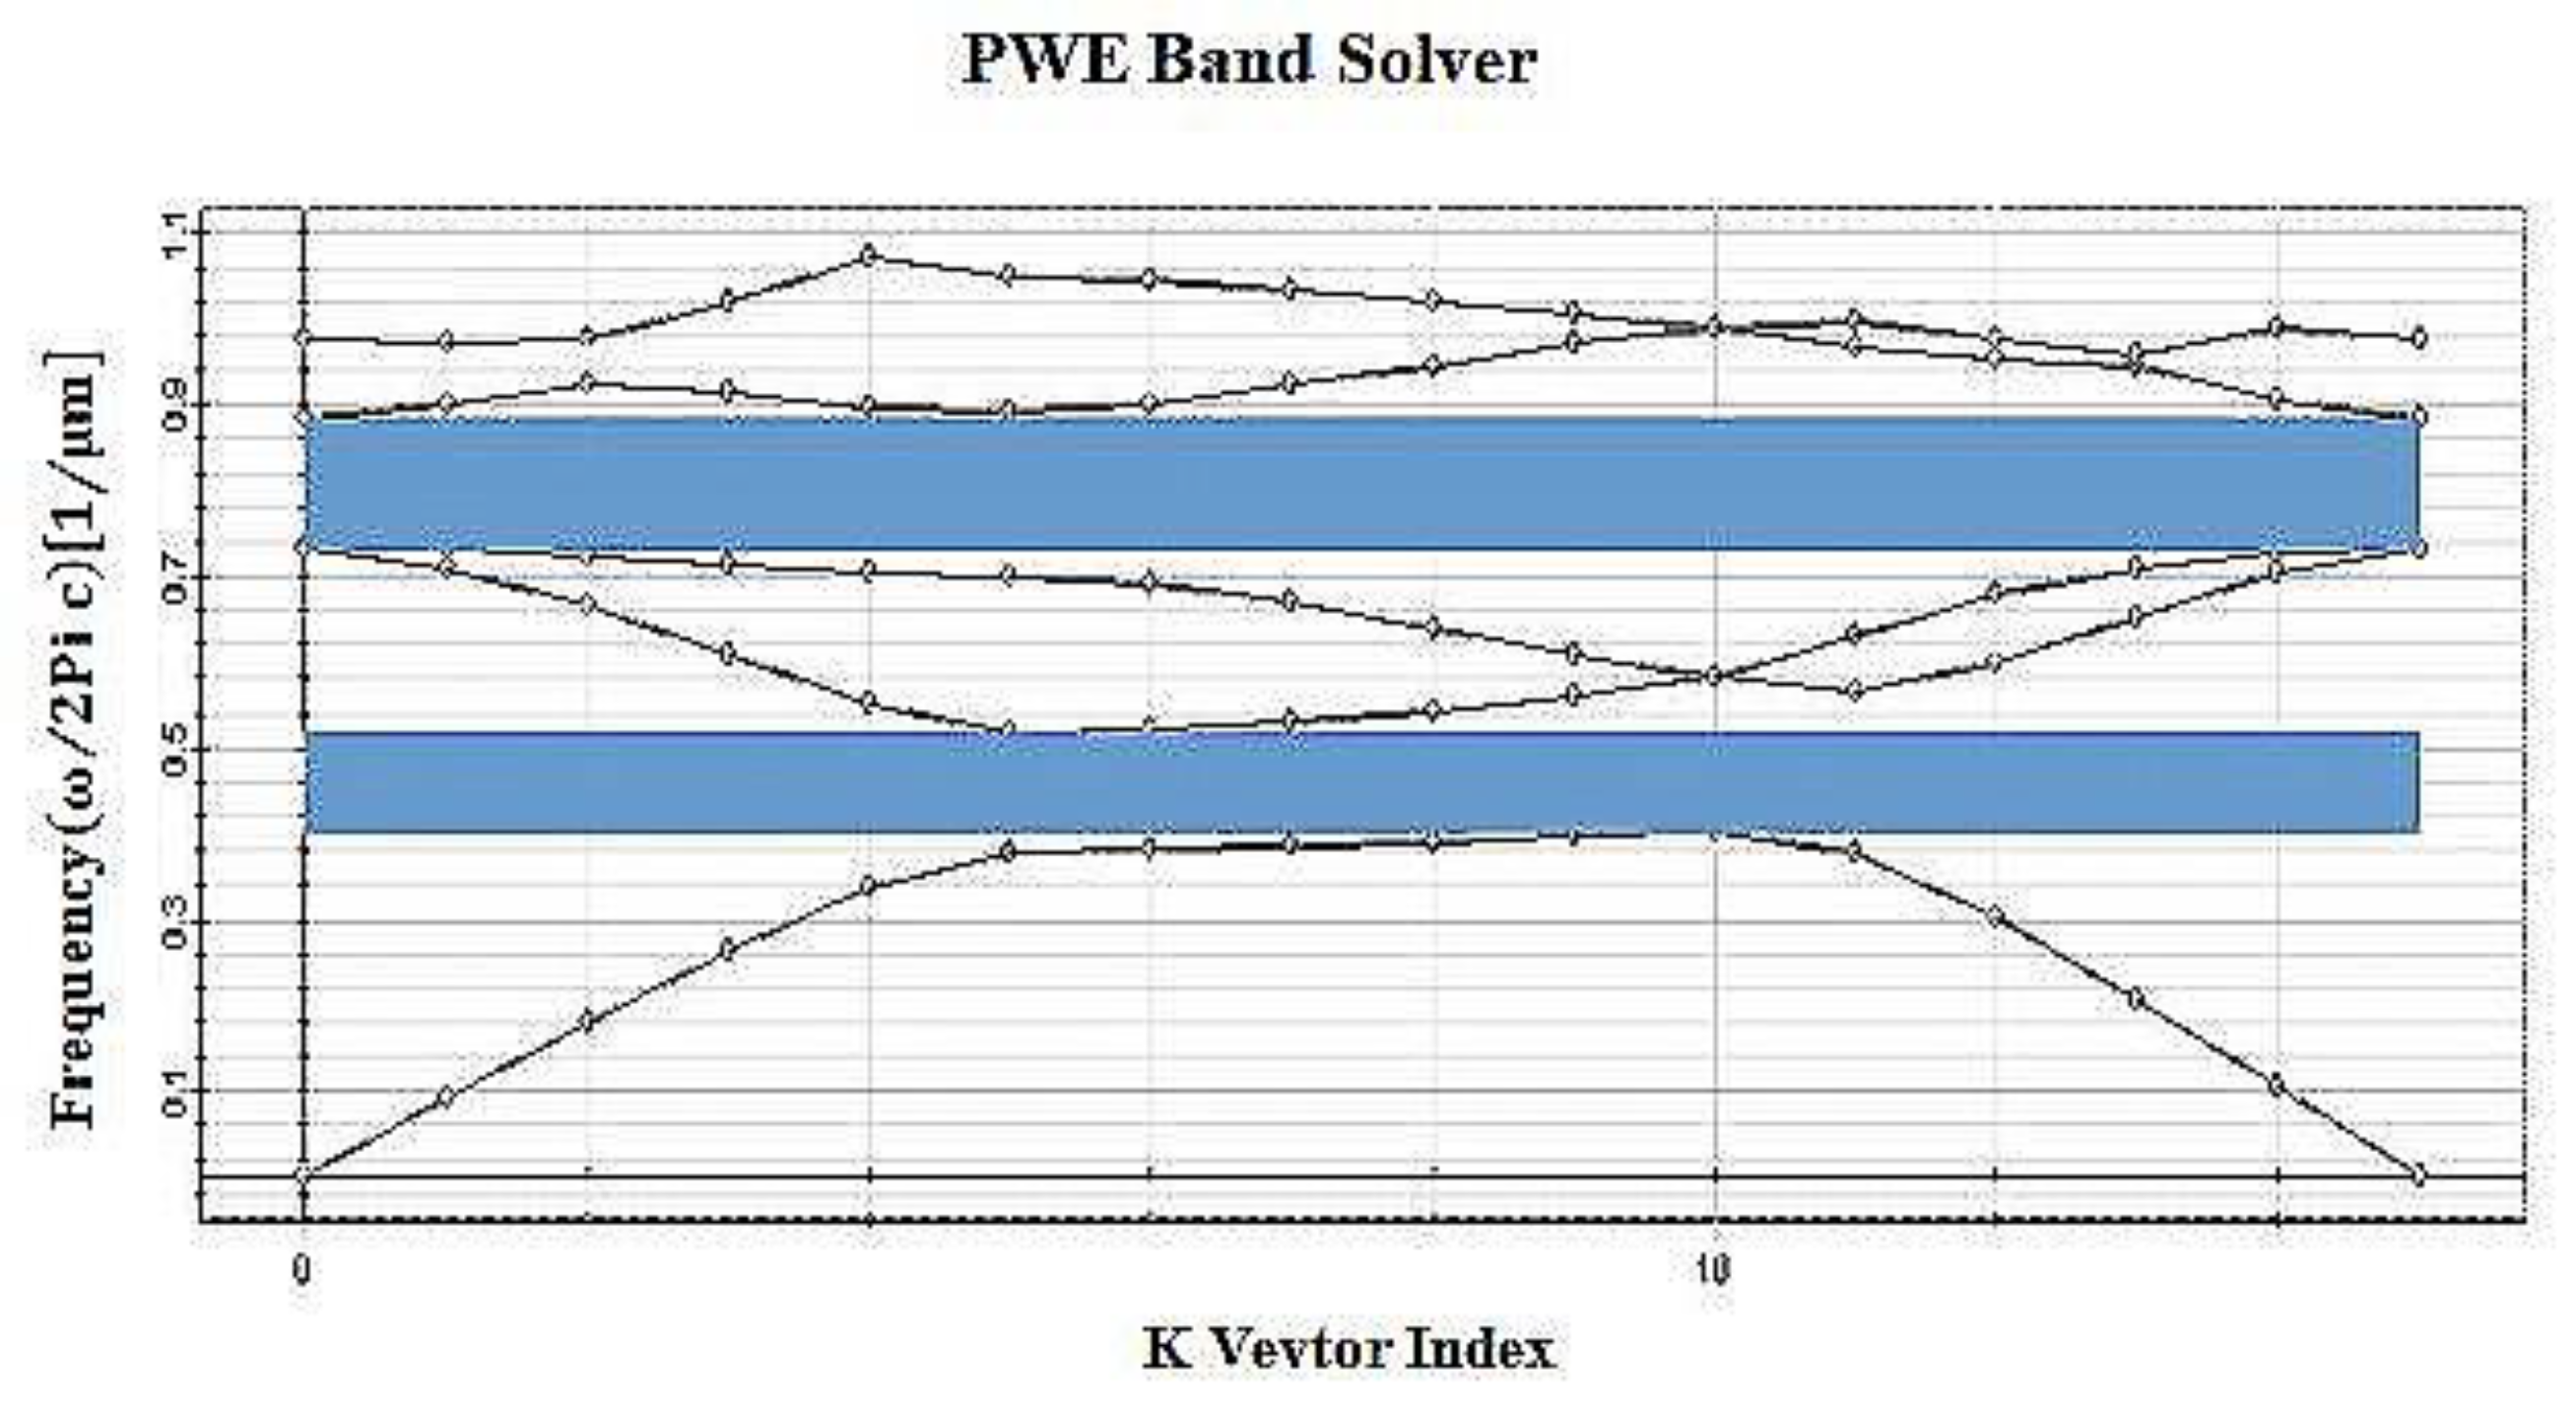
Figure 4.
Distribution field.
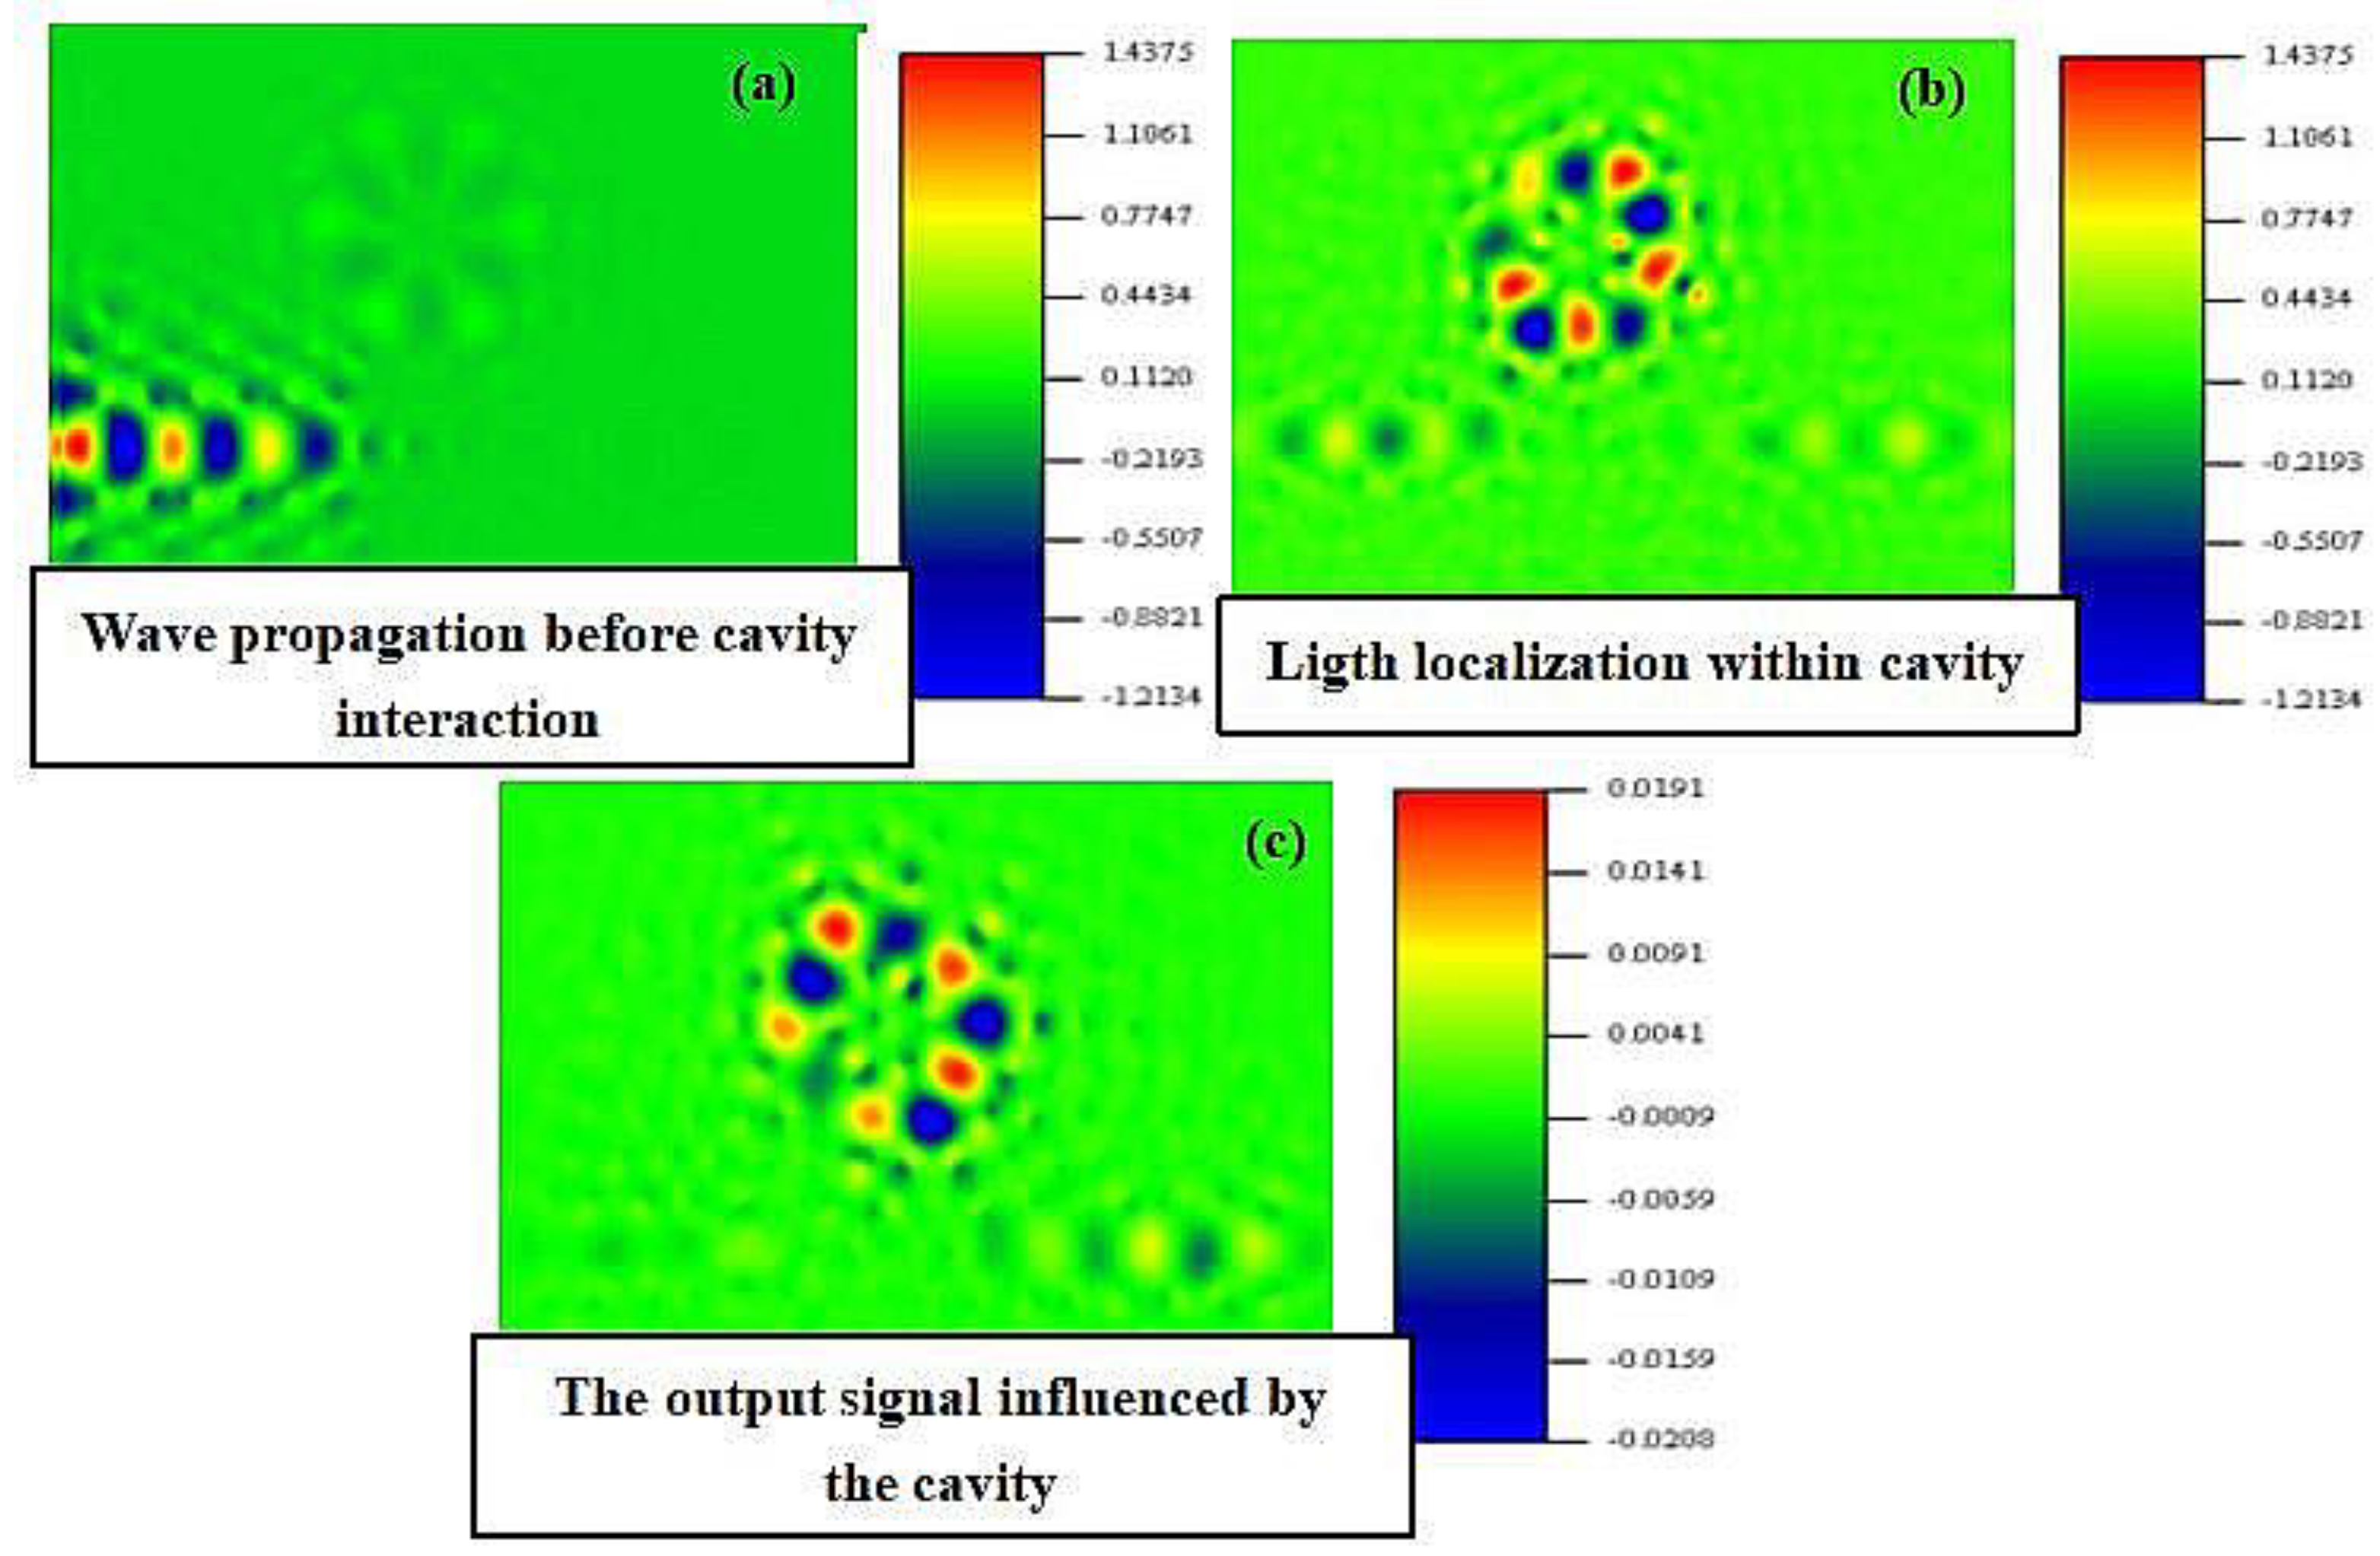
Figure 5.
The detection mechanism.
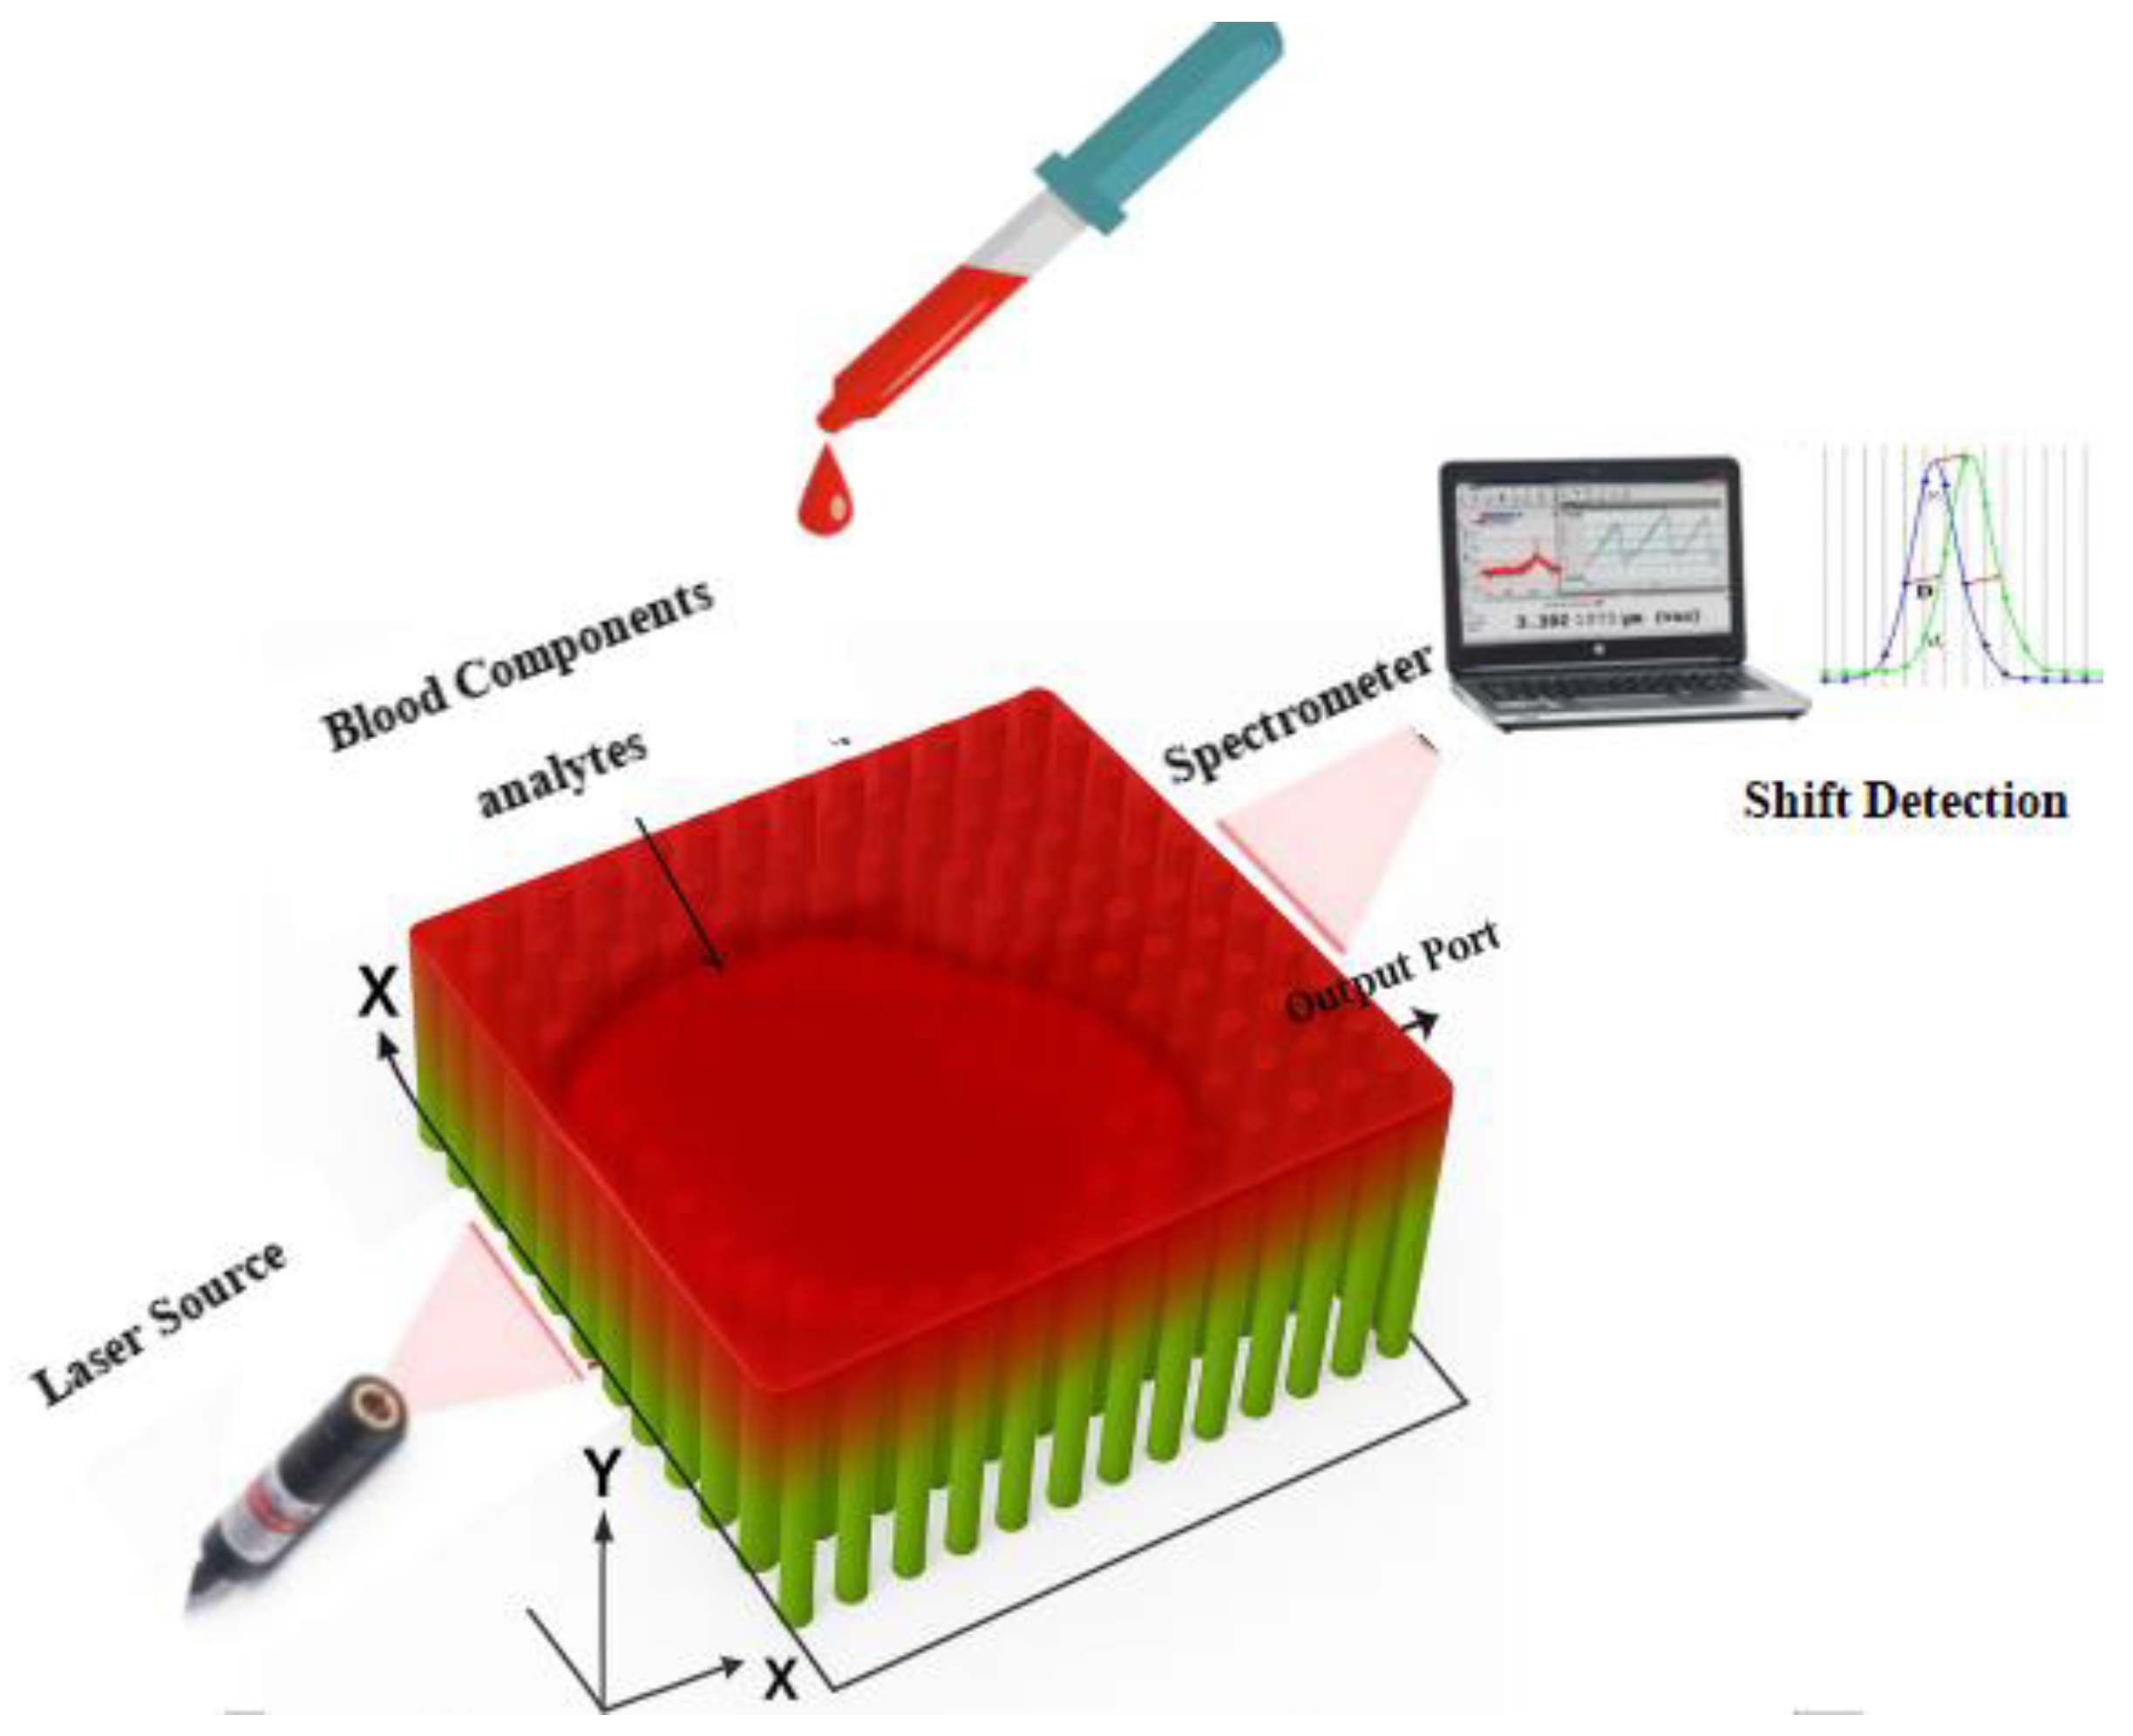
Figure 6.
Normalized transmission of infected and normal platelets.
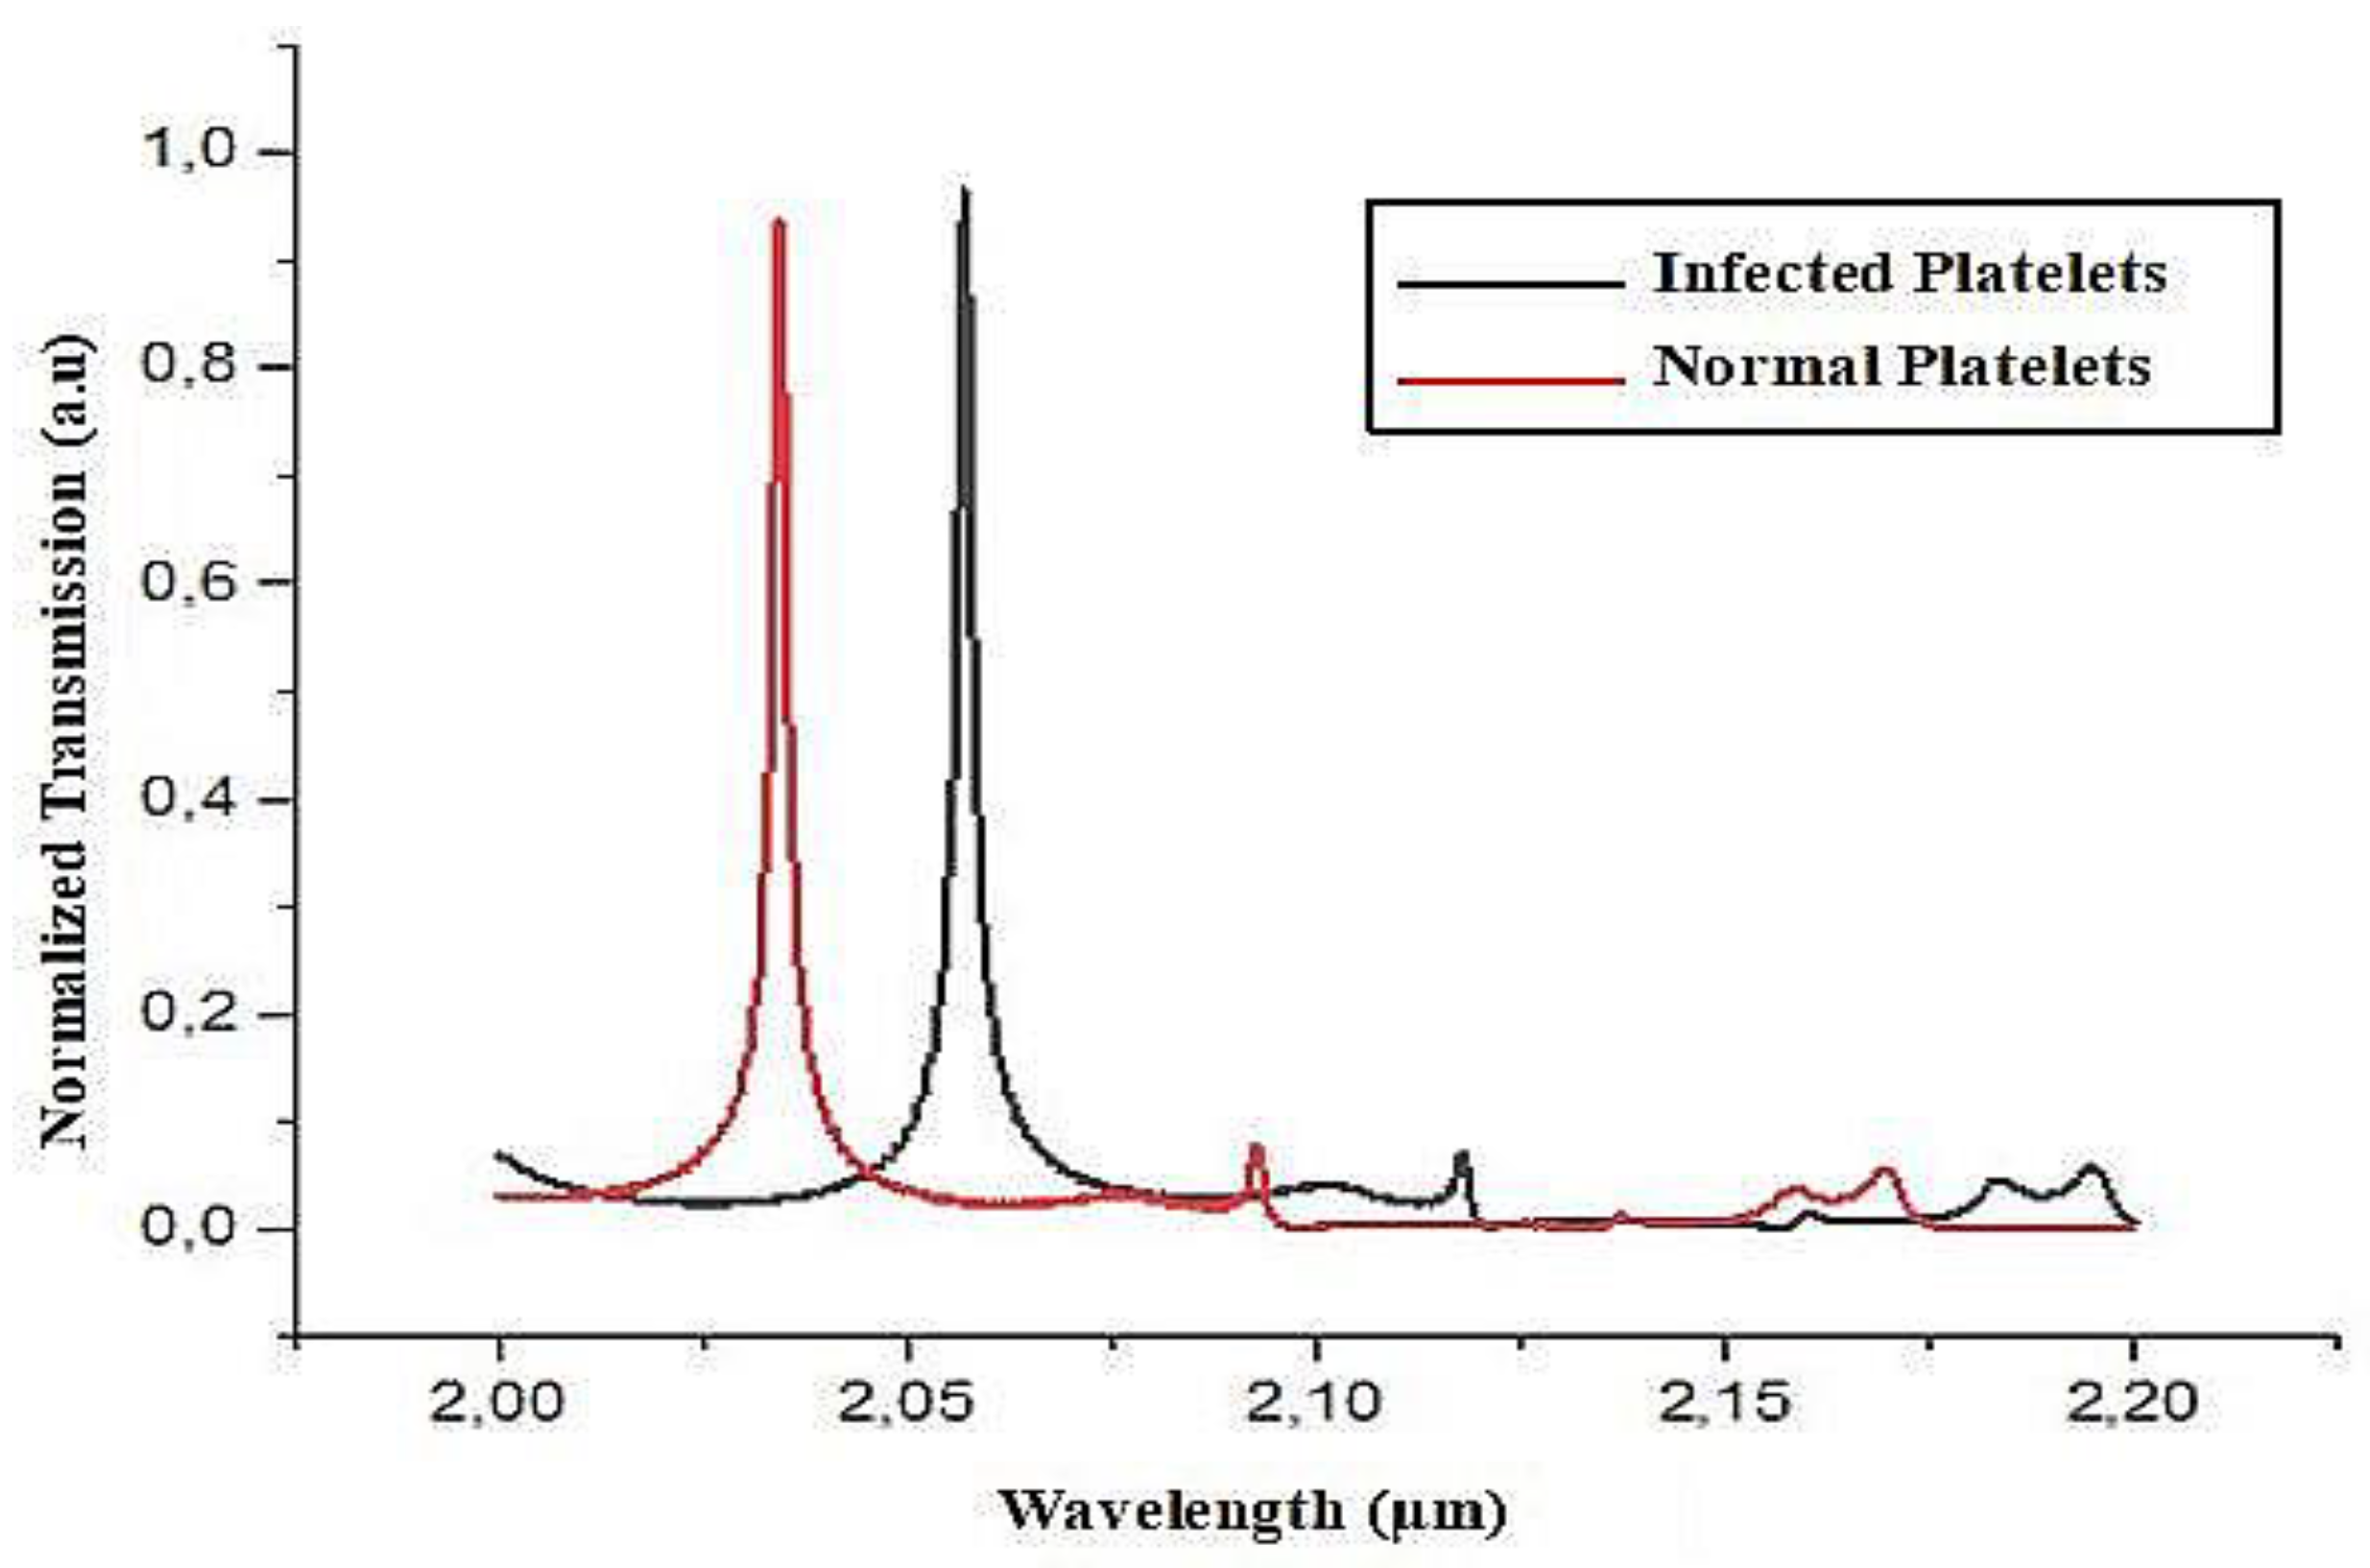
Figure 7.
Normalized transmission of infected and normal Haemoglobin.
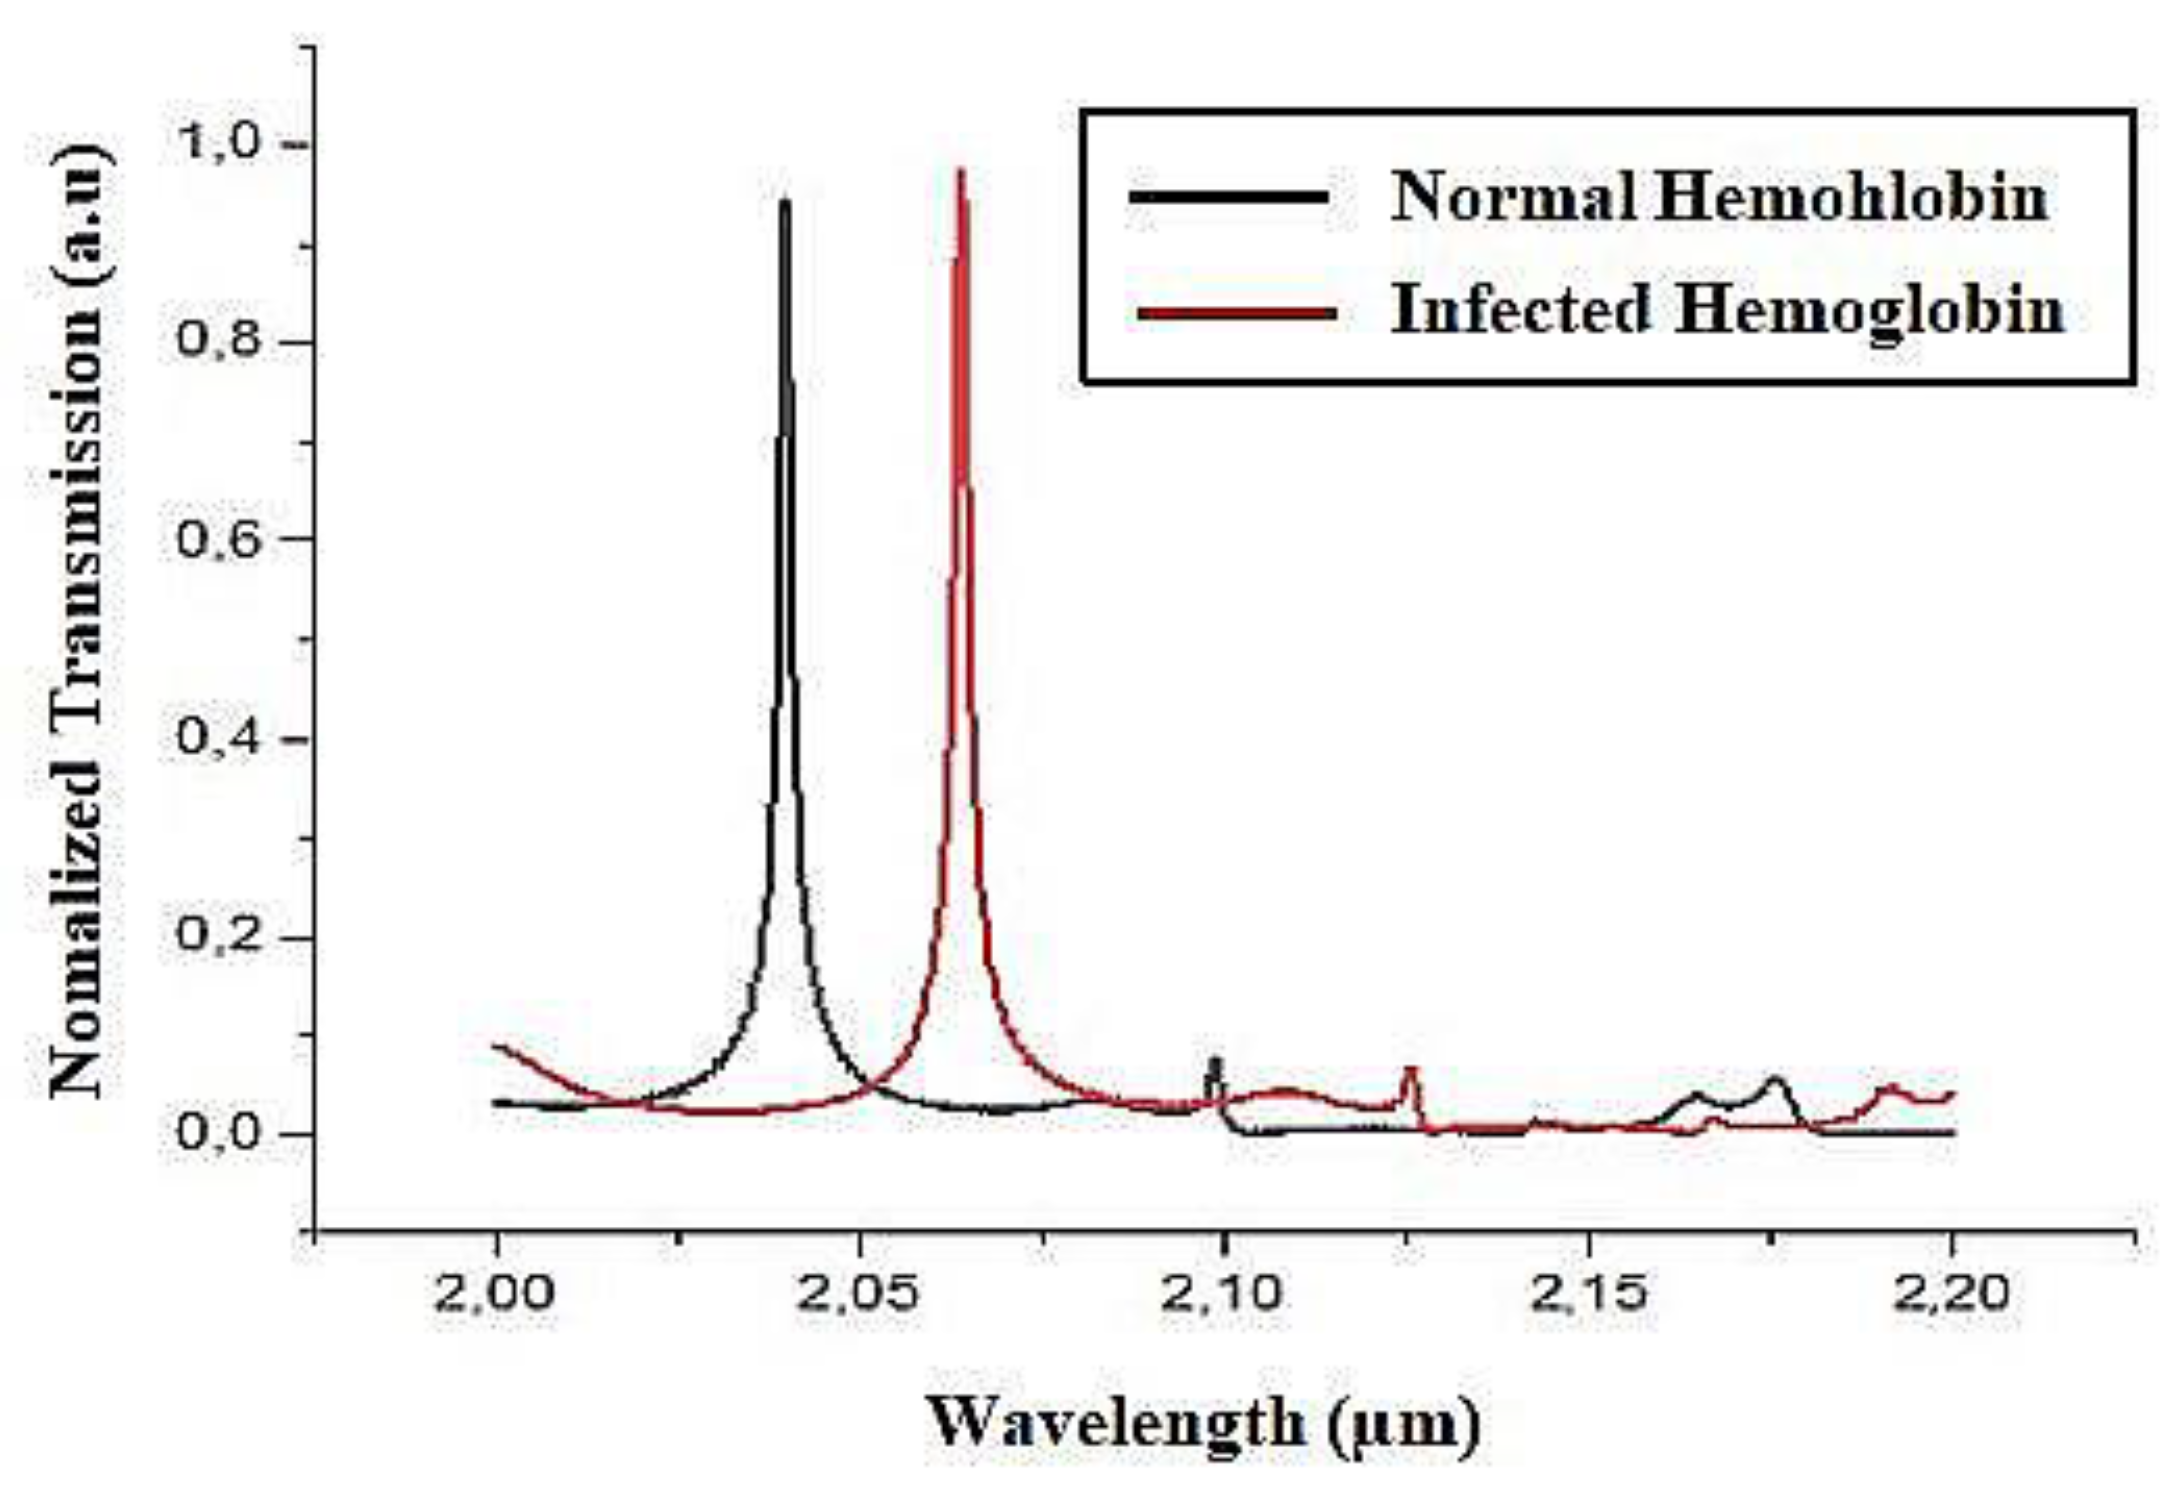
Figure 8.
Normalized transmission of infected and normal Plasma.
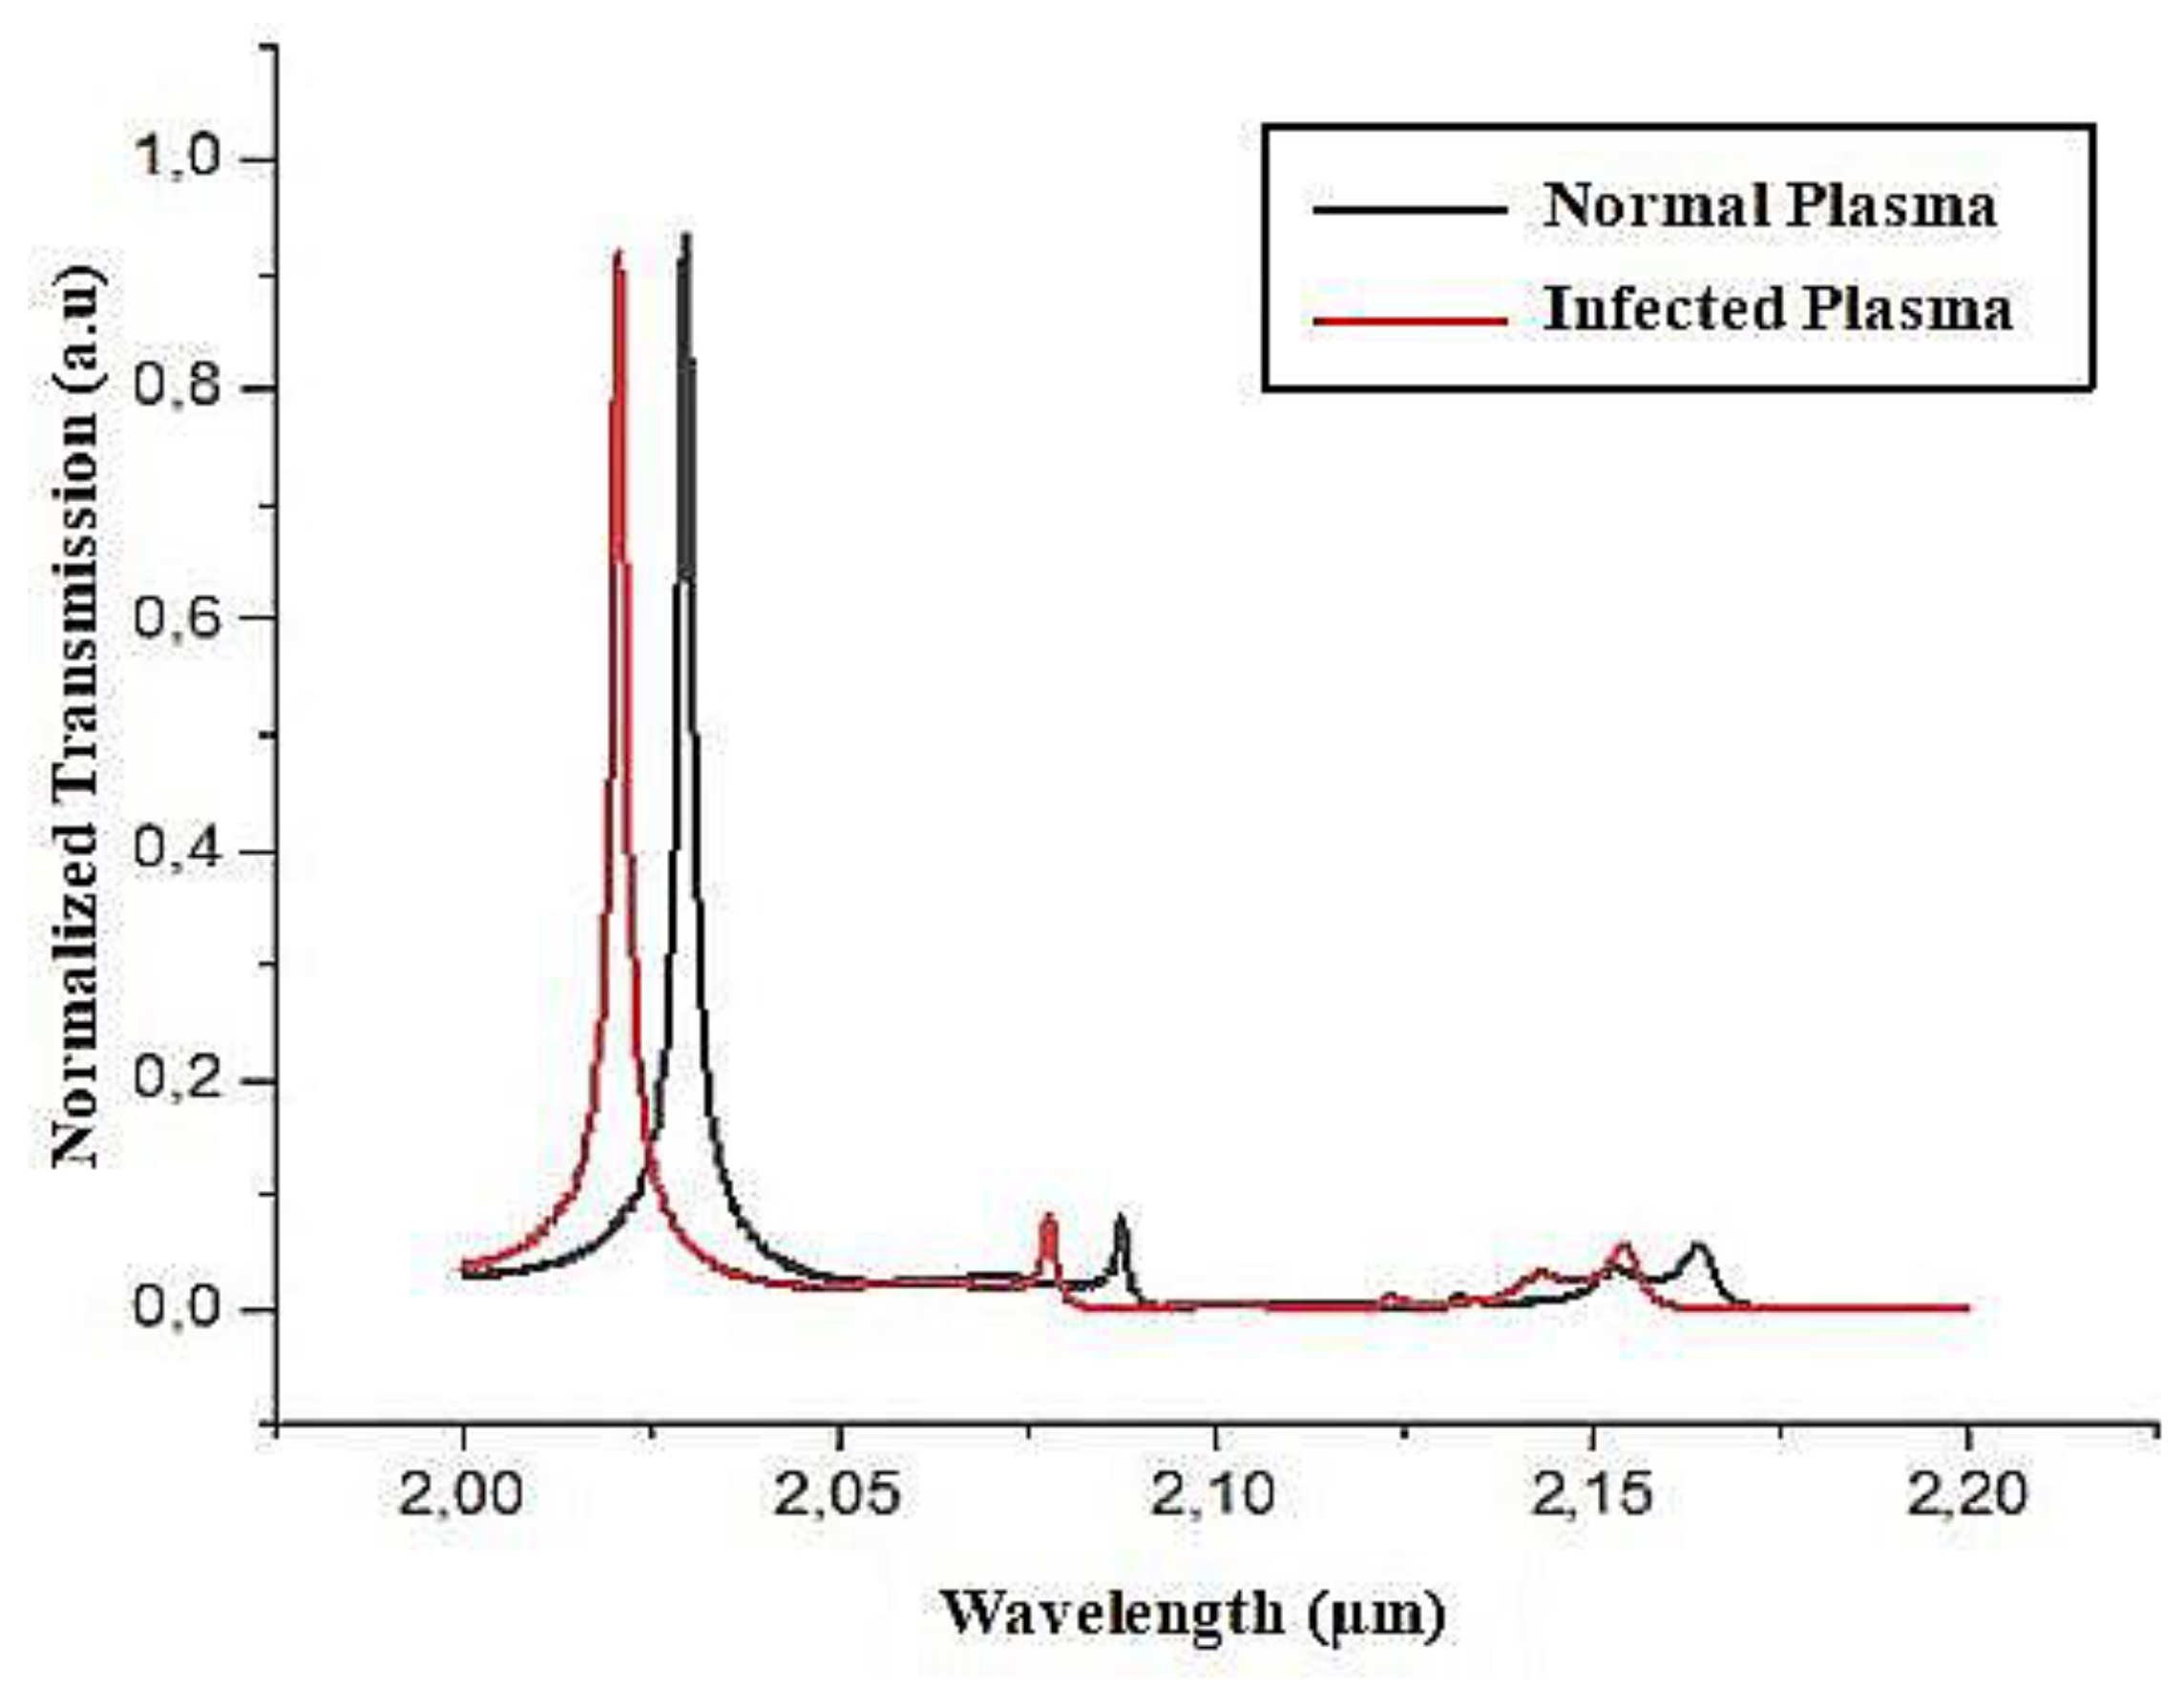
Figure 9.
Normalized transmission of infected and normal Plasma.
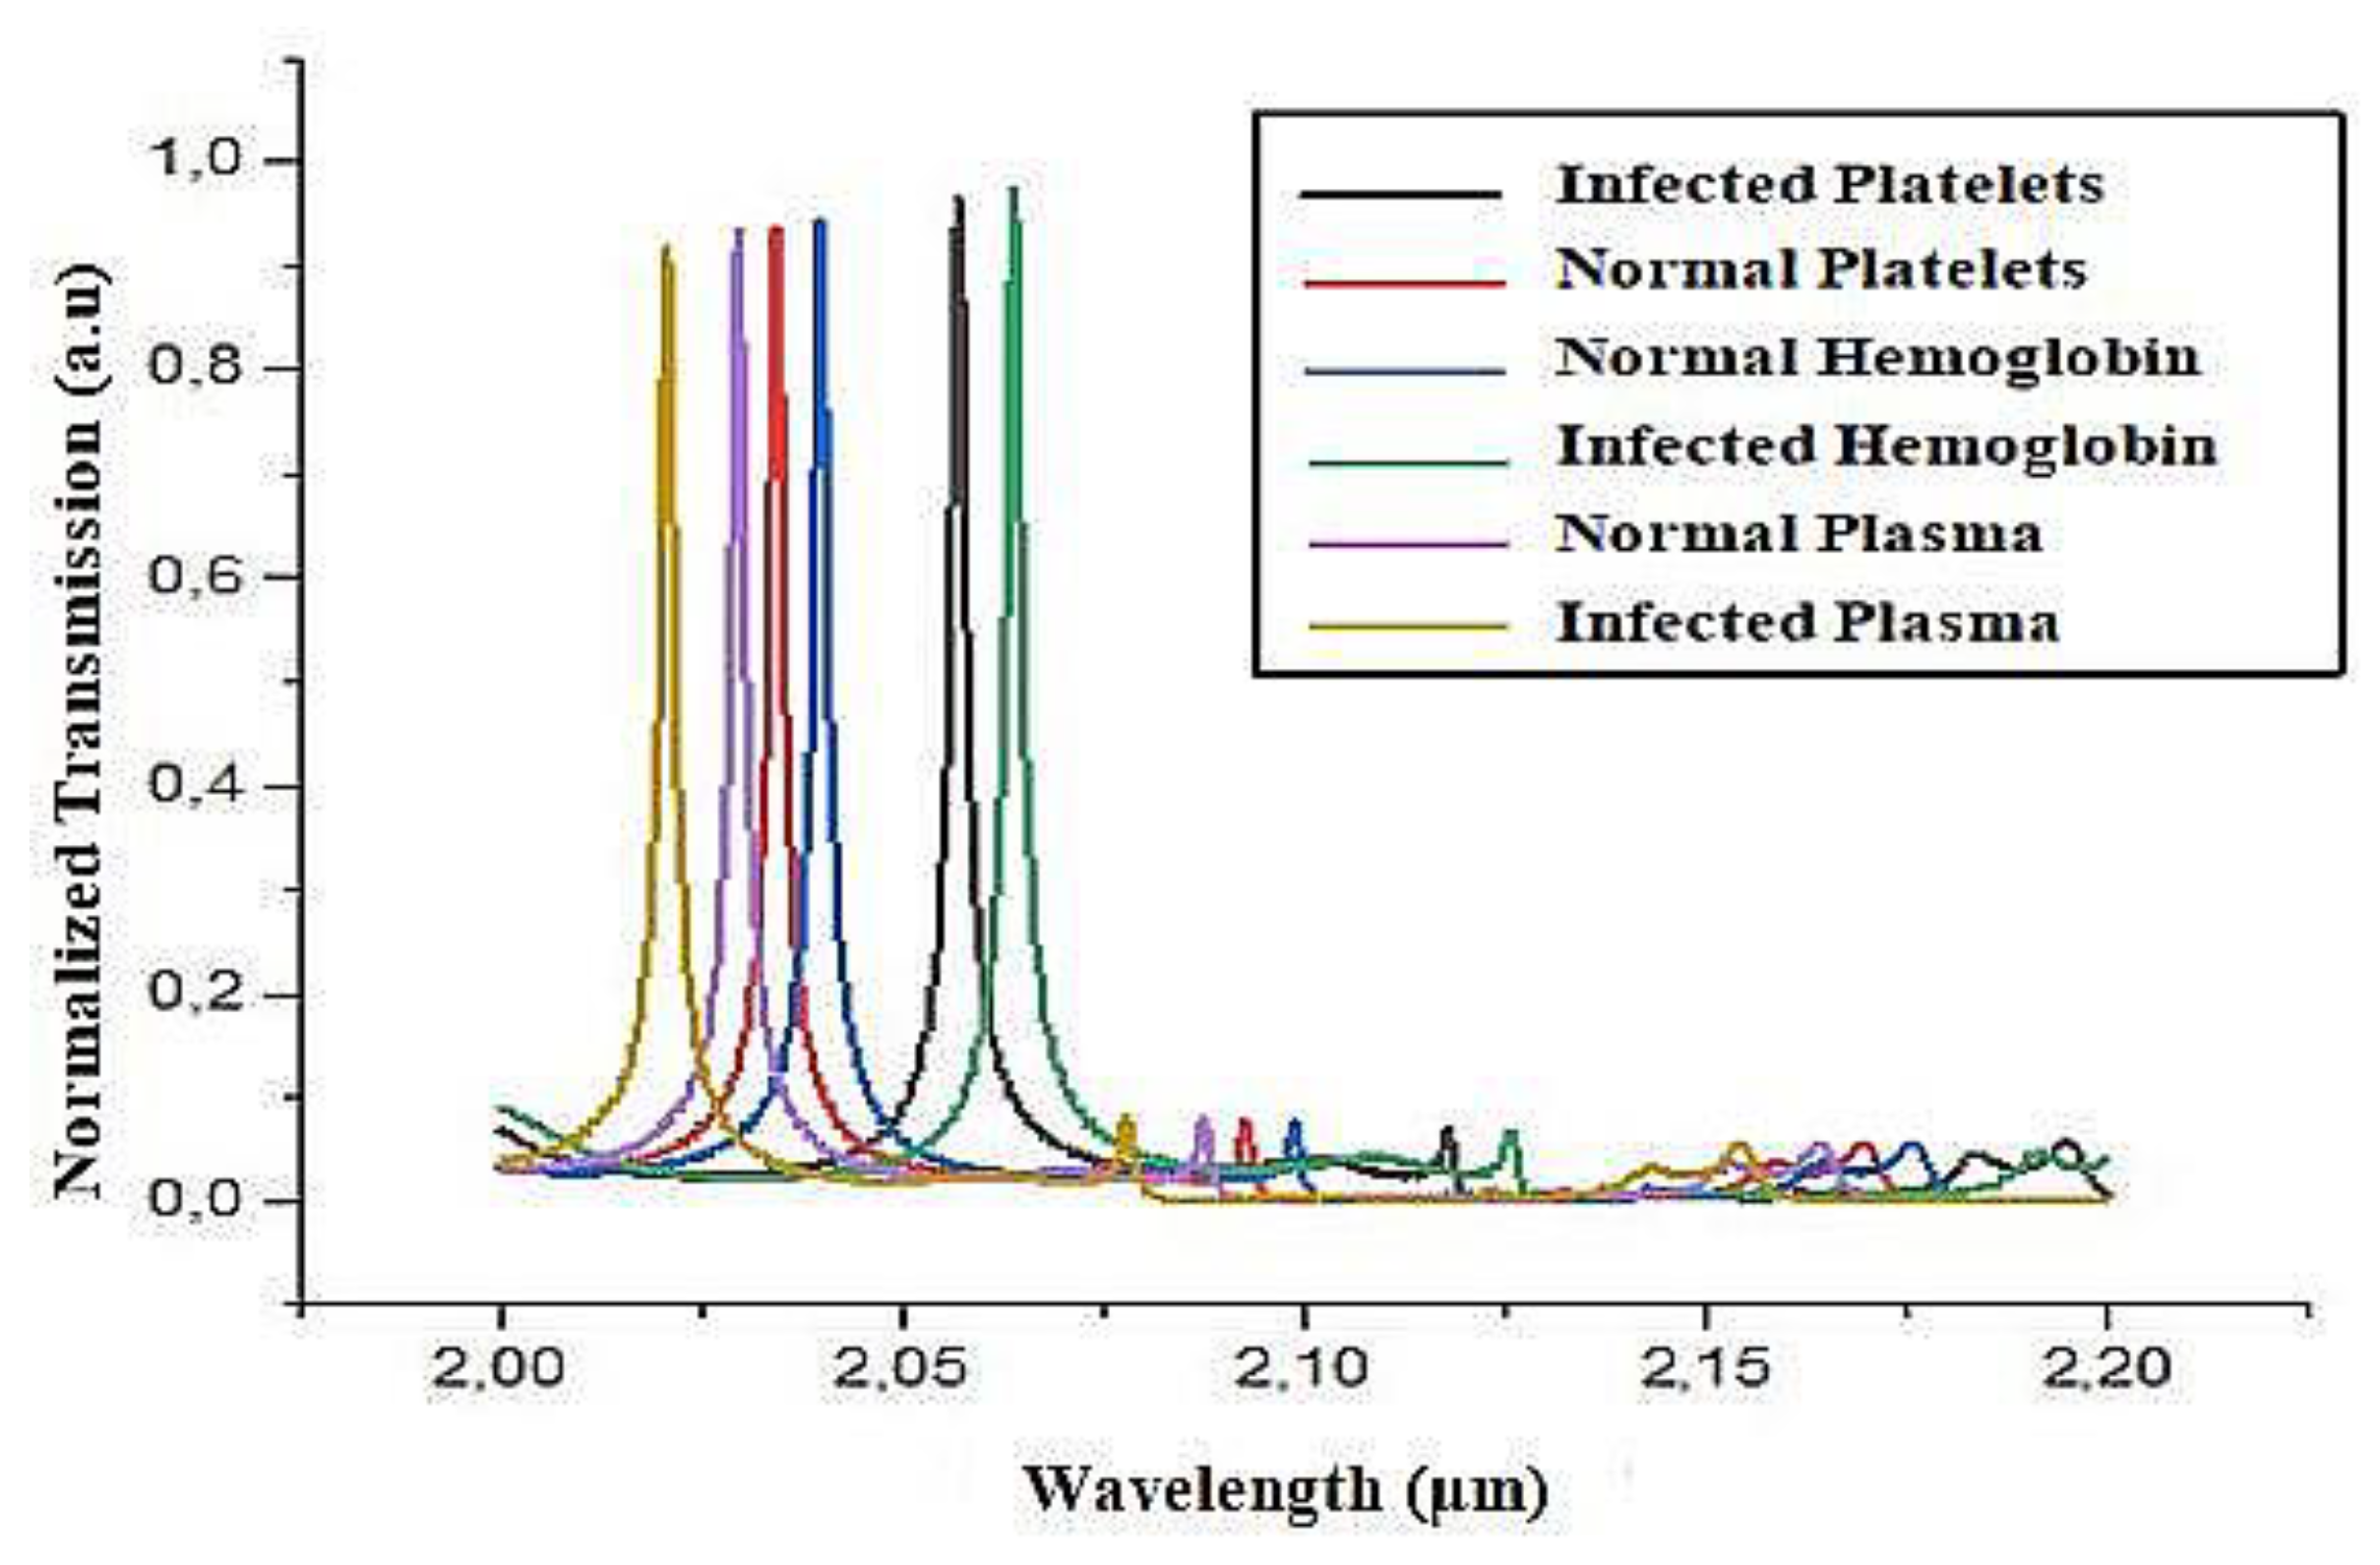
Figure 10.
Central wavelengths shift according to refractive index.
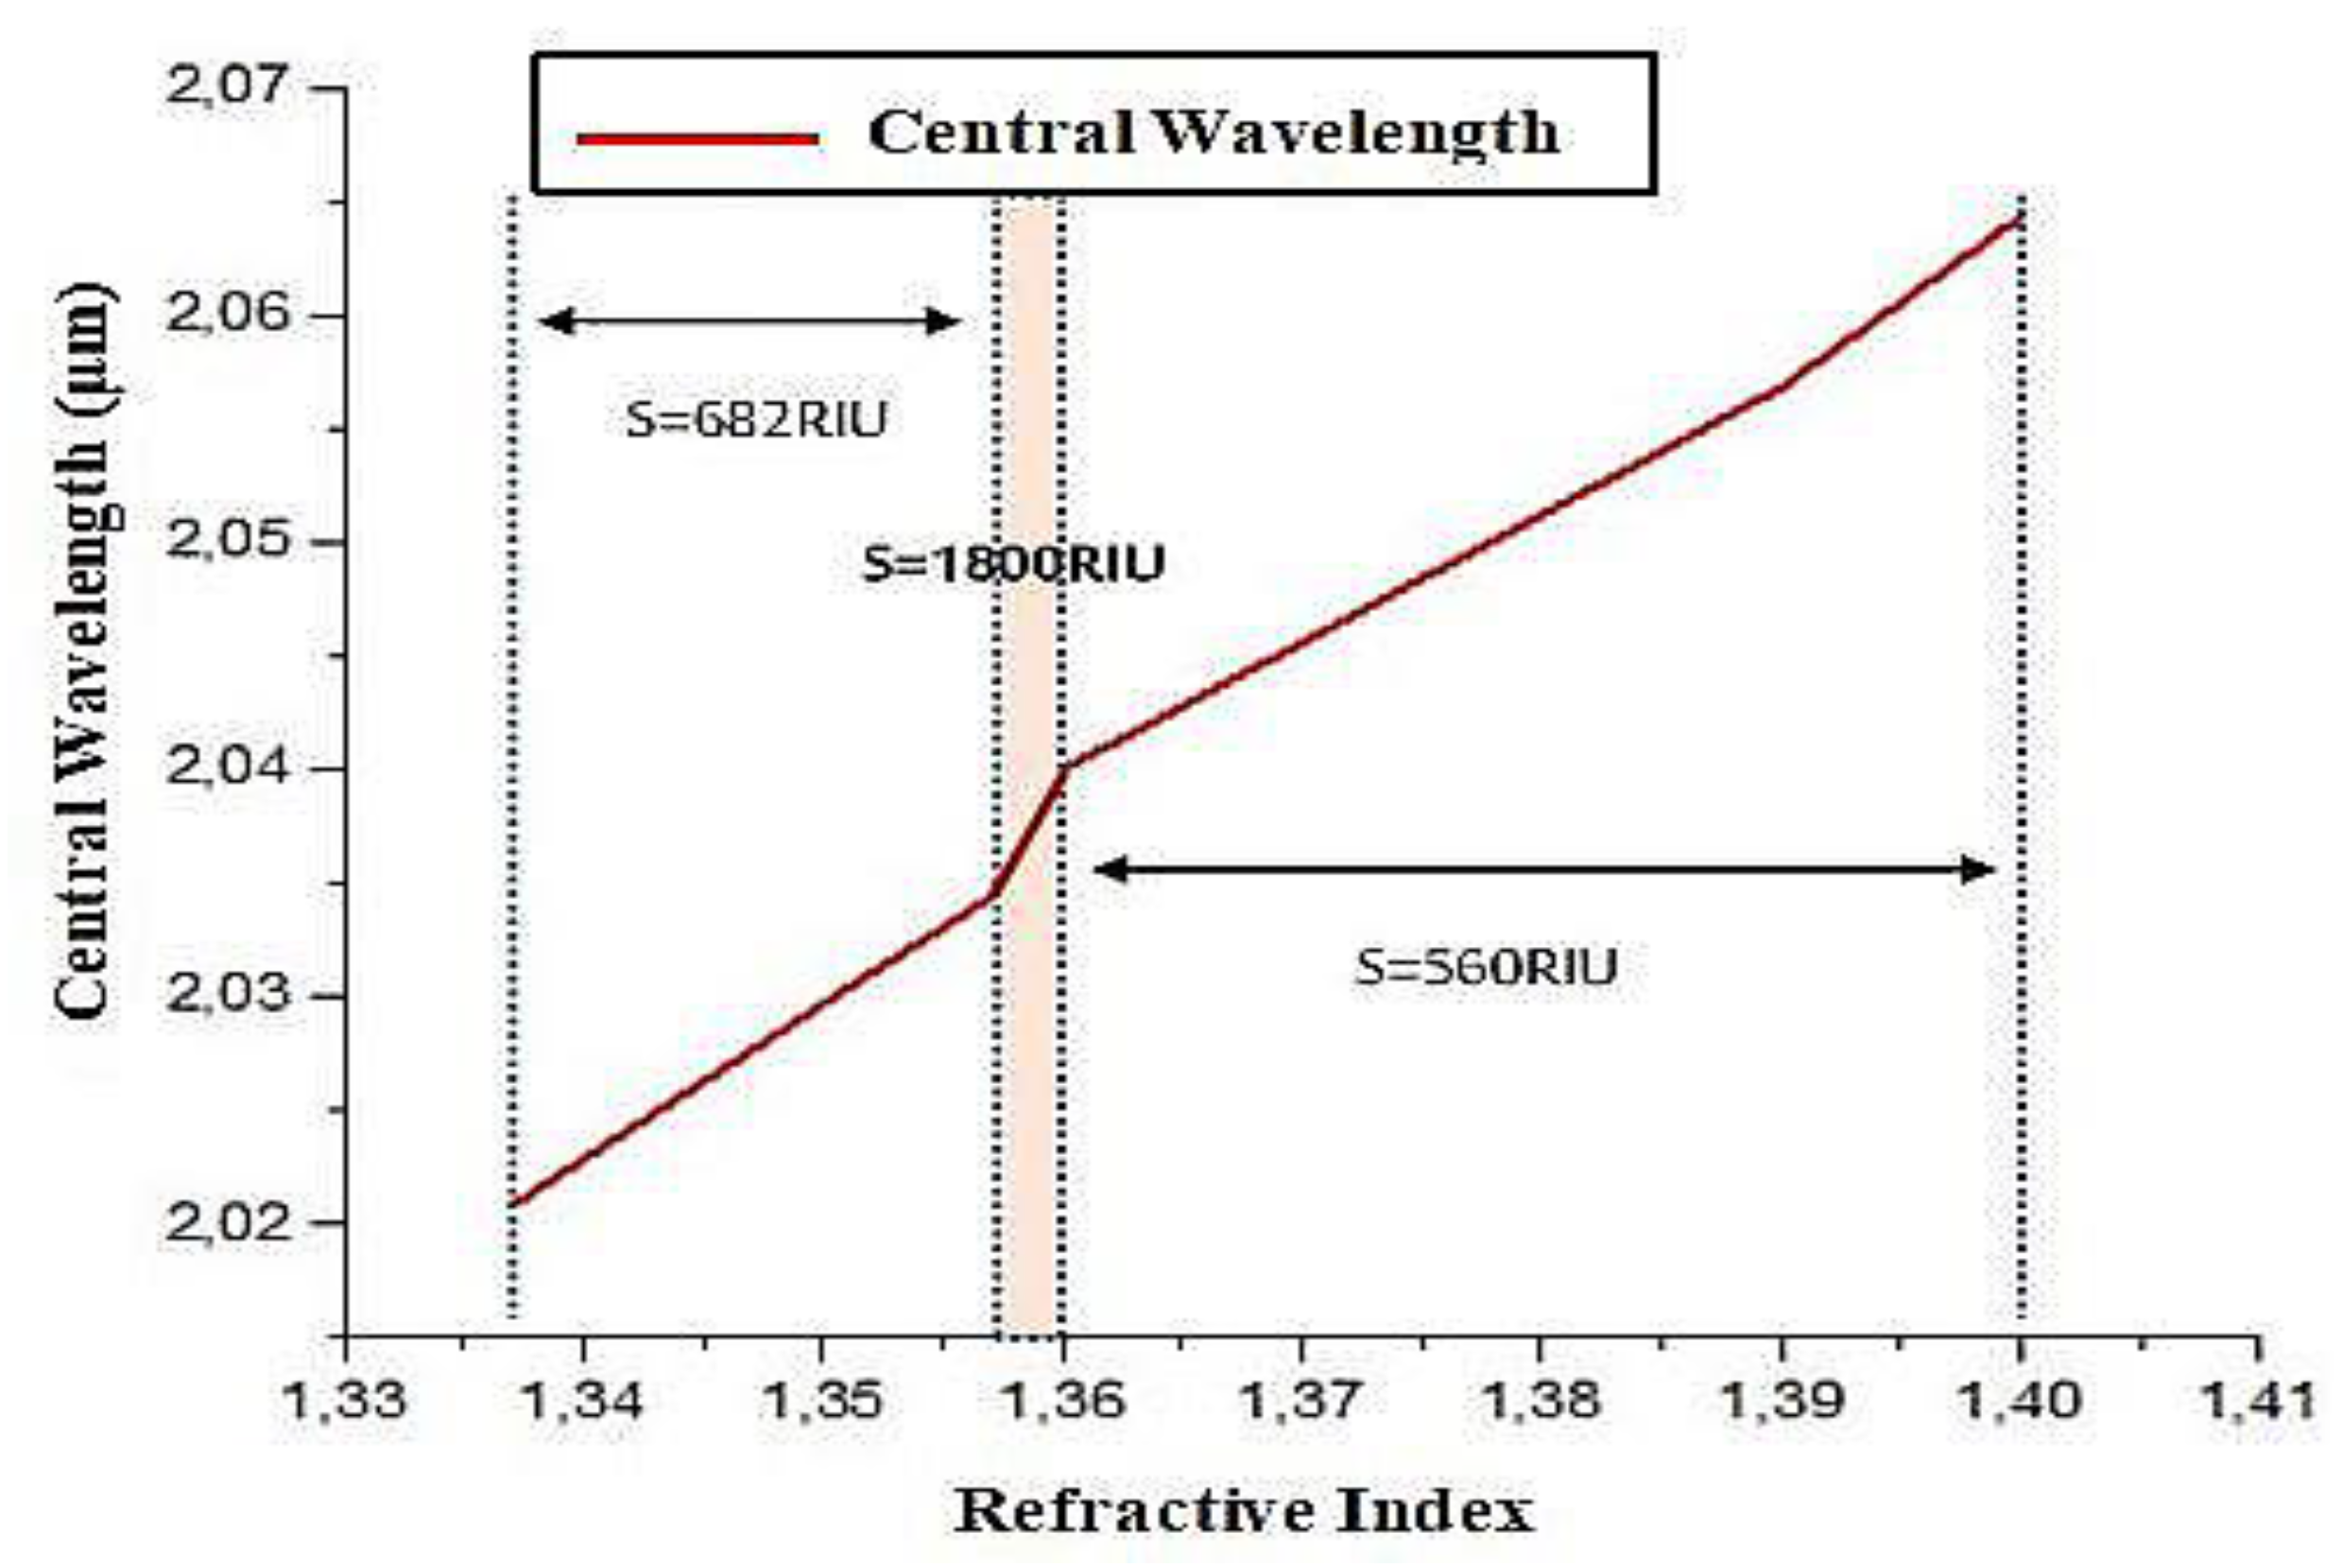
Figure 11.
Rrefractive index distribution.
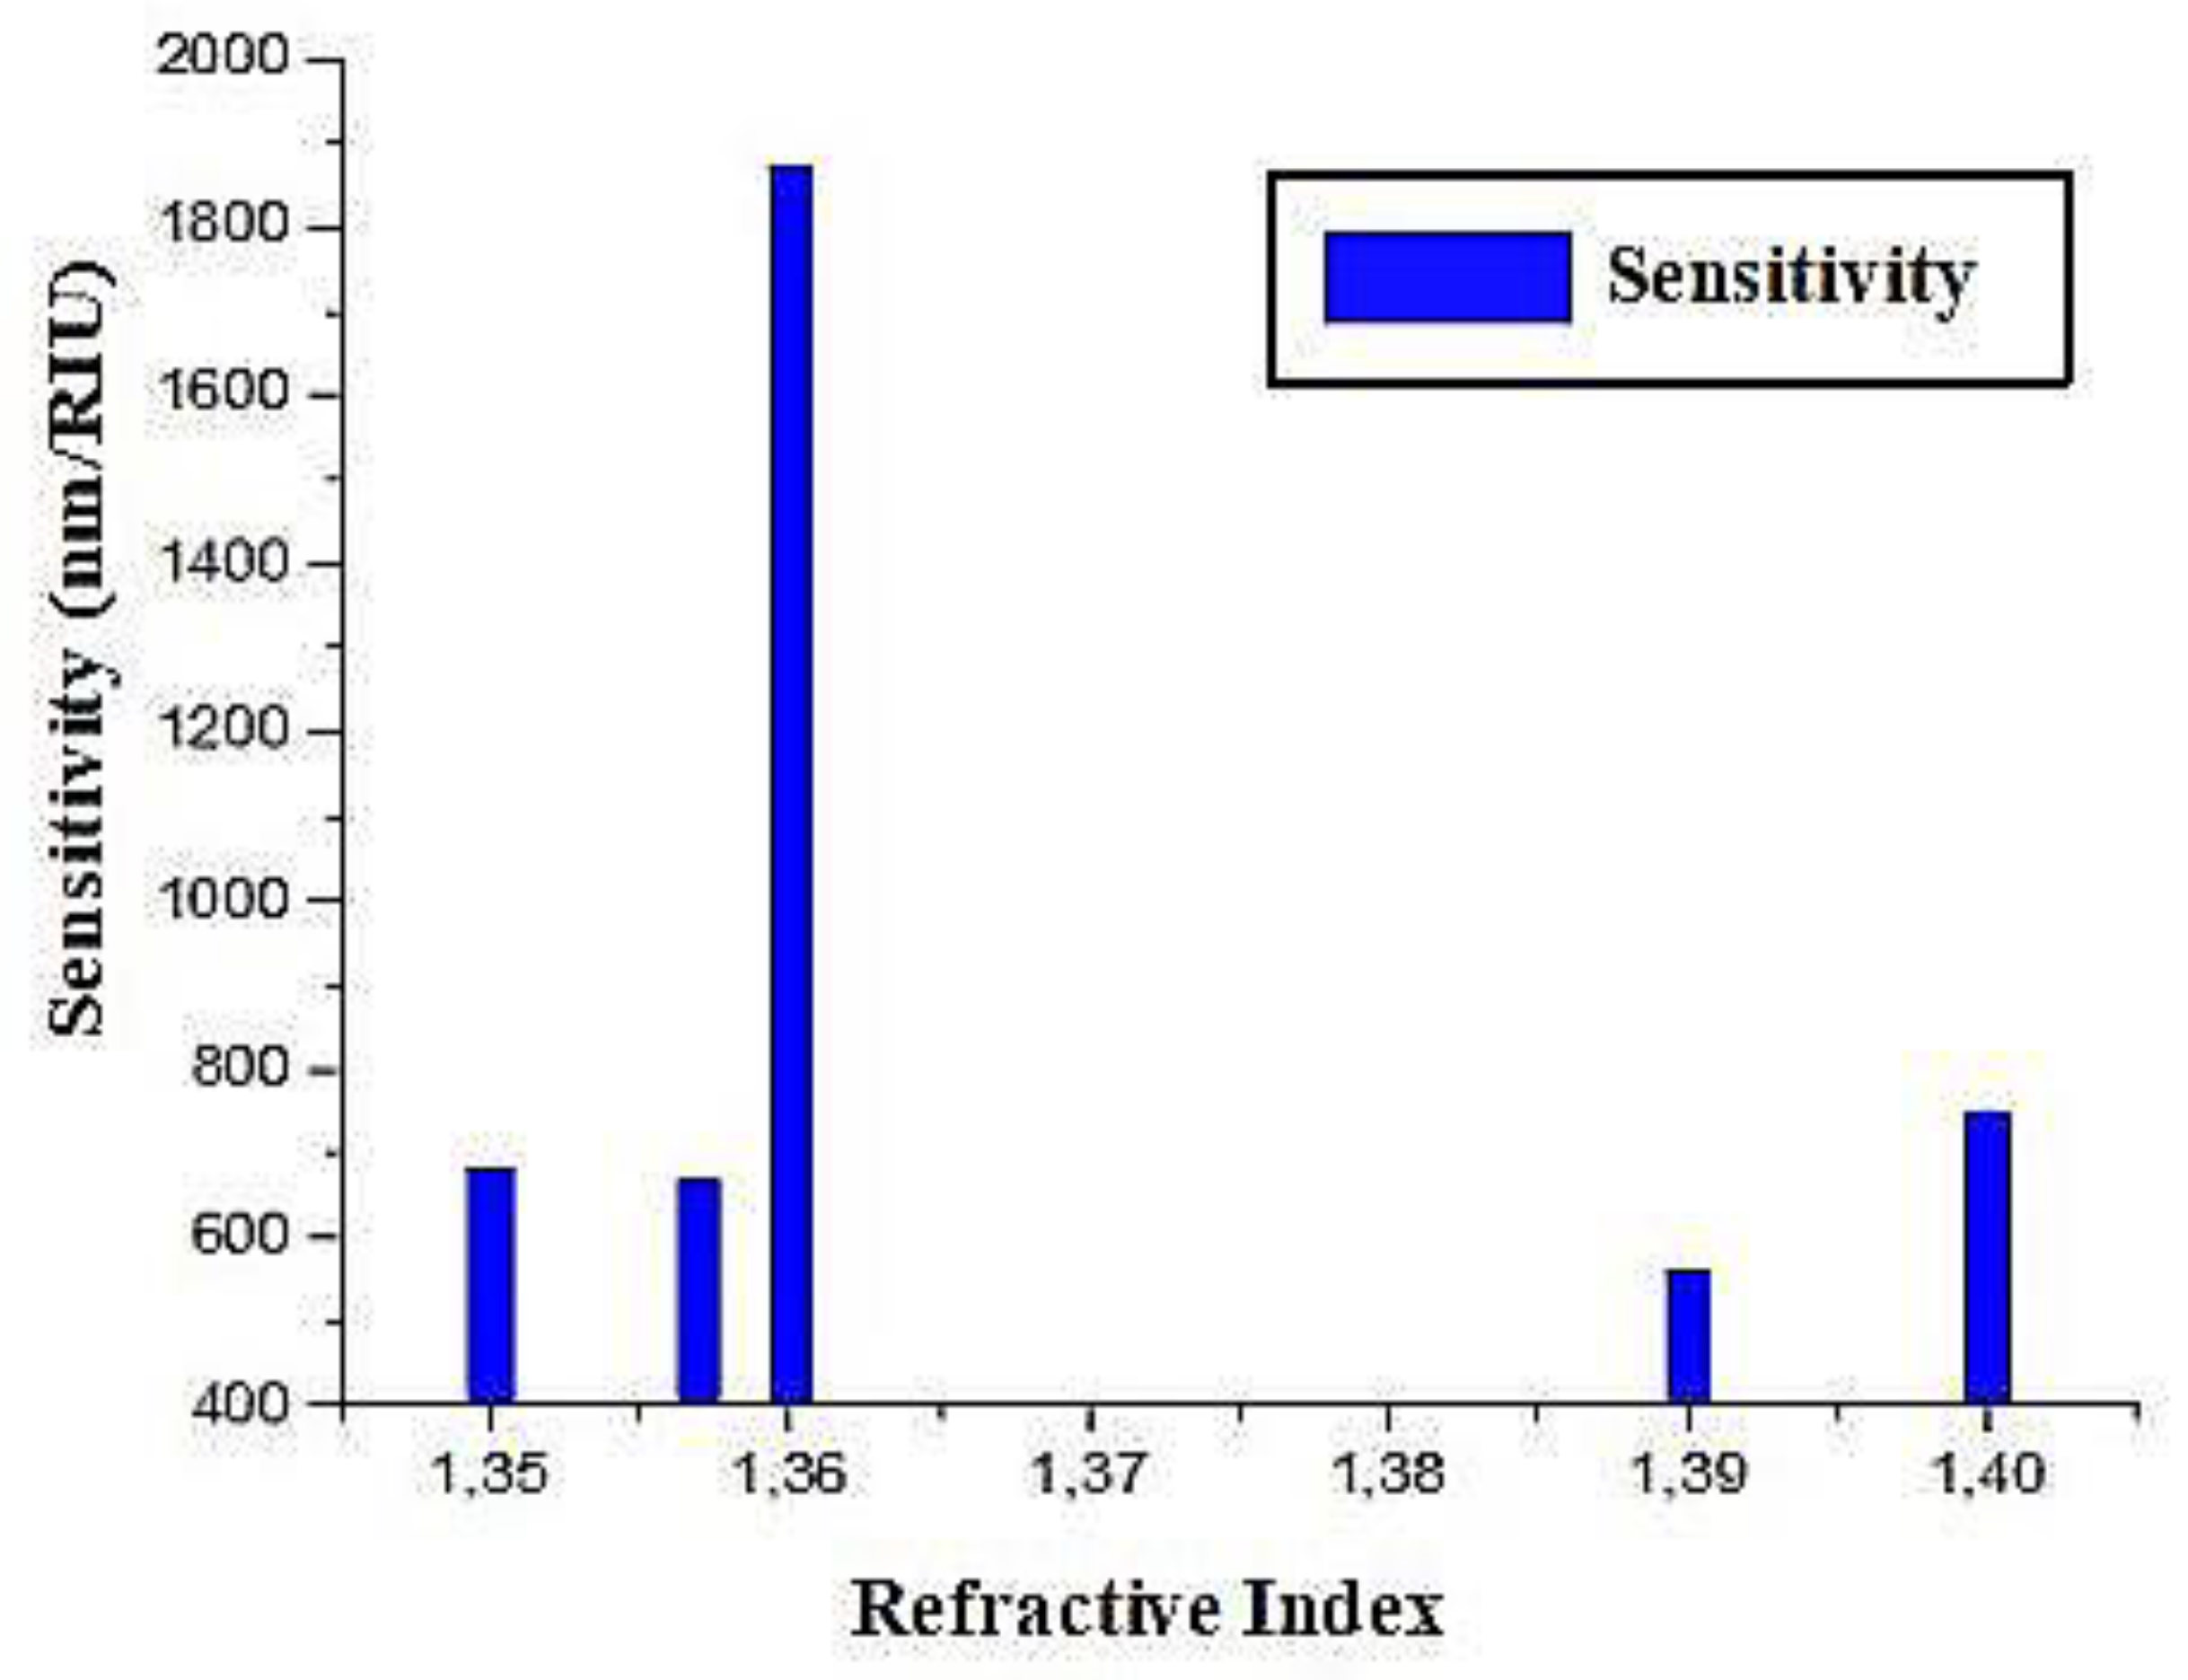
Figure 12.
Transmission spectrum of Coupled system.
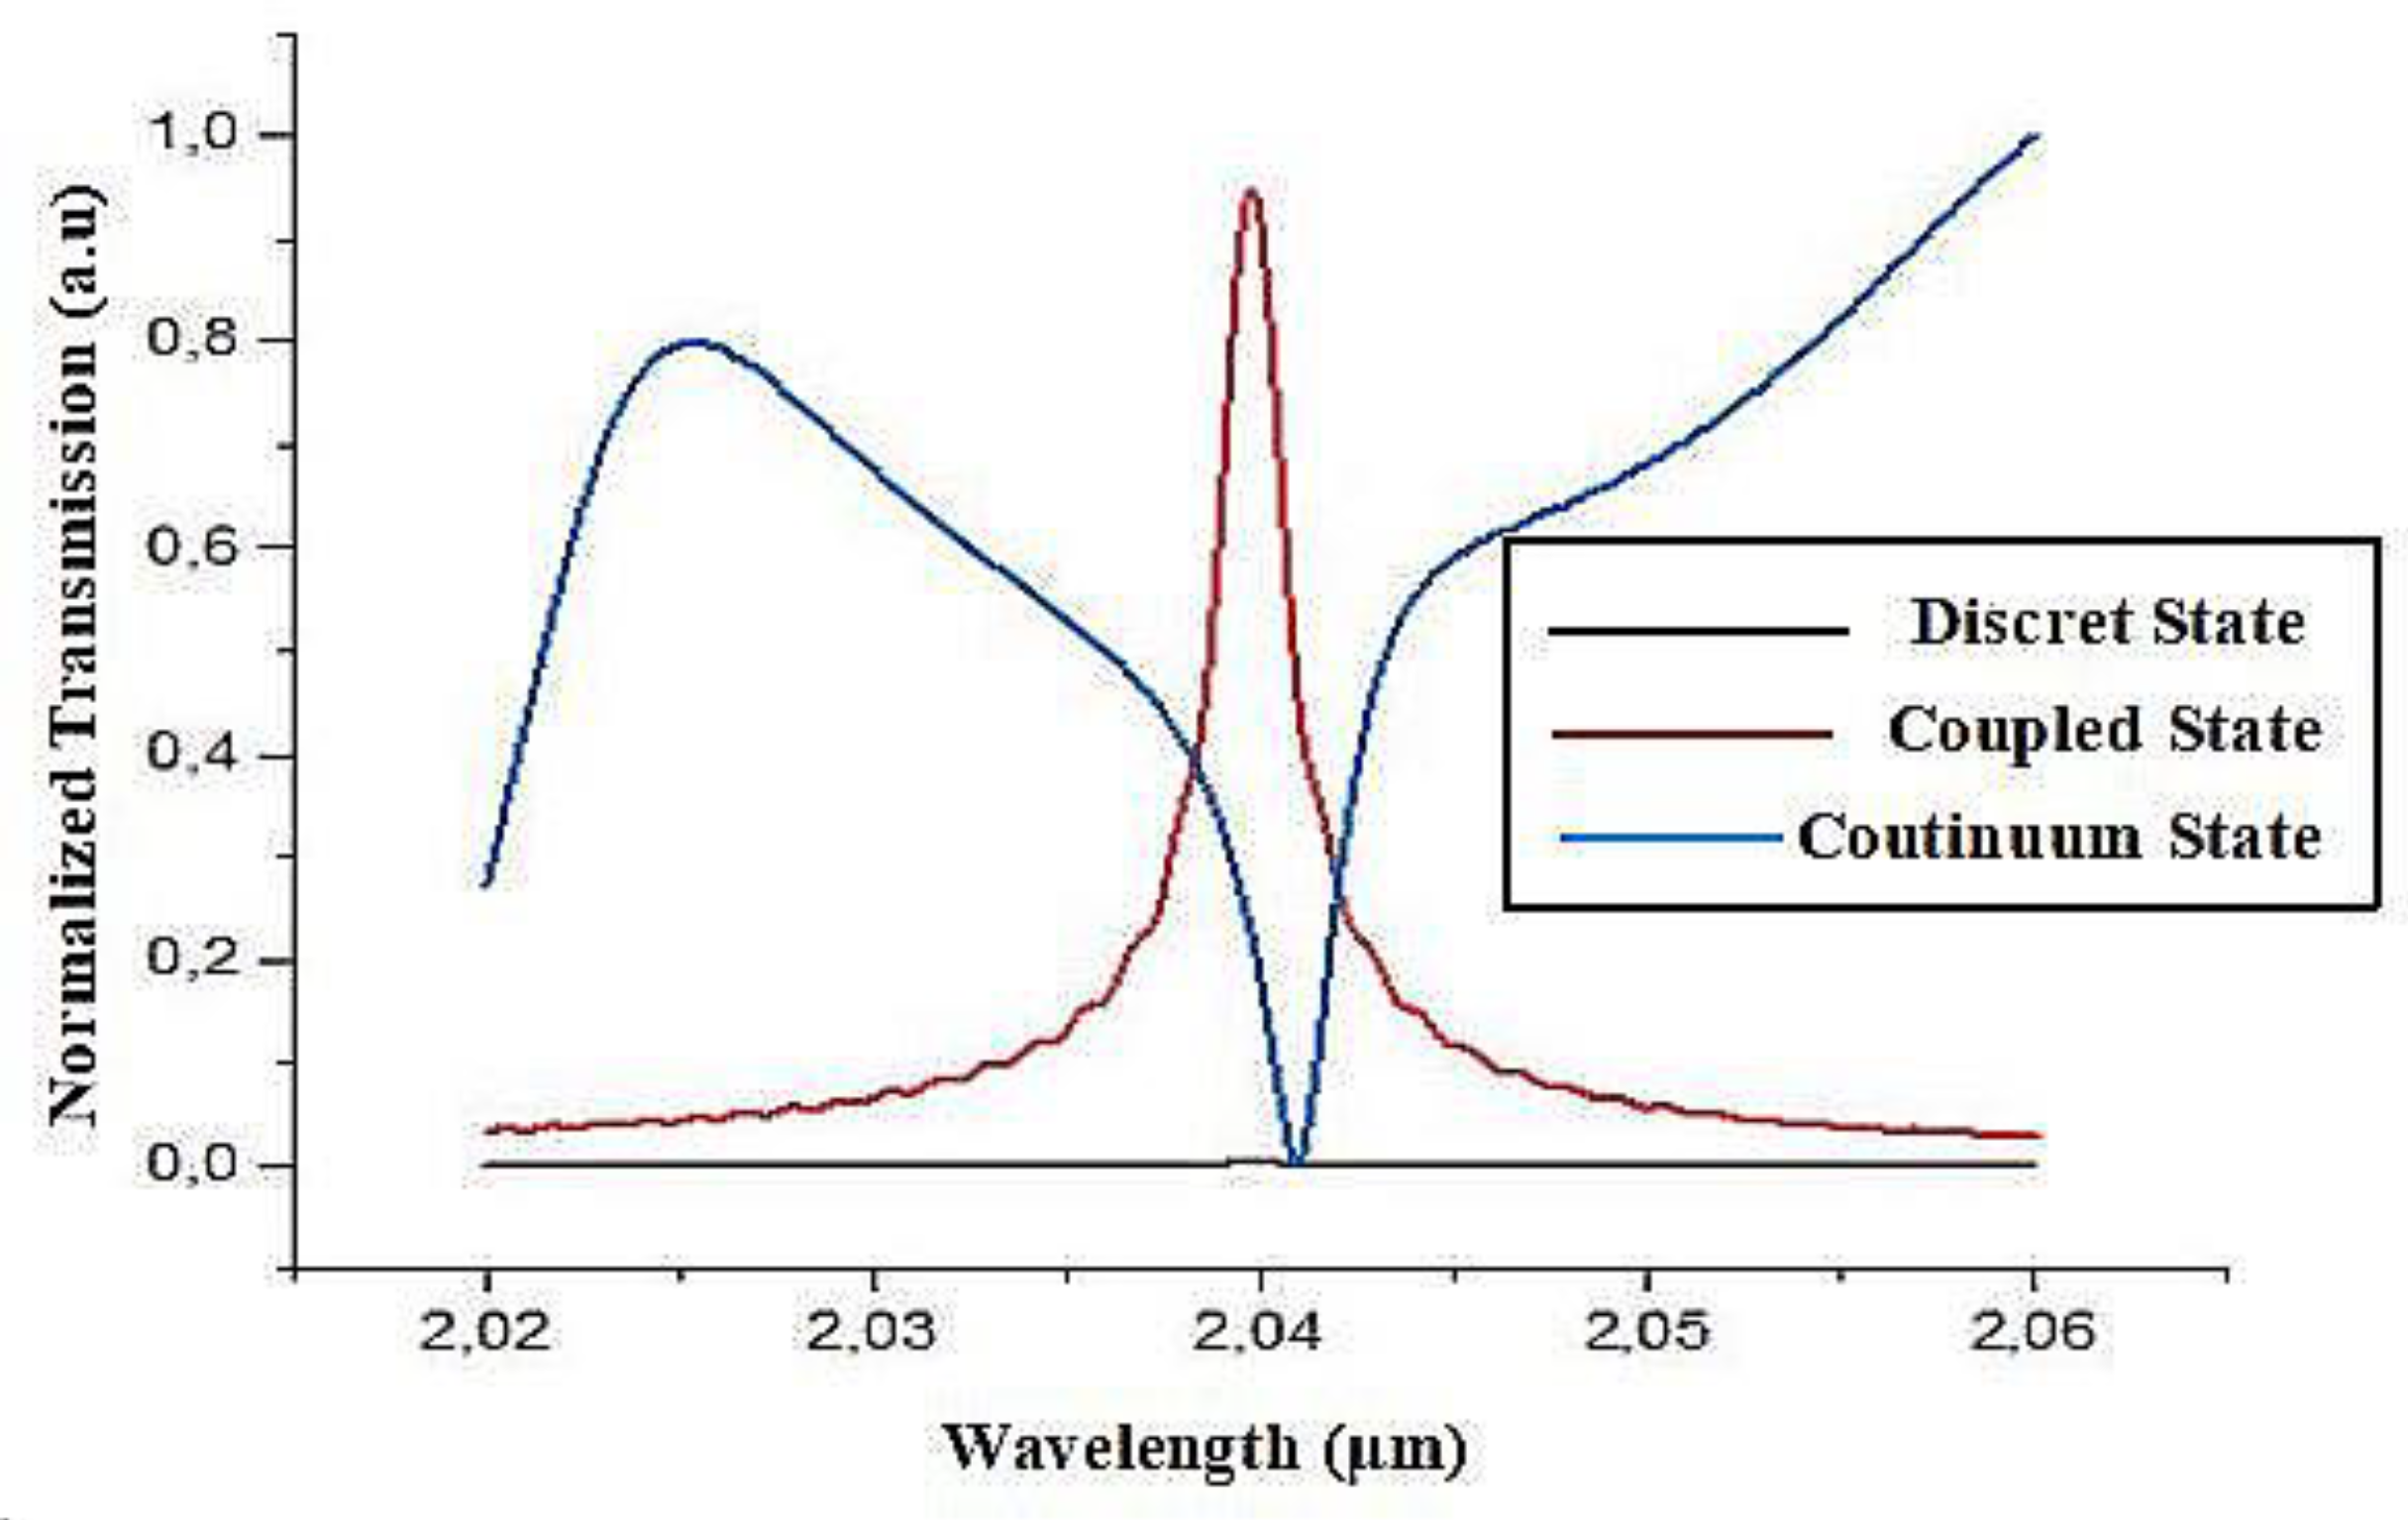

Table 1.
Sensitivity and Quality Factor according to the central wavelength and blood components refractive index are cited.
Table 1.
Sensitivity and Quality Factor according to the central wavelength and blood components refractive index are cited.
| Refractive Index Central Wavelength | Q | Sensitivity | |
|---|---|---|---|
| µ | mm/RIU | ||
| 1.337 | 2.02083 | 902.004 | |
| 1.35 | 2.0297 | 905.229 | 682.307 |
| 1.357 | 2.03437 | 943.309 | 667.142 |
| 1.36 | 2.03998 | 938.226 | 1870 |
| 1.39 | 2.05679 | 863.469 | 560.333 |
| 1.4 | 2.06427 | 866.369 | 748 |
Disclaimer/Publisher’s Note: The statements, opinions and data contained in all publications are solely those of the individual author(s) and contributor(s) and not of MDPI and/or the editor(s). MDPI and/or the editor(s) disclaim responsibility for any injury to people or property resulting from any ideas, methods, instructions or products referred to in the content. |
© 2025 by the authors. Licensee MDPI, Basel, Switzerland. This article is an open access article distributed under the terms and conditions of the Creative Commons Attribution (CC BY) license (http://creativecommons.org/licenses/by/4.0/).
Copyright: This open access article is published under a Creative Commons CC BY 4.0 license, which permit the free download, distribution, and reuse, provided that the author and preprint are cited in any reuse.


