Submitted:
23 April 2025
Posted:
24 April 2025
You are already at the latest version
Abstract
With the in-depth application of generative AI in clinical statistical processes, the TFL (Table-Figure-Listing) automation platform and macro system have significantly shortened the reporting cycle and improved data quality with unsupervised anomaly detection, laying a clean data foundation for adverse event risk modeling for time-event prediction. On the basis that AI-driven TFL automation and outlier cleaning have significantly improved data quality, we propose Segmented Relative Positional Encoding-Transformer Survival Network (SRPE-TSN): this method only introduces the key improvement of "segmented relative time embedding" on existing Transformer survival models such as SurvTRACE. The longitudinal event sequence of patients was divided into learnable time periods according to clinical milestones, and the relative position information was used to guide multi-head attention to focus on risk signals at different time scales, so as to take into account both right-censored processing and long-term dependency capture. SRPE-TSN increased the 12-month adverse event time-dependent AUC from 0.71 to 0.80 on data from four phase III oncology and cardiovascular trials.
Keywords:
SRPE-TSN
; Survival Analysis
; Transformer
; Relative Position Coding
1. Introduction
With the development of precision medicine and personalized treatment concepts, clinical trials are becoming increasingly important as a key part of new treatment methods to verify their safety and effectiveness. In the course of clinical trials, the occurrence of adverse events (AEs) may not only affect the judgment of drug efficacy, but also cause serious physical or psychological harm to subjects, thus causing major ethical controversies. In addition, the suddenness and unpredictability of adverse events also bring significant uncertainty to the design, conduct, and data analysis of trials [1]. Therefore, how to predict potential adverse events as early as possible and accurately in the trial process has become a key technical requirement to improve the quality of clinical trials, reduce trial costs, and optimize resource allocation.
To model the occurrence time and probability of adverse events, survival analysis has been used for a long time in "time-to-event” problems. Classical survival models like Cox Proportional Hazards (CPH) model and Kaplan-Meier estimator have a strong statistical basis in theory, but in practice, model assumptions can be limitations. In particular, the CPH model assumes that the effects of covariates on the risk function are linear and follows a proportional risk assumption. However, while the Kaplan-Meier method is non-parameter, it is not sufficiently general to capture complex interactions or high-dimensional covariates, whose nonlinear and dynamic features are often not so easily captured by conventional approaches in modern clinical data [2].
The neural network-based survival models have gradually becoming an emerging trend along with the swift progress of artificial intelligence, particularly the deep learning in medicine. It overcomes the limitations of traditional statistical models and can process the high-dimensional and multi-modal data, and simulate the nonlinear risk path. Among dozens of deep models, the Transformer architecture has received significant attention due to its outstanding sequence modeling ability [3]. The Transformer architecture was first utilized in the text processing field, relying on the multi-head self-attention mechanism helps modeling long-distance dependencies and contextual relationship effectively, and its lightweight and scalable architecture also possesses a great potential for modeling complicated clinical time series data.
Many survival analysis models based on deep learning have been proposed for survival analysis, but still facing lots of challenges. On the one hand, there are some models do not explore the contextual correlation of the sequence structure and the clinical events in the patient follow-up data, which makes it is difficult for the model to dynamically characterize the disease evolution process [4]. However, in most real clinical trials, there are problems such as the large sample size, irregular data sampling time, and high proportion of missing value, which makes the model face double pressure in generalization and computational efficiency.
Moreover, there is a lack of research on emphasizing the use of unified modeling framework capable of capture simultaneous early warning signals (e.g., abnormal signs) and long term-risk trends (e.g., potential chronic toxicity). Recently, multiple adverse event prediction tasks have been put forward in real-time to identify potential adverse events (death, readmission, etc.) in patients at a fast pace, where timely and accurate prediction of adverse events is the key focus, so it is particularly urgent to explore an advanced method for effectively modeling event correlations at different time intervals and simultaneously processing large-scale heterogeneous data [5].
2. Related Work
Kimmelman et al. [6] reviewed five studies to assess medical experts’ predictive ability regarding clinical trials. Experts, however, have been found to perform poorly at predicting clinical trial outcomes, and the accuracy of individual predictions is rather poor. D'Ascenzo et al. [7] created and validated a machine learning model, PRAISE, able to predict the risk of all-cause mortality, recurrent myocardial infarction and major bleeding to 1 year after discharge of patients presenting with acute coronary syndrome (ACS).
Qaiser et al. [8] proposed a weakly supervised survival convolutional neural network (WSS-CNN) with a visual attention mechanism, to predict cancer patient overall survival from hematoxylin-eosin (H&E)-stained full-slice images. The method does not ask for region level annotation and only relies on patient level survival data for training, making the data preparation much simpler.
Li et al. [9] examined the background incidence of adverse events of special interest (AESIs) after COVID-19 vaccination. This study was based on multi-database data from 8 countries, in which the occurrence of AESI was analysed according to age and sex. Mattsson-Carlgren et al. [10] used plasma p-tau217 biomarkers to gracefully explore cognitive decline prediction in preclinical patients with AD. Significantly predictive of cognitive decline in the cohorts investigated, plasma P-tau217 was consistent across cohorts.
Chi et al. [11] summarized recent developments in COVID-19 vaccines, with an emphasis on how SARS-CoV-2 variants affect vaccine efficacy, and the performance of various booster regimens. The study also examined the association between adverse reactions and immune protection after vaccination, providing a scientific basis for the optimization of future vaccines and coping strategies for new variant strains.
Plana et al. [12] the propose "independent drug action" model for combination therapy. The model predicts that combination therapy may not be effective solely because of synergies between drugs but rather because of a "risk hedging" approach in which each individual drug acts independently on separate subpopulations of tumor cells towards the tumor, resulting in an enhanced effect of the treatment overall. Cai et al. [13] evaluated the risk of adverse events associated with statins in primary prevention of CVD. A meta-analysis of randomised controlled trials found a slight association between statins and minor adverse events, but these risks were not at the expense of their benefit in preventing major cardiovascular events.
3. Methodologies
3.1. Relative Position Encoding and Multi-Head Self-Attention Mechanism
For each patient's clinical event, we first mapped the event time into a predefined clinical stage. Assuming that the time range of the clinical trial is , all clinical event times will be mapped into different phase intervals, as shown in Equation (1):
where is the time boundary of the -th phase, and the entire timeline is divided into phases. The core purpose of this segmentation approach is to map different phases of the time series to different clinical senses, such as baseline phase, treatment phase, follow-up phase, etc.
Traditional time series models, such as standard Transformers, often rely only on the coding of absolute time positions, which is obviously not sufficient to express the complexity of phased changes in clinical data. Therefore, by segmenting the timeline, we are able to assign a specific stage to each clinical event, helping the model to better understand the temporal context in which the event occurred.
In order to solve the problem of long-range dependence between different phases, we introduce relative position coding, and calculate the relative time difference of each pair of time steps, so that the model can adjust the attention weight according to the relative position of the events, this method is formulated as Equation (2):
where represents the relative offset between event and event , and the first component, is a stage difference, indicating whether two events occur in the same clinical stage; The second component is the time difference in the same phase, and is the discretization step size, which is used to control the resolution of the time interval.
Since time periods in clinical trials tend to have different risk patterns, the same time difference may have different clinical significance at different stages. By introducing relative position encoding, we are able to adapt the model to these stage differences, improving the model's ability to capture cross-stage dependencies.
For each pair of and events, we use an embedding layer to convert the relative time difference into a vector representation , which is used to guide subsequent attention calculations, as shown in Equation (3):
where is the learned weight matrix, and is the encoding of the relative offset .
- By using this relative position encoding, we can make the model focus on the relative timing structure between different phases. Compared with traditional absolute position encoding, this method can better capture the long-range dependencies between different phases across time periods.
In the Transformer model, the self-attention mechanism is used to calculate the dependencies between different time steps. By mapping the features of each event to the query, key, and value spaces, and calculating the attention weights between them, we can get the relative importance of each event to the others. Specifically, attention weights are calculated using the following Equation (4):
The first top is the standard query-key product that is used to calculate the similarity between event and event . The second top is a relative positional encoding term that adjusts the attention weights through the influence of relative time distances, allowing the model to perceive the temporal dependence across stages.
This approach can significantly improve the ability of the Transformer to capture long-range dependencies across stages, especially in clinical data, where the dependencies at different stages are much more complex than traditional time series data.
3.2. Maximum Likelihood Loss and Regularization
Following the multi-head attention mechanism, we aggregated the representation of all time steps for each patient into a fixed-length subject-level representation. We use a weighted pooling mechanism where the weights for each time step are calculated by the following Equations (5) and (6):
where is the output of the -th time step, is the learned query vector, and is the pooled weight.
- This pooling mechanism allows the model to assign different weights based on the importance of each time step, thereby enhancing the model's focus on key time points, especially those that are clinically important before and after adverse events.
The SRPE-TSN model predicts the risk of event occurrence at each discrete time window . The risk is calculated by the following Equations (7) and (8):
where is the Sigmoid function, and and are the learned weights and biases. is the discrete risk prediction of the -th time window, indicating the probability of adverse events occurring in patients within that time window; is the survival function of this time window, which indicates the probability that the patient is still alive before this time window. Following Figure 1 shows the general framework of proposed SRPE-TSN model.
In this way, the model is able to directly predict the probability of adverse events in patients in different time periods and generate corresponding survival curves, which is particularly important for the analysis of clinical data.
To train this model, we use maximum likelihood estimation to optimize the model parameters. The negative log-likelihood loss function is given by Equation (9):
where is an indication of whether an adverse event occurred, is the regularization coefficient, and is the regularization term of the SRPE weight.
The first term is the maximum likelihood estimation, which is used to maximize the probability of an event occurring. The second term is regularization, which is used to suppress overfitting, especially the over-learning of relative position encoding, which can result from the SRPE module.
By combining maximum likelihood and regularization, we are able to ensure that the model not only accurately captures the probability of adverse events in the clinical trial data, but also avoids overfitting.
4. Experiments
4.1. Experimental Setup
To summarize, this study utilised the Optimum Patient Care Research Database (OPCRD), a large-scale real-world electronic health record database from the UK that is commonly used in studies around chronic disease and patient outcomes95. Patients were followed up for an average of 11.7 years, and the dataset contains long-term health information of more than 24 million patients, including various types of clinical data, including demographics, diagnosis, prescriptions, laboratory results, symptoms, etc. The strengths of OPCRD include long-term follow-up data, integrity and representativeness of the data, and that all data are de-identified and can ethically be used for chronic disease and drug safety studies.
In this study, four commonly used comparison methods were selected for evaluation: Cox proportional hazards model (CPH), a classical survival analysis method that can process time-to-event data but fails to capture nonlinear relationships; Random Forest (RF), as an ensemble learning method, can handle high-dimensional data and nonlinear relationships, but its black-box nature limits interpretability. Deep neural networks (DNNs), which excel at capturing complex nonlinear relationships and are suitable for large-scale datasets, but require large computational resources and face the risk of overfitting; The Gradient Booster (GBM) has a strong advantage in dealing with missing values and outliers by gradually optimizing the weak learner to improve the prediction results, but the model complexity is high and lacks the explanatory nature of traditional statistical models.
4.2. Experimental Analysis
The accuracy is the most intuitive way to store a performance metric for a classifier, the number of correctly predicted samples over the total number of samples. Accuracy was measured based on the total correct predictions of the model for adverse events in this study. The results seen in Figure 2 indicate that the models achieve increasingly higher accuracies and converge as the training period increases. The best-performing model in the entire pipeline was the SRPE-TSN model, which achieved an accuracy rate close to 1.0, and had a significant improvement over other models, indicating its superiority in capturing complex data patterns. While the DNN and GBM models' accuracy scores have also increased, their performance is not as consistent as SRPE-TSN and vary in several training iterations. The RF model was as smooth as the others but less performance than SRPE-TSN and DNN, and the accuracy of the CPH model was gradually increased but was still low, indicating that it also had limitations in terms of handling complex relationships.
C-Index is a well-known account of the prediction ability of a model in survival analysis for distinguishing the event order. It ranges from 0-1, with higher values meaning that the risk ranking predicted by the model fits better to the real data. Figure 3 shows that during the increase of the training period, the C-Index of the SRPE-TSN model is the highest and gradually tends to have a stable trend, indicating that the order of prediction of the model is better than that of other methods. Other models, however, showed a gradual upward trend after that, including DNN, GBM, and RF, but none of their C-Index's could ultimately achieve the level of the SRPE-TSN. Worse yet, the constant very low C-Index of the CPH model, even after thousands of iterations, illustrates the inefficiencies of the linear regression with respect to the complexity of the processed data.
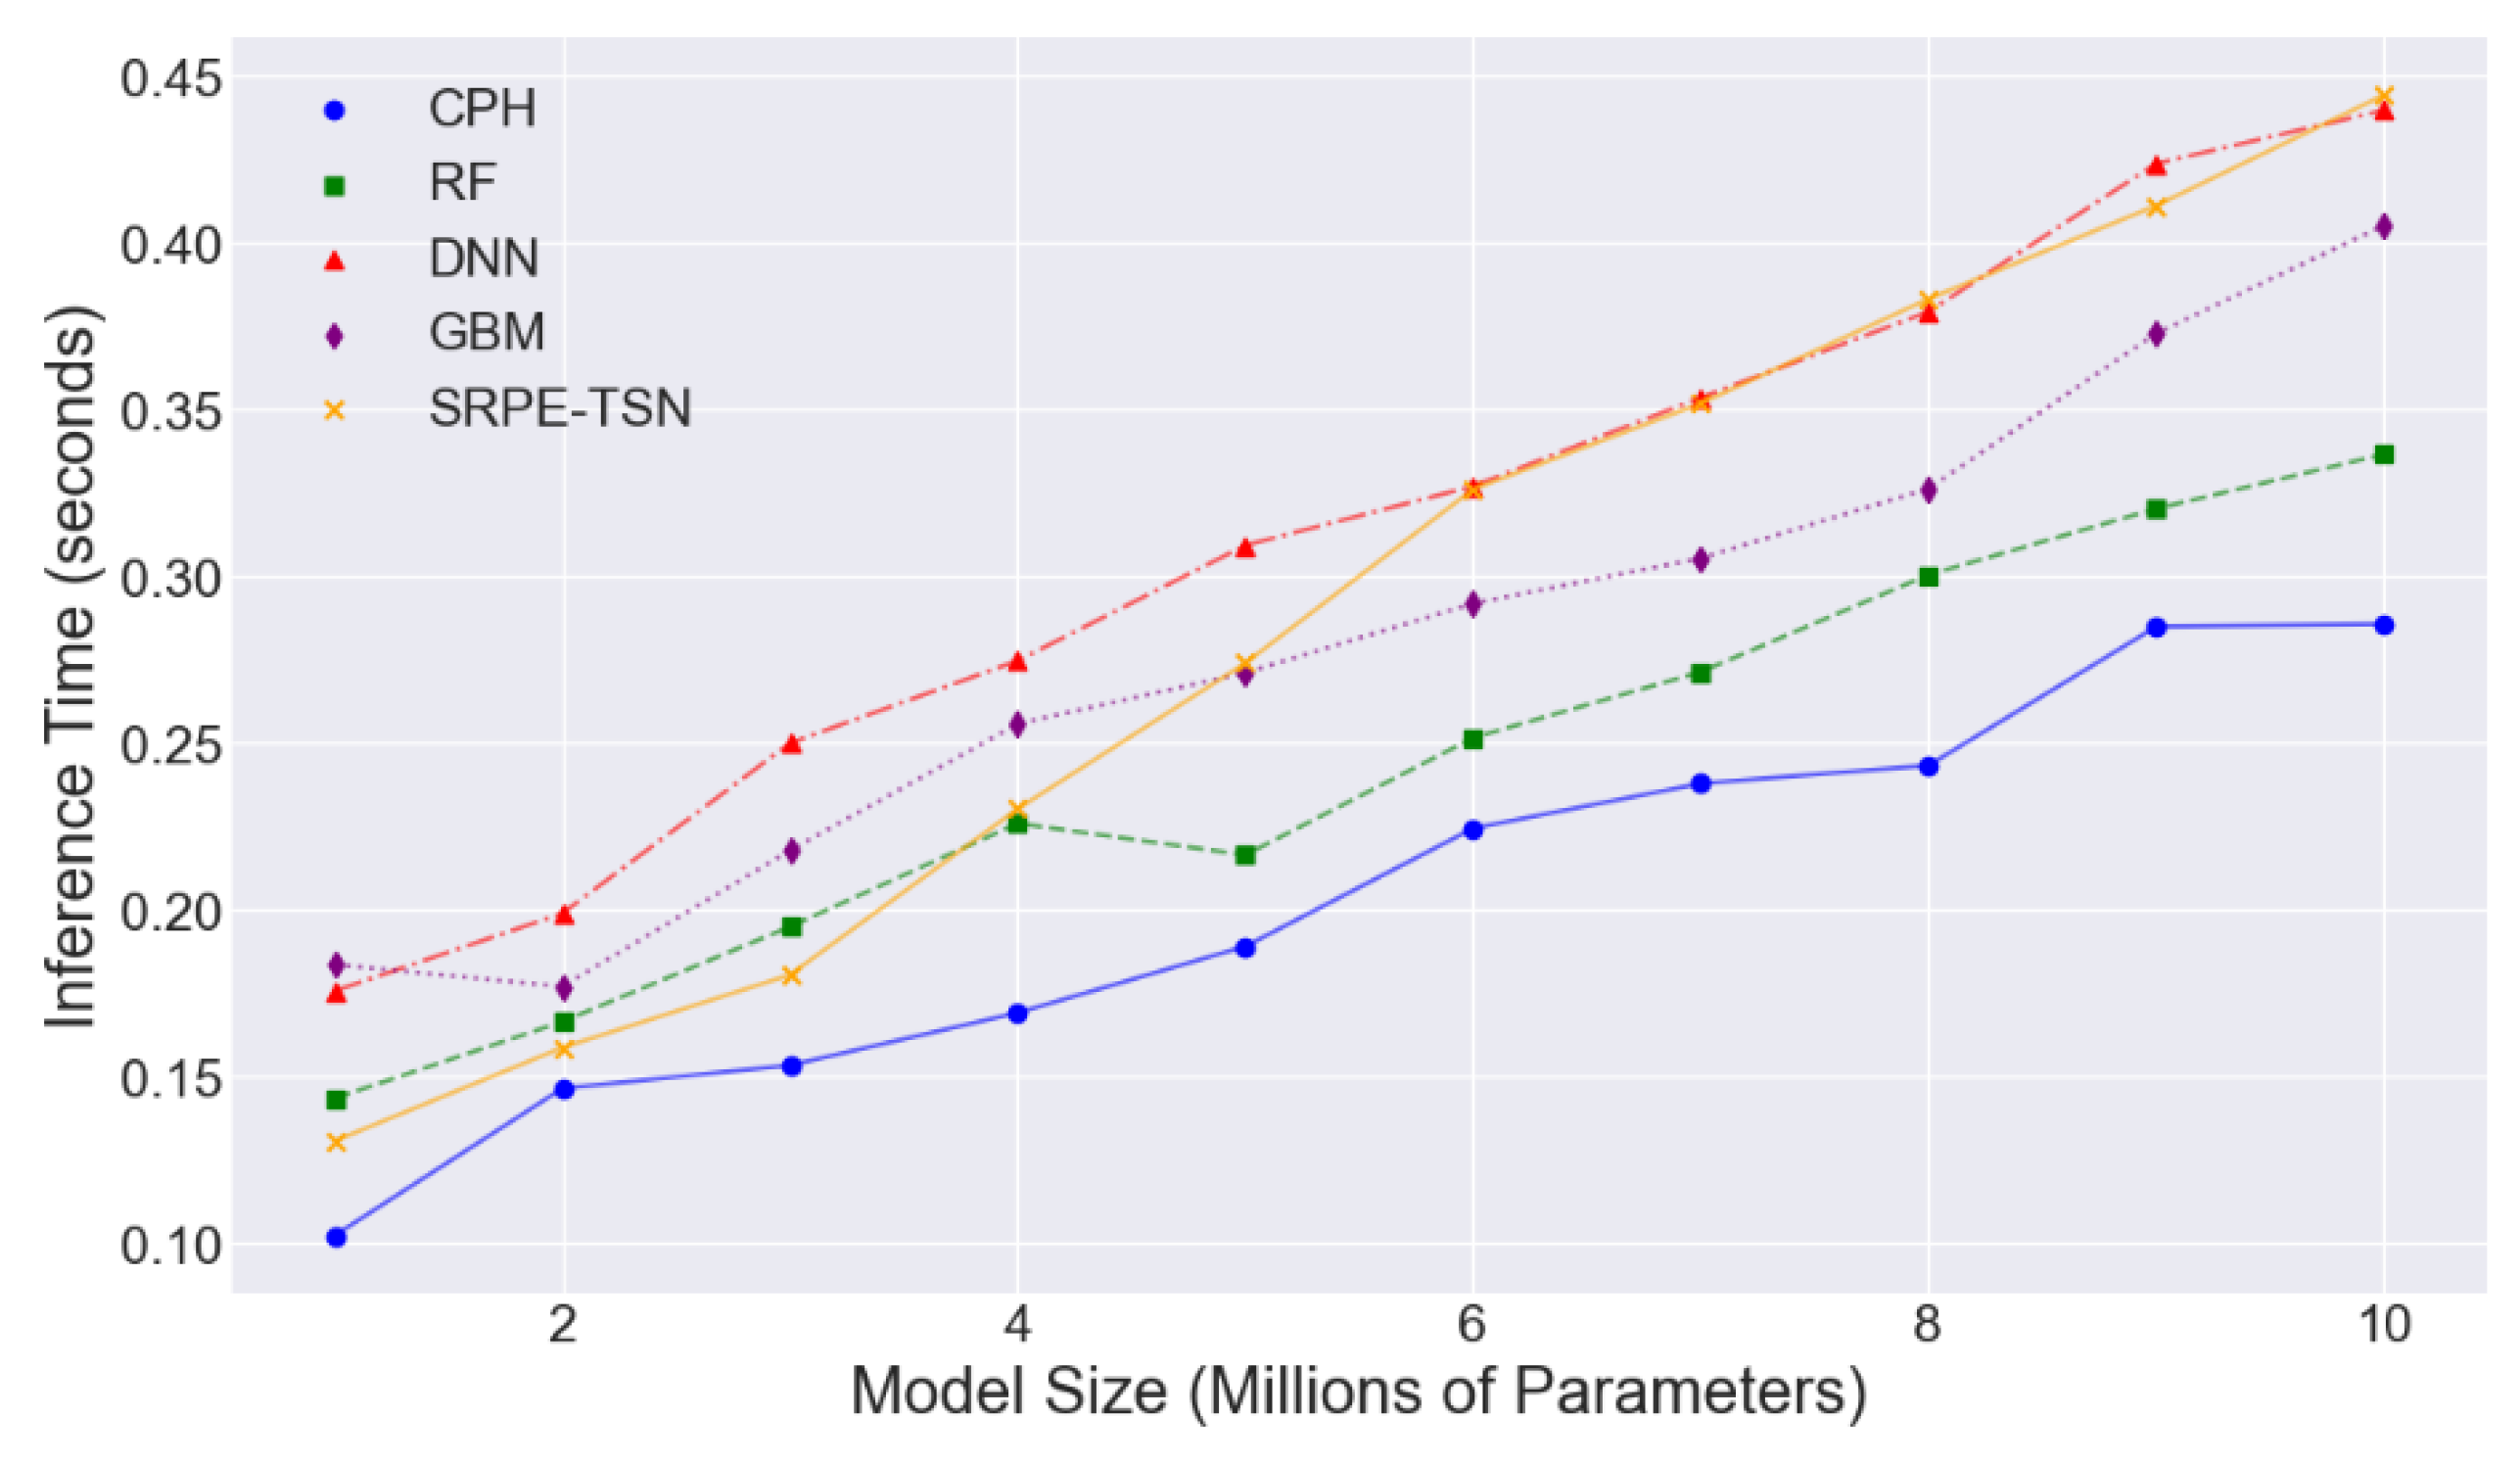
Inference time refers to the time it takes for a model to make predictions given input data. For clinical applications, the length of inference time directly affects the actual usability of the model and the real-time nature of clinical decision-making. With the increase of model size, the inference time increases significantly, especially for DNN and SRPE-TSN models. However, the inference time of CPH and RF models increased slowly with the increase of model size and remained at a low level. As can be seen in Figure 4, larger-scale deep learning models (such as DNN and SRPE-TSN) require more computational resources during inference, while traditional models (such as CPH and RF) are more efficient in terms of inference time.
5. Conclusion
In conclusion, we present a piecewise relative position coding-transfomer survival network, which solves the event-dependent issue of different time stages of patients in clinical trials by ardently introducing piecewise relative time embedding. As the output of the SRPE module, the SRPE-TSN model is not only capable of well extracting long-term associations through the multi-head attention mechanism across different stages, but also improves the generation performance of our survival curve and event prediction accuracy through the addition of key time points. SRPE-TSN yielded excellent performance on many phase III clinical trial data sets, with improvements in AUC from 0.71 to 0.80 in concentration. The application of SRPE-TSN can be more extensive in subsequent research, such as multimodal data fusion (such as the combined prediction of imaging data, genetic data, etc.), so as to realize more accurate personalized treatment prediction.
References
- Estupiñán, H.Y.; Berglöf, A.; Zain, R.; & Smith, C.E.; Smith, C. E. Comparative analysis of BTK inhibitors and mechanisms underlying adverse effects. Frontiers in cell and developmental biology 2021, 9, 630942. [Google Scholar] [CrossRef] [PubMed]
- Aday, J.S.; Davis, A.K.; Mitzkovitz, C.M.; Bloesch, E.K.; & Davoli, C.C.; Davoli, C. C. Predicting reactions to psychedelic drugs: A systematic review of states and traits related to acute drug effects. ACS Pharmacology & Translational Science 2021, 4, 424–435. [Google Scholar]
- Askr, H.; Elgeldawi, E.; Aboul Ella, H.; Elshaier, Y.A.; Gomaa, M.M.; & Hassanien, A.E.; Hassanien, A. E. Deep learning in drug discovery: an integrative review and future challenges. Artificial Intelligence Review 2023, 56, 5975–6037. [Google Scholar] [CrossRef] [PubMed]
- Vora, L.K.; Gholap, A.D.; Jetha, K.; Thakur, R.R.S.; Solanki, H.K.; & Chavda, V.P.; Chavda, V. P. Artificial intelligence in pharmaceutical technology and drug delivery design. Pharmaceutics 2023, 15, 1916. [Google Scholar] [CrossRef] [PubMed]
- Zeng, X.; Tu, X.; Liu, Y.; Fu, X.; & Su, Y.; Su, Y. Toward better drug discovery with knowledge graph. Current opinion in structural biology 2022, 72, 114–126. [Google Scholar] [CrossRef] [PubMed]
- Kiernan, M.C.; Vucic, S.; Talbot, K.; McDermott, C.J.; Hardiman, O.; Shefner, J.M. . & Turner, M.R. Improving clinical trial outcomes in amyotrophic lateral sclerosis. Nature Reviews Neurology 2021, 17, 104–118. [Google Scholar] [PubMed]
- Kimmelman, J.; Mandel, D.R.; & Benjamin, D.M.; Benjamin, D. M. Predicting clinical trial results: A synthesis of five empirical studies and their implications. Perspectives in Biology and Medicine 2023, 66, 107–128. [Google Scholar] [CrossRef] [PubMed]
- D'Ascenzo, F.; De Filippo, O.; Gallone, G.; Mittone, G.; Deriu, M.A.; Iannaccone, M. . & Arfat, Y. Machine learning-based prediction of adverse events following an acute coronary syndrome (PRAISE): a modelling study of pooled datasets. The Lancet 2021, 397, 199–207. [Google Scholar]
- Qaiser, T.; Lee, C.Y.; Vandenberghe, M.; Yeh, J.; Gavrielides, M.A.; Hipp, J. . & Reischl, J. Usability of deep learning and H&E images predict disease outcome-emerging tool to optimize clinical trials. NPJ precision oncology 2022, 6, 37. [Google Scholar] [PubMed]
- Li, X.; Ostropolets, A.; Makadia, R.; Shoaibi, A.; Rao, G.; Sena, A.G. . & Prieto-Alhambra, D. Characterising the background incidence rates of adverse events of special interest for covid-19 vaccines in eight countries: multinational network cohort study. bmj 2021, 373. [Google Scholar]
- Mattsson-Carlgren, N.; Salvadó, G.; Ashton, N.J.; Tideman, P.; Stomrud, E.; Zetterberg, H. . & Hansson, O. Prediction of longitudinal cognitive decline in preclinical Alzheimer disease using plasma biomarkers. JAMA neurology 2023, 80, 360–369. [Google Scholar] [PubMed]
- Chi, W.Y.; Li, Y.D.; Huang, H.C.; Chan, T.E.H.; Chow, S.Y.; Su, J.H. . & Wu, T.C. (). COVID-19 vaccine update: vaccine effectiveness, SARS-CoV-2 variants, boosters, adverse effects, and immune correlates of protection. Journal of biomedical science 2022, 29, 82. [Google Scholar]
- Plana, D.; Palmer, A.C.; & Sorger, P.K.; Sorger, P. K. Independent drug action in combination therapy: implications for precision oncology. Cancer discovery 2022, 12, 606–624. [Google Scholar] [CrossRef] [PubMed]
- Cai, T.; Abel, L.; Langford, O.; Monaghan, G.; Aronson, J.K.; Stevens, R.J. . & Sheppard, J.P. Associations between statins and adverse events in primary prevention of cardiovascular disease: systematic review with pairwise, network, and dose-response meta-analyses. Bmj 2021, 374. [Google Scholar]
Figure 1.
Proposed SRPE-TSN Model Framework Illustration.
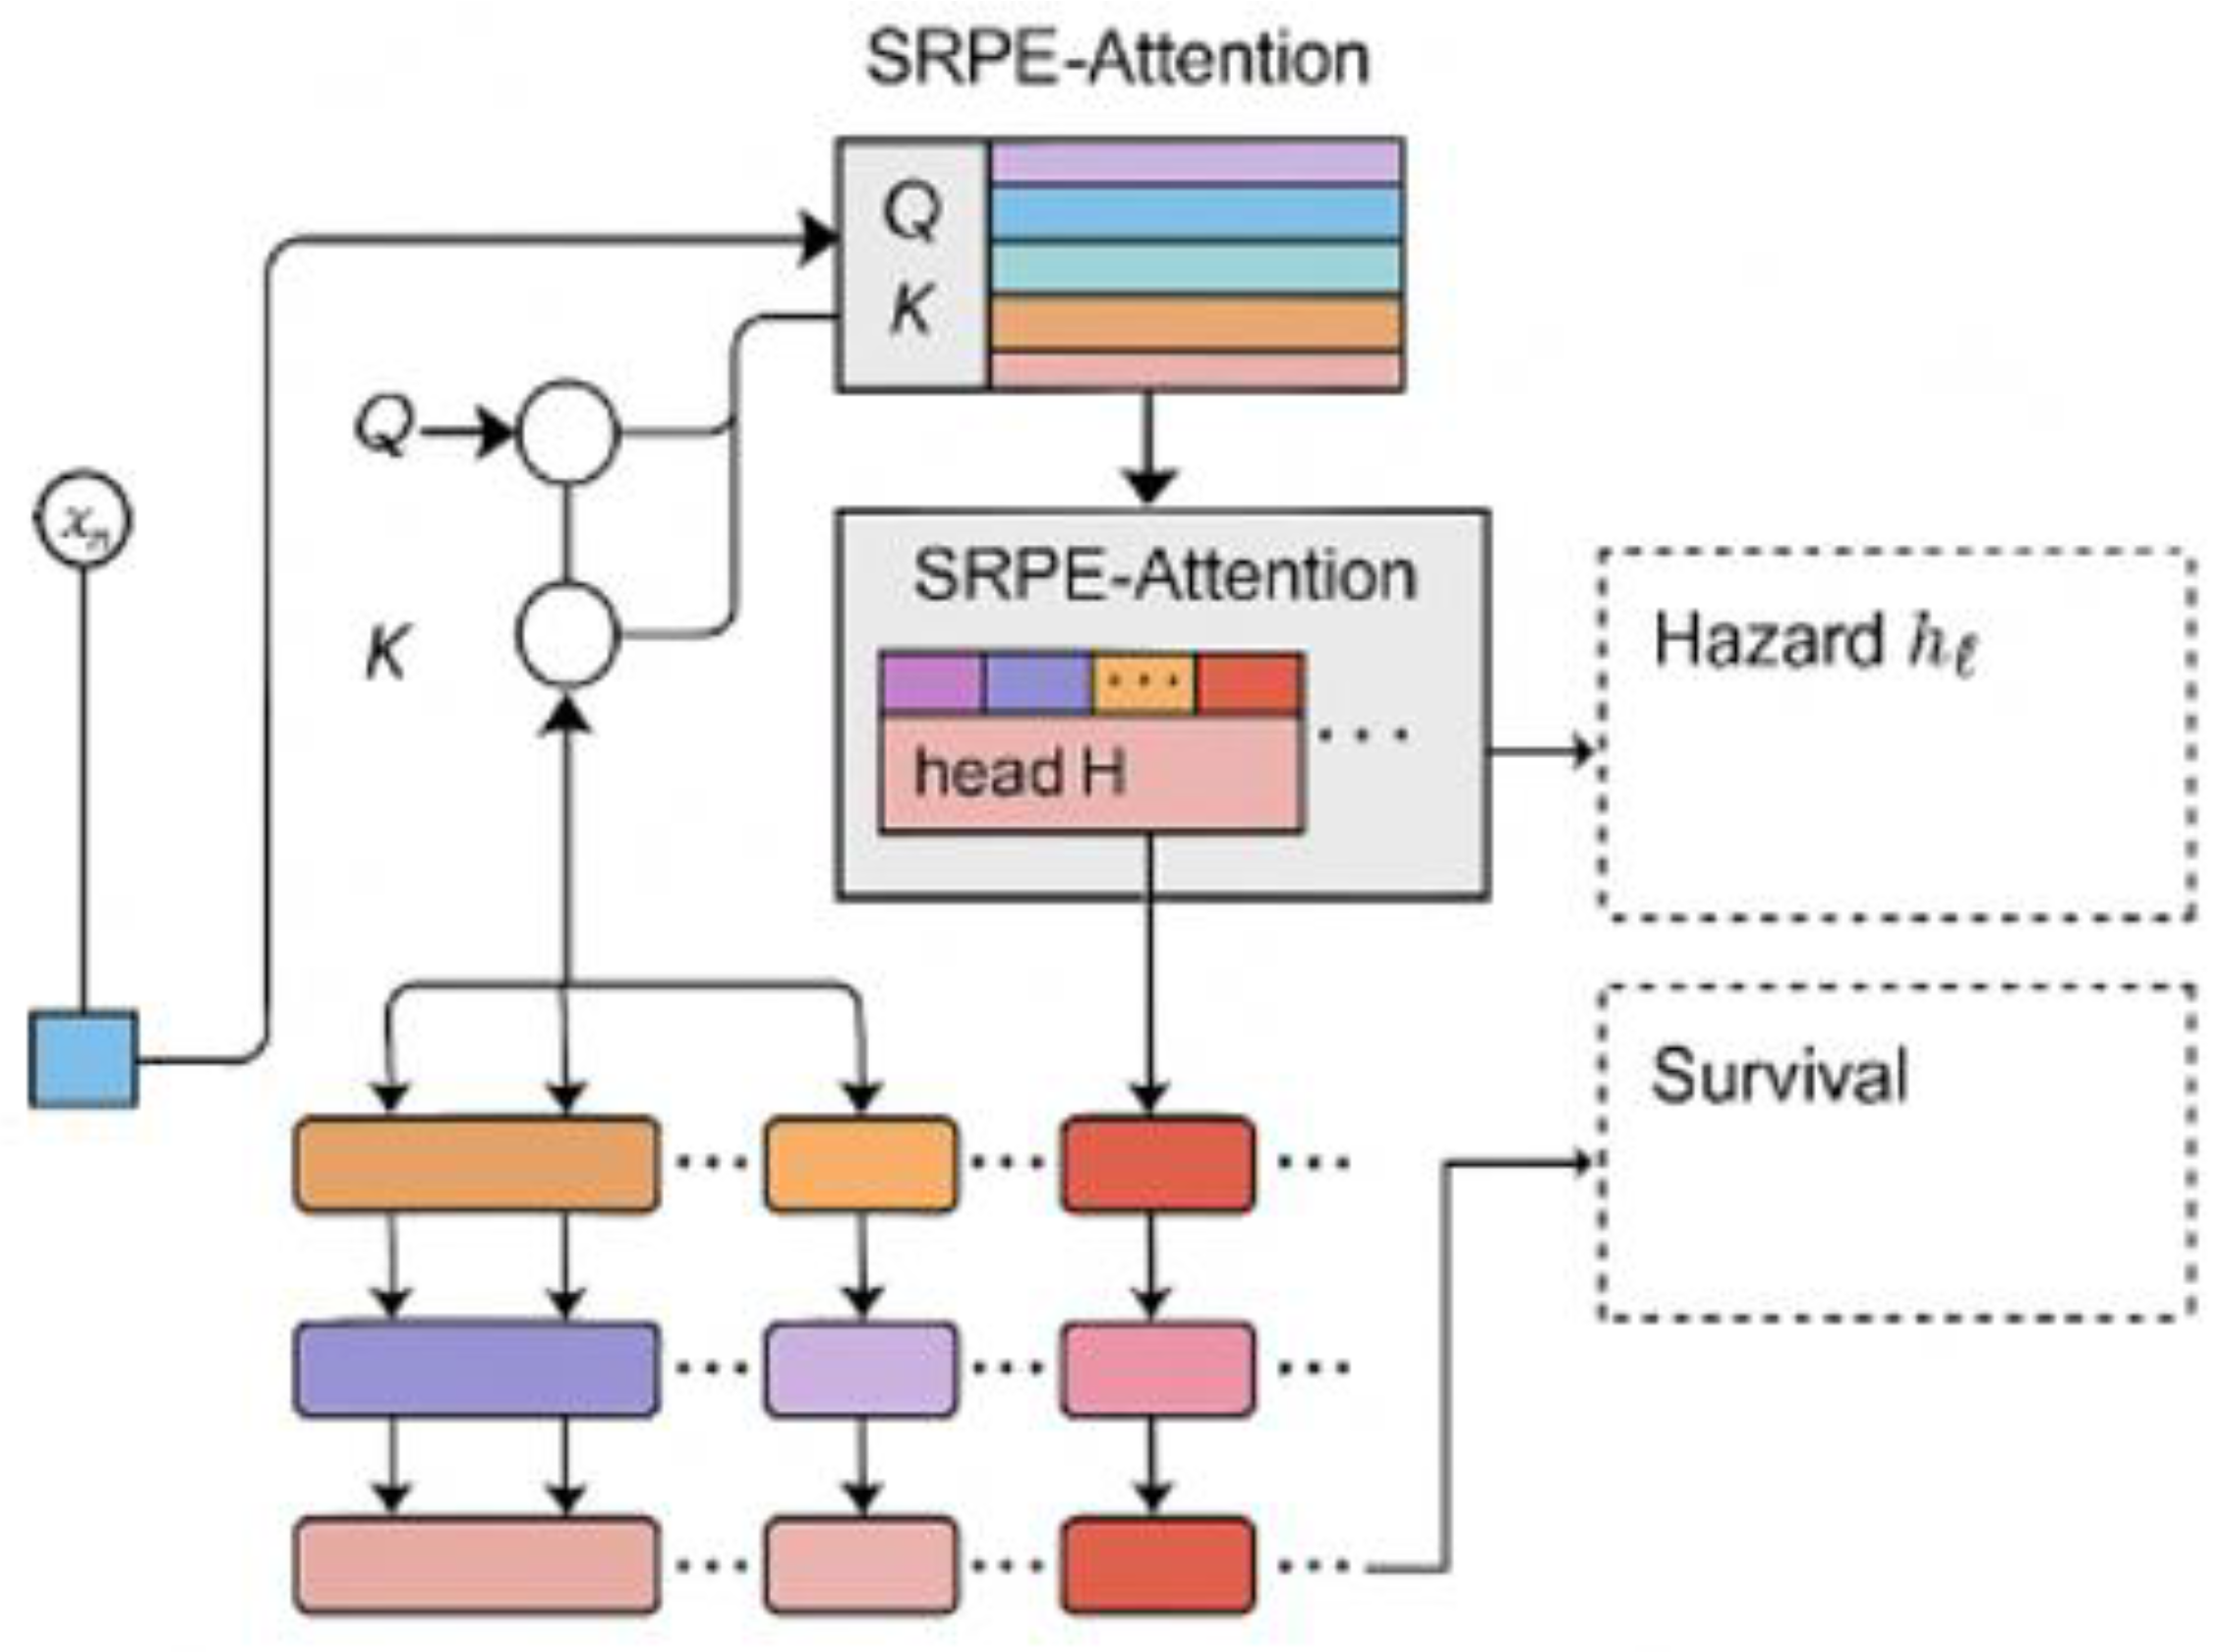
Figure 2.
Accuracy Comparison across Models with Varying Training Epochs.
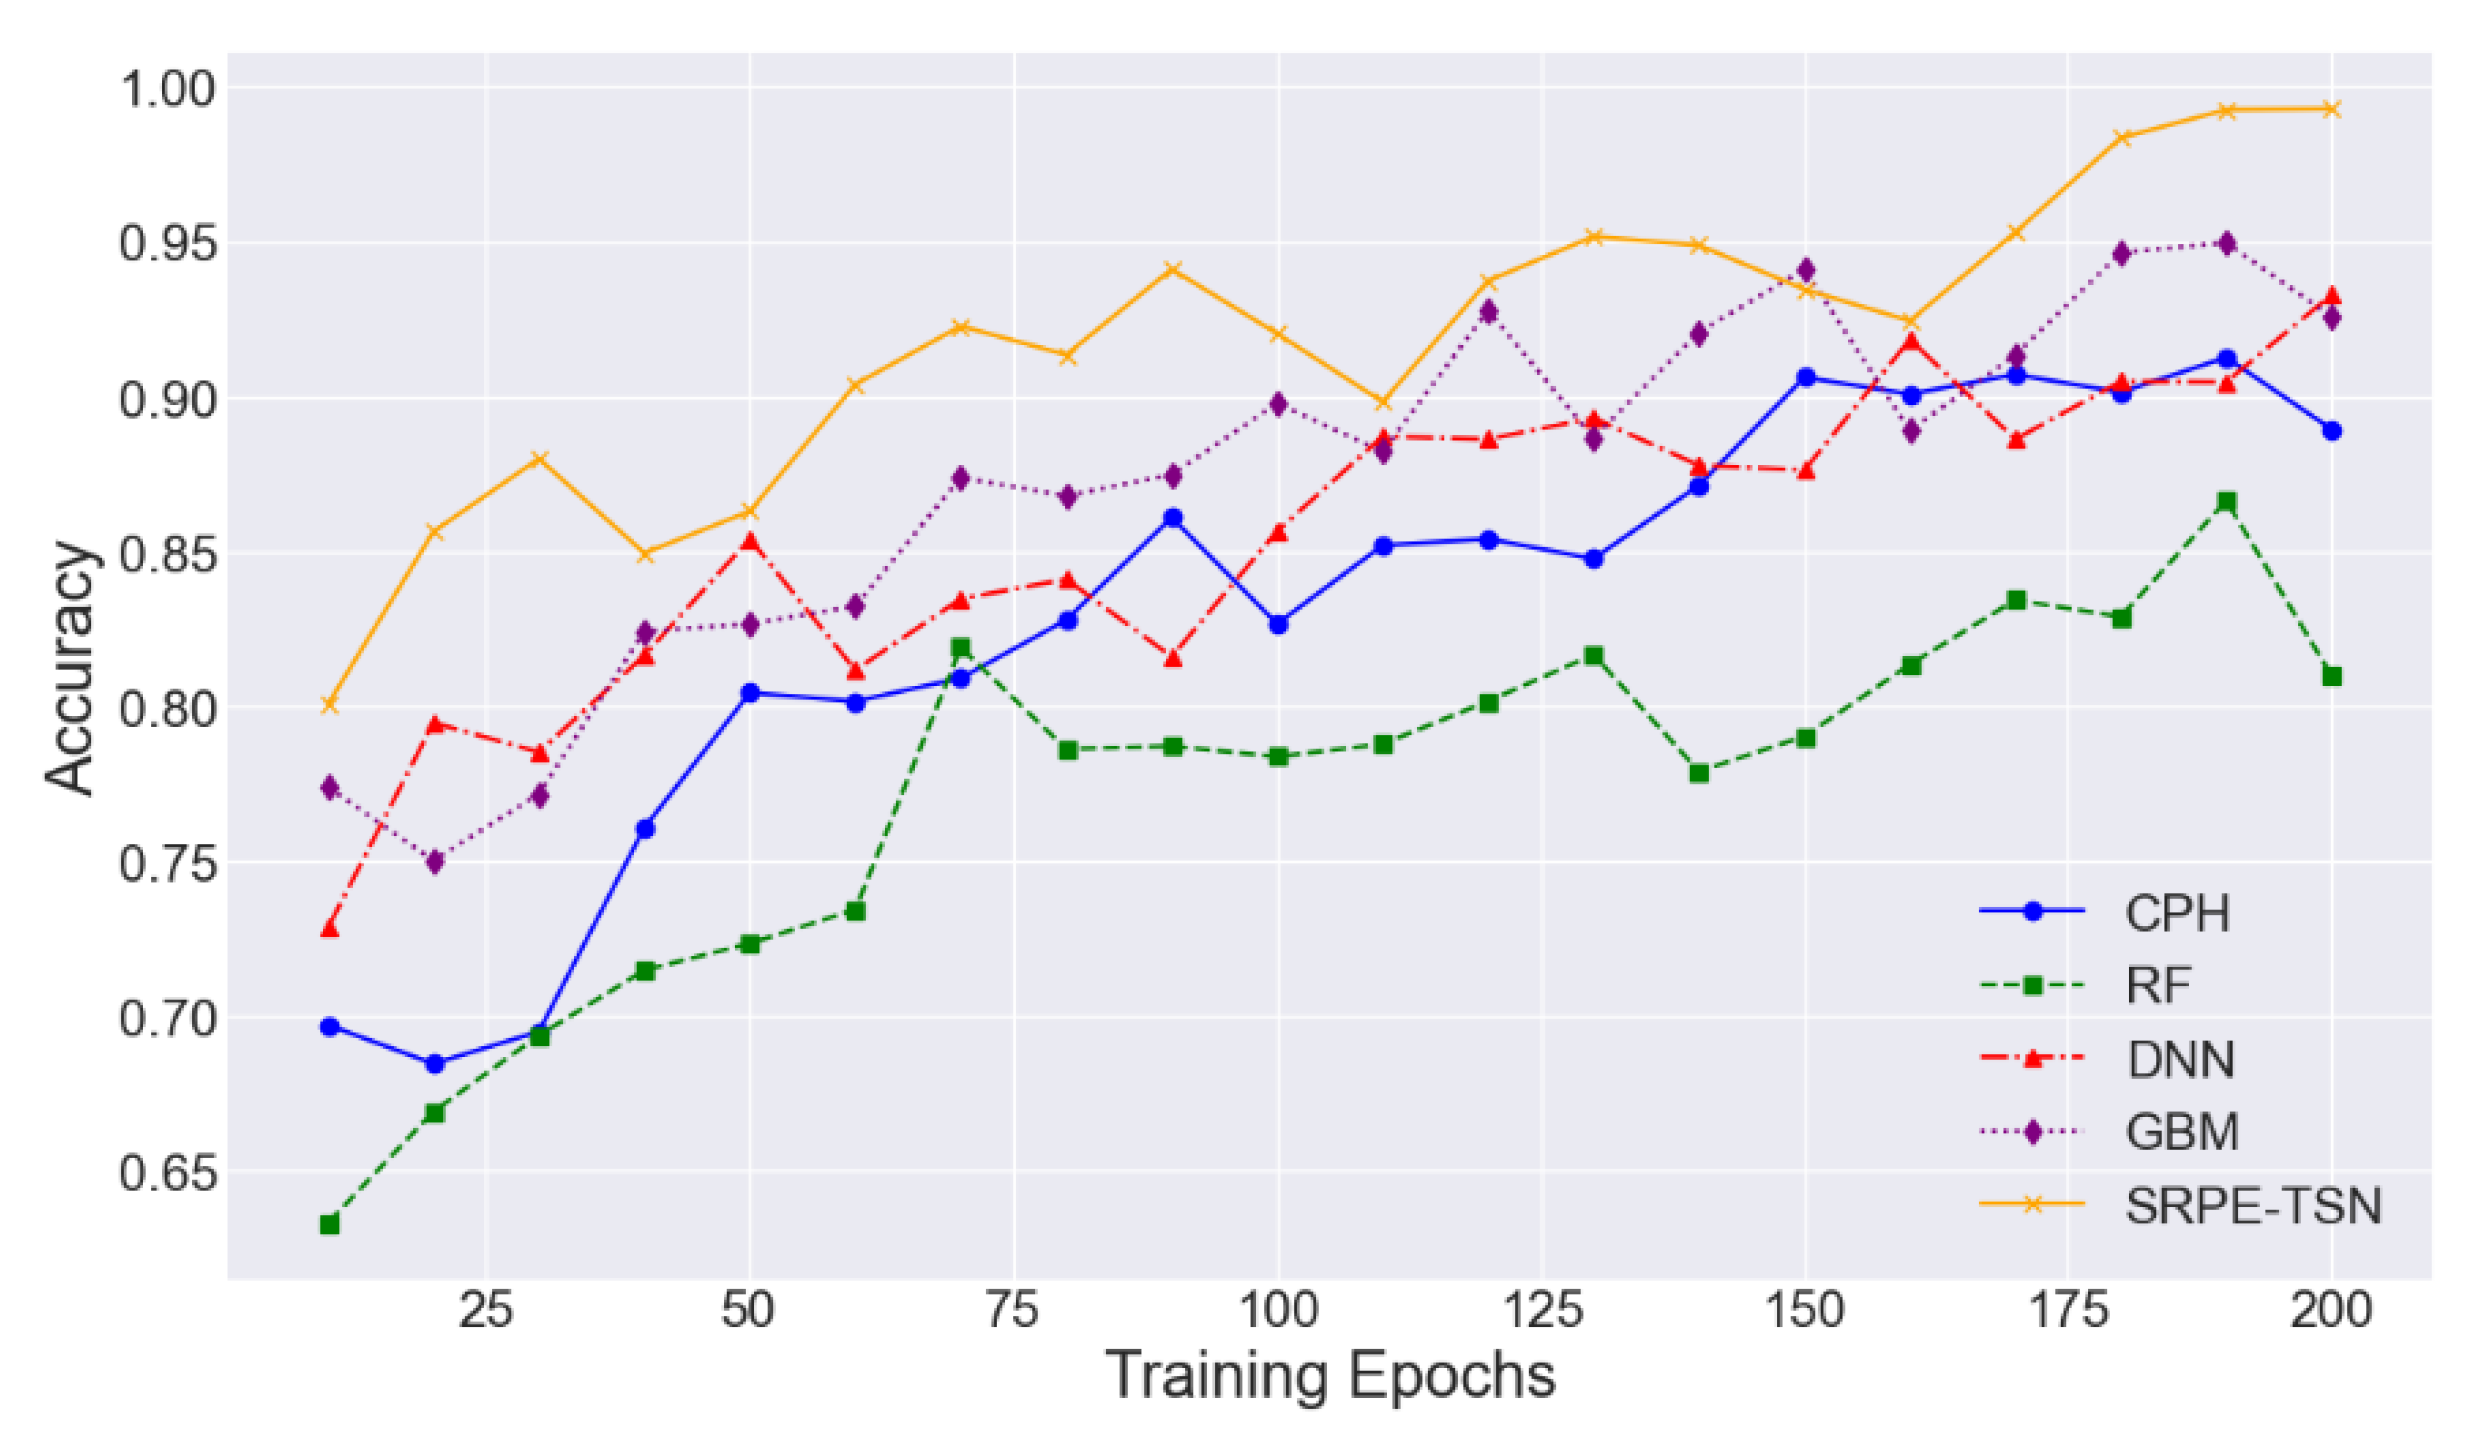
Figure 3.
C-Index Comparison across Models with Varying Training Epochs.
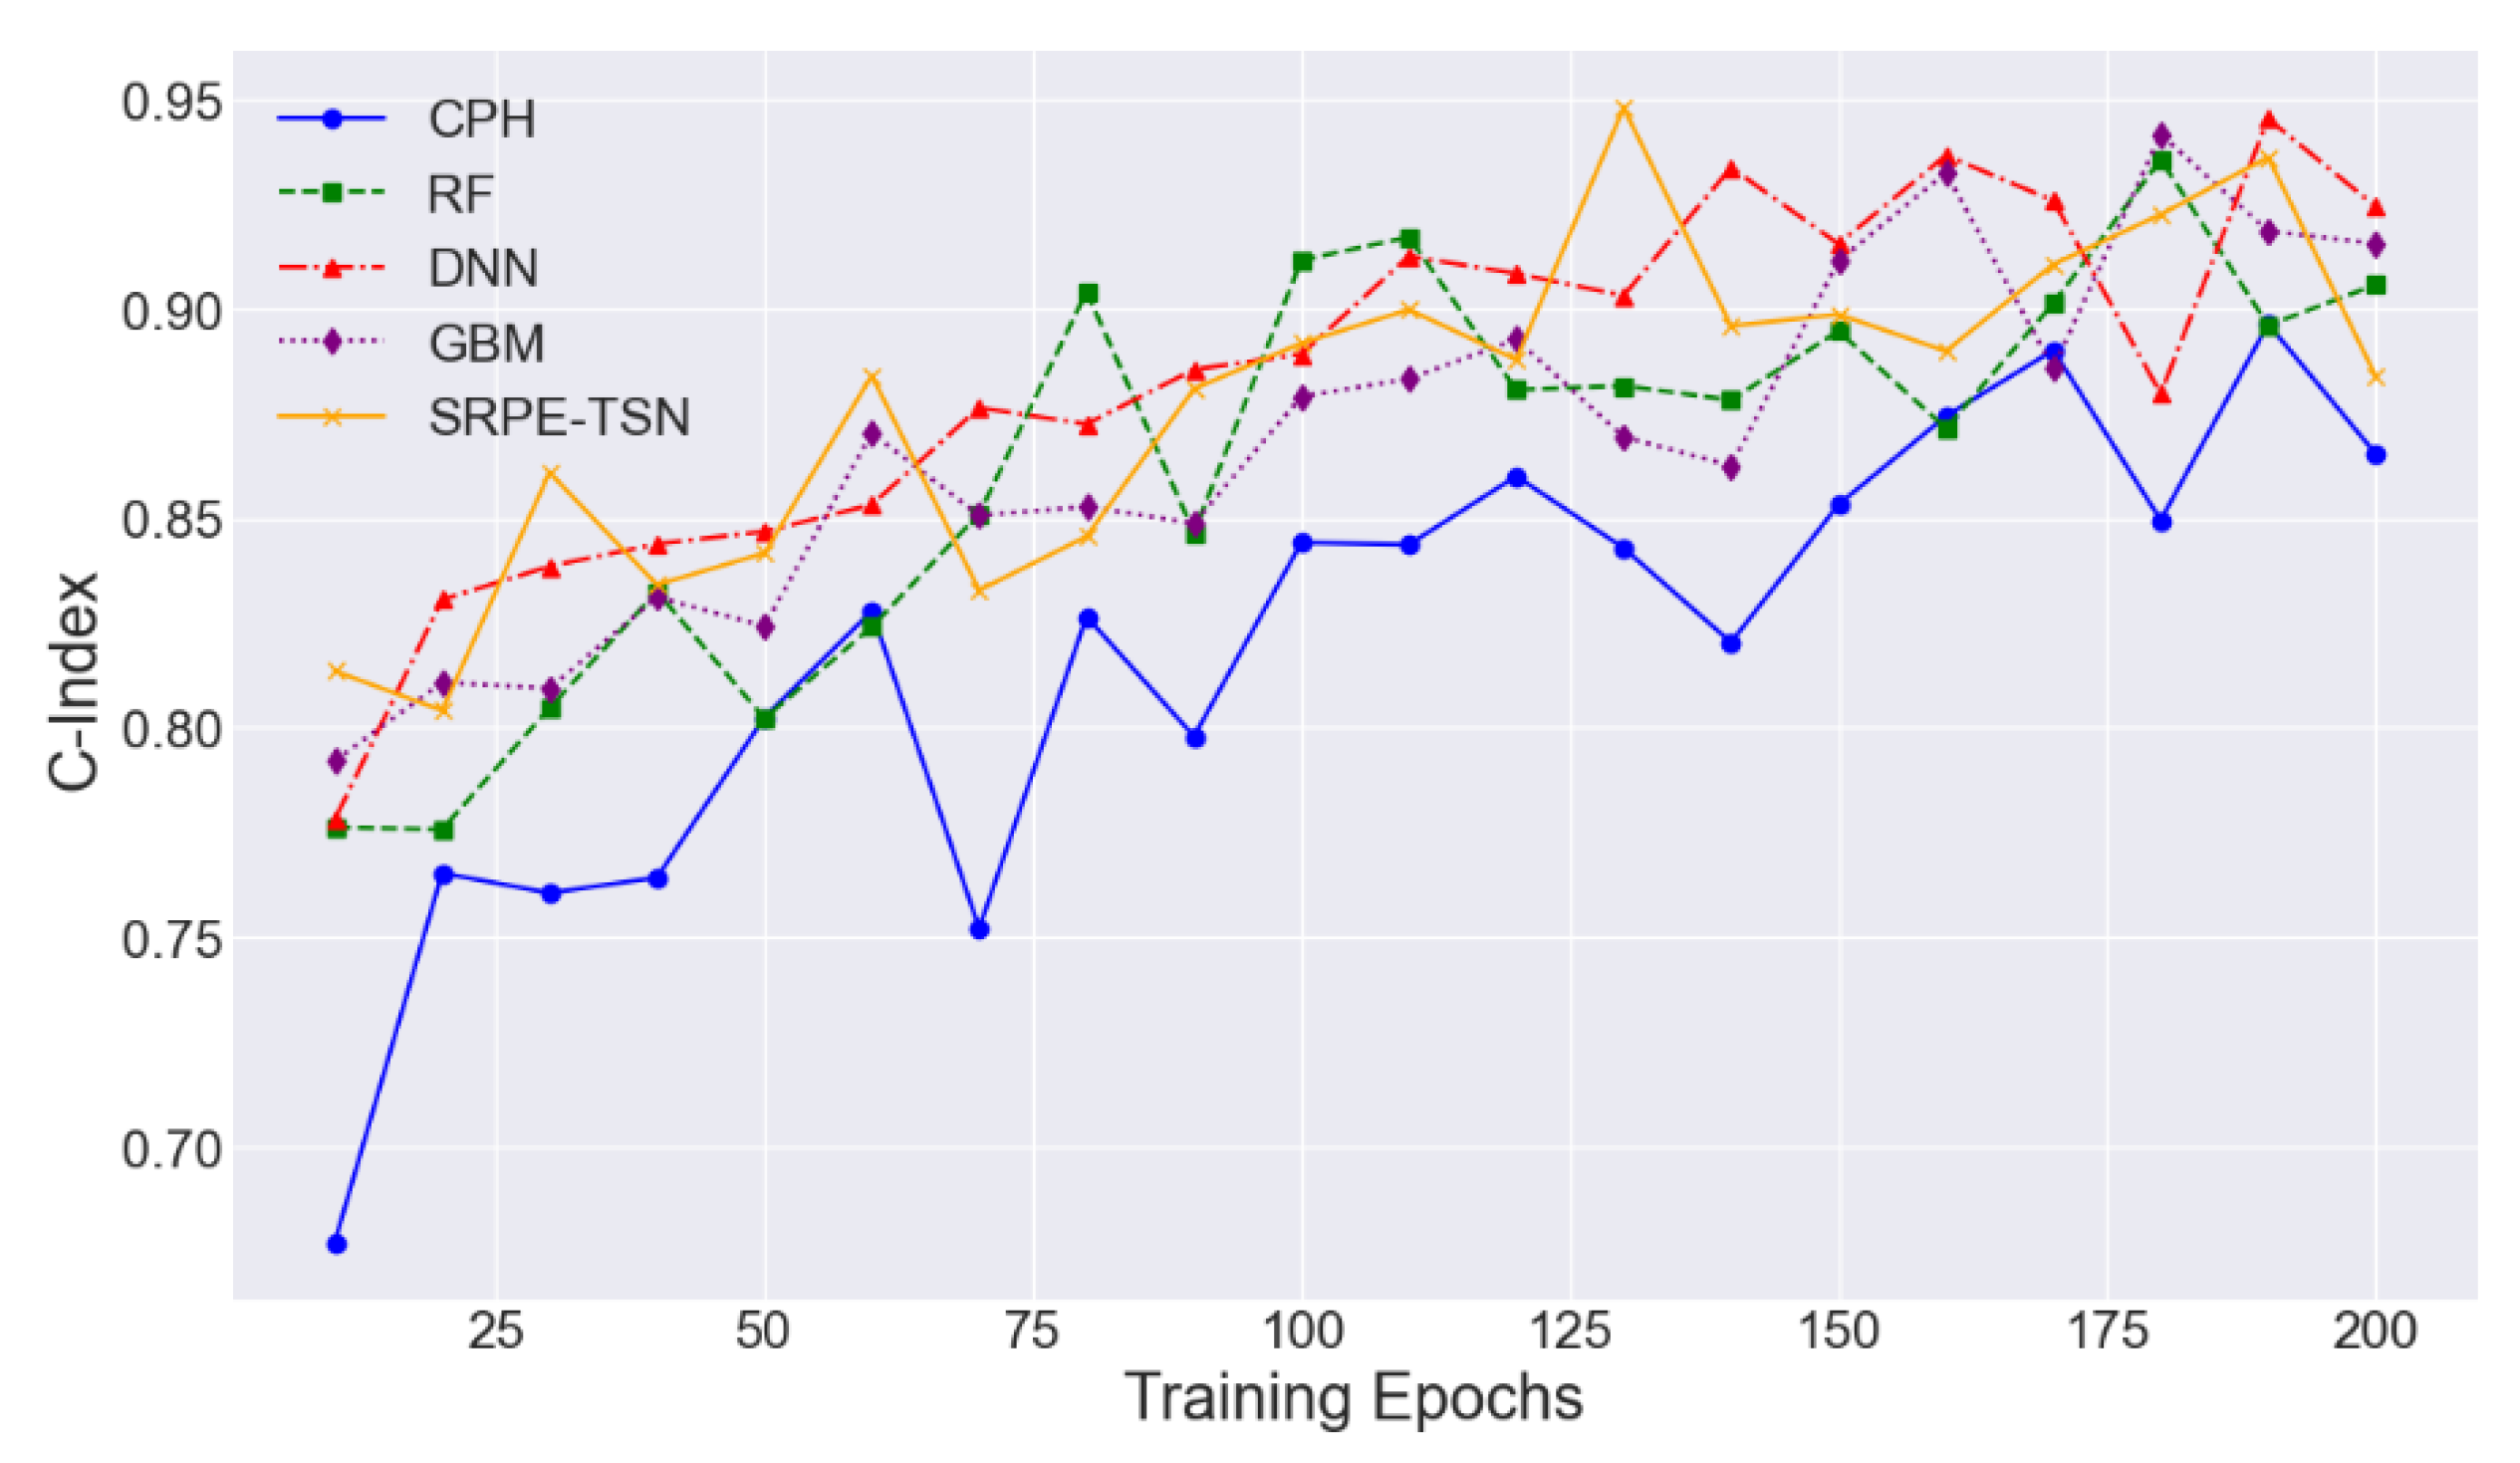
Figure 4.
Inference Time Comparison across Models with Varying Model Size.
Disclaimer/Publisher’s Note: The statements, opinions and data contained in all publications are solely those of the individual author(s) and contributor(s) and not of MDPI and/or the editor(s). MDPI and/or the editor(s) disclaim responsibility for any injury to people or property resulting from any ideas, methods, instructions or products referred to in the content. |
© 2025 by the authors. Licensee MDPI, Basel, Switzerland. This article is an open access article distributed under the terms and conditions of the Creative Commons Attribution (CC BY) license (http://creativecommons.org/licenses/by/4.0/).
Copyright: This open access article is published under a Creative Commons CC BY 4.0 license, which permit the free download, distribution, and reuse, provided that the author and preprint are cited in any reuse.


