Submitted:
23 April 2025
Posted:
24 April 2025
You are already at the latest version
Abstract
The Middle Chelif region in Algeria, characterized by its ancient and fertile landscape, encompasses 75 km rectangular plain covering 362,600 hectares and is the site of the highest volumes of running water in northern Algeria, significantly supporting local agriculture. This study aimed to analyze the spatial distribution of equivalent conductivity and transmissivity within the alluvial valley, focusing on the basin from Oum El Drou to Boukadir. Utilizing geoelectric sections from a 1972 survey conducted by the General Company of Geophysics (CGG) and obtained from the National Agency for Hydraulic Resources (ANRH), data processing involved Jupyter Notebook with the geopandas package, QGIS for visualization, and ordinary kriging using SAGA GIS. The methodology included printing geoelectric sections, estimating hydraulic conductivities, calculating equivalent hydraulic conductivities and transmissivities at sampling points, and employing ordinary kriging for spatial distribution mapping. The findings revealed that equivalent permeabilities and transmissivities are influenced by the geological layers' properties and thicknesses, including alluvium of the major bed, clay-silty alluvium, pebbles, and limestone shells, Villafranchian clays and silts, and Astian sandstones. These insights enhance our understanding of groundwater flow characteristics and inform effective management strategies for water resources in the region.
Keywords:
alluvial valley
; hydrogeology
; equivalent conductivity
; equivalent transmissivity
; middle Chelif
Introduction
The Middle Chelif valley is part of the Chelif basin which is part of the internal domains of the Maghrebides chain. This basin is built on the southern branch of the Alpine chain around the western Mediterranean(Walter et al., 2001).
The Middle Chelif valley is essentially filled with Neogene formation and constitutes an important part of the most important basin of the North-Algerian geological domains(Arab et al., 2015). Due to frequent changes in facies and their thicknesses, it is difficult to establish the typical stratigraphic series of the Middle Chelif Valley(Belhadji & Belkebir, 2008). The absence of deep drilling and good quality seismic studies make the deep geological interpretation of the valley very questionable thus a pull apart basin intra-mountainous, even transported (piggyback basin) according to new interpretations.
The equivalent conductivity of a geological formation refers to a single, representative value for the conductivity of a complex rock layer, taking into account the varying conductivities of its individual components and their relative thicknesses, essentially acting as an average conductivity for the entire formation when considering groundwater flow through it; it’s often used in hydrogeology to simplify calculations related to water movement within a layered geological structure. Most geological formations are not homogeneous, meaning their conductivity varies significantly within different layers or zones. This value is particularly useful for modelling groundwater flow through an aquifer, where the complex structure of the formation can be simplified by using an equivalent conductivity. (Dagan, 1982, 1989; Gomez-Hernandez and Gorelick, 1989; Neuman and Orr, 1993; Indelman and Abramovich, 1994; Indelman et al., 1996; Sanchez-Vila, 1997; Riva et al., 2001; Guadagnini et al., 2003)
Transmissivity referred as the rate of flow under a unit hydraulic gradient through a unit width of aquifer of given saturated thickness while Equivalent transmissivity refers to the overall ability of a layered or heterogeneous aquifer to transmit water ((Eluozo & Nwofor, 2012). In a multi-layer aquifer system where each layer may have a different hydraulic conductivity (K) and saturated thickness (b) each layer contributes its own transmissivity (T = K × b). The equivalent transmissivity is then obtained by combining these individual contributions into a single parameter that effectively characterizes the entire system. (Schvidler [1964] and Matheron [1967]) For example, if an aquifer consists of two horizontal layers: Layer 1: Hydraulic conductivity K1 and thickness b1 give transmissivity T1=K1×b1. Layer 2: Hydraulic conductivity K2 and thickness b2 give transmissivity T2=K2×b2. Assuming the layers contribute independently and are laterally continuous, the equivalent transmissivity for the entire aquifer can be estimated as:
Teq = T1+T2 = K1b1 + K2b2
This single parameter simplifies the analysis of groundwater flow, making it easier to predict aquifer behaviour, design pumping tests, and estimate sustainable yields. In more complex settings, especially when anisotropy or vertical flow components are significant, more sophisticated methods (such as numerical modelling) might be used to determine an equivalent transmissivity (William W. Woessner and Eileen P. Poeter).
Thus, equivalent transmissivity represents an aggregate measure that reflects how easily water can be transmitted horizontally through all layers of an aquifer combined. (Gilbert Castany 1998)
This study aimed to analyze the spatial distribution of equivalent conductivity and equivalent transmissivity within the alluvial valley, focusing on the basin from Oum El Drou to Boukadir.
Study Zone
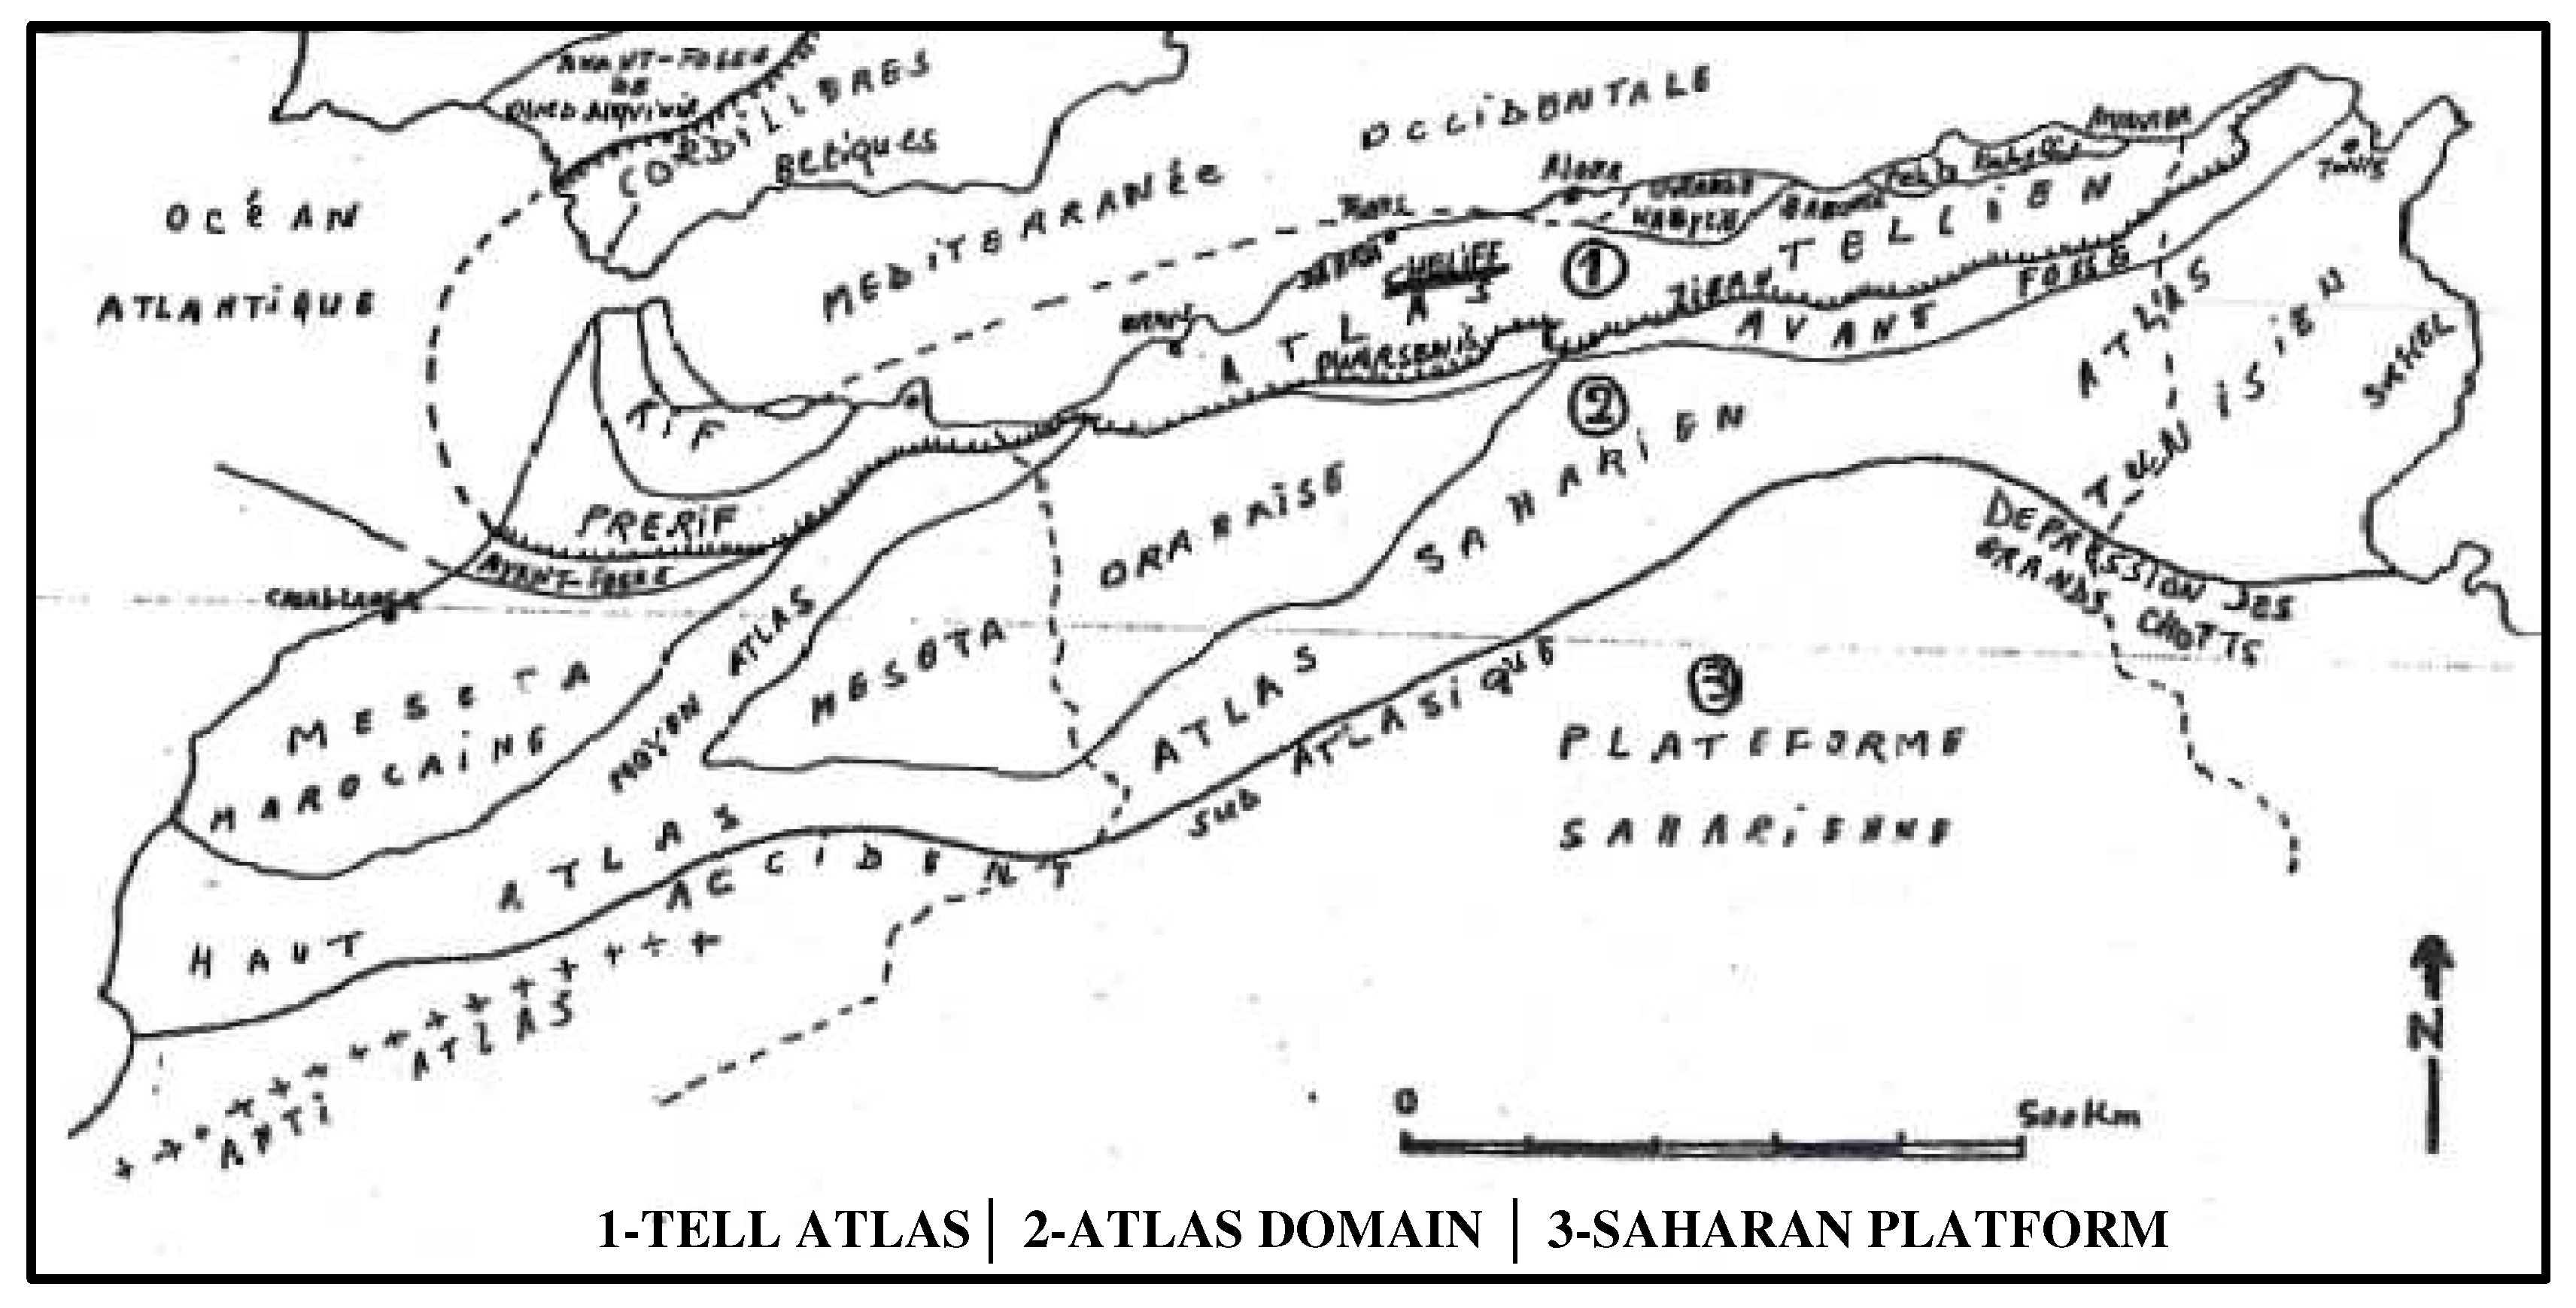
This study was conducted in the alluvial valley of Middle Western Chelif, which extends from Oum El Drou to Boukadir. The alluvial valley is part of the Chelif Basin, situated within the internal domains of the Maghrebides chain. Specifically, the Chelif Basin forms the southern part of the Alpine chain surrounding the western Mediterranean.
Figure 1.
The peri-Mediterranean Alpine orogen map of Northern Algeria (according to Durand-Delga, 1969).
Figure 1.
The peri-Mediterranean Alpine orogen map of Northern Algeria (according to Durand-Delga, 1969).
Geophysical
The middle western Chelif alluvial valley is believed to contain layers of usable water, a hypothesis supported by an electrical prospecting survey conducted by the General Company of Geophysics (CGG) on December 13, 1972.
The Middle Western Chelif alluvial valley is full of layers likely to contain usable water. To support this hypothesis, from September 18 to December 13, 1972, the General Company of Geophysics (CGG) carried out an electrical prospecting, under the request from the Department of Environmental Studies and Hydraulic Research.
The part of the valley covered by this prospection is the one we chose for this project. This 1972 survey incorporates 4 previous geophysical surveys carried out in this valley: in 1960, 1966, 1967 and 1971 respectively in the southern region of Ouled Fares (Warnier), in the Mouafekia plain, and in the region of Oued Sly-Boukadir. Their results were taken back rectified and used to interpret the new prospecting.
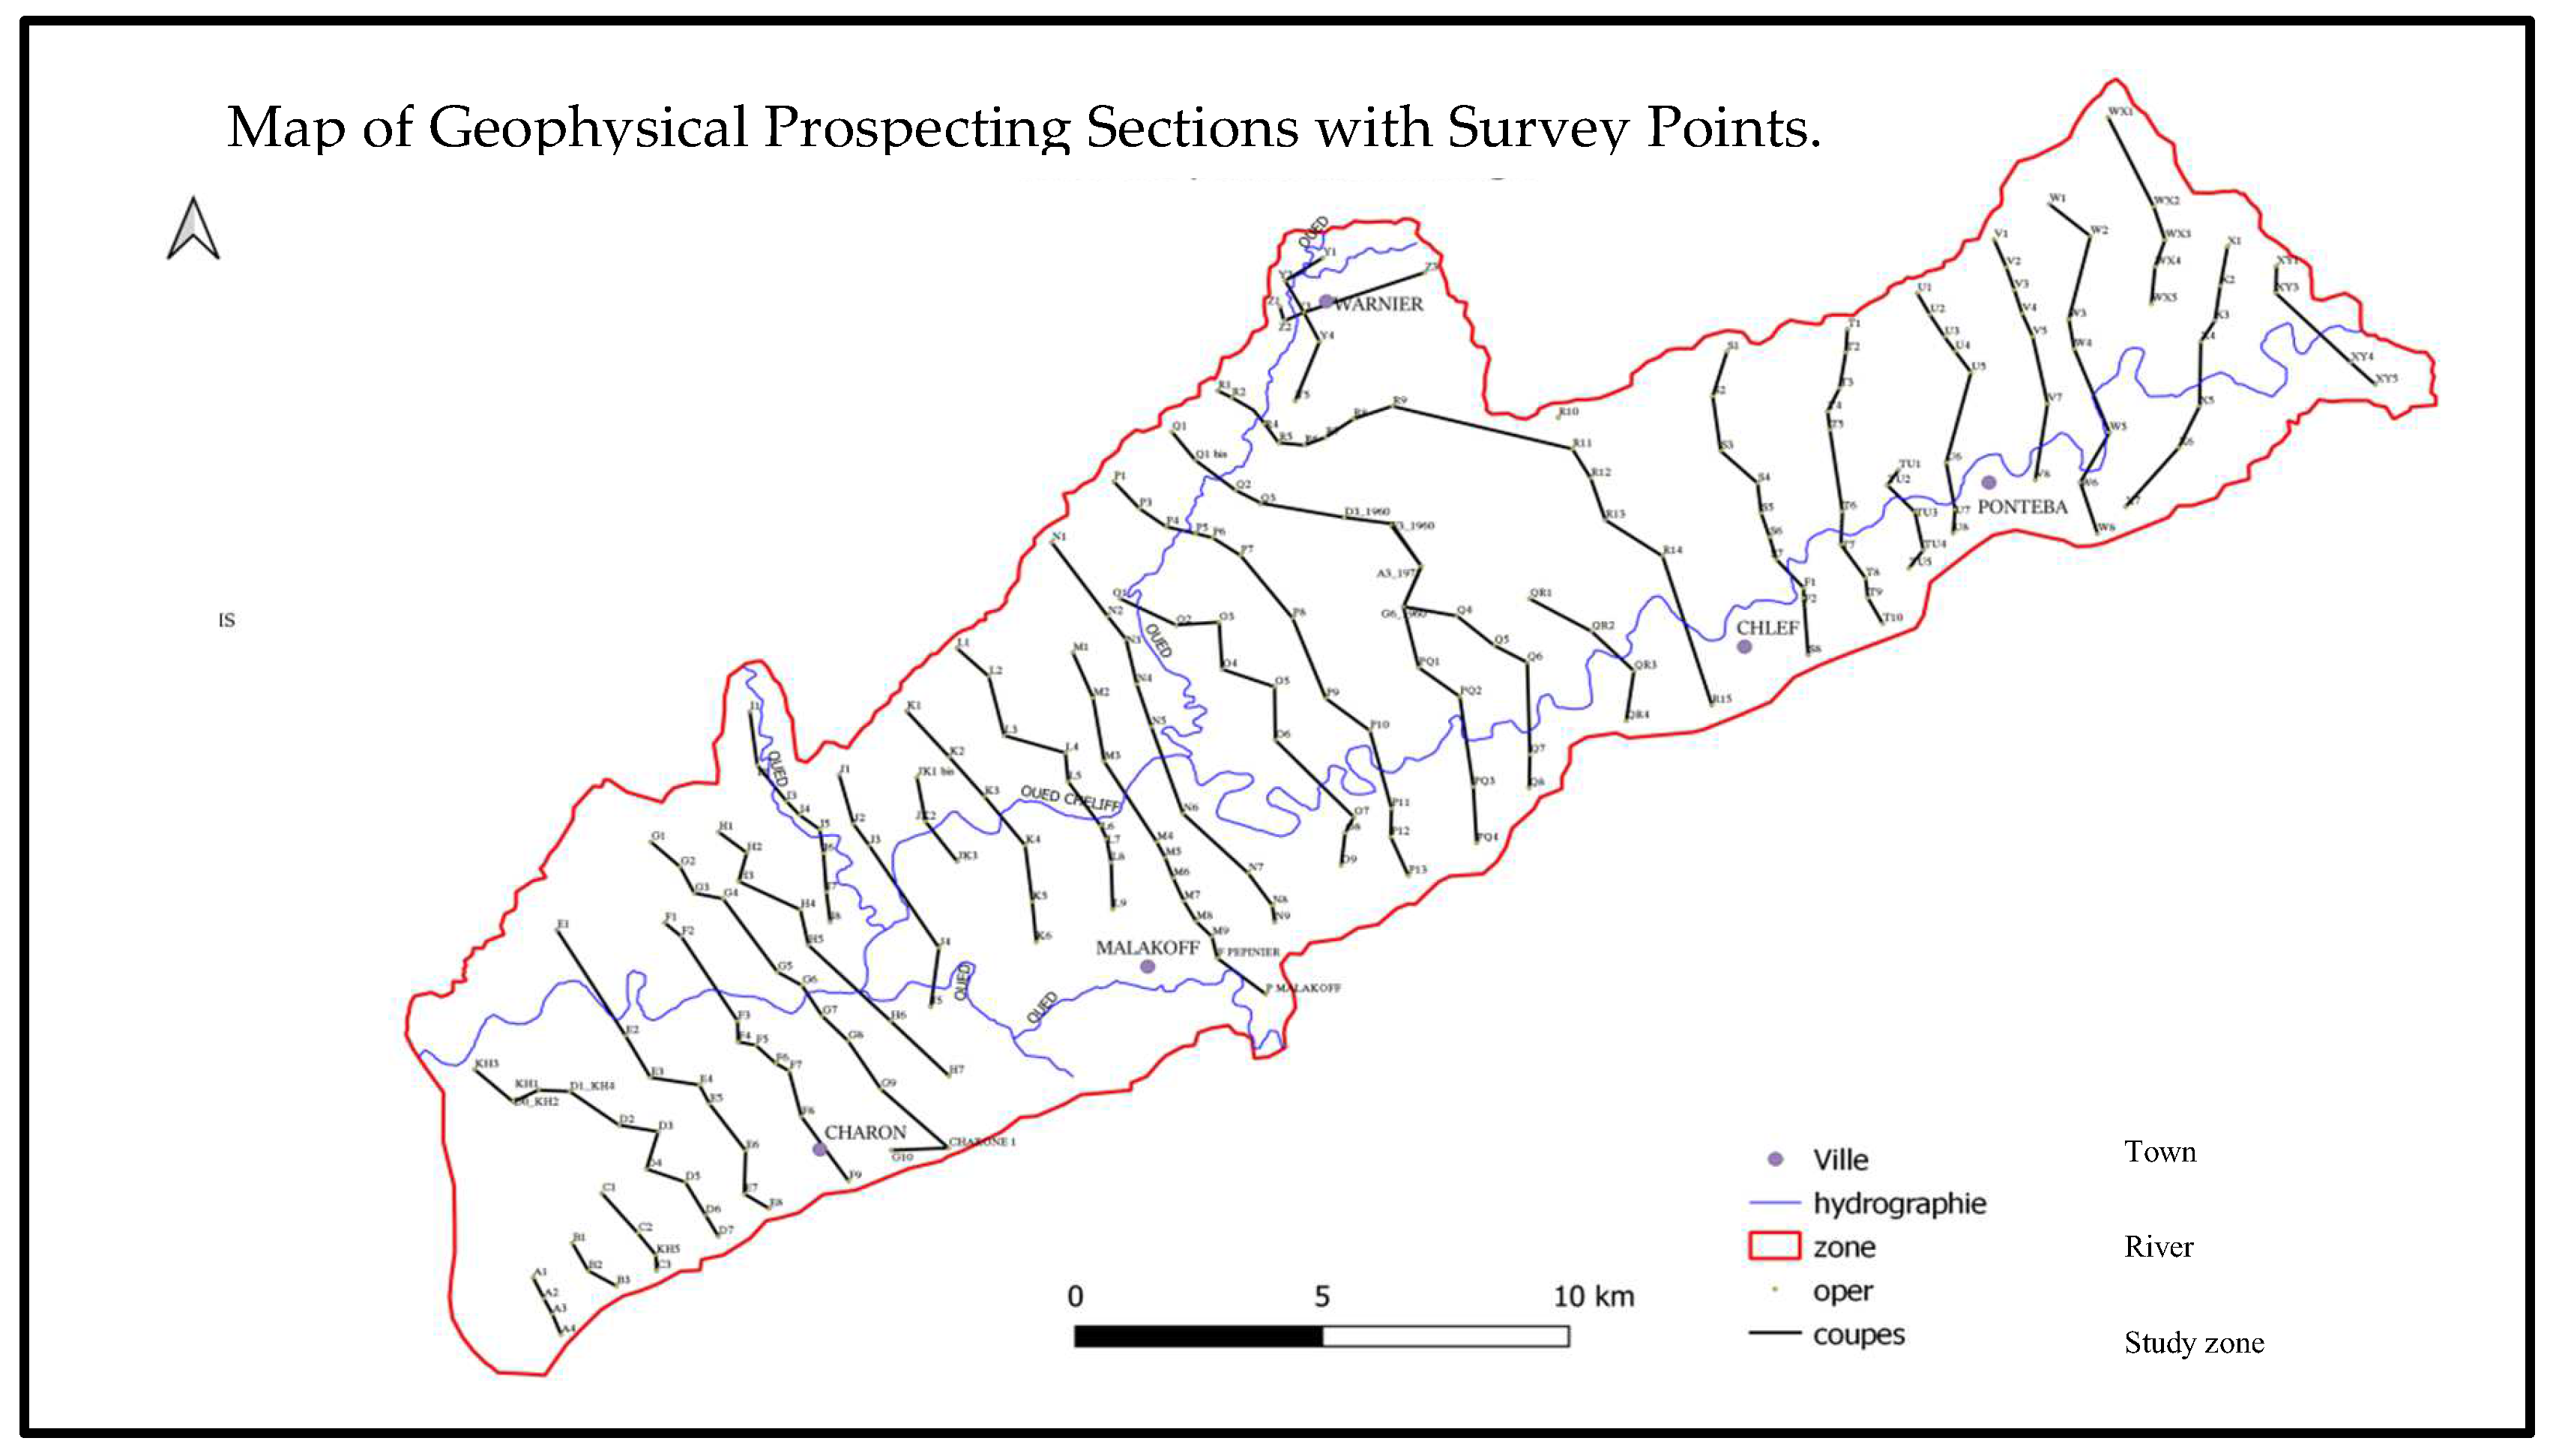
The prospecting included 237 Schlumberger Electrical Surveys in line length variable, going from AB 1000 to AB 6000 meters depending on their position, and distributed over 32 profiles. A dozen drillings were carried out for calibration.
In this chapter, based on this prospecting, we will study the geophysics of our study area (Middle Chelif).
Figure 2.
The position map of the Middle Chelif (CGG-1972).
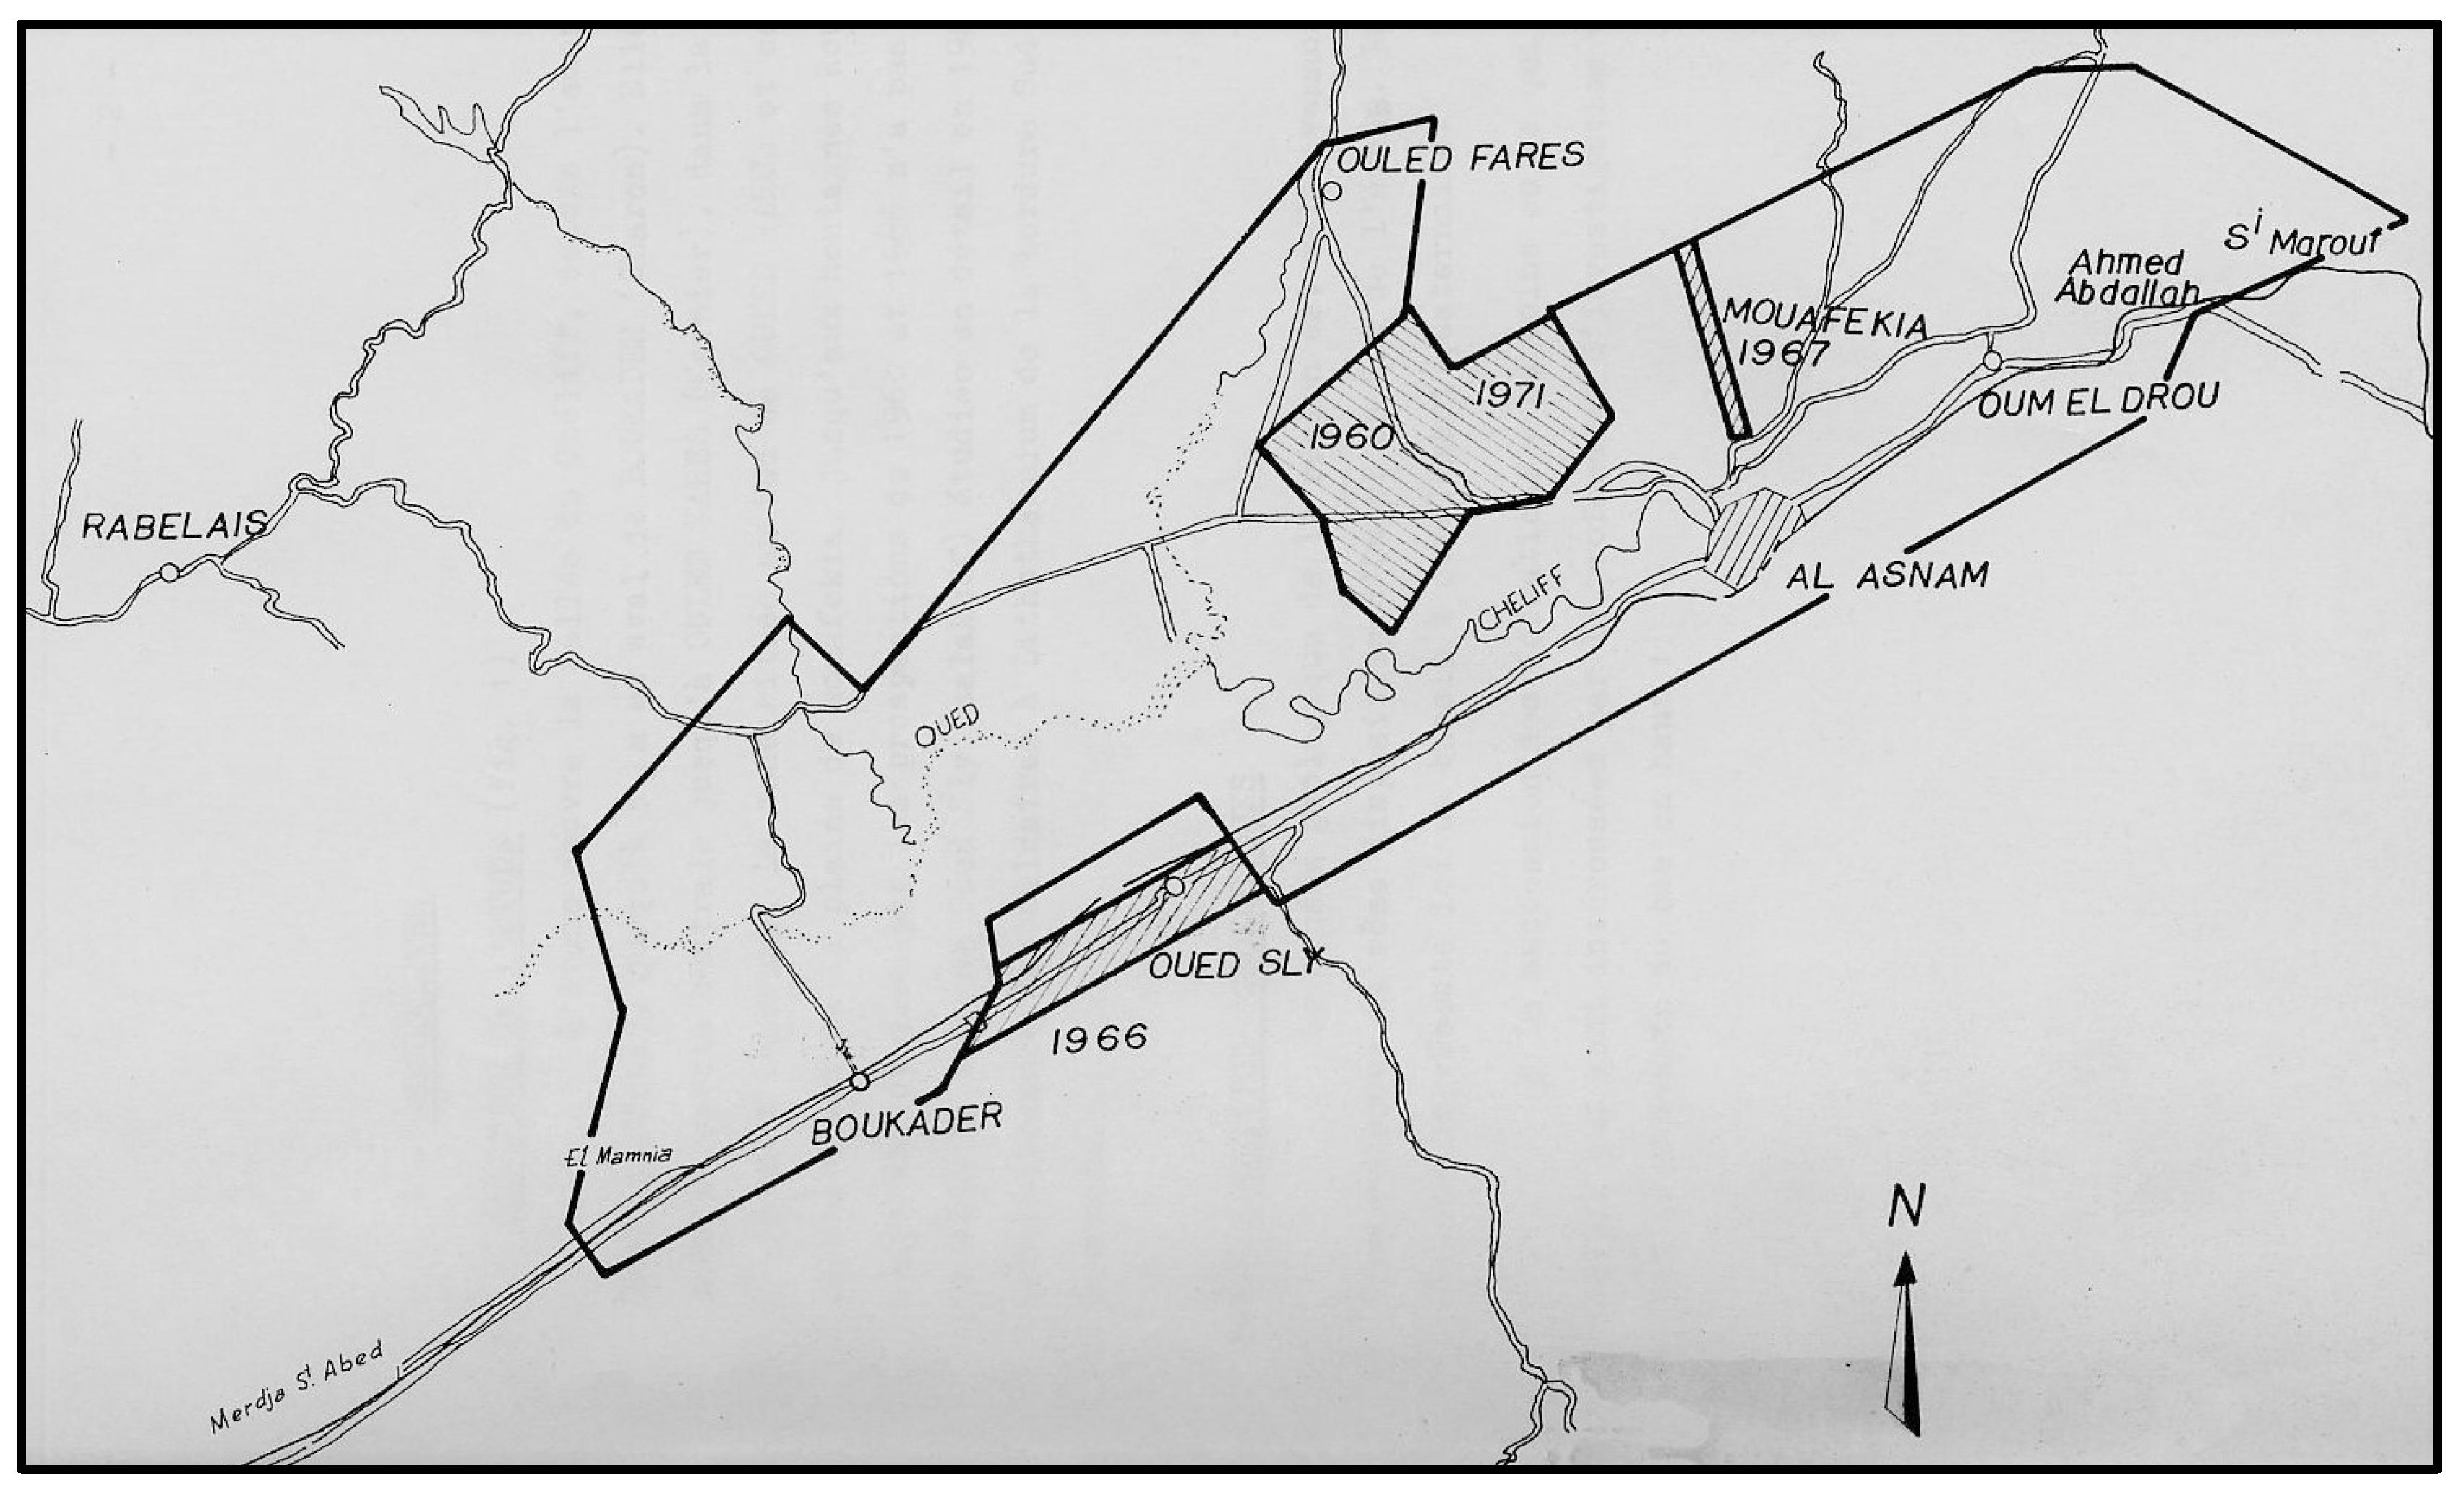
Figure 3.
Map of geophysical prospecting sections with survey points.
Data Collection
The dataset utilized in this project consists of the geoelectric section from a geophysical prospecting survey conducted in 1972 by the General Company of Geophysics in the Alluvial Valley of Middle Chelif. This data was requested and obtained from the National Agency for Hydraulic Resources (ANRH) located in Blida, Algeria.
Data Analysis
The data was processed using Jupyter Notebook, part of the Anaconda distribution of the Python programming language, specifically employing the geo panda’s package. Maps were gathered, modified, and visualized using QGIS versions 3.16 and 3.18. Ordinary kriging was executed with SAGA GIS version 2.3.2.
Methods
Steps for Geoelectric and Hydraulic Conductivity Analysis
- Printing of Geoelectric Sections
The data file obtained from the 1972 geophysical survey report contains geoelectric sections in JPEG format. To facilitate the measurement of the thicknesses of various geological layers at each electrical survey point, these JPEG documents were printed on paper.
- 2.
- Estimation of Hydraulic Conductivity
The hydraulic conductivity for each geological layer was estimated based on the printed geoelectric sections and relevant empirical formulas.
- 3.
- Calculation of Equivalent Hydraulic Conductivities
Equivalent hydraulic conductivities were calculated at each electrical sampling point, integrating the estimated values from the different geological layers.
- 4.
- Calculation of Equivalent Transmissivities
Following the hydraulic conductivity calculations, equivalent transmissivities were determined for each electrical sampling point, reflecting the capacity of each layer to transmit water.
- 5.
- An application of Ordinary Kriging
Ordinary kriging was employed to interpolate and create a spatial distribution map of hydraulic conductivities and transmissivities across the study area, allowing for a comprehensive analysis of groundwater flow characteristics.
Finally, to calculate the minimum, maximum and average equivalent permeabilities at an electrical sounding point, we use the respectively minimum, maximum and average permeabilities of the geological layers below the sounding point as follows:
Keq : equivalent permeability
Ki : permeability of the layer i
E : total thickness
ei : layer thickness i
To calculate the transmissivity, we use the permeabilities previously calculated as follows:
Teq: equivalent transmissivity
Keq: equivalent permeability
E: total thickness
Results
Figure 4.
A map of the minimum permeability equivalent of Alluviums in middle Chelif.
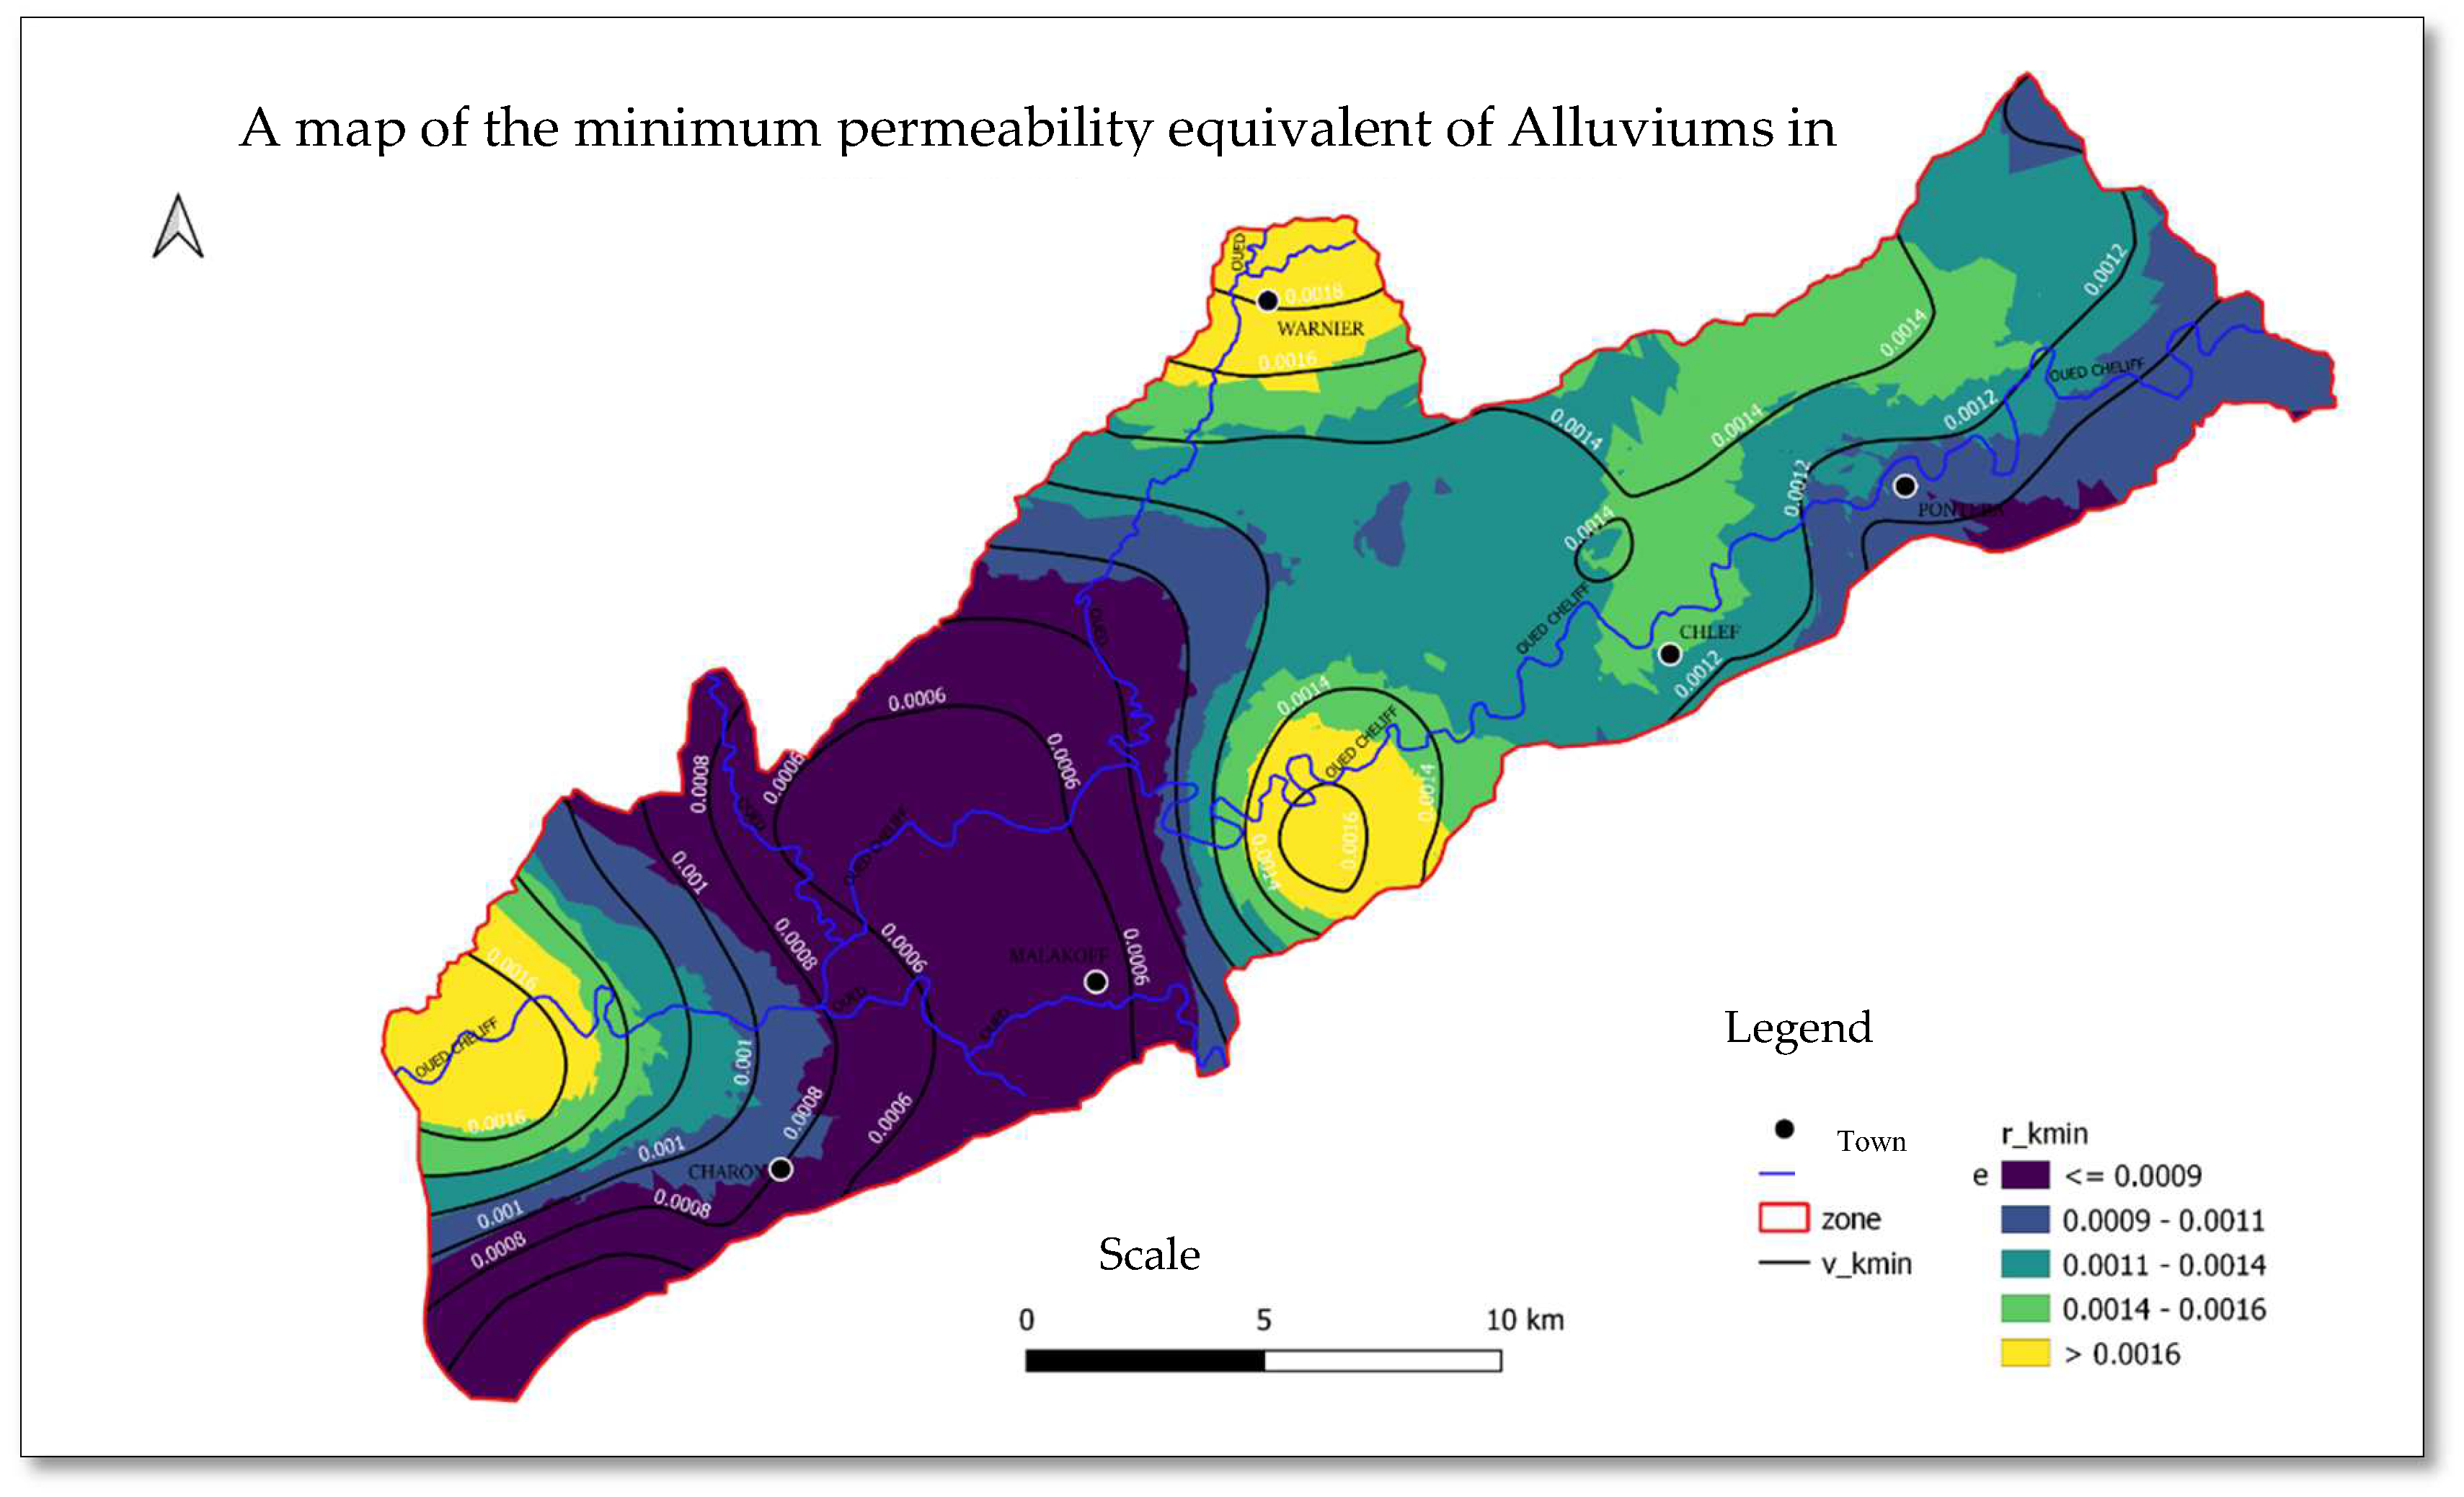
Figure 5.
A map of the maximum permeability equivalent of Alluviums in middle Chelif.
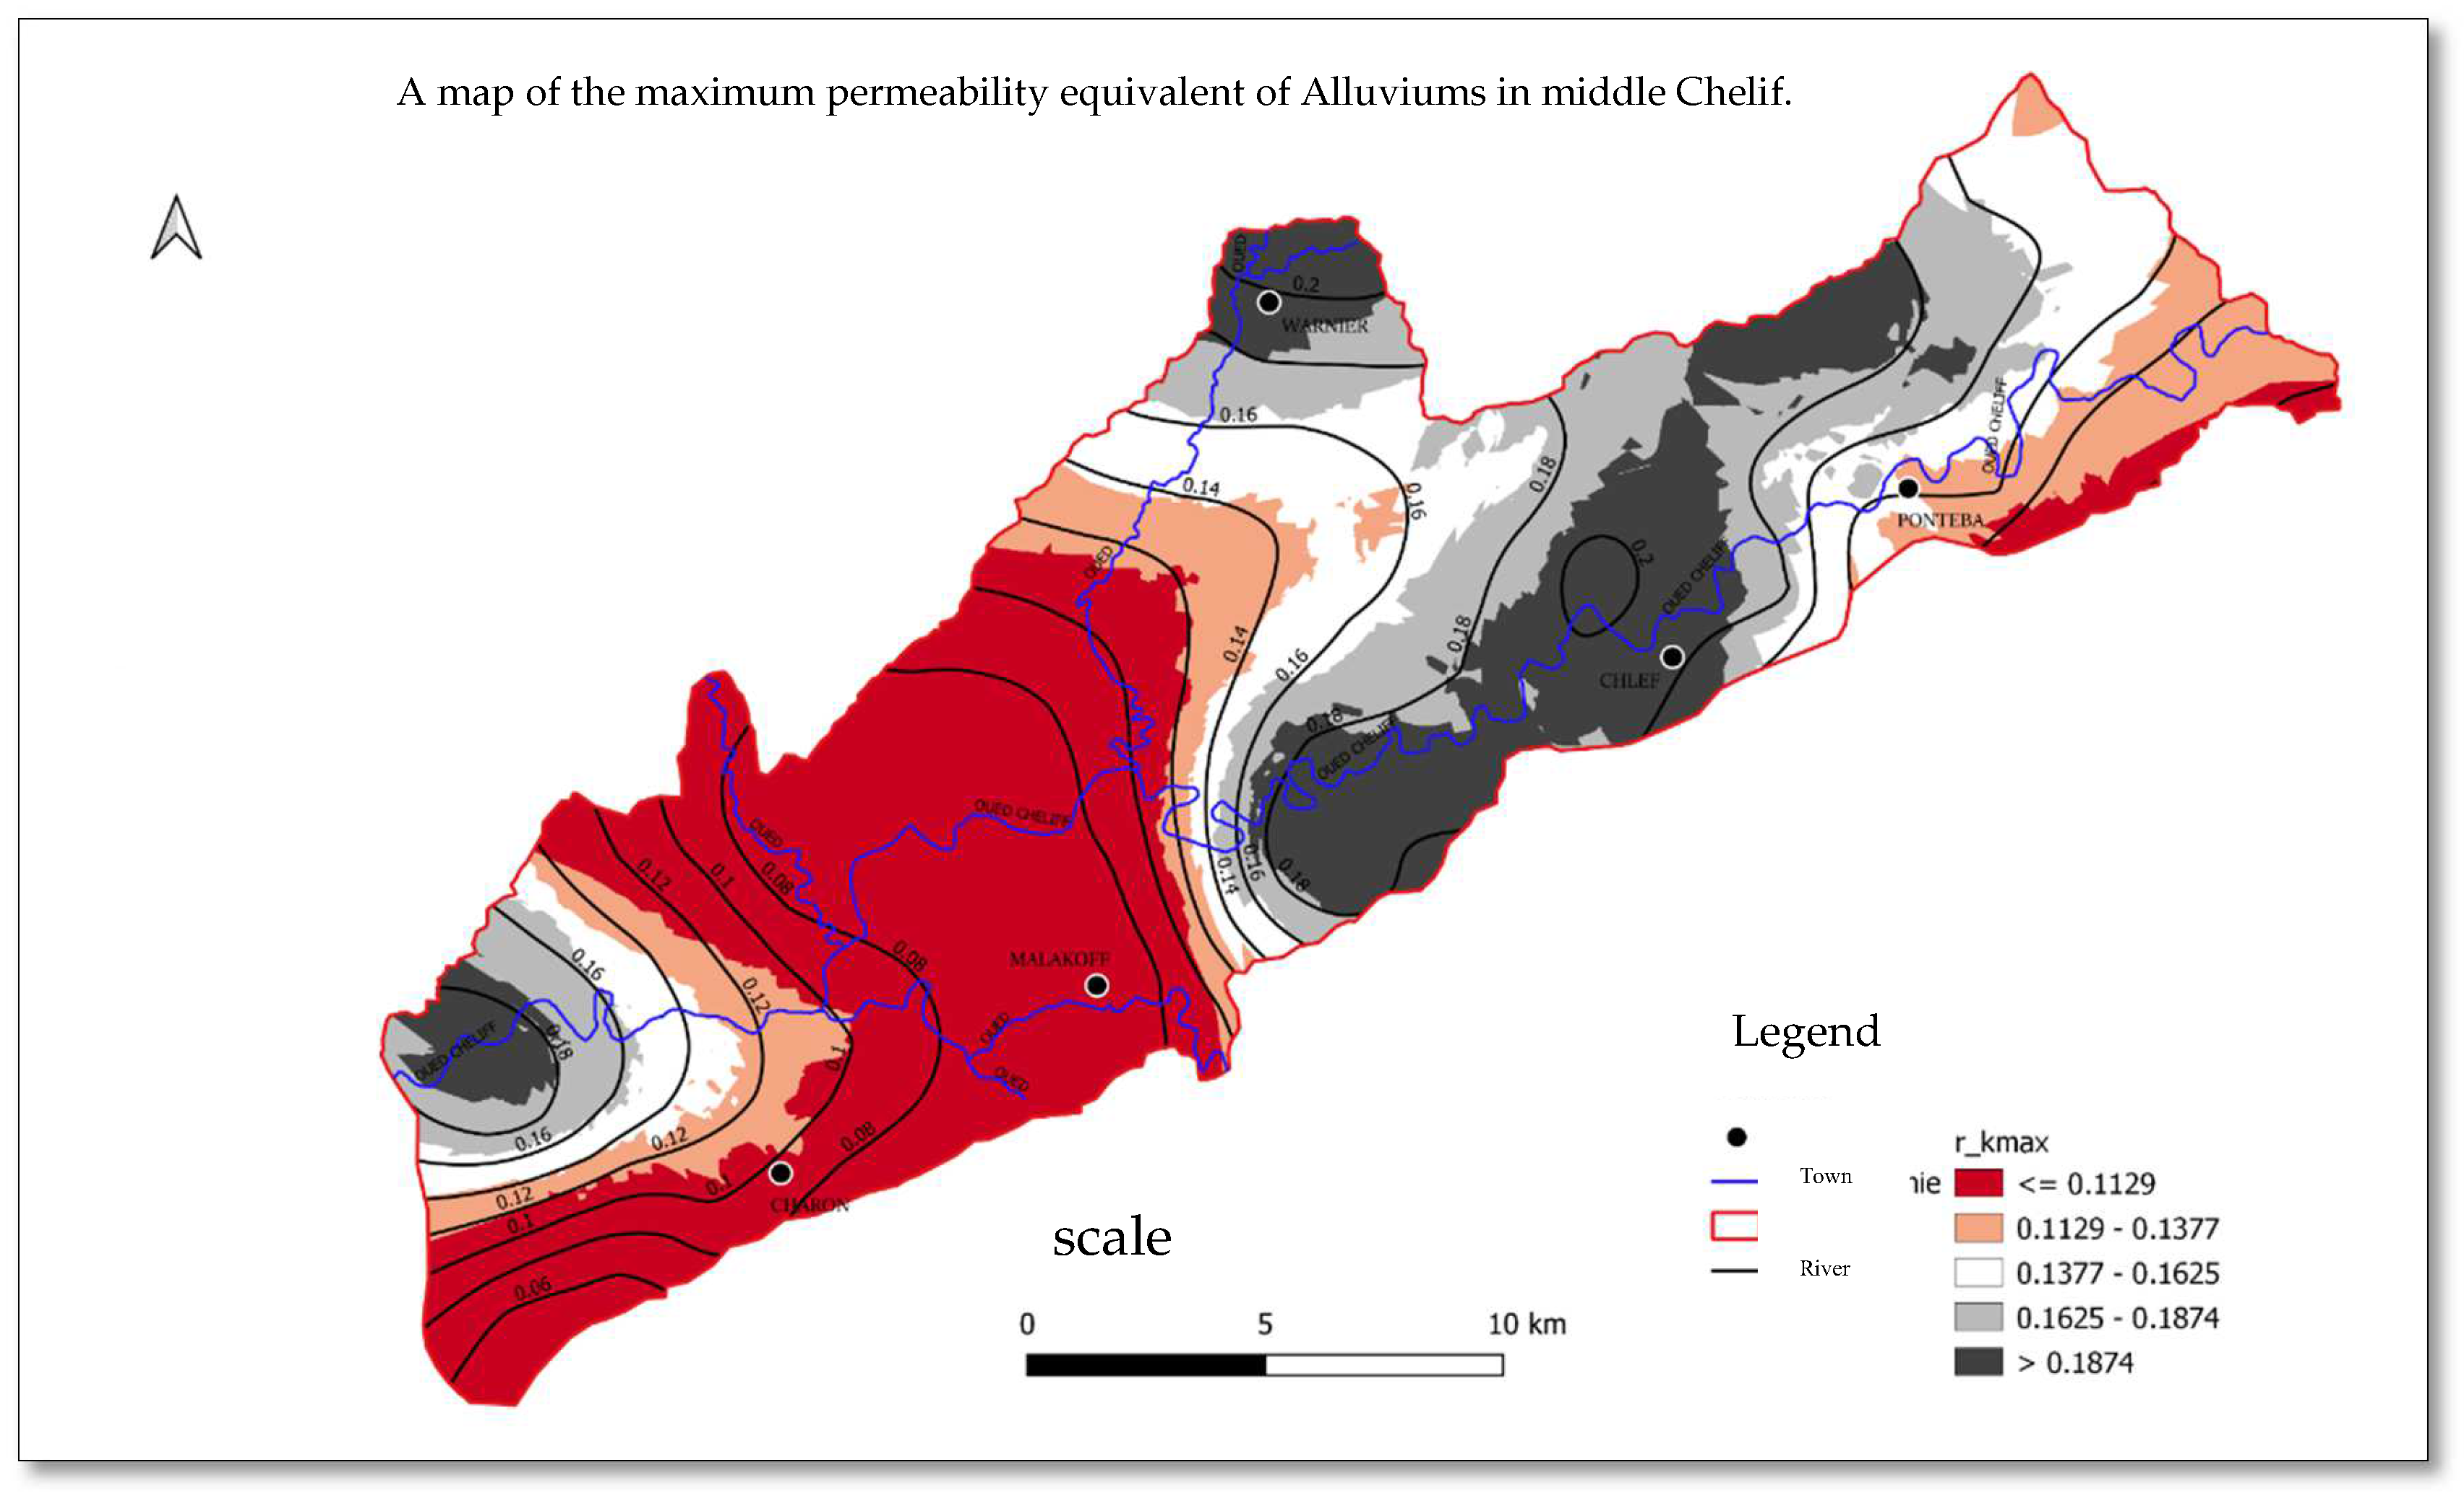
Figure 6.
A map of the repartition of the average permeability equivalent of middle Chelif alluviums.
Figure 6.
A map of the repartition of the average permeability equivalent of middle Chelif alluviums.
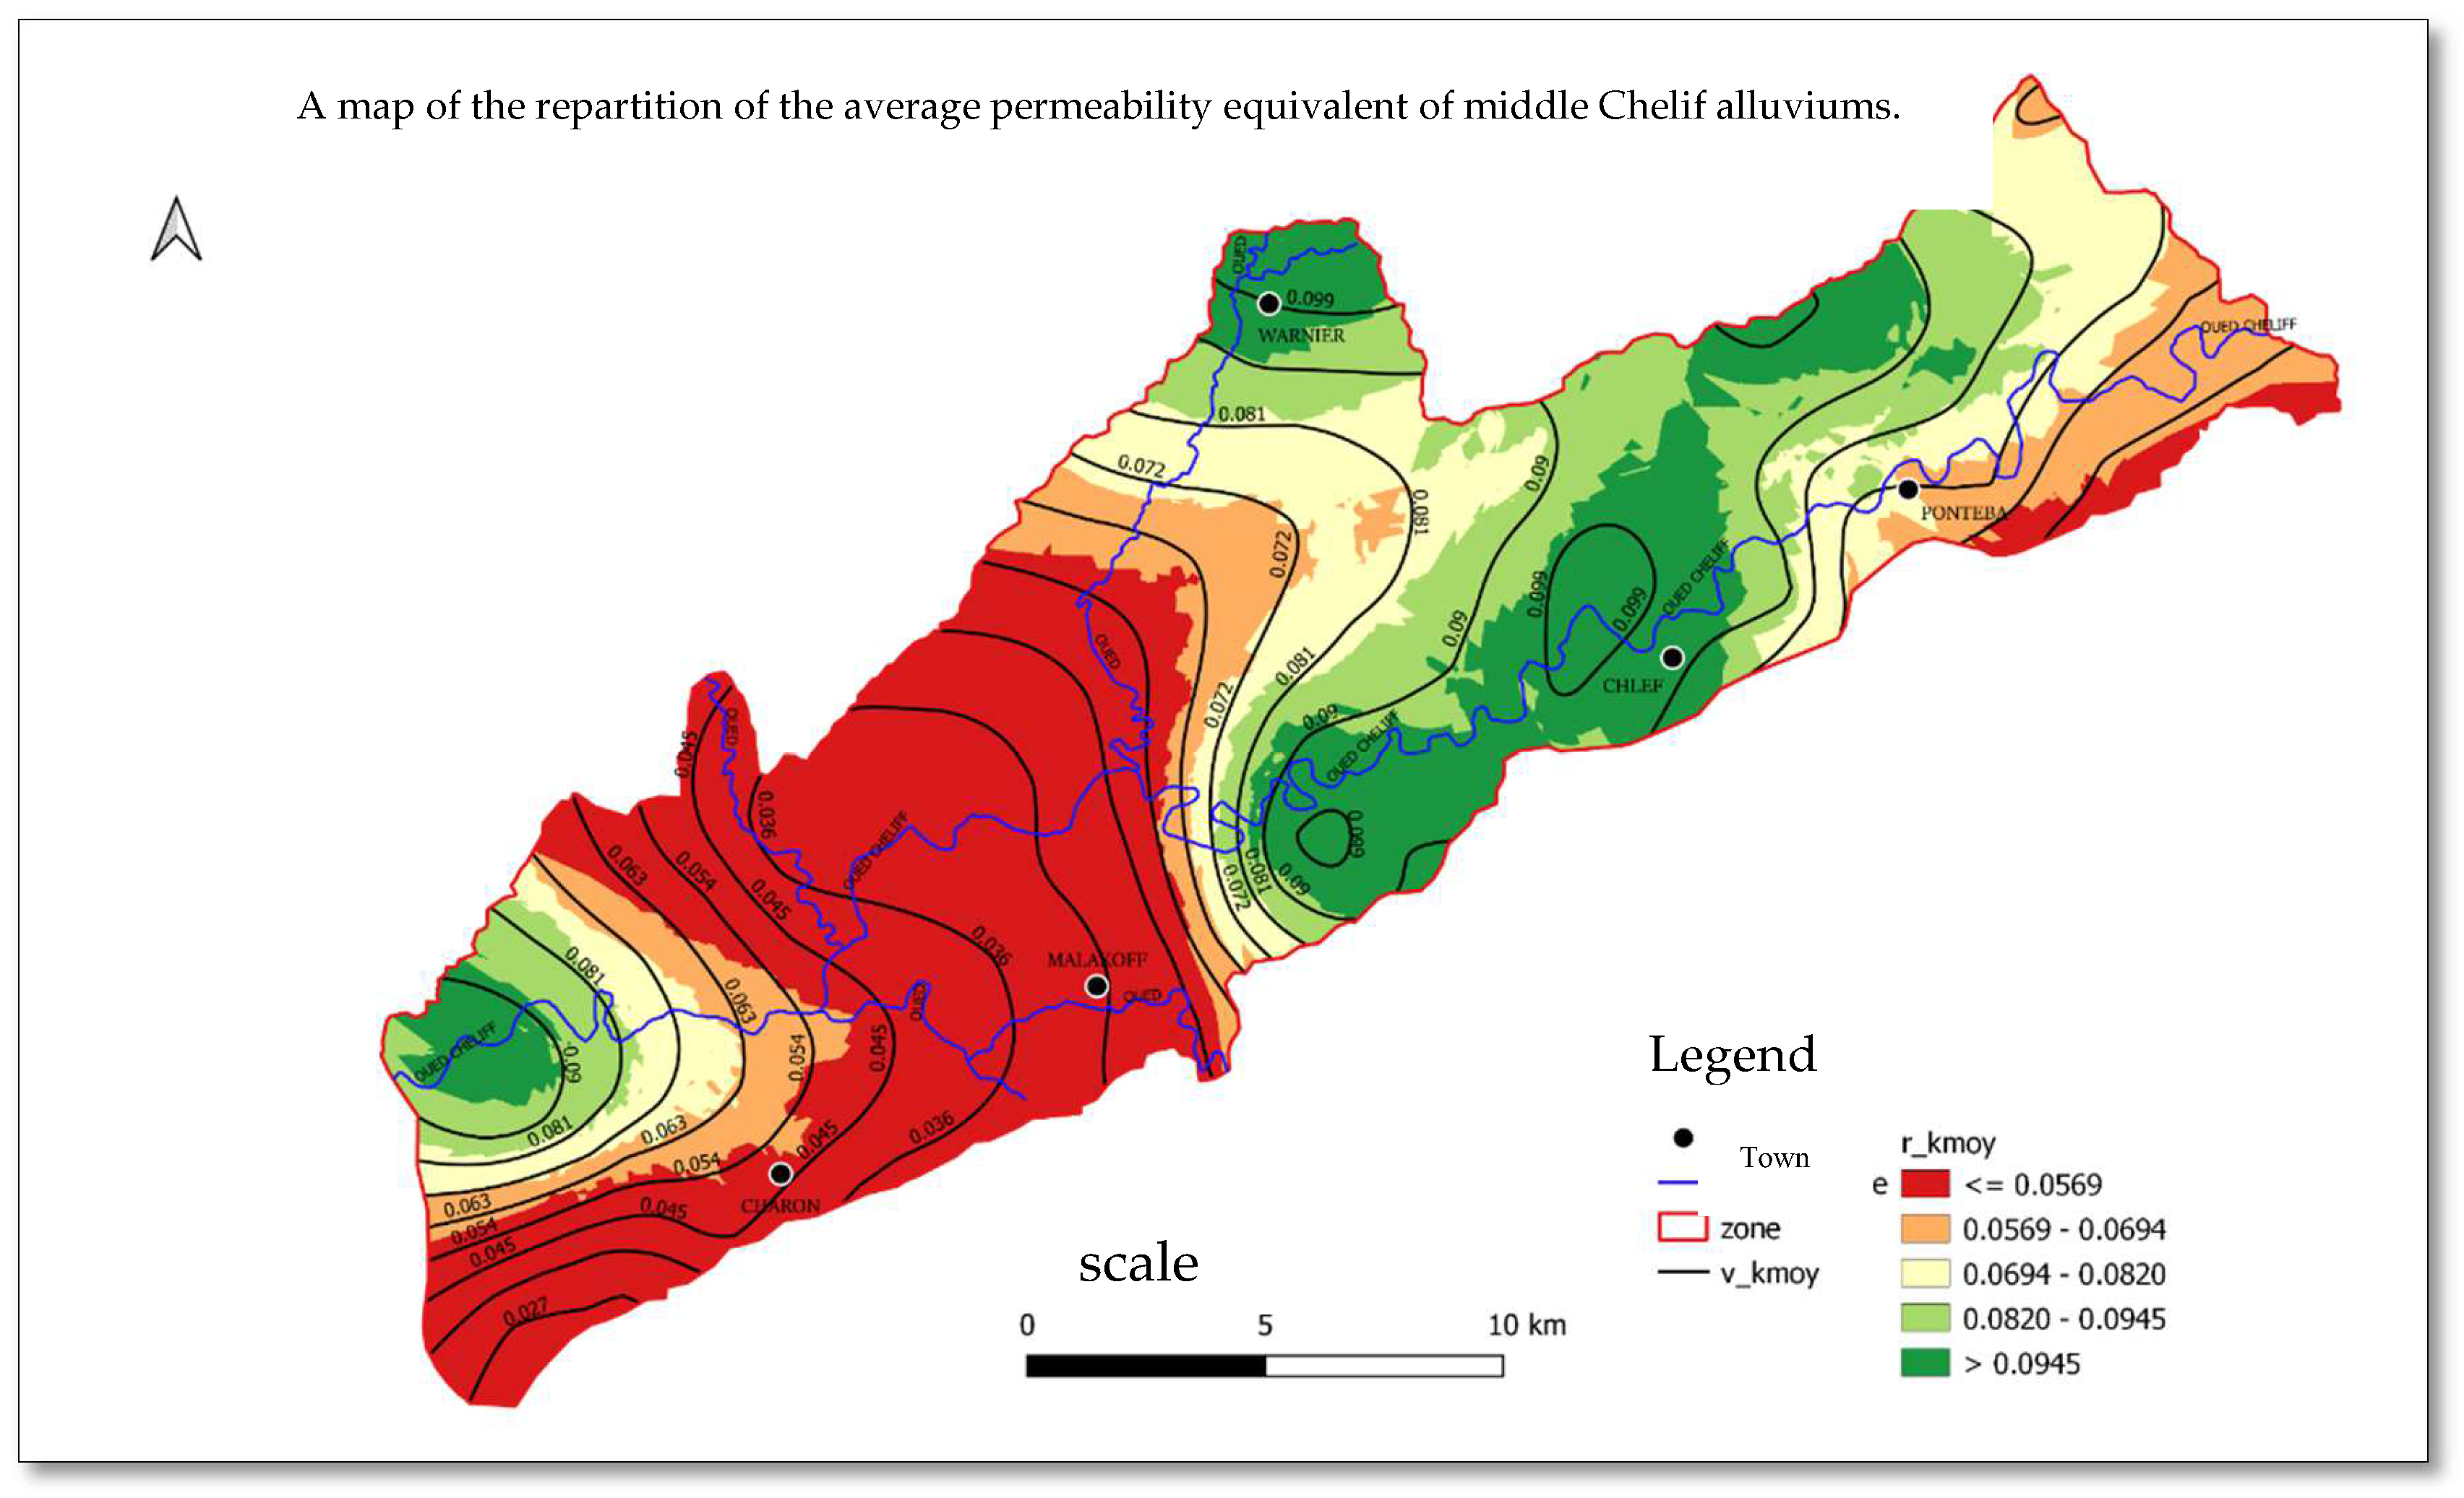
Figure 7.
A map showing the repartition of the median permeability equivalent for middle Chelif alluviums.
Figure 7.
A map showing the repartition of the median permeability equivalent for middle Chelif alluviums.
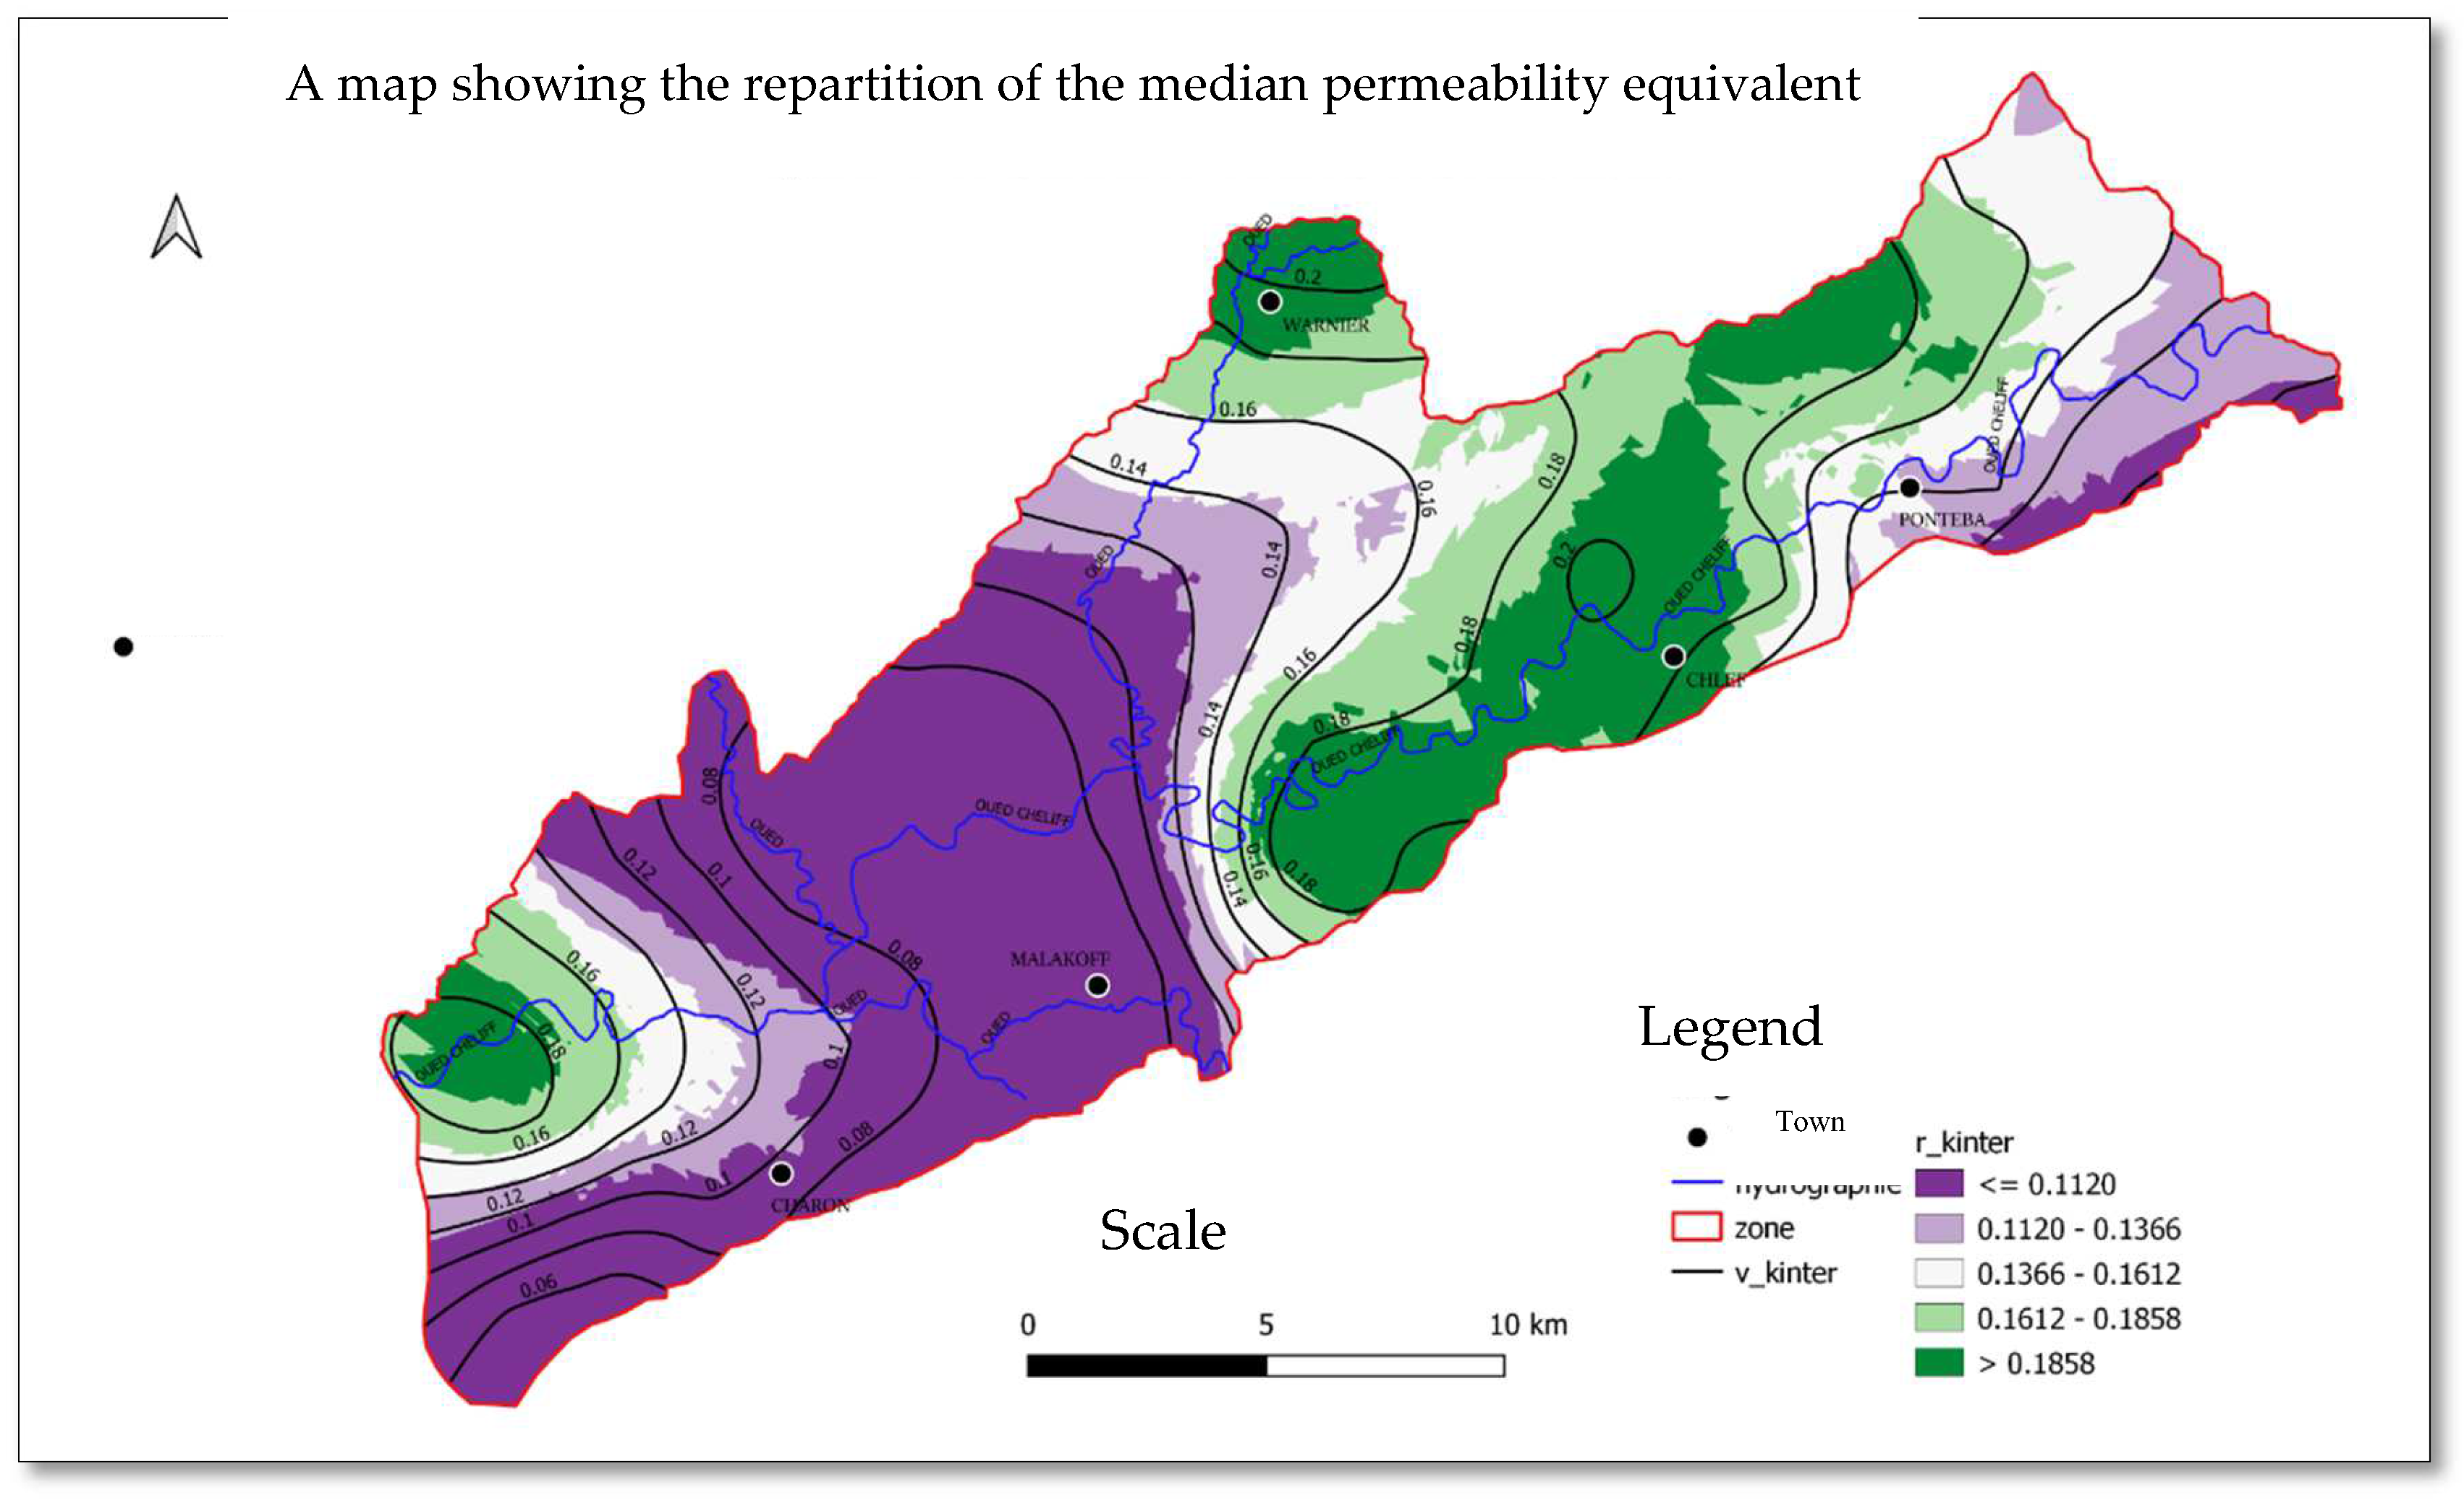
Figure 8.
A map showing the repartition of the minimal transmissivity equivalent for middle Chelif alluviums.
Figure 8.
A map showing the repartition of the minimal transmissivity equivalent for middle Chelif alluviums.

Figure 9.
A map showing the repartition of the maximum transmissivity equivalent for middle Chelif alluviums.
Figure 9.
A map showing the repartition of the maximum transmissivity equivalent for middle Chelif alluviums.
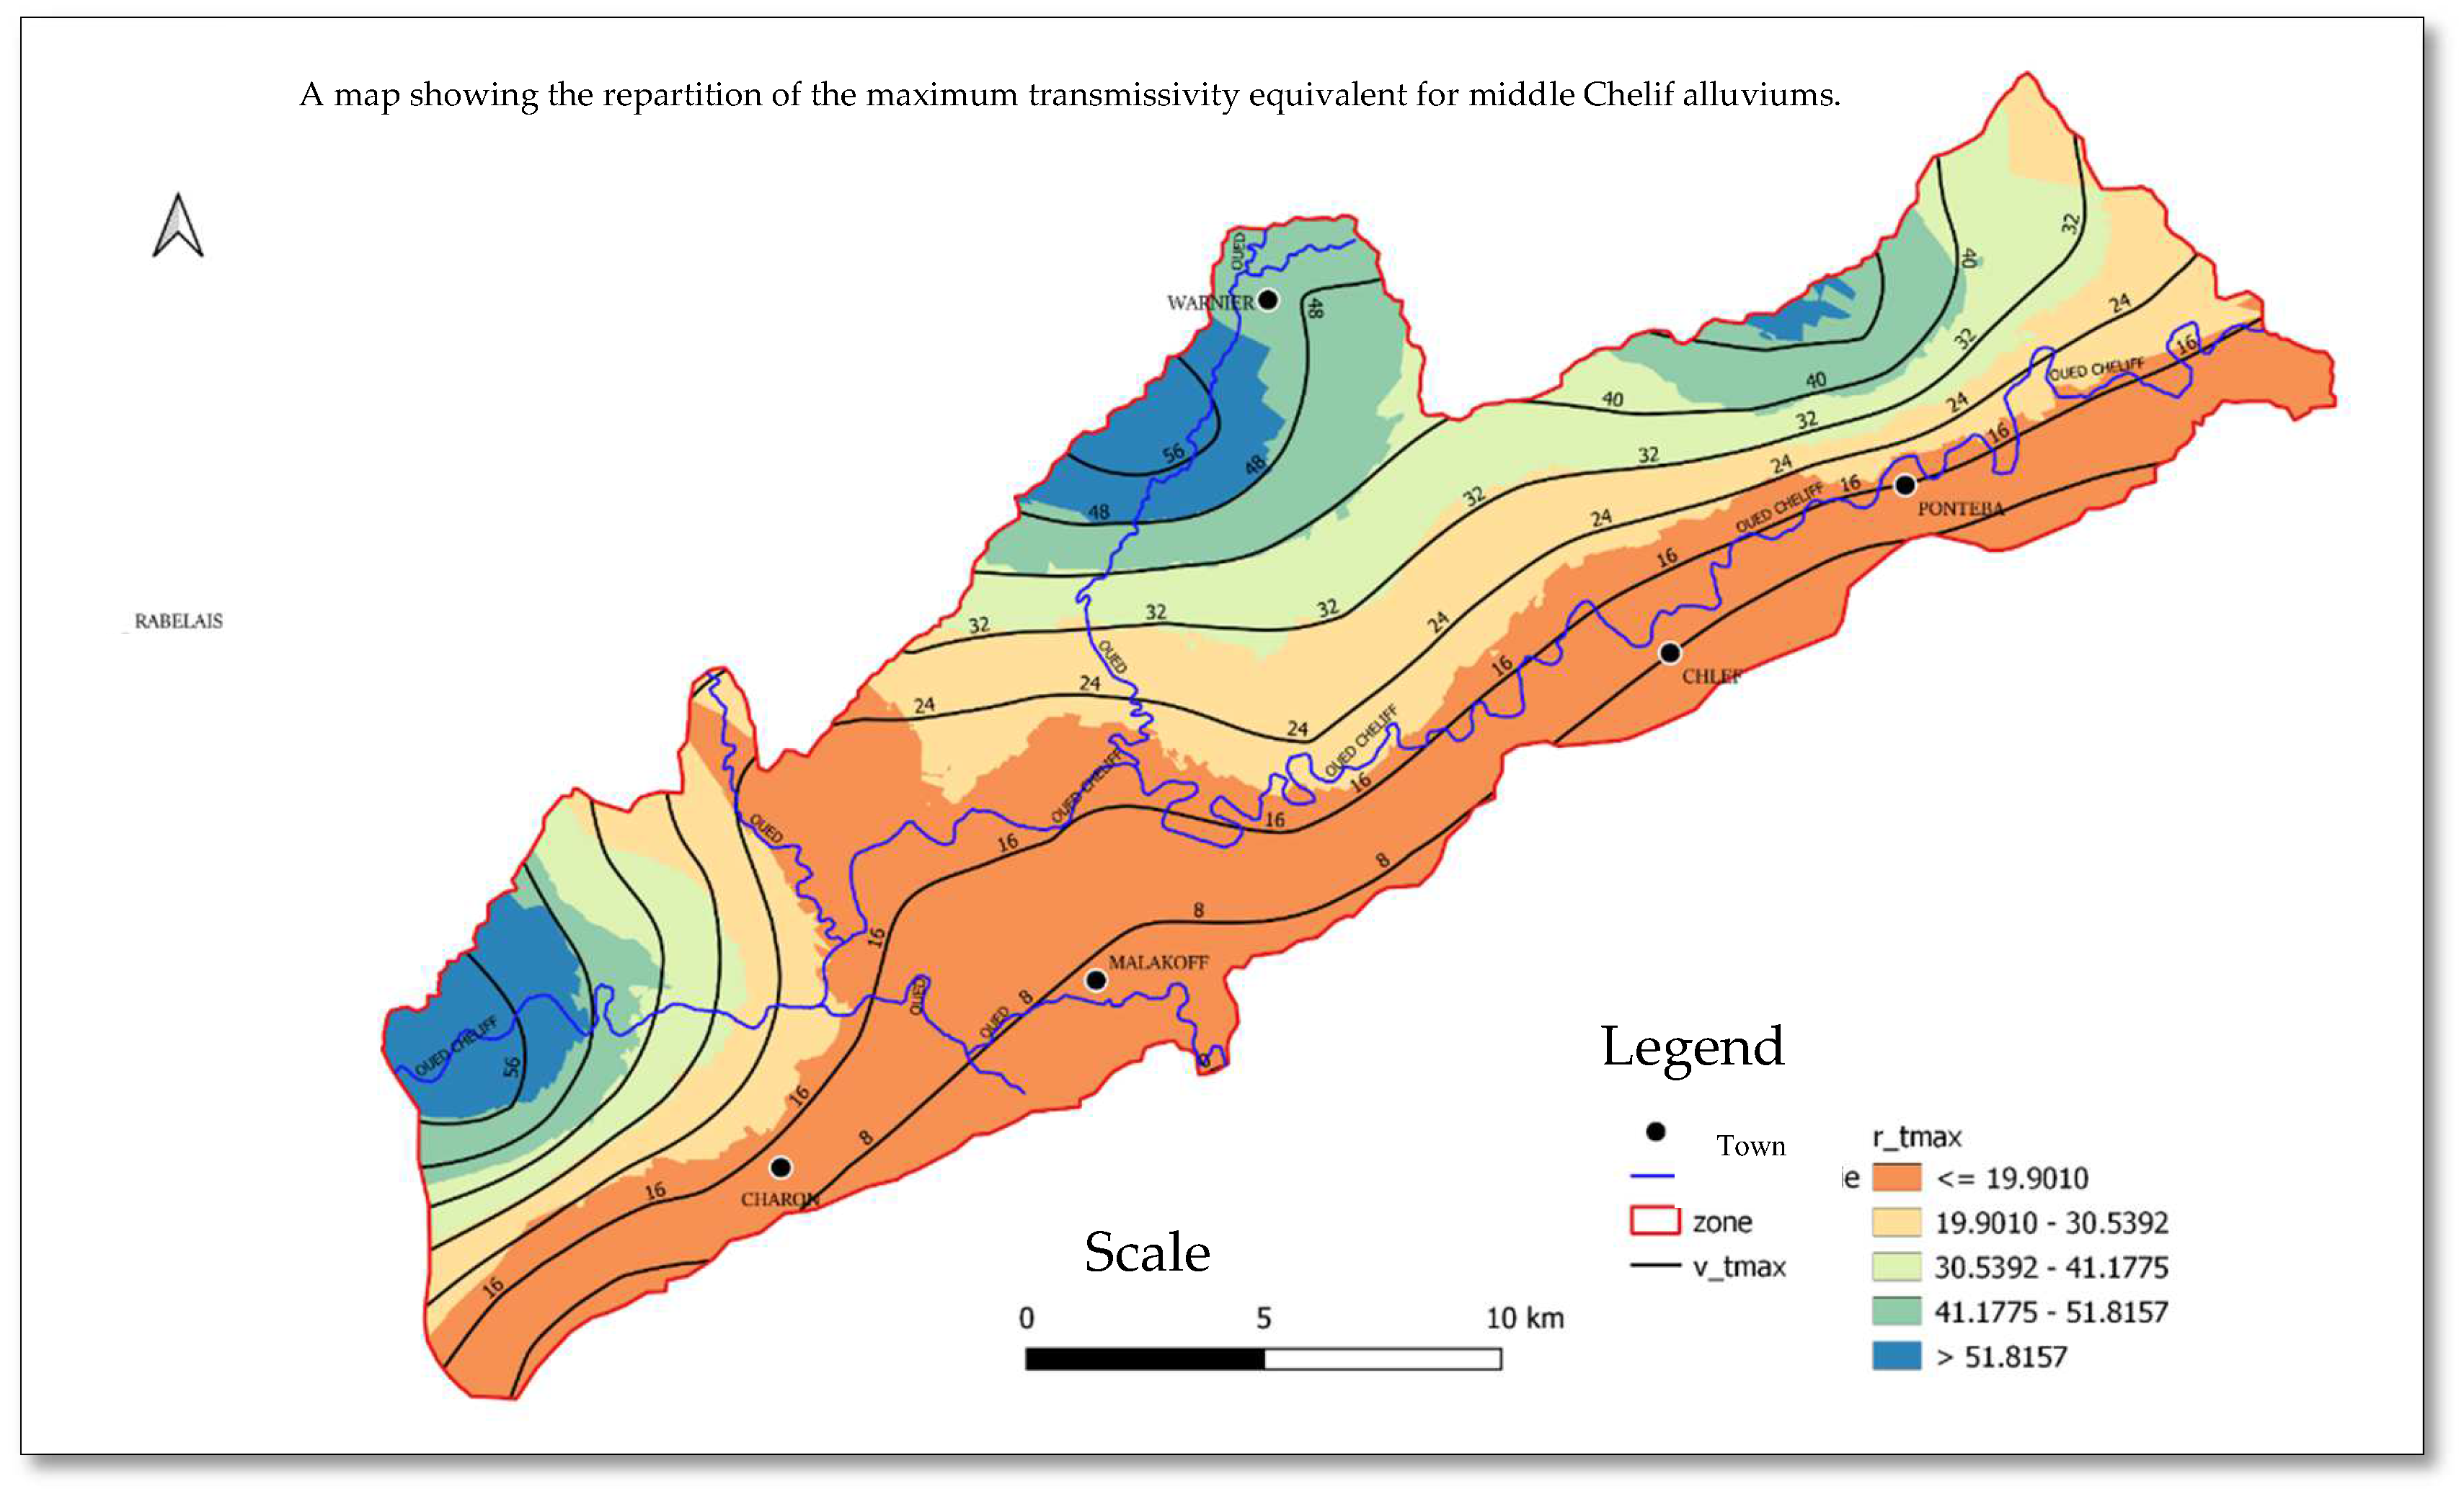
Figure 10.
A map showing the repartition of the median transmissivity equivalent for middle Chelif alluviums.
Figure 10.
A map showing the repartition of the median transmissivity equivalent for middle Chelif alluviums.
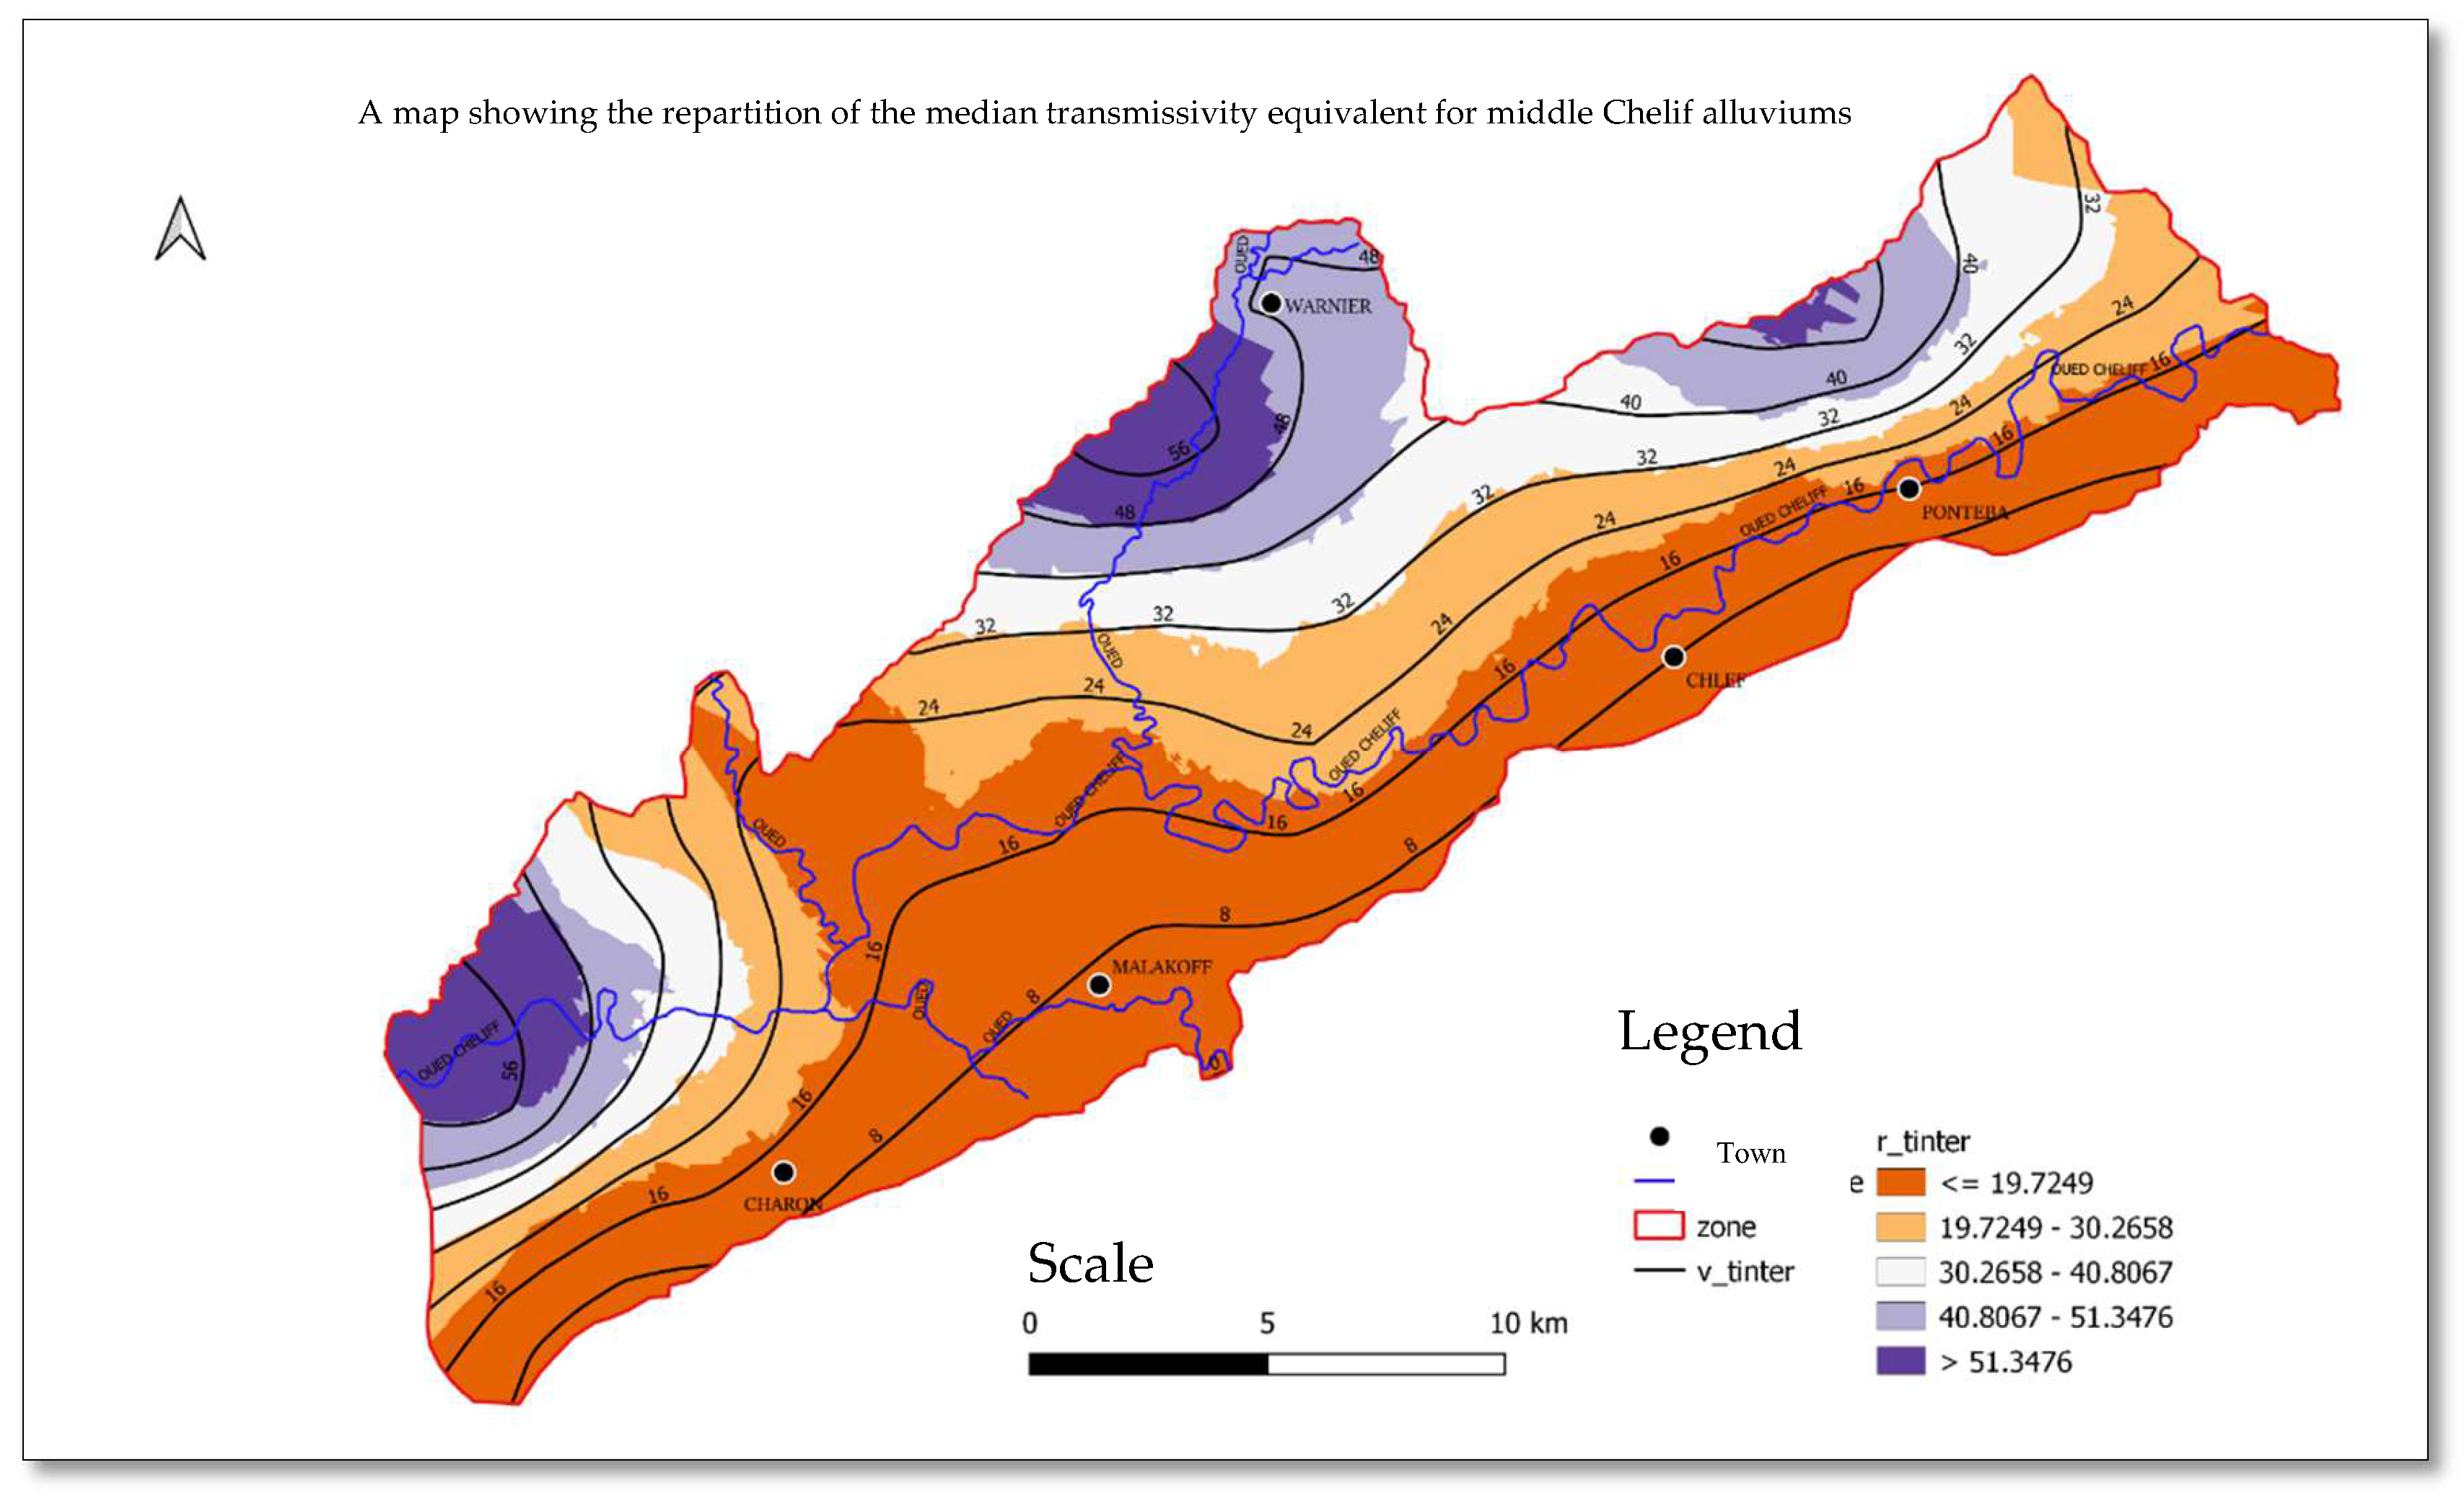
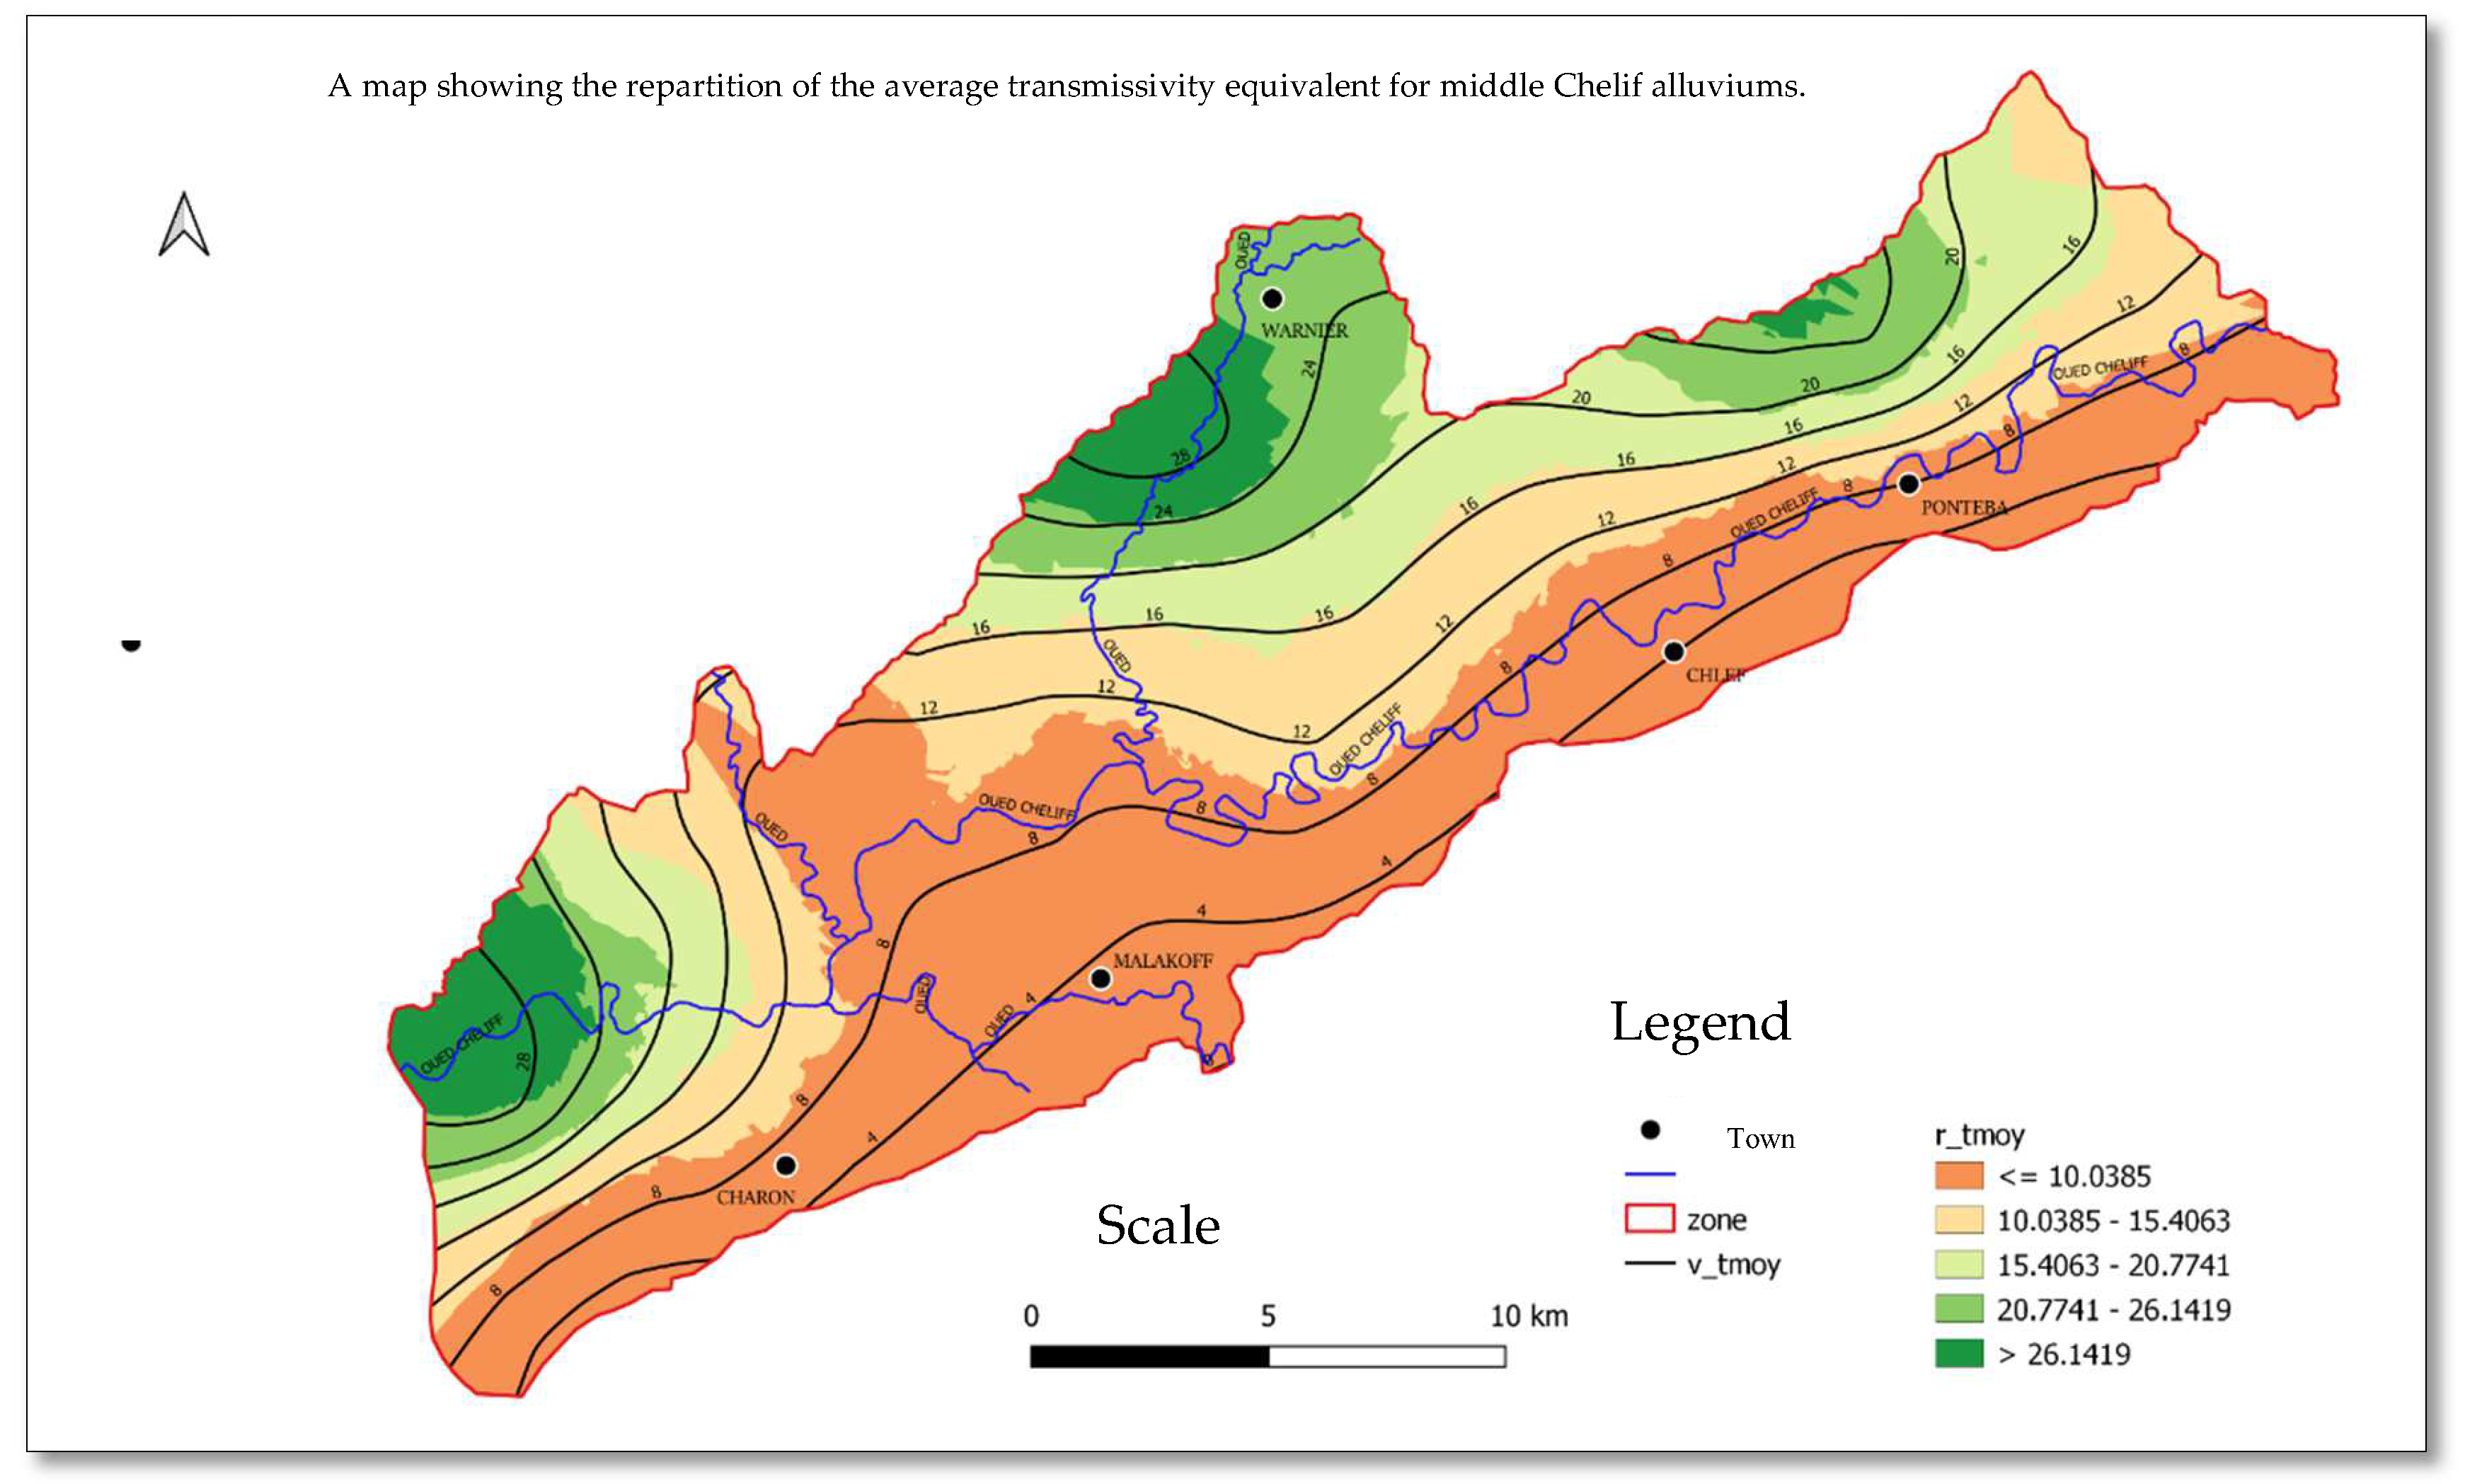
Figure 11.
A map showing the repartition of the average transmissivity equivalent for middle Chelif alluviums.
Figure 11.
A map showing the repartition of the average transmissivity equivalent for middle Chelif alluviums.
Discussion
Interpretation of the Results
A. Interpretation of Maps of the Spatial Distribution of Equivalent Permeability of the Alluvial valley
In the Malakoff, Charon, and southern Ponteba areas, the average permeabilities are the lowest, measuring less than 0.06 m/s. This low permeability is attributed to the thin or nearly absent alluvium of the major bed, which has an average permeability of 2.52×10−22.52×10−2 m/s and a thickness of less than 25 m, along with significant thicknesses of Astian sandstones. In the northwest regions of Charon, as well as south of Warnier and in Ponteba, permeabilities are moderate, ranging from 0.06 to 0.09 m/s. This can be explained by the presence of alluvium with an average thickness between 25 to 32 m, along with substantial thicknesses of Astian sandstones and Villafranchian clays. Conversely, high permeabilities greater than 0.09 m/s are observed in the regions of Warnier, Chlef, and Kherba, where the alluvium of the major bed is significant, exceeding 32 m in thickness.
B. Interpretation of Maps of the Spatial Distribution of Equivalent Transmissivities of Alluvium of middle Chelif
Equivalent transmissivities are low (less than 10 m²/s) in the southern regions of Oued Chélif, including Charon, Malakoff, Chlef, and Ponteba. This low transmissivity is due to a reduced total thickness (less than 60 m²/s) of the aquifer containing the alluvial deposits. In contrast, average transmissivities are noted in the northern areas of Ponteba and Charon. High transmissivities are found in regions such as Warnier, Kherba, and the far north of Ponteba. These areas exhibit greater total thickness accompanied by significant permeability levels.
In this study, we analyzed the hydrogeological parameters derived from various geological layers in the region. The following key findings summarize the permeabilities of these layers:
-
Alluvium of the Major Bed:
- Minimum permeability: 2.75×10−32.75×10−3 m/s
- Maximum permeability: 5.0×10−15.0×10−1 m/s
- Average permeability: 2.52×10−32.52×10−3 m/s
-
Clay-Silty Alluvium:
- Minimum permeability: 5.0×10−105.0×10⁻¹⁰ m/s
- Maximum permeability: 5.0×10−65.0×10−6 m/s
- Average permeability: 2.5×10−62.5×10−6 m/s
-
Pebbles and Limestone Shells:
- Minimum permeability: 5.0×10−85.0×10−8 m/s
- Maximum permeability: 5.0×10−45.0×10−4 m/s
- Average permeability: 2.5×10−42.5×10−4 m/s
-
Villafranchian Clays:
- Minimum permeability: 3.34×10−33.34×10−3 m/s
- Maximum permeability: 3.33×10−13.33×10−1 m/s
- Average permeability: 1.68×10−11.68×10−1 m/s
-
Villafranchian Silts:
- Minimum permeability: 3.34×10−73.34×10−7 m/s
- Maximum permeability: 3.37×10−43.37×10−4 m/s
- Average permeability: 1.69×10−41.69×10−4 m/s
-
Astian Sandstones:
- Minimum permeability: 5.5×10−65.5×10−6 m/s
- Maximum permeability: 5.5×10−45.5×10−4 m/s
- Average permeability: 2.78×10−102.78×10⁻¹⁰ m/s
VI. Conclusion
The equivalent permeabilities calculated in this study are influenced by the permeabilities of these geological layers and their respective thicknesses. Furthermore, the equivalent transmissivities are determined by both the equivalent permeabilities and the total thickness of the geological formations. These findings contribute to a better understanding of the hydrogeological characteristics of the region and highlight the importance of considering both geological properties and layer thicknesses when assessing groundwater flow and management strategies.
Funding
This was master’s degree thesis work that had no funding.
Abbreviations
- National Agency for Hydraulic Resources (ANRH)
- General Company of Geophysics (CGG)
Ethics approval and consent to participate
This study was approved by the Hydrogeology committee of the Department of Geology, FSTGAT-USTHB.
Consent for publication
All Authors agreed to publish this work.
Data Availability Statement
The data is available upon request from National Agency for Hydraulic Resources (ANRH) of Blida, Algeria.
Acknowledgments
We are deeply indebted to the Department of Geology, FSTGAT-USTHB and project support team for their efforts into the success of this project work.
Conflicts of Interest
The authors declare no conflicts of interest.
References
- CASTANY.G, MARGAT.J, 1977. Dictionnaire français d’Hydrogéologie.
- CASTANY. G, 1982. Principe et méthode de 1’Hydrogéologie. Ed Dunod. Paris. France.
- KABOUCHE.O et TOUATI.A, 2000. Etude hydrogéologique et hydrochimiques du Moyen Chélif (Rouina-Oued Rhiou). Néotectonique et vulnérabilité. Mémoire d’ingénieur. Hydrogéologie (USTHB).
- PLEVECHE. G, 1960. Contribution à l’étude géologique de l’Ouarsenis. CGG Algérie occidentale.
- PERRODON. A, 1957. Etude géologique des bassins néogène sublittoraux Algérie occidentale.
- PRADINES. D, 1977. Etude hydrogéologique du Moyen Chélif Occidental.
- GUEBLI Wiam. Hydrogéologie et évolution spatio-temporelle des caractéristiques du Haut et Moyen Chélif sous l’effet de conditions climatiques semi- arides et cartographies hydrogéologiques.
- JOAO Yuri Francisco Miguel et TELA Mariana Matondo Pumba. Contribution à l’étude Hydrogéologique de la région du Moyen Chélif.
- R. ALLAN Freeze and JOHN A Cherry, 1979. Groundwater.
- Arab, M., Bracène, R., Roure, F., Zazoun, R., Mahdjoub, Y., & Badji, R. (2015). Rocks and Related Petroleum Systems of the Chelif Basin, (Western Tellian Domain, North Algeria). Marine and Petroleum Geology, 64, 363–385. [CrossRef]
- Belhadji, A., & Belkebir, L. (2008). Apports des foraminifères planctoniques à la biostratigraphie du Miocène supérieur et du Pliocène de Djebel Diss (bassin du Chélif, Algérie).
- Eluozo, S.; Nwofor, T. Evaluating the Variation of Transmissivity on Groundwater Development in Rivers State. International Journal of Applied Environmental Sciences 2012, 7, 141–147. [Google Scholar]
- Walter, C., McBratney, A. B., Douaoui, A., & Minasny, B. (2001). Spatial prediction of topsoil salinity in the Chelif Valley, Algeria, using local ordinary kriging with local variograms versus whole-area variogram. Soil Research, 39(2), 259. [CrossRef]
Disclaimer/Publisher’s Note: The statements, opinions and data contained in all publications are solely those of the individual author(s) and contributor(s) and not of MDPI and/or the editor(s). MDPI and/or the editor(s) disclaim responsibility for any injury to people or property resulting from any ideas, methods, instructions or products referred to in the content. |
© 2025 by the authors. Licensee MDPI, Basel, Switzerland. This article is an open access article distributed under the terms and conditions of the Creative Commons Attribution (CC BY) license (http://creativecommons.org/licenses/by/4.0/).
Copyright: This open access article is published under a Creative Commons CC BY 4.0 license, which permit the free download, distribution, and reuse, provided that the author and preprint are cited in any reuse.


