
Submitted:
22 April 2025
Posted:
23 April 2025
You are already at the latest version
Abstract
Objectives The chronic kidney disease (CKD) diagnostics consists of three most basic groups of examinations: laboratory tests, radiological imaging and histopathological examinations. In most severe cases when clinical decision is required to be fast and undisputed the histopathological tests are the only examinations capable to fulfill this need. Unfortunately, preforming histopathological test require undertaking kidney biopsy which is invasive procedure excluding numerous patients. The aim of this study is to create algorithm which will be able to divide CKD patients of active and non-active phase on the basis of MRI texture analysis compared with histopathological examinations. Methods The study is based on MRI examinations of healthy volunteers (group 1, N=14) and patients suffering from CKD who were subjects of kidney biopsy. On the basis of histopathological outcome, patients were divided to group with active faze of CKD (group 2, N=58) and non-active faze (group 3, N=22). The T2-weighted images of these examinations were the subject for analysis of Support Vector Machines model created with qMazDa software which was trained to classify images to appropriate group of CKD activity. Results The evaluation metrics calculated for final SVM models corresponding to confusion matrices are as follows: for texture analysis – balanced accuracy 81.6%, sensitivity 68.2-92.0%, specificity 82.5-97.5%, precision 62.5-95.8%; for texture and shape analysis - balanced accuracy 87.3%, sensitivity 77.3-100.0%, specificity 87.5-100.0%, precision 65.4-100.0%. Conclusion Texture analysis of T2 weighted images associated with kidney shape features seem to be reliable method of assessing state of ongoing CKD.
Keywords:
MRI
; magnetic resonance
; texture analysis
; T2-weighted images
; chronic kidney disease
; CKD
Introduction
Chronic kidney disease (CKD) is the outcome of long process deteriorating kidney’s function [1]. The beginning of CKD is caused by single kidney injury that was not possible to overcome with standard healing processes and usually is gradually evolving by constant persistence of pathological factor. Nowadays, the most common causes of CKD is hypertension and diabetes [2,3]. Both of these diseases are modeling kidney microstructure by indicating self-reinforcing mechanism started with hyperfiltration, first one through arteriolar remodeling and second through increasing level of end glycation products, various cytokines and growth factors [4,5,6,7,8,9]. The hyperfiltration leads to thickening of basement membrane, degeneration of podocytes and glomerular remodeling. Eventually, the kidney self-indicates proteinuria and activation of inflammatory cascades leading to its final loss of function by glomerular sclerosis, renal fibrosis and scaring. The described process is constant but of a waving intensity characteristics with active phases mixed with non-active ones. It is crucial for clinical managing to distinguish the beginning of active phase of CKD as it demands fast and intensive pharmacological treatment.
The CKD diagnostics consists of three most basic groups of examinations: laboratory tests, radiological imaging and histopathological examinations [10]. In clinical practice, the laboratory examinations are most widespread and most accessible means of kidney diagnostics providing reliable and current insight into renal function [11]. Also, radiological examinations, most commonly ultrasound, contribute to kidney diagnostics by presenting changes of morphological features like shape, size or cortico-medullary differentiation, which are useful for standard monitoring of CKD [12]. However, in most severe cases when clinical decision is required to be fast and undisputed the histopathological tests are the only examinations capable to fulfill this need. Unfortunately, preforming histopathological test require undertaking kidney biopsy which is invasive procedure burdened with sometimes severe complications and number of contraindications which exclude numerous patients. Fortunately, recent advances in diagnostic imaging, to be more precise in magnetic resonance imaging, gives hope to patients disqualified for invasive procedures, as novel approach to image analysis seems to be reasonable alternative to kidney biopsy in cases where it is encumbered by too much risk [13,14,15].
The aim of this study is to create algorithm which will be able to divide CKD patients of active and non-active phase on the basis of MRI texture analysis compared with histopathological examinations.
Material and Methods
The patients included in this study were of two categories. First one was consisting of healthy volunteers without any known kidney pathology, who had MRI examination proceeded in Radiology Department of our Hospital –named “Group 1”. Second one included consecutive patients suffering from chronic kidney disease admitted to Department of Nephrology of our Hospital who had performed night kidney biopsy and control MRI examination after 24 hours. On a basis of histopathological outcome these patients were divided on two subgroups – with active phase of CKD (Group 2) and with non-active phase of CKD (Group 3). After excluding the examination with poor SNR we included 14 people to group 1, 58 to group 2 and 22 to group 3 – detailed information is included in Table 1.
The patients enrolled to the trial suffered from focal segmental glomerular sclerosis (2 group – 11 patients, 3 group – 7 patients), vasculitis (2 group – 11 patients, 3 group – 1 patients), lupus nephritis (2 group – 7 patients, 3 group - 0 patients), tubulointerstitial nephritis (2 group – 8 patients, 3 group - 1 patients), tubular nephropathy (2 group – 0 patients, 3 group - 1 patients), IgA nephropathy (2 group – 9 patients, 3 group - 2 patients), membranous nephropathy (2 group – 12 patients, 3 group - 0 patients), diabetes related nephropathy (2 group – 0 patients, 3 group - 3 patients), 7 patients had end-stage kidney disease.
All patients had MRI scanning on 3T Magnetom Vida (Siemens Healthcare GmbH, Erlangen, Germany) a day before or day after kidney biopsy. The patients scanned before biopsy had both kidneys included to further analysis whereas only one kidney was added to further trial from patients examined after biopsy. In the MRI examination protocol we included T2-weighted HASTE images with fat saturation (TR= 1350 ms, TE= 80ms, TA= 0.51ms).
Among the first group, there were 11 volunteers. All other subjects were patients routinely qualified for diagnosis. These subjects, according to the approved protocol, underwent biopsy on the left kidney before MR examination. Hence, to exclude the impact of biopsy on the subsequent analyses, only the images of the right kidney were processed. This restriction does not apply to volunteer data, free from artefacts caused by renal tissue samples removal. In order to decrease the class imbalance, both left and right kidney from volunteer acquisitions were analyzed, resulting in 25 images of the normal category available for experimentation.
Our prospective trial was accepted by Bioethical Committee associated with Medical University of Lodz (decision RNN/206/20/KE, dated 08/09/2020).
Texture analysis
All feature extraction methods used in this study are summarized in Table 2. They can be divided into two subgroups. The first group of methods focuses on image texture, whereas the second one concerns the kidney shape. The goal of texture analysis is to extract image features which encapsulate characteristic intensity distribution patterns. There have been established numerous techniques to statistically model first- and higher-order relationships between image pixels. In particular, in this study we utilized statistical descriptors based on histogram, local binary patterns (LBP), grey-level co-occurrence matrix (GLCM), and grey-level run-length matrix (GLRM). Moreover, two other feature subsets were derived from autoregressive model (AR) and Haar wavelet (HW) transform. All computations were performed in the open-source qMaZda software [16], specifically dedicated to image texture analysis. There were 339 texture features determined in total. Please, refer to [17] and qMaZda manual [18] for the detailed definitions of specific TA parameters. qMaZda is equipped with the graphical user interface which, among others, facilitates completion and configuration of the various processing tasks, such as delineation of regions of interest within the image, selection of image cross-sections to be processed, determination of required feature extraction methods, image normalization and discretization.
The feature extraction workflow in our study embraced the following steps. For each subject included in the study, we first selected from the entire 3D volume a middle cross-section of the kidney along the anterior-posterior acquisition axis. Then, a pentagonal region of interest (ROI) was manually drawn over the tissue area directly above the kidney pelvis (cf. Figure 1). The choice of this region for analysis was subject to the fact that it is anatomically most representative and most repetitively represented on MRI images. Also the pentagonal ROI was chosen since it occurred the simplest, yet sufficiently flexible shape adjustable to kidney geometry of an individual subject. Next, pixel intensities within the ROI were normalized to the range defined by this ROI mean intensity and the interval of +/- 3 standard deviations (so-called 3-sigma normalization). The normalization ensures that the computed features are independent from possibly various acquisition settings, scanner parameters drift during equipment lifetime or different measured signal energies resulting from patient-dependent magnetic field perturbations, i.e. all factors which affect final image brightness and contrast. Eventually, the texture analysis was performed within each patient ROI, and the computed feature vectors completed with a category label (1 – normal, 2 – active, 3 – chronic) were stored in an output CSV file.
In addition to texture analysis, we also determined a series of geometrical attributes. These were calculated for a whole 2D shape of the kidney visible in the selected cross-section, i.e. the same slice of the 3D volume as chosen for TA. The set of morphological parameters consisted of 97 features which described kidney shape’s characteristics such as e.g. area, circularity, convexity, principal orientation, contour-skeleton attributes, second order moments of inertia, or perimeter profile attributes. Inclusion of this group of descriptors in the further analysis was motivated by the observation that texture alone does not encapsulate all the differences in tissue appearance wrt. lesion category, and it is the kidney shape which improves performance of the ultimate classification model. As a final remark, please note that each kidney image was represented in the final data set by only one feature vector. Hence, there’s no risk of data leakage while partitioning the vectors into train and test folds during the exploratory analysis.
Exploratory Analysis
The relatively large number of extracted features – textural and geometrical ones – poses the problem of developing a complex classification rule in a very high dimensional space. Such complexity makes a classifier prone to overfitting. Therefore, before proceeding to training stage, it is crucial to perform dimensionality reduction, either through feature selection or transformation. In this study we followed the former approach, since we aimed at identification of specific texture model and geometrical parameters capable of distinguishing renal tissue states. For that purpose we utilized a so-called wrapper strategy. Its two main components are: the algorithm of feature space exploration which constructs consecutive feature subsets candidates, and a classifier employed to evaluate discriminative power of those candidates.
In our experiments, feature space exploration was accomplished using the linear floating forward selection method [19], as implemented in Weka [20] software. Essentially, this search strategy adds subsequent features to a currently selected subset based on their impact on the final classification accuracy, defined as the fraction of all true positive detections out of the total number of data vectors. Here, it must be noted that this simple accuracy metric provides reliable classifier evaluation only in case of uniform class distribution. However, due to the limitation of Weka, this evaluation measure cannot be changed, e.g. to balanced accuracy, which in principle should be used in case of uneven class sizes. Therefore, during the feature selection stage, we subsampled the dataset to contain equal number of feature vectors in each category (i.e. 20 samples per class).
At each step of feature space exploration, the obtained accuracy is recorded for future comparisons. Then, the algorithm can optionally take steps backward provided that after adding new features, removal of some previously selected ones increases the evaluation score at lower dimensionality. The algorithm terminates when the score does not improve after a predefined number of forward selection steps d, set to 10 in our experiments. Note, that is this setting the final data dimensionality n results from the optimal classifier performance and cannot be assumed a priori.
As regards the classification algorithm, we chose Support Vector Machines (SVM) both for features evaluation and as a final classifier model. This choice was due to the robustness of SVM to problems of class-imbalance, overfitting and outliers, as well as because of its inherent capability to model non-linear separating hypersurfaces while maintaining clean, linearized formulation [21]. The latter is obtained by substituting the dot product used in the linear setting with a non-linear kernel function. It implicitly transforms the data into an unknown space of higher dimension, where the class separating boundary becomes linear. One of the popular kernels, chosen also for our experiments, is the radial basis function defined as
where, xi and xj denote data vectors, ||.|| is the l2-norm, and y is the kernel parameter which controls the rate of non-linearity introduced to the transformation. Another parameter of SVM, usually designated with letter C, relaxes the constraints imposed on the optimization criterion to allow a certain number of training points violate the decision boundary. This mechanism ensures better model generalization to new data. A common heuristic used to set the value of y parameter is to adjust it to the data dimensionality, i.e. y = 1/n. Both, during the feature selection and final classifier training stages we adopted this approach and also set C = 1. SVM was evaluated in 5-fold cross-validation mode to enable objective verification of a given feature subset saliency.
After feature selection stage, the final classifier model was trained, now using all available data. Also, in this stage, we tested the final classifier using the 5-fold cross-validation method. In order to ensure that features with various value ranges have equal impact on the data similarity metric, all attributes where standardized, so that their mean = 0 and standard deviation = 1. Data standardization was executed both before feature selection and classifier training. Eventually, instead of simple accuracy metric, we now evaluated the classification performance using the balanced variant of the measure [22]. Additionally, in the following we report also class-wise true positive rate (TPR, sensitivity), true negative rate (TNR, specificity), and precision. To calculate these measures we took all members of a given class as ‘positive’ examples, while all the rest were the ‘negative’ ones.
Results
As a result of the first stage of the experiment, there were identified various subsets of features relevant to renal tissue classification. Table 3 shows the lists of selected features depending on whether the kidney shape attributes were included in the analysis or not. For the meaning of specific feature name, please refer to qMazDa manual [18]. Moreover, Table 4 includes all evaluation metrics calculated for final SVM models corresponding to confusion matrices showed in Figure 2.
Discussion
Currently, available reports suggest that texture analysis T2-weighted images effectively assesses kidney function. However, the approach presented in this article appears to be more clinically practical than that of our predecessors, as it is the only one that allows making clinically significant decisions. After all, in everyday medical practice, assessing kidney function by taking a blood sample for laboratory tests is much easier than performing an MRI scan. On the other hand, MRI is significantly less invasive than performing a diagnostic kidney biopsy.
Modern medicine seeks to minimize the frequency and extent of invasive procedures in both diagnostics and treatment. However, certain invasive procedures, such as biopsies, remain irreplaceable by laboratory tests or imaging studies due to inadequate accuracy. In the context of kidney biopsies, this issue is particularly concerning, as obtaining a histopathological sample may result in dysfunction of the entire organ, often due to vascular complications.
Research into the utility of T2-weighted images for the diagnosis of kidney diseases commenced early with animal models. The group led by Yusa Y et al. [23] developed a protocol utilizing rabbit models to assess changes in signal intensity during renal artery occlusion, identifying the impact of organ hypoperfusion on the prolongation of T2-weighted times. Subsequently, significant alterations in T2 signal intensities in the kidneys were also reported by Pohlmann et al. in an experiment involving 16 rat kidneys with a 9.4T MRI system, by Hueper K et al. [24] in mouse models and Schmidbauer M et al. [25] examining transplanted kidneys in mice. A particularly noteworthy study by Schley G et al. [26] utilized mouse models to establish and confirm relationships between T2-weighted signal intensities and histopathological features of developing chronic kidney disease (CKD), suggesting that T2 times possess greater diagnostic significance in CKD than T1 times. While these results were derived from mouse models, they align with the conclusions of our study.
Despite positive results from animal models, the evaluation of T2-weighted imaging in human subjects remains a rare focus in research. Notably, a study conducted by a team led by Inoue T et al.[27], involving over 140 patients, demonstrates the correlation between renal fibrosis, hypoxia in the kidneys, and the intensity of the T2 signal and ADC maps. The significant contribution of this study lies in the correlation of MR imaging data with histopathological findings, a feature also present in our own research. The literature contains only three reports addressing the role of T2-weighted image textures in diagnosing CKD; however, none of these studies included histopathological examinations of the kidneys, relying solely on GFR results.
Zhang Hao et al. [28] conducted a study involving 55 subjects divided into two groups: healthy volunteers and patients with stage III CKD associated with type II diabetes. All participants underwent magnetic resonance imaging, which included a T2-weighted sequence and Apparent Diffusion Coefficient (ADC) maps. The algorithm developed by the research team effectively distinguished the healthy subjects from the CKD patients, achieving accuracy values nearing 90%, based on three first-order features and eight texture features derived from the T2-weighted images and ADC maps. While this study addresses a slightly different facet of CKD progression, emphasizing the decline in kidney function, it confirms the hypothesis that microstructural changes responsible for kidney damage are reflected in the texture of kidney imaging.
A study examining kidney function was conducted also by Grzywińska M et al.,[29] who assessed textures concerning GFR levels in a limited cohort of 9 patients following kidney transplantation. While their findings support the correlation between textures and kidney function, caution is warranted due to the small sample size and the use of non-dedicated imaging protocols.
The most recent study on MRI texture analysis of the kidneys was conducted by Yuki Hara et al.[30] This study is the closest to ours among those available in the literature, as the authors evaluated the ability of texture analysis algorithms applied to T1-Dixon and T2*-weighted images, as well as ADC maps, to differentiate between healthy individuals and patients with moderate and severe CKD. The highest discriminative ability was observed in combinatory algorithms, although our algorithm appears to be more effective. In our opinion, this may be related not so much to the algorithm’s design as to the method of patient group classification. Our classification is based on histopathological assessment of existing microstructural changes in the kidneys, whereas in the study by Yuki Hara et al.[30], although the patients showed clinical symptoms of kidney failure at various stages, they might not yet have developed sufficiently advanced alterations in the renal matrix.
Our study had two main limitations moderate number of patients and unbalanced distribution to groups.
Texture analysis of T2 weighted images associated with kidney shape features seem to be reliable method of assessing state of ongoing CKD.
Author Contributions
Conceptualization - MM, IK, AK; Data curation - MM, KS; Formal analysis - MM, AK; Funding acquisition - IK, LS; Investigation - MM, IK, AK; Methodology - MM, IK, AK; Project administration - MM; Resources - MM, KS, IK; Software - MM, AK; Supervision - LS, IK; Validation - MM, AK; Visualization - MM, AK; Writing – original draft - MM; Writing – review and editing - MM, AK, IK.
Funding
This research received no external funding.
Institutional Review Board Statement
The study was conducted in accordance with the Declaration of Helsinki, and the protocol was approved by the Ethics Committee associated with Medical University of Lodz (decision RNN/206/20/KE, dated 08/09/2020).
Informed Consent Statement
Written informed consent has been obtained from the patient(s) to publish this paper.
Data Availability Statement
Source code is available upon request to interested researchers from corresponding author.
Conflicts of Interest
The authors declare no conflict of interest.
References
- Sato, Y.; Takahashi, M.; Yanagita, M. Pathophysiology of AKI to CKD progression. Semin. Nephrol. 2020, 40, 206–215. [CrossRef]
- Hill, N.R.; Fatoba, S.T.; Oke, J.L.; Hirst, J.A.; O’Callaghan, C.A.; Lasserson, D.S.; Hobbs, F.D.R. Global Prevalence of Chronic Kidney Disease – A Systematic Review and Meta-Analysis. PLoS One 2016, 11, e0158765. [CrossRef]
- Navaneethan, S.D.; Zoungas, S.; Caramori, M.L.; Chan, J.C.N.; Heerspink, H.J.L.; Hurst, C.; Liew, A.; Michos, E.D.; Olowu, W.A.; Sadusky, T.; et al. Diabetes Management in Chronic Kidney Disease: Synopsis of the KDIGO 2022 Clinical Practice Guideline Update. Ann. Intern. Med. 2023, 176, 381–387. [CrossRef]
- Palm, F.; Nordquist, L. Renal oxidative stress, oxygenation, and hypertension. Am. J. Physiol. Regul. Integr. Comp. Physiol. 2011, 301. [CrossRef]
- Ow, C.P.C.; Ngo, J.P.; Ullah, M.M.; Hilliard, L.M.; Evans, R.G. Renal hypoxia in kidney disease: Cause or consequence? Acta Physiol. (Oxf). 2018, 222. [CrossRef]
- S, Y.; K, F.; S, U.; S, O. Molecular mechanisms of diabetic nephropathy and its therapeutic intervention. Curr. Drug Targets 2007, 8, 952–959. [CrossRef]
- Calabrese, V.; Mancuso, C.; Sapienza, M.; Puleo, E.; Calafato, S.; Cornelius, C.; Finocchiaro, M.; Mangiameli, A.; Di Mauro, M.; Stella, A.M.G.; et al. Oxidative stress and cellular stress response in diabetic nephropathy. Cell Stress Chaperones 2007, 12, 299–306. [CrossRef]
- Zoccali, C.; Vanholder, R.; Massy, Z.A.; Ortiz, A.; Sarafidis, P.; Dekker, F.W.; Fliser, D.; Fouque, D.; Heine, G.H.; Jager, K.J.; et al. The systemic nature of CKD. Nat. Rev. Nephrol. 2017, 13, 344–358. [CrossRef]
- Hauwanga, W.N.; Abdalhamed, T.Y.; Ezike, L.A.; Chukwulebe, I.S.; Oo, K.; Wilfred, A.; Rahman, A.; Khan, A.; Khan, A.; Chukwuwike, J.; et al. The Pathophysiology and Vascular Complications of Diabetes in Chronic Kidney Disease: A Comprehensive Review. Cureus 2024, 16, e76498. [CrossRef]
- Rovin, B.H.; Adler, S.G.; Barratt, J.; Bridoux, F.; Burdge, K.A.; Chan, T.M.; Cook, H.T.; Fervenza, F.C.; Gibson, K.L.; Glassock, R.J.; et al. KDIGO 2021 Clinical Practice Guideline for the Management of Glomerular Diseases. Kidney Int. 2021, 100, S1–S276. [CrossRef]
- Selby, N.M.; Taal, M.W. An updated overview of diabetic nephropathy: Diagnosis, prognosis, treatment goals and latest guidelines. Diabetes. Obes. Metab. 2020, 22 Suppl 1, 3–15. [CrossRef]
- KDIGO 2024 Clinical Practice Guideline for the Evaluation and Management of Chronic Kidney Disease. 2024. [CrossRef]
- Xiong, L.Q.; Ma, L.L.; Shi, L.Y.; Pan, N.N.; Ai, K.; Zhao, J.X.; He, D.L.; Hang, G. Functional magnetic resonance imaging for staging chronic kidney disease: a systematic review and meta-analysis. Int. Urol. Nephrol. 2024, 56, 2971–2981. [CrossRef]
- Zhou, H.; Si, Y.; Sun, J.; Deng, J.; Yang, L.; Tang, Y.; Qin, W. Effectiveness of functional magnetic resonance imaging for early identification of chronic kidney disease: A systematic review and network meta-analysis. Eur. J. Radiol. 2023, 160. [CrossRef]
- Hua, C.; Qiu, L.; Zhou, L.; Zhuang, Y.; Cai, T.; Xu, B.; Hao, S.; Fang, X.; Wang, L.; Jiang, H. Value of multiparametric magnetic resonance imaging for evaluating chronic kidney disease and renal fibrosis. Eur. Radiol. 2023, 33, 5211–5221. [CrossRef]
- Szczypiński, P.M.; Strzelecki, M.; Materka, A.; Klepaczko, A. MaZda—A software package for image texture analysis. Comput. Methods Programs Biomed. 2009, 94, 66–76. [CrossRef]
- Szczypiński, P.M.; Klepaczko, A. MaZda – A Framework for Biomedical Image Texture Analysis and Data Exploration. Biomed. Texture Anal. Fundam. Tools Challenges 2017, 315–347. [CrossRef]
- Szczypiński, P.M. qmazda manual.
- Pudil, P.; Novovičová, J.; Kittler, J. Floating search methods in feature selection. Pattern Recognit. Lett. 1994, 15, 1119–1125. [CrossRef]
- Witten, I.H.; Frank, E.; Hall, M.A. Data Mining: Practical Machine Learning Tools and Techniques, Third Edition. Data Min. Pract. Mach. Learn. Tools Tech. Third Ed. 2011, 1–629. [CrossRef]
- Vapnik, V.N. The Nature of Statistical Learning Theory. Nat. Stat. Learn. Theory 2000. [CrossRef]
- Brodersen, K.H.; Ong, C.S.; Stephan, K.E.; Buhmann, J.M. The balanced accuracy and its posterior distribution. Proc. - Int. Conf. Pattern Recognit. 2010, 3121–3124. [CrossRef]
- Yusa, Y.; Kundel, H.L. Magnetic resonance imaging following unilateral occlusion of the renal circulation in rabbits. Radiology 1985, 154, 151–156. [CrossRef]
- Hueper, K.; Rong, S.; Gutberlet, M.; Hartung, D.; Mengel, M.; Lu, X.; Haller, H.; Wacker, F.; Meier, M.; Gueler, F. T2 relaxation time and apparent diffusion coefficient for noninvasive assessment of renal pathology after acute kidney injury in mice: comparison with histopathology. Invest. Radiol. 2013, 48, 834–842. [CrossRef]
- Schmidbauer, M.; Rong, S.; Gutberlet, M.; Chen, R.; Bräsen, J.H.; Hartung, D.; Meier, M.; Wacker, F.; Haller, H.; Gueler, F.; et al. Diffusion-Weighted Imaging and Mapping of T1 and T2 Relaxation Time for Evaluation of Chronic Renal Allograft Rejection in a Translational Mouse Model. J. Clin. Med. 2021, 10. [CrossRef]
- Schley, G.; Jordan, J.; Ellmann, S.; Rosen, S.; Eckardt, K.U.; Uder, M.; Willam, C.; Bäuerle, T. Multiparametric magnetic resonance imaging of experimental chronic kidney disease: A quantitative correlation study with histology. PLoS One 2018, 13. [CrossRef]
- Inoue, T.; Kozawa, E.; Okada, H.; Inukai, K.; Watanabe, S.; Kikuta, T.; Watanabe, Y.; Takenaka, T.; Katayama, S.; Tanaka, J.; et al. Noninvasive evaluation of kidney hypoxia and fibrosis using magnetic resonance imaging. J. Am. Soc. Nephrol. 2011, 22, 1429–1434. [CrossRef]
- Zhang, H.; Yu, B.; Yang, H.; Ying, H.; Qu, X.; Zhu, L.; Wang, C.; Ding, J. Application of MR Imaging Characteristics in the Differentiation of Renal Changes Between Patients with Stage III Type 2 Diabetic Kidney Disease and Healthy People. Diabetes. Metab. Syndr. Obes. 2023, 16, 2177–2186. [CrossRef]
- Grzywińska, M.; Jankowska, M.; Banach-Ambroziak, E.; Szurowska, E.; Dębska-Ślizień, A. Computation of the Texture Features on T2-Weighted Images as a Novel Method to Assess the Function of the Transplanted Kidney: Primary Research. Transplant. Proc. 2020, 52, 2062–2066. [CrossRef]
- Hara, Y.; Nagawa, K.; Yamamoto, Y.; Inoue, K.; Funakoshi, K.; Inoue, T.; Okada, H.; Ishikawa, M.; Kobayashi, N.; Kozawa, E. The utility of texture analysis of kidney MRI for evaluating renal dysfunction with multiclass classification model. Sci. Rep. 2022, 12, 14776. [CrossRef]
Figure 1.
Example regions of interest for texture and shape analysis.
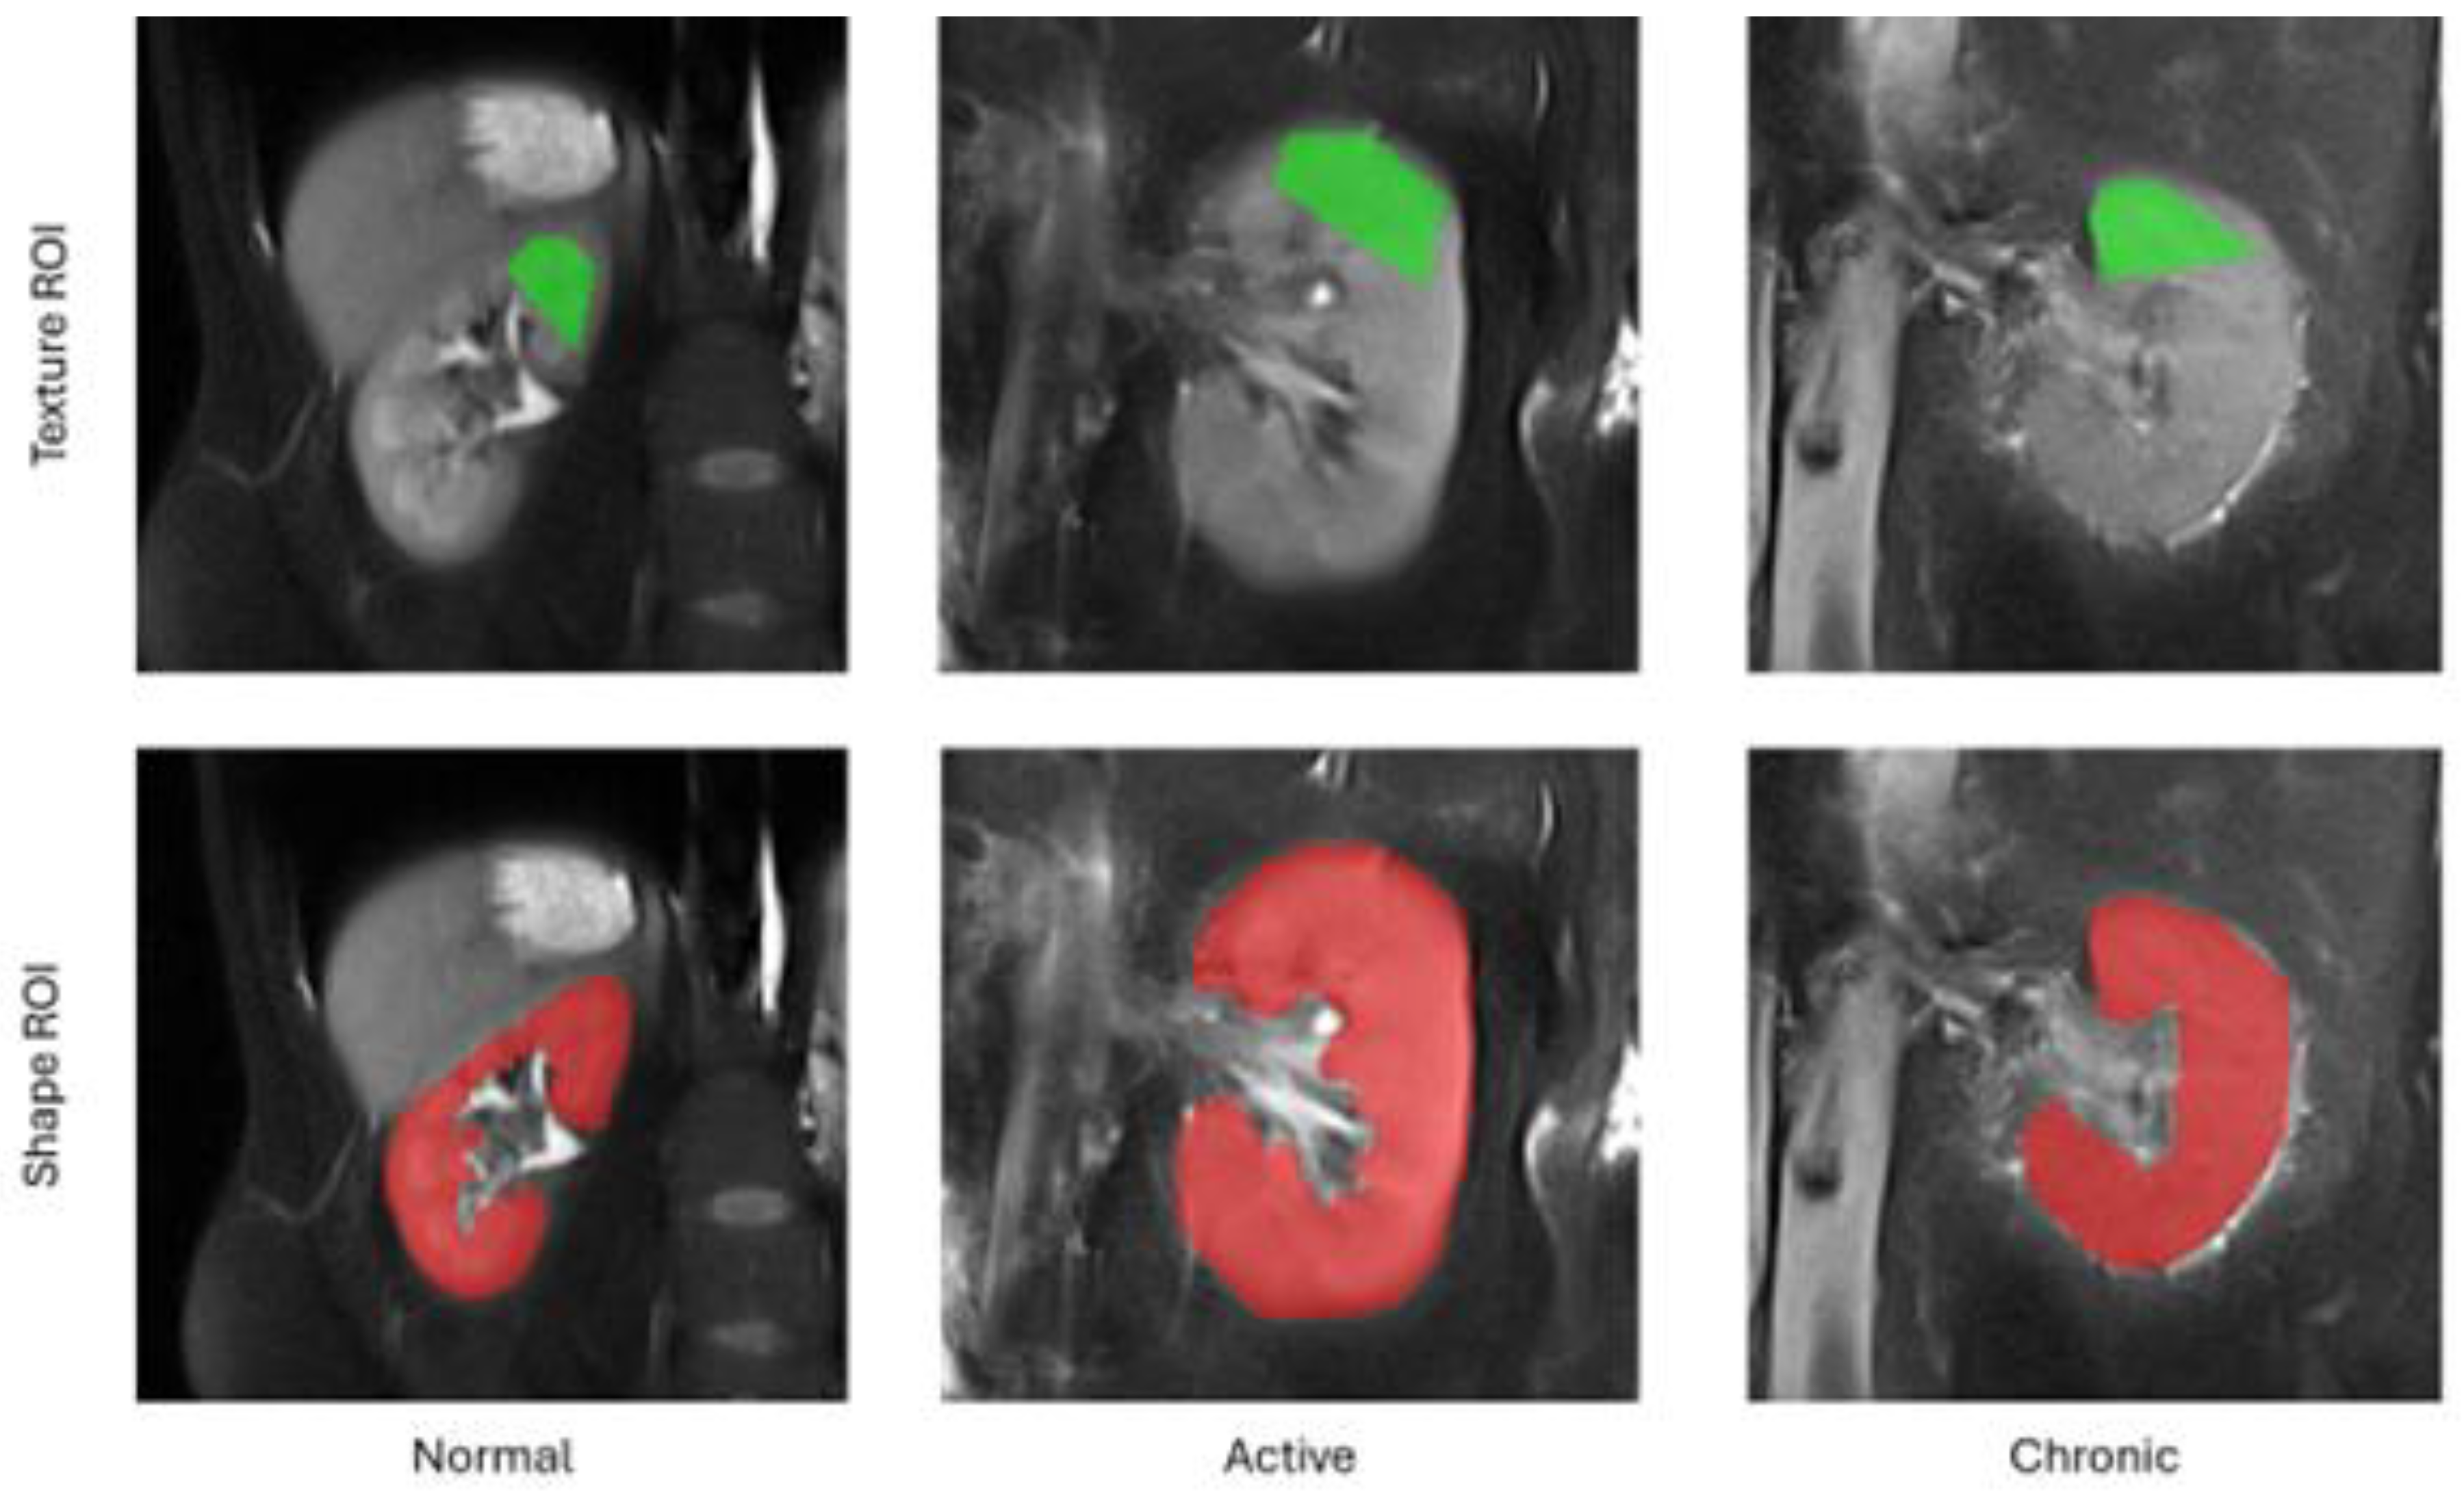
Figure 2.
Confusion matrices obtained for final SVM models (5-fold cross-validation test).
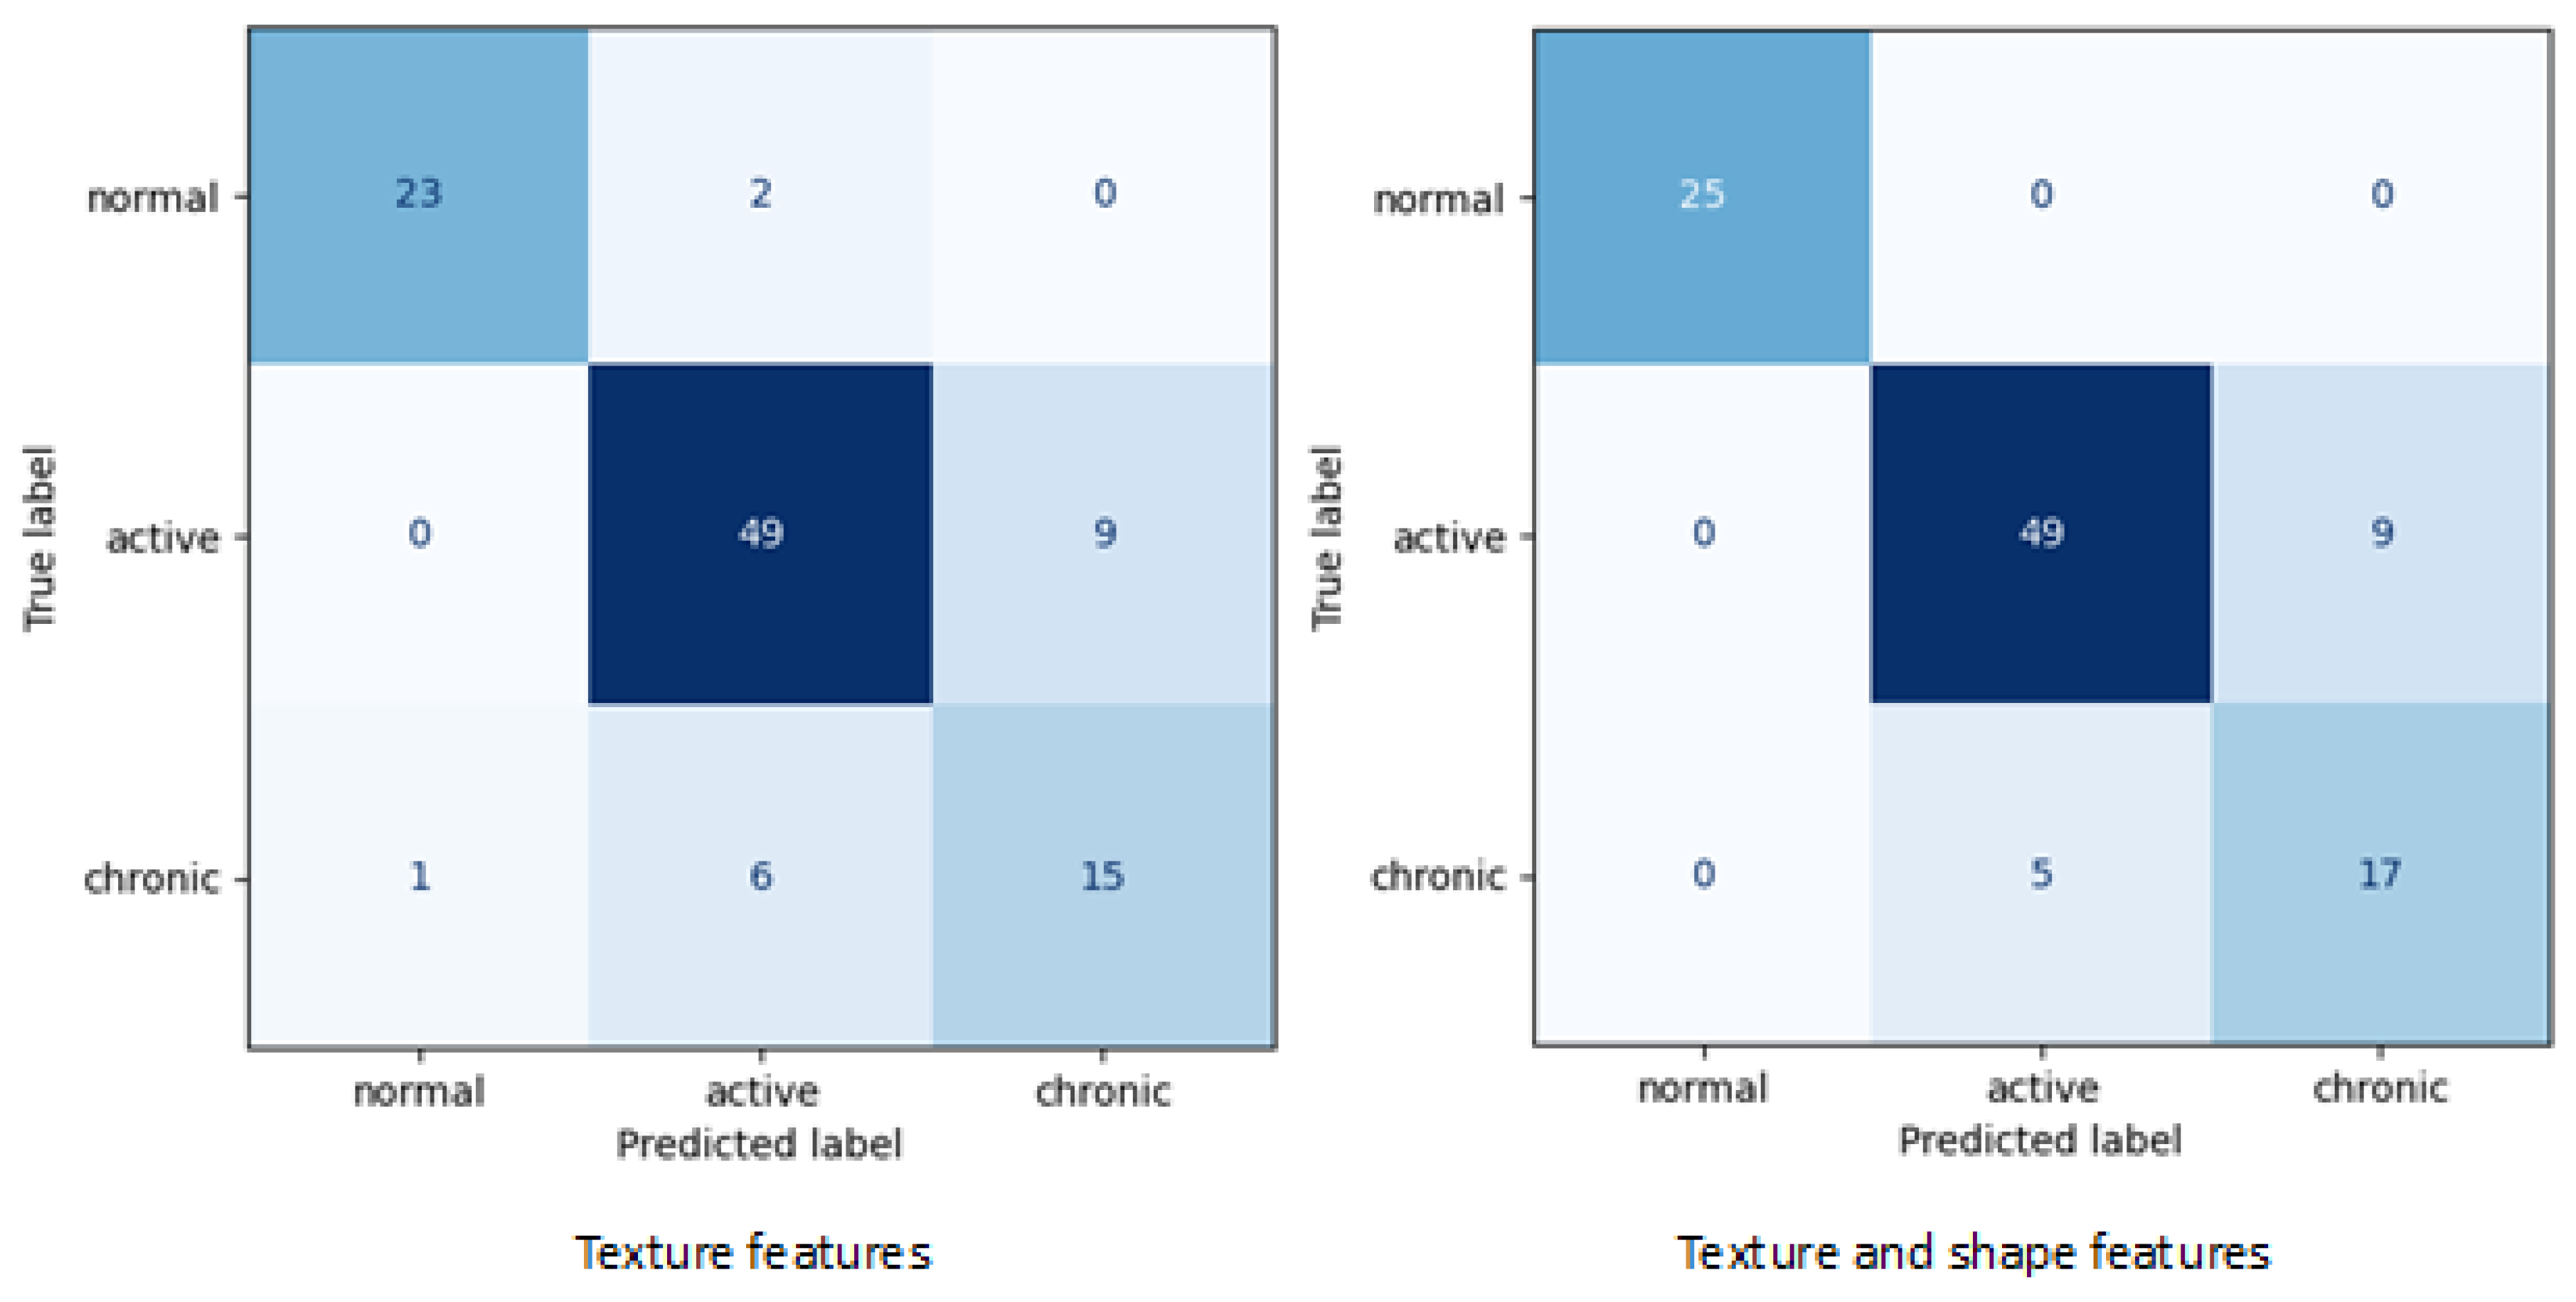

Table 1.
Presentation of patients basic characteristics.
| Group | N | Gender | Mean age (years) |
Mean eGFR | |
|---|---|---|---|---|---|
| Females | Males | ||||
| 1 | 14 | 7 | 7 | 41.42 | 60< |
| 2 | 58 | 31 | 27 | 51.68 | 49.7 |
| 3 | 22 | 10 | 12 | 57.99 | 36.7 |
Table 2.
Summary of feature extraction methods.
| Texture model | Model parameters | Number of features |
|---|---|---|
| Histogram | - | 14 |
| LBP | Type: center-symmetric Neighborhood size: 4 |
4 |
| GLCM | Distances: 1-5 Directions: 0°, 45°, 90°, 135° Type: Symmetrical |
280 |
| GLRM | Directions: 0°, 45°, 90°, 135° | 28 |
| AR | - | 5 |
| HW | Scales: 1, 2 Bands: HH, LH, HL, LL |
8 |
| Shape | - | 97 |
| Total: | 436 |
Table 3.
Selected features depending on involvement of kidney shape characteristic.
| Extraction method | Selected features | Total number of subsets evaluations | Accuracy [%] | |
|---|---|---|---|---|
| Texture analysis | Grey-level co-occurrence matrix |
|
10 939 | 81.8 |
| Local binary patterns |
|
|||
| Texture & shape analysis | Histogram |
|
4 281 | 86.7 |
| Grey-level run-length matrix |
|
|||
| Grey-level co-occurrence matrix |
|
|||
| Local binary patterns |
|
|||
| Shape |
|
|||
Table 4.
Evaluation metrics for final Support Vector Machines model.
| Extraction method | Balanced accuracy | Class | Sensitivity (TPR) | Specificity (TNR) | Precision |
|---|---|---|---|---|---|
| Texture | 81,6 | Normal | 92.0 | 97.5 | 95.8 |
| Active | 84.5 | 82.5 | 86.0 | ||
| Chronic | 68.2 | 92.5 | 62.5 | ||
| Texture & Shape | 87,3 | Normal | 100.0 | 100.0 | 100.0 |
| Active | 84.5 | 87.5 | 90.7 | ||
| Chronic | 77.3 | 92.5 | 65.4 |
Disclaimer/Publisher’s Note: The statements, opinions and data contained in all publications are solely those of the individual author(s) and contributor(s) and not of MDPI and/or the editor(s). MDPI and/or the editor(s) disclaim responsibility for any injury to people or property resulting from any ideas, methods, instructions or products referred to in the content. |
© 2025 by the authors. Licensee MDPI, Basel, Switzerland. This article is an open access article distributed under the terms and conditions of the Creative Commons Attribution (CC BY) license (http://creativecommons.org/licenses/by/4.0/).
Copyright: This open access article is published under a Creative Commons CC BY 4.0 license, which permit the free download, distribution, and reuse, provided that the author and preprint are cited in any reuse.


