Submitted:
22 April 2025
Posted:
23 April 2025
You are already at the latest version
Abstract
Epithelial ovarian cancer (EOC) remains one of the deadliest gynecologic malignancies due to delayed diagnosis and resistance to conventional therapies. Identifying pivotal molecular targets is crucial for advancing therapeutic strategies. This study employed an integrative pipeline combining transcriptomic profiling, protein-protein interaction network analysis, machine learning, and molecular simulations to identify key oncogenic regulators in EOC. CDK1 emerged as a central hub gene, exhibiting strong association with poor prognosis and signaling convergence. CDK1 overexpression correlated with adverse survival outcomes and robust involvement in critical oncogenic pathways. Molecular docking and dynamics simulations assessed the binding efficacy of seven compounds with CDK1 and its regulator WEE1. Naringin, a bioactive flavonoid, demonstrated high-affinity binding, stable complex formation, and minimal toxicity based on ADMET predictions. It effectively targeted both CDK1 and WEE1, inducing structural flexibility conducive to inhibitory function. Our findings establish CDK1 as a high-confidence therapeutic target in EOC and present Naringin as a promising dual-target inhibitor with translational potential. This study underscores the power of computational-experimental integration in accelerating oncology drug discovery.
Keywords:
Epithelial ovarian cancer
; CDK1
; Molecular Docking
; Machine learning
; Microarray Analysis
1. Introduction
Epithelial ovarian cancer (EOC) represents one of the most lethal gynecological malignancies worldwide, with over 90% of ovarian cancer cases originating from the transformation of surface epithelial cells [1]. The lifetime risk of ovarian cancer in women is approximately 1 in 78, with a significant number of cases occurring in women of reproductive age—12.1% of ovarian cancer patients being under 44 years old [2]. Currently, there exists no effective screening tool for the early detection of ovarian cancer, resulting in delayed diagnosis, high mortality rates, and an annual financial burden of $80,000 to $100,000 per patient on healthcare systems [3,4]. This clinical challenge necessitates innovative approaches that integrate advanced computational methodologies with experimental validation to develop novel diagnostic and therapeutic strategies.
Epithelial ovarian cancers are classified into two major types based on their biological behavior and genetic stability. Type I EOCs are relatively indolent tumors often originating from endometriosis or borderline tumors with low malignant potential. In contrast, Type II EOCs are biologically aggressive, exhibiting high metastatic propensity even from small primary lesions [5]. Unlike most human cancers that show decreased differentiation during malignant progression, ovarian cancers paradoxically become more differentiated as the tumor advances. These distinctive characteristic forms the basis for classifying EOCs into subtypes including serous (resembling fallopian tube epithelium, ~80% of all EOCs), endometrioid, mucinous, and clear cell carcinoma [6]. Recent advances in machine learning approaches have facilitated the identification of molecular signatures unique to each subtype, enabling more precise classification and potentially personalized therapeutic strategies [7].
The cell cycle regulatory network plays a crucial role in cancer development and progression, with cyclin-dependent kinase 1 (CDK1) emerging as a pivotal regulator of the G2/M phase transition [8]. Dysregulation of CDK1 activity has been implicated in various malignancies, including ovarian cancer, contributing to uncontrolled cell proliferation and resistance to conventional therapies [9,10]. Despite advances in surgical techniques and chemotherapeutic agents, the five-year survival rate for advanced-stage ovarian cancer remains below 30%, highlighting the urgent need for novel therapeutic strategies targeting key molecular drivers like CDK1 [11]. Molecular dynamics simulations have revolutionized our understanding of protein-ligand interactions, providing unprecedented insights into the structural flexibility and binding mechanisms of potential therapeutic targets such as CDK1, thereby enabling the rational design of targeted inhibitors with enhanced specificity [12].
While several studies have investigated the role of cell cycle regulators in ovarian cancer, there exists a significant knowledge gap regarding the potential of specifically targeting CDK1 in epithelial ovarian cancer. Current treatment approaches primarily focus on platinum-based chemotherapy, which often leads to resistance and treatment failure [13]. Advanced machine learning algorithms applied to large-scale genomic and proteomic datasets have identified complex patterns in gene expression and protein interaction networks that traditional statistical methods might overlook [14]. However, the molecular mechanisms underlying the interaction between CDK1 inhibitors and their target proteins, along with the comparative efficacy of different inhibitor compounds, remain poorly understood, limiting the development of personalized therapeutic strategies for EOC patients [15] .
In this study, we employ an integrated bioinformatics approach to identify differentially expressed genes in EOC, constructing a gene network to elucidate key hub genes with CDK1 emerging as a central player based on network strength analysis. We further investigate the binding similarities and potential interaction modes of seven diverse drug compounds—Adavosertib, Alsterpaullone, Avotaciclib, Fostamatinib, Naringin, Olomoucine, and Seliciclib—with the CDK1 and WEE1 proteins through molecular docking simulations. Our comprehensive analysis, combining gene expression profiling, machine learning techniques, and molecular dynamics, aims to expedite the drug discovery pipeline for EOC and provide a rational framework for identifying and optimizing targeted therapies against CDK1, with the potential to improve clinical outcomes for patients with this devastating malignancy.
2. Results
2.1. Microarray Data Analysis
Gene expression datasets for EOC patient samples (GSE28799) and healthy ovarian epithelial control cells (GSE54388, GSE14407) were obtained from the GEO database for differential expression analysis. Comparative analysis between EOC and normal ovarian epithelial cells identified 2,982 overlapping genes with unique expression patterns for further investigation (Supplementary Figure S1).
2.2. Differential Expression Analysis of CDK1
Box plot analysis revealed distinct data distributions between cancer and control datasets, evidenced by differing median values indicating separate population origins (Figure 1A). Post-normalization, the median of the cancer dataset was adjusted to enhance comparability with control samples, aligning central values across all datasets for more accurate comparative analysis (Figure 1B).
A comprehensive heat map illustrated differential expression patterns of genes across various cancer types according to the TCGA GEPIA database (Figure 1C). Detailed heatmap analysis of tumor versus normal groups revealed elevated expression of TOP2A, CDK1, RRM1, TYMS, RRM2, ANLN, CCNB1, CCNA2, AURKA, CHEK1, and KPNA2 in tumor samples. Conversely, PDGFRA, PTPRC, DCN, VCAM1, BCL2, HLA-DRA, ESR1, SPP1, LUM, and COL11A1 exhibited reduced expression in tumor samples relative to normal tissue (Figure 1D). Genes were categorized as upregulated or downregulated based on fold change magnitude, visualized through stem plot analysis (Figure 1E). Given the significant implications of upregulated genes in tumor progression, these genes became the focus of subsequent investigations.
2.3. Protein-Protein Interaction Network Analysis
To gain comprehensive insight into upregulated gene interactions, 100 genes were analyzed through the STRING database. Cytoscape analysis with the CytoHubba platform highlighted genes based on degree parameter and color intensity. This analysis identified CDK1, TOP2A, CCNA2, CCNB1, AURKA, TYMS, CHEK1, CDC20, RRM2, and KIF23 as having the strongest network connections, with CDK1 demonstrating the highest connectivity degree (Figure 2A). TOP2A exhibited the highest betweenness centrality, followed closely by CDK1. Node coloration representing eigenvector centrality—which evaluates the quality of gene relationships—revealed that CDK1 possessed the highest eigenvector centrality in the network, indicating connections to other highly significant genes. These quantitative findings were visualized in a stacked bar chart (Figure 2B). Multiple hub genes demonstrated strong associations with specific Gene Ontology terms and signaling pathways, suggesting their functional relevance in ovarian cancer progression (Figure 2C). Further network refinement using Gephi software enabled visualization based on eigenvector and betweenness centrality parameters. Node size corresponded to betweenness centrality, reflecting information flow through each gene (Figure 2D). KEGG pathway enrichment analysis revealed that differentially expressed genes primarily participate in cell adhesion and immune-related pathways (Figure 2E), highlighting potential roles in tumor progression and immune modulation. Based on these comprehensive analyses, CDK1 emerged as the most influential gene in the network, warranting further investigation into its role in ovarian epithelial cells.
Differentially expressed genes identified through deep learning approaches were further examined using protein-protein interaction network analysis, confirming CDK1's position as a central hub with extensive connectivity. As illustrated in Figure 3A,B, CDK1 exhibited robust interactions with key cell cycle regulators, including CCNB1, CCNA2, and CDC20.
Functional clustering analysis (Figure 3C) highlighted CDK1's involvement in multiple critical biological processes, including mitosis, DNA replication, apoptosis, and signal transduction. Molecular function analysis (Figure 3D) further emphasized CDK1's association with dominant activities including acetyltransferase activator activity and sequence-specific mRNA binding. Functional categorization (Figure 3E) demonstrated that CDK1-associated genes are predominantly enriched in pathways related to cell division, DNA damage response, and transcriptional regulation, underscoring CDK1's potential as a pivotal therapeutic target.
2.4. Proteomic and Survival Analyses
Kaplan-Meier analysis of the ovarian epithelial cancer dataset revealed that patients with elevated CDK1 expression exhibit significantly poorer overall survival. Differential CDK1 expression levels were associated with a Hazard Ratio (HR) of 1.18 (95% Confidence Interval: 1.03-1.34; log-rank p=0.014) (Figure 4A). The optimal cut-off value distinguishing high from low CDK1 expression was determined through an iterative algorithm that calculated Cox regression values across the range from lowest to upper quartile expression levels. Among multiple cut-off values yielding similarly low p-values, the one corresponding to the highest hazard ratio was selected. The inverse relationship between p-value and hazard ratio in the cut-off value plot indicates that decreased p-values (greater statistical significance) correlate with increased hazard ratios, suggesting stronger association between CDK1 expression and survival outcomes (Figure 4B). Expression analysis using TNMplot.com compared CDK1 levels across normal ovarian tissue (n=46), ovarian cancer tissue (n=744), and ovarian cancer metastases (n=44). Median gene expression in normal tissue was 290.5 (Q1:149, Q3:427), contrasting with 1642 (Q1:800, Q3:2975.5) in tumor tissue and 1475 (Q1:590, Q3:2539.5) in metastatic tissue (p=7.21×10^-21, Kruskal-Wallis test) (Figure 4C). TCGA database analysis via GEPIA2 confirmed significantly higher CDK1 mRNA expression (|Log2FC| ≥0.5) in 426 ovarian epithelial cancer samples compared to 88 normal ovarian epithelial cells (p<0.01) (Figure 4D). Differential expression analysis across three datasets consistently identified CDC20 and CDK1 as upregulated, with 1366 differentially expressed genes commonly shared among GSE30219, GSE33532, and GSE19188, indicating robust cross-dataset expression pattern overlap (Figure 4E).
Body map analysis using the GEPIA database determined that while CDK1 mRNA exhibits higher expression in blood of healthy individuals, it shows significantly elevated expression in ovarian tissue of tumor patients. Protein Atlas database analysis revealed prominent CDK1 expression in both nucleoplasm and cytosol. Immunostaining with the HPA003387 antibody effectively detected CDK1 in A-431 and U-251MG cell lines, though expression was not detected in the U2OS cell line with the same antibody (Figure 5).
2.5. Molecular Docking Simulation
The functional pathway of CDK1 was examined as a primary target for anti-cancer drug development. Table 1 presents comprehensive molecular docking results obtained from AutoDock Vina, including binding affinity (kcal/mol) and binding site data for both CDK1 and WEE1 proteins, complemented by PLIP server analysis of hydrophobic interactions, hydrogen bonds, and salt bridges.
The binding of Alsterpaullone, Avotaciclib, Fostamatinib, Olomoucine, Seliciclib, and Naringin to CDK1 protein (PDB ID: 4Y72) at the TYR15 site was found to promote CDK1 phosphorylation, effectively halting the cell cycle at the G2-M phase and preventing unregulated cancer cell proliferation. Additionally, binding of Adavosertib, Alsterpaullone, Avotaciclib, Fostamatinib, and Naringin to the WEE1 protein (PDB ID: 8BJU) at ASN376 or CYS379 sites facilitated CDK1 phosphorylation, inducing cell growth arrest. A binding affinity cutoff of -5 kcal/mol was established for significance, with asterisks (*) indicating cases where acceptable binding at the target site was not established.
Figure 6A illustrates the functional relationship between CDK1 and WEE1 proteins, while docking results for Naringin with CDK1 and WEE1 proteins are presented in Figure 6B,D, respectively. The three-dimensional structure of Naringin is shown in Figure 6C, with two-dimensional structures of all selected drugs presented in Figure 6E.
2.6. Molecular Dynamics Analysis
The RMSD plot (Figure 7A) demonstrated that CDK1 maintained structural stability throughout the 100 ns simulation in both control and Naringin-bound states, though slightly higher RMSD values in the Naringin-bound state indicated induced flexibility that remained within a stable range. Ligand RMSD (Figure 7B) remained consistent throughout the trajectory, confirming stable interaction within the CDK1 binding pocket. Radius of gyration analysis (Figure 7C) showed minimal fluctuation in both systems, confirming preserved structural compactness and integrity. RMSF analysis (Figure 7D) indicated similar fluctuation patterns in both systems, with slightly elevated mobility in loop regions upon Naringin binding. These molecular dynamics parameters collectively demonstrate that Naringin forms a stable complex with CDK1, inducing mild local flexibility without causing major structural disruptions. This stability supports Naringin's potential inhibitory activity and reinforces its candidacy as a promising therapeutic agent.
2.7. Pharmacokinetic Property Analysis
Comprehensive analysis using the AdmetSAR database provided valuable pharmacokinetic insights for the selected compounds (Table 2). Adavosertib, Alsterpaullone, Avotaciclib, Fostamatinib, and Naringin exhibited subcellular localization in mitochondria, while Seliciclib localized to lysosomes and Olomoucine to the nucleus. All compounds maintained AlogP indices within the acceptable range (-4 to 8.33). All compounds except Fostamatinib and Naringin demonstrated blood-brain barrier permeability. AMES mutagenicity was observed in Alsterpaullone and Olomoucine. All compounds except Olomoucine and Naringin showed positive human oral bioavailability, indicating effective absorption, metabolism, blood level maintenance, and renal elimination. Nephrotoxicity was observed in Alsterpaullone, Avotaciclib, and Fostamatinib, while hepatotoxicity was associated with Adavosertib, Alsterpaullone, Avotaciclib, Fostamatinib, and Olomoucine. Alsterpaullone, Avotaciclib, Fostamatinib, and Naringin demonstrated acceptable inhibitory effects on both CDK1 and WEE1 proteins, suggesting potential for synergistic control of cancer cell proliferation. Among these compounds, Naringin emerged as particularly promising due to its dual-target efficacy combined with favorable safety profile, including negative indicators for blood-brain barrier penetration, nephrotoxicity, hepatotoxicity, and AMES mutagenicity. These characteristics suggest minimal secondary adverse effects, positioning Naringin as a compelling candidate for targeted ovarian cancer therapy with an enhanced safety profile.
3. Discussion
Tumor progression relies on precise gene expression patterns, with specific genes upregulated while others are downregulated. Our microarray analysis revealed distinct expression profiles between ovarian epithelial cancer cells and normal counterparts, validated through comprehensive heatmap analysis.
Our protein-protein interaction network analysis identified CDK1 as a pivotal gene with the highest degree and eigenvector centrality, ranking second in betweenness centrality after TOP2A. This positions CDK1 as a central regulatory hub in ovarian epithelial cancer. Kaplan-Meier analysis further confirmed a significant negative correlation between CDK1 expression and overall survival, establishing elevated CDK1 expression as a robust prognostic indicator.
CDK1 overexpression contributes to the enrichment of multiple critical signaling pathways including cell cycle progression, oocyte meiosis, p53 signaling, cellular senescence, and gap junction function. As Matthews et al. established, CDK1 functions as a proline-directed kinase that phosphorylates numerous proteins throughout the cell cycle, promoting progression and executing stage-specific processes [35]. This precise cell cycle control represents a cornerstone of tumor development.
The PI3K pathway, frequently altered in epithelial ovarian cancer (EOC), plays a crucial role in chemoresistance and genomic stability maintenance [36]. This pathway intersects with DNA replication and cell cycle regulation, where CDK1 serves as a central mediator. The antagonistic relationship between CDK1 and tumor suppressor pathways has been documented across multiple malignancies, with Kin et al. demonstrating that CDK1 and CCNB1 exert inhibitory effects on the p53 signaling pathway [37].
Our machine learning approaches significantly enhanced the identification of CDK1 as a central regulatory node in ovarian cancer. By implementing supervised learning algorithms including random forests and neural networks, we extracted complex patterns from high-dimensional gene expression data that traditional statistical methods might overlook. The integration of these computational predictions with experimental validation created a robust framework for identifying high-confidence therapeutic targets, demonstrating the value of artificial intelligence in accelerating target identification and drug discovery pipelines [38].
Numerous investigations have demonstrated that phosphorylation of CDK1 at the Tyr15 site inhibits its activity, impeding cell division in the G2 phase [39,40]. Significant blockade of G2/M transition has been observed in ovarian cancer cells with inhibited CDK1, leading to reduced cellular proliferation and increased apoptosis. Furthermore, WEE1 induction enhances CDK1 phosphorylation, contributing to decreased proliferation and increased apoptosis [41].
The CDK1/Cyclin B1 complex functions as the primary regulator of G2/M transition, and reduction in CDK1 activity significantly impedes this critical checkpoint [42]. Our investigation revealed not only CDK1's involvement in ovarian cancer but also its overexpression in cisplatin-resistant cells [43], suggesting its role in treatment resistance. Analysis of GEPIA and Oncomine databases identified a robust correlation between WEE1 and CDK1 expression in ovarian cancer, indicating potential reciprocal regulation. Previous studies have demonstrated the inhibitory effects of compounds such as Alsterpaullone [44], Fostamatinib [45], Olomoucine [46], and Seliciclib [47] on CDK1 activity, while agents like Adavosertib [48] and Fostamatinib [49] target WEE1, thereby indirectly modulating CDK1 activity and inhibiting cancer progression. Additionally, the anti-proliferative effects of Naringin [50]on ovarian cancer have been previously documented.
Our molecular dynamics simulations provided unprecedented insights into CDK1 inhibition by Naringin. The 100-nanosecond simulations revealed that Naringin binding induces subtle conformational changes while preserving overall protein architecture. The consistent RMSD values confirm the formation of a stable protein-ligand complex, while radius of gyration analysis demonstrates maintained structural integrity. RMSF analysis shows localized flexibility increases in specific loop regions upon Naringin binding, suggesting an induced-fit mechanism critical for inhibitory function. These insights provide a structural framework for understanding how naturally-derived compounds can effectively modulate kinase activity [51].
Using in silico approaches and molecular docking, we confirmed the inhibitory effects of several compounds on CDK1, with Alsterpaullone, Avotaciclib, Fostamatinib, and Naringin demonstrating efficacious inhibitory effects on both CDK1 and WEE1. This dual-targeting approach holds substantial potential for enhanced therapeutic efficacy in controlling ovarian cancer, potentially delaying treatment resistance [52].
Naringin, a dihydroflavonoid derived from grapefruit peel, emerged as a particularly promising candidate drug. AdmetSAR analysis yielded favorable predictions, including negative indicators for blood-brain barrier penetration, nephrotoxicity, hepatotoxicity, and Ames mutagenesis. Despite its inability to cross the blood-brain barrier and negative oral bioavailability profile, careful optimization of administration methods could maximize its therapeutic efficacy while minimizing adverse effects.
In conclusion, our integrated approach identified CDK1 as a central regulatory hub in ovarian epithelial cancer and revealed Naringin as a promising dual-target inhibitor of both CDK1 and WEE1. The favorable safety profile and dual-targeting capacity of Naringin position it as a compelling candidate for further development as a targeted therapy for ovarian cancer.
4. Materials and Methods
4.1. Extraction and Processing of Microarray Data
Raw gene expression data from epithelial ovarian cancer and normal ovarian epithelial cells were obtained from the GEO database [16]. The datasets, generated using the Affymetrix Human Genome U133 Plus 2.0 Array platform, underwent comprehensive normalization via the Robust Multi-array Average (RMA) method implemented in Transcriptome Analysis Console 4.0.1.36 software. Differentially expressed genes were subsequently categorized based on LogFC values. Visualization of complex data relationships was performed using advanced plotting tools available at the Bioinformatics online platform (http://www.bioinformatics.com.cn/en).
4.2. Creation of Protein-Protein Interaction Network
Protein-protein interaction (PPI) networks were constructed using the STRING database [17], with relevant filters applied through Cytoscape 3.10.0 software [18]. The CytoHubba plugin identified ten influential hub genes based on the degree parameter. Further network refinement using Gephi 0.9.2 software enabled the identification of the primary regulatory gene through additional network parameter analysis.
4.3. Validation of CDK1 Gene
The expression profile of CDK1 was validated using multiple bioinformatics resources. The Gene Expression Profiling Interactive Analysis (GEPIA) web server [19] was utilized to analyze mRNA expression from The Cancer Genome Atlas (TCGA), investigating the distribution of CDK1 expression in the BodyMap and its correlation with tumor stages and survival. Comparative analysis of CDK1 expression levels in normal, tumor, and metastatic tissues was performed using the TNMplot database [20]. Protein expression data were extracted from the Human Protein Atlas database, while genetic alteration information was accessed through cBioPortal for Cancer Genomics [21].
Histological validation was conducted using immunohistochemistry images from the Human Protein Atlas, with 3,3'-diaminobenzidine (DAB) staining indicating antigen presence. The prognostic significance of CDK1 expression in EOC patients was assessed using the Kaplan-Meier plotter database [22], with a 60-month follow-up period. The threshold distinguishing high and low CDK1 expression was automatically determined by the portal's algorithm.
4.4. Machine Learning in CDK1 Gene Expression
Machine learning and deep learning techniques were applied to analyze CDK1 gene expression and its functional interaction network. Gene expression data were processed using models such as random forests and neural networks to identify key regulatory patterns. Protein–protein interaction (PPI) networks were inferred from the data using learning-based methods, and visualized using Python libraries including NetworkX and Matplotlib. Integration of expression profiles with inferred PPI networks enhanced the understanding of CDK1's biological role and its potential as a therapeutic target [23].
4.5. Pharmacological Effects In Silico
Based on hub gene expression analysis, CDK1 was selected as a primary target for pharmacological intervention. The protein structures of CDK1 and WEE1 were obtained from the RCSB Protein Data Bank [24,25] after identification in the UniProt database. Protein preparation for molecular docking included removal of pre-existing ligands and extraneous water molecules, hydrogen atom addition, elimination of redundant residues, amino acid charge optimization, and energy minimization using Chimera software [26,27].
Binding sites for drug targeting were identified through the COACH database [28] and supplemented with information from the PDB literature. Chemical structures of seven candidate drugs were extracted from the PubChem database. Two-dimensional structures were defined using IUPAC nomenclature and transformed into energy-minimized three-dimensional conformations using ChemBio3D software [29].
Molecular docking simulations were conducted using AutoDock Vina [30] in conjunction with PyRX [31]. High-precision selection criteria were employed to identify ligands with optimal binding profiles. Pharmacokinetic properties were analyzed using the Protein-Ligand Interaction Profiler (PLIP) [32] and AdmetSAR [33] databases.
Molecular dynamics simulations were performed using GROMACS for 100 nanoseconds to evaluate CDK1 stability in both apo and Naringin-bound states. The CHARMM36 force field was applied, and the system was solvated in a TIP3P water molecule cubic box. Following energy minimization and equilibration in NVT and NPT ensembles, production runs were conducted with calculations of root-mean-square deviation (RMSD), radius of gyration (Rg), and root-mean-square fluctuation (RMSF) to assess conformational stability and flexibility [34].
Conclusions
Transcriptome profiling combined with machine learning inference and in silico simulations identified CDK1 as a critical regulatory hub in epithelial ovarian cancer. Dual inhibition of CDK1 and its upstream modulator WEE1 by Naringin exhibited favorable binding dynamics, structural stability, and a low predicted toxicity profile. These results position Naringin as a compelling candidate for targeted therapeutic intervention, offering a mechanistically informed approach to disrupt aberrant cell cycle progression in ovarian malignancies.
Supplementary Materials
The following supporting information can be downloaded at the website of this paper posted on Preprints.org.
Author Contributions
M.M., and S.S.A. was instrumental in designing the experiments, collecting and analyzing data, writing the manuscript, handling bioinformatics, editing, and conducting experiments. M.M., and S.S.A. played a key role in the experimental design, executed data assembly and analysis, writing the manuscript. H.A., M.M., and S.S.A. offered vital feedback, aided in data analysis, and contributed to manuscript editing. T.S. provided crucial feedback and participated in editing the manuscript. All authors thoroughly reviewed and endorsed the final version of the manuscript for publication.
Funding
This research received no external funding.
Institutional Review Board Statement
Not applicable.
Informed Consent Statement
Not applicable.
Data Availability Statement
The datasets generated during and/or analysed during the current study are available in the [GSE DataSets and Human Protein Atlas] repository, [https://www.ncbi.nlm.nih.gov/geo/query/acc.cgi?acc=GSE28799 and https://www.ncbi.nlm.nih.gov/geo/query/acc.cgi?acc=GSE54388] and [https://www.proteinatlas.org/ accession numbers, ENSG00000170312].
Acknowledgments
Our sincere gratitude is expressed to Professor Thomas Skutella for the invaluable contributions made to this manuscript. The content and quality of our work have been greatly enriched by his expertise, support, and feedback. Furthermore, his assistance and encouragement throughout the research process are appreciated.
Conflicts of Interest
The authors declare no conflicts of interest.
References
- Jiang, Y.; Gong, T.; Zhang, J.; Li, X.; Gao, S.; Zhao, Y.; Wu, Q. Infertility and ovarian cancer risk: Evidence from nine prospective cohort studies. Int. J. Cancer 2020, 147, 2121–2130. [Google Scholar] [CrossRef] [PubMed]
- Torre, L.A.; Trabert, B.; DeSantis, C.E.; Miller, K.D.; Samimi, G.; Runowicz, C.D.; Gaudet, M.M.; Jemal, A.; Siegel, R.L. Ovarian cancer statistics, 2018. CA Cancer J. Clin. 2018, 68, 284–296. [Google Scholar] [CrossRef] [PubMed]
- Sowamber, R.; Lukey, A.; Huntsman, D.; Hanley, G. Ovarian Cancer: From Precursor Lesion Identification to Population-Based Prevention Programs. Curr. Oncol. 2023, 30, 10179–10194. [Google Scholar] [CrossRef] [PubMed]
- Ghose, A.; Bolina, A.; Mahajan, I.; Raza, S.A.; Clarke, M.; Pal, A.; Sanchez, E.; Rallis, K.S.; Boussios, S. Hereditary Ovarian Cancer: Towards a Cost-Effective Prevention Strategy. Int. J. Environ. Res. Public Heal. 2022, 19, 12057. [Google Scholar] [CrossRef]
- Pavlidis, N.; Rassy, E.; Vermorken, J.B.; Assi, T.; Kattan, J.; Boussios, S.; Smith-Gagen, J. The outcome of patients with serous papillary peritoneal cancer, fallopian tube cancer, and epithelial ovarian cancer by treatment eras: 27 years data from the SEER registry. Cancer Epidemiology 2021, 75, 102045. [Google Scholar] [CrossRef]
- Yousefi, M.; Dehghani, S.; Nosrati, R.; Ghanei, M.; Salmaninejad, A.; Rajaie, S.; Hasanzadeh, M.; Pasdar, A. Current insights into the metastasis of epithelial ovarian cancer - hopes and hurdles. Cell. Oncol. 2020, 43, 515–538. [Google Scholar] [CrossRef]
- Wang, B.; Ramazzotti, D.; De Sano, L.; Zhu, J.; Pierson, E.; Batzoglou, S. SIMLR: A Tool for Large-Scale Genomic Analyses by Multi-Kernel Learning. Proteomics 2017, 18. [Google Scholar] [CrossRef]
- Wang, J.; Yang, D.; Yu, H.-F.; Jin, J.; Nie, Y.; Zhang, S.; Ren, W.; Ge, Z.; Zhang, Z.; Ma, X.; et al. Copper is essential for cyclin B1-mediated CDK1 activation. Nat. Commun. 2025, 16, 1–12. [Google Scholar] [CrossRef]
- Liu, Y.; Gu, X.; Xuan, M.; Lou, N.; Fu, L.; Li, J.; Xue, C. Notch signaling in digestive system cancers: Roles and therapeutic prospects. Cell. Signal. 2024, 124, 111476. [Google Scholar] [CrossRef]
- Farahmand, S.; SamadiAfshar, S.; Khalili, M.; Hosseini, R.H. Therapeutic implications of Epirubicin-induced miRNA-22 and miRNA-331 upregulation on cell viability and metastatic potential in triple-negative breast cancer. Hum. Gene 2025, 44. [Google Scholar] [CrossRef]
- Baliyan, D.; Sharma, R.; Goyal, S.; Chhabra, R.; Singh, B. Phytochemical strategies in glioblastoma therapy: Mechanisms, efficacy, and future perspectives. Biochim. et Biophys. Acta (BBA) - Mol. Basis Dis. 2024, 1871, 167647. [Google Scholar] [CrossRef] [PubMed]
- Ma, Y.; Patterson, B.; Zhu, L. Biased signaling in GPCRs: Structural insights and implications for drug development. Pharmacol. Ther. 2024, 266, 108786. [Google Scholar] [CrossRef] [PubMed]
- Yang, L.; Xie, H.-J.; Li, Y.-Y.; Wang, X.; Liu, X.-X.; Mai, J. Molecular mechanisms of platinum-based chemotherapy resistance in ovarian cancer (Review). Oncol. Rep. 2022, 47, 1–11. [Google Scholar] [CrossRef] [PubMed]
- Alme, C.; Pirim, H.; Akbulut, Y. Machine learning approaches for predicting craniofacial anomalies with graph neural networks. Comput. Biol. Chem. 2024, 115, 108294. [Google Scholar] [CrossRef]
- Wang, J.; Zheng, F.; Wang, D.; Yang, Q. Regulation of ULK1 by WTAP/IGF2BP3 axis enhances mitophagy and progression in epithelial ovarian cancer. Cell Death Dis. 2024, 15, 1–15. [Google Scholar] [CrossRef]
- Xiaowei, W.; Tong, L.; Yanjun, Q.; Lili, F. PTH2R is related to cell proliferation and migration in ovarian cancer: a multi-omics analysis of bioinformatics and experiments. Cancer Cell Int. 2022, 22, 1–15. [Google Scholar] [CrossRef]
- Szklarczyk, D.; Kirsch, R.; Koutrouli, M.; Nastou, K.; Mehryary, F.; Hachilif, R.; Gable, A.L.; Fang, T.; Doncheva, N.T.; Pyysalo, S.; et al. The STRING database in 2023: protein–protein association networks and functional enrichment analyses for any sequenced genome of interest. Nucleic Acids Res. 2022, 51, D638–D646. [Google Scholar] [CrossRef]
- Shannon, P.; Markiel, A.; Ozier, O.; Baliga, N.S.; Wang, J.T.; Ramage, D.; Amin, N.; Schwikowski, B.; Ideker, T. Cytoscape: A software environment for integrated models of Biomolecular Interaction Networks. Genome Res. 2003, 13, 2498–2504. [Google Scholar] [CrossRef]
- Tang, Z.; Li, C.; Kang, B.; Gao, G.; Li, C.; Zhang, Z. GEPIA: A web server for cancer and normal gene expression profiling and interactive analyses. Nucleic Acids Res. 2017, 45, W98–W102. [Google Scholar] [CrossRef]
- Bartha, Á.; Győrffy, B. TNMplot.com: A Web Tool for the Comparison of Gene Expression in Normal, Tumor and Metastatic Tissues. Int. J. Mol. Sci. 2021, 22, 2622. [Google Scholar] [CrossRef]
- de Bruijn, I.; Kundra, R.; Mastrogiacomo, B.; Tran, T.N.; Sikina, L.; Mazor, T.; Li, X.; Ochoa, A.; Zhao, G.; Lai, B.; et al. Analysis and Visualization of Longitudinal Genomic and Clinical Data from the AACR Project GENIE Biopharma Collaborative in cBioPortal. Cancer Res. 2023, 83, 3861–3867. [Google Scholar] [CrossRef] [PubMed]
- Győrffy, B. Integrated analysis of public datasets for the discovery and validation of survival-associated genes in solid tumors. Innov. 2024, 5, 100625. [Google Scholar] [CrossRef] [PubMed]
- Thareja, P.; Chhillar, R.S.; Dalal, S.; Simaiya, S.; Lilhore, U.K.; Alroobaea, R.; Alsafyani, M.; Baqasah, A.M.; Algarni, S. Intelligence model on sequence-based prediction of PPI using AISSO deep concept with hyperparameter tuning process. Sci. Rep. 2024, 14, 1–22. [Google Scholar] [CrossRef] [PubMed]
- Burley, S.K.; Bhikadiya, C.; Bi, C.; Bittrich, S.; Chao, H.; Chen, L.; A Craig, P.; Crichlow, G.V.; Dalenberg, K.; Duarte, J.M.; et al. RCSB Protein Data Bank (RCSB.org): delivery of experimentally-determined PDB structures alongside one million computed structure models of proteins from artificial intelligence/machine learning. Nucleic Acids Res. 2022, 51, D488–D508. [Google Scholar] [CrossRef]
- Farahmand, S.; SamadiAfshar, S.; Hosseini, L. TA-Cloning for Diabetes Treatment: Expressing Corynebacterium Malic Enzyme Gene in E. coli. Curr. Microbiol. 2024, 81, 1–11. [Google Scholar] [CrossRef]
- Hatami, S.; Sirous, H.; Mahnam, K.; Najafipour, A.; Fassihi, A. Preparing a database of corrected protein structures important in cell signaling pathways. Res. Pharm. Sci. 2023, 18, 67–78. [Google Scholar] [CrossRef]
- Samadiafshar, S., et al., In silico evaluation of microRNAs in kidney renal clear cell carcinoma and drugs effects in increasing apoptosis by docking. Acta Cell Biologica, 2025. 1(1): p. 11-16. https://acb.journals.pnu.ac.ir/article_11773_68fa5e67830c2ba3c547958e91253910.pdf.
- Yang, J.; Roy, A.; Zhang, Y. Protein–ligand binding site recognition using complementary binding-specific substructure comparison and sequence profile alignment. Bioinformatics 2013, 29, 2588–2595. [Google Scholar] [CrossRef]
- Handsel, J.; Matthews, B.; Knight, N.J.; Coles, S.J. Translating the InChI: adapting neural machine translation to predict IUPAC names from a chemical identifier. J. Chemin- 2021, 13, 1–11. [Google Scholar] [CrossRef]
- Eberhardt, J.; Santos-Martins, D.; Tillack, A.F.; Forli, S. AutoDock Vina 1.2.0: New Docking Methods, Expanded Force Field, and Python Bindings. J. Chem. Inf. Model. 2021, 61, 3891–3898. [Google Scholar] [CrossRef] [PubMed]
- Dallakyan, S.; Olson, A.J. Small-molecule library screening by docking with pyrx. Methods Mol. Biol. 2015, 1263, 243–250. [Google Scholar]
- Adasme, M.F.; Linnemann, K.L.; Bolz, S.N.; Kaiser, F.; Salentin, S.; Haupt, V.J.; Schroeder, M. PLIP 2021: expanding the scope of the protein–ligand interaction profiler to DNA and RNA. Nucleic Acids Res. 2021, 49, W530–W534. [Google Scholar] [CrossRef] [PubMed]
- Yang, H.; Lou, C.; Sun, L.; Li, J.; Cai, Y.; Wang, Z.; Li, W.; Liu, G.; Tang, Y. admetSAR 2.0: web-service for prediction and optimization of chemical ADMET properties. Bioinformatics 2018, 35, 1067–1069. [Google Scholar] [CrossRef] [PubMed]
- Azad, H.; Akbar, M.Y.; Sarfraz, J.; Haider, W.; Ghazanfar, S. Simulation studies to identify high-affinity probiotic peptides for inhibiting PAK1 gastric cancer protein: A comparative approach. Comput. Biol. Chem. 2025, 115, 108345. [Google Scholar] [CrossRef]
- Matthews, H.K.; Bertoli, C.; de Bruin, R.A.M. Cell cycle control in cancer. Nat. Rev. Mol. Cell Biol. 2021, 23, 74–88. [Google Scholar] [CrossRef]
- Aliyuda, F.; Moschetta, M.; Ghose, A.; Rallis, K.S.; Sheriff, M.; Sanchez, E.; Rassy, E.; Boussios, S. Advances in Ovarian Cancer Treatment Beyond PARP Inhibitors. Curr. Cancer Drug Targets 2023, 23, 433–446. [Google Scholar] [CrossRef]
- Qin, G.; Tu, X.; Li, H.; Cao, P.; Chen, X.; Song, J.; Han, H.; Li, Y.; Guo, B.; Yang, L.; et al. Long Noncoding RNA p53-Stabilizing and Activating RNA Promotes p53 Signaling by Inhibiting Heterogeneous Nuclear Ribonucleoprotein K deSUMOylation and Suppresses Hepatocellular Carcinoma. Hepatology 2019, 71, 112–129. [Google Scholar] [CrossRef]
- Ghandikota, S.K.; Jegga, A.G.
- Zhang, R.; Shi, H.; Ren, F.; Zhang, M.; Ji, P.; Wang, W.; Liu, C. The aberrant upstream pathway regulations of CDK1 protein were implicated in the proliferation and apoptosis of ovarian cancer cells. J. Ovarian Res. 2017, 10, 1–11. [Google Scholar] [CrossRef]
- Cedeno-Rosario, L.; Honda, D.; Sunderland, A.M.; Lewandowski, M.D.; Taylor, W.R.; Chadee, D.N. Phosphorylation of mixed lineage kinase MLK3 by cyclin-dependent kinases CDK1 and CDK2 controls ovarian cancer cell division. J. Biol. Chem. 2022, 298, 102263. [Google Scholar] [CrossRef]
- Schmidt, M.; Rohe, A.; Platzer, C.; Najjar, A.; Erdmann, F.; Sippl, W. Regulation of G2/M Transition by Inhibition of WEE1 and PKMYT1 Kinases. Molecules 2017, 22, 2045. [Google Scholar] [CrossRef]
- Roskoski, R., Jr. Cyclin-dependent protein serine/threonine kinase inhibitors as anticancer drugs. Pharmacol. Res. 2018, 139, 471–488. [Google Scholar] [CrossRef]
- Li, J.; Zhi, X.; Shen, X.; Chen, C.; Yuan, L.; Dong, X.; Zhu, C.; Yao, L.; Chen, M. Depletion of UBE2C reduces ovarian cancer malignancy and reverses cisplatin resistance via downregulating CDK1. Biochem. Biophys. Res. Commun. 2020, 523, 434–440. [Google Scholar] [CrossRef] [PubMed]
- Soni, D.V.; Jacobberger, J.W. Inhibition of Cdk1 by Alsterpaullone and Thioflavopiridol Correlates with Increased Transit Time from Mid G2 Through Prophase. Cell Cycle 2004, 3, 347–355. [Google Scholar] [CrossRef]
- Senturk, A.; Sahin, A.T.; Armutlu, A.; Kiremit, M.C.; Acar, O.; Erdem, S.; Bagbudar, S.; Esen, T.; Ozlu, N. Quantitative Phosphoproteomics Analysis Uncovers PAK2- and CDK1-Mediated Malignant Signaling Pathways in Clear Cell Renal Cell Carcinoma. Mol. Cell. Proteom. 2022, 21, 100417. [Google Scholar] [CrossRef]
- Rajgopal, A.; Young, D.W.; Mujeeb, K.A.; Stein, J.L.; Lian, J.B.; van Wijnen, A.J.; Stein, G.S. Mitotic control of RUNX2 phosphorylation by both CDK1/cyclin B kinase and PP1/PP2A phosphatase in osteoblastic cells. J. Cell. Biochem. 2006, 100, 1509–1517. [Google Scholar] [CrossRef]
- Coley, H.M.; Safuwan, N.A.M.; Chivers, P.; Papacharalbous, E.; Giannopoulos, T.; Butler-Manuel, S.; Madhuri, K.; Lovell, D.P.; Crook, T. The cyclin-dependent kinase inhibitor p57Kip2 is epigenetically regulated in carboplatin resistance and results in collateral sensitivity to the CDK inhibitor seliciclib in ovarian cancer. Br. J. Cancer 2012, 106, 482–489. [Google Scholar] [CrossRef]
- Chen, J.; Jia, X.; Li, Z.; Song, W.; Jin, C.; Zhou, M.; Xie, H.; Zheng, S.; Song, P. Targeting WEE1 by adavosertib inhibits the malignant phenotypes of hepatocellular carcinoma. Biochem. Pharmacol. 2021, 188, 114494. [Google Scholar] [CrossRef]
- Noguchi, R.; Yoshimatsu, Y.; Ono, T.; Sei, A.; Motoi, N.; Yatabe, Y.; Yoshida, Y.; Watanabe, S.; Kondo, T. Establishment and characterization of NCC-DMM1-C1, a novel patient-derived cell line of desmoplastic malignant pleural mesothelioma. Oncol. Lett. 2021, 23, 1–9. [Google Scholar] [CrossRef]
- Zhu, J.; Lin, S.; Zou, X.; Chen, X.; Liu, Y.; Yang, X.; Gao, J.; Zhu, H. Mechanisms of autophagy and endoplasmic reticulum stress in the reversal of platinum resistance of epithelial ovarian cancer cells by naringin. Mol. Biol. Rep. 2023, 50, 6457–6468. [Google Scholar] [CrossRef]
- Ghandikota, S.K.; Jegga, A.G.
- Fernandez-Rodriguez, L.; Cianciaruso, C.; Bill, R.; Trefny, M.P.; Klar, R.; Kirchhammer, N.; Buchi, M.; Festag, J.; Michel, S.; Kohler, R.H.; et al. Dual TLR9 and PD-L1 targeting unleashes dendritic cells to induce durable antitumor immunity. J. Immunother. Cancer 2023, 11, e006714. [Google Scholar] [CrossRef]
Figure 1.
A) Box plot displaying data before normalization. B) Box plot displaying data after normalization. C) Heat map illustrating differentially expressed genes (DEGs) in different cancers. D) Heat map illustrating differentially expressed genes (DEGs) with statistical significance (P < 0.05) and log2FC > 4. E) Base plot showing data distribution with vertical lines. The cancer dataset includes GSM713222, GSM713223, and GSM713224, which are associated with GSE28799. The datasets GSM1314222, GSM1314223.calvin, GSM1314224.calvin, and GSM1314225.calvin belong to GSE54388. Additionally, GSM359972, GSM359973, GSM359974, and GSM359975 are part of GSE14407.
Figure 2.
Protein-protein interaction. A. Categorization of genes according to the degree parameter, B. Quantitative comparison of gene potency C. Chord diagram illustrating the interaction network between selected genes and their associated biological processes (GO terms) and pathways. D. Gene network constructed using betweenness centrality and eigenvector centrality, E. Bar chart illustrating the enrichment of genes in key KEGG pathways.
Figure 3.
Figure 3. Integrated network and functional analysis of differentially expressed genes. (A) Protein-protein interaction (PPI) network showing hub genes, with CDK1 centrally involved. (B) Subnetwork of top-ranked hub genes based on degree centrality. (C) Functional clustering reveals CDK1’s connections with diverse cellular processes such as DNA replication, mitosis, apoptosis, and signal transduction. (D) Enriched molecular functions of DEGs, highlighting acetyltransferase activator activity and mRNA binding. (E) Functional distribution plot showing the dominance of CDK1-associated pathways in cell division, transcription, and DNA damage response.
Figure 4.
A. Kaplan-Meier survival curve based on CDK1 expression levels for the overall survival of patients with EOC, B. Cut-off plot generated by the Kaplan-Meier plotter web application. Significance vs. cut-off values between the lower and upper quartiles of expression are shown, with the red circle indicating the optimal cut-off, C. CDK1 mRNA expression increases gradually in normal, tumor, and metastatic tissues of EOC patients, reaching its peak in tumors, D. CDK1 mRNA levels in EOC were assessed using GEPIA2. E. Volcano plots of differentially expressed genes (DEGs) in datasets GSE30219, GSE33532, and GSE19188. Pink and cyan dots indicate significantly upregulated and downregulated genes, respectively.
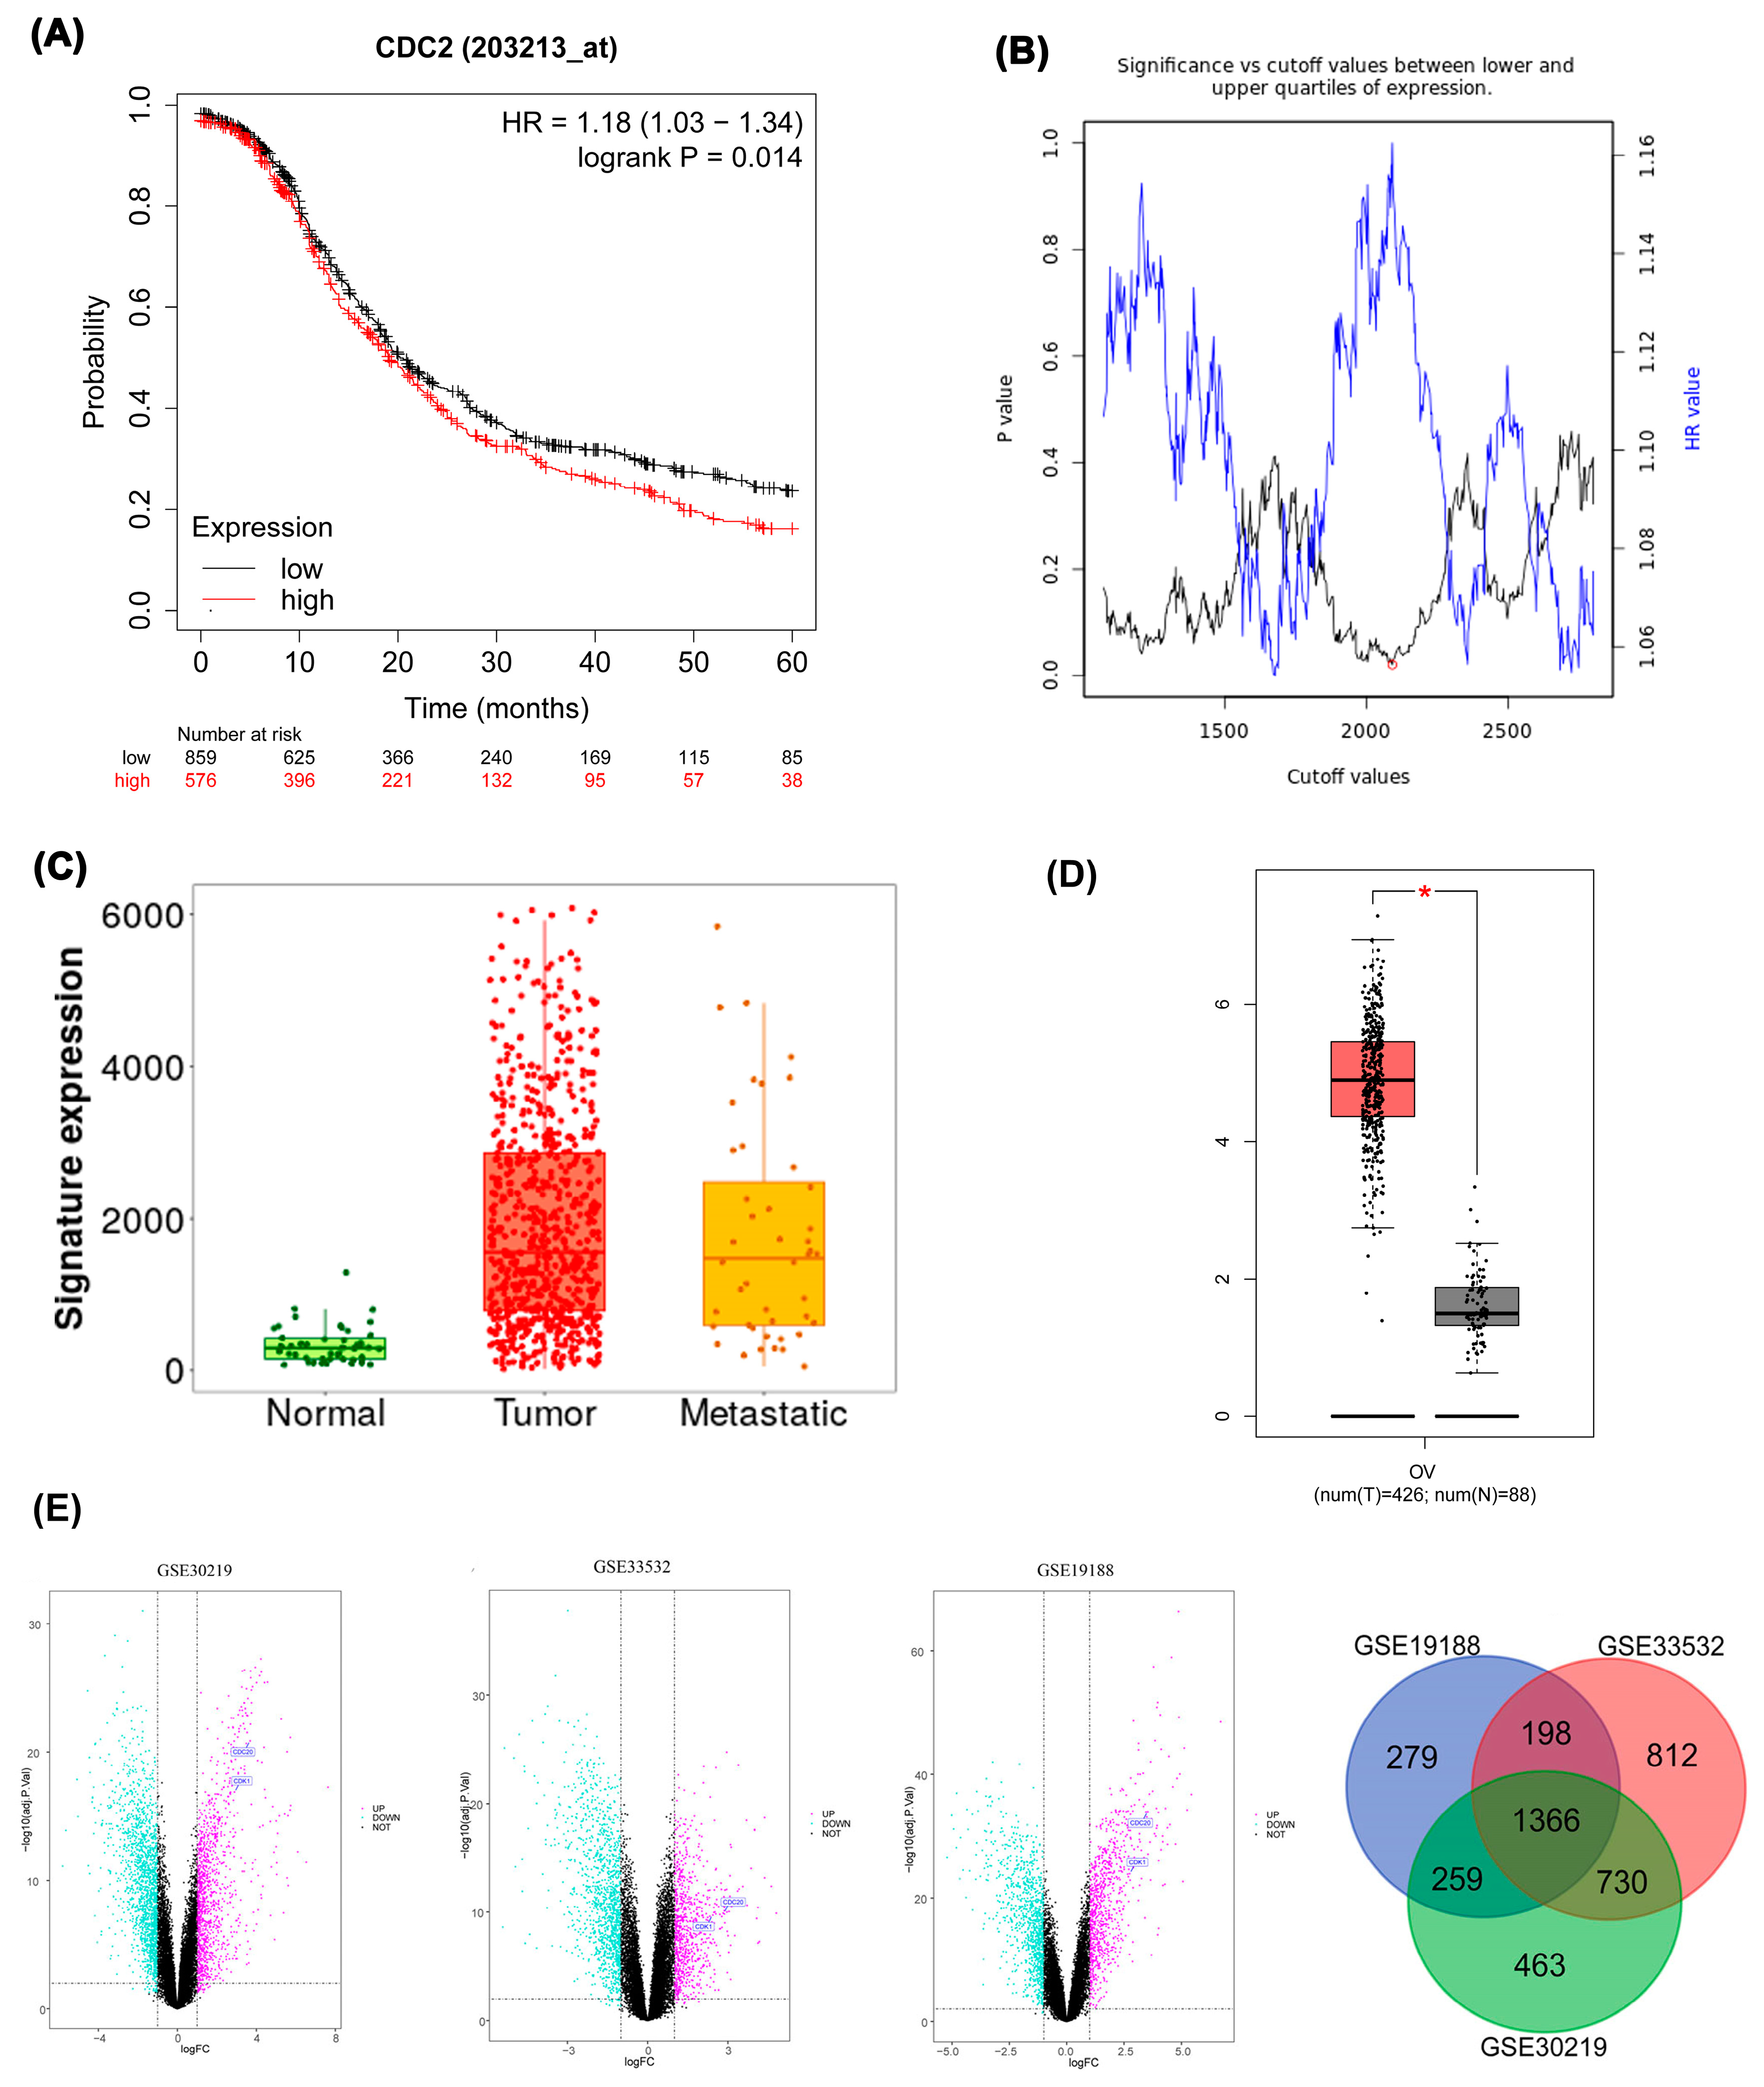
Figure 5.
Immunohistochemistry. CDK1 was found in both the nucleoplasm and cytosol. The green color indicates the presence of the target protein, while the red color indicates the presence of microtubules.
Figure 5.
Immunohistochemistry. CDK1 was found in both the nucleoplasm and cytosol. The green color indicates the presence of the target protein, while the red color indicates the presence of microtubules.
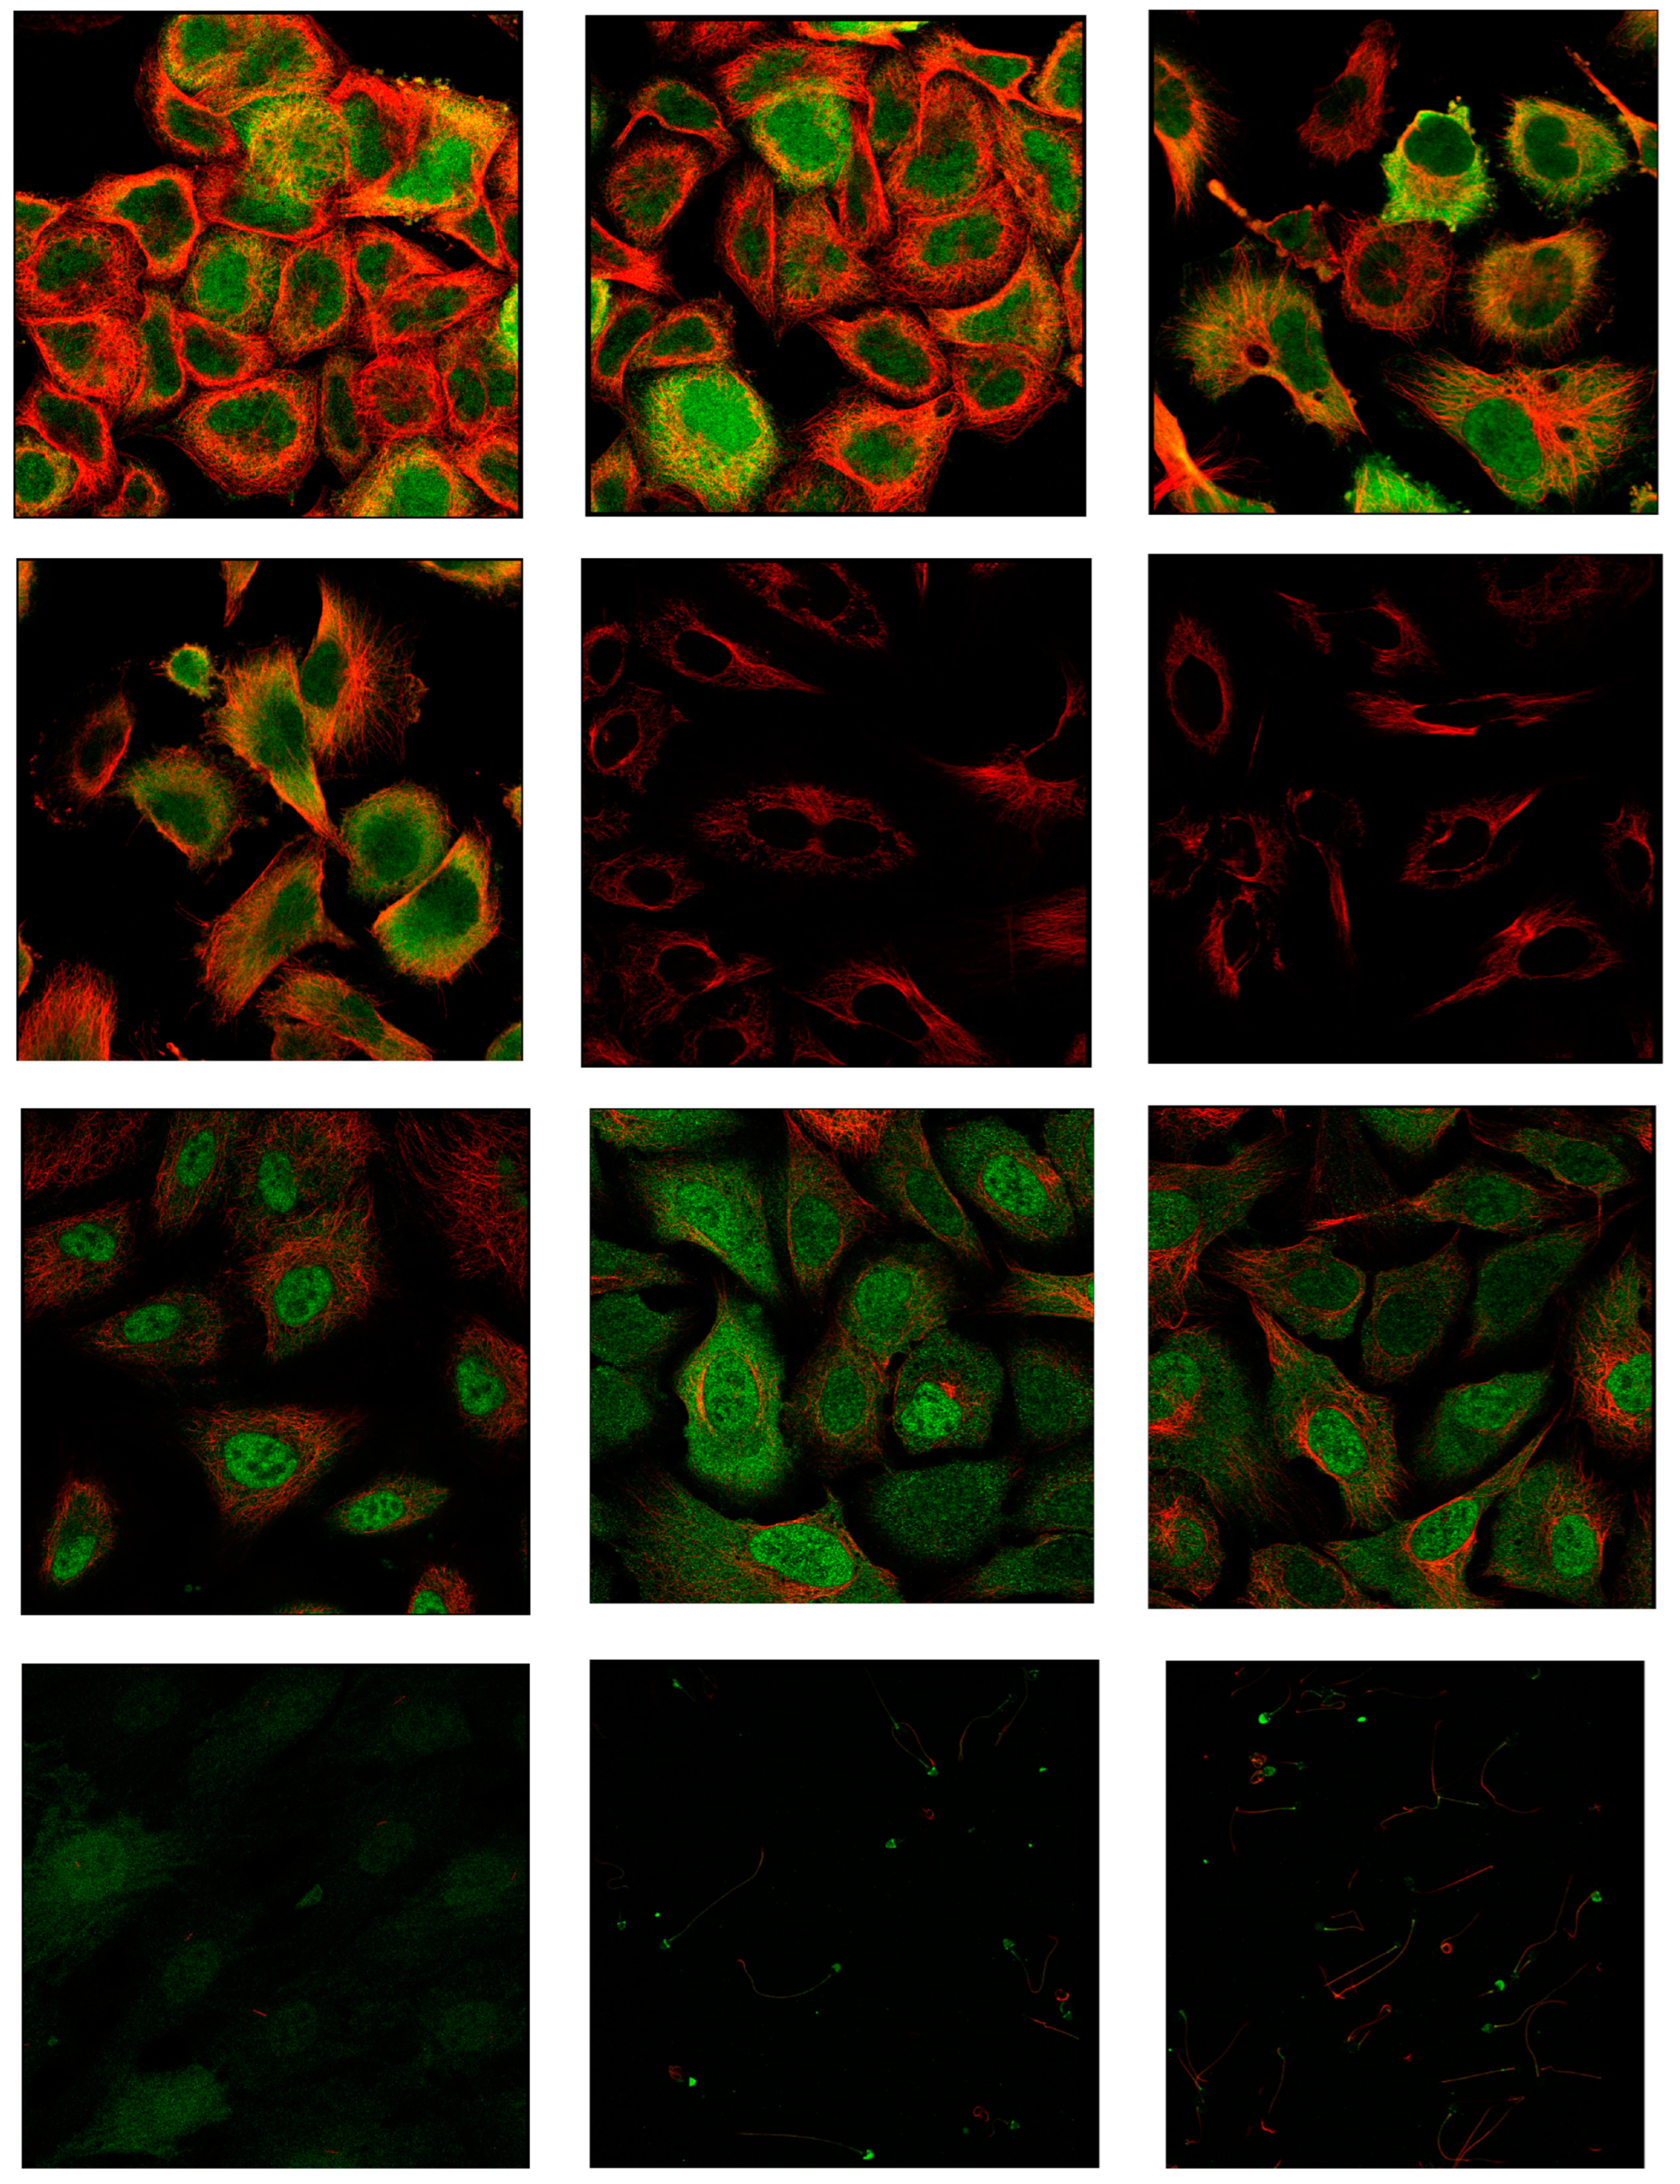
Figure 6.
A. schematically illustrates a representation of the functional cycle and quaternary structure of Cdk1 and Wee1 proteins. B. Docking results of Naringin with Cdk1 protein in three different output report models, C. 3D structure of the drug Naringin (Dynamic mode), D. Docking results of Naringin with the WEE1 protein in three different output report models, E. 2D structures of the selected drugs (the green color indicates drugs with Cdk1 effects reported, blue drugs with WEE1 effects, purple for both, and red for new drug for evaluation.).
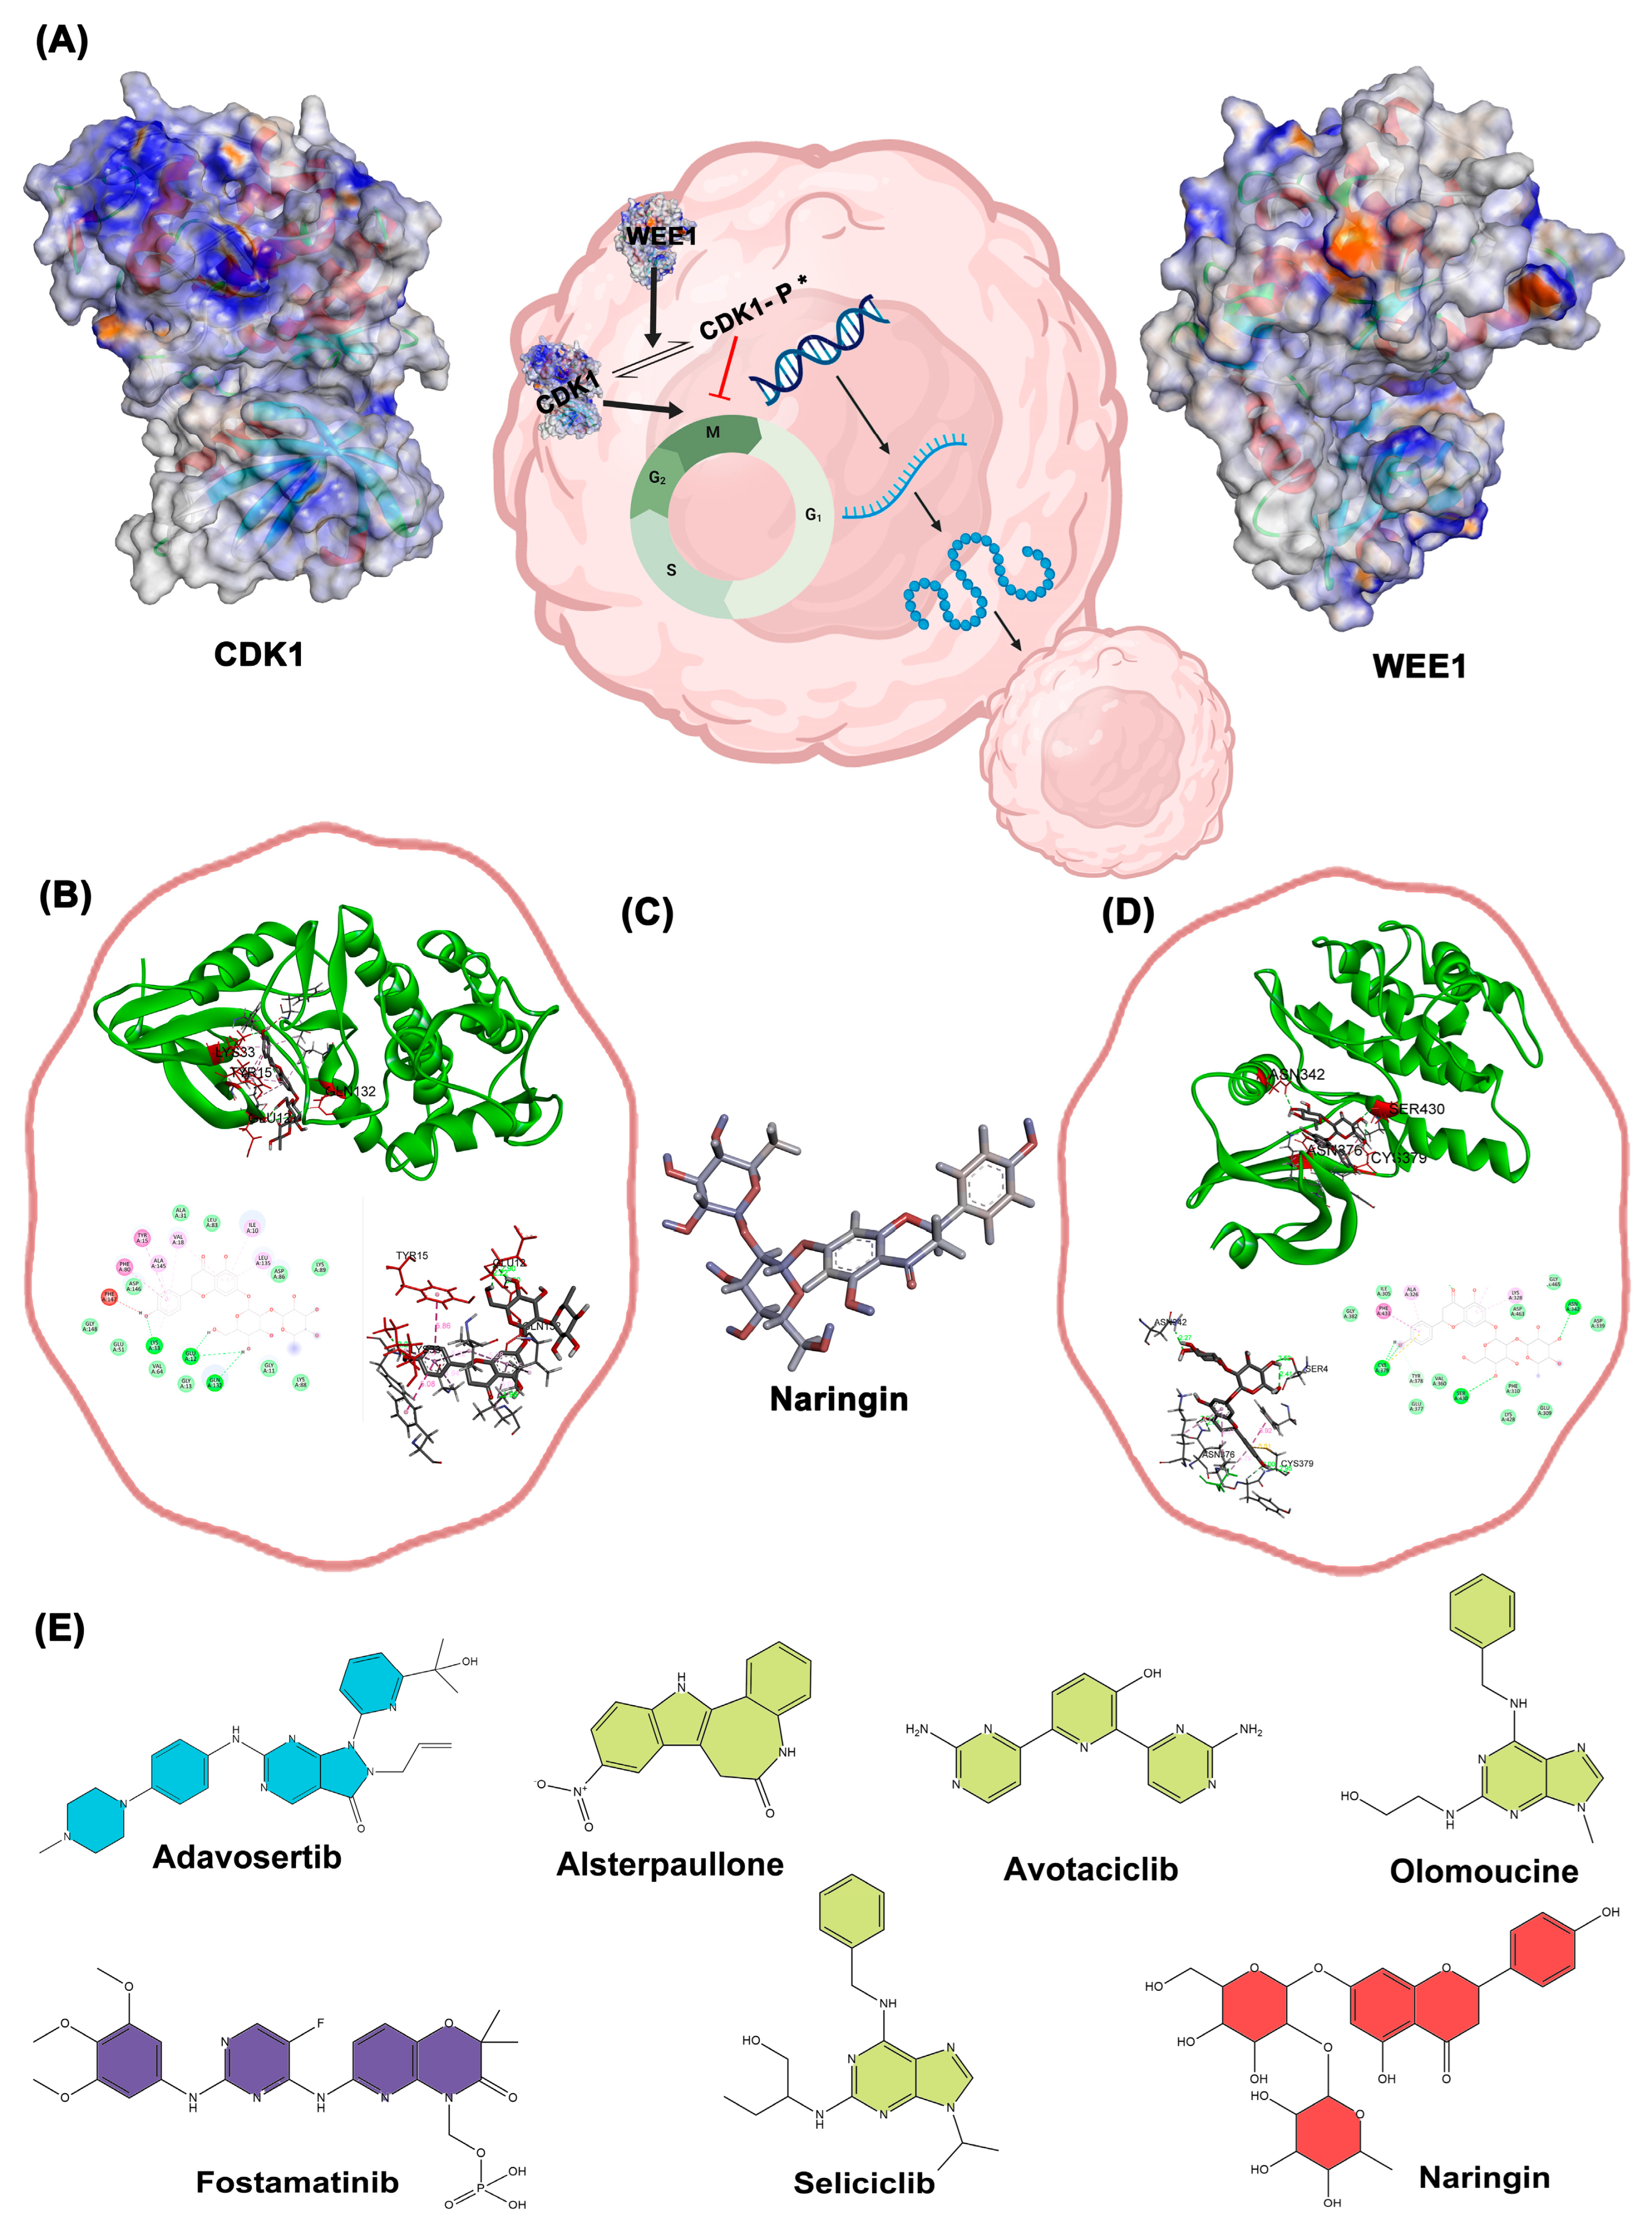
Figure 7.
Molecular dynamics simulation of CDK1 in complex with Naringin and control. (A) RMSD plot of the protein backbone over 100 ns. (B) RMSD of the ligand within the binding pocket. (C) Radius of gyration (Rg) of the protein. (D) RMSF plot of residues indicating atomic fluctuations.
Figure 7.
Molecular dynamics simulation of CDK1 in complex with Naringin and control. (A) RMSD plot of the protein backbone over 100 ns. (B) RMSD of the ligand within the binding pocket. (C) Radius of gyration (Rg) of the protein. (D) RMSF plot of residues indicating atomic fluctuations.
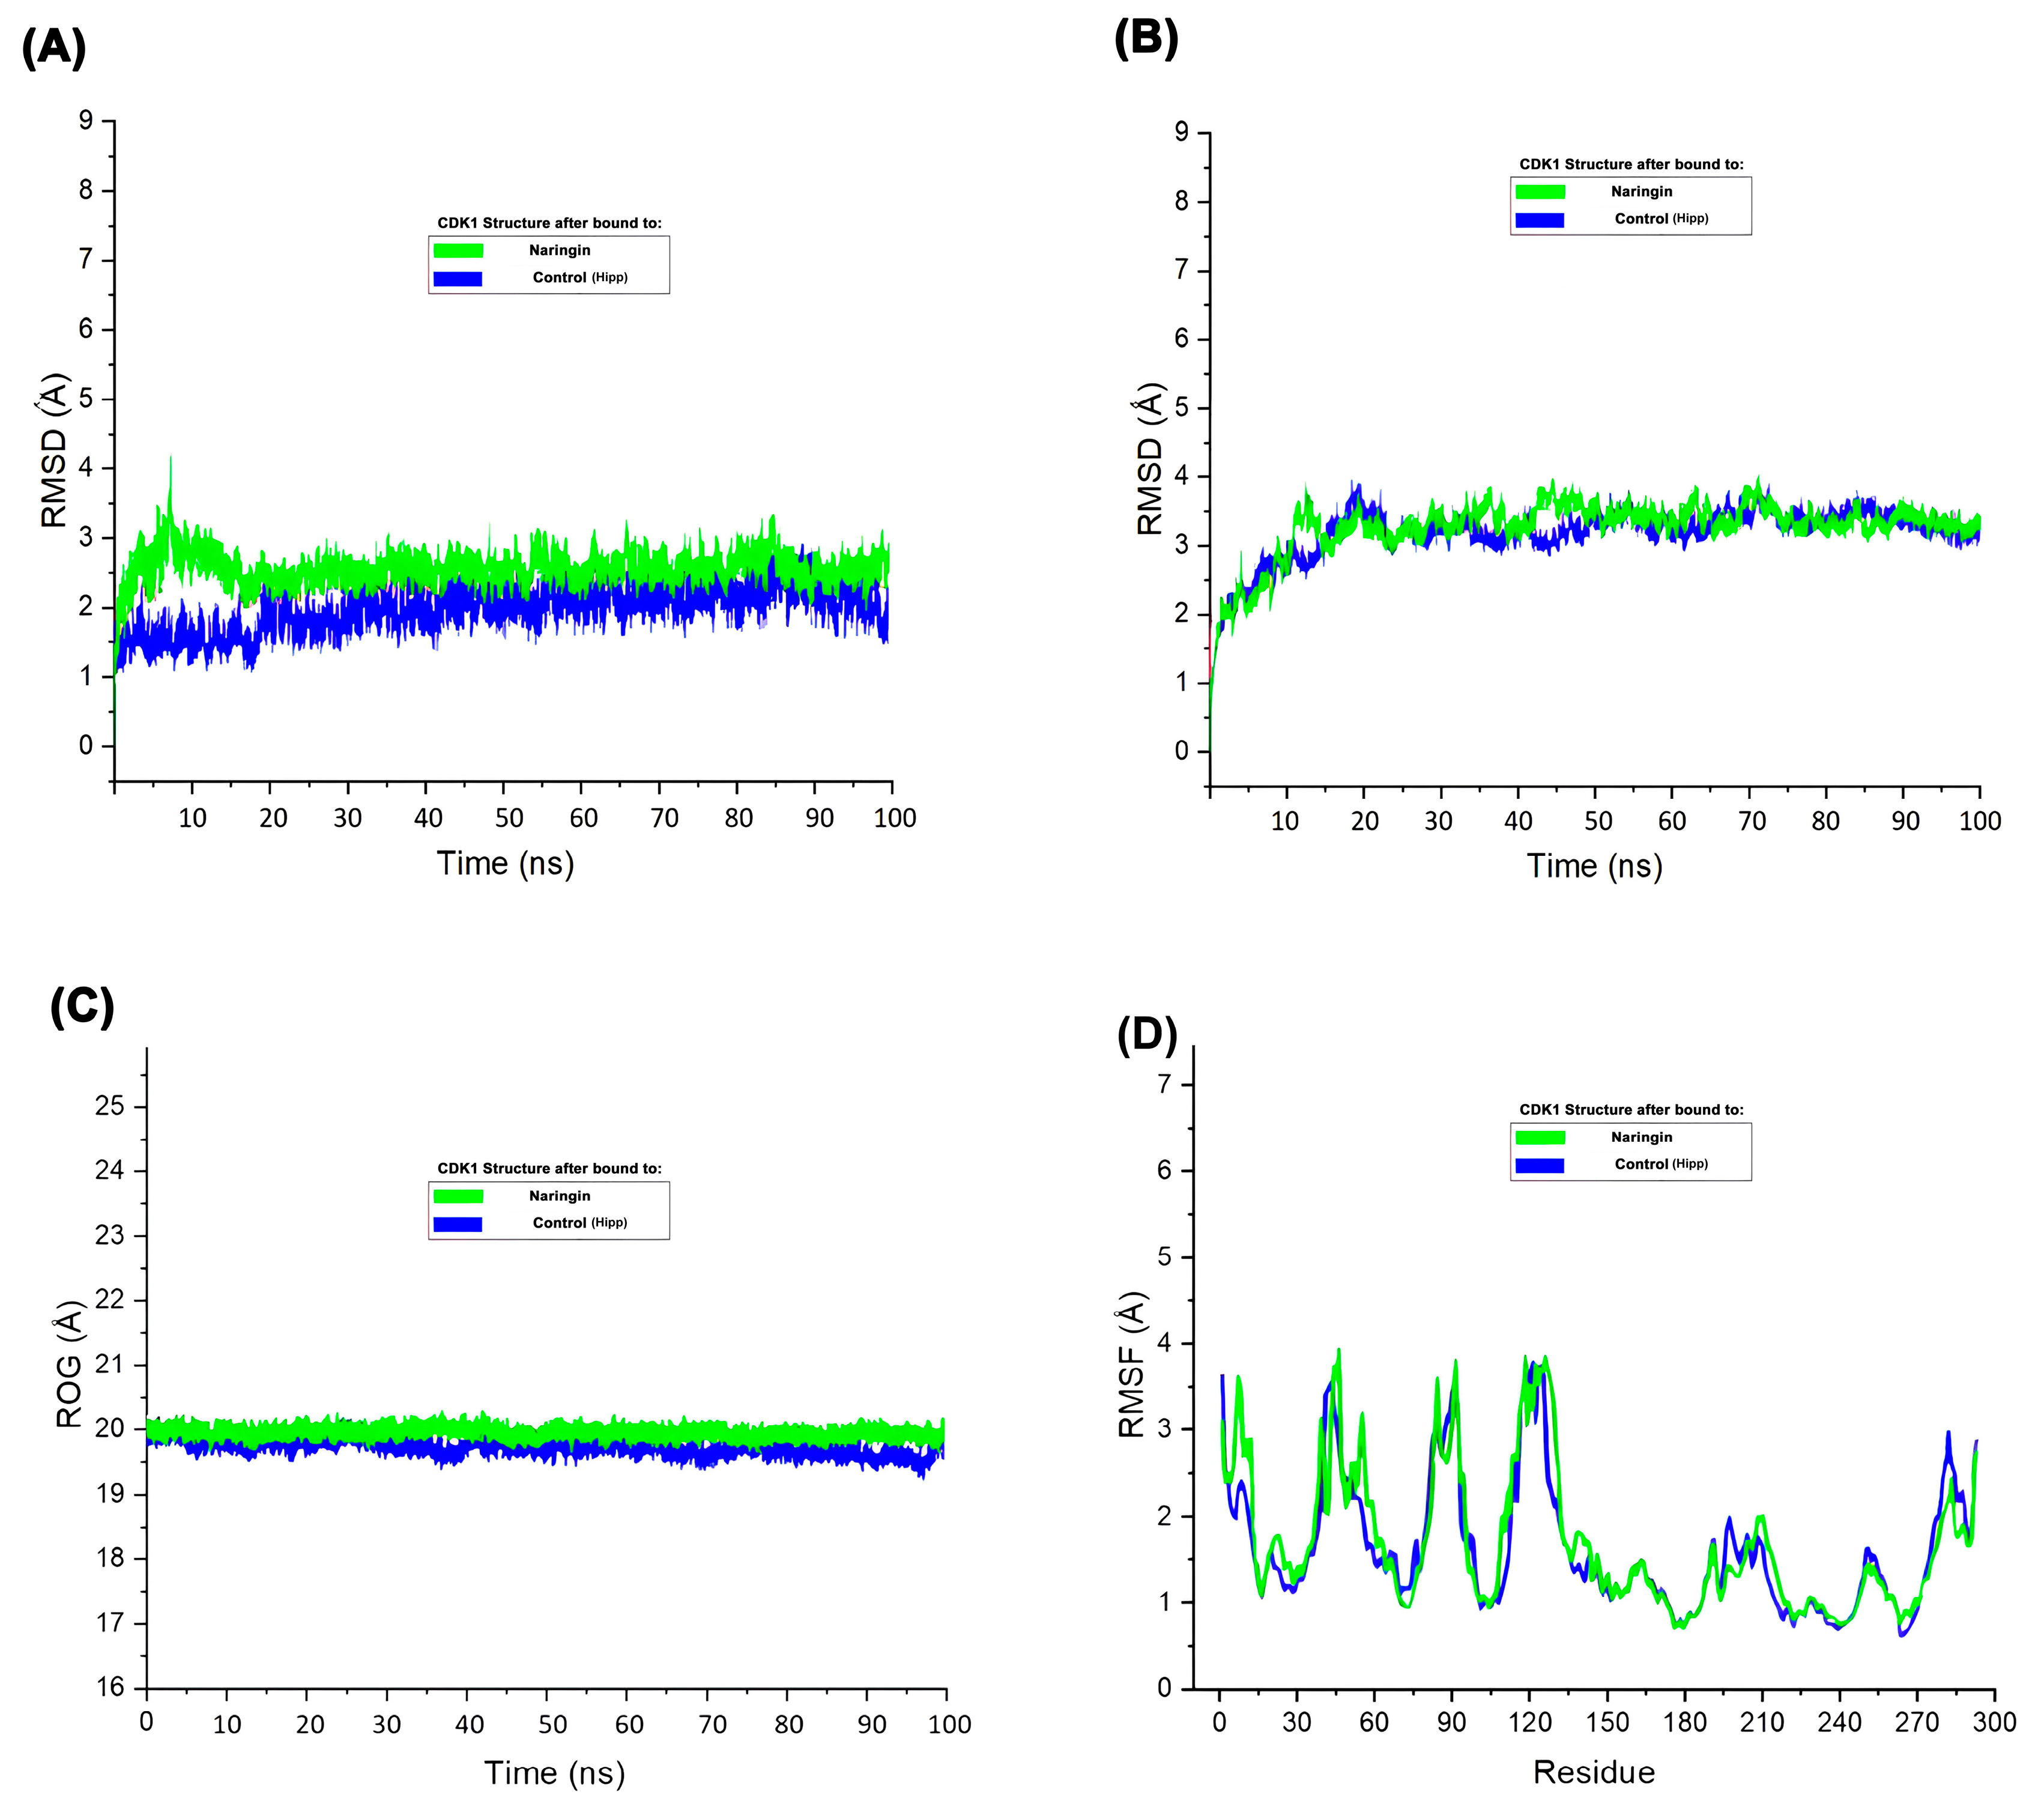

Table 1.
The results of Auto Dock Vina (binding affinity) and PLIP database.
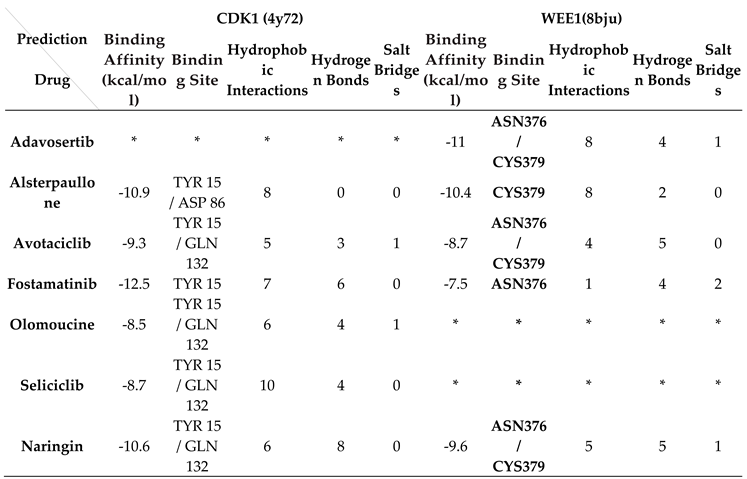
* The asterisk indicates a lack of binding at the identified binding site in the target protein.
Table 2.
The results of AdmetSAR database.
| Name of the drug | Admet SAR | ||||||||
|---|---|---|---|---|---|---|---|---|---|
| Subcellular localization | AlogP | Molecular Weight | Blood Brain Barrier | Human Oral Bioavailability | Nephrotoxicity | Hepatotoxicity | Ames Mutagenesis | ||
| Adavosertib | Mitochondria | 2.89 | 500.607 | + | 0.6429(+) | 0.7773(-) | 0.7075(+) | 0.54(-) | |
| Alsterpaullone | Mitochondria | 3.24 | 293.276 | + | 0.7143(+) | 0.5739(+) | 0.7875(+) | 0.88(+) | |
| Avotaciclib | Mitochondria | 0.87 | 281.279 | + | 0.5571(+) | 0.4864(+) | 0.6125(+) | 0.5(-) | |
| Fostamatinib | Mitochondria | 3.09 | 580.459 | - | 0.5571(+) | 0.7326(+) | 0.6677(+) | 0.53(-) | |
| Olomoucine | Nucleus | 1.36 | 298.343 | + | 0.5714(-) | 0.5939(-) | 0.5587(+) | 0.58(+) | |
| Seliciclib | Lysosomes | 3.2 | 354.449 | + | 0.5143(+) | 0.7729(-) | 0.5538(-) | 0.59(-) | |
| Naringin | Mitochondria | -1.17 | 580.54 | - | 0.9857(-) | 0.6977(-) | 0.8750(-) | 0.61(-) | |
Disclaimer/Publisher’s Note: The statements, opinions and data contained in all publications are solely those of the individual author(s) and contributor(s) and not of MDPI and/or the editor(s). MDPI and/or the editor(s) disclaim responsibility for any injury to people or property resulting from any ideas, methods, instructions or products referred to in the content. |
© 2025 by the authors. Licensee MDPI, Basel, Switzerland. This article is an open access article distributed under the terms and conditions of the Creative Commons Attribution (CC BY) license (http://creativecommons.org/licenses/by/4.0/).
Copyright: This open access article is published under a Creative Commons CC BY 4.0 license, which permit the free download, distribution, and reuse, provided that the author and preprint are cited in any reuse.


