Submitted:
22 April 2025
Posted:
23 April 2025
You are already at the latest version
Abstract
Alzheimer’s disease (AD) is an incurable neurodegenerative disorder that debilitates an overwhelming number of people in the aging population worldwide. The aggregated forms of the beta-amyloid (Aβ) peptide play an important role in the onset of AD. Small molecules that can bind to Aβ are useful for in vitro assays, in vivo imaging, and in therapeutic research. Herein, a series of compounds that can target Aβ aggregates and inhibit their formation were developed. The interaction of several compounds with the Aβ peptide was found to modulate the formation of aggregates. These N-alkylamino stilbene compounds offer important Aβ selectivity and have potential for aiding the development of soluble Aβ aggregate selective AD probes.
Keywords:
Alzheimer’s disease
; beta-amyloid
; chemical tools
; Aβ probes
; protein aggregation
1. Introduction
Alzheimer’s disease (AD) is a neurodegenerative disorder negatively impacting the cognitive functions of an ever-increasing number of people worldwide. First described in 1906 by Alois Alzheimer, the neuropathological markers can be described as either positive or negative lesions - the former containing amyloid plaques and neurofibrillary tangles and the latter describing cerebral atrophy [1]. Alzheimer’s disease remains incurable, and its unclear etiology remains a challenge for the development of effective diagnostics and treatments. Molecules that bind to AD biomarkers, such as the amyloid beta (Aβ) peptide that makes up amyloid plaques, are highly sought for use as a dye for in vitro assays, as a probe with in vivo imaging, and in therapeutic endeavours. Selectively targeting soluble Aβ oligomers is of particular interest due to their high neurotoxicity [2,3,4]. However, there remains limited understanding for designing oligomer selective probes. As such, probes that can inhibit insoluble amyloid aggregation may be used to investigate new compounds which selectively target soluble Aβ aggregates such as oligomers or protofibrils.
Small fluorescent molecules that bind to Aβ have long been inspired by chemical tools such as Congo Red (CR) and Thioflavin T (ThT) because of their great binding affinity to Aβ aggregates. Popular assay dyes like ThT, contain a rotatable σ bond that, upon rotation, quenches their fluorescence. However, once bound to insoluble amyloid aggregates, i.e., fibrils or plaques, the dyes lock into a specific conformer, resulting in significant fluorescent enhancement. The structural moiety associated with the locked-conformation dependent fluorescent enhancement phenomenon has been dubbed the molecular rotor motif or push-pull design. These molecular rotors perform twisted intramolecular charge transfer (TICT) from an electron donating group along a highly conjugated π system to an electron accepting group (D-π-A or D-A) [5]. This design concept has been applied to synthesize better binding fragments for extracellular amyloid plaques, one of the pathological hallmarks of Alzheimer-diseased brains [6]. However, more recent developments in the amyloid cascade hypothesis indicate that the deposition of amyloid plaques is not correlated with AD progression. More evidence has suggested that soluble Aβ oligomers, which precede amyloid plaque accumulation, are the first pathological change along the course progression of AD and are the most cytotoxic species [7,8,9]. Hence, chemical tools which can effectively inhibit the aggregation pathway of amyloid are essential for improvement of more dyes selective for soluble Aβ.
Herein, we report a series of compounds for which inhibition of the amyloid aggregation pathway was observed. Several compounds demonstrate potential within in vitro settings and for further development as chemical tools. A privileged stilbene scaffold is utilized as the conjugated π linker for these compounds [10,11,12,13,14,15,16,17,18,19,20,21]. The structural differences of these compounds were investigated to better inform design of amyloid-targeting compounds in general. Accordingly, this series indicates important considerations for Aβ aggregate inhibitors to aid in the development of more selective AD probes.
2. Results
2.1. Design and Synthesis of Compounds
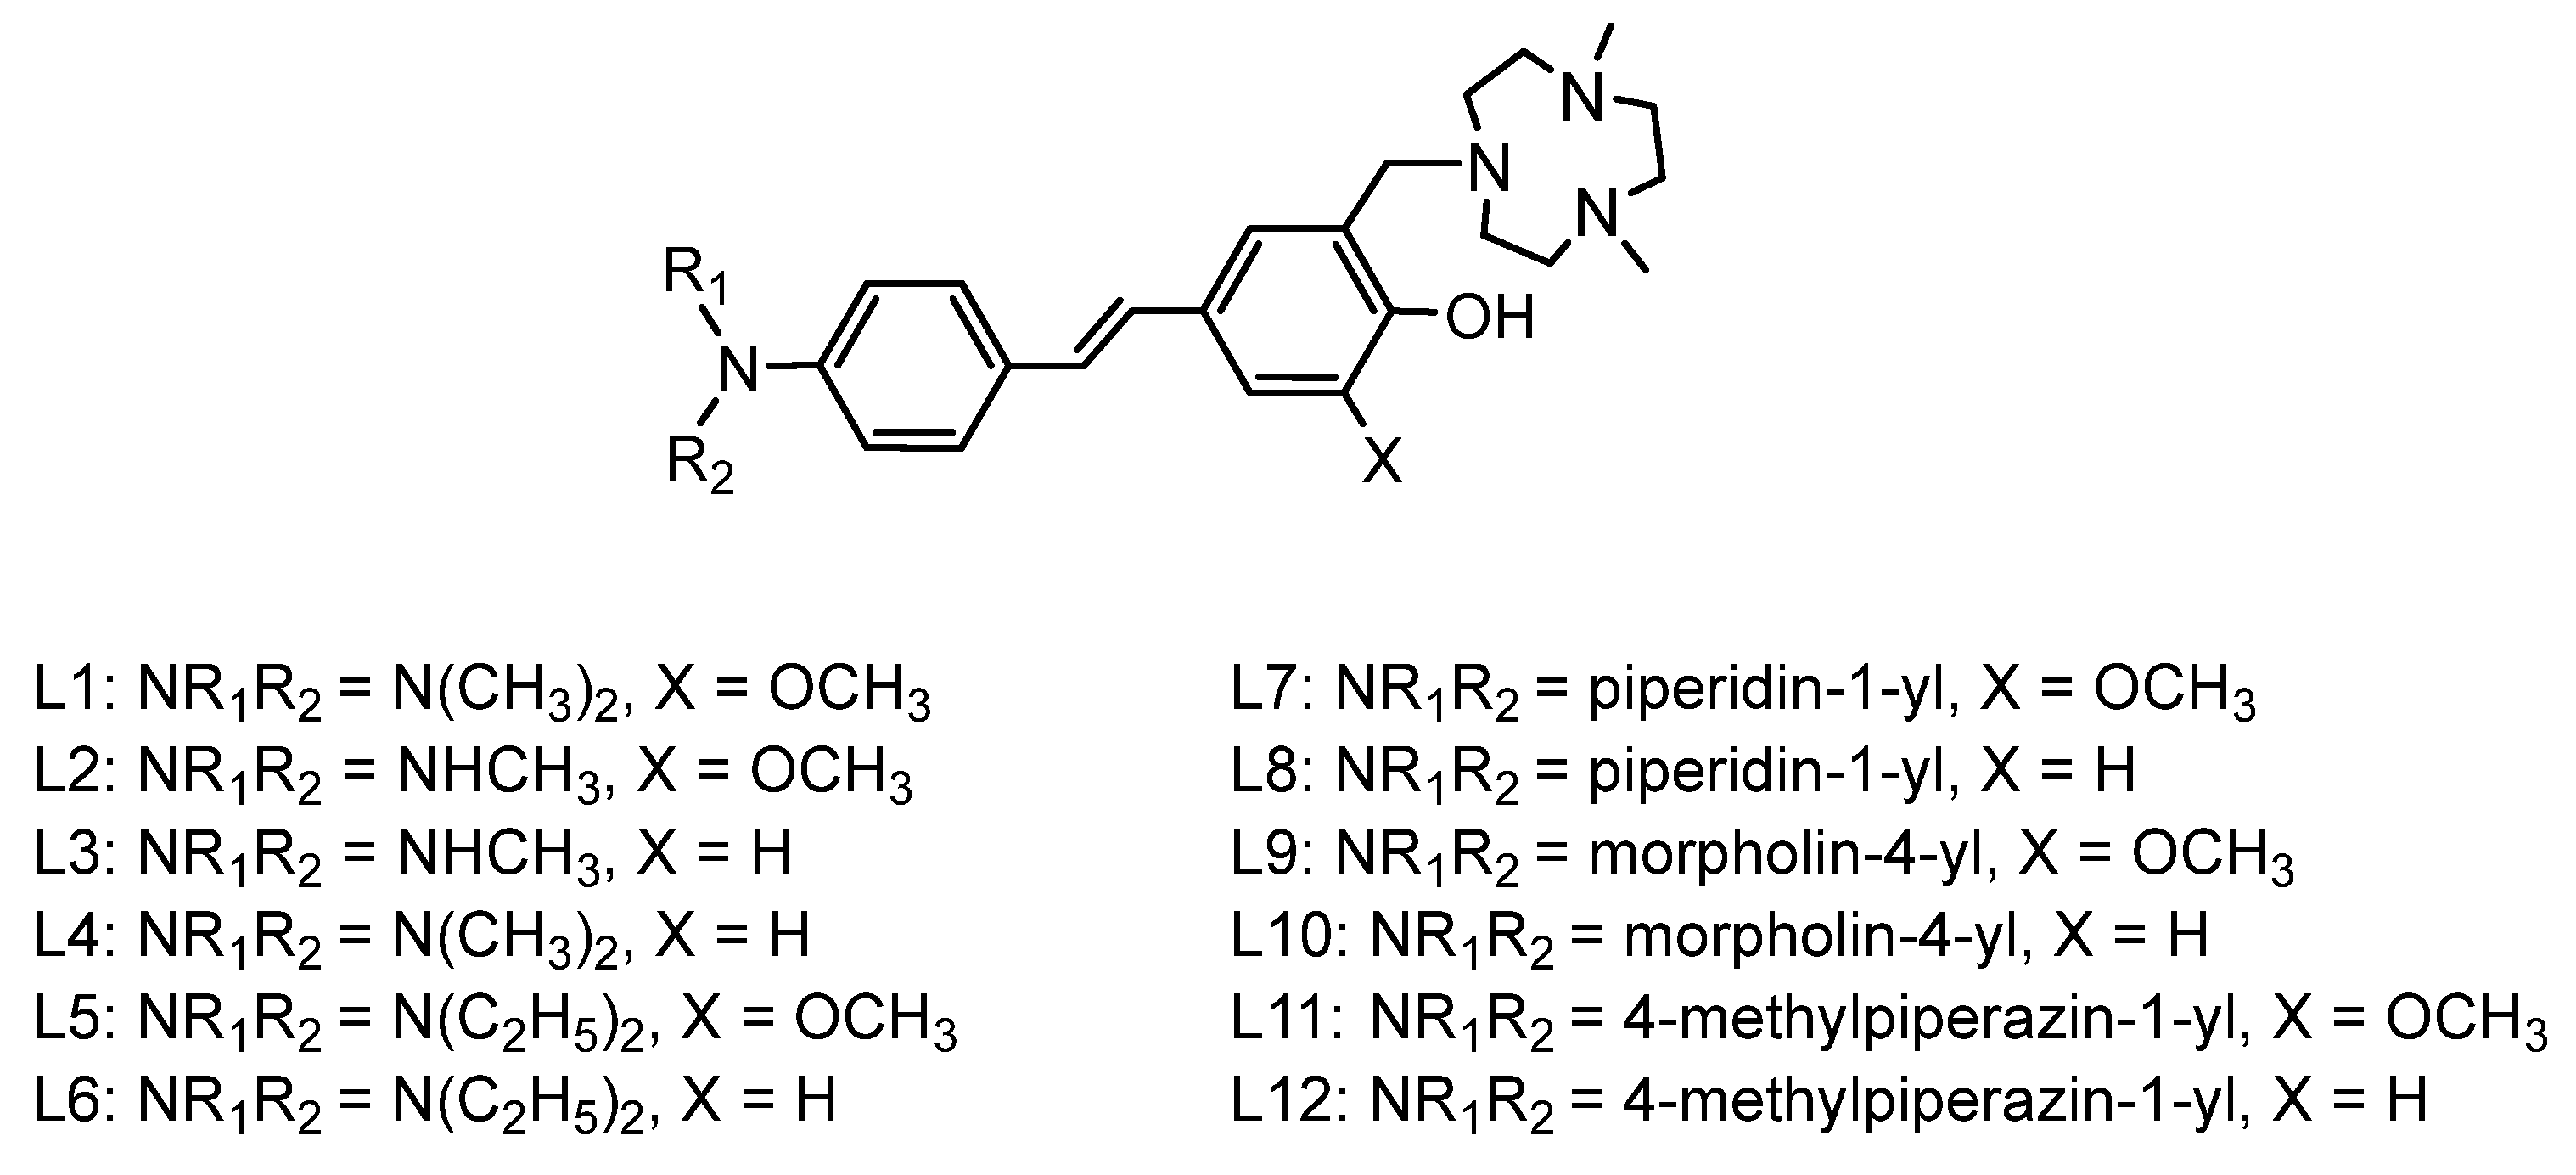
The Aβ binding compounds contain an alkylamine moiety as the electron donor. These alkylamine containing compounds have been previously used as electron donating groups [22]. The stilbene, a privileged scaffold within amyloid binding, serves as the π framework which bridges the donor group to the acceptor group, a substituted phenol, as shown in Figure 1 [15]. While the donor group is not expected to be the best electron acceptor group, it has previously been shown to be a useful moiety for amyloid binding [23].
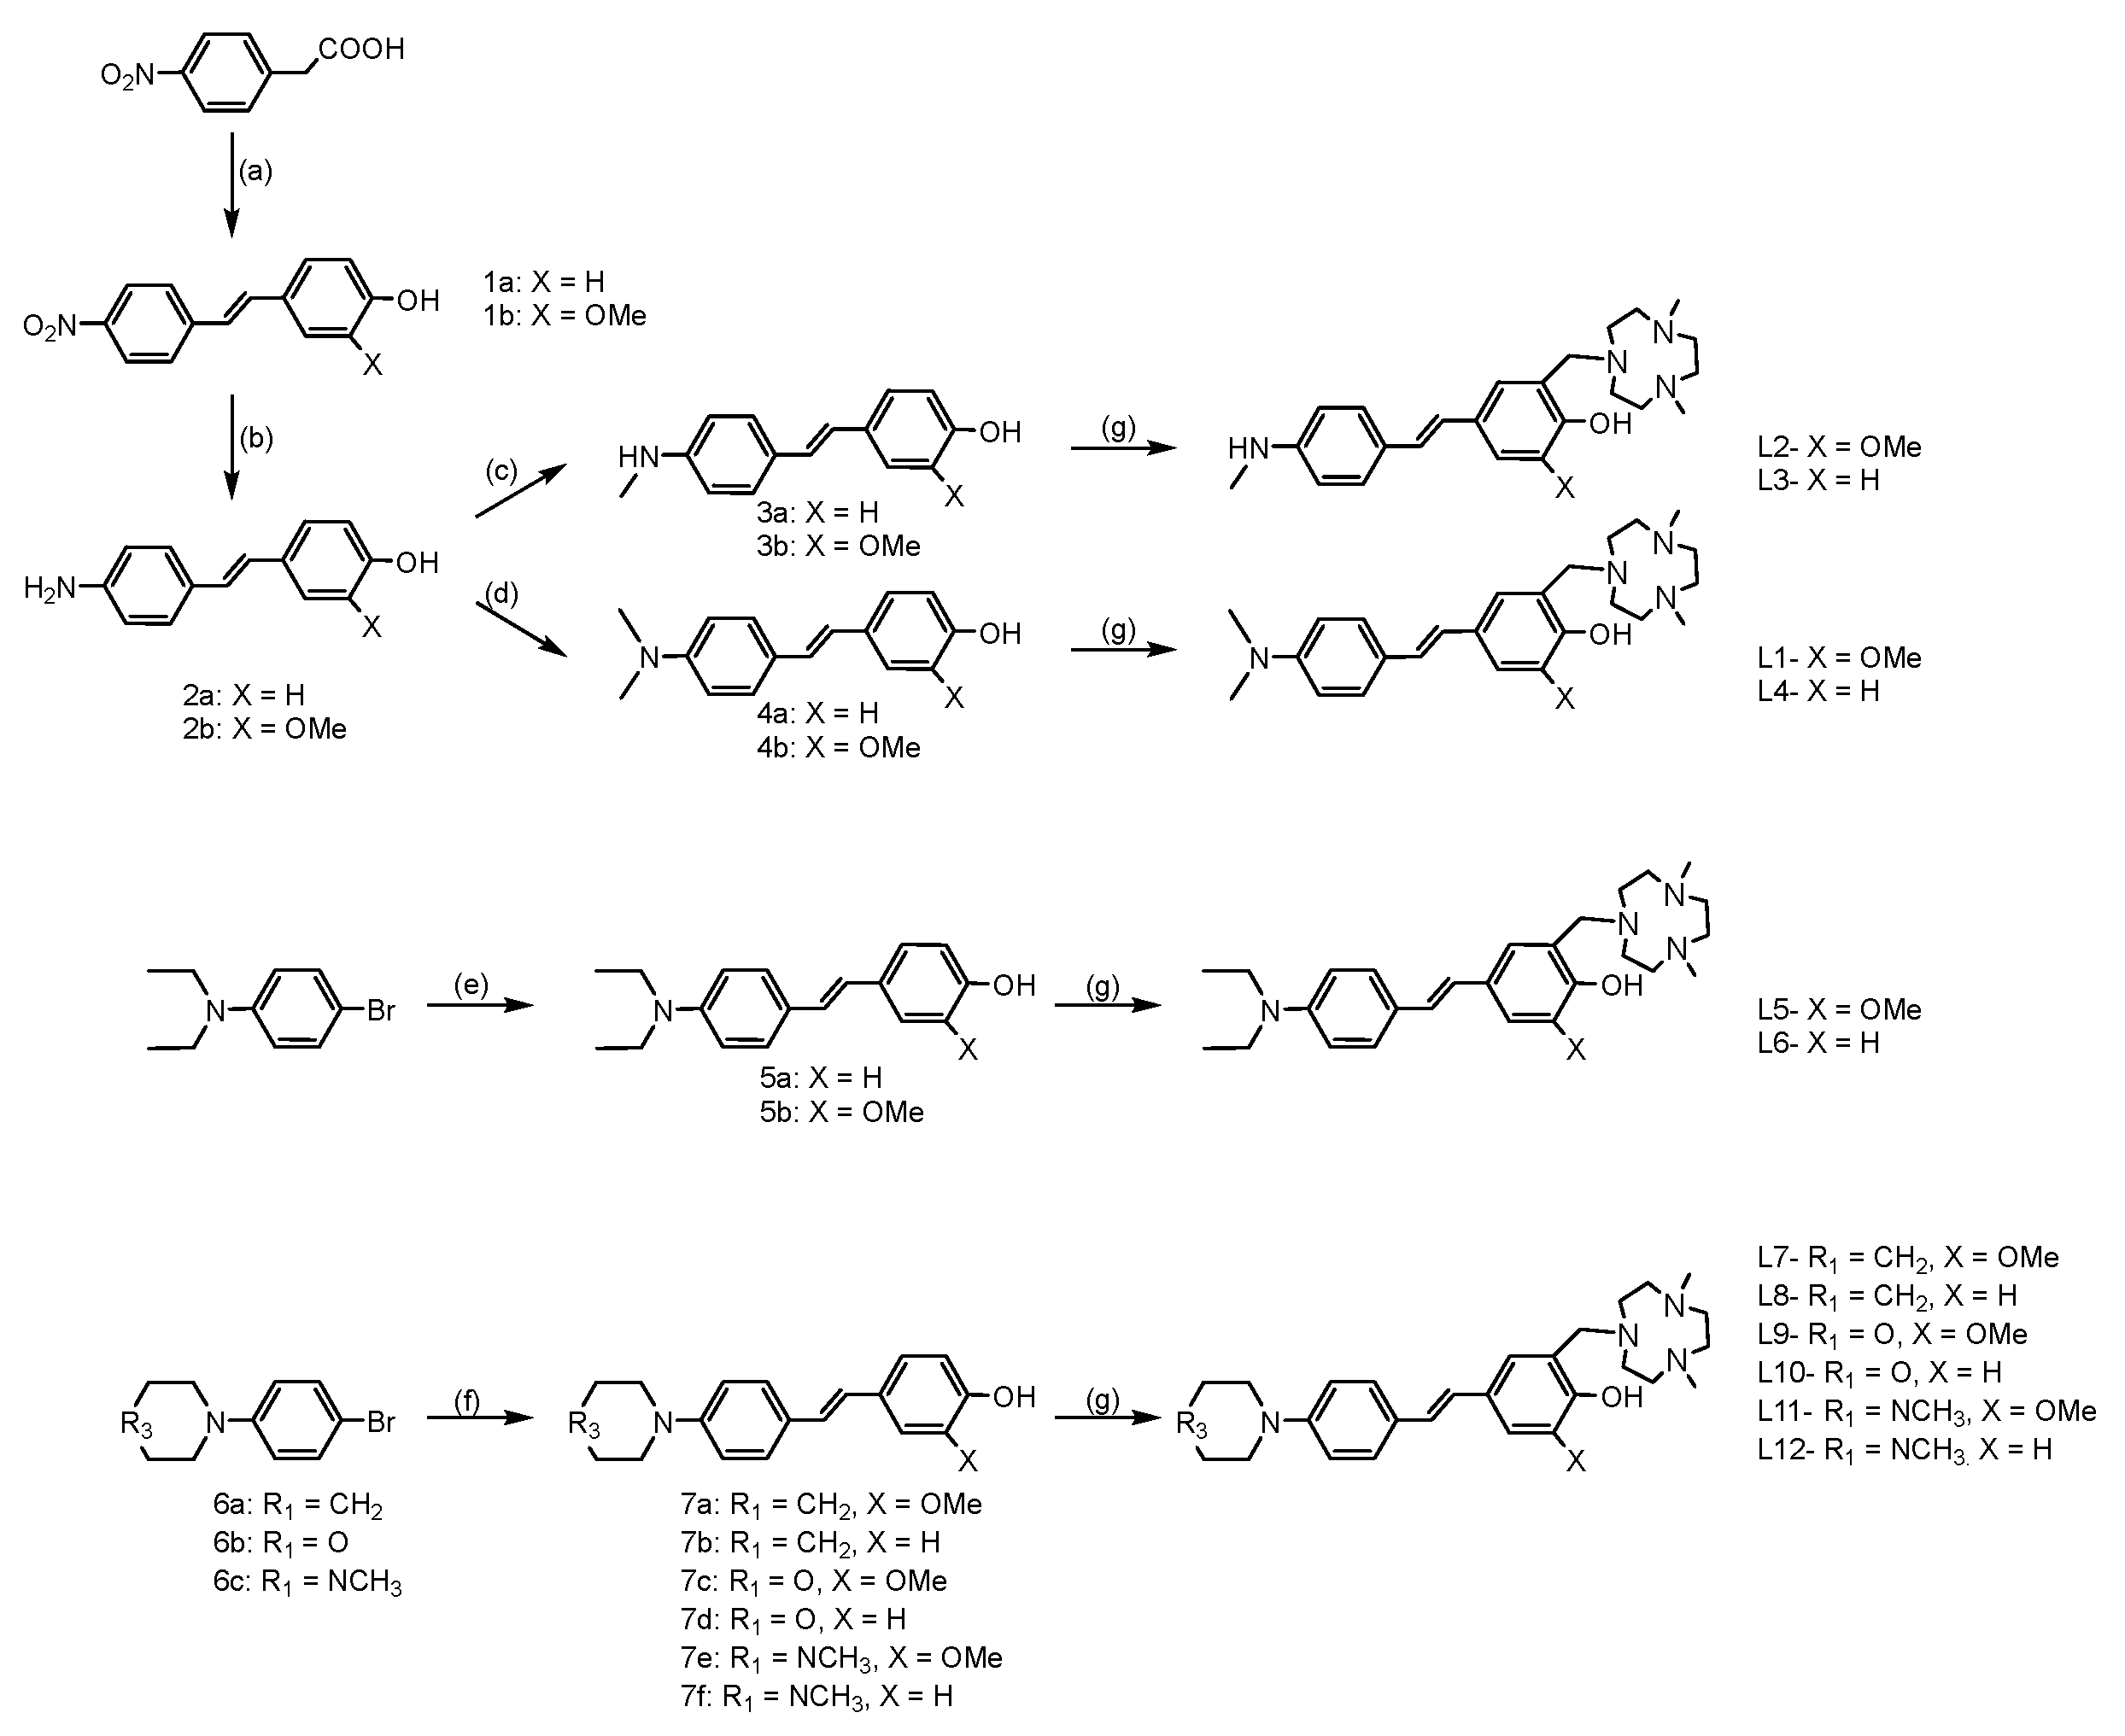
To better understand the structure-activity-relationships of these stilbene-based dyes, the electron donating (EDG) and electron accepting (EAG) groups were derivatized. The Aβ targeting stilbenes were synthesized using two different methods. The first method used followed the reported Kung procedure to successfully synthesize the mono- and di-methylamino stilbene derivatives [24]. The second method employed Heck reactions to generate the other stilbene products [25,26]. To synthesize the final compounds (L1, L2, L3, L4, L5, L6, L7, L8, L9, L10, L11, and L12) the Mannich reaction was performed among paraformaldehyde and an amine-containing fragment 2,4-dimethyl-1,4,7-triazacyclononane (tacn) with the stilbene derivatives (Scheme 1).
Two classes of EDGs were synthesized [27]. The first type of donor group was monomethyl, dimethyl, or diethylamine. The second type of donor group was more rigid piperidine derivatives. The effect of heteroatom substitution on the para- position of the EDG piperidine was also examined. This series contains moderately effective EAGs which allow minor EDG electronic differences to be studied for better comparison. The two studied EAGs were tacn-substituted phenols in the presence or absence of an ortho- methoxy group.
2.2. Fluorescence Turn-on Effect of Compounds with Aβ Species
A fluorescence turn-on assay was performed to interrogate the effect of structural differences on the fluorescence enhancement with Aβ aggregates. These compounds showed a range of low to moderate background fluorescence intensity. Increases in fluorescence intensity with different aggregates would be ideal for tools used in amyloid-based assays. For both the methyl and dimethyl EDGs, L1 and L2, the presence of an ortho- methoxy group on the EAG shows a slightly higher fluorescence enhancement with soluble amyloid beta (sAβ) over fibrils. L2, with a monomethylamine EDG, shows a greater fluorescence turn- on than L1, which has a dimethyl amine EDG. Without the ortho-methoxy group on the EAG, there is greater fluorescent enhancement for Aβ fibrils over sAβ for L3 and L4. The compounds containing a diethyl-amine EDG, L5 and L6, show a slightly greater turn-on with sAβ species, and the compound containing an ortho-methoxy on the EAG show no discernible difference. The larger fluorescent enhancement observed for L6 than L5 indicates the dimethylamine EDG/methoxy EAG pair has a greater TICT. The piperidine-EDG-containing L7 has only slightly higher turn-on with sAβ, which may be attributed to the ortho-methoxy group on the EAG. L8 does not have that methoxy group and exhibits a slightly greater turn-on for Aβ fibrils. In this case, it appears that the methoxy on the EAG diminishes the overall fluorescence of the compound since L8 has a greater baseline fluorescence and turn-on than L7. This is also the case for the morpholine-EDG-containing L9 and L10. The lack of a methoxy group on L10 EAG, in conjunction with the oxygen heteroatom from the morpholine EDG, electronically favors turn-on with Aβ fibrils to a slight extent. However, for L9, the addition of a methoxy group onto the EAG shows equal turn-on to both sAβ and Aβ fibrils. Changing the EDG to a methyl piperazine, L11, increases the baseline fluorescence and turn-on compared to L9. Interestingly, the addition of an o-methoxy for L9 does not follow the previous trend and instead diminishes overall fluorescence. L11 and L12, both containing a N-methyl piperazine EDG, show similar turn-on with sAβ and fibrils, and the o-methoxy EAG of L11 increases the overall baseline fluorescence compared to L12. L4, L8, and L10 have the greatest overall fluorescence enhancements with L8 showing the greatest fluorescent enhancement of these compounds (Figure 2). The spectra for the remaining compounds can be found in the Supplementary Information (Figure S1). L6 showed a comparable fluorescent turn-on but was not as fluorescent as the other three. None of the three compounds with the highest fluorescence contained an o-methoxy on the EAG.
The fluorescence properties of these compounds suggest that, at least for these stilbenes, the substitution of o-tacn onto the phenol EAG does not appreciably increase interactions with sAβ to cause a greater turn-on unlike previously reported results [23]. Notably, the fluorescence enhancement is modulated, either increasing or decreasing depending on the compound, by the addition of a methoxy substituent on the EAG. Finally, the fluorescence turn-on appears to depend on the EDG-EAG pair, instead of the individual strength of electron donation and acceptance of each group, respectively.
2.3. Aβ Inhibition Assays
To investigate the effect of these compounds on amyloid aggregation, inhibition of aggregation assays were performed using the Aβ40 peptide. Aβ40 has been implicated with inducing oxidative stress and is physiologically the most common isoform of amyloid peptide and is therefore a widely used isoform in amyloid assays [28,29]. These experiments track the time duration of fibril growth which is monitored by ThT fluorescence turn-on represented by the relative fluorescence unit (RFU) intensity. A lower RFU signifies a lack of soluble amyloid species as ThT binds to insoluble forms. Thus, a lower RFU can be interpreted as inhibiting the fibrillization of amyloid. L4 and L8 showed the best inhibition of amyloid aggregates as shown in Figure 3. The rest of the compounds show appreciable inhibition of Aβ aggregation as found in the SI (Figure S2), except for L9, which contains the morpholine EDG and a methoxy on the EAG (Figure 3). Lastly, although L2 and L3 show similar amyloid inhibition, the L3 compound lacking the o-methoxy group begins inhibition at an earlier time.
Likewise, based on the inhibition assays, the EAG methoxy once again plays an important role in tuning amyloid inhibition for these compounds. For instance, the piperidine EDG derivatives with the methoxy group on the EAG show lesser or later inhibition of aggregation. Comparing the different EDG of the mono- and disubstituted amine scaffold containing the same EAG suggests a general trend of greater Aβ fibril inhibition for the compounds containing an EAG without the o-methoxy group.
2.4. Cytotoxicity of Compounds in N2a Cells
For in cellula assays, useful Aβ inhibitors would require low toxicity. The Alamar blue assay was used for the evaluation of the cytotoxicity of these stilbenes. L2 has the highest cell viability at the highest tested concentration, 88%, while the rest show lower cell viability as shown in Figure 4. The monomethyl and methoxy groups on L2 may be attributed to reducing cytotoxicity in comparison to L1 and L3. Of the cyclic amine EDG derivatives, L9 and L12 have the best cell viability. The oxygen heteroatom on L9 does not play an important role in alleviating cell toxicity, but the addition of a methoxy group on this EDG-EAG system reduces toxicity. The extra methylated amine group from the piperazine EDG on L11 and L12 switches the cytotoxic effect of the methoxy group on the EAG, such that L12 is less cytotoxic. Interestingly, with the presence of the methoxy group, the cell viability increased compared to the counterpart compounds without that moiety, except for L11 versus L12.
2.5. Effect of Inhibitors on Aβ42 Neurotoxicity in N2a Cells
These compounds can chelate metals via their substituted tacn moiety on the phenol EAGs. Meaning that, these inhibitors may also have utility in metal-involved assays. Therefore, we tested their ability to inhibit the Cu-mediated Aβ42 cytotoxicity on N2a cells. This procedure has been adapted from our previous publications after finding that in vitro conditions for Aβ toxicity is best achieved with addition of copper [18,30,31,32]. As shown in Figure 5, L9 and L11 inhibit both Cu-stabilized Aβ42 and Aβ42-induced toxicity. The worst performing compounds were L4 and L8, for which toxicity was exacerbated. Lastly, contrasting the toxicity of the EAG counterparts, it appears that the o-methoxy group assists in rescuing the cells from toxicity. Similarly, the methoxy containing derivatives generally rescued cells from copper-induced toxicity. It is possible that the o-methoxy may rescue the Cu-stabilized Aβ42 toxicity in two ways, either via an o-vanillin-like antioxidant mode of action, or via improved Cu chelation. O-vanillin has previously shown antioxidant properties, which these compounds may emulate [43,44,45]. Cu chelation might be further improved with the methoxy arm, thereby increasing its copper binding affinity and reducing any Cu leaching [32,46].
In general, all compounds are well tolerated up to 5 μM. Specifically, L1, L5, L9, L10, L11, and L12 rescue cells from Cu-Aβ42 cytotoxicity, likely by modulating the formation of off-pathway aggregates between Aβ and metal ions. Even so, both cell viability and Cu-Aβ-induced toxicity studies show that dimethyl and diethyl EDG, L1-L6, have some level of toxicity associated with them, which is not found for the monomethyl, morpholine, and piperazine derivatives L7-L12. Also, the mechanism of the cytotoxicity of L4 with Cu and Aβ is not easily understood based on these studies. While the toxicity profiles of L11, L10, and L5 are acceptable for in vitro studies, the Aβ42 inhibition profile are not the best from this set of ligands.
2.6. Fluorescence Imaging of Amyloid Plaques in 5xFAD Mice Brain Sections
To further investigate the affinity of the developed compounds toward various Aβ aggregates in situ, the intrinsic fluorescence properties of the compounds were employed for their ability to stain insoluble amyloid plaques. For these studies, brain sections from 11-month-old 5xFAD transgenic mice, which rapidly develop severe amyloid pathology, were co-stained with stilbenes and HJ3.4 antibody. HJ3.4 is an anti-amyloid antibody that binds to the N-terminal region of Aβ peptide, thereby targeting both soluble and insoluble amyloid species [33,34,35].
Interestingly, for L3 and L4 a large amount of well-defined fluorescence staining was observed (Figure 6a, left image), and the plaques were also stained by AF594-HJ3.4 (middle image) and the two sets of fluorescence images were well colocalized as analyzed by the Pearson’s coefficient, confirming that the compounds efficiently accumulate into and label amyloid plaques specifically. However, with the introduction of the methoxy EAG on the mono- EDG stilbene derivatives, the binding selectivity of the compounds marginally decreases, and non-specific binding increases, affecting the imaging of Aβ as the Pearson’s coefficient decreases from R = 0.72 to R = 0.54. The dimethyl (R = 0.67 compared to R = 0.60 without OMe) and diethylamino (R = 0.74 compared to R = 0.70 without OMe) scaffold show better overall binding to amyloid and even greater Aβ selectivity with the methoxy EAG, whereas the piperidine EDG (R = 0.68 decreases to R = 0.66 with OMe) shows comparable results and similar trends to the monomethylamino structures with the addition of the methoxy group on the EAG. The morpholine EDG shows overall better selectivity to Aβ but shows slightly better colocalization without the methoxy EAG (R = 0.74 decreases to R = 0.71 with the OMe). The methyl piperazine EDG has good selectivity for Aβ species with the methoxy EAG but has slightly decreased selectivity without the methoxy group (R = 0.65 increases to R = 0.77 with the OMe). Positively, the in-situ brain section staining shows good colocalization of all compounds, with slight differences in selectivity for Aβ species between those compounds modulated by the addition or lack of the methoxy on the EAG.
2.7. Docking Studies of Compounds on Aβ
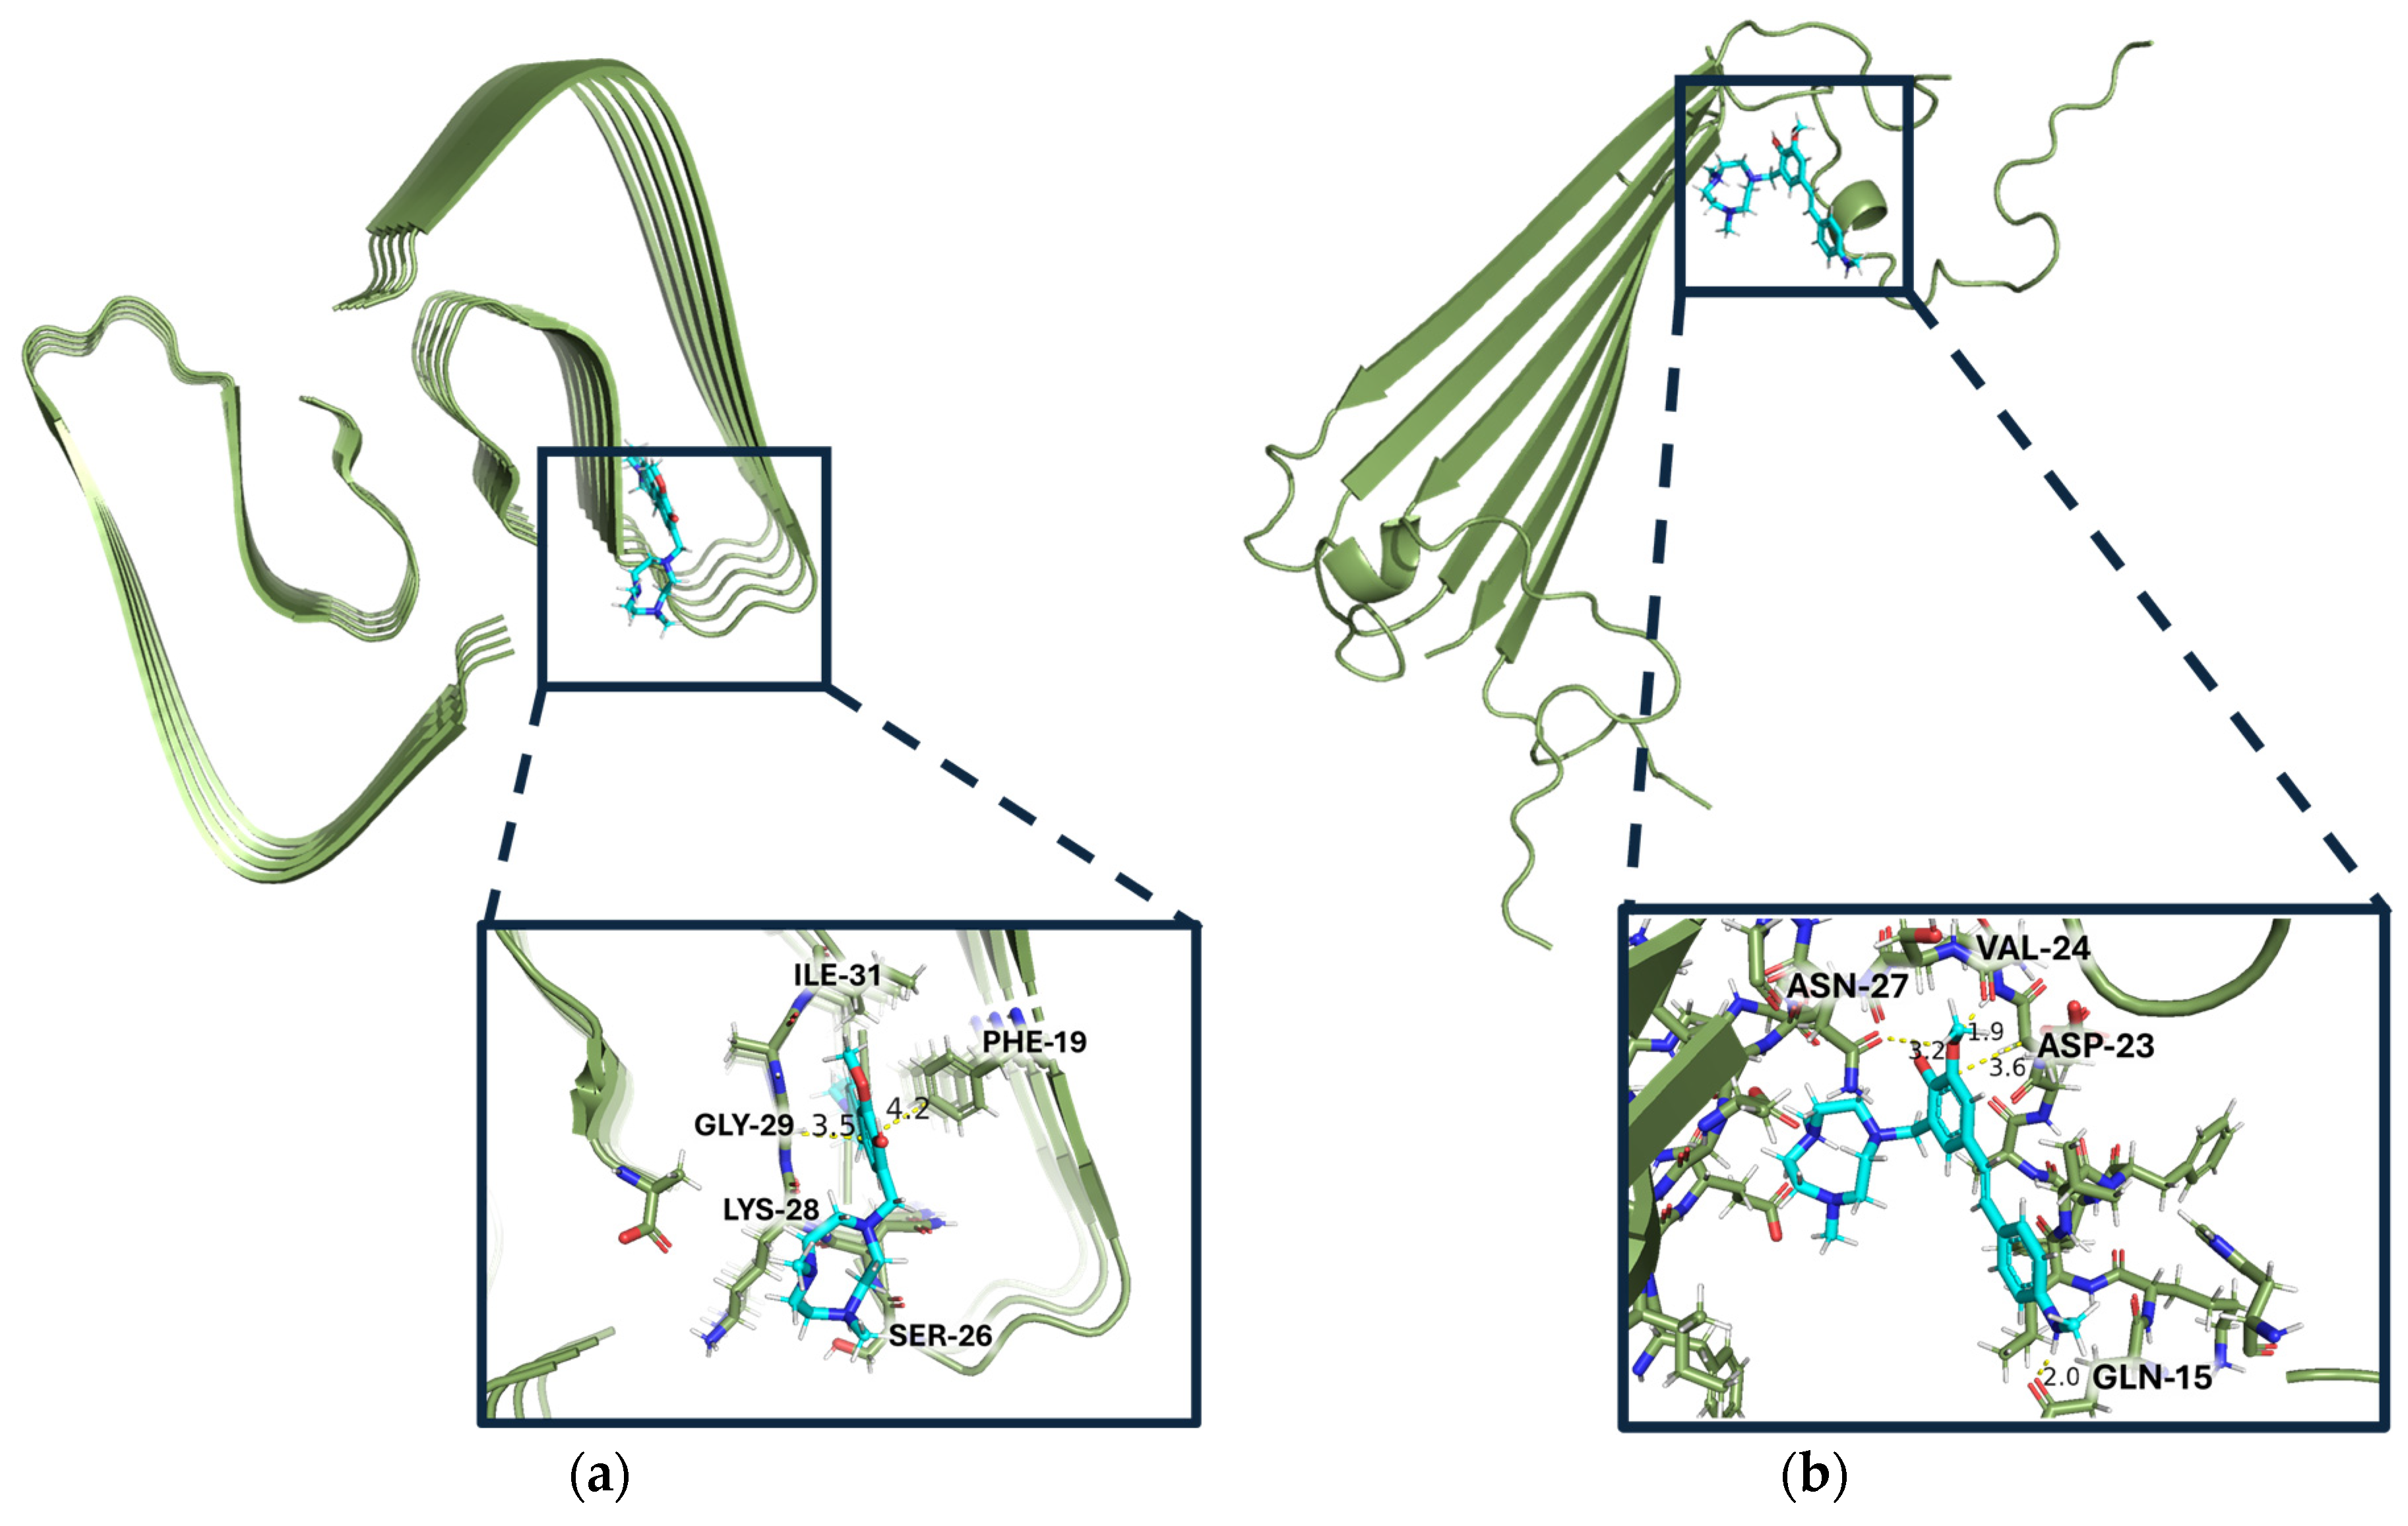
Finally, to gain understanding for how these Aβ inhibitors may interact with different Aβ42 aggregates, a series of docking studies were performed with Schrödinger Glide. Using the Aβ42 fibril structure (PDB ID: 5OQV) and the Aβ42 oligomer model (PDB ID: 6RHY), the most appropriate PDB model for soluble species to date, the compounds’ binding scores and binding pockets were investigated [36,37,38,39]. These PDBs were chosen because they most resemble a native conformation state for both fibrils and oligomers, respectively. Analysis for these compounds includes the docking score, an empirical score that approximates ligand binding free energy and considers Epik penalties [40,41,42]. The docking scores for each compound with both the Aβ42 fibril structure (5OQV) and the Aβ42 oligomer model (6HRY) can be found in Tables S1 and S2 in the Supplemental Information (SI). The best ligand for fibril docking (L7 with docking score of -7.749 on 5OQV) has a better docking score than the best ligand for soluble amyloid docking (L2 with docking score of -5.055 on 6RHY), suggesting that these compounds are generally better binders of amyloid fibrils over any other aggregates. Interestingly, the Aβ fibril-docked compounds all have the same binding pocket, interacting with the FKGA amino acid sequence. The compound with the best docking score for 5OQV is L7 (Figure 7a). L7, along with the next best docking compound for fibrils, L11, both have an ortho-methoxy on the EAG. These two compounds also have a third ring, piperidine and methyl piperazine, respectfully, that elongates the ligands. Based on the docking studies, increased length of the compound and a more planar EDG favour binding to the longer fibrillar structure, 5OQV.
Overall, these results confirm that the fluorescence assays are indicative of the electronic properties of the individual EDG and EAG displaying TICT behaviour since the binding modes are different depending on the Aβ model. Likewise, the docking scores suggest that the length and planarity of the π system are important factors for binding to amyloid species. Despite these compounds being non-selective against soluble or insoluble aggregates, they provide insight for potential rules on aggregate selectivity and may prove valuable for experimental controls in search of compounds selective for soluble Aβ aggregates.
3. Discussion
3.1. Interpretation of Docking Results
When docked onto the Aβ oligomer model, the binding pocket was different based on the compounds (Table S2). The compound with the best docking score onto oligomers (6RHY), L2, has a binding pocket consisting of the QVVNS amino acids (Figure 7b). According to the molecular modelling, all compounds containing an o-methoxy group on the EAG exhibit a greater docking score onto the fibrils than the non-o-methoxy derivative counterparts, except for L9 and L10. One explanation for this exception may be that these morpholine EDG containing compounds have such unfavourable binding in one region due to the oxygen heteroatom, that even the addition of a methoxy group on the EAG, while not overcoming these negative effects, may mitigate it such that the fluorescence enhancement is not significantly different from the others (Figure S1). There was no such trend of the methoxy arm when docked upon oligomers, 6RHY, suggesting that the methoxy arm does not particularly stabilize interactions with soluble amyloid species as it does with fibrils.
The opportunity for π stacking interactions between the phenylalanine from Aβ42 and the styryl backbone of these compounds can explain why the docking scores for these compounds are more favourable with Aβ fibrils than soluble aggregates. In lieu of π stacking interactions, the Aβ oligomer-docked compounds primarily relied on hydrogen bonding interactions of the tacn moiety with the peptide backbone. Notably the tacn moiety does not permit the planar stilbene region of the compounds to bind deeply within the grooves of either Aβ structure as expected for TICT compounds such as ThT. 6RHY’s, oligomers, shorter beta sheet prevents π interactions, unlike 5OQV’s, fibrils, longer sheet which better accommodates the stilbenes. All the while, the hydrophilic tacn moiety remains on the outskirts weakly binding to the protein. Although the binding pocket was different from Aβ fibrils to oligomers, the compounds still had very similar turn-on for both Aβ oligomers and fibrils in the fluorescence studies. L9, despite being the worst amyloid inhibitor from the inhibition assay, is not predicted to be the worst of these compounds for either aggregate docking, suggesting it may interact with a form of soluble amyloid aggregate not studied herein such as protofibrils [47,48,49].
3.2. Application of Amyloid Inhibitors
All these compounds are inhibitors of amyloid aggregation and can be used to modulate the formation of aggregates in vitro. In general, all compounds are well tolerated up to 5 μM, which may prove to be a limitation for most of them for in cellula experiments. While L1, L5, L9, L10, L11, and L12 all rescue the cells from Cu-Aβ42 cytotoxicity, it is important to note that the role of metals such as copper will affect the suitability of these compounds for such related assays. The toxicity profiles of L11, L10, and L5 show their utility for in cellula studies, but these three compounds were some of the lower performing amyloid inhibitors as indicated by the Aβ42 inhibition profile. The in-situ brain section staining shows good overlap between the compounds and the antibody control, signifying good selectivity for amyloid species. Based off the docking studies, it was determined that the increased length of the compound and a slightly more planar EDG favor binding to the longer fibrillar structure, 5OQV, and that, upon comparison with the docking scores for 6RHY, these compounds are generally more selective for the amyloid fibrils than any other aggregates. Overall, these results are informative for the design of amyloid-targeting inhibitors which can be advanced as chemical tools for the development of more selective soluble amyloid beta probes.
4. Materials and Methods
4.1. General Experimental Details
All reagents were purchased from commercial sources and used as received unless stated otherwise. All solutions and buffers were prepared using metal-free Millipore water that was treated with Chelex resin overnight and filtered through a 0.22 μm nylon filter. 1H NMR (300.121 MHz) spectra were recorded on a Varian Mercury-300 spectrometer. Chemical shifts were reported in ppm downfield from tetramethylsilane. UV−visible spectra were recorded on a Varian Cary 50 Bio spectrophotometer and were reported as λmax, nm (ε, M−1 cm−1). 5xFAD transgenic mice (Tg6799 line) overexpressing mutant human APP (695) with the Swedish (K670N, M671L), Florida (I716V), and London (V717I) were purchased from Jackson Laboratories (Bar Harbor, ME, USA). TEM analysis was performed at the Nano Research Facility (NRF) at Washington University. All normal and C-18 reversed-phase column chromatography was performed on a Teledyne Isco Combiflash Rf+.
4.2. Synthetic Details
The full synthetic route is shown in Scheme 2, and precursors are labelled as indicated on the schematic.
4.2.1. Synthesis of Precursors: 1a, 1b, 2a, 2b, 3a, 3b, 4a, and 4b
Compound 1a ((E)-4-(4-nitrostyryl)phenol) or 1b ((E)-2-methoxy-4-(4-nitrostyryl)phenol). A mixture of 2-(4-nitrophenyl) acetic acid (for 1a: 500 mg, 2.8 mmol)(for 1b: 2g, 11 mmol), (for 1a) 4-hydroxybenzaldehyde (337 mg, 2.8 mmol) or (for 1b) 2-methoxy-4-vinylphenol (1.68 g, 11 mmol), piperidine (for 1a: 271 μL)(for 1b: 1.1 mL) was added in toluene (1a: 50 mL, 1b: 100 mL). The resultant mixture was heated to reflux for 2 h. The solvent was removed, and the resulting residue was purified by silica gel column chromatography using EtOAc/Hexane (1: 3) to yield a yellow solid.
1a: (418 mg, 63%); 1H NMR (DMSO-d6): δ (ppm): 9.77 (s, 1H), 8.18 (d, 2H, J = 8.4 Hz), 7.77 (d, 2H, J = 8.5 Hz), 7.49 (d, 2H, J = 8.2 Hz), 7.42 (d, 1H, J = 16.6 Hz), 7.16 (d, J = 16.4 Hz, 1H), 6.79 (d, J = 8.1 Hz, 2H).
1b: (1.8 g, 60%); 1HNMR (Acetone-d6): δ (ppm) 8.21 (d, 2H, J = 9.0 Hz), 7.79 (d, 2H, J = 8.8 Hz), 7.45 (d, 1H, J = 16.4 Hz), 7.34 (d, 1H, J = 2.0 Hz), 7.25 (d, 1H, J = 16.4 Hz), 7.14 (dd, 1H, J = 8.1, 2.0 Hz), 3.92 (s, 2H).
Compound 2a ((E)-4-(4-aminostyryl)phenol) or 2b ((E)-4-(4-aminostyryl)-2-methoxyphenol) [50]. Stannous chloride (9.3 mol) was added to a solution of compound 1a or 1b (1.9 mmol) in ethanol (100 mL) followed by the addition of concentrated hydrochloric acid (0.75 mL). The solution was brought to reflux for 3 h and cooled to room temperature stirring overnight. Saturated sodium bicarbonate was added to adjust the pH to 8-9. After standard workup with ethyl acetate, crude product 2a or 2b was obtained and was used in the following step without further purifications.
2a: (394 mg, ∼100%); 1H NMR (DMSO-d6): δ (ppm): 9.46 (s, 1H), 7.28 (d, 2H, J = 8.7 Hz), 7.18 (d, 2H, J = 8.5 Hz), 6.78 (d, 2H, J = 2.6 Hz), 6.71 (d, 2H, J = 8.6 Hz), 6.52 (d, 2H, J = 8.5 Hz), 5.20 (s, 2H).
2b: (490 mg, ~100%); 1H NMR (Acetone-d6): δ (ppm): 7.59 (s, 1H), 7.27 (d, 2H, J = 8.5 Hz), 7.16 (d, 1H, J = 1.9 Hz), 7.00 – 6.89 (m, 2H), 6.86 (d, 1H, J = 16.3 Hz), 6.79 (d, 1H, J = 8.1 Hz), 6.66 (d, 2H, J = 8.6 Hz), 4.74 (s, 1H), 3.88 (s, 3H).
Compound 3a ((E)-4-(4-(methylamino)styryl)phenol) or 3b ((E)-2-methoxy-4-(4-(methylamino)styryl)phenol). To a mixture of 2a or 2b (0.5 mmol), paraformaldehyde (5 mmol), and sodium cyanoborohydride (1.5 mmol) was added in acetic acid (10 mL). The mixture was stirred at room-temperature overnight and then poured into 100 mL of water. Saturated sodium bicarbonate was added to adjust the pH to 8-9. After standard workup with dichloromethane, the residue was purified by silica gel column chromatography using EtOAc/Hexane (1:5) to afford 3a or 3b as a white solid.
3a: (108 mg, 48%); 1H NMR (CD3CN): δ (ppm): 7.37 (d, 2H, J = 8.7 Hz), 7.34 (d, 2H, J = 8.8 Hz), 6.94 (d, 1H, J = 16.4 Hz), 6.96 – 6.93 (m, 1H), 6.90 (d, 1H, J = 16.4 Hz, 6.60 (d, 2H, J = 8.6 Hz), 2.79 (s, 3H).
3b: (60 mg, 50%); 1H NMR (CD3CN): δ (ppm): 7.40 (d, 2H, J = 5.2 Hz), 7.37 (d, 1H, J = 4.9 Hz), 6.93 (d, 3H, J = 1.9 Hz), 6.81 (d, 2H, J = 8.7 Hz), 6.76 (d, 2H, J = 8.9 Hz), 2.96 (s, 6H).
Compound 4a ((E)-4-(4-(dimethylamino)styryl)phenol) or 4b ((E)-4-(4-(dimethylamino)styryl)-2-methoxyphenol). To a mixture of compound 2a or 2b (5.0 mmol), paraformaldehyde (50 mmol), and sodium cyanoborohydride (24 mmol) was added in acetic acid (100 mL). The mixture was stirred at room temperature overnight and then poured into 100 mL of water. Saturated sodium bicarbonate was added to adjust the pH to 8-9. After standard workup with dichloromethane (3×50 mL), the residue was purified by silica gel column chromatography using EtOAc/Hexane (1:10) to afford 4a or 4b as a white solid.
4a: (60 mg, 50%); 1H NMR (CD3CN): δ (ppm): 7.40 (d, 2H, J = 5.2 Hz), 7.37 (d, 1H, J = 4.9 Hz), 6.93 (d, 3H, J = 1.9 Hz), 6.81 (d, 2H, J = 8.7 Hz), 6.76 (d, 2H, J = 8.9 Hz), 2.96 (s, 6H).
4b: (50 mg, 46%); 1H NMR (Acetone-d6): δ (ppm) 7.61 (s, 1H), 7.39 (d, 2H, J = 8.8 Hz), 7.18 (d, 1H, J = 2.0 Hz), 7.01 – 6.94 (m, 2H), 6.90 (d, 1H, J = 16.3 Hz), 6.79 (d, 1H, J = 8.1 Hz), 6.73 (d, 2H, J = 8.9 Hz), 3.89 (s, 3H), 2.96 (s, 6H).
4.2.1. Synthesis of Compounds L1-L12
L1, (E)-2-((4,7-dimethyl-1,4,7-triazonan-1-yl)methyl)-4-(4-(dimethylamino)styryl)-6-methoxyphenol. Paraformaldehyde (5 mg, 0.1 mmol) was added to a solution of 1,4-dimethyl-1,4,7-triazacyclononane (18 mg, 0.1 mmol) in MeCN (20 mL), and the resultant mixture was heated to reflux for 30 min. A solution of compound 4a (27 mg, 0.1 mmol) in MeCN (10 mL) was added to the reaction flask and the solution was refluxed for an additional 24 h. The solvent was removed, and the resulting residue was purified by CombiFlash (reversed-phase) using MeCN/H2O/TFA (gradient wash from 10:90:1 to 30:70:1) to yield a light-yellow solution. The solution was neutralized by saturated NaHCO3 solution (30 mL) and extracted by dichloromethane (3×10 mL). The solvent was removed to yield a yellow semi-solid (13 mg, yield 30%). 1H NMR (CD3CN): δ (ppm): 7.39 (d, 2H, J = 8.8 Hz), 7.05 (d, 1H, J = 2.0 Hz), 6.95 (d, 1H, J = 16.4 Hz), 6.85 (d, 1H, J = 16.4 Hz), 6.79 (d, 1H, J = 2.0 Hz), 6.79 (d, 2H, J = 2.0 Hz), 3.86 (s, 3H), 3.83 (s, 2H), 2.95 (s, 6H), 2.91 – 2.80 (m, 4H), 2.67 – 2.60 (m, 4H), 2.55 (s, 4H), 2.36 (s, 6H).
L2, (E)-2-((4,7-dimethyl-1,4,7-triazonan-1-yl)methyl)-6-methoxy-4-(4-(methylamino)styryl)phenol. Paraformaldehyde (5 mg, 0.1 mmol) was added to a solution of 1,4-dimethyl-1,4,7-triazacyclononane (18 mg, 0.1 mmol) in MeCN (20 mL), and the resultant mixture was heated to reflux for 30 min. A solution of compound 3b (25 mg, 0.1 mmol) in MeCN (10 mL) was added to the reaction flask, and the solution was refluxed for an additional 24 h. The solvent was removed, and the resulting residue was purified by CombiFlash (reversed-phase) using MeCN/H2O/TFA (gradient wash from 10:90:1 to 30:70:1) to yield a light-yellow solution. The solution was neutralized by saturated NaHCO3 solution (30 mL) and extracted by dichloromethane (3×10 mL). The solvent was removed to yield a yellow semi-solid (15 mg, yield 34%). 1H NMR (CDCl3): δ (ppm): 7.33 (d, 2H, J = 8.6 Hz), 6.95 (d, 1H, J = 1.9 Hz), 6.86 (d, 1H, J = 16.3 Hz), 6.78 (d, 1H, J = 16.3 Hz), 6.74 (d, 1H, J = 1.9 Hz), 6.59 (d, 1H, J = 8.6 Hz), 3.92 (s, 3H), 3.83 (s, 2H), 3.00 – 2.91 (m, 4H), 2.86 (s, 3H), 2.78 – 2.70 (m, 4H), 2.63 (s, 4H), 2.40 (s, 6H).
L3, (E)-2-((4,7-dimethyl-1,4,7-triazonan-1-yl)methyl)-4-(4-(methylamino)styryl)phenol. Paraformaldehyde (5 mg, 0.1 mmol) was added to a solution of 1,4-dimethyl-1,4,7-triazacyclononane (18 mg, 0.1 mmol) in MeCN (20 mL), and the resultant mixture was heated to reflux for 30 min. A solution of compound 3a (22 mg, 0.1 mmol) in MeCN (10 mL) was added to the reaction flask, and the solution was refluxed for an additional 24 h. The solvent was removed, and the resulting residue was purified by CombiFlash (reversed-phase) using MeCN/H2O/TFA (gradient wash from 10:90:1 to 30:70:1) to yield a light-yellow solution. The solution was neutralized by saturated NaHCO3 solution (30 mL) and extracted by dichloromethane (3×10 mL). The solvent was removed to yield a yellow semi-solid (15 mg, 38%). 1H NMR (CD3CN): δ (ppm): 7.32 (d, 2H, J = 8.6 Hz), 7.28 (dd, 1H, J = 8.3, 2.3 Hz), 7.21 (d, 1H, J = 2.2 Hz), 6.91 (d, 1H, J = 16.4 Hz), 6.83 (d, 1H, J = 16.4 Hz), 6.76 (d, 1H, J = 8.3 Hz), 6.59 (d, 2H, J = 8.6 Hz), 4.51 (s, 1H), 3.86 (s, 2H), 2.93 – 2.83 (m, 4H), 2.78 (d, J = 3.1 Hz, 3H), 2.69 – 2.61 (m, 4H), 2.58 (s, 4H), 2.38 (s, 6H).
L4, (E)-2-((4,7-dimethyl-1,4,7-triazonan-1-yl)methyl)-4-(4-(dimethylamino)styryl)phenol. Paraformaldehyde (5 mg, 0.1 mmol) was added to a solution of 1,4-dimethyl-1,4,7-triazacyclononane (18 mg, 0.1 mmol) in MeCN (20 mL), and the resultant mixture was heated to reflux for 30 min. A solution of compound 4a (24 mg, 0.1 mmol) in MeCN (10 mL) was added to the reaction flask, and the solution was refluxed for an additional 24 h. The solvent was removed, and the resulting residue was purified by CombiFlash (reversed-phase) using MeCN/H2O/TFA (gradient wash from 10:90:1 to 30:70:1) to yield a light-yellow solution. The solution was neutralized by saturated NaHCO3 solution (30 mL) and extracted by dichloromethane (3×10 mL). The solvent was removed to yield a yellow semi-solid (13 mg, yield 32%). 1H NMR (CD3CN): δ (ppm): 7.38 (d, 2H, J = 8.7 Hz), 7.28 (dd, 1H, J = 8.3, 2.2 Hz), 7.18 (d, J = 2.2 Hz, 1H), 6.92 (d, 1H, J = 16.4 Hz), 6.86 (d, 1H, J = 16.4 Hz), 6.74 (d, 1H, J = 8.8 Hz), 6.71 (d, 1H, J = 8.1 Hz), 3.83 (s, 2H), 2.95 (s, 6H), 2.88 – 2.82 (m, 4H), 2.66 – 2.58 (m, 4H), 2.53 (s, 4H), 2.35 (s, 6H).
L5, (E)-4-(4-(diethylamino)styryl)-2-((4,7-dimethyl-1,4,7-triazonan-1-yl)methyl)-6-methoxyphenol. A mixture of 4-vinylphenol (200 mg, 1.7 mmol), 4-bromo-N,N-diethylaniline (388 mg, 1.7 mmol), triethanolamine (10 mL) and Pd(OAc)2 (23 mg, 0.1 mmol) was stirred under nitrogen at 100 °C for 24 h. The reaction was cooled to room temperature and quenched with water (5 mL). The resulting solution was extracted by ethyl acetate (3×20 mL). The solvent was removed and purified by silica gel column chromatography (ethyl acetate: hexane = 1:4) to obtain a crude product 5b. Then, paraformaldehyde (6 mg, 0.2 mmol) was added to a solution of 1,4-dimethyl-1,4,7-triazacyclononane (15 mg, 0.1 mmol) in MeCN (10 mL), and the resultant mixture was heated to reflux for 30 min. A solution of compound 5b (27 mg, 0.1 mmol) in MeCN (10 mL) was added to the reaction flask, and the solution was refluxed for an additional 24 h. The solvent was removed, and the resulting residue was purified by CombiFlash (reversed-phase) using MeCN/H2O/TFA (gradient wash from 10:90:1 to 30:70:1). The solution was neutralized by saturated NaHCO3 solution (30 mL), extracted by dichloromethane, and dried to give a yellow semi-solid (15 mg, yield 34%). 1H NMR (CDCl3): δ (ppm): 7.34 (d, 2H, J = 8.8 Hz), 7.27 (dd, 1H, J = 7.9 Hz), 7.11 (d, 1H, J = 2.2 Hz), 6.93 – 6.73 (m, 3H), 6.65 (d, 2H, J = 8.9 Hz), 3.83 (s, 2H), 3.37 (q, 4H, J = 7.1 Hz), 3.04 – 2.82 (m, 4H), 2.58 (s, 4H), 2.41 (s, 6H), 1.17 (t, J = 7.0 Hz, 6H). MS(ESI): Expected m/z 467.3386, found 467.3372 [M + H].
L6, (E)-4-(4-(diethylamino)styryl)-2-((4,7-dimethyl-1,4,7-triazonan-1-yl)methyl)phenol. A mixture of 2-methoxy-4-vinylphenol (200 mg, 1.3 mmol), 4-bromo-N,N-diethylaniline (297 mg, 1.3 mmol), triethanolamine (10 mL) and Pd(OAc)2 (23 mg, 0.1 mmol) was stirred under nitrogen at 100 °C for 24 h. The reaction was cooled to room temperature and quenched with water (5 mL). The resulting solution was extracted by ethyl acetate (3×20 mL). The solvent was removed, and the product purified by silica gel column chromatography (ethyl acetate: hexane = 1:4) to get crude material 5a. Then, paraformaldehyde (6 mg, 0.2 mmol) was added to a solution of 1,4-dimethyl-1,4,7-triazacyclononane (15 mg, 0.1 mmol) in MeCN (10 mL), and the resultant mixture was heated to reflux for 30 min. A solution of compound 5a (20 mg, 0.05 mmol) in MeCN (10 mL) was added to the reaction flask, and the solution was refluxed for an additional 24 h. The solvent was removed, and the resulting residue was purified by CombiFlash (reversed-phase) by using MeCN/H2O/TFA (gradient wash from 10:90:1 to 30:70:1). The solution was neutralized by saturated NaHCO3 solution (30 mL), extracted by dichloromethane (3×10 mL) and dried to give a yellow semi-solid (12 mg, yield 26%). 1H NMR (CDCl3): δ (ppm): 7.34 (d, 2H, J = 8.7 Hz), 6.95 (d, 1H, J = 1.8 Hz), 6.86 (d, 1H, J = 16.2 Hz), 6.81 – 6.72 (m, 2H), 6.65 (d, 2H, J = 8.8 Hz), 3.92 (s, 3H), 3.83 (s, 2H), 3.37 (q, 4H, J = 7.1 Hz), 2.99 – 2.86 (m, 4H), 2.80 – 2.70 (m, 4H), 2.63 (s, 4H), 2.40 (s, 6H), 1.17 (t, J = 7.0 Hz, 6H).
L7, (E)-2-((4,7-dimethyl-1,4,7-triazonan-1-yl)methyl)-6-methoxy-4-(4-(piperidin-1-yl)styryl)phenol. A mixture of 2-methoxy-4-vinylphenol (200 mg, 1.3 mmol), 1-(4-bromophenyl)piperidine (312 mg, 1.3 mmol), triethanolamine (10 mL) and Pd(OAc)2 (23 mg, 0.1 mmol) was stirred under nitrogen at 100 °C for 24 h. The reaction was cooled to room temperature and quenched with water (5 mL). The resulting solution was extracted by ethyl acetate (3×20 mL). The solvent was removed, and the product purified by silica gel column chromatography (ethyl acetate: hexane = 1:4) to get crude material 7a. Then, paraformaldehyde (6 mg, 0.2 mmol) was added to a solution of 1,4-dimethyl-1,4,7-triazacyclononane (15 mg, 0.1 mmol) in MeCN (10 mL), and the resultant mixture was heated to reflux for 30 min. A solution of compound 7a (20 mg, 0.05 mmol) in MeCN (10 mL) was added to the reaction flask, and the solution was refluxed for an additional 24 h. The solvent was removed, and the resulting residue was purified by CombiFlash (reversed-phase) by using MeCN/H2O/TFA (gradient wash from 10:90:1 to 30:70:1). The solution was neutralized by saturated NaHCO3 solution (30 mL), extracted by dichloromethane (3×10 mL) and dried to give a yellow semi-solid (12 mg, yield 26%). 1H NMR (CDCl3): δ (ppm): 7.36 (d, 2H, J = 8.7 Hz), 6.95 (d, 1H, J = 1.9 Hz), 6.89 (d, 2H, J = 8.8 Hz), 6.84 (s, 2H), 6.74 (d, 1H, J = 1.9 Hz), 3.92 (s, 3H), 3.83 (s, 2H), 3.22 – 3.14 (m, 4H), 2.99 – 2.88 (m, 4H), 2.77 – 2.68 (m, 4H), 2.62 (s, 4H), 2.40 (s, 6H), 1.69 (m, 4H), 1.64 – 1.51 (m, 2H). MS(ESI): Expected m/z 479.3386, found 479.3375 [M + H].
L8, (E)-2-((4,7-dimethyl-1,4,7-triazonan-1-yl)methyl)-4-(4-(piperidin-1-yl)styryl)phenol. A mixture of 4-vinylphenol (200 mg, 1.7 mmol), 1-(4-bromophenyl)piperidine (408 mg, 1.7 mmol), triethanolamine (10 mL) and Pd(OAc)2 (23 mg, 0.1 mmol) was stirred under nitrogen at 100 °C for 24 h. The reaction was cooled to room temperature and quenched with water (5 mL). The resulting solution was extracted by ethyl acetate (3×20 mL). The solvent was removed and purified by silica gel column chromatography (ethyl acetate: hexane = 1:4) to obtain a crude product 7b. Then, paraformaldehyde (6 mg, 0.2 mmol) was added to a solution of 1,4-dimethyl-1,4,7-triazacyclononane (15 mg, 0.1 mmol) in MeCN (10 mL), and the resultant mixture was heated to reflux for 30 min. A solution of compound 7b (27 mg, 0.1 mmol) in MeCN (10 mL) was added to the reaction flask, and the solution was refluxed for an additional 24 h. The solvent was removed, and the resulting residue was purified by CombiFlash (reversed-phase) using MeCN/H2O/TFA (gradient wash from 10:90:1 to 30:70:1). The solution was neutralized by saturated NaHCO3 solution (30 mL), extracted by dichloromethane, and dried to give a yellow semi-solid (15 mg, yield 34%). 1H NMR (CDCl3): δ (ppm): 7.36 (d, 2H, J = 8.8 Hz), 7.29 (dd, 1H, J = 8.4, 2.2 Hz), 7.11 (d, 1H, J = 2.2 Hz), 6.95 – 6.78 (m, 5H), 3.83 (s, 2H), 3.26 – 3.14 (m, 4H), 2.98 – 2.84 (m, 4H), 2.72 – 2.62 (m, 4H), 2.56 (s, 4H), 2.39 (s, 6H), 1.71 (m, 4H), 1.65 – 1.51 (m, 2H). MS(ESI): Expected m/z 449.3280, found 449.3262 [M + H].
L9, (E)-2-((4,7-dimethyl-1,4,7-triazonan-1-yl)methyl)-6-methoxy-4-(4-morpholinostyryl)phenol. A mixture of 2-methoxy-4-vinylphenol (200 mg, 1.3 mmol), 4-(4-bromophenyl)morpholine (315 mg, 1.3 mmol), triethanolamine (10 mL) and Pd(OAc)2 (23 mg, 0.1 mmol) was stirred under nitrogen at 100 °C for 24 h. The reaction was cooled to room temperature and quenched with water (5 mL). The resulting solution was extracted by ethyl acetate (3×20 mL). The solvent was removed, and the product purified by silica gel column chromatography (ethyl acetate: hexane = 1:4) to get crude material 7c. Then, paraformaldehyde (6 mg, 0.2 mmol) was added to a solution of 1,4-dimethyl-1,4,7-triazacyclononane (15 mg, 0.1 mmol) in MeCN (10 mL), and the resultant mixture was heated to reflux for 30 min. A solution of compound 7c (20 mg, 0.05 mmol) in MeCN (10 mL) was added to the reaction flask, and the solution was refluxed for an additional 24 h. The solvent was removed, and the resulting residue was purified by CombiFlash (reversed-phase) by using MeCN/H2O/TFA (gradient wash from 10:90:1 to 30:70:1). The solution was neutralized by saturated NaHCO3 solution (30 mL), extracted by dichloromethane (3×10 mL) and dried to give a yellow semi-solid (12 mg, yield 26%). 1H NMR (500 MHz, CDCl3) δ 7.33 (d, J = 8.7 Hz, 2H), 6.90 (s, 1H), 6.82 (d, J = 8.7 Hz, 2H), 6.80 (s, 2H), 6.72 (s, 1H), 3.86 (s, 3H), 3.79 (m, 8H), 3.15 – 3.09 (m, 4H), 2.86 (m, 4H), 2.76 (m, 4H), 2.40 (s, 6H). MS(ESI): Expected m/z 481.3179, found 481.3162 [M + H].
L10, (E)-2-((4,7-dimethyl-1,4,7-triazonan-1-yl)methyl)-4-(4-morpholinostyryl)phenol. A mixture of 4-vinylphenol (200 mg, 1.7 mmol), 4-(4-bromophenyl)morpholine (411 mg, 1.7 mmol), triethanolamine (10 mL) and Pd(OAc)2 (23 mg, 0.1 mmol) was stirred under nitrogen at 100 °C for 24 h. The reaction was cooled to room temperature and quenched with water (5 mL). The resulting solution was extracted by ethyl acetate (3×20 mL). The solvent was removed and purified by silica gel column chromatography (ethyl acetate: hexane = 1:4) to obtain a crude product 7d. Then, paraformaldehyde (6 mg, 0.2 mmol) was added to a solution of 1,4-dimethyl-1,4,7-triazacyclononane (15 mg, 0.1 mmol) in MeCN (10 mL), and the resultant mixture was heated to reflux for 30 min. A solution of compound 7d (27 mg, 0.1 mmol) in MeCN (10 mL) was added to the reaction flask, and the solution was refluxed for an additional 24 h. The solvent was removed, and the resulting residue was purified by CombiFlash (reversed-phase) using MeCN/H2O/TFA (gradient wash from 10:90:1 to 30:70:1). The solution was neutralized by saturated NaHCO3 solution (30 mL), extracted by dichloromethane, and dried to give a yellow semi-solid (15 mg, yield 34%). 1H NMR (CD3CN): δ (ppm): 7.42 (d, J = 8.8 Hz, 2H), 7.31 (dd, J = 8.3, 2.3 Hz, 1H), 7.23 (d, J = 2.2 Hz, 1H), 6.93 (d, J = 7.6 Hz, 4H), 6.75 (d, J = 8.3 Hz, 1H), 3.86 (s, 2H), 3.83 – 3.73 (m, 4H), 3.19 – 3.09 (m, 4H), 2.89 – 2.84 (m, 4H), 2.68 – 2.61 (m, 4H), 2.57 (s, 4H), 2.37 (s, 6H). MS(ESI): Expected m/z 450.3073, found 451.3059 [M + H].
L11, (E)-2-((4,7-dimethyl-1,4,7-triazonan-1-yl)methyl)-6-methoxy-4-(4-(4-methylpiperazin-1-yl)styryl)phenol. A mixture of 2-methoxy-4-vinylphenol (200 mg, 1.3 mmol), 1-(4-bromophenyl)methylpiperazine (332 mg, 1.3 mmol), triethanolamine (10 mL) and Pd(OAc)2 (23 mg, 0.1 mmol) was stirred under nitrogen at 100 °C for 24 h. The reaction was cooled to room temperature and quenched with water (5 mL). The resulting solution was extracted by ethyl acetate (3×20 mL). The solvent was removed, and the product purified by silica gel column chromatography (ethyl acetate: hexane = 1:4) to get crude material 7e. Then, paraformaldehyde (6 mg, 0.2 mmol) was added to a solution of 1,4-dimethyl-1,4,7-triazacyclononane (15 mg, 0.1 mmol) in MeCN (10 mL), and the resultant mixture was heated to reflux for 30 min. A solution of compound 7e (20 mg, 0.05 mmol) in MeCN (10 mL) was added to the reaction flask, and the solution was refluxed for an additional 24 h. The solvent was removed, and the resulting residue was purified by CombiFlash (reversed-phase) by using MeCN/H2O/TFA (gradient wash from 10:90:1 to 30:70:1). The solution was neutralized by saturated NaHCO3 solution (30 mL), extracted by dichloromethane (3×10 mL) and dried to give a yellow semi-solid (12 mg, yield 26%). 1H NMR (CDCl3): δ (ppm) 7.41 (d, 2H, J = 8.7 Hz), 6.98 (d, 1H, J = 1.9 Hz), 6.93 (d, 2H, J = 10.9 Hz), 6.88 (s, 2H), 6.78 (d, 1H, J = 1.9 Hz), 3.95 (s, 3H), 3.86 (s, 2H), 3.29 – 3.24 (m, 4H), 3.02 – 2.92 (m, 4H), 2.81 – 2.73 (m, 4H), 2.68 (s, 4H), 2.63 – 2.58 (m, 4H), 2.44 (s, 6H), 2.38 (s, 3H). MS(ESI): Expected m/z 494.3495, found 494.3481 [M + H].
L12, (E)-2-((4,7-dimethyl-1,4,7-triazonan-1-yl)methyl)-4-(4-(4-methylpiperazin-1-yl)styryl)phenol. A mixture of 4-vinylphenol (200 mg, 1.7 mmol), 1-(4-bromophenyl)methylpiperazine (433 mg, 1.7 mmol), triethanolamine (10 mL) and Pd(OAc)2 (23 mg, 0.1 mmol) was stirred under nitrogen at 100 °C for 24 h. The reaction was cooled to room temperature and quenched with water (5 mL). The resulting solution was extracted by ethyl acetate (3×20 mL). The solvent was removed and purified by silica gel column chromatography (ethyl acetate: hexane = 1:4) to obtain a crude product 7f. Then, paraformaldehyde (6 mg, 0.2 mmol) was added to a solution of 1,4-dimethyl-1,4,7-triazacyclononane (15 mg, 0.1 mmol) in MeCN (10 mL), and the resultant mixture was heated to reflux for 30 min. A solution of compound 7f (27 mg, 0.1 mmol) in MeCN (10 mL) was added to the reaction flask, and the solution was refluxed for an additional 24 h. The solvent was removed, and the resulting residue was purified by CombiFlash (reversed-phase) using MeCN/H2O/TFA (gradient wash from 10:90:1 to 30:70:1). The solution was neutralized by saturated NaHCO3 solution (30 mL), extracted by dichloromethane, and dried to give a yellow semi-solid (15 mg, yield 34%). 1H NMR (500 MHz, CDCl3) δ 7.30 (d, 2H, J = 8.9 Hz), 7.11 (s, 1H), 6.82 (d, 2H, J = 8.5 Hz), 6.79 (s, 4H), 3.76 (s, 2H), 3.17 (m, 4H), 2.83 - 2.80 (m, 4H), 2.70-2.73 (m, 4H), 2.63 - 2.59 (m, 4H), 2.54 - 2.47 (m, 4H), 2.35 (s, 6H), 2.28 (s, 3H). MS(ESI): Expected m/z 464.3389, found 464.3368 [M + H].
4.3. Amyloid β Peptide Experiments
4.3.1. Fluorescence Turn-on and Cell Studies
Aβ42 powder was prepared by dissolving commercial Aβ42 peptide (AnaSpec or GL Biochem) in ammonium hydroxide solution (1%, v/v). The solution was then aliquoted out and lyophilized overnight. The resulting aliquoted powder was stored at –80 °C. Aβ42 monomers were generated by dissolving Aβ42 powder in 1,1,1,3,3,3-hexafluoro-2-propanol (HFIP, 1 mM) and incubating for 1 h at room temperature. The solution was then evaporated overnight and dried by vacuum centrifuge to result in monomeric films. Aβ42 fibrils were generated by dissolving the monomeric Aβ42 films in DMSO, diluting into the appropriate buffer, and incubating for 24 h at 37 °C with continuous agitation (final DMSO concentration was < 2%). For preparation of Aβ42 oligomers, the peptides were suspended in PBS buffer and incubated overnight at 4 °C. (The ThT negative control, since ThT does not bind to soluble aggregates [51], and UV-Vis confirming that sAβ42, but not fibrillar Aβ42 was formed is shown in the SI). Amyloid beta procedures were validated in previous publications [23,30].
4.3.2. Inhibition Assay
For monitoring the inhibition of Aβ40 fibrils, a peptide solution of 25 μM Aβ40 monomers (AnaSpec) was prepared and incubated at 37 °C with shaking for 48 hours (final DMSO concentration was < 2%), in the presence of 5 μM ThT and 5 μM of compound. The ThT fluorescent signal was monitored at 485 nm upon 435 nm excitation. This procedure has been established in a previous publication [52].
4.4. Fluorescence Spectra Measurements
All fluorescence measurements were performed by using a SpectraMax M2e plate reader (Molecular Devices). The fluorescence spectra of the compounds’ solution (100 μL PBS, 5.0 µM) were recorded with excitation at 380 nm and emission wavelength from 400 to 680 nm. To PBS solutions (100 μL) of compound (5.0 µM), various Aβ42 species were added to the solution, final concentrations of 5.0 µM, 25.0 µM, and their fluorescence spectra (λmax of emission) were determined as described as above.
4.5. Alamar Blue Assay
Mouse neuroblastoma Neuro2A (N2A) cell lines were purchased from the American Type Culture Collection (ATCC). Cells were grown in DMEM/10% FBS, which is the regular growth media for N2A cells, in a humidified atmosphere with 5% CO2 at 37 °C. N2A cells were seeded in a clear 96-well plate (2.5 × 10⁴/well) with DMEM/10% FBS. The media was changed to DMEM/N-2 media 24 h later. After 1 h, the treatment reagents were added. Owing to the poor solubility of compounds in the media, the final amount of DMSO used was 1% (v/v). After an additional incubation of 40 h, the Alamar Blue solution was added in each well and the cells were incubated for 90 min at 37 °C. Fluorescence intensity was measured at 590 nm (excitation wavelength = 560 nm).
4.5.1. Cytotoxicity Studies
Alamar Blue assay followed as described with the following treatment reagents: 20 μM compounds, 10 μM compounds, 5 μM compounds, and 2 μM compounds.
4.5.2. N2a Cell Rescue Studies
Alamar Blue assay followed as described with the following treatment reagents: 20 μM Aβ42 species, 5 μM compounds, and 20 μM CuCl2.
4.6. Molecular Docking
Molecular docking studies were performed with the Schrödinger Suite software. Protein structure Aβ42 tetramers (PDB ID: 6RHY) and the Aβ42 fibrils (PDB ID: 5OQV) were imported from the RCSB database and optimized by minimal minimization with the OPLS3 force field using the Protein Preparation Wizard program. The LS stilbene derivatives were prepared using Ligprep, and the pH was set as 7.0 ± 2.0 using Epik. The resulting different protonation states of the compounds were obtained and used for docking studies. The grid size was set to include the whole optimized protein structure in each direction. The final molecular docking was performed using Glide. The calculated poses were ranked by both the docking score and Glide e-model energy, and the structures with the best docking scores and Glide e-model energies were rendered in PyMol.
4.7. Histological Staining of 5xFAD Mice Brain Sections
To evaluate the Aβ binding specificity of the compounds in vitro, brain sections from 11-month-old 5xFAD mice were washed with PBS (3 × 5 min) and blocked with bovine serum albumin (2% BSA in PBS, pH 7.4, 10 min). Then the sections were incubated with 25 μM of multifunctional compounds and sequentially stained with HJ3.4 antibody (Professor David Holtzman, 1 μg/mL) 30 minutes respectively. The brain sections were treated with 2%BSA-PBS again for 4 min to remove any compounds or antibodies that were non-specifically binding to the tissue. Finally, the sections were washed with PBS (3 × 2 min), DI water (2 min) and mounted with non-fluorescent mounting media (Vectashield). Colocalization analysis and determination of the Pearson’s correlation coefficient was performed with the imaging software Fiji (ImageJ 1.52p). Mouse brains were harvested in compliance with the Institutional Animal Care and Use Committee of the University of Illinois at Urbana-Champaign (IACUC protocol #22094).
4.8. Log D Measurement
The determination of log D values for N-alkylamino multifunctional compounds was performed using a slightly modified reported procedure [53]. The compounds (final concentration 10 μM) were added to the premix suspension containing 0.5 mL octanol and 0.5 mL octanol-saturated PBS buffer (pH=7.4). The resulting mixture was stirred vigorously for 5 minutes and centrifuged at 2000 rpm for 5 minutes. The octanol layer was separated from PBS layer, and the fluorescence spectrum was recorded. The rest 0.5 mL PBS layer was partitioned with 0.5 mL PBS-saturated octanol, and the octanol layer was separated after 5 minutes vigorously shaking and centrifuging. The fluorescence spectrum of the octanol layer was recorded. The log D value was calculated by the fluorescence intensity ratio for the two octanol layers. Each experiment was completed in triplicate and the error represents standard deviation for the average log D values.
5. Conclusions
Aβ oligomer-targeting dyes are highly sought after for both fundamental and translational research applications. The series of compounds described herein can serve as chemical tools, such as aggregation inhibitors or amyloid handles, for the development of better and more sAβ-selective compounds. By understanding the electronic contributions of EDGs and EAGs on a stilbene π system, and the effect of these groups in cellular toxicity and their participation in amyloid binding, we have established that these compounds can be effective in the appropriate amyloid-based assay.
O-methoxy-containing compounds generally have decreased amyloid specificity, have decreased toxicity, rescue Cu-induced Aβ42 toxicity, and exhibit lower overall fluorescence compared to the non-methoxy analogues. Based on the docking studies, the different binding modes of these compounds to Aβ fibril and oligomer models suggest that the slight electronic contributions of EDG/EAG to TICT can be inferred from the fluorescence assays as the fluorescent turn-on between Aβ fibrils and soluble aggregates were similar. Hence, the fluorescence intensities and turn-on show that TICT fluorescence depends on the EDG-EAG pair rather than the individual strength of electron donation and/or acceptance of each group. Another insight from molecular docking was that, for sAβ turn-on preference amphiphilicity is likely not solely responsible as previously suggested [23]. The length and planarity of the hydrophobic stilbene ligand may also be important. Despite several of these compounds having incompatible toxicity profiles for in cellula studies, compounds, such as L4 and L8, showed promise by halting aggregation before the development of insoluble fibrils and having promising toxicity profiles for being used as leads for further development as molecular tools.
Current Aβ dyes have high affinity but suffer low selectivity for specific amyloid species: soluble and insoluble. Small molecule inhibitors with both high affinity and selectivity to certain Aβ species would be immensely useful for both fundamental and translational research applications. The compounds reported herein are inhibitors of amyloid aggregation and can be used to modulate the formation of aggregates in vitro. L2 would be the best inhibitor for Aβ aggregation, based on its ample inhibition and fluorescence properties. Overall, we present these compounds as chemical tools for use in assays for the development of necessary Aβ oligomer-targeting dyes.
Supplementary Materials
The following supporting information can be downloaded at the website of this paper posted on Preprints.org and contains fluorescence spectra, molecular docking results, inhibition assay data, HPLC Chromatograms, absorbance spectra, soluble amyloid beta control data, and logD measurements are also included [54,55].
Author Contributions
Conceptualization, L.S. and L.M.M.; methodology, L.S. and C.G.; software, C.G.; validation, Y.H., K.G. and K.T.; formal analysis, C.G.; investigation, L.S., C.G, and L.M.M.; resources, L.M.M.; writing—original draft preparation, C.G.; writing—review and editing, C.G. and L.M.M.; visualization, C.G.; supervision, L.M.M.; project administration, L.M.M.; funding acquisition, L.M.M. All authors have read and agreed to the published version of the manuscript.
Funding
This research was funded by NIH (R01GM114588 and RF1AG083937 to L.M.M.). C. G. acknowledges support from the National Science Foundation Graduate Research Fellowship Program under Grant No. DGE 21-46756.
Institutional Review Board Statement
Not applicable.
Informed Consent Statement
Not applicable.
Data Availability Statement
The experimental data used to support the results of this study are available in the article and in the Supplementary Materials.
Conflicts of Interest
The authors declare no conflicts of interest.
Abbreviations
The following abbreviations are used in this manuscript:
| AD | Alzheimer’s disease |
| Aβ | Amyloid beta |
| CR | Congo Red |
| EAG | Electron accepting group |
| EDG | Electron donating group |
| NMR | Nuclear magnetic resonance |
| sAβ | Soluble amyloid beta |
| tacn | 1,4,7-triazacyclononane |
| ThT | Thioflavin T |
| TICT | Twisted Intramolecular Charge Transfer |
References
- Liu, P. P.; Xie, Y.; Meng, X. Y.; Kang, J. S., History and progress of hypotheses and clinical trials for Alzheimer’s disease. Signal Transduct. Target Ther. 2019, 4, 29. [CrossRef]
- Ono, K.; Condron, M. M.; Teplow, D. B., Structure–neurotoxicity relationships of amyloid β-protein oligomers. Proc. Natl. Acad. Sci. U. S. A. 2009, 106, 14745. [CrossRef]
- Tew, D. J.; Bottomley, S. P.; Smith, D. P.; Ciccotosto, G. D.; Babon, J.; Hinds, M. G.; Masters, C. L.; Cappai, R.; Barnham, K. J., Stabilization of Neurotoxic Soluble β-Sheet-Rich Conformations of the Alzheimer’s Disease Amyloid-β Peptide. Biophys. J. 2008, 94, 2752. [CrossRef]
- Jin, L.; Wu, W.-H.; Li, Q.-Y.; Zhao, Y.-F.; Li, Y.-M., Copper inducing Aβ42 rather than Aβ40 nanoscale oligomer formation is the key process for Aβ neurotoxicity. Nanoscale 2011, 3, 4746. [CrossRef]
- Yang, J.; Zeng, F.; Li, X.; Ran, C.; Xu, Y.; Li, Y., Highly specific detection of Aβ oligomers in early Alzheimer’s disease by a near-infrared fluorescent probe with a “V-shaped” spatial conformation. Chem. Commun. 2020, 56, 583. [CrossRef]
- Matsumura, K.; Ono, M.; Kitada, A.; Watanabe, H.; Yoshimura, M.; Iikuni, S.; Kimura, H.; Okamoto, Y.; Ihara, M.; Saji, H., Structure–Activity Relationship Study of Heterocyclic Phenylethenyl and Pyridinylethenyl Derivatives as Tau-Imaging Agents That Selectively Detect Neurofibrillary Tangles in Alzheimer’s Disease Brains. J. Med. Chem. 2015, 58, 7241. [CrossRef]
- Leuzy, A.; Chiotis, K.; Lemoine, L.; Gillberg, P.-G.; Almkvist, O.; Rodriguez-Vieitez, E.; Nordberg, A., Tau PET imaging in neurodegenerative tauopathies—still a challenge. Mol. Psychiatry 2019, 24, 1112. [CrossRef]
- Vadukul, D. M.; Maina, M.; Franklin, H.; Nardecchia, A.; Serpell, L. C.; Marshall, K. E., Internalisation and toxicity of amyloid-beta 1-42 are influenced by its conformation and assembly state rather than size. FEBS Lett. 2020, 594, 3490. [CrossRef]
- Tolar, M.; Hey, J.; Power, A.; Abushakra, S., Neurotoxic Soluble Amyloid Oligomers Drive Alzheimer’s Pathogenesis and Represent a Clinically Validated Target for Slowing Disease Progression. Int. J. Mol. Sci. 2021, 22, 6355. [CrossRef]
- Fu, Z.; Yang, J.; Wei, Y.; Li, J., Effects of piceatannol and pterostilbene against β-amyloid-induced apoptosis on the PI3K/Akt/Bad signaling pathway in PC12 cells. Food & Function 2016, 7, 1014. [CrossRef]
- Yuan, W.; Shang, Z.; Qiang, X.; Tan, Z.; Deng, Y., Synthesis of pterostilbene and resveratrol carbamate derivatives as potential dual cholinesterase inhibitors and neuroprotective agents. Res. Chem. Intermed. 2014, 40, 787. [CrossRef]
- Garcia, G. X.; Larsen, S. W.; Pye, C.; Galbreath, M.; Isovitsch, R.; Fradinger, E. A., The functional group on (E)-4,4′–disubstituted stilbenes influences toxicity and antioxidative activity in differentiated PC-12 cells. Bioorg. Med. Chem. Lett. 2013, 23, 6355. [CrossRef]
- Breitung, E. M.; Shu, C.-F.; McMahon, R. J., Thiazole and Thiophene Analogues of Donor−Acceptor Stilbenes: Molecular Hyperpolarizabilities and Structure−Property Relationships. J. Am. Chem. Soc. 2000, 122, 1154. [CrossRef]
- Gao, Y.; Li, J.; Wu, Q.; Wang, S.; Yang, S.; Li, X.; Chen, N.; Li, L.; Zhang, L., Tetrahydroxy stilbene glycoside ameliorates Alzheimer’s disease in APP/PS1 mice via glutathione peroxidase related ferroptosis. Int. Immunopharmacol. 2021, 99, 108002. [CrossRef]
- Freyssin, A.; Page, G.; Fauconneau, B.; Rioux Bilan, A., Natural stilbenes effects in animal models of Alzheimer’s disease. Neural Regeneration Research 2020, 15, 843. [CrossRef]
- Gao, D.; Hao, J.-p.; Li, B.-y.; Zheng, C.-c.; Miao, B.-b.; Zhang, L.; Li, Y.-l.; Li, L.; Li, X.-j.; Zhang, L., Tetrahydroxy stilbene glycoside ameliorates neuroinflammation for Alzheimer’s disease via cGAS-STING. Eur. J. Pharmacol. 2023, 953, 175809. [CrossRef]
- Firdoos, S.; Dai, R.; Tahir, R. A.; Khan, Z. Y.; Li, H.; Zhang, J.; Ni, J.; Quan, Z.; Qing, H., In silico identification of novel stilbenes analogs for potential multi-targeted drugs against Alzheimer’s disease. J. Mol. Mod. 2023, 29, 209. [CrossRef]
- Yu, Z.; Guo, W.; Patel, S.; Cho, H.-J.; Sun, L.; Mirica, L. M., Amphiphilic stilbene derivatives attenuate the neurotoxicity of soluble Aβ42 oligomers by controlling their interactions with cell membranes. Chem. Sci. 2022, 13, 12818. [CrossRef]
- Hilt, S.; Liu, R.; Maezawa, I.; Rojalin, T.; Aung, H. H.; Budamagunta, M.; Slez, R.; Gong, Q.; Carney, R. P.; Voss, J. C., Novel Stilbene-Nitroxyl Hybrid Compounds Display Discrete Modulation of Amyloid Beta Toxicity and Structure. Front. Chem. 2022, 10. [CrossRef]
- Yu, Z.; Moshood, Y.; Wozniak, M. K.; Patel, S.; Terpstra, K.; Llano, D. A.; Dobrucki, L. W.; Mirica, L. M., Amphiphilic Molecules Exhibiting Zwitterionic Excited-State Intramolecular Proton Transfer and Near-Infrared Emission for the Detection of Amyloid β Aggregates in Alzheimer’s Disease. Chem. Eur. J. 2023, 29, e202302408. [CrossRef]
- Cho, H.-J.; Huynh, T. T.; Rogers, B. E.; Mirica, L. M., Design of a multivalent bifunctional chelator for diagnostic 64Cu PET imaging in Alzheimer’s disease. Proc. Natl. Acad. Sci. U. S. A. 2020, 117, 30928. [CrossRef]
- Cui, M.; Ono, M.; Watanabe, H.; Kimura, H.; Liu, B.; Saji, H., Smart Near-Infrared Fluorescence Probes with Donor–Acceptor Structure for in Vivo Detection of β-Amyloid Deposits. J. Am. Chem. Soc. 2014, 136, 3388. [CrossRef]
- Sun, L.; Cho, H.-J.; Sen, S.; Arango, A. S.; Bandara, N.; Huang, Y.; Huynh, T. T.; Rogers, B. E.; Tajkhorshid, E.; Mirica, L. M., Amphiphilic Distyrylbenzene Derivatives as Potential Therapeutic and Imaging Agents for the Soluble Amyloid-β Oligomers in Alzheimer’s Disease. J. Am. Chem. Soc. 2021, 143, 10462. [CrossRef]
- Kung, H. F.; Choi, S. R.; Qu, W.; Zhang, W.; Skovronsky, D., 18F Stilbenes and Styrylpyridines for PET Imaging of Aβ Plaques in Alzheimer’s Disease: A Miniperspective. J. Med. Chem. 2010, 53, 933. [CrossRef]
- Martí-Centelles, R.; Falomir, E.; Murga, J.; Carda, M.; Marco, J. A., Inhibitory effect of cytotoxic stilbenes related to resveratrol on the expression of the VEGF, hTERT and c-Myc genes. Eur. J. Med. Chem. 2015, 103, 488. [CrossRef]
- Kung, H., F.; Kung, M.-P.; Zhuang, Z.-P. Stilbene derivatives and their use for binding and imaging amyloid plaques. International patent no. 05854410.7, 2005.
- Xiao, G.; Li, Y.; Qiang, X.; Xu, R.; Zheng, Y.; Cao, Z.; Luo, L.; Yang, X.; Sang, Z.; Su, F.; Deng, Y., Design, synthesis and biological evaluation of 4′-aminochalcone-rivastigmine hybrids as multifunctional agents for the treatment of Alzheimer’s disease. Bioorg. Med. Chem. 2017, 25, 1030. [CrossRef]
- Lennol, M. P.; Canelles, S.; Guerra-Cantera, S.; Argente, J.; García-Segura, L. M.; de Ceballos, M. L.; Chowen, J. A.; Frago, L. M., Amyloid-β1-40 differentially stimulates proliferation, activation of oxidative stress and inflammatory responses in male and female hippocampal astrocyte cultures. Mech. Ageing Dev. 2021, 195, 111462. [CrossRef]
- Gu, L.; Guo, Z., Alzheimer’s Aβ42 and Aβ40 peptides form interlaced amyloid fibrils. J. Neurochem. 2013, 126, 305. [CrossRef]
- Sharma, A. K.; Pavlova, S. T.; Kim, J.; Kim, J.; Mirica, L. M., The effect of Cu2+ and Zn2+ on the Aβ42 peptide aggregation and cellular toxicity. Metallomics 2013, 5, 1529. [CrossRef]
- Sun, L.; Sharma, A. K.; Han, B.-H.; Mirica, L. M., Amentoflavone: A Bifunctional Metal Chelator that Controls the Formation of Neurotoxic Soluble Aβ42 Oligomers. ACS Chem. Neurosci. 2020, 11, 2741. [CrossRef]
- Cho, H.-J.; Sharma, A. K.; Zhang, Y.; Gross, M. L.; Mirica, L. M., A Multifunctional Chemical Agent as an Attenuator of Amyloid Burden and Neuroinflammation in Alzheimer’s Disease. ACS Chem. Neurosci. 2020, 11, 1471. [CrossRef]
- Liao, F.; Li, A.; Xiong, M.; Bien-Ly, N.; Jiang, H.; Zhang, Y.; Finn, M. B.; Hoyle, R.; Keyser, J.; Lefton, K. B.; Robinson, G. O.; Serrano, J. R.; Silverman, A. P.; Guo, J. L.; Getz, J.; Henne, K.; Leyns, C. E. G.; Gallardo, G.; Ulrich, J. D.; Sullivan, P. M.; Lerner, E. P.; Hudry, E.; Sweeney, Z. K.; Dennis, M. S.; Hyman, B. T.; Watts, R. J.; Holtzman, D. M., Targeting of nonlipidated, aggregated apoE with antibodies inhibits amyloid accumulation. J. Clin. Invest. 2018, 128, 2144. [CrossRef]
- Mahan, T. E.; Wang, C.; Bao, X.; Choudhury, A.; Ulrich, J. D.; Holtzman, D. M., Selective reduction of astrocyte apoE3 and apoE4 strongly reduces Aβ accumulation and plaque-related pathology in a mouse model of amyloidosis. Mol. Neurodegener. 2022, 17, 13. [CrossRef]
- Esparza, T. J.; Zhao, H.; Cirrito, J. R.; Cairns, N. J.; Bateman, R. J.; Holtzman, D. M.; Brody, D. L., Amyloid-beta oligomerization in Alzheimer dementia versus high-pathology controls. Ann. Neurol. 2013, 73, 104. [CrossRef]
- Gremer, L.; Schölzel, D.; Schenk, C.; Reinartz, E.; Labahn, J.; Ravelli, R. B. G.; Tusche, M.; Lopez-Iglesias, C.; Hoyer, W.; Heise, H.; Willbold, D.; Schröder, G. F., Fibril structure of amyloid-β(1–42) by cryo–electron microscopy. Science 2017, 358, 116. [CrossRef]
- Zou, Y.; Qian, Z.; Chen, Y.; Qian, H.; Wei, G.; Zhang, Q., Norepinephrine Inhibits Alzheimer’s Amyloid-β Peptide Aggregation and Destabilizes Amyloid-β Protofibrils: A Molecular Dynamics Simulation Study. ACS Chem. Neurosci. 2019, 10, 1585. [CrossRef]
- Gautieri, A., The Anti-Amyloidogenic Action of Doxycycline: A Molecular Dynamics Study on the Interaction with Aβ42. Int. J. Mol. Sci. 2019, 20, 4641. [CrossRef]
- Ciudad, S.; Puig, E.; Botzanowski, T.; Meigooni, M.; Arango, A. S.; Do, J.; Mayzel, M.; Bayoumi, M.; Chaignepain, S.; Maglia, G.; Cianferani, S.; Orekhov, V.; Tajkhorshid, E.; Bardiaux, B.; Carulla, N., Aβ(1-42) tetramer and octamer structures reveal edge conductivity pores as a mechanism for membrane damage. Nat. Commun. 2020, 11, 3014. [CrossRef]
- Lu, C.; Wu, C.; Ghoreishi, D.; Chen, W.; Wang, L.; Damm, W.; Ross, G. A.; Dahlgren, M. K.; Russell, E.; Von Bargen, C. D.; Abel, R.; Friesner, R. A.; Harder, E. D., OPLS4: Improving Force Field Accuracy on Challenging Regimes of Chemical Space. J. Chem. Theory Comput. 2021, 17, 4291. [CrossRef]
- Friesner, R. A.; Murphy, R. B.; Repasky, M. P.; Frye, L. L.; Greenwood, J. R.; Halgren, T. A.; Sanschagrin, P. C.; Mainz, D. T., Extra Precision Glide: Docking and Scoring Incorporating a Model of Hydrophobic Enclosure for Protein−Ligand Complexes. J. Med. Chem. 2006, 49, 6177. [CrossRef]
- Friesner, R. A.; Banks, J. L.; Murphy, R. B.; Halgren, T. A.; Klicic, J. J.; Mainz, D. T.; Repasky, M. P.; Knoll, E. H.; Shelley, M.; Perry, J. K.; Shaw, D. E.; Francis, P.; Shenkin, P. S., Glide: A New Approach for Rapid, Accurate Docking and Scoring. 1. Method and Assessment of Docking Accuracy. J. Med. Chem. 2004, 47, 1739. [CrossRef]
- Raju, S. K.; Sundhararajan, N.; Sekar, P.; Nagalingam, Y., Therapeutic aspects of biologically potent vanillin derivatives: A critical review. J. Drug Deliv. Therap. 2023, 13, 177.
- Iannuzzi, C.; Liccardo, M.; Sirangelo, I., Overview of the Role of Vanillin in Neurodegenerative Diseases and Neuropathophysiological Conditions. Int. J. Mol. Sci. 2023, 24, 1817. [CrossRef]
- Kumar, N. S.; Nair, R. H.; B, P. K., Comparative analysis of anti-oxidant potential of vanillin and ferulic acid invitro. Food & Humanity 2023, 1, 1206. [CrossRef]
- Terpstra, K.; Wang, Y.; Huynh, T. T.; Bandara, N.; Cho, H.-J.; Rogers, B. E.; Mirica, L. M., Divalent 2-(4-Hydroxyphenyl)benzothiazole Bifunctional Chelators for 64Cu Positron Emission Tomography Imaging in Alzheimer’s Disease. Inorg. Chem. 2022, 61, 20326. [CrossRef]
- Dong, X.; Qiao, Q.; Qian, Z.; Wei, G., Recent computational studies of membrane interaction and disruption of human islet amyloid polypeptide: Monomers, oligomers and protofibrils. Biochim. Biophys. Acta, Biomemb. 2018, 1860, 1826. [CrossRef]
- Gao, D.; Wan, J.; Zou, Y.; Gong, Y.; Dong, X.; Xu, Z.; Tang, J.; Wei, G.; Zhang, Q., The destructive mechanism of Aβ1–42 protofibrils by norepinephrine revealed via molecular dynamics simulations. Phys. Chem. Chem. Phys. 2022, 24, 19827. [CrossRef]
- Chen, Z.-L.; Singh, P. K.; Calvano, M.; Norris, E. H.; Strickland, S., A possible mechanism for the enhanced toxicity of beta-amyloid protofibrils in Alzheimer’s disease. Proc. Natl. Acad. Sci. U. S. A. 2023, 120, e2309389120. [CrossRef]
- Vangala, V. R.; Bhogala, B. R.; Dey, A.; Desiraju, G. R.; Broder, C. K.; Smith, P. S.; Mondal, R.; Howard, J. A. K.; Wilson, C. C., Correspondence between Molecular Functionality and Crystal Structures. Supramolecular Chemistry of a Family of Homologated Aminophenols. J. Am. Chem. Soc. 2003, 125, 14495. [CrossRef]
- Jameson, L. P.; Smith, N. W.; Dzyuba, S. V., Dye-Binding Assays for Evaluation of the Effects of Small Molecule Inhibitors on Amyloid (Aβ) Self-Assembly. ACS Chem. Neurosci. 2012, 3, 807. [CrossRef]
- Terpstra, K.; Huang, Y.; Na, H.; Sun, L.; Gutierrez, C.; Yu, Z.; Mirica, L. M., 2-Phenylbenzothiazolyl iridium complexes as inhibitors and probes of amyloid β aggregation. Dalton Trans. 2024, 53, 14258. [CrossRef]
- Ran, C.; Xu, X.; Raymond, S. B.; Ferrara, B. J.; Neal, K.; Bacskai, B. J.; Medarova, Z.; Moore, A., Design, Synthesis, and Testing of Difluoroboron-Derivatized Curcumins as Near-Infrared Probes for in Vivo Detection of Amyloid-β Deposits. J. Am. Chem. Soc. 2009, 131, 15257. [CrossRef]
- Xue, C.; Lee, Y. K.; Tran, J.; Chang, D.; Guo, Z., A mix-and-click method to measure amyloid-β concentration with sub-micromolar sensitivity. R. Soc. Open Sci. 2017, 4, 170325. [CrossRef]
- Groenning, M., Binding mode of Thioflavin T and other molecular probes in the context of amyloid fibrils—current status. J. Chem. Biol. 2010, 3, 1. [CrossRef]
Figure 1.
Structures of the derivatives labelled L1-L12.
Scheme 1.
Structures of derivatives L1-L12.
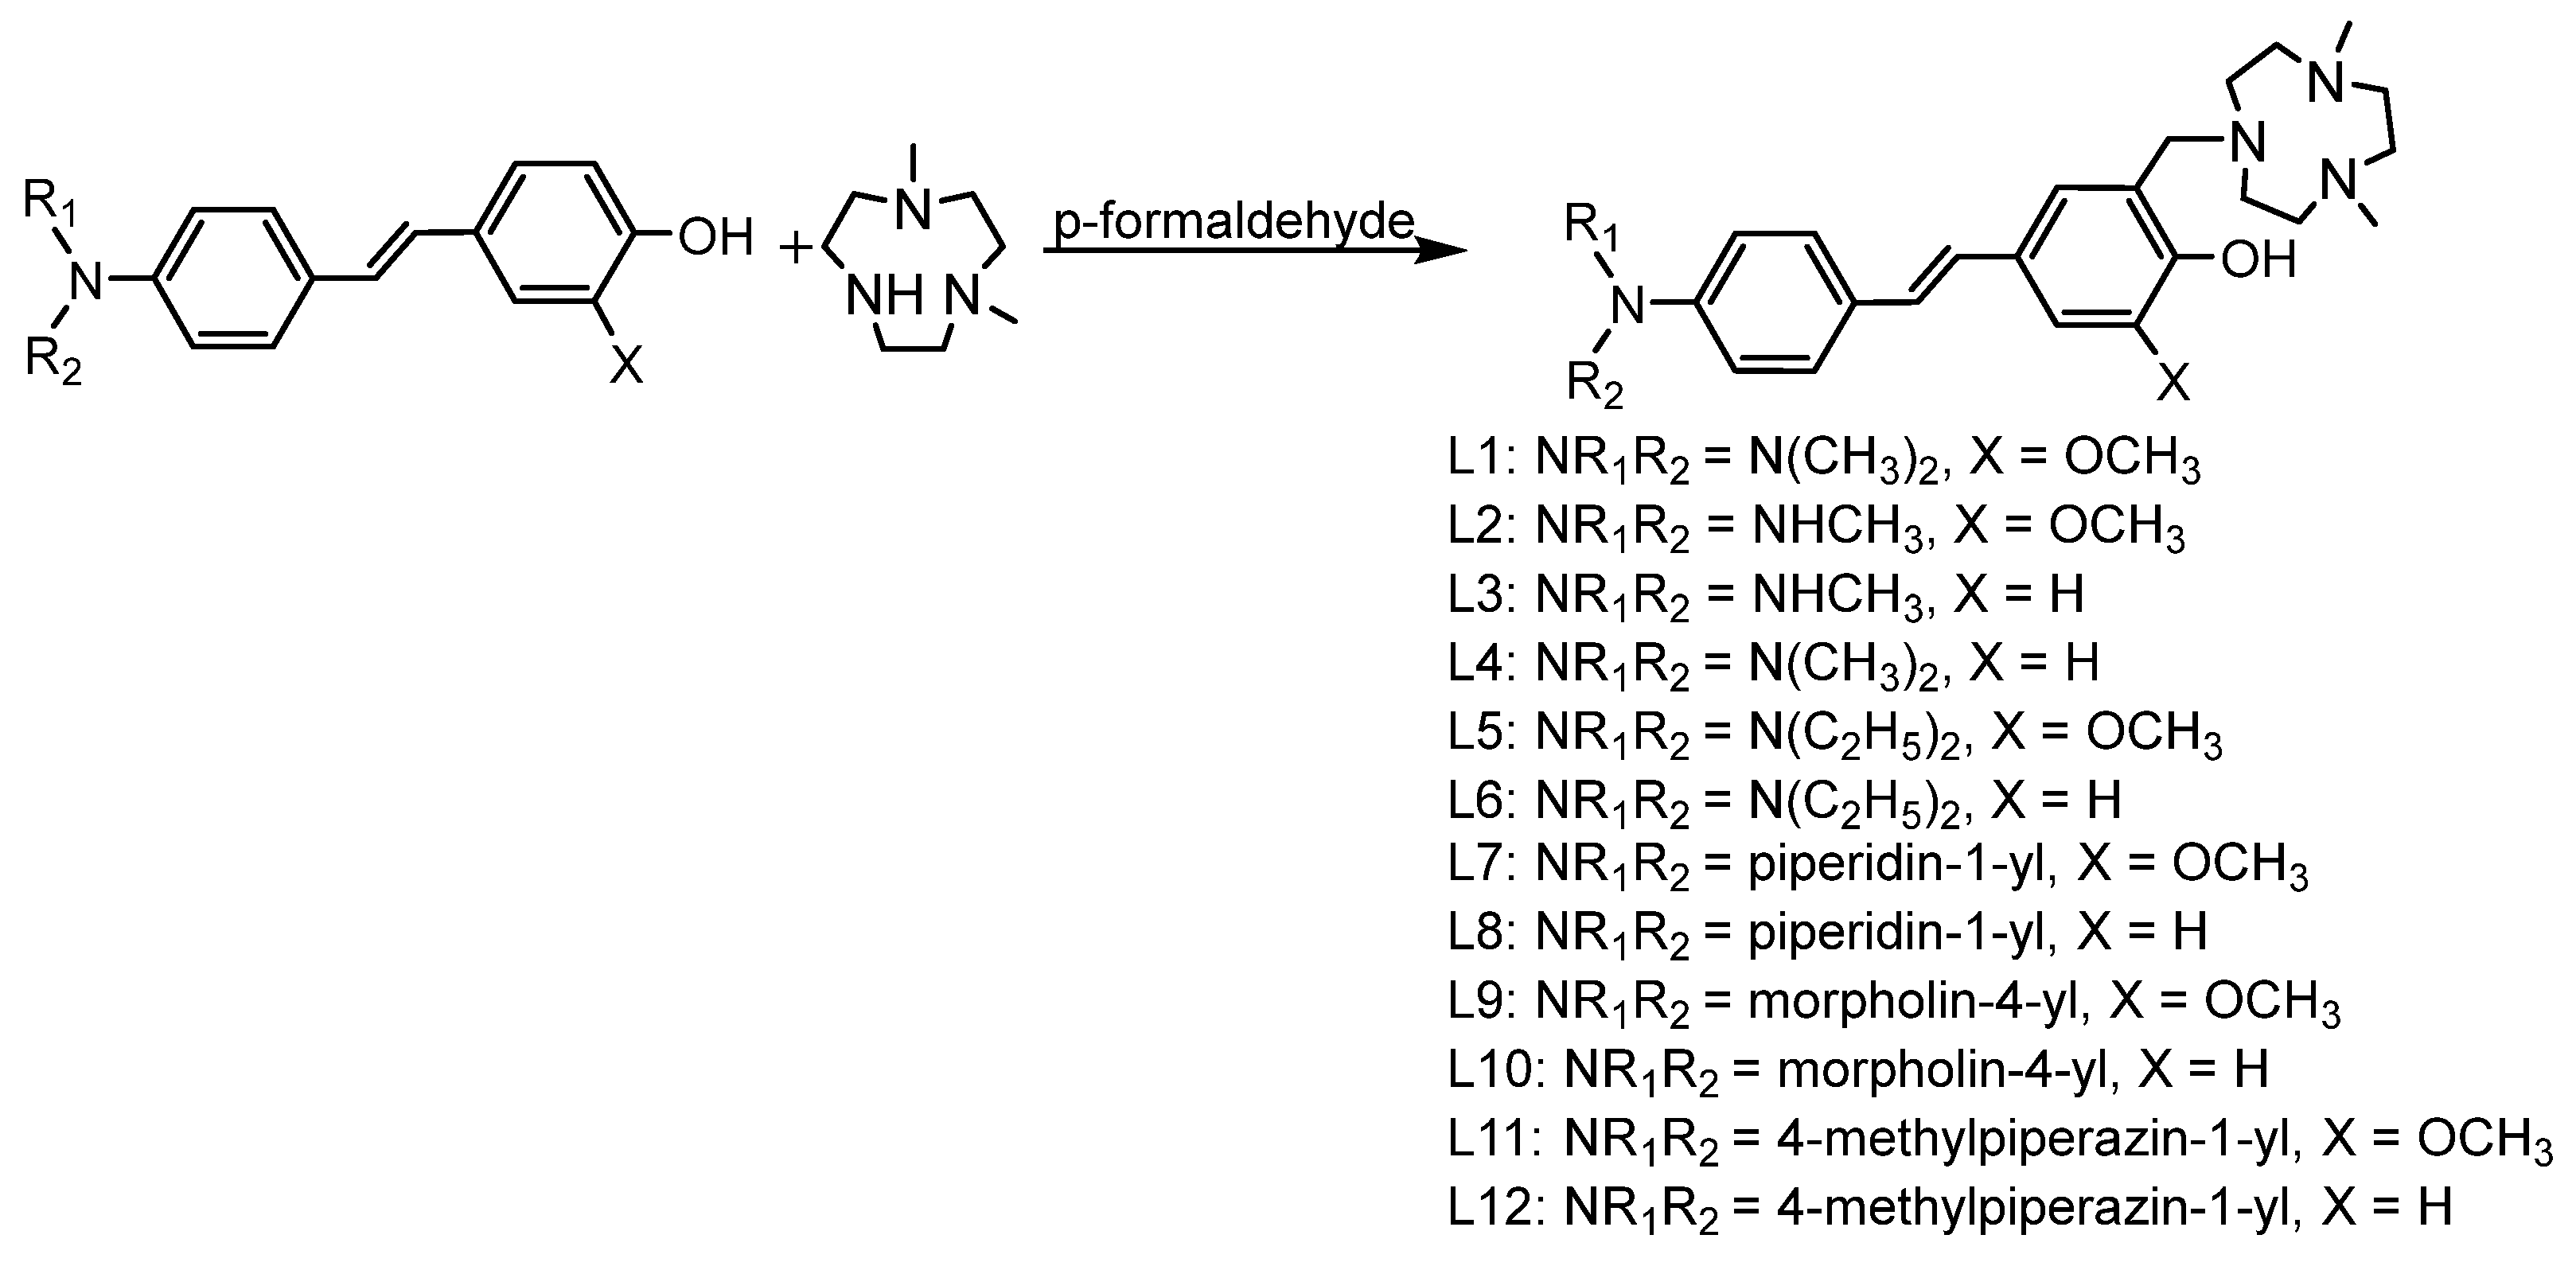
Figure 2.
Fluorescence spectra of L4 (left), L8 (middle), and L10 (right). L8 has the highest fluorescence turn-on from baseline fluorescence. L10 has the highest fluorescence intensity. All fluorescence spectra found in SI.
Figure 2.
Fluorescence spectra of L4 (left), L8 (middle), and L10 (right). L8 has the highest fluorescence turn-on from baseline fluorescence. L10 has the highest fluorescence intensity. All fluorescence spectra found in SI.
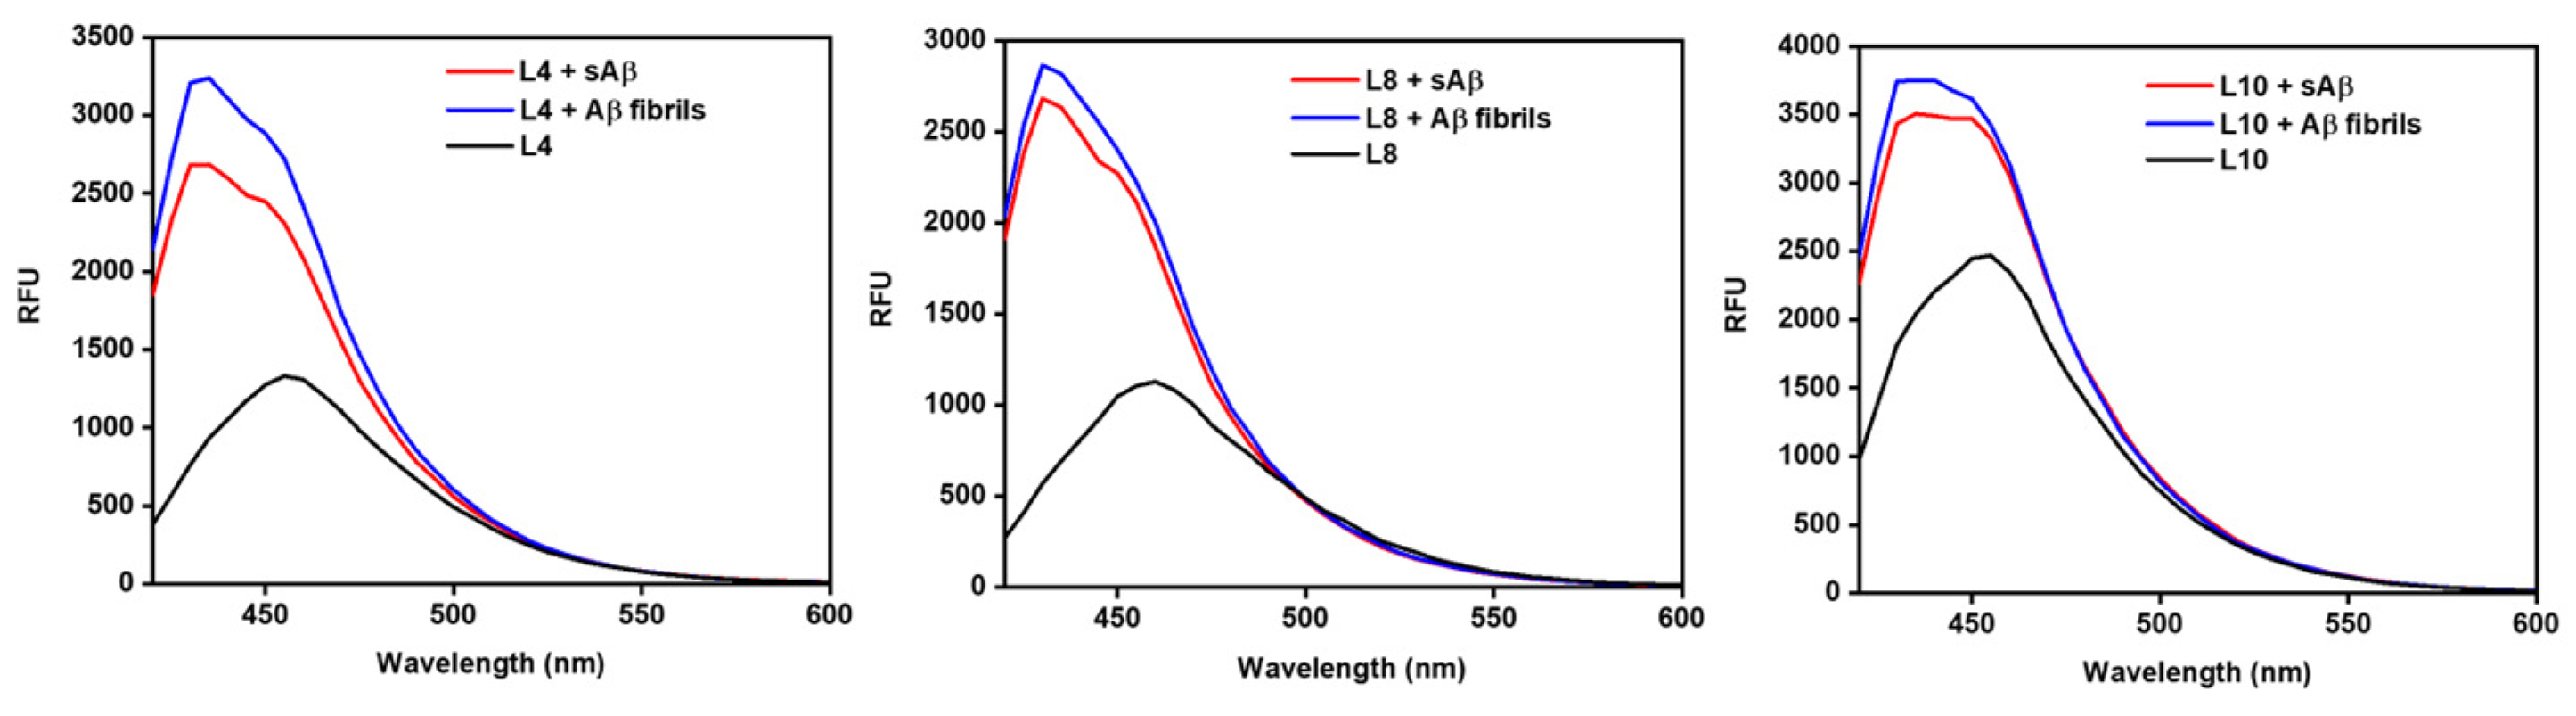
Figure 3.
Amyloid inhibition of L4 (left), L8 (center), and L9 (right). L4 shows the greatest inhibition, whereas L9 shows the least inhibition. All spectra found in SI.
Figure 3.
Amyloid inhibition of L4 (left), L8 (center), and L9 (right). L4 shows the greatest inhibition, whereas L9 shows the least inhibition. All spectra found in SI.
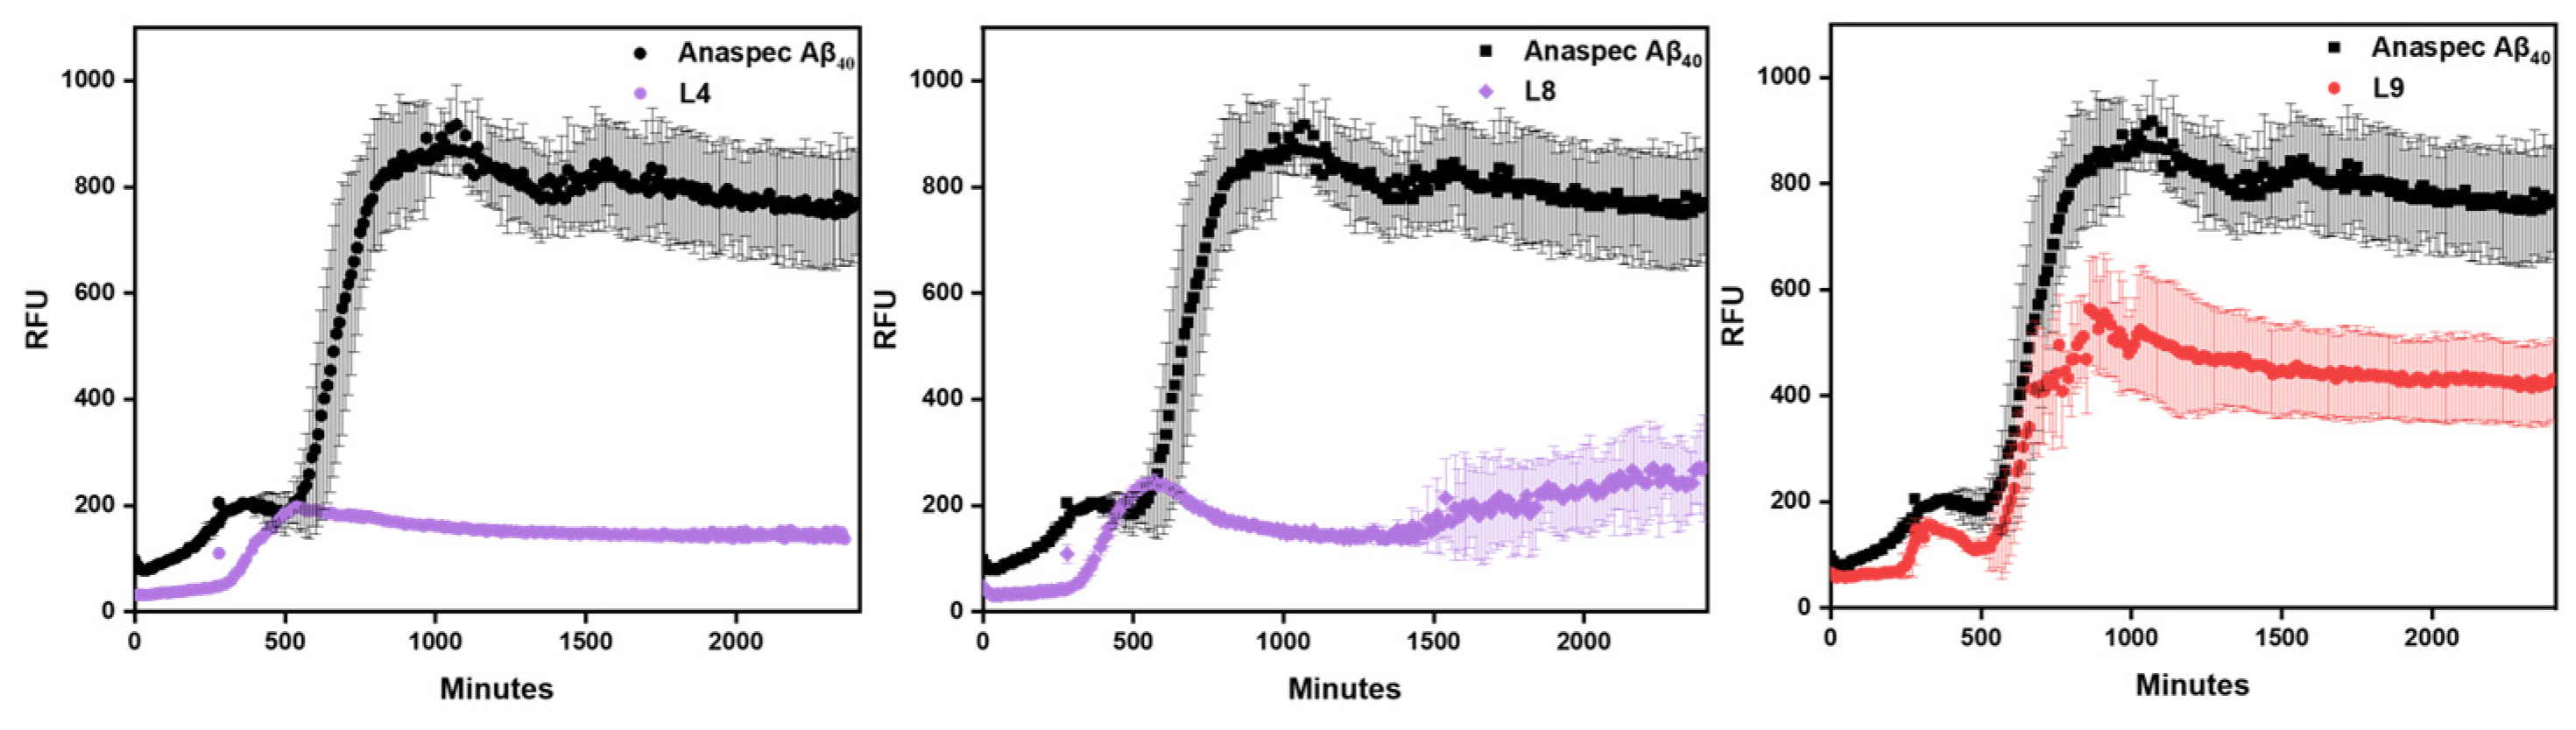
Figure 4.
Toxicity of compounds L1 – L12 (clustered on the x-axis from left to right) at different concentrations (0, 2, 5, 10, and 20 μM) in N2a (mouse neuroblastoma) cells. Percent cell viability is shown on the y-axis. Intensities are normalized to DMSO-only control.
Figure 4.
Toxicity of compounds L1 – L12 (clustered on the x-axis from left to right) at different concentrations (0, 2, 5, 10, and 20 μM) in N2a (mouse neuroblastoma) cells. Percent cell viability is shown on the y-axis. Intensities are normalized to DMSO-only control.
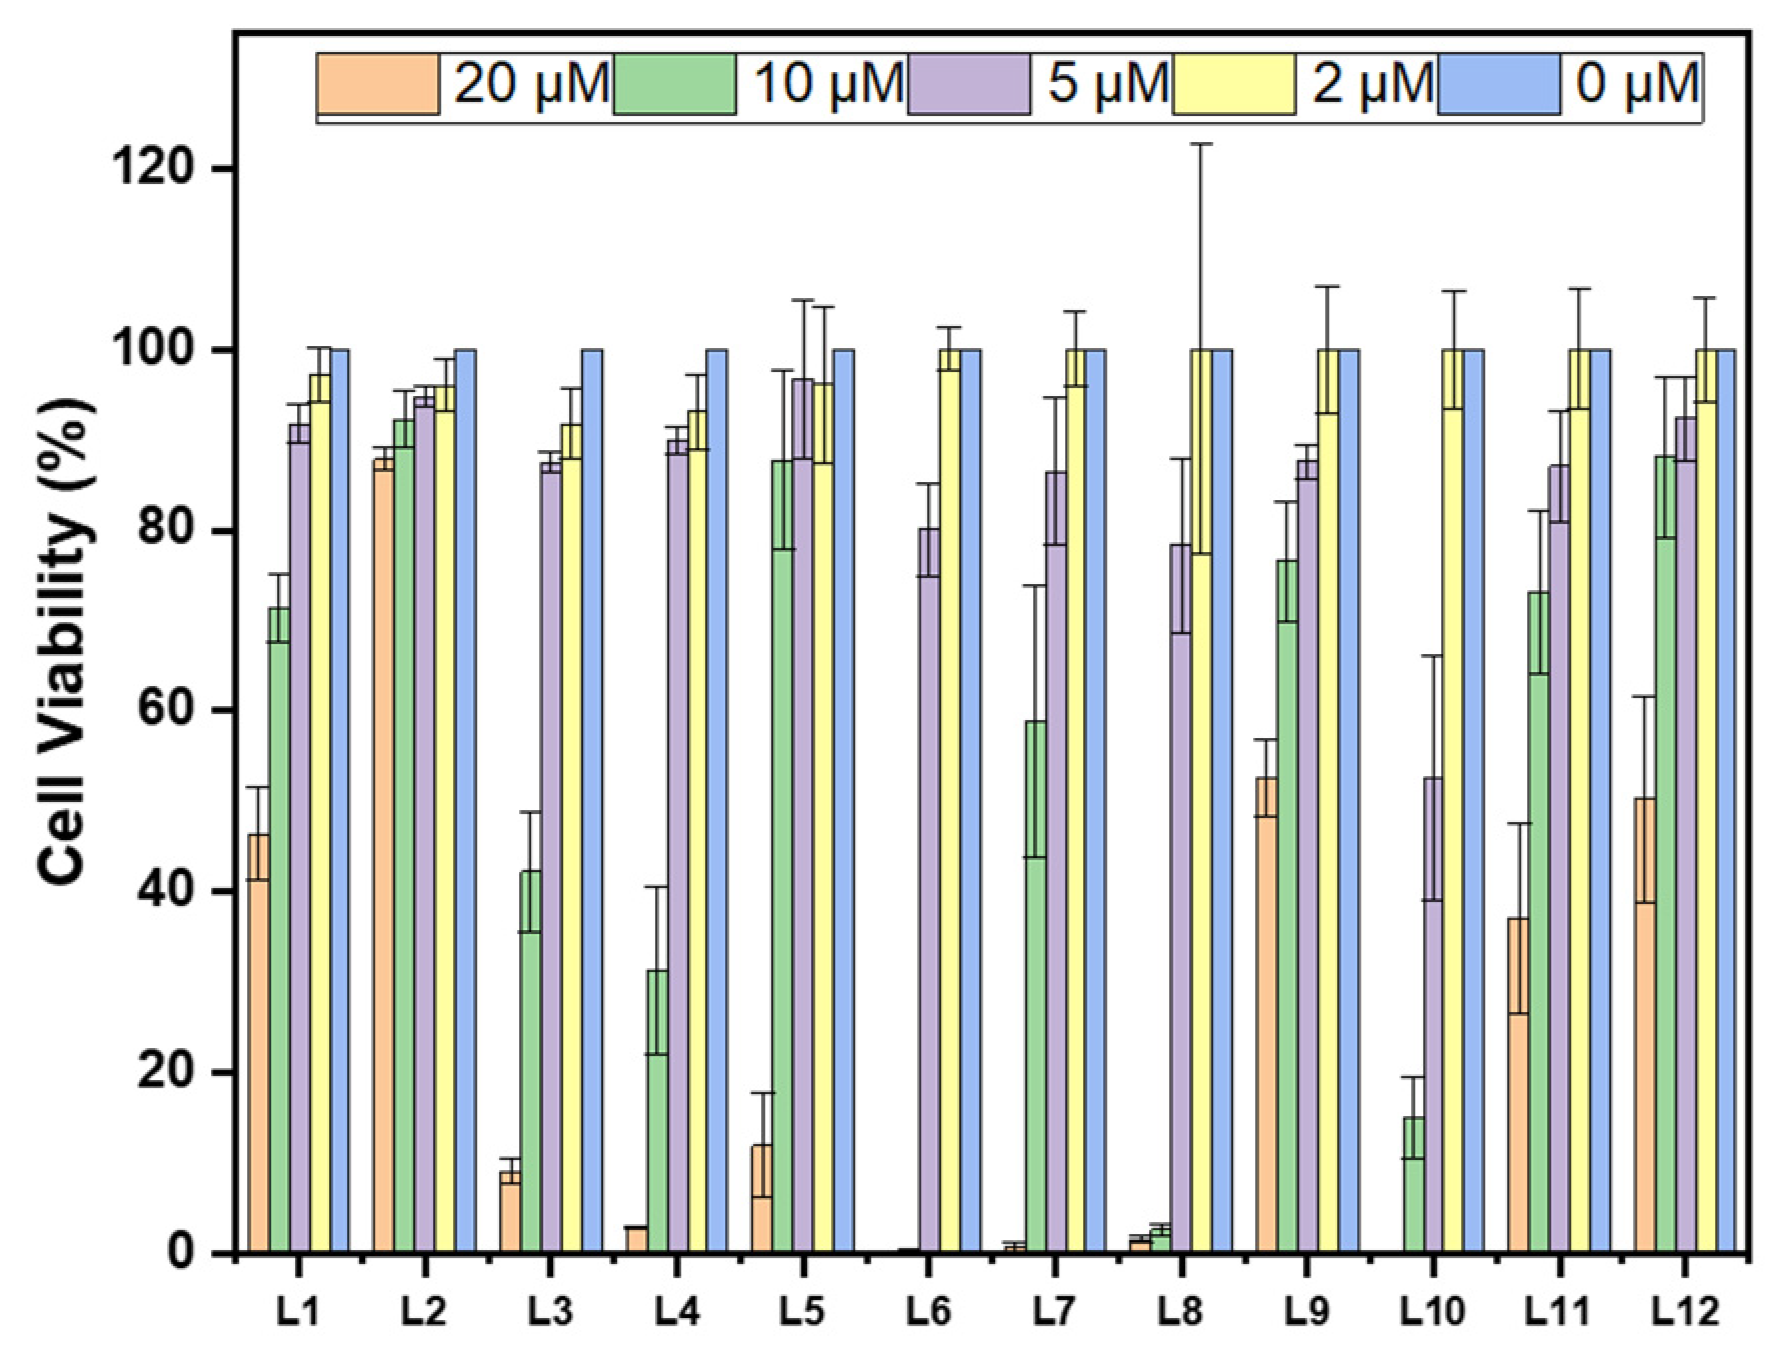
Figure 5.
Effects of Aβ-inhibitors on Cu-induced Aβ42 cytotoxicity. Conditions: [Aβ42] = [CuCl2] = 20 μM, [L1 to L12] = 5 μM. The reported cell viability % are relative to the DMSO control without Aβ42 or CuCl2.
Figure 5.
Effects of Aβ-inhibitors on Cu-induced Aβ42 cytotoxicity. Conditions: [Aβ42] = [CuCl2] = 20 μM, [L1 to L12] = 5 μM. The reported cell viability % are relative to the DMSO control without Aβ42 or CuCl2.

Figure 6.
Fluorescence microscopy images of 5xFAD mice brain sections co-incubated with compound (25 μM, left image), AF594-HJ3.4 (1 μg/mL) (middle image), and merged images (right image): (a) Compounds L1 (R = 0.67), L2 (R = 0.54), L3 (R = 0.72), L4 (R = 0.60), L5 (R = 0.74), L6 (R = 0.70) from top to bottom; (b) Compounds L7 (R = 0.66), L8 (R = 0.68), L9 (R = 0.71), L10 (R = 0.74), L11 (R = 0.77), and L12 (R = 0.65) from top to bottom. Scale bars on the lower left of each image measure 100 μm.
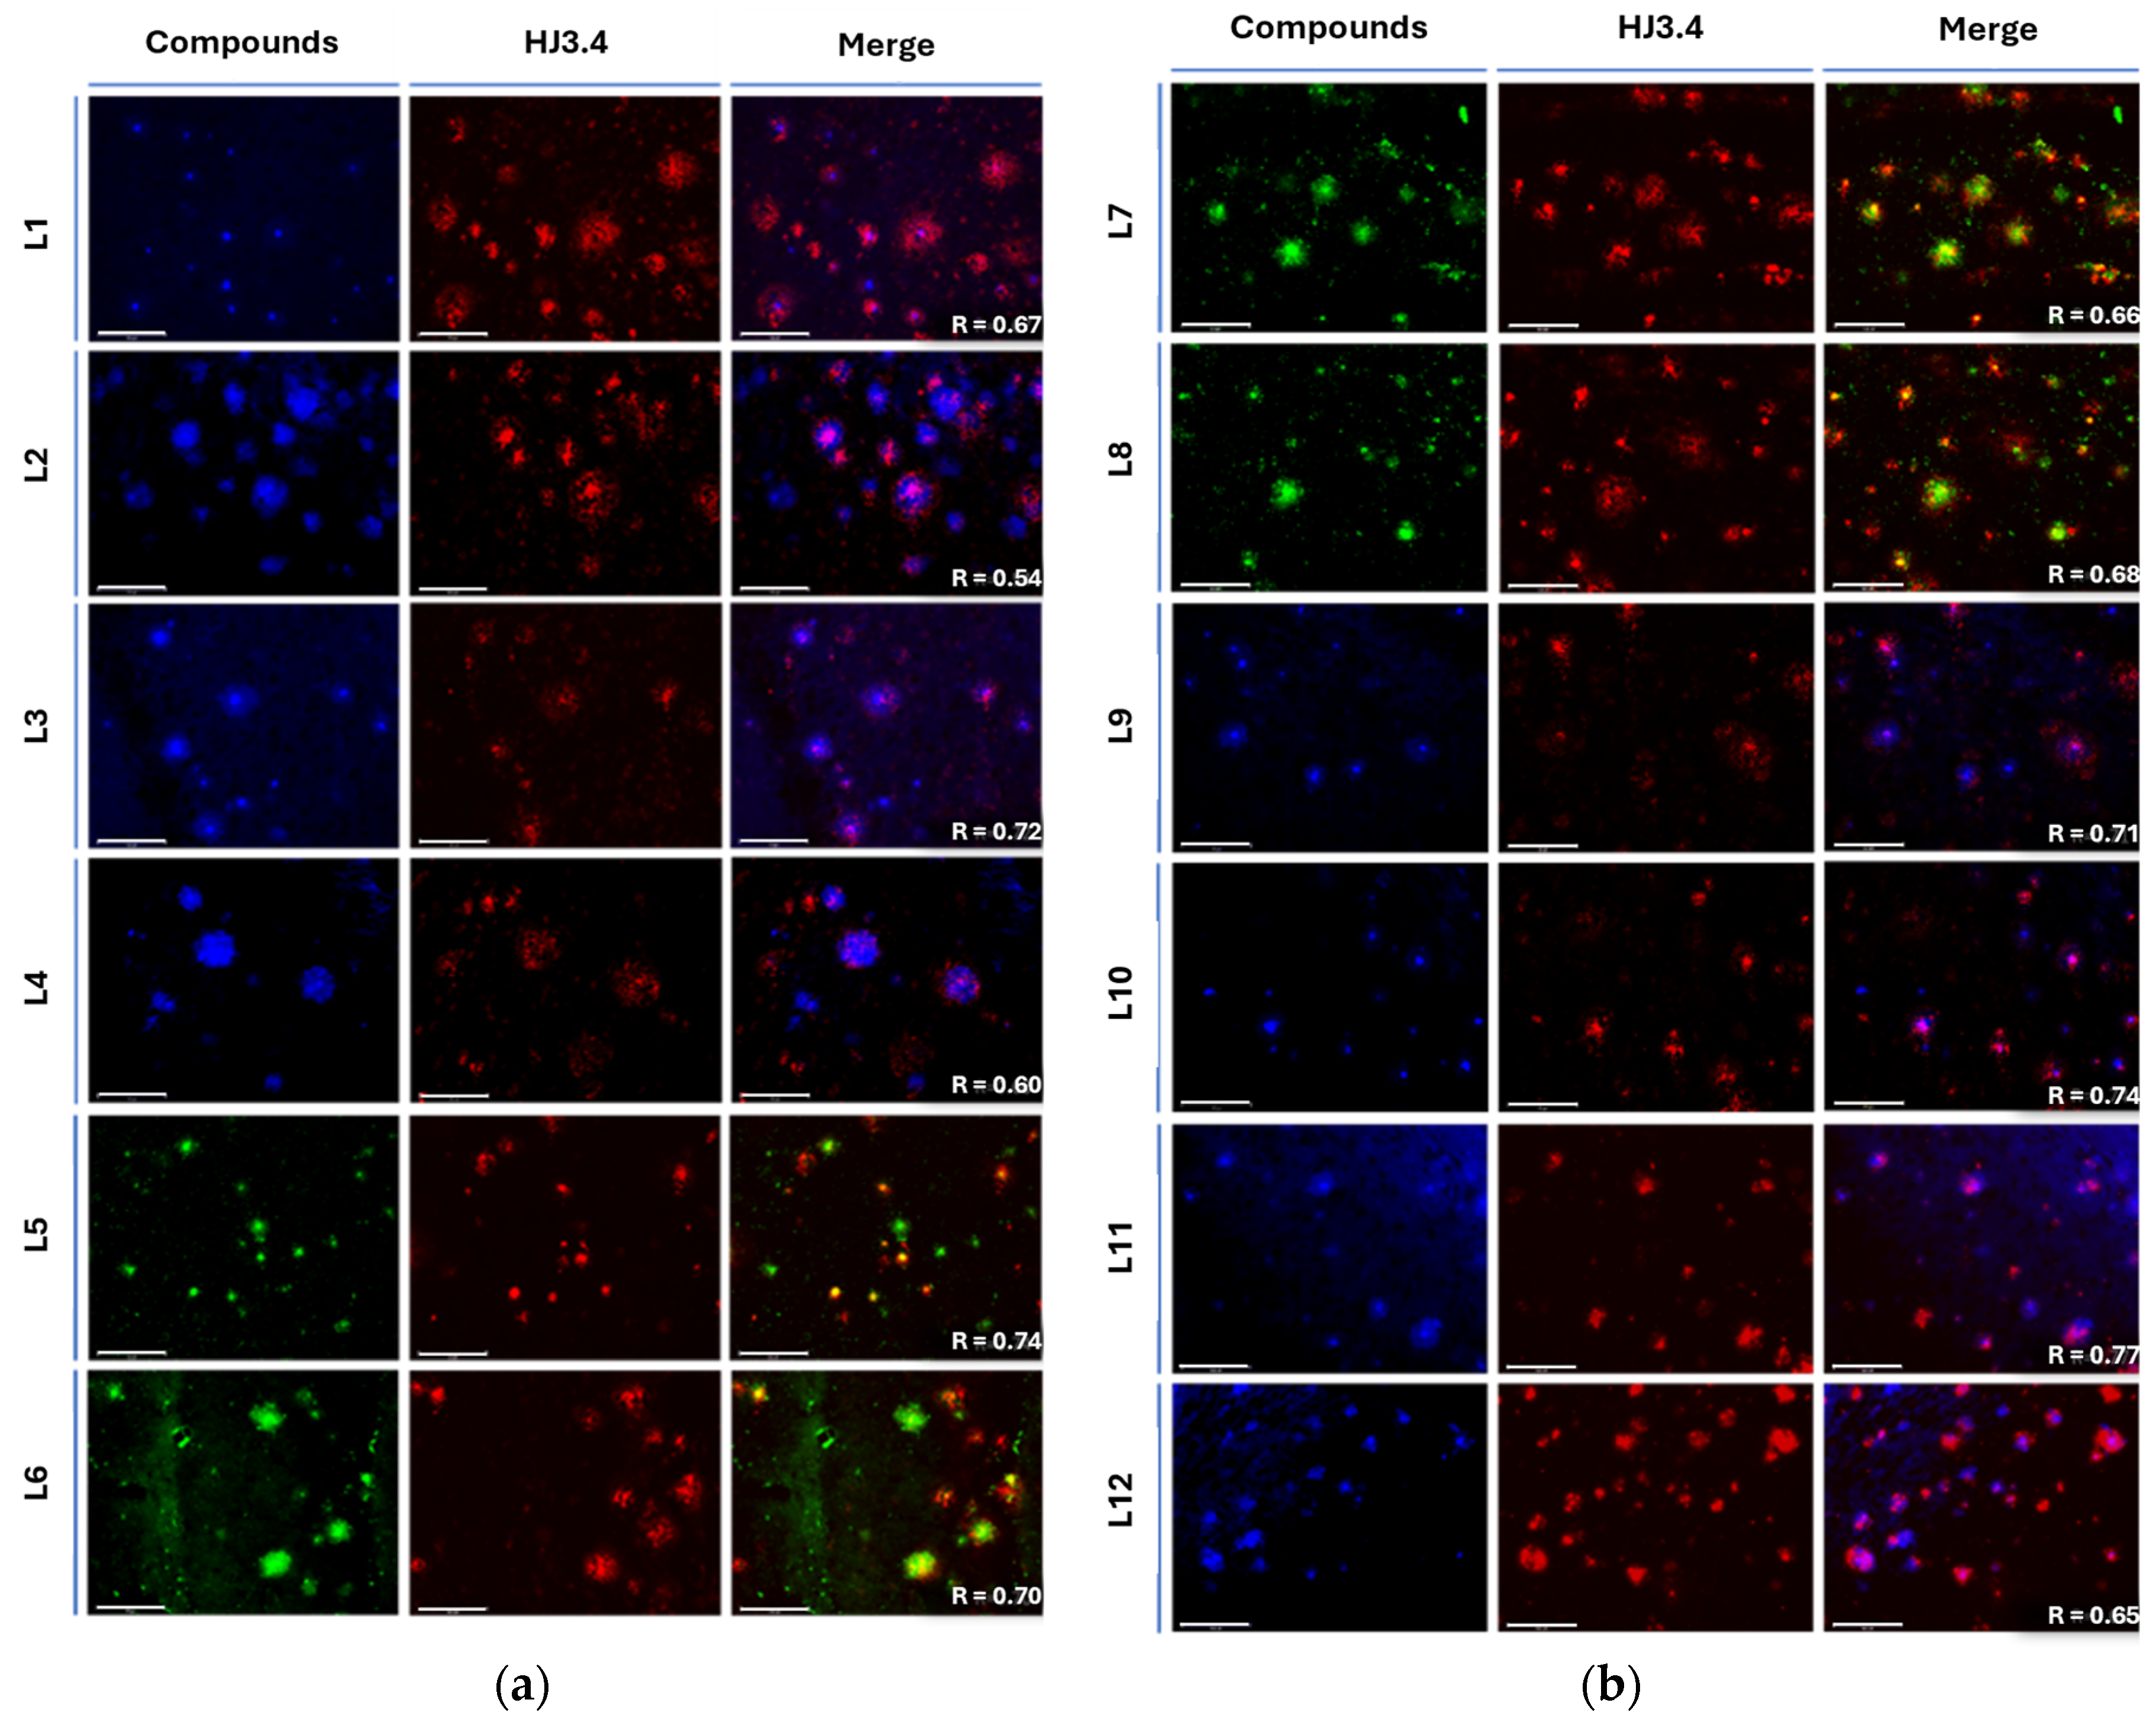
Figure 7.
Binding modes of the compounds with the best docking scores to each type of model, L7 for insoluble amyloid and L2 for soluble amyloid: (a) L7 docked into binding pocket of fibril model PDB:5OQV; (b) L2 binding pocket in PDB: 6RHY.
Figure 7.
Binding modes of the compounds with the best docking scores to each type of model, L7 for insoluble amyloid and L2 for soluble amyloid: (a) L7 docked into binding pocket of fibril model PDB:5OQV; (b) L2 binding pocket in PDB: 6RHY.
Scheme 2.
Synthesis of the compounds. (a) 4-hydroxybenzaldehyde or 4-hydroxy-3-methoxybenzaldehyde, piperidine, toluene, reflux, 3h; (b) SnCl2, Conc. HCl, EtOH, reflux, 3h; (c) (CH2O)n, NaBH4, NaOMe, CH3OH (d) (CH2O)n, NaBH3CN, CH3COOH, room temperature, overnight; (e) 4-vinylphenol or 2-methoxy-4-vinylphenol, Pd(OAc)2, triethanolamine, 100 °C, 24 h; (f) 4-vinylphenol or 2-methoxy-4-vinylphenol, Pd(OAc)2, triethanolamine, 100 °C, 24 h; (g) Me2HTACN, (CH2O)n, MeCN, reflux, 24 h.
Disclaimer/Publisher’s Note: The statements, opinions and data contained in all publications are solely those of the individual author(s) and contributor(s) and not of MDPI and/or the editor(s). MDPI and/or the editor(s) disclaim responsibility for any injury to people or property resulting from any ideas, methods, instructions or products referred to in the content. |
© 2025 by the authors. Licensee MDPI, Basel, Switzerland. This article is an open access article distributed under the terms and conditions of the Creative Commons Attribution (CC BY) license (http://creativecommons.org/licenses/by/4.0/).
Copyright: This open access article is published under a Creative Commons CC BY 4.0 license, which permit the free download, distribution, and reuse, provided that the author and preprint are cited in any reuse.


