

Submitted:
19 April 2025
Posted:
21 April 2025
You are already at the latest version
Abstract
Transportation infrastructure is a fundamental driver of economic growth and regional connectivity, and the supply of this infrastructure has been expected to reduce spatial disparities. This study investigates the impact of transportation accessibility on regional disparities in land prices across South Korea from 2010 to 2019. Using spatial econometric models and geographically weighted regression (GWR), this study evaluates how variations in transportation networks influence land price differentials between regions. The results confirm that transportation accessibility positively affects land prices, but GWR coefficients reveal substantial regional variations in the extent to which accessibility improvements drive land price growth. Furthermore, while the overall distribution of transportation accessibility remained relatively stable, its influence on land price appreciation varied significantly, contributing to a widening gap in land values between regions. These findings underscore the critical role of transportation infrastructure in shaping regional inequalities and highlight the need for more equitable transportation policies to mitigate spatial disparities and promote balanced regional development.
Keywords:
Transportation Accessibility
; Land Price
; Regional Disparity
; Spatial Panel Model
; Geographically Weighted Regression Model
1. Introduction
Transportation infrastructure, including roads and railways, is a key determinant of regional quality of life. It ensures equitable market access across all spatial units within a nation. By facilitating efficient movement of labor and logistics between regions, transportation infrastructure directly and indirectly enhances productivity in beneficiary areas, thereby contributing to national and regional economic growth. Consequently, the establishment and maintenance of transportation infrastructure are crucial for economic revitalization and income growth in underdeveloped regions and essential for achieving balanced regional development.
Concerns regarding balanced development have consistently been raised since the early stages of economic development periods in South Korea (hereafter Korea). Korea has endeavored to enhance regional competitiveness, mitigate regional disparities, and improve quality of life in underdeveloped areas through diverse initiatives such as the Five-Year National Balanced Development Plans in the 1970s. Among these initiatives, the provision of social infrastructure, particularly nationwide transportation networks, serves as a foundational policy for balanced regional development. However, despite substantial investments in transportation infrastructure, disparities between metropolitan and nonmetropolitan areas have continued to widen in such indicators as assets, employment, and income, etc. Consequently, criticisms have emerged regarding the equity of nationwide transportation infrastructure policies (Chung et al., 2011; Jo & Woo, 2014; Jun & Lee, 2007; Lee & Jung, 2011; Park et al., 2020).
From a spatial equity perspective, policy evaluation should consider the regional distribution of economic benefits resulting from transportation infrastructure policies. This study focuses on disparities in land value escalation as a key indicator of regional economic activation, which is a primary benefit of transportation infrastructure investments. Land prices encapsulate the efficiency of spatial allocation and the capitalized expectation of future returns. Thus, changes in land value serve as a representative metric for comprehensively assessing the economic value of specific areas. While microlevel studies examining the relationship between land value and transportation accessibility, such as the impact of transportation facility development on nearby land prices, are abundant (Chae & Sung, 2019; Choi & Kim, 2021; Kang, 2021), macrolevel research investigating how nationwide transportation network improvements influence regional land value changes remains limited. In particular, studies examining land price variations driven by improved transportation accessibility in relation to forward and backward linkages with existing regional infrastructure are extremely rare.
This study investigates how transportation accessibility influences land prices and analyzes changes in regional disparities driven by accessibility shifts from 2010 to 2019. Using transportation accessibility as a proxy for regional investment efficiency in transportation infrastructure, this study evaluates the extent to which improvements in roads, railways, and utilities contribute to variations in land prices. Furthermore, it examines how accessibility-driven changes affect regional equity, highlighting the spatial heterogeneity of their impacts. By providing empirical insights into the relationship between transportation accessibility and land price disparities, this study offers valuable guidance for policymakers aiming to develop transportation infrastructure policies that promote balanced regional development.
2. Background
2.1. Transportation Accessibility and Regional Development
Transportation accessibility is a driver of national and regional development, facilitating interregional trade and the movement of production factors and final output. Numerous studies have confirmed the positive impact of transportation infrastructure on productivity by reducing logistics, storage, and transportation costs, enhancing labor and capital productivity, and increasing demand for goods and services (Cook & Munnell, 1990; Litman, 2015; Munnell, 1990; Qi et al., 2020). The increase in productivity by the improved transportation accessibility significantly stimulates intraregional employment and income growth (Aschauer, 1990; Harris Jr., 1980; Mills & Carlino, 1989). Regions experiencing efficiency improvements due to enhanced accessibility accrue economic benefits such as market expansion, income growth, and increased land values (Ahlfeldt & Feddersen, 2017; Banister & Berechman, 2001; Bröcker et al., 2010; Hwang, 2002; Monzon et al., 2013; Qin, 2017). Notably, Aschauer (1990) demonstrated a significant correlation between public capital investments—including transportation infrastructure such as highways, airports, and public transit—and national productivity.
Previous studies have confirmed network effects of transportation, demonstrating that transportation infrastructure investments generate positive spillovers beyond directly affected areas. Munnell (1992) argued for positive spillover effects of regional transportation infrastructure investments on other regions, and numerous studies across various countries have identified significant interregional spillovers (Cai et al., 2022; Chen et al., 2019; Gutiérrez et al., 1996; Kim et al., 2021; Cantos et al., 2005; Yu et al., 2013). Improved transportation accessibility has particularly enhanced labor market integration by enabling workers from peripheral regions to access broader employment opportunities, thus contributing to wage convergence between core and peripheral areas (Leck et al., 2008).
However, an opposing viewpoint suggests that transportation infrastructure investments may generate backwash effects, causing the outflow of quality production factors from less-developed regions to more advanced ones, potentially exacerbating regional disparities (Cavallaro et al., 2022; Lin & Huang, 2021; Meijers et al., 2012; Sánchez-Mateos & Givoni, 2012; Zhang et al., 2019). Chong et al. (2019) provide empirical evidence supporting this argument, demonstrating that high-speed rail (HSR) development in China has primarily stimulated economic growth in well-connected urban centers, while peripheral regions have struggled to capture similar benefits. Their findings indicate that instead of fostering regional convergence, transportation investments may reinforce existing spatial inequalities.
Several studies in the Korean context have examined the effects of transportation network investments on regional disparities. Park et al. (2020) showed that improved road and railway accessibility positively influences population influx and Gross Regional Domestic Product (GRDP) within beneficiary regions; however, these improvements negatively affect population influx in adjacent areas, exerting adverse impacts on GRDP growth in neighboring regions. Kim & Yi (2019) applied a computable general equilibrium model to analyze high-speed railway infrastructure investments and interregional inequality, finding most benefits concentrate within established traditional growth corridors. These results suggest that although transportation infrastructure investments may enhance overall economic activity across regions, regional disparities can simultaneously be intensified.
2.2. Transportation Accessibility and Land Price
This study analyzes the impact of improved transportation accessibility on regional and national economies, using land prices as a mediating indicator that comprehensively reflects regional disparities. The theoretical underpinning of the relationship between transportation infrastructure and land price is that transportation infrastructure improvements enhance the accessibility of land. This increased accessibility directly translates to reduced transportation costs (time, monetary expenses, and effort) for individuals and businesses. These reduced transportation costs and improved accessibility are then capitalized into land values. This means that the benefits of better transportation are reflected in higher prices that people are willing to pay for land in those accessible locations. The primary concern for these theories is that publicly funded transportation infrastructure projects generate an “unearned increment” in the value of nearby land due to improved accessibility. That is, the increase in land value is a result of public investment, not the landowner’s efforts. In this regard, analyzing the impact of transportation network development on interregional differences in land prices is essential for ensuring equitable resource distribution and balanced regional development.
In recent years, land prices in certain Korean regions have risen sharply, contributing to deepening interregional disparities. This widening gap in land prices results from uneven economic development and influences the movement of production factors, further exacerbating regional inequalities. Studies addressing the relationship between transportation accessibility and land prices have examined various impacts of transportation network improvements on rising land prices (Bollinger et al., 1998; Gatzlaff & Smith, 1993). Enhanced transportation accessibility produces spillover effects not only in the target areas but also in geographically adjacent regions, allowing areas without direct benefits to experience positive externalities (Bröcker et al., 2010). However, limited empirical research has analyzed the spatial correlation between transportation accessibility and land price differentials. One of the few recent studies investigated the relationship between regional transportation network density and land price disparities in China (Li & Chen, 2022), demonstrating that increased provincial-level transportation network density reduces the Gini coefficient measured by provincial land prices.
2.3. Transportation Infrastructure Policies in Korea
Concerns regarding regional disparities have consistently been raised since Korea’s implementation of economic development plans in the 1960s. Since the 2000s, efforts have been undertaken to address regional imbalances through initiatives such as the Five-Year National Balanced Development Plans. Among these initiatives, the provision of social overhead capital (SOC), including the development of a nationwide transportation network, has been a fundamental policy for achieving balanced regional development. The Ministry of Land, Infrastructure, and Transport’s investment in road construction averaged over 7 trillion KRW annually from 2016 to 2020, with a projected investment of approximately 26 trillion KRW from 2021 to 2025. Additionally, the national railway network received budgetary allocations exceeding 15 trillion KRW from 2016 to 2020, totaling around 21 trillion KRW when including private investments (Kim et al., 2021). Transportation infrastructure supply is predominantly financed by the government. Therefore, the economic efficiency of constructed roads and railways, along with regional equity, has been a critical focus of policy concerns.
Figure 1 illustrates interregional differences in road, railway, and utility accessibility in Korea from 2010 to 2019 across 247 local governments, measured by the Gini coefficient. During this period, disparities in road and railway accessibility remained relatively stable, ranging from 0.50 to 0.51 and 0.54 to 0.55, respectively, while utility accessibility exhibited a slight decrease of approximately 4% (from 0.50 to 0.48). Although transportation accessibility remains higher in major metropolitan areas, extreme skewness is not observed. In summary, regional disparities in transportation accessibility either decreased or remained stable, suggesting transportation infrastructure investment policies have not contributed to widening regional disparities. Based solely on this argument, balanced investments in transportation networks appear to have been effective.
Despite stable or reduced regional disparities in transportation accessibility, disparities between metropolitan and nonmetropolitan areas have been widening across various indicators, including population, employment, assets, and income (Kim, 2023). That is, even with apparently balanced investments in transportation networks, regional disparities continue to intensify in those key indicators. The benefits of transportation network investments typically concentrate in regions with pre-existing infrastructure (Banister & Thurstain-Goodwin, 2011; Kim & Sultana, 2015; Kim & Yi, 2019). Therefore, if benefits from transportation infrastructure investments predominantly accumulate in specific regions, regional disparities are likely to expand beyond the scope of accessibility.
Since Korea’s active industrialization, wealth disparities have continued to rise (Kim & Yu, 2018), indicating that improved accessibility under the existing transportation policy has not translated into investments aimed at enhancing regional equity. In formulating transportation policies, considerations must extend beyond the economic benefits of accessibility improvements and encompass equity, as previous studies have asserted (Donaldson, 2018; Tsutsumi & Seya, 2008). In particular, land prices represent a critical asset indicator capable of comprehensively reflecting changes in regional economic activity, attractiveness, and asset value. By analyzing regional equity in transportation infrastructure through land prices, this study can provide insightful implications for developing balanced transportation policies.
3. Methodologies and Data
3.1. Methodologies
As noted above, investments in transportation infrastructure have direct and indirect effects on beneficiary areas and spatially adjacent regions. In addition, spillover effects arising from preexisting transportation infrastructure contribute to increasing regional utility. To control for inherent spatial heterogeneity and spatial autocorrelation embedded in improved transportation accessibility, this study sequentially employs panel and cross-sectional spatial econometric models as well as geographically weighted regression models.
Spatial econometric models use spatial weight matrices to account for spillover effects based on regions’ proximity (Anselin et al., 2008; LeSage & Pace, 2009). Spatial weight matrices can take various forms, such as adjacency matrices or inverse distance weight matrices, with no fundamental differences in their essence, assigning higher weights to spatially closer entities (Lee et al., 2006). Because transportation accessibility does not discretely influence regions according to administrative boundaries but affects all spaces nationwide, excluding remote regions inaccessible by roads or railways, this study employs an optimized inverse distance weight matrix to capture interactions among all regions nationwide. This matrix assigns higher weights to geographically closer regions based on the inverse of distances between regional centroids. By calculating weights using distance rather than adjacency alone, this approach incorporates interactions across a broader spatial range, capturing more diverse spatial relationships and dependencies.
3.1.1. Spatial Panel Model
The fundamental equation of the spatial panel model proposed by Lee and Yu (2010) is represented by Equation (1).
where represents the vector of dependent variables at certain time points, is the matrix of independent variables, W is the spatial weight matrix, denotes the vector of fixed effects corresponding to regional characteristics, is the spatial error vector, and is the vector of errors independently distributed over time and space without spatial dependence. The coefficients and indicate the spatial dependence of the dependent variable and the error term, respectively. This study uses the spatial error model (SEM), which incorporates the spatial dependence of the error term to analyze the panel data, estimating the model under the constraint , as indicated in Equation (1).
3.1.2. Cross-Sectional Spatial Econometrics Model
The general formula for the spatial econometric model utilized in cross-sectional data analysis is as follows:
This study employs the spatial autoregressive confused (SAC) model to analyze cross-sectional data, assuming spatial dependence for the dependent variable and the error term to estimate and .
3.1.3. Geographically Weighted Regression Model
This study is predicated on the assumption that the correlation between transportation accessibility and land prices will exhibit geographical variations due to the spillover effects of preexisting infrastructure. The geographically weighted regression (GWR) model is the most suitable approach for such a scenario as it enables the examination of spatial heterogeneity. The GWR approach, which is formulated by estimating a locally weighted least squares model, assigns spatial weights based on the physical distance between coordinates in a regression analysis. This approach provides regression coefficients that account for the interdependence of regional samples, reflecting the spatial relationships among them. The fundamental equation is expressed as follows:
Equation (4) signifies the estimated parameters specific to individual regions through the regression equation in Equation (3), where is the coefficient of the variable for region . is the spatial weight matrix used in the regional model estimation. This weight differs from spatial econometric models as it employs regional-specific diagonal matrices. This study applies an Adaptive bi-square kernel function to assign spatial weights, referencing Fotheringham et al. (2003)1. Unlike spatial panel models or spatial econometric models, the GWR model estimates region-specific coefficients, providing an effective method for analyzing spatial heterogeneity in land price changes. This approach enables a more detailed understanding of how transportation accessibility impacts land prices across different regions, allowing for a more precise identification of region-specific variations in land price increases.
3.1.4. Gini Coefficient
This study employs the Gini coefficient to assess regional disparities in the efficiency of transportation infrastructure investments. The Gini coefficient is a widely used measure of inequality, effectively capturing disparities through the Lorenz curve, and ranges from 0 (perfect equality) to 1 (maximum inequality). The calculation of the Gini coefficient is expressed by the following formula:
where represents the nationwide average land price, and and denote the land prices for respective regions and . n represents the number of regions (=247).
3.2. Data
This study utilizes municipal-level panel data sourced from the Ministry of Land, Infrastructure, and Transport and the Korea Real Estate Board, combined with transportation accessibility data provided by the Korea Transport Institute. The variables and corresponding data sources are summarized in Table 1. The dataset covers the period from 2010 to 2019 and includes 247 cities and counties across South Korea. Notably, Ulleung-gun, Jeju-si, and Seogwipo-si are excluded from the analysis due to their limited connectivity to nationwide road and railway networks, which are central to this study.
The majority of land-related research conducted in Korea has utilized government-designated standard land prices (Officially Announced Price of Reference Land) as indicators of land value. The term “reference land” refers to representative and stable parcels selected from groups of parcels recognized as generally similar in terms of land use conditions, surrounding environment, and other natural and social characteristics. The standard land disclosure price is determined by the Minister of Land, Infrastructure, and Transport through an annual investigation and evaluation of prices for approximately 500,000 standard parcels, as of the disclosure reference date (January 1st), in accordance with the Real Estate Price Disclosure and Appraisal Law. The assessed prices, subject to deliberation by the Central Real Estate Evaluation Committee, are publicly disclosed as fair market values. Local governments, including city, county, and district offices, subsequently adopt and announce individual disclosure prices based on this process (Jeong et al., 2020). The dependent variable selected for this study is the Officially Announced Price of Reference Land per square meter, due to its suitability for analyzing trends in land price differentials across regions, as it provides annually standardized land prices for each region.
Other independent variables used in this study, including regional economic and local development indicators, are constructed based on theoretical rationales drawn from regional economic and development studies. The selection of these variables was guided by previous research findings and data availability at the municipal level from 2010 to 2019. Detailed explanations regarding the causal relationships between individual regional variables and regional economic activities (i.e., GRDP and land prices) have been thoroughly established in prior studies by Park et al. (2020), Lee et al. (2021), and Choi et al. (2020), obviating the need for additional elaboration.
Various transportation accessibility indicators are employed as independent variables to reflect the efficiency of transportation infrastructure investments. Regional accessibility, as defined by Hansen (1959), represents the latent potential for interaction between regions. Transportation accessibility variables used in this study include TRAD, weighted average travel time (WATT), and utility accessibility, calculated using origin–destination (OD) data from transportation demand forecasting models, where population figures are replaced with arrival counts. Unlike traditional approaches estimating potential size based on population and employment data, this method measures potential size using actual travel volumes. Arrival counts are commonly employed in transportation demand models by Metropolitan Planning Organizations in the United States and have been widely adopted in Korean studies (Choi et al., 2020; Lee et al., 2021; Park et al., 2020).
The traditionally adopted accessibility measure in accessibility calculations is TRAD accessibility (road and railway), and its formulation is as follows:
where refers to administrative divisions in Korea, specifically targeting 247 cities and counties of the total 250 regional units (excluding Ulleung-gun, Jeju-si, and Seogwipo-si). represents the time required for travel from region to region , while denotes the time incurred in transit from region to region . represents the number of travelers originating from region , and corresponds to the travelers (arrival count) destined for region . In calculating TRAD accessibility, the separate considerations of road and railway accessibility imply a distinction based on the difference between traffic volumes and travel times for each mode, although there is no difference in the computational process.
WATT accessibility (road and railway) differs from the TRAD approach as it assigns higher values to regions with longer travel times. This variable is computed as the weighted average of travel times () by arrival counts (). The formula is as follows:
Regions’ utility accessibility is calculated by estimating the utility function obtained through connections from one region to another, which is measured considering time, distance, socioeconomic variables, and local characteristics of population, employment, and building floor area. This approach offers the advantage of providing a more realistic and detailed estimation of local accessibility, as it incorporates nuanced factors related to land use modifications and inclusive considerations of time and expenses (Geurs et al., 2010). The calculation formula is expressed as follows:
where represents the logsum coefficient for the purpose of travel , denotes the utility, indicates income-stratified population groups considered, and signifies transportation zones (Geurs et al., 2010; Kim et al., 2019). Utility accessibility is an accessibility indicator derived by summing the expected utility for all modes of travel that can be used for segment-specific travel from a specific region.
4. Results
This study constructs transportation accessibility at municipal levels to analyze the impact of changes in road and railway infrastructure on the standardized land disclosure prices of individual regions. First, spatial econometric models are applied to estimate the elasticity of land prices based on changes in accessibility for each region. Second, GWR models are employed to account for differentiated spatiotemporal linkage effects based on regional infrastructure conditions, enabling the estimation of regression coefficients for all 247 regions. Third, temporal changes in the Gini coefficient are analyzed based on the elasticity of land prices attributed to estimated regional transportation infrastructure investments through accessibility. The regional disparities in land value appreciation and elasticity calculated through these processes provide evidence of the influence of transportation policies on spatial inequality over the past decade.
Before estimating spatial econometric models at the panel and cross-sectional levels, an examination of the spatial dependence of the dependent variable (land prices) was conducted using Moran’s Index (Table 2). A global Moran’s I approaching 1 suggests strong spatial clustering, whereas approaching -1 indicates significant spatial dispersion. According to the global Moran’s I estimates, spatial dependence in land prices is evident in nationwide city and county regions from 2010 to 2019 and is statistically significant at the p < .01 level for all years. These results align with the study’s objective of analyzing regional disparities in land prices and highlight the necessity of accounting for spatial dependence to avoid biased or inefficient estimates. Consequently, spatial econometric models are applied in this study to appropriately capture the spatial interactions and heterogeneity inherent in the data.
The use of panel data allows for more robust estimation results by eliminating endogeneity among latent variables when empirically examining the relationship between spatial unit transportation accessibility and local utility. To leverage these empirical advantages, this study estimates a one-way fixed effects panel SEM that does not include lagged terms for the dependent variable, enabling the interpretation of each independent variable’s coefficients as direct effects on the dependent variable. The estimation results are presented in Table 3. The key predictor variables for land prices in all three regression models are road, railway, and utility accessibility, while controlling for independent variables related to the economy, population, and urban planning areas.
Applying quasi-maximum likelihood estimation, the resulting pseudo ranges between 76% and 87%, indicating that the panel model effectively explains a substantial portion of the variance in land prices. The coefficient (), representing the spatial autocorrelation of regional errors, is statistically significant at the 1% level in all models, revealing spatial dependence in regional errors.
Control variables of GRDP, industrial structure, demographic composition, and restricted development area exhibit significant impacts on average land prices at the 1% significance level. An increase in GRDP implies a positive correlation with land prices, indicating that a 1% increase in GRDP results in a 0.1% increase in regional land value. The results for the number of manufacturing establishments, which is controlled as an indicator of economic activity, reveal that a 1% increase in establishments corresponds to a 0.08% increase in land prices. The positive correlation between manufacturing establishments and land prices underscores the significant impact of industrial structure on regional economic growth. The results for higher population density suggest efficient land use, which positively influences land prices. A positive correlation is revealed between the aging rate and land prices, showing that a 1% increase in the aging rate corresponds to a 0.01% increase in land prices. Finally, the restricted development area consistently shows statistical significance at the p < .01 level across all models, with an elasticity indicating a roughly 0.9% decrease in land prices associated with a one unit increase in this variable.
Transportation accessibilities generally demonstrate a statistically significant positive correlation with land prices at the 1% significance level. Regarding TRAD road accessibility, a 1% increase is associated with a 1.497% increase in land prices, while railway accessibility is linked to a 0.079% increase for a 1% rise; however, TRAD railway accessibility is statistically insignificant. Comparable results are obtained in the analysis based on travel time-based indicators (WATT). Comparing the absolute estimates of road and railway accessibility, the elasticity for road accessibility is considerably larger than that for railway accessibility. This suggests that road networks have a stronger influence on residential and economic activities than the railway network when considered from the perspective of regional living areas at the city and county regional level. Utility accessibility also exerts a statistically significant positive impact on regional land prices at the p < .01 level. Similar findings have been documented in studies such as Bollinger et al. (1998) and Gatzlaff and Smith (1993), which highlight the influence of transportation infrastructure on land price dynamics.
Overall, the results confirm the significant and positive relationship between transportation accessibility and land prices, as discussed in the background section of this study. The observed elasticities indicate that transportation infrastructure investments contribute to regional land price increases, reinforcing the importance of equitable and strategic transportation development policies to address regional disparities.
While spatial panel models offer the advantage of robustly confirming relationships between variables, the limitation of such models is that they do not allow for the observation of annual trends in the relationships between variables. Therefore, we subsequently conduct cross-sectional analyses to examine the annual variations in each accessibility coefficient. As noted previously, the SAC model are employed for these analyses, including spatial lagged terms for the dependent variable and error terms. Table 4 presents only the results for TRAD accessibility and utility accessibility2.
The correlation between accessibility and land prices is significantly positive at the p<.01 level in all years, aligning with the results from the panel analysis. Additionally, the spatial lagged terms ( and ) for the dependent variable and error terms are significantly estimated in the positive direction, indicating that land prices in one region are influenced directly and indirectly by the spatial interactions with neighboring regions (see Appendix 1, Appendix 2 and Appendix 3). In contrast, the annual impact of accessibility during the same period demonstrates a diminishing trend over time, which is observed consistently across all three types of accessibility. This underscores the dynamic relationship between transportation accessibility and land prices, indicating that the marginal effects of accessibility improvements diminish over time as regional infrastructure reaches a state of relative saturation.
Summarizing the analyzed results thus far, first, transportation accessibility is shown to have a statistically significant positive impact on land prices. Second, the evolving trends of annual correlations and the indirect effects generated by the established transportation network are substantial, suggesting the potential discriminatory effects of transportation accessibility improvement depending on a region’s infrastructure level. To confirm this heterogeneity from a spatial perspective, we conduct additional analyses applying the GWR model.
The heterogeneity in land price formation, as identified through GWR analysis, indicates that the impact of transportation infrastructure investment on the increase in regional utility varies according to forward and backward linkage effects. Table 5, Table 6 and Table 7 summarize the GWR model estimation results, controlling for TRAD road and railway and utility accessibility in 2019.
All three outcomes of the GWR model exhibit explanatory power exceeding 94%. While direct comparison is challenging due to differing estimation methods, these results surpass the explanatory power of the previous SEM panel model and SAC cross-sectional model. The average magnitudes of each accessibility coefficient also follow the same order of road, utility, and railway. In all 247 regions (100%), population density and restricted development area are identified as independent variables with statistically significant positive impacts on land prices, with the number of businesses also demonstrating a similar level of influence.
Conversely, the manufacturing establishment ratio on land prices is found to have a negative impact in over 99.6% of the regions across all three accessibility models. Among the controlled regional variables, GRDP and aging rate exhibit high spatial diversity in associated impact on land prices. In all three models, the influence of GRDP is positive in over 60% of the regions, with a negative direction observed in 35%–39% of the regions. However, for the aging rate, more than 60% of the regions indicate a negative impact in all three models, with a positive impact observed in 34%–36% of the regions.
The relationships between the three types of accessibility and land prices are confirmed to be statistically significant at the level of p < .10 or higher in more than 80% of regions (85% or higher for road and utility), indicating a meaningful impact on land value changes in most areas. In all 247 regions, population density has a statistically significant impact on land prices at the level of p < .10 or higher for all three types of accessibility, and restricted development area has a significant impact on land prices in more than 90% of regions.
The implications of the analyses using the GWR model lie in the heterogeneity of regional coefficients. For instance, if the elasticity of land prices to accessibility is higher in certain regions compared with others, this indicates the possibility that the asset effect of transportation infrastructure investment may be more pronounced in those regions. In contrast, if these distinctive effects are concentrated in metropolitan and major city areas, this indicates a potential for transportation infrastructure investment to contribute to widening regional inequality.
Figure 2 illustrates the expected changes in land prices due from improvements in each form of transportation accessibility for all 247 regions, presenting the temporal trends of regional disparities using the Gini coefficient applied to Equation (5). The projected increases in land prices for region i are calculated as . Contrary to the trend showing regional disparities in accessibility for each local government unit in Figure 1, the results indicate that regional disparities in land value increments for road–rail–utility sectors have consistently widened from 2011 to 2019.
This finding signifies that despite investments in transportation infrastructure aimed at securing regional equity depicted in Figure 1, the economic inequality resulting from these investments is, in fact, worsening and becoming more entrenched. The increase in the Gini coefficient based on land value increments indicates that regions with already high land values are enjoying more significant economic benefits from accessibility improvements. This pattern is visually confirmed through a geographical illustration of the land value increments for all 247 regions in 2019 compared with the previous year.
Figure 3 compares the three transportation accessibilities and land value increments for the 247 local government units in 2019, ranking them based on accessibility and land value increments. The comparison, which uses rankings rather than actual increments, mitigates differences between regions due to scale disparities. The distribution of accessibility rankings in the left chart suggests relative equity, particularly in major cities. Although the accessibility levels in metropolitan areas, particularly those along the central transportation axis, appear favorable and are not excessively skewed. However, the right chart, based on the ranking of land value increments, vividly demonstrates the concentration of land value increases, especially in the capital region, particularly around Seoul. This trend is consistent across all three accessibility types.
In sum, evaluating the regional distribution of raw transportation accessibility data from 2010 to 2019 indicates that regional disparities have either decreased or remained at similar levels, demonstrating that transportation infrastructure investment policies have not necessarily contributed to the widening of regional disparities but rather a balanced investment has occurred across regions. However, the diverse spillover effects on land prices due to investments in transportation network and the discriminatory effects of preexisting infrastructure are notably higher in metropolitan and major city regions. Consequently, the current transportation investments based on present population and economic demands are found to have a higher likelihood of contributing to the widening disparity in land prices between regions, which is a critical indicator of regional economic vitality.
5. Conclusion
Transportation infrastructure, characterized by roads and railways, is a critical determinant of the quality of life within a region. Its significance is underscored by its role in ensuring equitable market access for all spatial units within a nation. Since the implementation of transportation infrastructure primarily relies on government funding, the economic efficiency of constructed roads and railways, along with regional equity are pivotal evaluation criteria. This study aimed to investigate how transportation accessibility influences regional land price disparities and to assess the broader implications for regional equity. This study examined the impact of investment in the transportation sector on regional land prices disparities in Korea.
The major findings of this study are presented as follows. First, when using raw data at city and county levels, accessibility tends to be higher in metropolitan areas, including the capital region compared with other regions; however, this disparity is not exceedingly pronounced. This implies that regional disparities, when evaluated solely based on raw accessibility data, have either diminished or maintained similar levels over the past decade. Consequently, an assessment based solely on transportation accessibility suggests that the transportation infrastructure policies implemented over the last 10 years have contributed to alleviating regional accessibility disparities.
Second, the relationship between transportation accessibility and land prices demonstrates a positive correlation. The findings reveal that land prices inherently exhibit statistically significant levels of spatial dependence, as evidenced by the application of spatial econometric models. The results indicate a robust relationship between transportation accessibility and land prices across panel and cross-sectional analyses. Furthermore, the spatial autocorrelation term in the SAC model consistently exhibits statistical significance in the positive direction, suggesting that land prices in adjacent regions are highly likely to be influenced by spatial interactions.
Third, the results of GWR revealed significant regional disparities, with a pronounced skewness toward the Seoul Metropolitan Area and other major urban regions when assessing the net effects of changes in transportation accessibility on land prices. This skewness is attributed to the heightened impact of various infrastructural effects that influence the increase in assessed land values by promoting forward and backward linkages, particularly in the capital region and major metropolitan areas. The findings suggest that the influence of previously implemented transportation investments on the regional disparities in land values has, in fact, expanded.
In sum, the findings reveal that improvements in transportation infrastructure can contribute to rising land prices, but the effects are uneven across regions. Enhanced accessibility has intensified the divergence in land values over the past decade, with regions that already have high land prices benefiting from wealth accumulation, while less developed regions could face economic loss in a relative sense. These results underscore the role of forward and backward linkages of transportation accessibility in amplifying regional disparities, highlighting the need for policies that address these disparities.
While this study provides invaluable insights for the balanced development of transportation policies utilizing the relationship between transportation accessibility and land price dynamics, some limitations warrant consideration. Factors such as variations in regional economic structures, demographic characteristics, local policy interventions, and pre-existing infrastructure conditions may play a role in the relationship, but their specific interactions and causal pathways require further investigation. Future studies should address these gaps to better capture the multifaceted effects of transportation accessibility on land prices, ultimately providing a more comprehensive understanding of the complex interactions between transportation infrastructure investments and regional economic dynamics.
Author Contributions
Conceptualization: Seongwoo Lee. Investigation: Kyungjae Lee, Dohyeong Choi. Methodology: Kyungjae Lee, Seongwoo Lee. Formal analysis: Kyungjae Lee, Dohyeong Choi. Writing – original draft: Kyungjae Lee. Writing – review & editing: Seongwoo Lee
Funding
This research received no external funding.
Conflicts of Interest
The authors declare no conflict of interest.
Ethics Statements
This study does not involve human participants, animals, or sensitive data, and thus does not require ethical approval.
Appendix 1. Estimation Results of Road Accessibility SAC Cross-Sectional Model
| Variable | 2010 | 2011 | 2012 | 2013 | 2014 | 2015 | 2016 | 2017 | 2018 | 2019 | ||||||||||
| Intercept | 7.962 | *** | 7.344 | *** | 7.329 | *** | 7.27 | *** | 7.249 | *** | 7.236 | *** | 7.213 | *** | 5.972 | *** | 5.811 | *** | 5.652 | *** |
| GRDP | 0.048 | 0.014 | 0.046 | 0.060 | 0.074 | * | 0.085 | * | 0.103 | ** | -0.021 | -0.025 | 0.006 | |||||||
| Establishment | 0.182 | *** | 0.224 | *** | 0.236 | *** | 0.209 | *** | 0.181 | *** | 0.197 | *** | 0.180 | *** | 0.712 | *** | 0.723 | *** | 0.718 | *** |
| Manufacturer | -1.480 | *** | -1.221 | *** | -1.251 | *** | -1.166 | *** | -1.261 | *** | -1.288 | *** | -1.370 | *** | -2.417 | *** | -2.449 | *** | -2.598 | *** |
| Density | 0.368 | *** | 0.373 | *** | 0.379 | *** | 0.385 | *** | 0.394 | *** | 0.399 | *** | 0.407 | *** | 0.366 | *** | 0.371 | *** | 0.379 | *** |
| Aging | -0.070 | *** | -0.043 | *** | -0.043 | *** | -0.039 | *** | -0.033 | *** | -0.035 | *** | -0.032 | *** | -0.041 | *** | -0.038 | *** | -0.035 | *** |
| Restriction | 0.276 | ** | 0.189 | 0.191 | * | 0.233 | ** | 0.289 | *** | 0.266 | ** | 0.295 | ** | 0.394 | *** | 0.419 | *** | 0.448 | *** | |
| ln_TRAD_R | 0.208 | *** | 0.204 | *** | 0.178 | *** | 0.187 | *** | 0.204 | *** | 0.181 | *** | 0.179 | *** | 0.145 | *** | 0.154 | *** | 0.160 | *** |
| 0.067 | *** | 0.072 | *** | 0.051 | * | 0.076 | *** | 0.064 | *** | 0.050 | * | 0.053 | * | 0.087 | *** | 0.092 | *** | 0.096 | *** | |
| 2.582 | *** | 2.623 | *** | 0.951 | *** | 1.741 | *** | 2.673 | *** | 0.956 | *** | 0.955 | *** | 0.945 | *** | 0.949 | *** | 0.953 | *** | |
| 0.090 | *** | 0.099 | *** | 0.105 | *** | 0.099 | *** | 0.089 | *** | 0.105 | *** | 0.105 | *** | 0.079 | *** | 0.080 | *** | 0.082 | *** | |
| N | 247 | 247 | 247 | 247 | 247 | 247 | 247 | 247 | 247 | 247 | ||||||||||
| Pseudo R2 | 0.960 | 0.955 | 0.952 | 0.956 | 0.954 | 0.951 | 0.952 | 0.966 | 0.965 | 0.963 | ||||||||||
| LL | -54.38 | -65.72 | -74.68 | -66.63 | -53.18 | -74.37 | -74.65 | -38.85 | -41.61 | -44.85 | ||||||||||
| Note: *** p<0.01, ** p<0.05, * p<0.1. | ||||||||||||||||||||
Appendix 2. Estimation Results of Railway Accessibility SAC Cross-Sectional Model
| Variable | 2010 | 2011 | 2012 | 2013 | 2014 | 2015 | 2016 | 2017 | 2018 | 2019 | ||||||||||
| Intercept | 8.536 | *** | 7.994 | *** | 7.84 | *** | 7.837 | *** | 7.821 | *** | 7.796 | *** | 7.759 | *** | 6.399 | *** | 6.28 | *** | 6.162 | *** |
| GRDP | 0.056 | 0.004 | 0.07 | 0.061 | 0.073 | 0.094 | ** | 0.112 | ** | -0.016 | -0.021 | 0.002 | ||||||||
| Establishment | 0.180 | *** | 0.268 | *** | 0.188 | *** | 0.232 | *** | 0.221 | *** | 0.197 | *** | 0.181 | *** | 0.727 | *** | 0.738 | *** | 0.733 | *** |
| Manufacturer | -1.326 | *** | -1.155 | *** | -1.177 | *** | -1.05 | *** | -1.179 | *** | -1.183 | *** | -1.27 | *** | -2.365 | *** | -2.392 | *** | -2.533 | *** |
| Density | 0.374 | *** | 0.368 | *** | 0.389 | *** | 0.395 | *** | 0.402 | *** | 0.410 | *** | 0.418 | *** | 0.375 | *** | 0.381 | *** | 0.391 | *** |
| Aging | -0.075 | *** | -0.052 | *** | -0.042 | *** | -0.044 | *** | -0.041 | *** | -0.038 | *** | -0.036 | *** | -0.044 | *** | -0.042 | *** | -0.039 | *** |
| Restriction | 0.272 | ** | 0.109 | 0.247 | ** | 0.197 | * | 0.213 | * | 0.258 | ** | 0.289 | ** | 0.388 | *** | 0.413 | *** | 0.440 | *** | |
| ln_TRAD_R | 0.143 | *** | 0.111 | *** | 0.123 | *** | 0.108 | *** | 0.108 | *** | 0.107 | *** | 0.107 | *** | 0.084 | *** | 0.086 | *** | 0.087 | *** |
| 0.069 | *** | 0.067 | ** | 0.081 | *** | 0.052 | * | 0.051 | * | 0.051 | * | 0.055 | * | 0.089 | *** | 0.094 | *** | 0.099 | *** | |
| 2.567 | *** | 0.933 | *** | 3.144 | *** | 0.953 | *** | 0.954 | *** | 0.956 | *** | 0.954 | *** | 0.943 | *** | 0.947 | *** | 0.951 | *** | |
| 0.093 | *** | 0.113 | *** | 0.094 | *** | 0.108 | *** | 0.107 | *** | 0.107 | *** | 0.107 | *** | 0.08 | *** | 0.082 | *** | 0.085 | *** | |
| N | 247 | 247 | 247 | 247 | 247 | 247 | 247 | 247 | 247 | 247 | ||||||||||
| Pseudo R2 | 0.960 | 0.955 | 0.952 | 0.956 | 0.954 | 0.951 | 0.952 | 0.966 | 0.965 | 0.963 | ||||||||||
| LL | -54.38 | -65.72 | -74.68 | -66.63 | -53.18 | -74.37 | -74.65 | -38.85 | -41.61 | -44.85 | ||||||||||
| Note: *** p<0.01, ** p<0.05, * p<0.1. | ||||||||||||||||||||
Appendix 3. Estimation Results of Utility Accessibility SAC Cross-Sectional Model
| Variable | 2010 | 2011 | 2012 | 2013 | 2014 | 2015 | 2016 | 2017 | 2018 | 2019 | ||||||||||
| Intercept | 7.149 | *** | 6.165 | *** | 6.202 | *** | 6.048 | *** | 6.053 | *** | 6.057 | *** | 6.000 | *** | 4.943 | *** | 4.703 | *** | 4.499 | *** |
| GRDP | 0.042 | 0.009 | 0.054 | 0.061 | 0.064 | 0.088 | * | 0.103 | ** | -0.021 | -0.026 | 0.006 | ||||||||
| Establishment | 0.211 | *** | 0.262 | *** | 0.235 | *** | 0.229 | *** | 0.224 | *** | 0.197 | *** | 0.182 | *** | 0.706 | *** | 0.718 | *** | 0.715 | *** |
| Manufacturer | -1.418 | *** | -1.263 | *** | -1.242 | *** | -1.154 | *** | -1.279 | *** | -1.284 | *** | -1.312 | *** | -2.41 | *** | -2.461 | *** | -2.670 | *** |
| Density | 0.342 | *** | 0.346 | *** | 0.367 | *** | 0.373 | *** | 0.378 | *** | 0.388 | *** | 0.396 | *** | 0.359 | *** | 0.364 | *** | 0.373 | *** |
| Aging | -0.081 | *** | -0.047 | *** | -0.043 | *** | -0.039 | *** | -0.037 | *** | -0.034 | *** | -0.031 | *** | -0.039 | *** | -0.036 | *** | -0.033 | *** |
| Restriction | 0.238 | ** | 0.128 | 0.197 | * | 0.214 | * | 0.218 | * | 0.266 | ** | 0.297 | ** | 0.397 | *** | 0.423 | *** | 0.451 | *** | |
| ln_TRAD_R | 0.188 | *** | 0.203 | *** | 0.19 | *** | 0.199 | *** | 0.197 | *** | 0.194 | *** | 0.196 | *** | 0.161 | *** | 0.171 | *** | 0.176 | *** |
| 0.078 | *** | 0.076 | *** | 0.061 | ** | 0.058 | ** | 0.061 | ** | 0.059 | ** | 0.062 | ** | 0.097 | *** | 0.103 | *** | 0.109 | *** | |
| 0.879 | *** | 0.918 | *** | 0.945 | *** | 0.948 | *** | 0.948 | *** | 0.952 | *** | 0.952 | *** | 0.94 | *** | 0.946 | *** | 0.951 | *** | |
| 0.098 | *** | 0.108 | *** | 0.103 | *** | 0.103 | *** | 0.103 | *** | 0.103 | *** | 0.103 | *** | 0.078 | *** | 0.079 | *** | 0.081 | *** | |
| N | 247 | 247 | 247 | 247 | 247 | 247 | 247 | 247 | 247 | 247 | ||||||||||
| Pseudo R2 | 0.960 | 0.955 | 0.952 | 0.956 | 0.954 | 0.951 | 0.952 | 0.966 | 0.965 | 0.963 | ||||||||||
| LL | -54.38 | -65.72 | -74.68 | -66.63 | -53.18 | -74.37 | -74.65 | -38.85 | -41.61 | -44.85 | ||||||||||
| Note: *** p<0.01, ** p<0.05, * p<0.1. | ||||||||||||||||||||
| 1 | Adaptive bi-square kernel function assigns weights that decrease with increasing distance from the target location, reaching zero beyond a certain threshold distance, which is automatically optimized based on the spatial distribution of the data to ensure the most appropriate bandwidth for the analysis. |
| 2 | The results for all regression analyses applying the SAC model for TRAD road and railway accessibility and utility accessibility from 2010 to 2019 are summarized in Appendix 1, Appendix 2 and Appendix 3. |
References
- Ahlfeldt, G. M. & Feddersen, A. (2017). From periphery to core: Measuring agglomeration effects using high-speed rail. Journal of Economic Geography, 18(2), 355–390. [CrossRef]
- Anselin, L., Gallo, J. L. & Jayet, H. (2008). The Econometrics of Panel Data. Springer, Berlin.
- Aschauer D. A. (1990). Why is infrastructure important? In: A. H. Munnell. (Ed.), Is there a shortfall in public capital investment? (pp. 21-50). Federal Bank of Boston, Boston.
- Banister, D. and Berechman, Y. (2001). Transport investment and the promotion of economic growth. Journal of Transport Geography, 9(3), 209–218. [CrossRef]
- Banister, D., & Thurstain-Goodwin, M. (2011). Quantification of the non-transport benefits resulting from rail investment. Journal of Transport Geography, 19(2), 212–223. [CrossRef]
- Bollinger, C. R., Ihlanfeldt, K. R., & Bowes, D. R. (1998). Spatial Variation in Office Rents within the Atlanta Region. Urban Studies, 35(7), 1097–1118. [CrossRef]
- Bröcker, J., Korzhenevych, A., & Schürmann, C. (2010). Assessing spatial equity and efficiency impacts of transport infrastructure projects. Transportation Research Part B: Methodological, 44(7), 795–811. [CrossRef]
- Cai, W., Wu, Z., & Lu, Y. (2022). The Impact of High-Speed Rails on Urban Consumption: From the Perspective of “Local-Adjacent” Effect. Frontiers in Environmental Science, 10, 884965. [CrossRef]
- Cantos, P., Gumbau-Albert, M., & Maudos, J. (2005). Transport infrastructures, spillover effects and regional growth: Evidence of the Spanish case. Transport Reviews, 25(1), 25–50. [CrossRef]
- Cavallaro, F., Bruzzone, F., & Nocera, S. (2022). Effects of high-speed rail on regional accessibility. Transportation, 50, 1685-1721. [CrossRef]
- Chae, J. & Sung, H. (2019). Impact of Spatial Accessibility Index, Based on Road Network and Actual Trips, on Housing Price. Journal of Korea Planning Association, 54(2), 76-83. [CrossRef]
- Chen, C.-L., Loukaitou-Sideris, A., de Ureña J. M., & Vikerman, R. (2019). Spatial short and long-term implications and planning challenges of high-speed rail: a literature review framework for the special issue. European Planning Studies, 27(3), 415-433. [CrossRef]
- Choi, E., Park, J., Kim, C., & Lee, S. (2020). The Impact of Improved Transportation Accessibility on Agricultural Productivity. Journal of Rural Development (JRD), 43(4), 83-114. [CrossRef]
- Choi, U. & Kim, J., (2021). Impact of Large-scale Transportation Infrastructure Plan on the Housing Markets: Focus on GTX, Housing Consumer Confidence Index and Sales Prices. Journal of Digital Convergence, 19(9), 9-18. [CrossRef]
- Chong, Z., Qin, C., & Chen, Z. (2019). Estimating the economic benefits of high-speed rail in China: A new perspective from the connectivity improvement. Journal of Transport and Land Use, 121(1), 287-302. [CrossRef]
- Chung, I., Lee, B., & Kim, H. (2011). The Strategies of Equity Improvement toward Fair Society - focusing on the Equity in Transportation Policy. Korea Research Institute for Human Settlements, Sejong.
- Cook, L. M. & Munnell, A. H. (1990). How does public infrastructure affect regional economic performance? New England Economic Review, Sep, 11–33.
- Donaldson, D. (2018). Railroads of the Raj: Estimating the impact of transportation infrastructure. American Economic Review, 108(4–5), 899–934. [CrossRef]
- Fotheringham, A. S., Brunsdon, C., & Charlton, M. (2003). Geographically weighted regression: The analysis of spatially varying relationships. John Wiley & Sons.
- Gatzlaff, D. H., & Smith, M. T. (1993). The impact of the Miami Metrorail on the value of residences near station locations. Land Economics, 69(1), 54–66. [CrossRef]
- Geurs, K., Zondag, B., de Jong, G., & de Bok, M. (2010). Accessibility appraisal of land-use/transport policy strategies: More than just adding up travel-time savings. Transportation Research Part D: Transport and Environment, 15, 382–393. [CrossRef]
- Gutiérrez, J., González, R., & Gómez, G. (1996). The European high-speed train network. Journal of Transport Geography, 4(4), 227–238. [CrossRef]
- Hansen, W. G. (1959). How accessibility shapes land use. Journal of the American Institute of Planners, 25(2), 73–76. [CrossRef]
- Harris Jr., C. C. (1980). Symposium on multiregional forecasting and policy simulation models: New developments and extensions of the multiregional, multi-industry forecasting model. Journal of Regional Science, 20(2), 159–171.
- Hwang, E. (2002). A study on the urban growth according to transportation construction. Journal of Korea Planning Association (JKPA), 37(2), 159–172.
- Jeong, S., Lee, H., Lee, Y., & Lee, J. (2020). Analysis of determinants and validation on standard official housing price in Seoul. Journal of Urban Studies and Real Estate, 11(3), 109–124. [CrossRef]
- Jo, J., & Woo, M. (2014). The impacts of high-speed rail on regional economy and balanced development: Focused on Gyeongbu and Gyeongjeon lines of Korea Train eXpress (KTX). Journal of Korea Planning Association (JKPA), 49(5), 263–278.
- Jun, E., & Lee, S. (2007). The effects of rapid rail transit on balanced regional development. Seoul Studies, 8(4), 73–87.
- Kang, C. (2021). Effects of intermodalism of public transit on land prices: Case of metro and bus transit in Seoul, Korea. Korea Real Estate Review, 31(2), 47–68. [CrossRef]
- Kim, C., Cho, H., Choi, J., Park, J., & Kang, D. (2021). 2021 Transportation SOC investment outlook. The Korea Transport Institute.
- Kim, C., Kang, D., Lee, J., Kang, K., Seo, S., Song, K., & Lee, H. (2019). A preliminary study on the future national transportation master plan. The Korea Transport Institute.
- Kim, E., & Yi, Y. (2019). Impact analysis of high-speed rail investment on regional economic inequality: A hybrid approach using a transportation network-CGE model. Journal of Transport Economics and Policy, 53(3), 314–333.
- Kim, E., Moon, S., & Yi, Y. (2021). Analyzing spillover effects of development of Asian highway on regional growth of Northeast Asian countries. Review of Development Economics, 25(3). [CrossRef]
- Kim, H., & Sultana, S. (2015). The impacts of high-speed rail extensions on accessibility and spatial equity changes in South Korea from 2004 to 2018. Journal of Transport Geography, 45, 48–61. [CrossRef]
- Kim, J., & Yu, J. (2018). Forecasting income disparity in Korea and some suggestions for environmental welfare from tax reform. Journal of Environmental Policy and Administration, 26(1), 37-58. [CrossRef]
- Kim, K. (2023). A study on the gap in employment and earned income between regions in Korea. International Area Studies Review, 27(2), 3-37. [CrossRef]
- Leck, E., Bekhor, S., & Gat, D. (2008). Equity impacts of transportation improvements on core and peripheral cities. Journal of Transport and Land Use, 1(2), 153-182. [CrossRef]
- Lee, K., Kim, C., & Lee, S. (2021). The impact of transportation accessibility on the mode choice for commuters in Seoul Metropolitan Area from 2005 to 2015: Application of a conditional logit model. Seoul Studies, 22(2), 77-102.
- Lee, L., & Yu, J. (2010). Estimation of spatial autoregressive panel data models with fixed effects. Journal of Econometrics, 154(2), 165–185. [CrossRef]
- Lee, S., & Jung, I. (2011). The effects of high-speed rail on regional disparity. Journal of Korea Regional Economics, 9(3), 61-79.
- Lee, S., Yun, S., Park, J., & Min, S. (2006). The practice of spatial econometric models. Park Youngsa.
- LeSage, J., & Pace, R. K. (2009). Introduction to spatial econometrics. CRC Press.
- Li, T., & Chen, Z. (2022). The impact of transportation development on land price differences between cities: Widening or narrowing?—A case study based on the provincial level of Mainland China. Growth and Change, 53(2), 910–932. [CrossRef]
- Lin, Y., & Huang, J. (2021). Can highway networks promote productivity? Evidence from China. Journal of Advanced Transportation, 2021(02), 1-20. [CrossRef]
- Litman, T. (2015). Evaluating public transit benefits and costs. Victoria Transport Policy Institute.
- Meijiers, E., Hoekstra, J., Leijten, M., Louw, E., & Spaans, M. (2012). Connecting the periphery: Distributive effects of new infrastructure. Journal of Transport Geography, 22, 187-198. [CrossRef]
- Mills, E. S., & Carlino, G. (1989). Dynamics of county growth. In A. E. Anderson, D. F. Batten, B. Johansson, & P. Nijkamp (Eds.), Advances in spatial theory and dynamics (pp. 195-205). North-Holland.
- Monzón, A., Ortega, E., & López, E. (2013). Efficiency and spatial equity impacts of high-speed rail extensions in urban areas. Cities, 30, 18–30. [CrossRef]
- Munnell, A. H. (1990). Why has productivity growth declined? Productivity and public investment. New England Economic Review, January, 3–22.
- Munnell, A. H. (1992). Policy watch: Infrastructure investment and economic growth. Journal of Economic Perspectives, 6(4), 189–198. [CrossRef]
- Park, J., Kim, C., & Lee, S. (2020). The effects of transportation accessibility on influx of population and gross regional domestic product. The Korea Spatial Planning Review, 107, 25-40.
- Qi, G., Shi, W., Lin, K.-C., Yuen, K. F., & Xiao, Y. (2020). Spatial spillover effects of logistics infrastructure on regional development: Evidence from China. Transportation Research Part A: Policy and Practice, 135, 96–114. [CrossRef]
- Qin, Y. (2017). ‘No county left behind?’ The distributional impact of high-speed rail upgrades in China. Journal of Economic Geography, 17(3), 489–520.
- Sánchez-Mateos, H. S. M., & Givoni, M. (2012). The accessibility impact of a new high-speed rail line in the UK: A preliminary analysis of winners and losers. Journal of Transport Geography, 25, 105-114. [CrossRef]
- Tsutsumi, M., & Seya, H. (2008). Measuring the impact of large-scale transportation projects on land price using spatial statistical models. Papers in Regional Science, 87(3), 385–401. [CrossRef]
- Yu, N., De Jong, M., Storm, S., & Mi, J. (2013). Spatial spillover effects of transport infrastructure: Evidence from Chinese regions. Journal of Transport Geography, 28, 56–66. [CrossRef]
- Zhang, A., Wan, Y., & Yang, H. (2019). Impacts of high-speed rail on airlines, airports, and regional economics: A survey of recent research. Transport Policy, 81, A1-A19. [CrossRef]
Figure 1.
Regional Disparities in Transportation Accessibility (GINI).
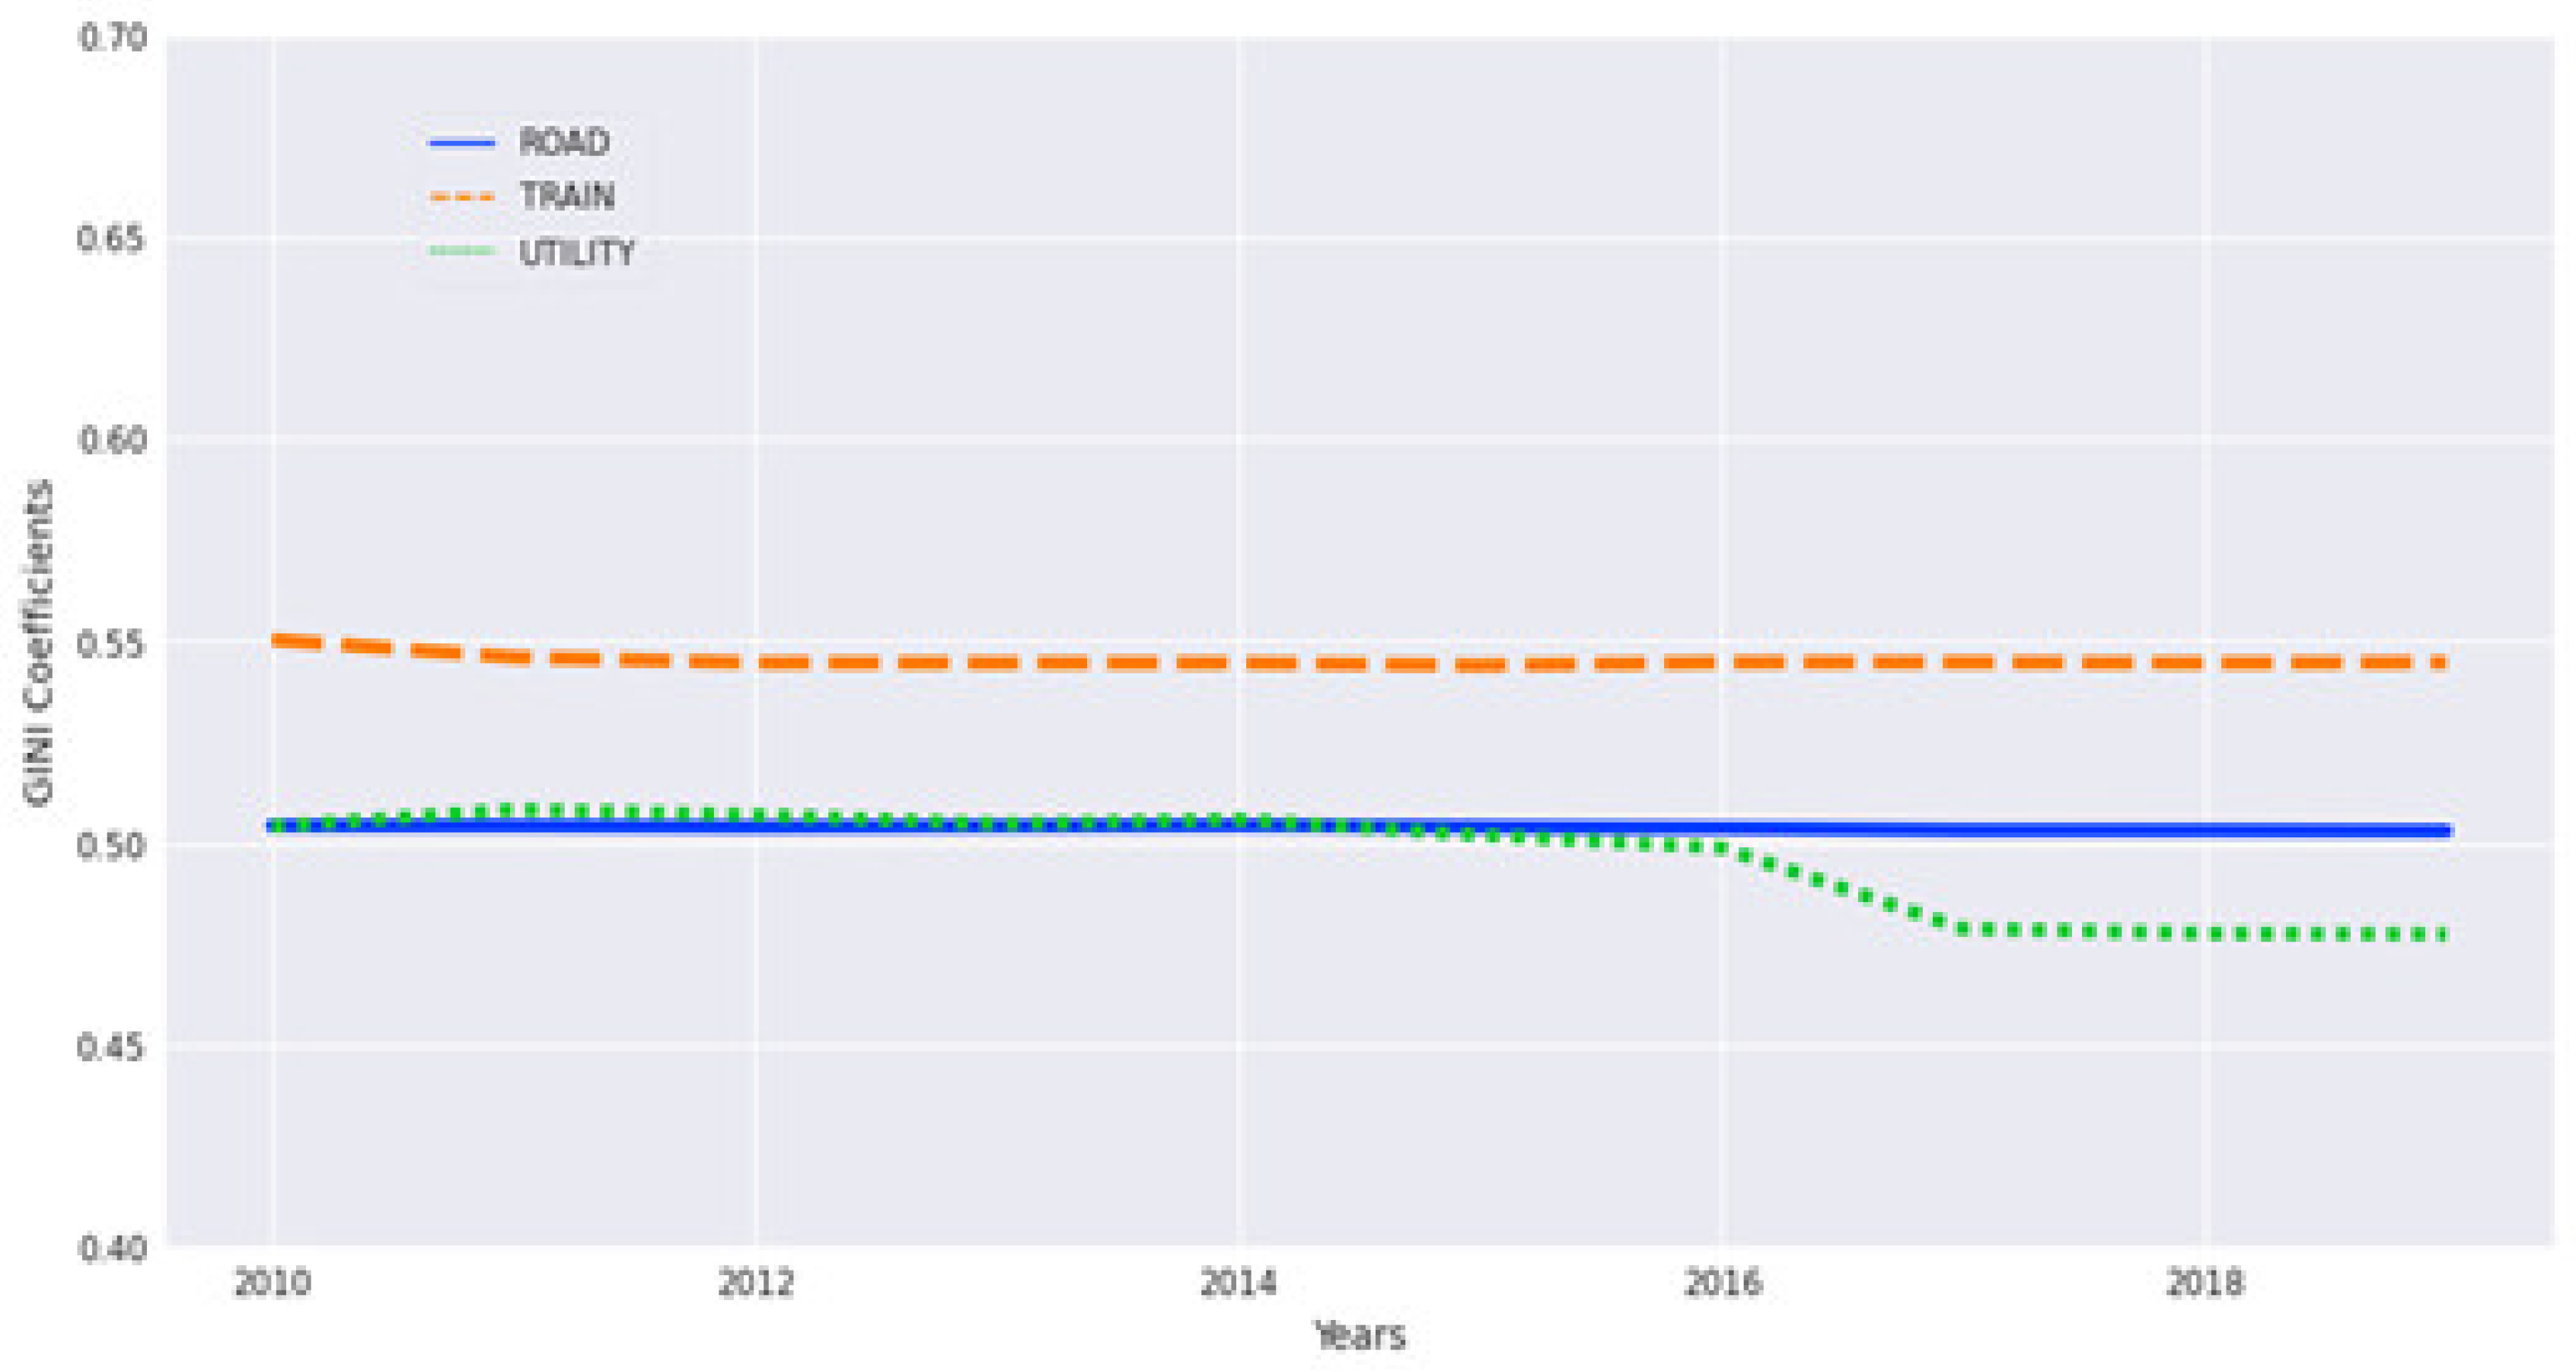
Figure 2.
Transport Infrastructure Investment and Regional Disparity (Gini).
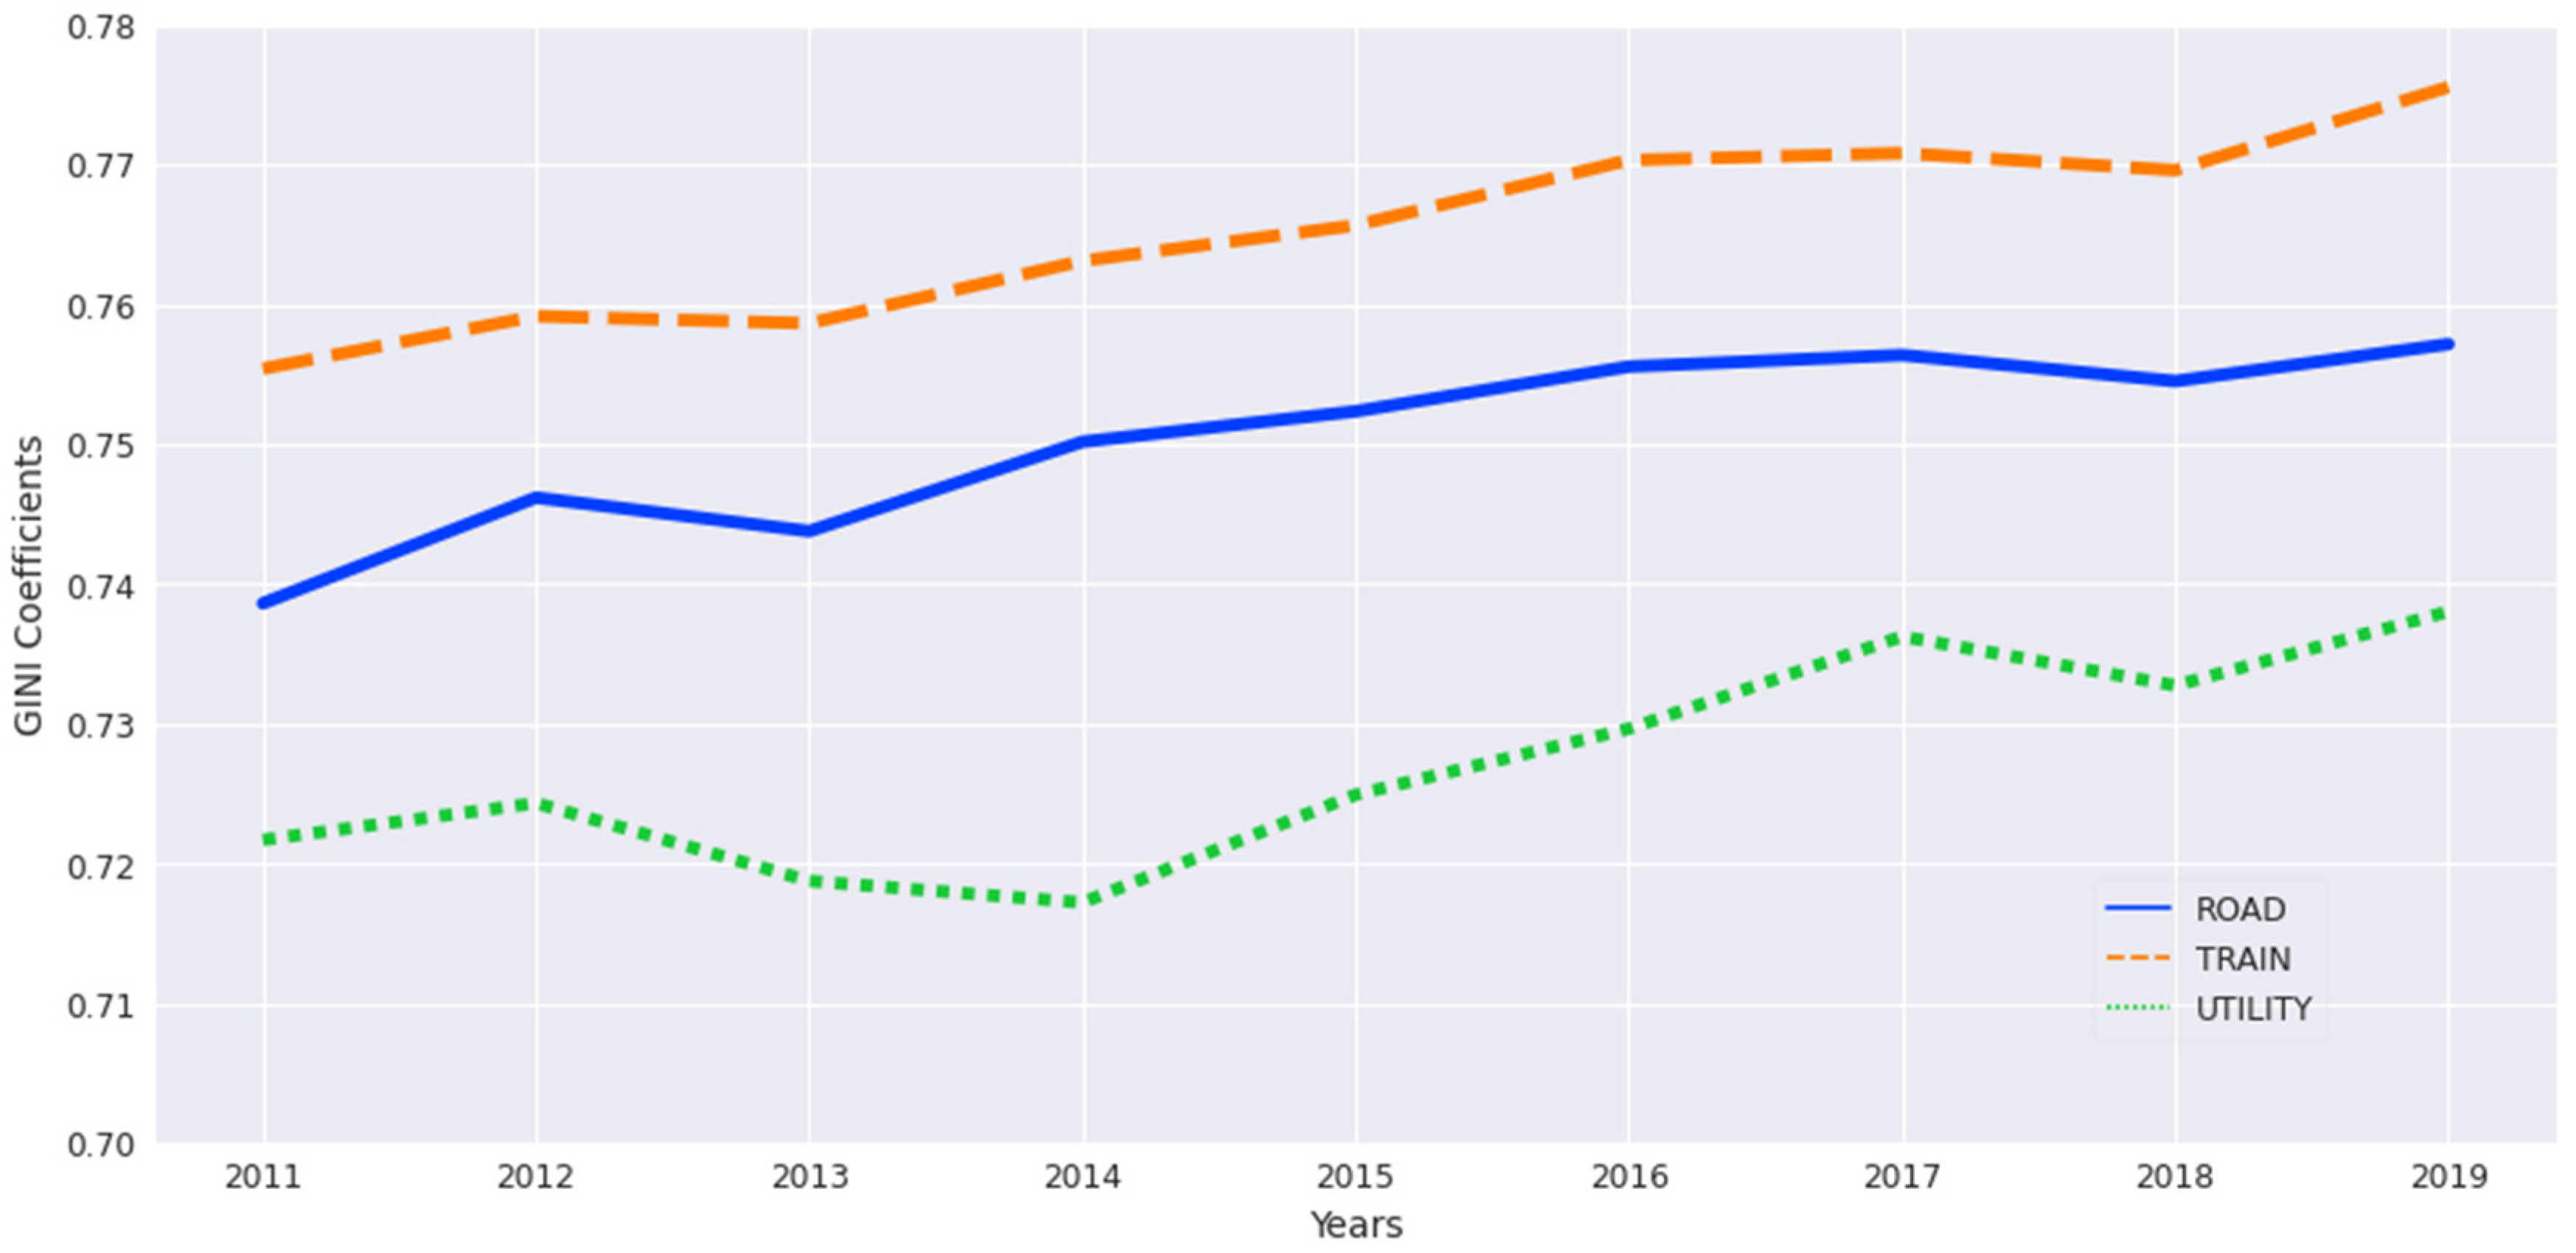
Figure 3.
Geographical Visualization of Raw Accessibility Rankings and Land Price Increase Rankings Due to Accessibility Improvement (2019).
Figure 3.
Geographical Visualization of Raw Accessibility Rankings and Land Price Increase Rankings Due to Accessibility Improvement (2019).
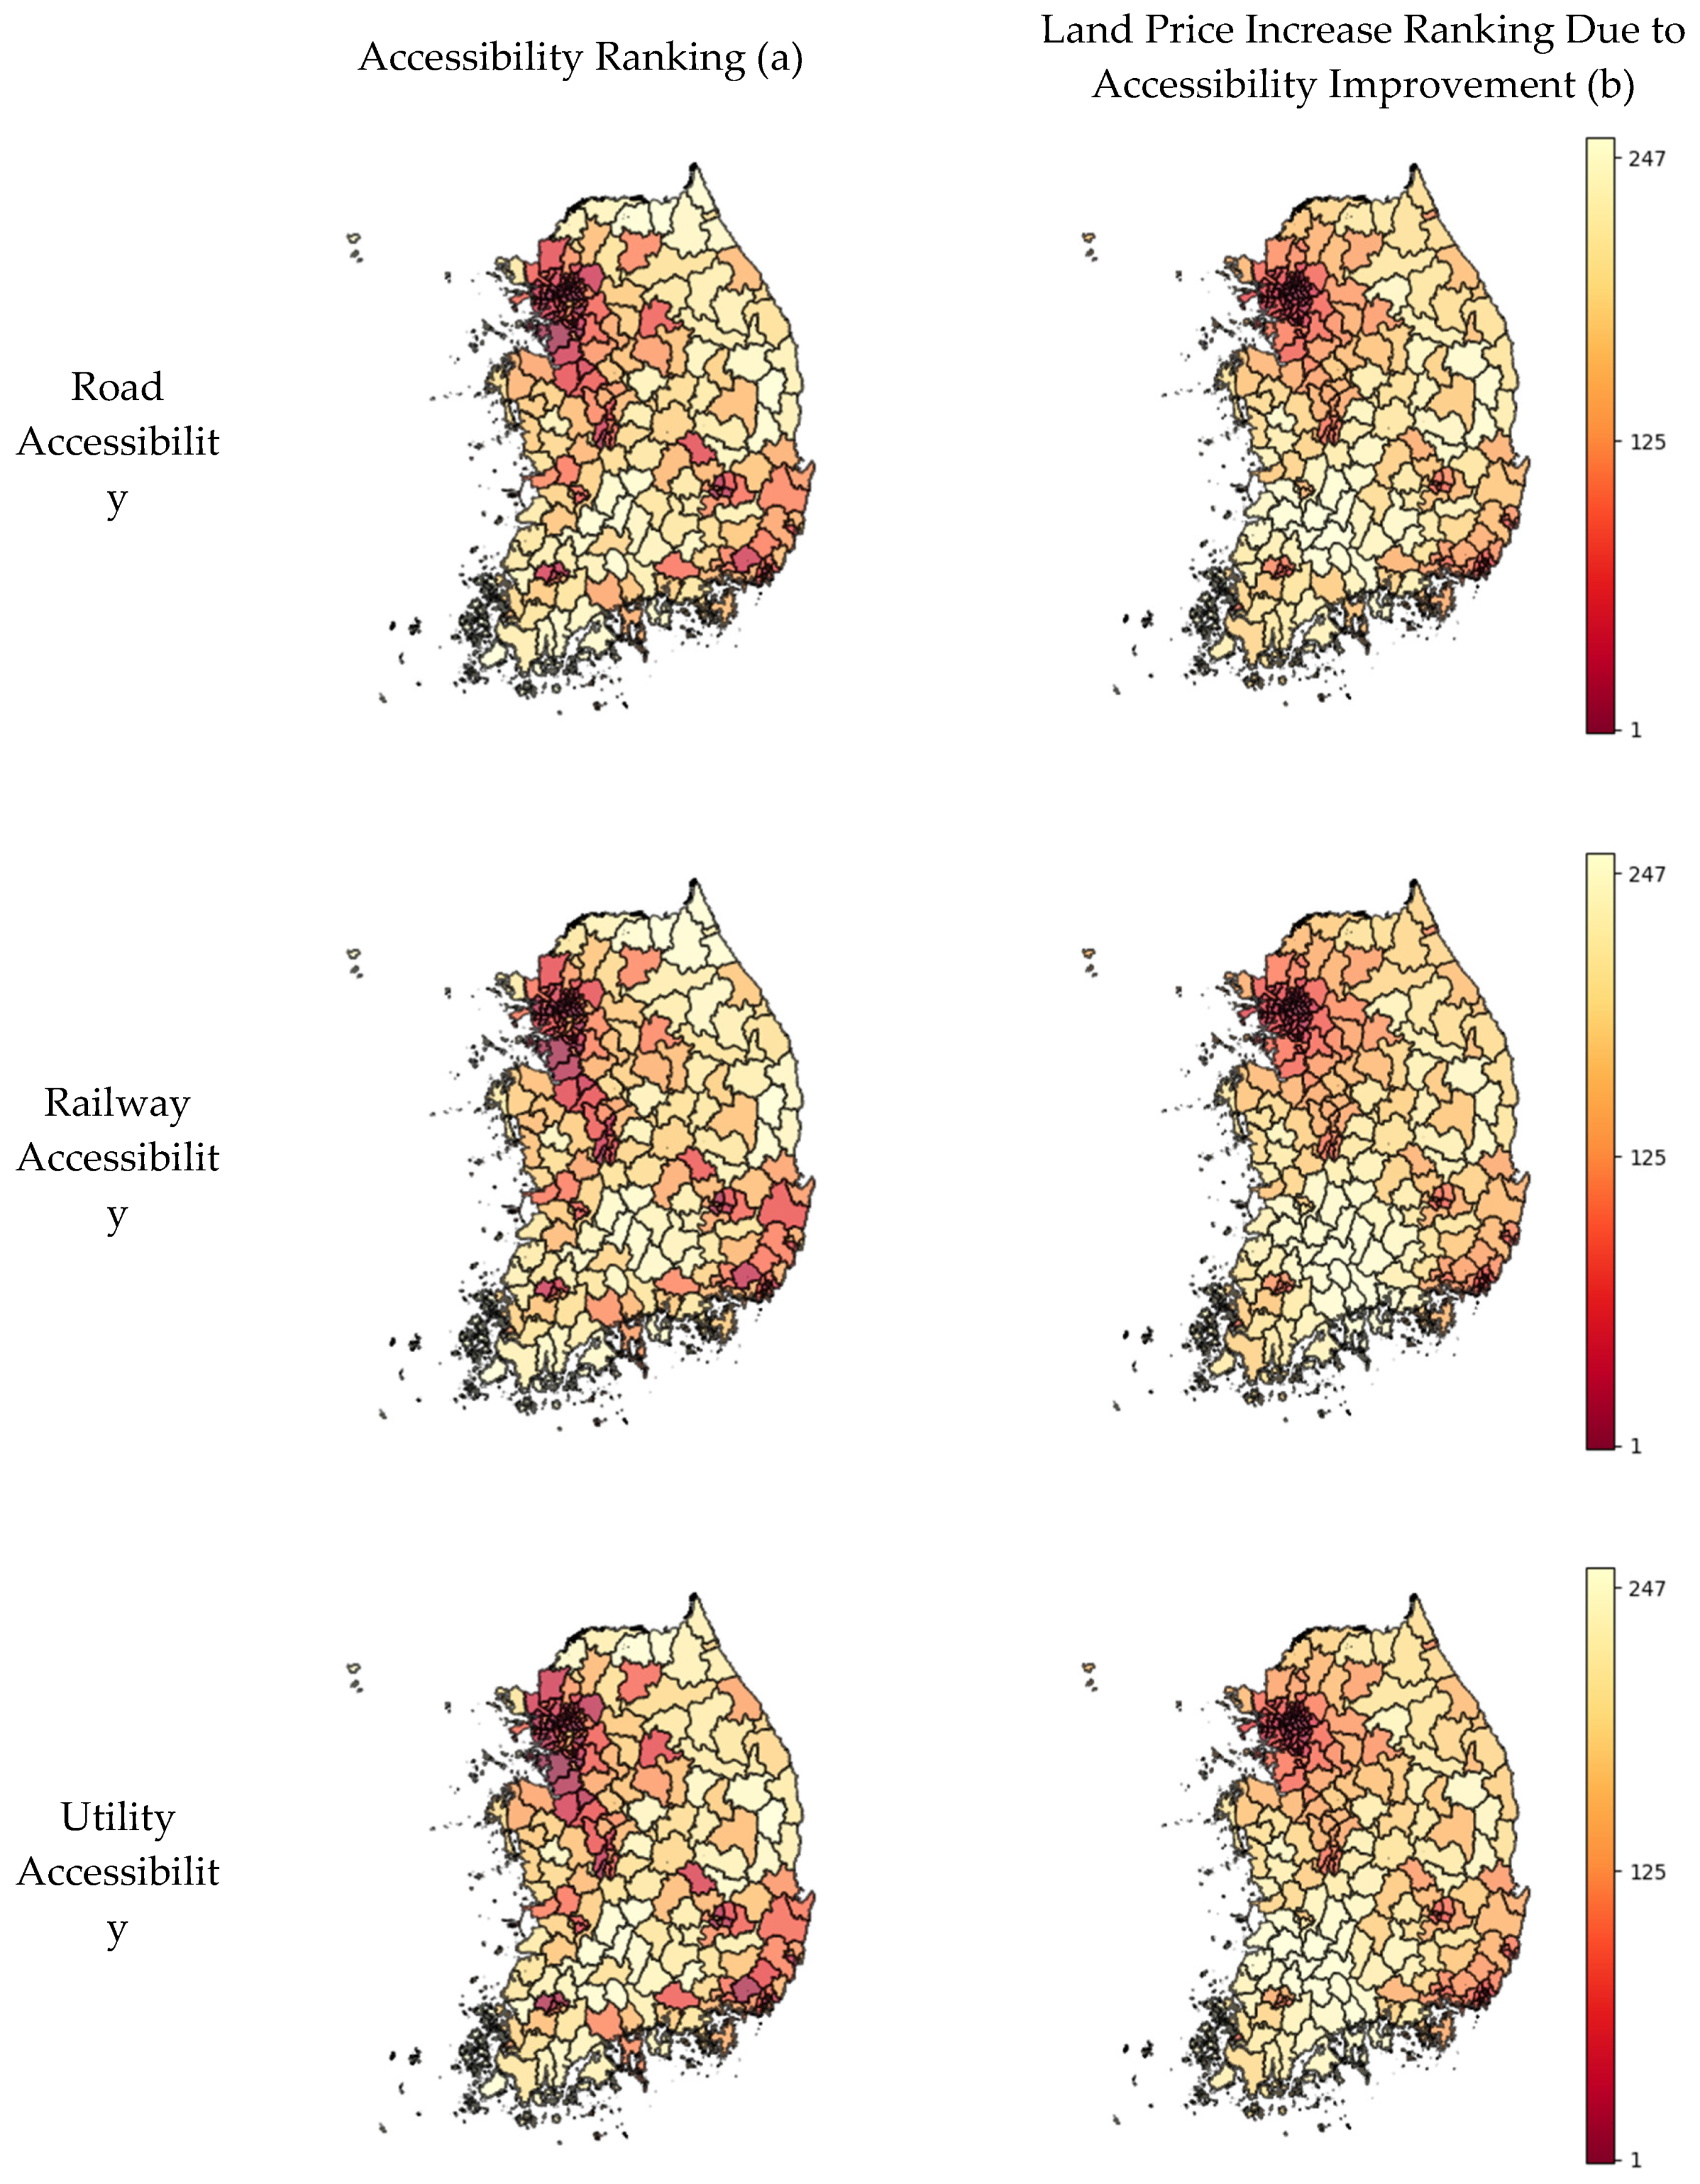

Table 1.
Description of Variables for Spatial Econometrics Models.
| Variable Name | Definition | Source | |
| Dependent Variable | |||
| Average Land Price | (log) Average land price by region (KRW/) | Korea Real Estate Board | |
| Regional Variables | |||
| GRDP | (log) GRDP per capita (million KRW/person) | Statistics Korea | |
| Establishment | (log) Number of establishments per 1,000 people | ||
| Manufacturer | % of manufacturing establishments to total establishments | ||
| Density | (log) Population per total area (people/) | ||
| Aging | % of population aged 65 and above | ||
| Restriction | % of restricted development area to total area | ||
| Accessibility Variables | |||
| ln_TRAD_R | (log) TRAD road accessibility | Korea Transport Institute | |
| ln_TRAD_T | (log) TRAD railway accessibility | ||
| ln_WATT_R | (log) WATT road accessibility | ||
| ln_WATT_T | (log) WATT railway accessibility | ||
| ln_UTILITY | (log) Utility accessibility | ||
Table 2.
The Global Moran’s I Indices.
| Yearly Index | |||||
| 2010 | 2011 | 2012 | 2013 | 2014 | |
| Moran’s I | 0.544*** | 0.545*** | 0.548*** | 0.545*** | 0.542*** |
| 2015 | 2016 | 2017 | 2018 | 2019 | |
| Moran’s I | 0.539*** | 0.537*** | 0.531*** | 0.525*** | 0.501*** |
| *** p<0.01, ** p<0.05, * p<0.1. | |||||
Table 3.
SEM Panel Model Estimation Results, 2010-2019.
| TRAD Accessibility | WATT Accessibility | Utility Accessibility | ||||||||
| Variable | Road | Railway | Road | Railway | ||||||
| GRDP | 0.103 | *** | 0.125 | *** | 0.075 | *** | 0.124 | *** | 0.115 | *** |
| Establishment | 0.091 | *** | 0.082 | *** | 0.078 | *** | 0.082 | *** | 0.084 | *** |
| Manufacturer | 0.713 | *** | 0.678 | *** | 0.569 | *** | 0.676 | *** | 0.657 | *** |
| Density | 0.521 | *** | 0.557 | *** | 0.515 | *** | 0.555 | *** | 0.476 | *** |
| Aging | 0.013 | *** | 0.015 | *** | 0.009 | *** | 0.015 | *** | 0.015 | *** |
| Restriction | -0.936 | *** | -0.983 | *** | -0.889 | *** | -0.985 | *** | -0.975 | *** |
| ln_TRAD_R | 1.497 | *** | ||||||||
| ln_TRAD_T | 0.079 | |||||||||
| ln_WATT_R | -2.965 | *** | ||||||||
| ln_WATT_T | -0.115 | *** | ||||||||
| ln_UTILITY | 0.087 | *** | ||||||||
| 1.279 | *** | 1.284 | *** | 1.074 | *** | 1.274 | *** | 1.252 | *** | |
| 0.065 | *** | 0.066 | *** | 0.06 | *** | 0.066 | *** | 0.066 | *** | |
| N | 2,470 | 2,470 | 2,470 | 2,470 | 2,470 | |||||
| Time Period | 10 | 10 | 10 | 10 | 10 | |||||
| # of groups | 247 | 247 | 247 | 247 | 247 | |||||
| Pseudo R2 | 0.871 | 0.859 | 0.760 | 0.847 | 0.844 | |||||
| LL | 2913 | 2874 | 3064 | 2877 | 2890 | |||||
| Note: *** p<0.01, ** p<0.05, * p<0.1. | ||||||||||
Table 4.
SAC Cross-sectional Estimation Results (Accessibility Summary).
| Variable | Yearly Estimates | |||||||||
| 2010 | 2011 | 2012 | 2013 | 2014 | ||||||
| ln_TRAD_R | 0.208 | *** | 0.204 | *** | 0.178 | *** | 0.187 | *** | 0.204 | *** |
| ln_TRAD_T | 0.143 | *** | 0.111 | *** | 0.123 | *** | 0.108 | *** | 0.108 | *** |
| ln_UTILITY | 0.188 | *** | 0.203 | *** | 0.190 | *** | 0.199 | *** | 0.197 | *** |
| N | 247 | 247 | 247 | 247 | 247 | |||||
| 2015 | 2016 | 2017 | 2018 | 2019 | ||||||
| ln_TRAD_R | 0.181 | *** | 0.180 | *** | 0.145 | *** | 0.154 | *** | 0.160 | *** |
| ln_TRAD_T | 0.107 | *** | 0.107 | *** | 0.084 | *** | 0.086 | *** | 0.087 | *** |
| ln_UTILITY | 0.194 | *** | 0.196 | *** | 0.161 | *** | 0.171 | *** | 0.176 | *** |
| N | 247 | 247 | 247 | 247 | 247 | |||||
| Note: *** p<0.01, ** p<0.05, * p<0.1. | ||||||||||
Table 5.
Road Accessibility (TRAD) GWR Estimation Result (2019).
| GWR Coefficients | % of (+) or (-) Coefficients | % of t-Valuesp < 0.1 | ||||||||
| Variable | Min | Max | Mean | Std. | (+) | (-) | ||||
| Intercept | 0.548 | 8.618 | 4.608 | 1.827 | 100% | 0% | 93.93% | |||
| GRDP | -0.192 | 0.406 | 0.101 | 0.181 | 63.56% | 36.44% | 34.41% | |||
| Establishment | -0.024 | 1.564 | 0.504 | 0.412 | 98.79% | 1.21% | 60.32% | |||
| Manufacturer | -3.601 | -0.031 | -2.020 | 0.912 | 0% | 100% | 82.19% | |||
| Density | 0.308 | 0.650 | 0.504 | 0.086 | 100% | 0% | 100% | |||
| Aging | -0.050 | 0.077 | 0.006 | 0.039 | 35.63% | 64.37% | 61.94% | |||
| Restriction | 0.026 | 2.457 | 0.690 | 0.330 | 100% | 0% | 94.33% | |||
| ln_TRAD_R | -0.005 | 0.517 | 0.259 | 0.120 | 99.60% | 0.40% | 86.23% | |||
| GWR Diagnostics | Adj R2 | 0.982 | AIC | 13.889 | ||||||
Table 6.
Railway Accessibility (TRAD) GWR Estimation Result (2019).
| GWR Coefficients | % of (+) or (-) Coefficients | % of t-Valuesp < 0.1 | ||||||||
| Variable | Min | Max | Mean | Std. | (+) | (-) | ||||
| Intercept | 1.394 | 8.844 | 5.169 | 1.641 | 100% | 0% | 97.17% | |||
| GRDP | -0.185 | 0.416 | 0.103 | 0.186 | 60.73% | 39.27% | 35.63% | |||
| Establishment | 0.018 | 1.576 | 0.520 | 0.436 | 100% | 0% | 59.92% | |||
| Manufacturer | -3.519 | 0.043 | -1.882 | 0.897 | 0.40% | 99.60% | 76.11% | |||
| Density | 0.315 | 0.695 | 0.512 | 0.079 | 100% | 0% | 100% | |||
| Aging | -0.054 | 0.074 | 0.003 | 0.039 | 34.41% | 65.59% | 71.26% | |||
| Restriction | 0.004 | 2.441 | 0.695 | 0.333 | 100% | 0% | 93.93% | |||
| ln_TRAD_T | -0.135 | 0.432 | 0.188 | 0.130 | 93.93% | 6.07% | 81.38% | |||
| GWR Diagnostics | Adj R2 | 0.981 | AIC | 20.327 | ||||||
Table 7.
Utility Accessibility GWR Estimation Result (2019).
| GWR Coefficients | % of (+) or (-) Coefficients | % of t-Valuesp < 0.1 | ||||||||
| Variable | Min | Max | Mean | Std. | (+) | (-) | ||||
| Intercept | -1.315 | 7.728 | 3.472 | 1.974 | 95.55% | 4.45% | 73.28% | |||
| GRDP | -0.204 | 0.477 | 0.111 | 0.198 | 64.37% | 35.63% | 36.84% | |||
| Establishment | 0.008 | 1.661 | 0.507 | 0.426 | 100% | 0% | 59.11% | |||
| Manufacturer | -3.981 | 0.015 | -2.035 | 1.050 | 0.40% | 99.60% | 79.76% | |||
| Density | 0.305 | 0.67 | 0.516 | 0.093 | 100% | 0% | 100% | |||
| Aging | -0.056 | 0.095 | 0.008 | 0.041 | 36.03% | 63.97% | 60.73% | |||
| Restriction | 0.014 | 2.514 | 0.700 | 0.364 | 100% | 0% | 93.12% | |||
| ln_UTILITY | -0.107 | 0.500 | 0.23 | 0.109 | 96.76% | 3.24% | 85.83% | |||
| GWR Diagnostics | Adj R2 | 0.943 | AIC | 252.724 | ||||||
Disclaimer/Publisher’s Note: The statements, opinions and data contained in all publications are solely those of the individual author(s) and contributor(s) and not of MDPI and/or the editor(s). MDPI and/or the editor(s) disclaim responsibility for any injury to people or property resulting from any ideas, methods, instructions or products referred to in the content. |
© 2025 by the authors. Licensee MDPI, Basel, Switzerland. This article is an open access article distributed under the terms and conditions of the Creative Commons Attribution (CC BY) license (http://creativecommons.org/licenses/by/4.0/).
Copyright: This open access article is published under a Creative Commons CC BY 4.0 license, which permit the free download, distribution, and reuse, provided that the author and preprint are cited in any reuse.