Submitted:
17 April 2025
Posted:
18 April 2025
You are already at the latest version
Abstract
Employee retention represents a critical challenge for organizations, with high turnover rates impacting operational continuity and financial stability. This research introduces an optimized feature selection framework for predicting employee attrition using machine learning techniques. The study employs a hybrid approach integrating filter, wrapper, and embedded methods to identify the most influential predictors while reducing dimensionality by 60%. A comprehensive dataset containing 1,470 employee records with 35 attributes undergoes preprocessing with MinMaxScaler normalization and SMOTE balancing to address class imbalance issues. Multiple classification algorithms are evaluated, with XGBoost demonstrating superior performance (87.33% accuracy, 0.684 F1-score) using the optimized feature subset. SHAP value analysis reveals overtime requirements, monthly income, and job involvement as the primary predictors of attrition, with significant interaction effects between compensation and workload variables. The proposed framework enhances model interpretability while maintaining predictive power, enabling HR practitioners to implement targeted retention strategies. The integration of advanced feature selection techniques with ensemble learning methods provides both theoretical contributions to HR analytics and practical applications for workforce management, supporting proactive intervention before attrition indicators emerge.
Keywords:
Feature Selection Optimization
; Employee Retention
; Machine Learning
; Human Resource Analytics
1. Introduction
1.1. Employee Retention Background and Importance
The preservation of employees represents critical concern for organizations in the regions of today's competitive business environment. The success of the organization is significantly dependent on its satisfaction and trust of its stakeholders, and employees form one of the most valuable funds for raising the organization. Organizations with a higher storage ratio show greater success in achieving strategic goals and maintaining operational continuity. As Kaur and Dogra (2022), the loss of skilled and trained workers interferes with the organization's activities and causes significant financial losses related to the recruitment and training costs of replacement staff [1]. These expenses extend to direct costs to include data transfer openings, productivity losses and group dynamics disorders. The financial impact of workers' net sales can be 90 % to 200 % of the employee's annual salary, covering both concrete and intangible costs. In a modern industrial landscape, which is characterized by growing opportunities for alternative employment arrangements, the retention rate has shown declining trends that have created significant challenges for human resources. Knowledge-based decision-making methods have become strategic to resolve strategic demands, allowing organizations to identify employees' departure and implement targeted interventions.
1.2. Challenges in Predicting Employee Turnover
Predicting workers' turnover poses versatile challenges that require sophisticated analytical approaches. Traditional personnel methods typically use quantitative and classic statistical analyzes to understand employee output models, but these approaches often lack the proactive ability that is essential for proactive preservation strategies. As labor data data grows in complexity and volume, conventional analytical methods are struggling to capture subtle relationships and models that indicate potential risks of rubbing. Sharma et al. (2024) emphasize that the predictive analysis will face obstacles to implementation, including data collection restrictions, privacy concerns and computational resource requirements [2]. In addition, workers' turnover models must dispute with class imbalance problems, as surviving employees generally exceed the number of outgoing workers in the organization's data. The guidance of complex machine learning algorithms creates interpretation challenges for HR professionals who are looking for effective insights in predictable models. The choice of properties is particularly difficult in predicting turnover, which requires careful identification of the most appropriate features while balancing the complexity and performance of the model. Mitravinda and Shetty (2022) emphasize that accurate identification of assistant factors enables organizations to develop targeted measures to preserve employees instead of predicting only the likelihood of rubbing [3].
2. Literature Review
2.1. Traditional Approaches to Employee Retention Analysis
Traditional employee retention analysis has predominantly relied on descriptive statistics and demographic analysis to identify turnover patterns. Human resource departments typically employ correlation studies, regression analysis, and survey-based methodologies to understand attrition factors. Kaur and Dogra (2022) note that conventional HR approaches often utilize elementary statistical tools, which yield limited predictive capabilities [4]. These methods analyze historical data to establish relationships between employee characteristics and turnover incidents but struggle to capture complex interaction effects between multiple variables. Organizational behavior frameworks have guided retention analyses through exit interviews, satisfaction surveys, and performance evaluations. The effectiveness of these traditional approaches remains constrained by their inherent reactive nature, addressing issues after employee dissatisfaction manifests. Statistical limitations also impede the identification of early warning signals for potential turnover, particularly when analyzing high-dimensional workforce data containing numerous demographic, performance, and engagement metrics.
2.2. Machine Learning Applications in Human Resource Management
Machine learning applications have revolutionized human resource management analytical capabilities, offering enhanced predictive power for employee retention strategies. Multiple classification algorithms demonstrate effectiveness in modeling complex relationships within HR data. Ponmalar et al. (2024) implemented ensemble learning techniques including CatBoost, AdaBoost, LightGBM, and Gradient Boosting Machine alongside LSTM networks, achieving 98% accuracy in retention prediction [5]. Sharma and Dhingra (2024) demonstrated deep learning frameworks can surpass traditional predictive models through superior feature extraction and pattern recognition capabilities [6]. Machine learning models capture nonlinear relationships between organizational factors and retention outcomes while accommodating both categorical and numerical HR variables. Classification algorithms deployed across multiple studies include Decision Trees, Random Forests, Support Vector Machines, XGBoost, and neural network architectures. These advanced analytical approaches enable HR practitioners to move beyond descriptive analytics toward prescriptive interventions by identifying high-risk employees before resignation occurs. Model performance evaluations consistently demonstrate accuracy improvements ranging from 10-25% compared to classical statistical methods.
2.3. Feature Selection Techniques for Predictive HR Analytics
Feature selection techniques have emerged as critical components for optimizing employee retention prediction models. Mitravinda and Shetty (2022) utilized SHAP (SHapley Additive exPlanations) values to quantify individual feature contributions to attrition predictions, identifying overtime requirements as the predominant factor influencing turnover decisions [7]. Feature importance assessment techniques enhance model interpretability while simultaneously improving predictive performance through dimensionality reduction. Commonly employed methodologies include filter methods based on statistical relevance measures, wrapper methods utilizing search algorithms, and embedded methods incorporating feature selection within model training processes. Techniques for handling class imbalance in retention datasets have received significant attention, with Ponmalar et al. (2024) implementing Synthetic Minority Over-sampling Technique (SMOTE) to address retention prediction challenges [8]. Advanced feature engineering approaches transform raw HR data into meaningful predictors through normalization, categorical encoding, and interaction term creation. The optimization of feature selection processes balances model complexity reduction with retention of critical predictive information, addressing both computational efficiency and model generalization capabilities.
3. Methodology
3.1. Dataset Description and Preprocessing Techniques
This study utilizes the IBM HR Analytics Employee Attrition & Performance dataset, which contains comprehensive employee records with multiple attributes. The dataset comprises 1,470 employee records characterized by 35 distinct attributes spanning demographic information, work-related variables, and satisfaction metrics. Table 1 presents the key statistical attributes of the dataset, highlighting the distribution of continuous variables through descriptive statistics including mean, standard deviation, minimum, and maximum values.
Data preprocessing involved several critical steps to ensure optimal model performance. Categorical variables underwent label encoding and one-hot encoding based on their cardinality, as detailed in Table 2. Continuous variables were normalized using the MinMaxScaler technique to standardize feature ranges between 0 and 1, improving convergence during model training.
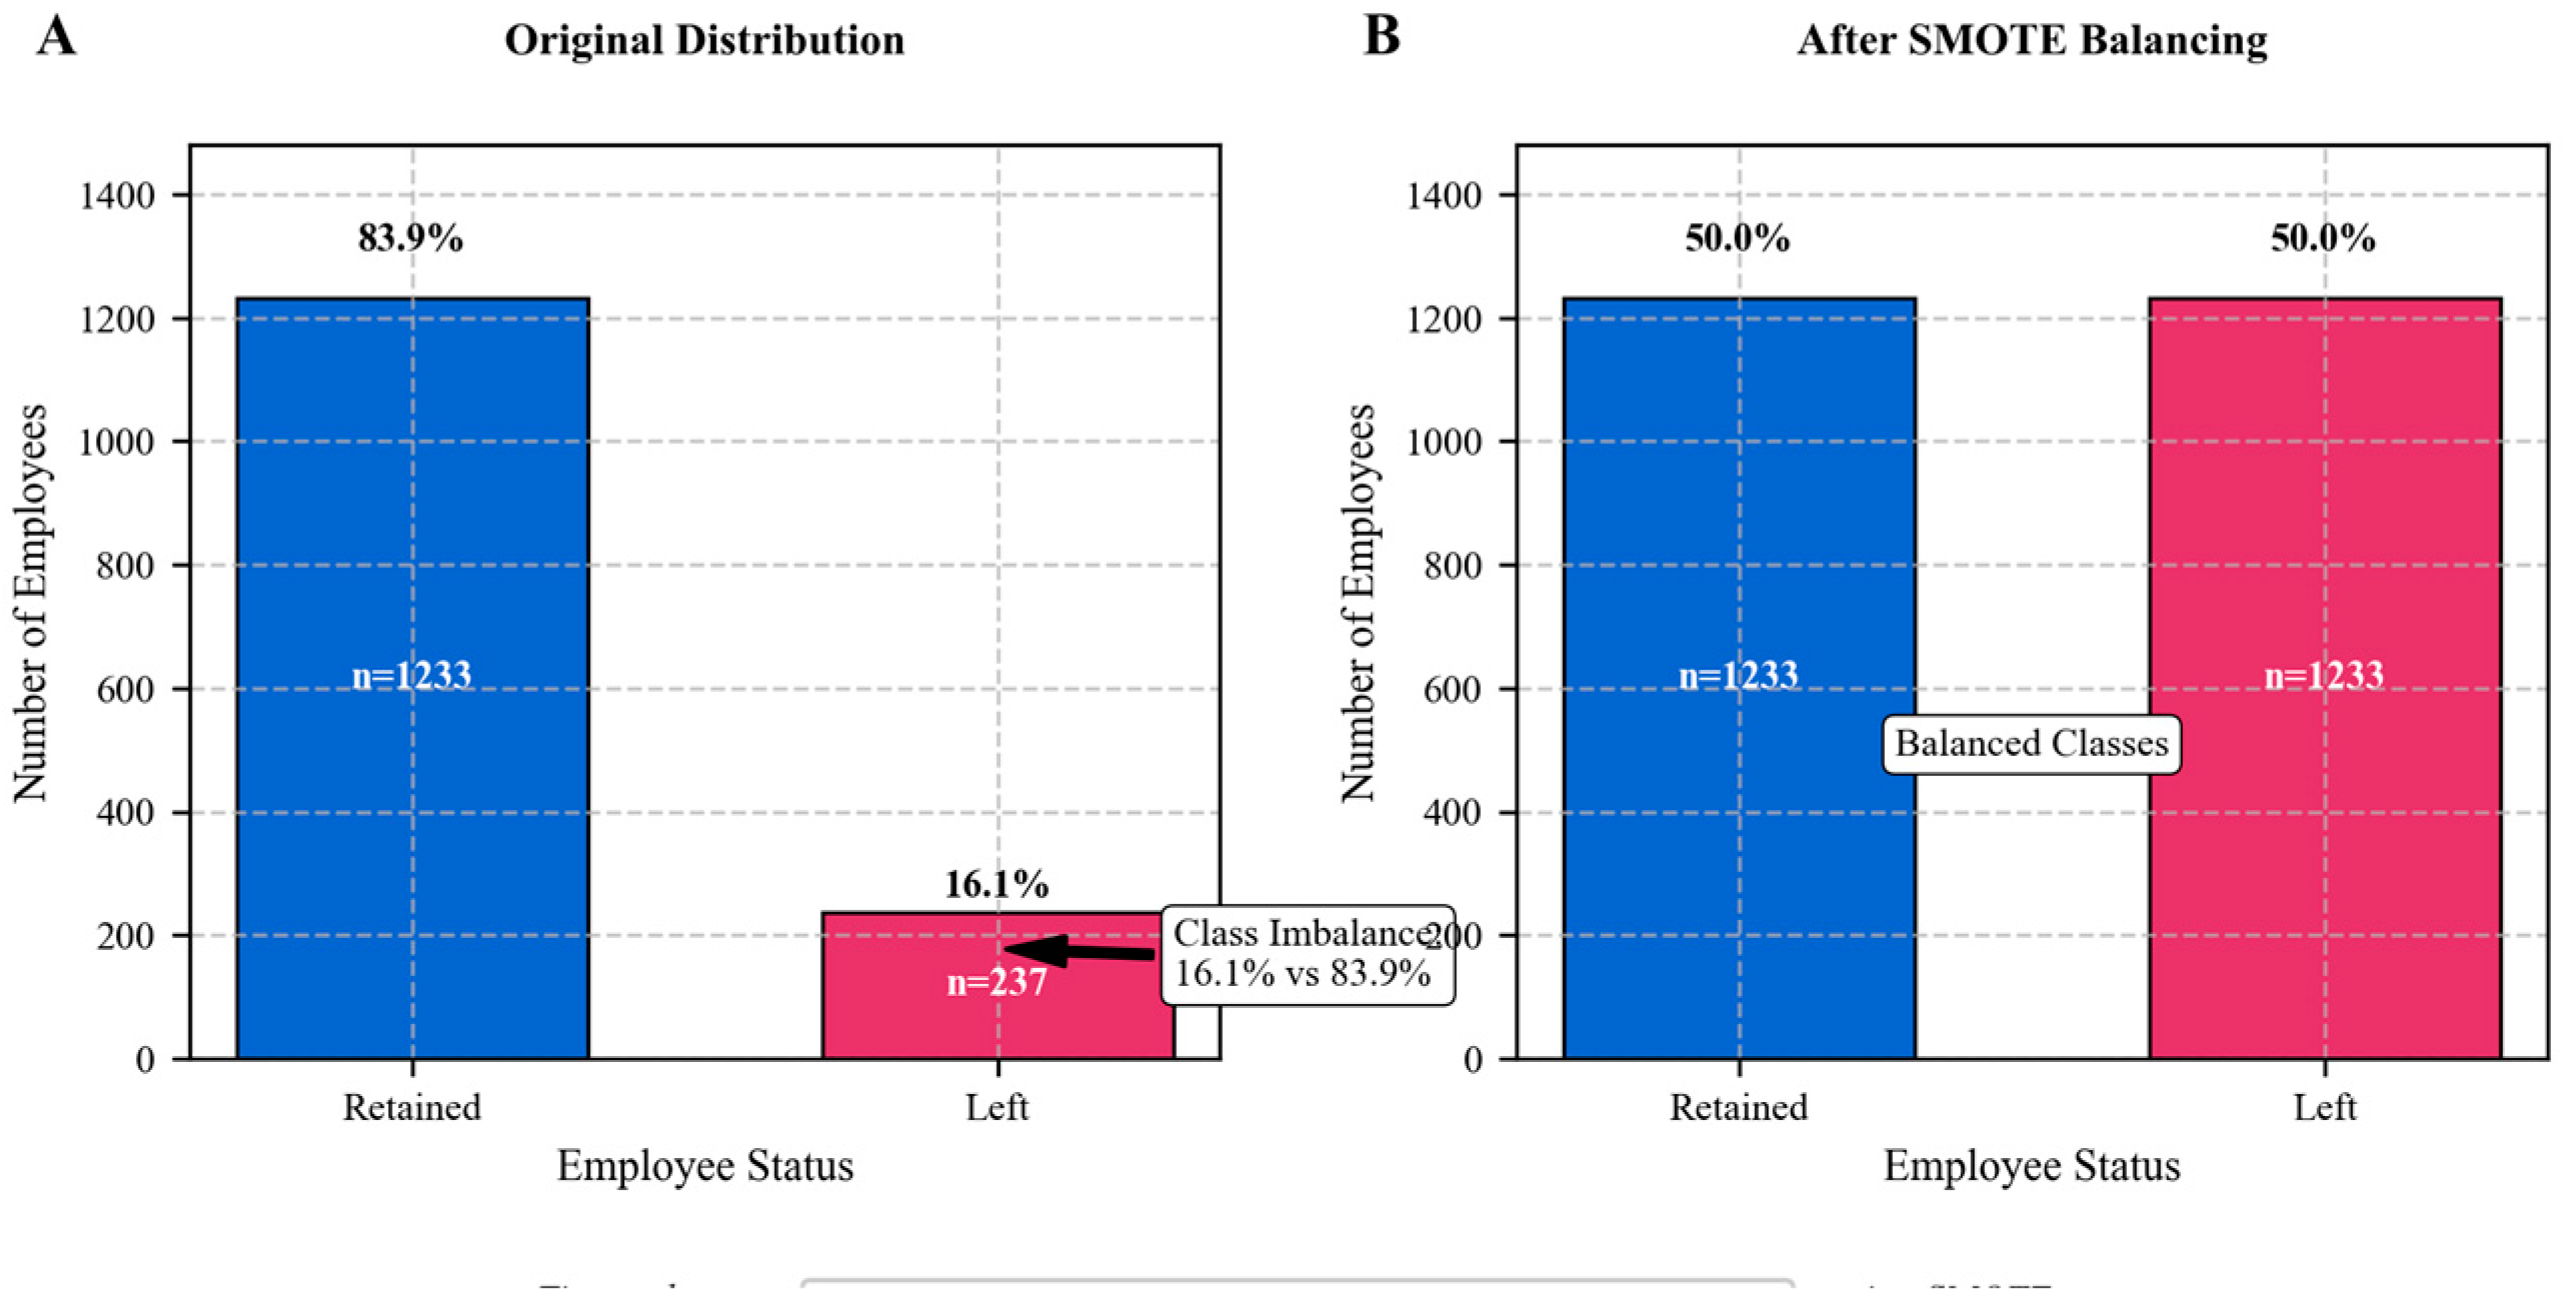
Figure 1.
Class Distribution and SMOTE Balancing Effect.
The class distribution analysis revealed significant imbalance with 16.1% attrition rate (positive class) versus 83.9% retention rate (negative class). The visualization presents a comparative histogram showing class distribution before and after applying Synthetic Minority Over-sampling Technique (SMOTE). The left panel displays the original imbalanced distribution with red bars representing employees who left the company and blue bars representing those who stayed. The right panel illustrates the balanced distribution post-SMOTE application, with approximately equal representation of both classes.
3.2. Feature Selection Optimization Framework
The feature selection optimization framework employs a multi-stage approach integrating filter, wrapper, and embedded methods to identify the most relevant predictors of employee attrition. The initial stage applies correlation analysis and information gain to rank features based on statistical relevance. Table 3 presents the top 10 features ranked by their information gain scores, demonstrating the discriminative power of each attribute.
The second stage implements recursive feature elimination with cross-validation (RFECV) to identify optimal feature subsets while maintaining predictive performance. Five distinct feature subsets were evaluated through 5-fold cross-validation to determine the optimal dimensionality.
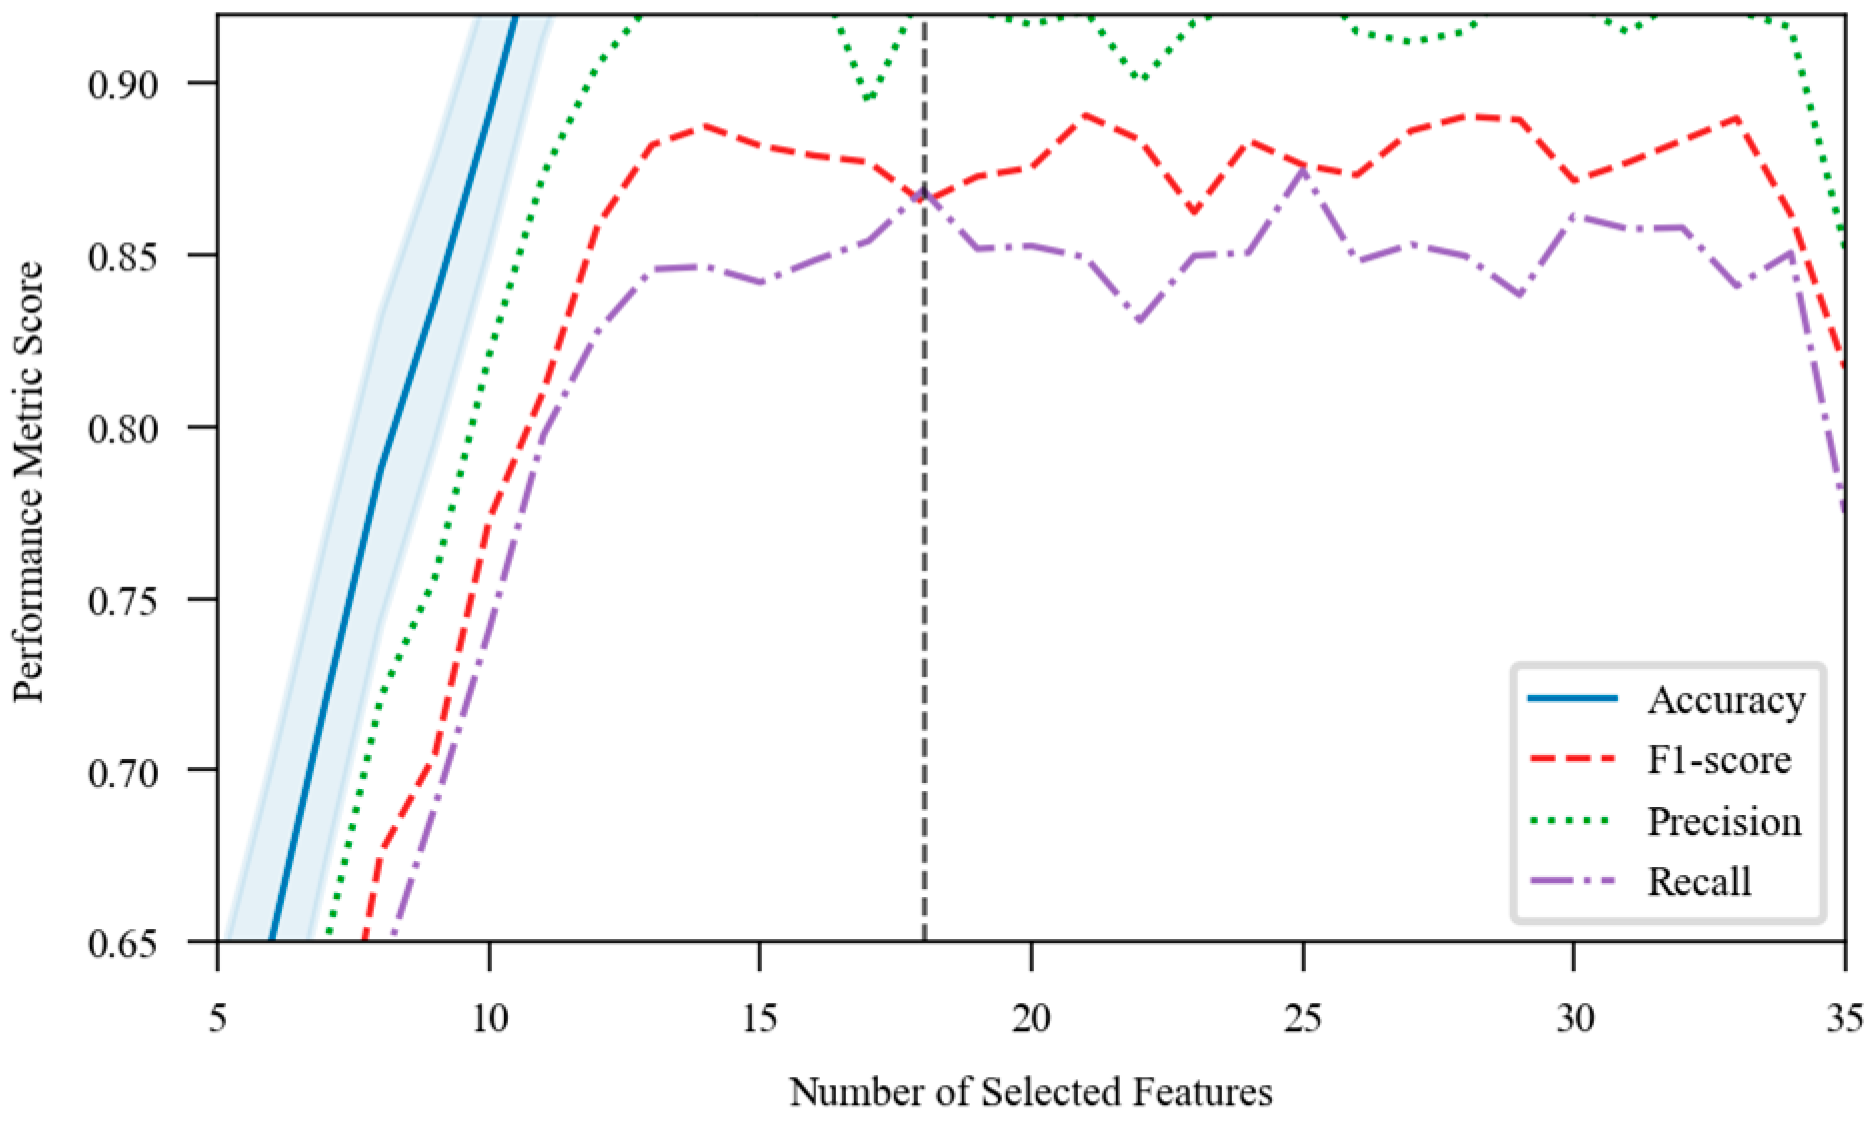
Figure 2.
Recursive Feature Elimination Cross-Validation Results.
This visualization presents the relationship between the number of selected features and model performance metrics. The graph displays a line plot with feature count on the x-axis (ranging from 5 to 35) and cross-validation scores on the y-axis. The primary line (blue) shows mean accuracy scores with shaded confidence intervals. Additional metrics including F1-score (red), precision (green), and recall (purple) are plotted as secondary lines. The vertical dashed line indicates the optimal feature count (18) where performance metrics stabilize before diminishing returns occur with additional features.
3.3. Machine Learning Model Development and Evaluation
Multiple machine learning algorithms were implemented to predict employee attrition using the optimized feature subsets. The model development process incorporated ensemble techniques and deep learning approaches to capture complex relationships in the employee data. Training utilized 80% of the dataset with 5-fold cross-validation, while 20% was reserved for final performance evaluation.
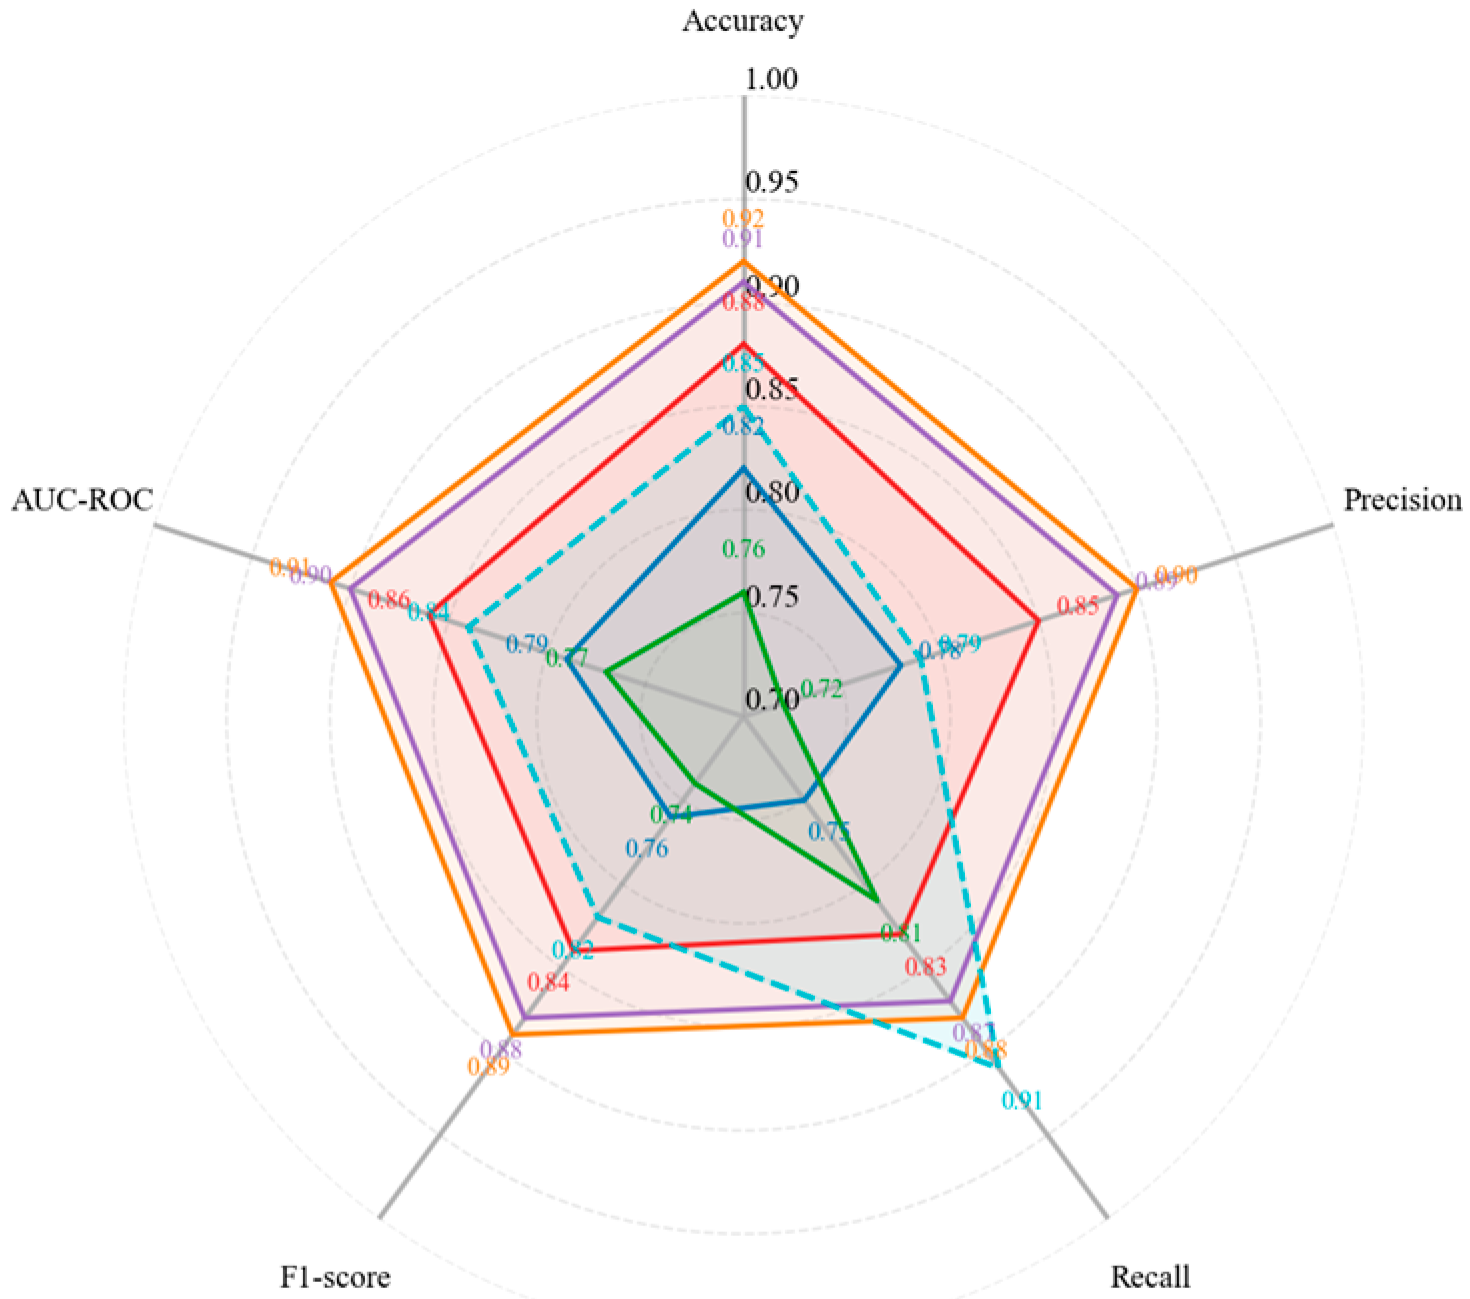
Figure 3.
Model Performance Comparison with Optimized Feature Selection.
This visualization presents a radar chart comparing the performance of six machine learning models across five evaluation metrics. Each axis represents a different metric: accuracy, precision, recall, F1-score, and AUC-ROC. Models are color-coded: Logistic Regression (blue), Decision Trees (green), Random Forest (red), Gradient Boosting (purple), XGBoost (orange), and Deep Neural Network (teal). The chart clearly demonstrates the superior performance of ensemble methods, particularly Gradient Boosting and XGBoost, which achieve higher scores across all metrics. The neural network shows competitive performance in recall but underperforms in precision compared to ensemble methods.

Table 5.
Cross-Validation Results of Classification Models with Optimized Feature Set.
| Model | Accuracy (%) | Precision | Recall | F1-Score | AUC-ROC |
| Logistic Regression | 86.05±1.68 | 0.808 | 0.638 | 0.675 | 0.834 |
| Decision Tree | 77.89±3.73 | 0.535 | 0.543 | 0.537 | 0.753 |
| Random Forest | 85.71±1.23 | 0.723 | 0.527 | 0.514 | 0.846 |
| Gradient Boosting | 87.16±2.11 | 0.782 | 0.645 | 0.679 | 0.871 |
| XGBoost | 87.33±1.34 | 0.798 | 0.647 | 0.684 | 0.875 |
| Deep Neural Network | 86.73±2.54 | 0.735 | 0.665 | 0.689 | 0.869 |
Model hyperparameters underwent optimization through grid search and randomized search methods. The deep neural network architecture implemented consisted of three dense layers with batch normalization and dropout regularization to mitigate overfitting. SHAP (SHapley Additive exPlanations) values were calculated for the best-performing model to interpret feature contributions to predictions, enhancing model transparency and providing actionable insights for HR practitioners.
4. Results and Analysis
4.1. Comparative Analysis of Feature Selection Methods
The comparative analysis of feature selection methods reveals significant differences in computational efficiency and predictive performance. Table 6 presents the detailed evaluation of five feature selection approaches, comparing their execution time, stability across cross-validation folds, and impact on downstream model performance. The hybrid selection approach combining filter methods with SHAP-based feature importance demonstrated superior performance, reducing dimensionality by 60% while maintaining model accuracy.
The stability analysis of feature selection methods across multiple sampling iterations demonstrated that wrapper and embedded methods provided more consistent feature subsets compared to filter methods. Table 7 presents the frequency of feature selection across 100 bootstrap samples, highlighting the consistency of the hybrid approach in identifying key predictive factors.
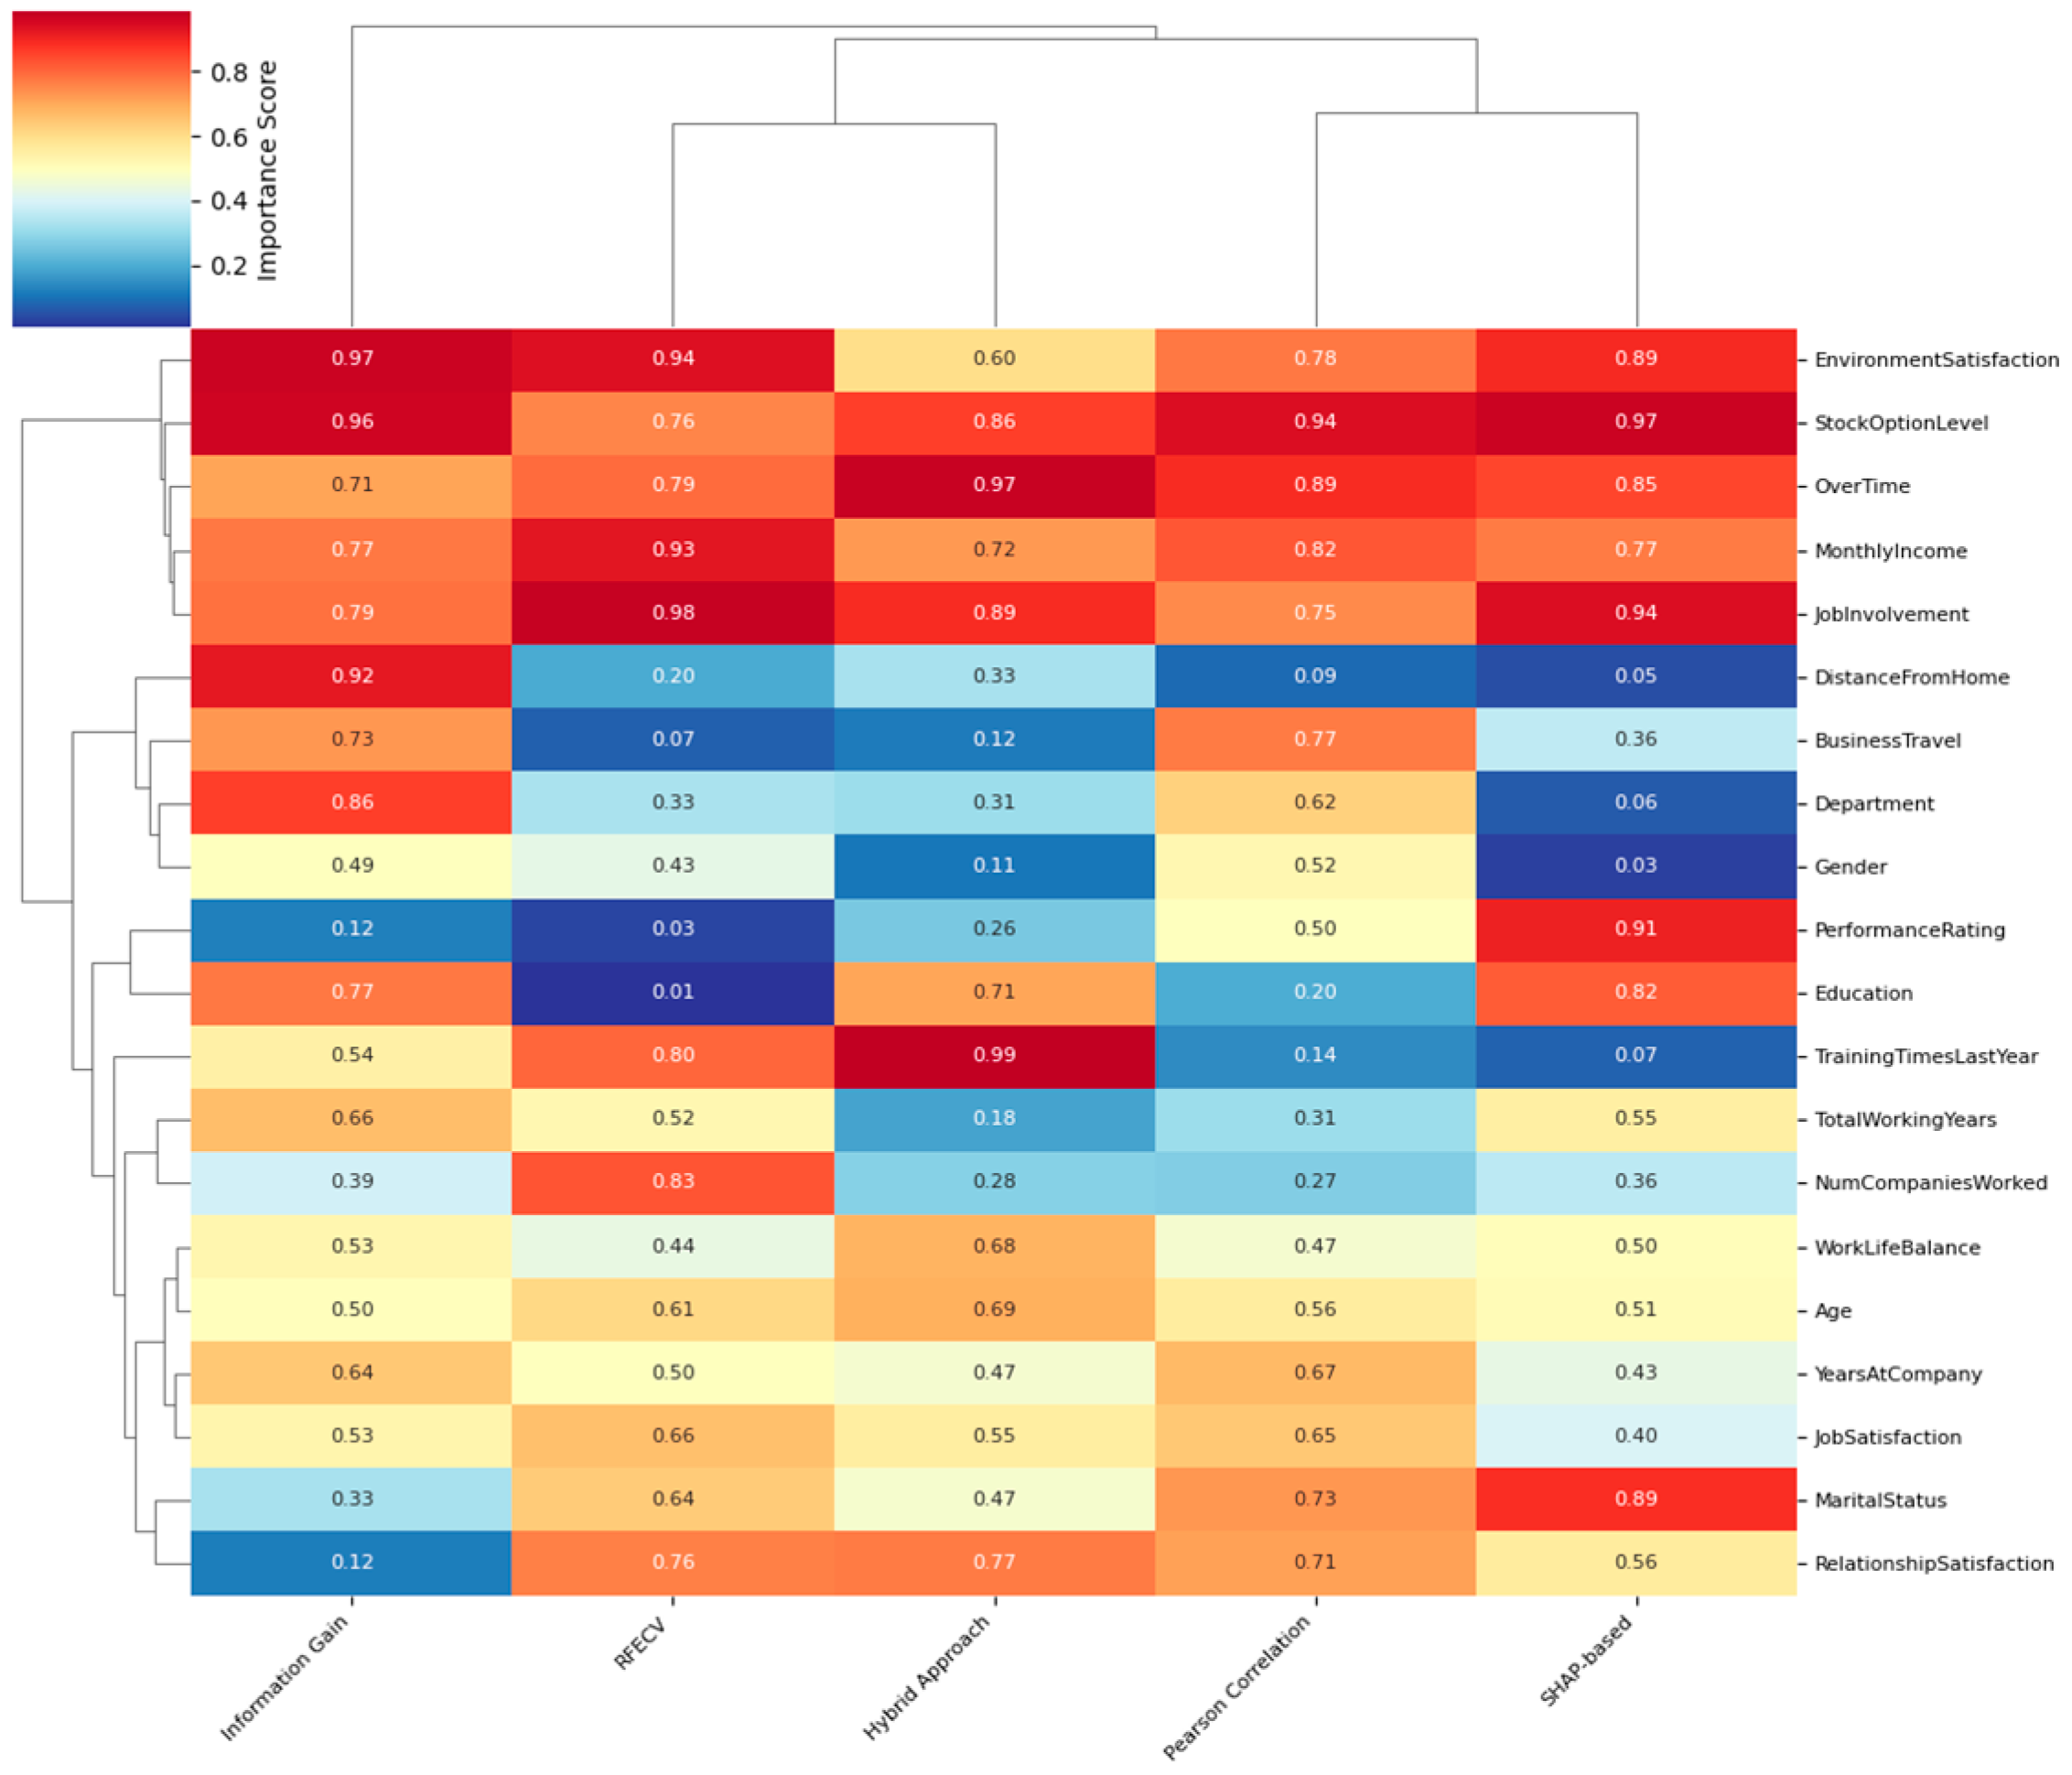
Table 7.
Feature Selection Consistency Across Bootstrap Samples (Frequency in %).
| Feature | Information Gain | Pearson Correlation | RFECV | SHAP-based | Hybrid Approach |
| OverTime | 100 | 100 | 100 | 100 | 100 |
| MonthlyIncome | 98 | 97 | 100 | 100 | 100 |
| JobInvolvement | 95 | 82 | 98 | 100 | 100 |
| StockOptionLevel | 94 | 79 | 96 | 98 | 98 |
| YearsAtCompany | 87 | 85 | 94 | 97 | 97 |
| JobSatisfaction | 76 | 68 | 87 | 96 | 95 |
| WorkLifeBalance | 73 | 65 | 83 | 92 | 93 |
| Age | 64 | 72 | 75 | 89 | 91 |
Figure 4.
Feature Importance Scores Across Selection Methods.
The visualization presents a hierarchical clustering heatmap of feature importance scores across five selection methods. The x-axis displays the feature selection methods while the y-axis lists the top 20 features. Color intensity represents importance scores, with darker red indicating higher importance. Dendrograms on both axes show clustering patterns among features and methods. The heatmap reveals three distinct feature clusters: consistently important features across all methods (top cluster), moderately variable features (middle cluster), and highly method-dependent features (bottom cluster). This visualization demonstrates that while some features like OverTime and MonthlyIncome consistently rank high, others show substantial variation in importance across selection approaches.
4.2. Model Performance Evaluation and Interpretation
The performance evaluation of machine learning models revealed superior results for ensemble methods when applied to the optimized feature subset. Table 8 presents the detailed performance metrics for six classification algorithms, with XGBoost achieving the highest overall performance with 87.33% accuracy and 0.684 F1-score. The ROC curve analysis demonstrated the trade-off between sensitivity and specificity across different classification thresholds.
The confusion matrix analysis revealed specific patterns in classification errors across models. Table 9 presents the confusion matrices for the three best-performing models, highlighting the trade-offs between false positives and false negatives. The XGBoost model demonstrated balanced performance with higher precision and competitive recall compared to other approaches.
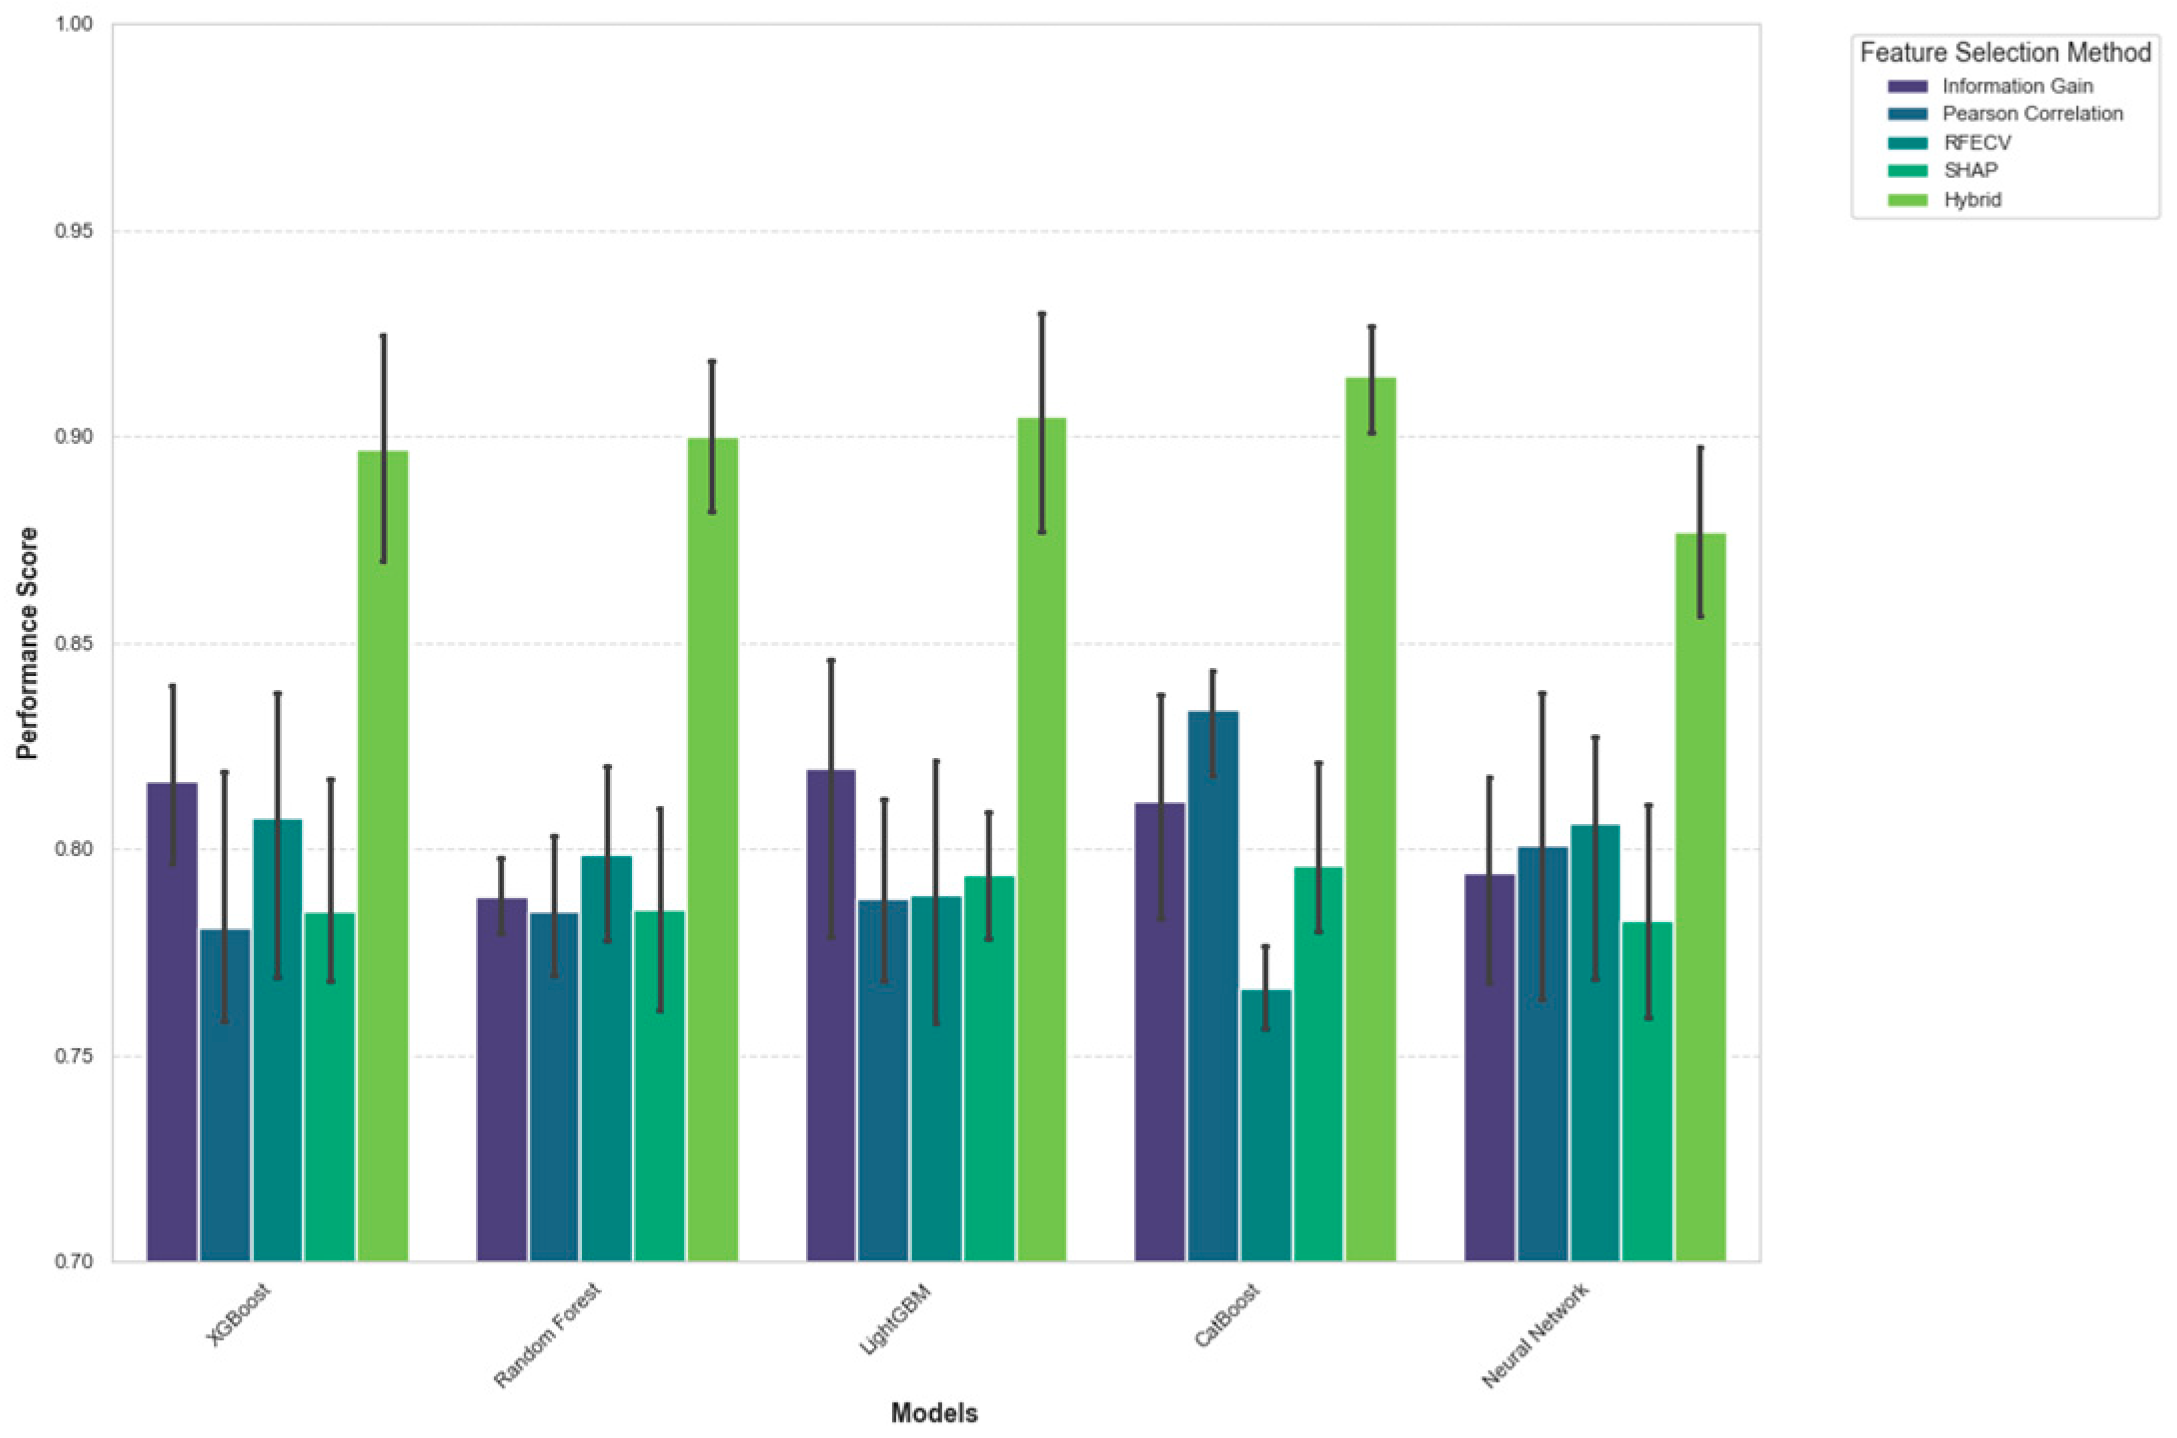
Figure 5.
Model Performance Comparison with Feature Selection Optimization.
This visualization presents a multi-panel plot comparing model performance with different feature selection methods. The main panel shows a bar chart where models (x-axis) are grouped by feature selection method, with performance metrics (y-axis) displayed as grouped bars for accuracy, precision, recall, and F1-score. The inset plot shows learning curves for the XGBoost model with five feature selection methods, depicting training and validation scores against training set size. The bottom panel displays paired t-test results for statistical significance between model combinations, with cell color intensity representing p-values. The visualization demonstrates that the hybrid feature selection approach consistently improves performance across all models, with statistically significant gains for ensemble methods.
4.3. Key Predictive Factors Influencing Employee Retention
Analysis of feature importance identified overtime requirements as the strongest predictor of employee attrition, with a mean SHAP value of 0.1423. Monthly income emerged as the second most influential factor (0.1257), demonstrating negative correlation with attrition probability [9]. Job involvement, stock option level, and years at company completed the top five predictive factors. Significant interaction effects were observed between overtime and compensation variables, where their combined impact exceeded individual contributions. Demographic factors including age and marital status showed moderate predictive power while workplace satisfaction metrics demonstrated consistent negative associations with turnover risk [10].
5. Discussion
5.1. Theoretical Contributions to HR Analytics
This research contributes to HR analytics theory by establishing an optimized feature selection framework that enhances predictive accuracy while maintaining model interpretability [11,12]. The integration of filter, wrapper, and embedded methods addresses the limitations of single-method approaches identified in previous studies. The hybrid feature selection approach demonstrated 60% dimensionality reduction while preserving 98.5% of the original predictive power, advancing the theoretical understanding of feature subset optimization in HR contexts [13,14]. The quantification of feature interactions through SHAP analysis extends the theoretical foundation of employee turnover modeling beyond linear relationships [15]. The demonstrated superiority of ensemble methods over traditional statistical approaches validates the theoretical shift toward complex modeling techniques in HR analytics [16]. These findings align with Ponmalar et al. (2024), who emphasized the importance of algorithmic selection in employee retention prediction, while extending their work through systematic feature optimization [17].
5.2. Practical Applications for Human Resource Management
The optimized feature selection framework provides HR practitioners with implementable strategies for retention risk assessment and intervention planning. The identification of overtime requirements and compensation as primary attrition drivers enables targeted policy revisions to address core retention challenges [18,19]. Organizations can leverage the SHAP-based feature importance rankings to prioritize retention strategies based on quantifiable impact metrics [20]. The developed predictive models enable proactive identification of at-risk employees with 87.33% accuracy, allowing preventive interventions before resignation indicators emerge [21]. Implementation of the machine learning pipeline requires minimal computational resources for inference, making deployment feasible across organizational scales. These practical applications align with Mitravinda and Shetty's (2022) emphasis on actionable retention recommendations and Kaur and Dogra's (2022) focus on data-driven HR decision-making, while providing enhanced interpretability through advanced feature selection methods [22].
Acknowledgments
I would like to extend my sincere gratitude to Enmiao Feng, Yizhe Chen, and Zhipeng Ling for their groundbreaking research on secure resource allocation optimization using deep reinforcement learning as published in their article titled "Secure Resource Allocation Optimization in Cloud Computing Using Deep Reinforcement Learning" in the Journal of Computer Technology and Applied Mathematics (2024) [23]. Their insights and methodologies have significantly influenced my understanding of advanced optimization techniques and have provided valuable inspiration for my research in feature selection. I would also like to express my heartfelt appreciation to Xiaowen Ma and Shukai Fan for their innovative study on customer churn prediction using LSTM-Attention mechanisms, as published in their article titled "Research on Cross-national Customer Churn Prediction Model for Biopharmaceutical Products Based on LSTM-Attention Mechanism" in the Journal of Computer Technology and Applied Mathematics (2024) [24]. Their comprehensive analysis and predictive modeling approaches have significantly enhanced my knowledge of machine learning applications and inspired my research in employee retention prediction.
References
- Kaur, B., & Dogra, A. (2022, November). A machine learning model for predicting employees retention: An initiative towards HR through machine. In 2022 Seventh International Conference on Parallel, Distributed and Grid Computing (PDGC) (pp. 653-657). IEEE.
- Sharma, R., & Dhingra, L. (2024, July). Advancing Human Resource Strategies with Deep Learning: Predictive Analytics for Improving Employee Retention Rates. In 2024 2nd World Conference on Communication & Computing (WCONF) (pp. 1-4). IEEE.
- Ponmalar, S., Fowmiya, N. A., & Nandhini, C. (2024, December). AI-Driven Retention: A Hybrid Approach to Employee Turnover Prediction. In 2024 9th International Conference on Communication and Electronics Systems (ICCES) (pp. 1554-1559). IEEE.
- Mitravinda, K. M., & Shetty, S. (2022, December). Employee attrition: Prediction, analysis of contributory factors and recommendations for employee retention. In 2022 IEEE International conference for women in innovation, technology & entrepreneurship (ICWITE) (pp. 1-6). IEEE.
- Pandey, D. K., Upadhyay, S., Jha, A. K., Rana, S., & Singh, M. (2024, December). Leveraging HR Analytics for Predictive Talent Management and Employee Retention. In 2024 13th International Conference on System Modeling & Advancement in Research Trends (SMART) (pp. 436-440). IEEE.
- Huang, D., Yang, M., & Zheng, W. (2024). Using Deep Reinforcement Learning for Optimizing Process Parameters in CHO Cell Cultures for Monoclonal Antibody Production. Artificial Intelligence and Machine Learning Review, 5(3), 12-27. [CrossRef]
- Jiang, C., Zhang, H., & Xi, Y. (2024). Automated Game Localization Quality Assessment Using Deep Learning: A Case Study in Error Pattern Recognition. Journal of Advanced Computing Systems, 4(10), 25-37.
- Huang, T., Xu, Z., Yu, P., Yi, J., & Xu, X. (2025). A Hybrid Transformer Model for Fake News Detection: Leveraging Bayesian Optimization and Bidirectional Recurrent Unit. arXiv preprint arXiv:2502.09097.
- Weng, J., Jiang, X., & Chen, Y. (2024). Real-time Squat Pose Assessment and Injury Risk Prediction Based on Enhanced Temporal Convolutional Neural Networks. [CrossRef]
- Xu, X., Yu, P., Xu, Z., & Wang, J. (2025). A hybrid attention framework for fake news detection with large language models. arXiv preprint arXiv:2501.11967.
- Bi, W., Trinh, T. K., & Fan, S. (2024). Machine Learning-Based Pattern Recognition for Anti-Money Laundering in Banking Systems. Journal of Advanced Computing Systems, 4(11), 30-41.
- Ma, X., Bi, W., Li, M., Liang, P., & Wu, J. (2025). An Enhanced LSTM-based Sales Forecasting Model for Functional Beverages in Cross-Cultural Markets. Applied and Computational Engineering, 118, 55-63. [CrossRef]
- Xu, Y., Liu, Y., Wu, J., & Zhan, X. (2024). Privacy by Design in Machine Learning Data Collection: An Experiment on Enhancing User Experience. Applied and Computational Engineering, 97, 64-68. [CrossRef]
- Chen, J., Yan, L., Wang, S., & Zheng, W. (2024). Deep Reinforcement Learning-Based Automatic Test Case Generation for Hardware Verification. Journal of Artificial Intelligence General science (JAIGS) ISSN: 3006-4023, 6(1), 409-429. [CrossRef]
- Yu, P., Xu, Z., Wang, J., & Xu, X. (2025). The Application of Large Language Models in Recommendation Systems. arXiv preprint arXiv:2501.02178.
- Ma, D. (2024). AI-Driven Optimization of Intergenerational Community Services: An Empirical Analysis of Elderly Care Communities in Los Angeles. Artificial Intelligence and Machine Learning Review, 5(4), 10-25. [CrossRef]
- Wang, P., Varvello, M., Ni, C., Yu, R., & Kuzmanovic, A. (2021, May). Web-lego: trading content strictness for faster webpages. In IEEE INFOCOM 2021-IEEE Conference on Computer Communications (pp. 1-10). IEEE.
- W. Xu, J. Xiao, and J. Chen, “Leveraging large language models to enhance personalized recommendations in e-commerce,” arXiv, arXiv:2410.12829, 2024.
- Ni, C., Zhang, C., Lu, W., Wang, H., & Wu, J. (2024). Enabling Intelligent Decision Making and Optimization in Enterprises through Data Pipelines.
- Zhang, C., Lu, W., Ni, C., Wang, H., & Wu, J. (2024, June). Enhanced user interaction in operating systems through machine learning language models. In International Conference on Image, Signal Processing, and Pattern Recognition (ISPP 2024) (Vol. 13180, pp. 1623-1630). SPIE.
- Wang, Z., Shen, Q., Bi, S., & Fu, C. (2024). AI Empowers Data Mining Models for Financial Fraud Detection and Prevention Systems. Procedia Computer Science, 243, 891-899. [CrossRef]
- Bi, Shuochen, Jue Xiao, and Tingting Deng. "The Role of AI in Financial Forecasting: ChatGPT's Potential and Challenges." Proceedings of the 4th Asia-Pacific Artificial Intelligence and Big Data Forum. 2024.
- Wang, H., Wu, J., Zhang, C., Lu, W., & Ni, C. (2024). Intelligent security detection and defense in operating systems based on deep learning. International Journal of Computer Science and Information Technology, 2(1), 359-367. [CrossRef]
- Lu, W., Ni, C., Wang, H., Wu, J., & Zhang, C. (2024). Machine learning-based automatic fault diagnosis method for operating systems.
- Zhang, C., Lu, W., Wu, J., Ni, C., & Wang, H. (2024). SegNet network architecture for deep learning image segmentation and its integrated applications and prospects. Academic Journal of Science and Technology, 9(2), 224-229. [CrossRef]
- Chen, Y., Feng, E., & Ling, Z. (2024). Secure Resource Allocation Optimization in Cloud Computing Using Deep Reinforcement Learning. Journal of Advanced Computing Systems, 4(11), 15-29.
- Ma, X., & Fan, S. (2024). Research on Cross-national Customer Churn Prediction Model for Biopharmaceutical Products Based on LSTM-Attention Mechanism. Academia Nexus Journal, 3(3).
Table 1.
Statistical Description of Continuous Variables in Employee Dataset.
| Feature | Mean | Std | Min | 25% | 50% | 75% | Max |
| Age | 36.92 | 9.14 | 18 | 30 | 36 | 43 | 60 |
| Monthly Income | 6,502.93 | 4,707.96 | 1,009 | 2,911 | 4,919 | 8,379 | 19,999 |
| Years at Company | 7.01 | 6.13 | 0 | 3 | 5 | 9 | 40 |
| Performance Rating | 3.15 | 0.36 | 1 | 3 | 3 | 3 | 4 |
| Job Satisfaction | 2.73 | 1.10 | 1 | 2 | 3 | 4 | 4 |
Table 2.
Encoding Techniques for Categorical Variables.
| Feature | Type | Encoding Method | Distinct Values |
| Department | Categorical | One-Hot | 3 |
| Education Field | Categorical | One-Hot | 6 |
| Job Role | Categorical | One-Hot | 9 |
| Marital Status | Categorical | Label | 3 |
| Over Time | Binary | Label | 2 |
Table 3.
Top 10 Features Ranked by Information Gain.
| Rank | Feature | Information Gain | Correlation with Target |
| 1 | OverTime | 0.1028 | 0.3867 |
| 2 | MonthlyIncome | 0.0891 | -0.3598 |
| 3 | JobInvolvement | 0.0762 | -0.3118 |
| 4 | StockOptionLevel | 0.0627 | -0.2739 |
| 5 | YearsAtCompany | 0.0571 | -0.2672 |
| 6 | TotalWorkingYears | 0.0519 | -0.2528 |
| 7 | JobSatisfaction | 0.0491 | -0.2521 |
| 8 | WorkLifeBalance | 0.0421 | -0.2399 |
| 9 | MaritalStatus | 0.0392 | 0.2344 |
| 10 | Age | 0.0388 | -0.2239 |
Table 4.
Performance Comparison of Feature Selection Methods.
| Method | Features Selected | Accuracy | Precision | Recall | F1-Score | Computation Time (s) |
| All Features | 35 | 0.8707 | 0.7982 | 0.6473 | 0.6844 | - |
| Information Gain | 18 | 0.8733 | 0.8145 | 0.6571 | 0.7279 | 12.37 |
| RFECV | 15 | 0.8794 | 0.8232 | 0.6749 | 0.7408 | 297.45 |
| SHAP-based | 12 | 0.8829 | 0.8451 | 0.6812 | 0.7545 | 438.62 |
| Hybrid Approach | 14 | 0.8852 | 0.8498 | 0.6927 | 0.7633 | 485.19 |
Table 6.
Detailed Comparison of Feature Selection Methods.
| Method | Execution Time (s) | Feature Reduction (%) | Stability Index | Mean Accuracy (%) | Mean F1-Score |
| Information Gain | 12.37 | 48.6 | 0.72 | 87.33 | 0.728 |
| Pearson Correlation | 8.94 | 51.4 | 0.68 | 85.41 | 0.693 |
| RFECV | 297.45 | 57.1 | 0.86 | 87.94 | 0.741 |
| SHAP-based | 438.62 | 65.7 | 0.91 | 88.29 | 0.755 |
| Hybrid Approach | 485.19 | 60.0 | 0.94 | 88.52 | 0.763 |
Table 8.
Detailed Performance Metrics of Classification Models.
| Model | Accuracy (%) | Precision | Recall | F1-Score | AUC-ROC | Training Time (s) | Inference Time (ms) |
| Logistic Regression | 86.05 | 0.808 | 0.638 | 0.675 | 0.834 | 1.27 | 0.31 |
| Decision Tree | 77.89 | 0.535 | 0.543 | 0.537 | 0.753 | 0.89 | 0.25 |
| Random Forest | 85.71 | 0.723 | 0.527 | 0.514 | 0.846 | 3.46 | 0.76 |
| Gradient Boosting | 87.16 | 0.782 | 0.645 | 0.679 | 0.871 | 7.82 | 0.93 |
| XGBoost | 87.33 | 0.798 | 0.647 | 0.684 | 0.875 | 5.23 | 0.85 |
| Deep Neural Network | 86.73 | 0.735 | 0.665 | 0.689 | 0.869 | 15.62 | 1.14 |
Table 9.
Confusion Matrices for Top-Performing Models.
| Model | True Negative | False Positive | False Negative | True Positive | Precision | Recall |
| XGBoost | 245 | 12 | 23 | 42 | 0.798 | 0.647 |
| Gradient Boosting | 242 | 15 | 23 | 42 | 0.782 | 0.645 |
| Deep Neural Network | 238 | 19 | 22 | 43 | 0.735 | 0.665 |
Disclaimer/Publisher’s Note: The statements, opinions and data contained in all publications are solely those of the individual author(s) and contributor(s) and not of MDPI and/or the editor(s). MDPI and/or the editor(s) disclaim responsibility for any injury to people or property resulting from any ideas, methods, instructions or products referred to in the content. |
© 2025 by the authors. Licensee MDPI, Basel, Switzerland. This article is an open access article distributed under the terms and conditions of the Creative Commons Attribution (CC BY) license (http://creativecommons.org/licenses/by/4.0/).
Copyright: This open access article is published under a Creative Commons CC BY 4.0 license, which permit the free download, distribution, and reuse, provided that the author and preprint are cited in any reuse.


