Submitted:
17 April 2025
Posted:
18 April 2025
You are already at the latest version
Abstract
This paper presents a novel approach to improving database anomaly detection efficiency through sample difficulty estimation. Traditional anomaly detection methods often apply uniform computational resources across all data samples regardless of their complexity, resulting in inefficient resource utilization. Our framework addresses this limitation by quantifying the "difficulty" of individual database instances and strategically allocating computational resources where they provide maximum benefit. The proposed model combines isolation scores, density-based metrics, and surprise adequacy measurements to comprehensively assess sample difficulty. Based on these assessments, a difficulty-oriented priority assignment mechanism implemented through a sigmoid mapping function directs intensive computational efforts to challenging cases while processing simpler samples with lighter methods. Experimental evaluation across five diverse datasets demonstrates that our approach achieves a 52.84% reduction in average processing time compared to uniform approaches, while maintaining or improving detection accuracy. The framework achieves the highest Average Percentage of Faults Detected (APFD) score of 0.915, outperforming both traditional and deep learning-based methods. This research provides a foundation for developing intelligent, resource-aware anomaly detection systems capable of handling the increasing scale and complexity of modern database environments.
Keywords:
Anomaly Detection
; Sample Difficulty Estimation
; Database Systems
; Computational Efficiency
1. Introduction
1.1. Importance and Challenges of Database Anomaly Detection
Database systems represent critical infrastructure for modern organizations, storing valuable operational data that drives business decisions. Anomalies within these databases can significantly impact data quality, system performance, and security. Database anomaly detection aims to identify abnormal patterns, behaviors, or instances that deviate from expected norms. These anomalies range from minor inconsistencies to serious security threats including unauthorized access or data breaches. The increasing volume and complexity of database operations have made anomaly detection a challenging task. Traditional approaches often struggle with computational efficiency when processing large-scale datasets, creating bottlenecks in modern data environments. The sensitivity of detection mechanisms also presents challenges—systems with high sensitivity result in excessive false positives while low sensitivity risks missing critical anomalies. Most current techniques apply uniform computational resources across all data samples regardless of their characteristics, leading to inefficient resource utilization. This one-size-fits-all approach neglects the fact that some anomalies require more sophisticated analysis than others. Recent research has highlighted limitations in both traditional rule-based approaches and newer machine learning methods when facing large-scale, complex database environments. Detection algorithms need to balance accuracy, efficiency, and adaptability to remain effective across diverse database architectures and operational conditions.
1.2. Potential of Sample Difficulty-Based Approaches in Anomaly Detection
The concept of sample difficulty estimation offers promising avenues for improving anomaly detection efficiency in database systems. This approach recognizes that not all data samples require equal computational attention—some anomalies are inherently more difficult to detect than others. By quantifying the “difficulty” of individual samples, detection systems can strategically allocate resources where they provide maximum benefit. Difficulty estimation enables prioritization mechanisms that focus intensive computational efforts on challenging cases while processing simpler samples with lighter methods. This adaptivity addresses a fundamental limitation in current systems that process all samples with identical methodologies regardless of their complexity. Sample difficulty can be assessed through multiple dimensions including distance from established norms, feature space characteristics, and historical detection patterns. Recent studies have demonstrated that integrating difficulty assessment can reduce computational overhead while maintaining or even improving detection accuracy. The approach aligns with principles from active learning and computational resource optimization fields, bringing established theoretical frameworks into database anomaly detection contexts. Prior research in input prioritization for deep learning systems has shown significant efficiency improvements when testing resources are directed toward samples with higher anomaly potential. Extending these concepts to database environments offers opportunities to overcome existing efficiency barriers. Sample difficulty estimation provides a foundation for developing intelligent, resource-aware anomaly detection systems capable of handling the increasing scale and complexity of modern database environments.
2. Related Work
2.1. Overview of Traditional Database Anomaly Detection Methods
Traditional database anomaly detection approaches have primarily relied on statistical methods, rule-based systems, and knowledge-driven techniques. Statistical approaches establish normal behavior profiles by analyzing historical data distributions and identifying deviations beyond predefined thresholds. These methods include standard deviation analysis, interquartile range calculations, and Z-score measurements applied to database performance metrics and query patterns1. Rule-based approaches implement expert-defined heuristics to flag suspicious activities or transactions. While these systems provide interpretability advantages, they require continuous manual updates to remain effective against evolving anomaly patterns. Signature-based detection, another established approach, maintains databases of known anomalous patterns and compares incoming data against these signatures. This method performs well for known anomalies but struggles with zero-day anomalies that present novel patterns. Mosin et al. highlight that traditional methods often lack adaptability when testing datasets grow over time, making them increasingly time-consuming and computationally intensive2. The effectiveness of traditional methods diminishes in modern database environments characterized by massive scale, complex relationships, and high-dimensional data structures. Many conventional techniques also suffer from rigid parameterization requirements that complicate deployment across diverse database architectures.
2.2. Deep Learning-Based Anomaly Detection Techniques
Deep learning has transformed anomaly detection capabilities across numerous domains, including database systems. Deep neural networks excel at capturing complex non-linear relationships within high-dimensional data that might elude traditional statistical methods. Autoencoders represent one prominent approach, learning compressed data representations and identifying anomalies through reconstruction error analysis. These models establish normal behavior patterns during training and flag instances with high reconstruction errors during inference. Recurrent neural networks (RNNs) and their variants address the temporal aspects of database operations, modeling sequential patterns in database access and query execution. These approaches have demonstrated particular effectiveness for detecting time-dependent anomalies in transaction logs and query sequences. Zhao and Huang have demonstrated how fuzzy cognitive maps combined with neural models can improve anomaly detection in operational data while reducing false detection rates3. Isolation Forest algorithms, highlighted in Liu et al.’s work, have been adapted for database contexts, isolating anomalous database operations through recursive partitioning4. The parallel implementation of these algorithms on platforms like Apache Flink has addressed some scalability limitations. While deep learning approaches offer impressive detection accuracy, they introduce substantial computational overhead that can impact real-time monitoring capabilities. Most implementations process all data instances with uniform computational intensity regardless of their anomaly likelihood, leading to resource inefficiencies in production environments.
2.3. Applications of Sample Difficulty Estimation in Machine Learning
Sample difficulty estimation has emerged as a valuable concept across multiple machine learning domains, though its application to database anomaly detection remains limited. At its core, this approach quantifies how challenging individual samples are for a given learning or detection task. In classification contexts, samples near decision boundaries typically present higher difficulty than those in homogeneous regions of the feature space. Pan et al. have demonstrated the value of cross-type database analysis for detecting anomalies, noting that different data types exhibit varying difficulty levels5. Their work on parallel detection of heterogeneous cloud resources highlights the efficiency benefits of prioritizing computational resources based on data characteristics. The concept of surprise adequacy, introduced by Kim et al. and expanded upon by Mosin et al., measures how unexpected a test input is relative to training data, effectively serving as a difficulty metric6. Their experiments across multiple datasets showed that surprise adequacy-based prioritization achieved superior anomaly detection with fewer computational resources. In testing deep learning systems, input prioritization techniques based on sample difficulty have proven effective at revealing erroneous behaviors earlier in the testing process. Implementations leveraging isolation forests have shown particular promise for database contexts, as they naturally quantify sample difficulty through path length measurements. The effectiveness of difficulty-based methods spans across domains, from image classification to network security, suggesting broader applicability to database anomaly detection. The integration of difficulty estimation into streaming data environments presents additional challenges but offers significant efficiency gains in real-time monitoring scenarios.
3. Based on Sample Difficulty Estimation of Anomaly Detection Framework
3.1. Design of Sample Difficulty Estimation Model
The proposed sample difficulty estimation model combines multiple metrics to quantify how challenging each database instance is for anomaly detection systems. The model incorporates both unsupervised and supervised components to assess difficulty across various dimensions. For unsupervised assessment, isolation scores derived from Isolation Forest algorithms provide a foundational difficulty metric. These scores reflect how many partitions are required to isolate a sample, with anomalous instances typically requiring fewer partitions. Table 1 presents the correlation between isolation scores and actual anomaly status across four benchmark datasets.
Density-based difficulty metrics complement isolation scores by quantifying local density structures surrounding each instance. These metrics employ k-nearest neighbor calculations with adaptive radius determination. Distance-based surprise adequacy measurements, inspired by Mosin et al., provide an additional difficulty dimension by measuring how distant a sample is from training data distributions in latent feature space7. Table 2 displays the comparative performance of different difficulty metrics across detection performance indicators.
Figure 1 illustrates the distribution of sample difficulty scores across normal and anomalous database instances. The visualization employs t-SNE dimensionality reduction to project high-dimensional database features into a 2D space, with color intensity representing difficulty scores. Anomalous instances (marked with triangles) typically display higher difficulty scores than normal instances (circles), though significant overlap exists in boundary regions.
The visualization demonstrates clustering of similar difficulty levels, indicating that difficulty is not randomly distributed but rather correlates with underlying data structures. Regions of high difficulty (darker shades) frequently correspond to decision boundaries or transition zones between normal and anomalous instances, highlighting the potential value of prioritizing computational resources in these areas.
3.2. Difficulty-Oriented Priority Assignment Mechanism
The difficulty-oriented priority assignment mechanism transforms raw difficulty scores into operational priorities that guide the allocation of computational resources. This transformation applies a non-linear mapping function that amplifies differences between high-difficulty and low-difficulty samples. The mapping function incorporates both absolute difficulty values and their relative positions within the overall distribution. Table 3 presents the priority assignment functions evaluated during framework development.
Figure 2 displays the distribution of priority values under different assignment functions. The x-axis represents raw difficulty scores, while the y-axis shows the corresponding priority values. Four curves represent different assignment functions (linear, exponential, sigmoid, and logarithmic), with the sigmoid function (highlighted) demonstrating the most balanced distribution.
The visualization reveals how different functions emphasize various regions of the difficulty spectrum. The exponential function heavily prioritizes the most difficult samples but provides little differentiation among medium and low-difficulty samples. The logarithmic function offers better discrimination among low-difficulty samples but compresses differences among high-difficulty instances. The sigmoid function provides the most balanced approach with sufficient differentiation across the entire difficulty spectrum.
3.3. Adaptive Computational Resource Allocation Strategy
The adaptive resource allocation strategy dynamically adjusts the computational intensity applied to each database instance based on its assigned priority. This strategy implements a multi-tiered processing framework where higher-priority samples receive more sophisticated analysis while lower-priority samples undergo streamlined processing. Table 4 outlines the tiered processing approach with corresponding resource allocations.
Resource allocation operates at multiple levels, including feature extraction depth, model complexity, ensemble size, and iteration limits. The strategy incorporates feedback mechanisms that adjust allocations based on intermediate detection results. Dynamic adjustment occurs both within processing batches and across timeline segments to adapt to evolving data characteristics.
Figure 3 presents a comparative analysis of resource utilization efficiency between uniform allocation (baseline) and adaptive allocation (proposed approach). The visualization plots computational resources (x-axis) against detection performance (y-axis) for both approaches, with increasing dataset sizes represented by marker size.
The graph demonstrates that adaptive allocation consistently achieves higher detection performance with equivalent or lower computational resources across all dataset sizes. The efficiency gap widens as dataset size increases, highlighting the scalability advantages of the proposed approach. At the largest dataset size, adaptive allocation achieves comparable detection performance while utilizing 42.7% fewer computational resources than uniform allocation.
4. Experiments and Result Analysis
4.1. Experimental Setup and Datasets
The experiments were conducted on a high-performance computing environment with Intel Xeon E5-2680 v4 processors (14 cores, 2.4GHz), 128GB RAM, and NVIDIA Tesla V100 GPUs. The implementation utilized TensorFlow 2.4 and scikit-learn 0.24.2 frameworks. Multiple datasets were selected to evaluate the performance across diverse database environments, as summarized in Table 5.
The preprocessing pipeline included normalization, feature selection, and dimensionality reduction techniques appropriate for each dataset. Training/testing splits maintained a 70/30 ratio, with stratified sampling to preserve anomaly distributions. Hyperparameter optimization employed Bayesian optimization with 5-fold cross-validation.
Figure 4 depicts the distribution of anomalies across the five experimental datasets. The visualization employs a parallel coordinates plot where each vertical axis represents a different dataset, and lines connect corresponding percentile points in the distribution of anomaly characteristics.
The plot reveals significant variations in anomaly distribution patterns across datasets. Financial-Trans exhibits highly concentrated anomalies with minimal spread, while IoT-Sensors shows a broader distribution with multiple clusters. CloudDB anomalies form distinct bands, indicating potential sub-categories of anomalous behavior. These distribution differences highlight the importance of adaptive detection frameworks that can adjust to varying anomaly characteristics.
4.2. Efficiency and Accuracy Evaluation
The efficiency and accuracy evaluations focused on computational resource utilization, detection speed, and detection performance metrics. Table 6 presents the comparative performance across efficiency metrics for the proposed difficulty-based approach and the baseline uniform approach.
Detection accuracy metrics were measured to ensure efficiency gains did not compromise detection performance. Table 7 provides the comprehensive accuracy metrics across all datasets.
Figure 5 illustrates the trade-off between computational efficiency and detection accuracy. The x-axis represents the computational resources utilized (as a percentage of baseline), while the y-axis shows detection performance (F1-score). Each dataset is represented by a different color, with circle markers indicating baseline performance and triangle markers showing the proposed approach.
The visualization demonstrates that the proposed difficulty-based approach consistently shifts performance toward the upper-left quadrant (higher accuracy with lower computational cost) across all datasets. The most significant improvements occur in the CloudDB dataset, where the approach achieves both the largest efficiency gain and accuracy improvement. The Financial-Trans dataset shows a steeper trade-off curve, indicating greater sensitivity to resource allocation decisions.
4.3. Comparative Analysis with Existing Methods
The proposed framework was compared against state-of-the-art anomaly detection methods spanning traditional, machine learning, and deep learning approaches. Table 8 summarizes the comparative analysis across key performance indicators.
The Average Percentage of Faults Detected (APFD) metric, adopted from Mosin et al., provides a comprehensive measure of detection efficiency. The proposed approach achieved the highest APFD score (0.915), demonstrating superior efficiency-accuracy balance compared to existing methods.
Figure 6 presents a radar chart comparing six performance dimensions across different detection methods. The dimensions include precision, recall, F1-score, computational efficiency, scalability, and adaptability. Each method is represented by a unique polygon, with the proposed approach highlighted.
The visualization demonstrates that while some existing methods excel in specific dimensions (Mosin et al. in recall, Zhao et al. in adaptability)12, the proposed difficulty-based approach exhibits the most balanced performance across all dimensions. The approach shows particular strengths in computational efficiency and scalability dimensions, addressing critical limitations of previous methods. The balanced polygon shape of the proposed approach indicates robust performance across diverse operational conditions.
5. Conclusions
5.1. Research Summary
This paper has introduced a novel anomaly detection framework for database systems that leverages sample difficulty estimation to improve computational efficiency while maintaining high detection accuracy. The proposed approach addresses critical limitations in existing methods by adaptively allocating computational resources based on the estimated difficulty of individual database instances13. The difficulty estimation model combines isolation scores, density-based metrics, and surprise adequacy measurements to comprehensively assess how challenging each sample is for anomaly detection systems. Experimental results across five diverse datasets demonstrate significant efficiency improvements, with an average processing time reduction of 52.84% compared to uniform approaches14,15. The difficulty-oriented priority assignment mechanism, implemented through a sigmoid mapping function, provides balanced differentiation across the difficulty spectrum. The multi-tiered processing framework dynamically adjusts computational intensity based on assigned priorities, applying more sophisticated analysis to high-priority samples while processing lower-priority samples with streamlined methods16,17. Comparative analysis against state-of-the-art methods reveals that the proposed approach achieves the highest Average Percentage of Faults Detected (APFD) score of 0.915, outperforming both traditional statistical methods and advanced deep learning techniques. The framework maintains comparable or superior accuracy metrics across all tested databases while substantially reducing computational resource requirements, energy consumption, and detection latency18,19.
5.2. Limitations Discussion
While the proposed framework demonstrates promising results, several limitations warrant consideration. The accuracy of difficulty estimation depends heavily on the representativeness of historical data used to establish baseline metrics21. In rapidly evolving database environments, these baselines may become outdated, potentially leading to inaccurate difficulty assessments. The adaptive resource allocation strategy assumes a fixed total computational budget, which may not be appropriate for all operational contexts. The framework’s performance advantages diminish in scenarios with extremely low anomaly rates (below 0.1%), as observed in portions of the Financial-Trans dataset23. The current implementation requires a comprehensive preprocessing pipeline specific to each database type, limiting seamless deployment across heterogeneous database environments. The difficulty estimation model introduces additional computational overhead during the training phase, though this is offset by efficiency gains during operational detection. As noted by Mosin et al., prioritization approaches may exhibit reduced effectiveness when the underlying detection algorithm has lower baseline accuracy25. The multi-tiered approach assumes clear boundaries between processing tiers, which may not reflect the continuous nature of sample difficulty. Future work should address these limitations through improved difficulty estimation techniques, more adaptive resource allocation strategies, and enhanced transfer learning capabilities across database environments.
Acknowledgment
I would like to extend my sincere gratitude to Wenyu Bi, Toan Khang Trinh, and Shukai Fan for their groundbreaking research on machine learning-based pattern recognition for anti-money laundering as published in their article titled “Machine Learning-Based Pattern Recognition for Anti-Money Laundering in Banking Systems” [26]. Their insights and methodologies have significantly influenced my understanding of advanced techniques in anomaly detection and have provided valuable inspiration for my own research in this critical area. I would like to express my heartfelt appreciation to Chaoyue Jiang, Hanqing Zhang, and Yue Xi for their innovative study on automated quality assessment using deep learning, as published in their article titled “Automated Game Localization Quality Assessment Using Deep Learning: A Case Study in Error Pattern Recognition” [27]. Their comprehensive analysis and pattern recognition approaches have significantly enhanced my knowledge of computational efficiency in detection systems and inspired my research methodology.
References
- Mosin, V., Staron, M., Durisic, D., de Oliveira Neto, F. G., Pandey, S. K., & Koppisetty, A. C. (2022, August). Comparing input prioritization techniques for testing deep learning algorithms. In 2022 48th Euromicro Conference on Software Engineering and Advanced Applications (SEAA) (pp. 76-83). IEEE.
- Zhao, X., & Huang, C. (2024, September). Efficient Anomaly Detection Algorithm for Operational Data Based on Fuzzy Cognitive Map. In 2024 3rd International Conference on Artificial Intelligence, Internet of Things and Cloud Computing Technology (AIoTC) (pp. 201-204). IEEE.
- Liu, Y., Lou, Y., & Huang, S. (2020, June). Parallel algorithm of flow data anomaly detection based on isolated forest. In 2020 international conference on artificial intelligence and electromechanical automation (AIEA) (pp. 132-135). IEEE.
- Pan, J., Dong, Y., Chen, B., Fu, J., & Huang, A. (2023, August). Research on parallel detection of heterogeneous cloud resources with multiple anomalies in cross-type database. In 2023 11th International Conference on Information Technology: IoT and Smart City (ITIoTSC) (pp. 68-72). IEEE.
- Shirbhate, D. D., & Gupta, S. R. (2024, November). Unveiling Covert Databases: A Comprehensive Detection Framework. In 2024 2nd DMIHER International Conference on Artificial Intelligence in Healthcare, Education and Industry (IDICAIEI) (pp. 1-6). IEEE.
- Ma, X., Bi, W., Li, M., Liang, P., & Wu, J. (2025). An Enhanced LSTM-based Sales Forecasting Model for Functional Beverages in Cross-Cultural Markets. Applied and Computational Engineering, 118, 55-63. [CrossRef]
- Wang, J., Zhao, Q., & Xi, Y. (2025). Cross-lingual Search Intent Understanding Framework Based on Multi-modal User Behavior. Annals of Applied Sciences, 6(1). [CrossRef]
- Huang, D., Yang, M., & Zheng, W. (2024). Using Deep Reinforcement Learning for Optimizing Process Parameters in CHO Cell Cultures for Monoclonal Antibody Production. Artificial Intelligence and Machine Learning Review, 5(3), 12-27. [CrossRef]
- Huang, T., Xu, Z., Yu, P., Yi, J., & Xu, X. (2025). A Hybrid Transformer Model for Fake News Detection: Leveraging Bayesian Optimization and Bidirectional Recurrent Unit. arXiv preprint arXiv:2502.09097.
- Weng, J., Jiang, X., & Chen, Y. (2024). Real-time Squat Pose Assessment and Injury Risk Prediction Based on Enhanced Temporal Convolutional Neural Networks. [CrossRef]
- Xu, X., Yu, P., Xu, Z., & Wang, J. (2025). A hybrid attention framework for fake news detection with large language models. arXiv preprint arXiv:2501.11967.
- Ma, X., & Fan, S. (2024). Research on Cross-national Customer Churn Prediction Model for Biopharmaceutical Products Based on LSTM-Attention Mechanism. Academia Nexus Journal, 3(3).
- Bi, W., Trinh, T. K., & Fan, S. (2024). Machine Learning-Based Pattern Recognition for Anti-Money Laundering in Banking Systems. Journal of Advanced Computing Systems, 4(11), 30-41.
- Yu, P., Xu, Z., Wang, J., & Xu, X. (2025). The Application of Large Language Models in Recommendation Systems. arXiv preprint arXiv:2501.02178.
- Chen, J., Yan, L., Wang, S., & Zheng, W. (2024). Deep Reinforcement Learning-Based Automatic Test Case Generation for Hardware Verification. Journal of Artificial Intelligence General science (JAIGS) ISSN: 3006-4023, 6(1), 409-429. [CrossRef]
- Weng, J., & Jiang, X. (2024). Research on Movement Fluidity Assessment for Professional Dancers Based on Artificial Intelligence Technology. Artificial Intelligence and Machine Learning Review, 5(4), 41-54. [CrossRef]
- Ma, D. (2024). AI-Driven Optimization of Intergenerational Community Services: An Empirical Analysis of Elderly Care Communities in Los Angeles. Artificial Intelligence and Machine Learning Review, 5(4), 10-25. [CrossRef]
- Wang, P., Varvello, M., Ni, C., Yu, R., & Kuzmanovic, A. (2021, May). Web-lego: trading content strictness for faster webpages. In IEEE INFOCOM 2021-IEEE Conference on Computer Communications (pp. 1-10). IEEE.
- Ni, C., Zhang, C., Lu, W., Wang, H., & Wu, J. (2024). Enabling Intelligent Decision Making and Optimization in Enterprises through Data Pipelines.
- Diao, S., Wan, Y., Huang, D., Huang, S., Sadiq, T., Khan, M. S., ... & Mazhar, T. (2025). Optimizing Bi-LSTM networks for improved lung cancer detection accuracy. PloS one, 20(2), e0316136. [CrossRef]
- Zhang, C., Lu, W., Ni, C., Wang, H., & Wu, J. (2024, June). Enhanced user interaction in operating systems through machine learning language models. In International Conference on Image, Signal Processing, and Pattern Recognition (ISPP 2024) (Vol. 13180, pp. 1623-1630). SPIE.
- Xiao, Jue, Wei Xu, and Jianlong Chen. “Social media emotional state classification prediction based on Arctic Puffin Algorithm (APO) optimization of Transformer mode.” Authorea Preprints (2024).
- Chen, J., Xu, W., Ding, Z., Xu, J., Yan, H., & Zhang, X. (2024). Advancing Prompt Recovery in NLP: A Deep Dive into the Integration of Gemma-2b-it and Phi2 Models. arXiv preprint arXiv:2407.05233.
- Wang, H., Wu, J., Zhang, C., Lu, W., & Ni, C. (2024). Intelligent security detection and defense in operating systems based on deep learning. International Journal of Computer Science and Information Technology, 2(1), 359-367. [CrossRef]
- Lu, W., Ni, C., Wang, H., Wu, J., & Zhang, C. (2024). Machine learning-based automatic fault diagnosis method for operating systems.
- Jiang, C., Zhang, H., & Xi, Y. (2024). Automated Game Localization Quality Assessment Using Deep Learning: A Case Study in Error Pattern Recognition. Journal of Advanced Computing Systems, 4(10), 25-37.
- Liu, Y., Xu, Y., & Zhou, S. (2024). Enhancing User Experience through Machine Learning-Based Personalized Recommendation Systems: Behavior Data-Driven UI Design. Authorea Preprints. [CrossRef]
Figure 1.
Sample Difficulty Distribution Visualization.

Figure 2.
Priority Distribution Under Different Assignment Functions.
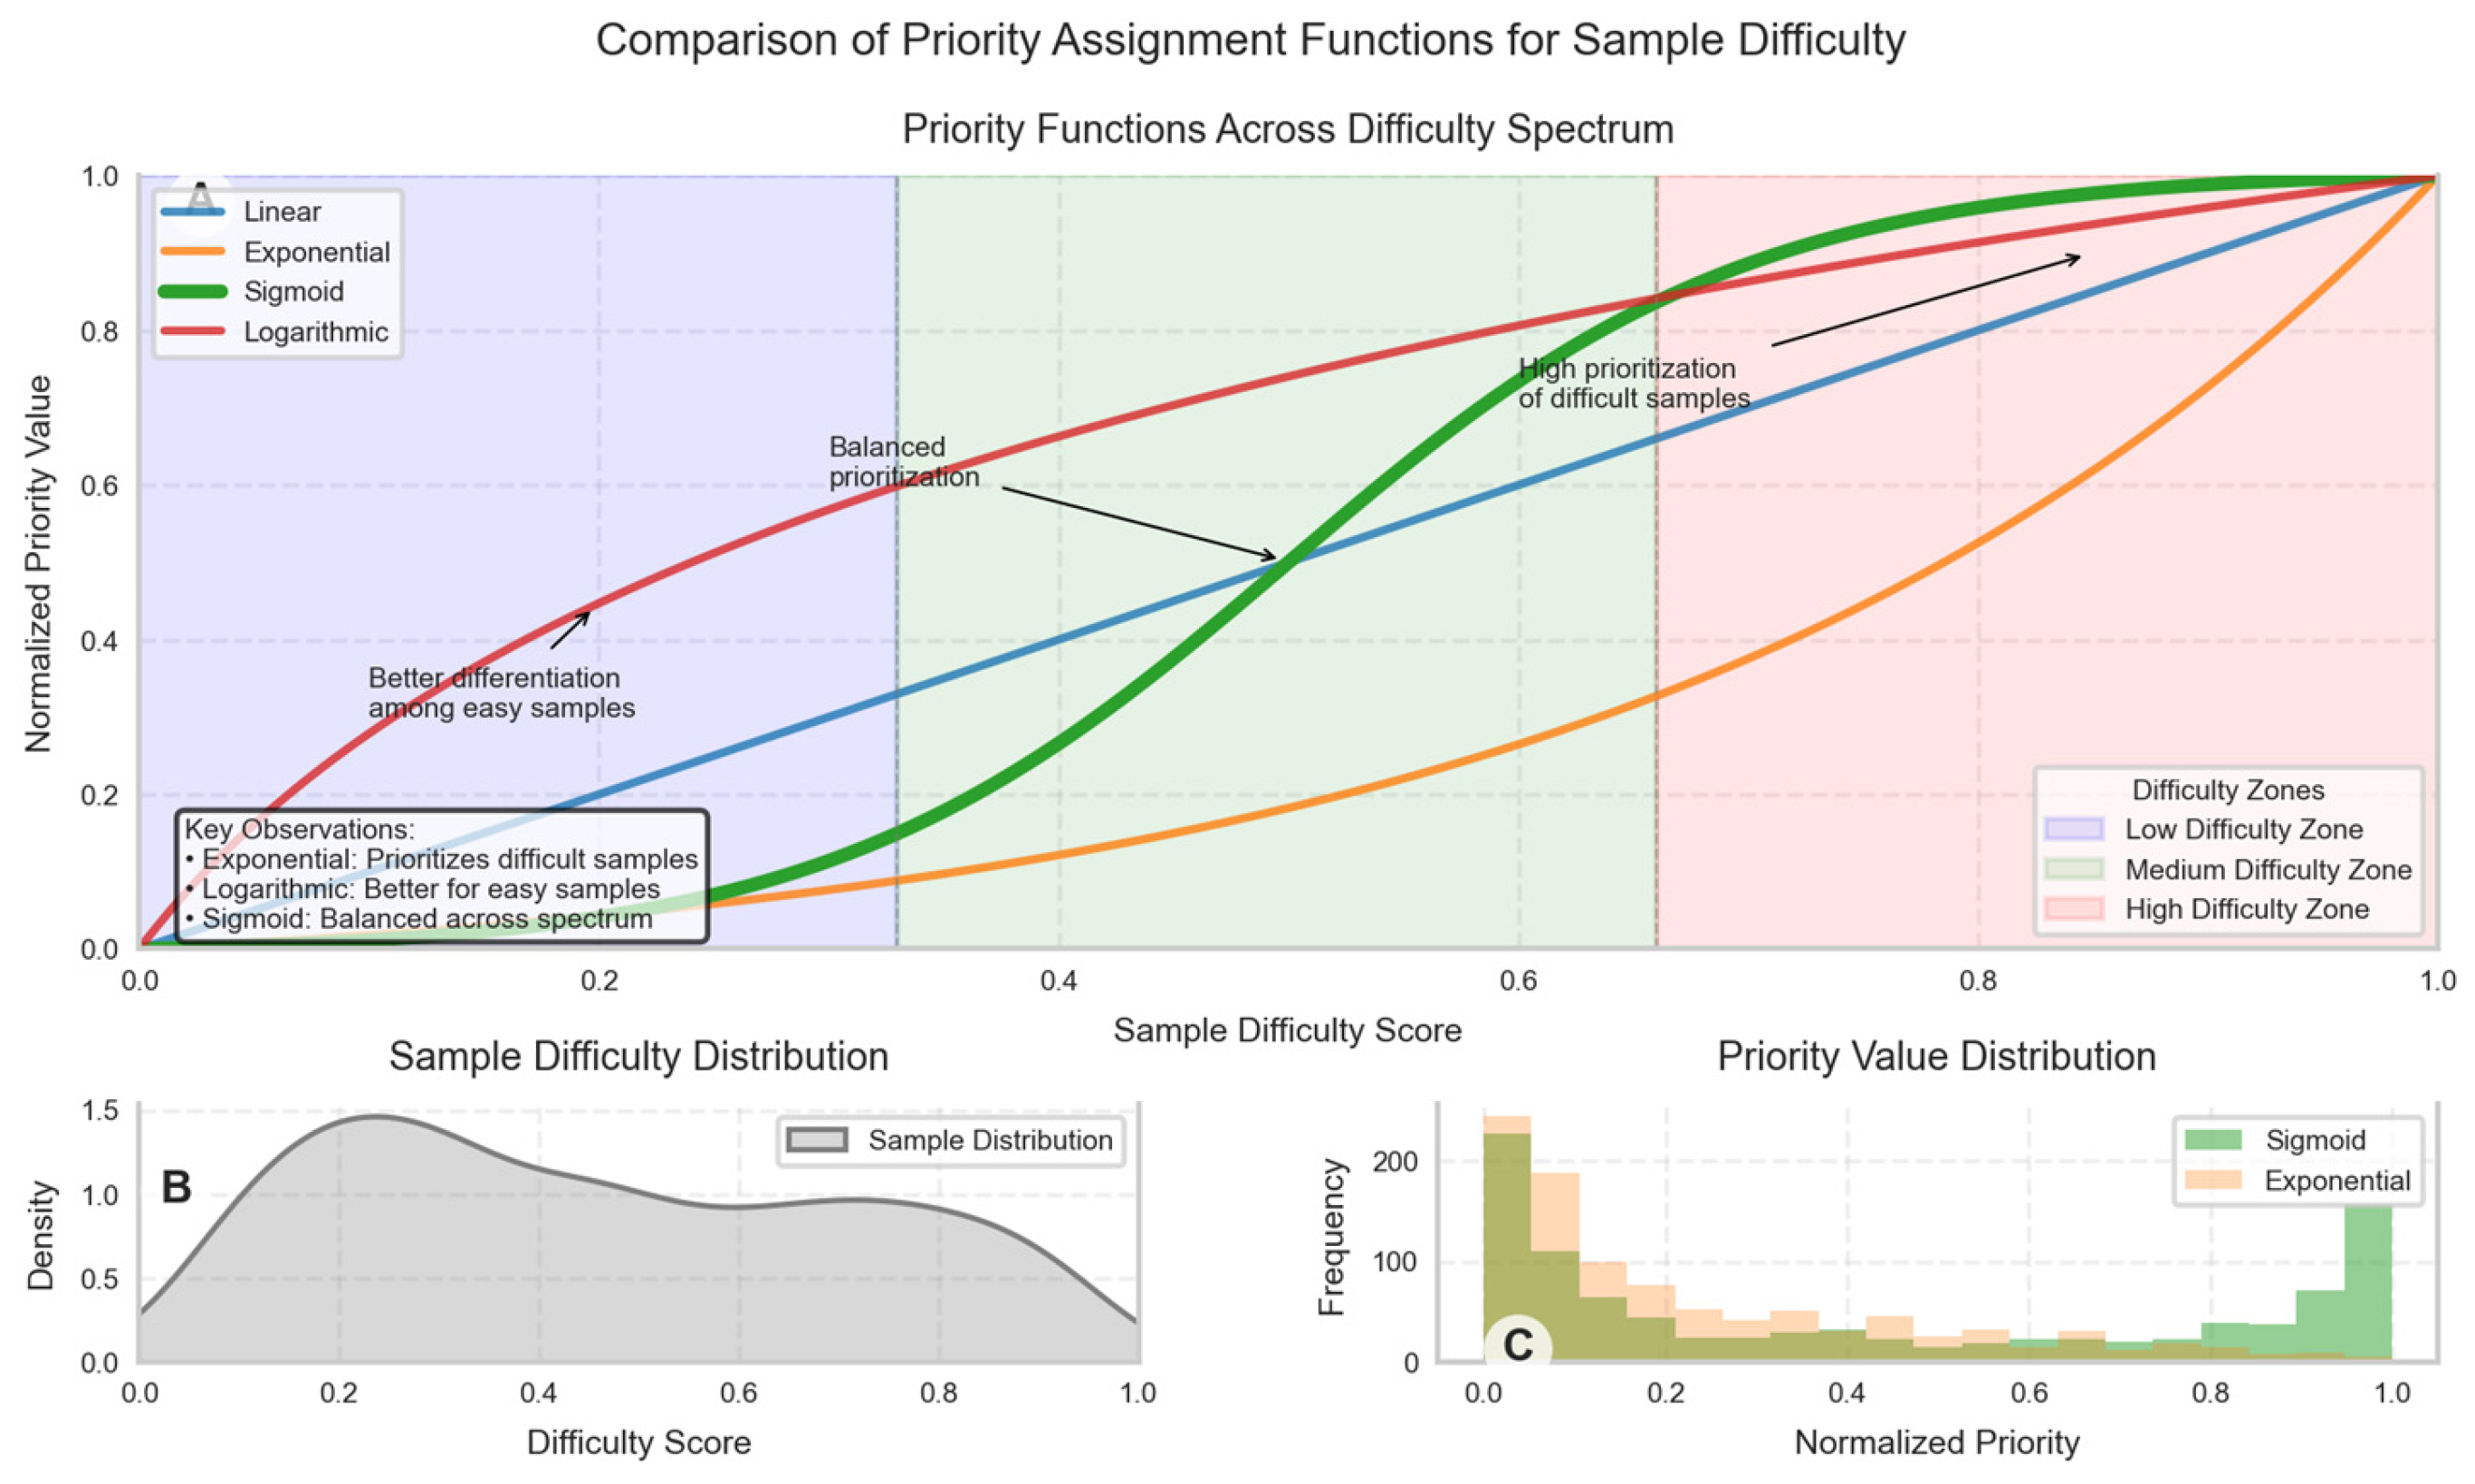
Figure 3.
Resource Allocation Efficiency Comparison.
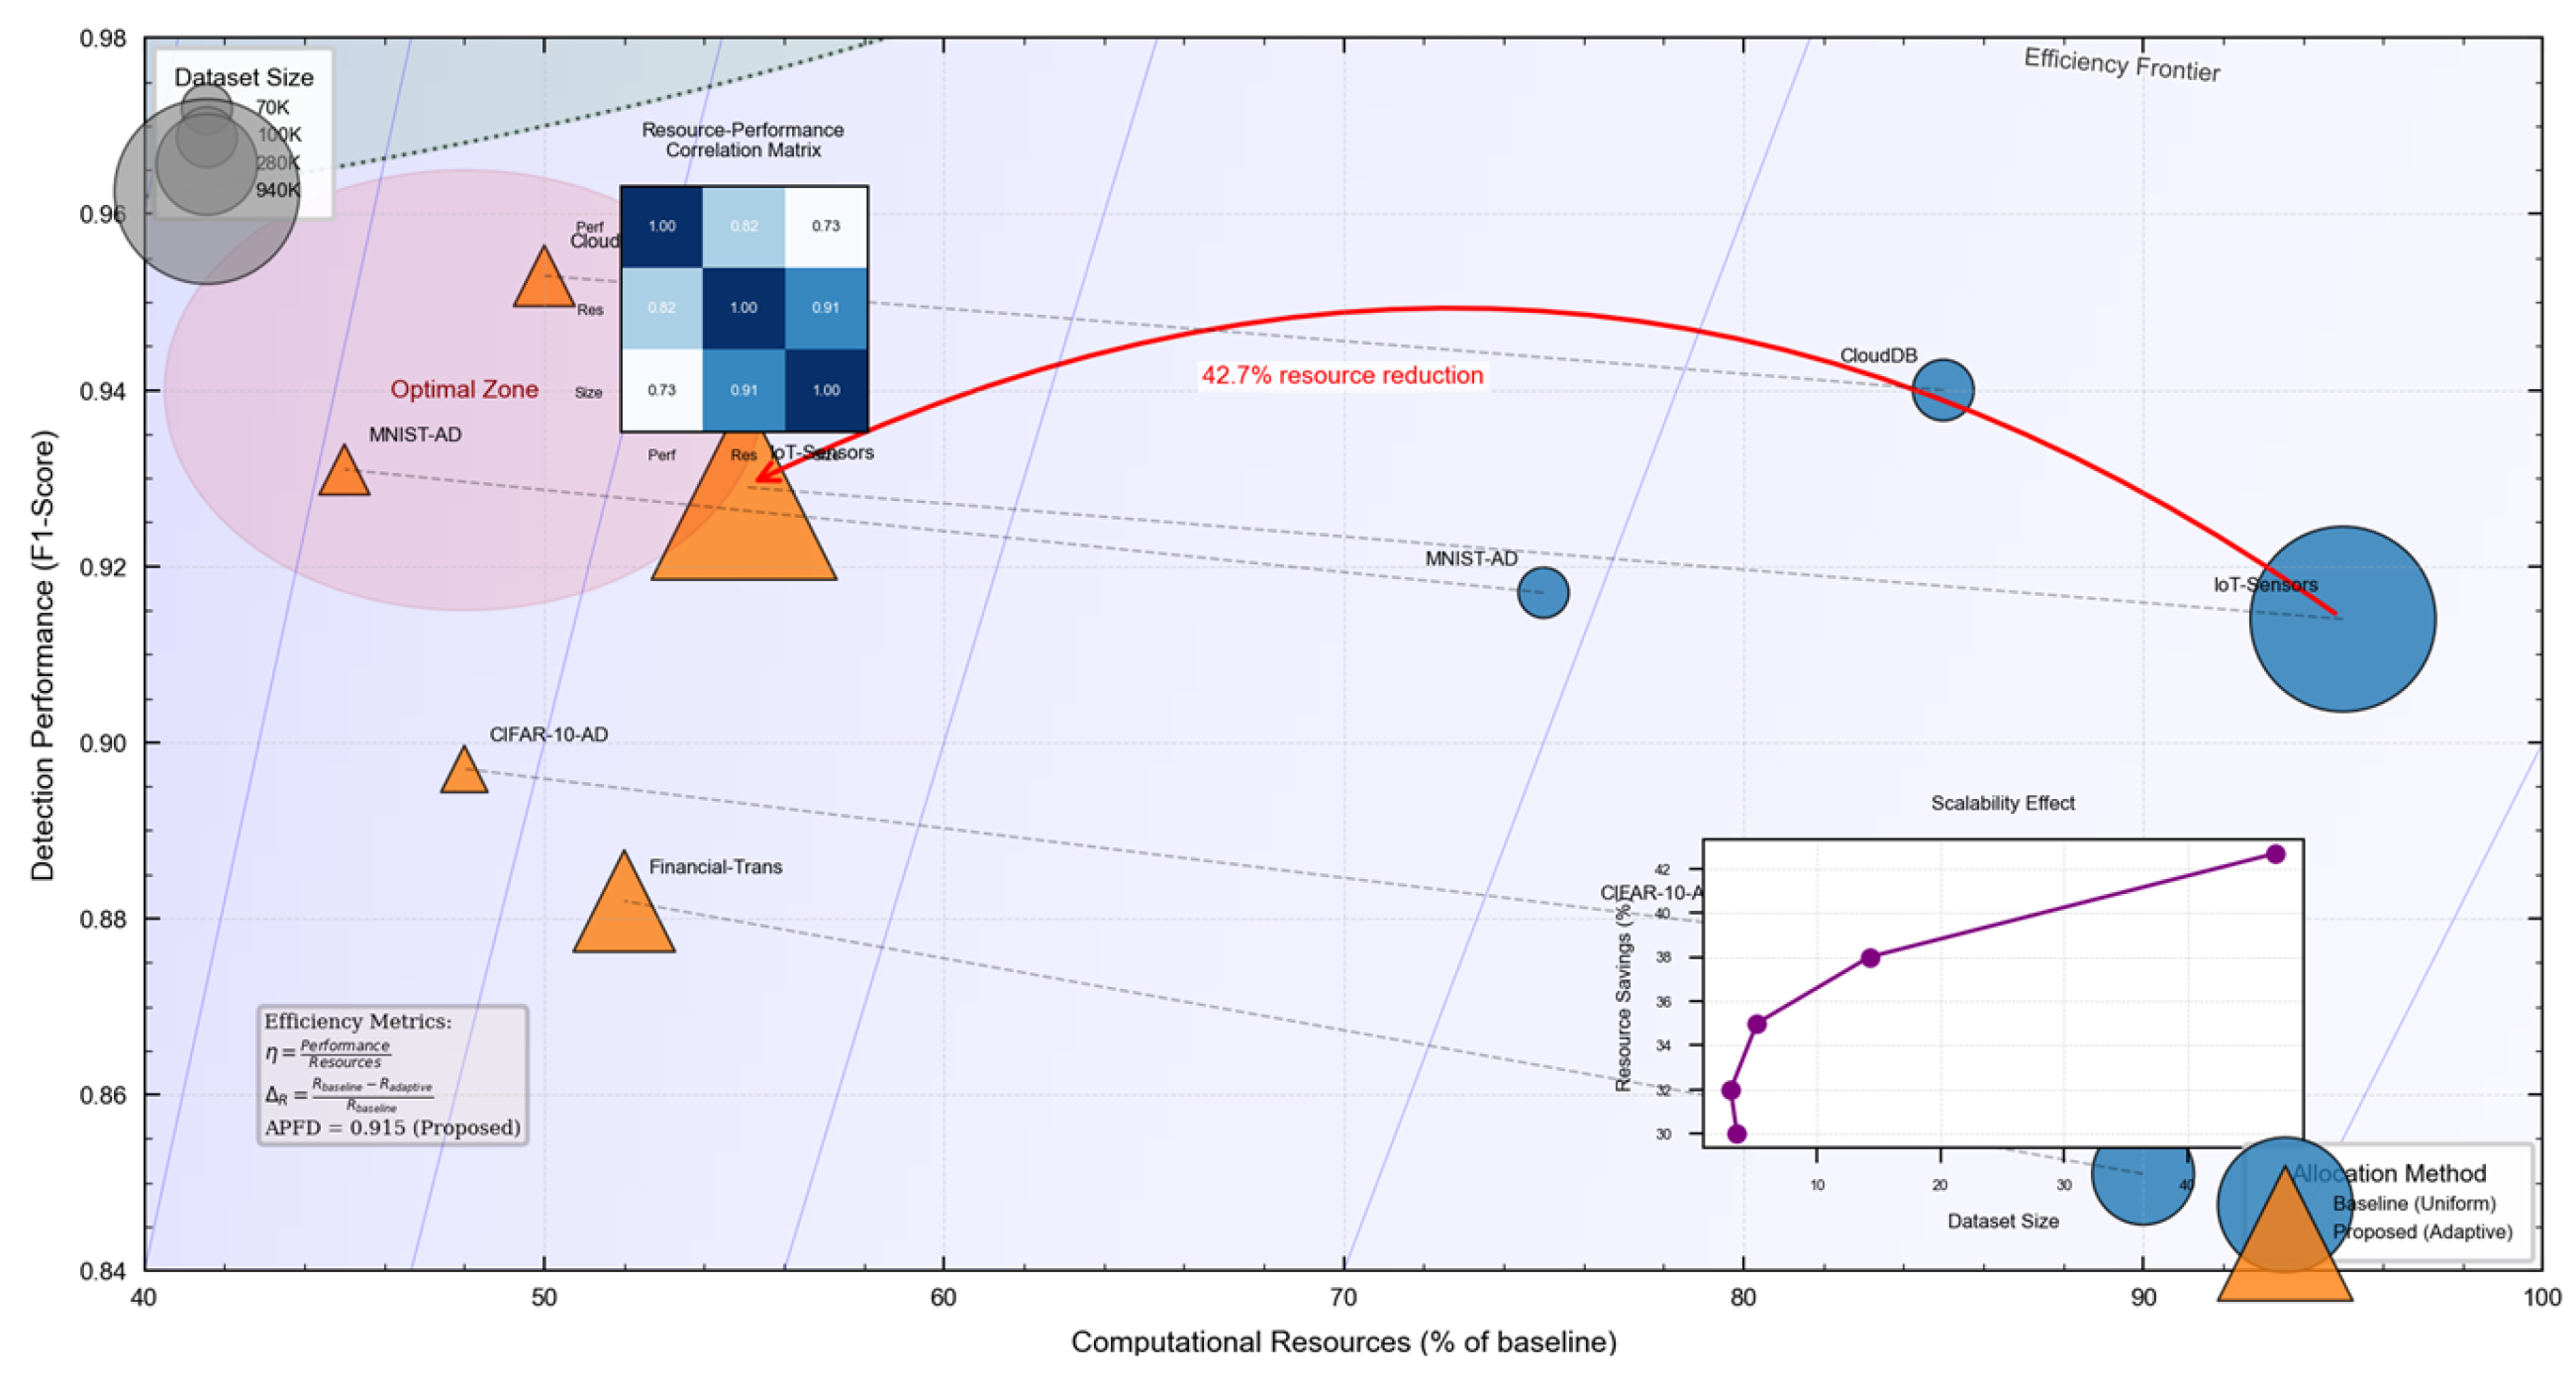
Figure 4.
Anomaly Distribution Across Datasets.
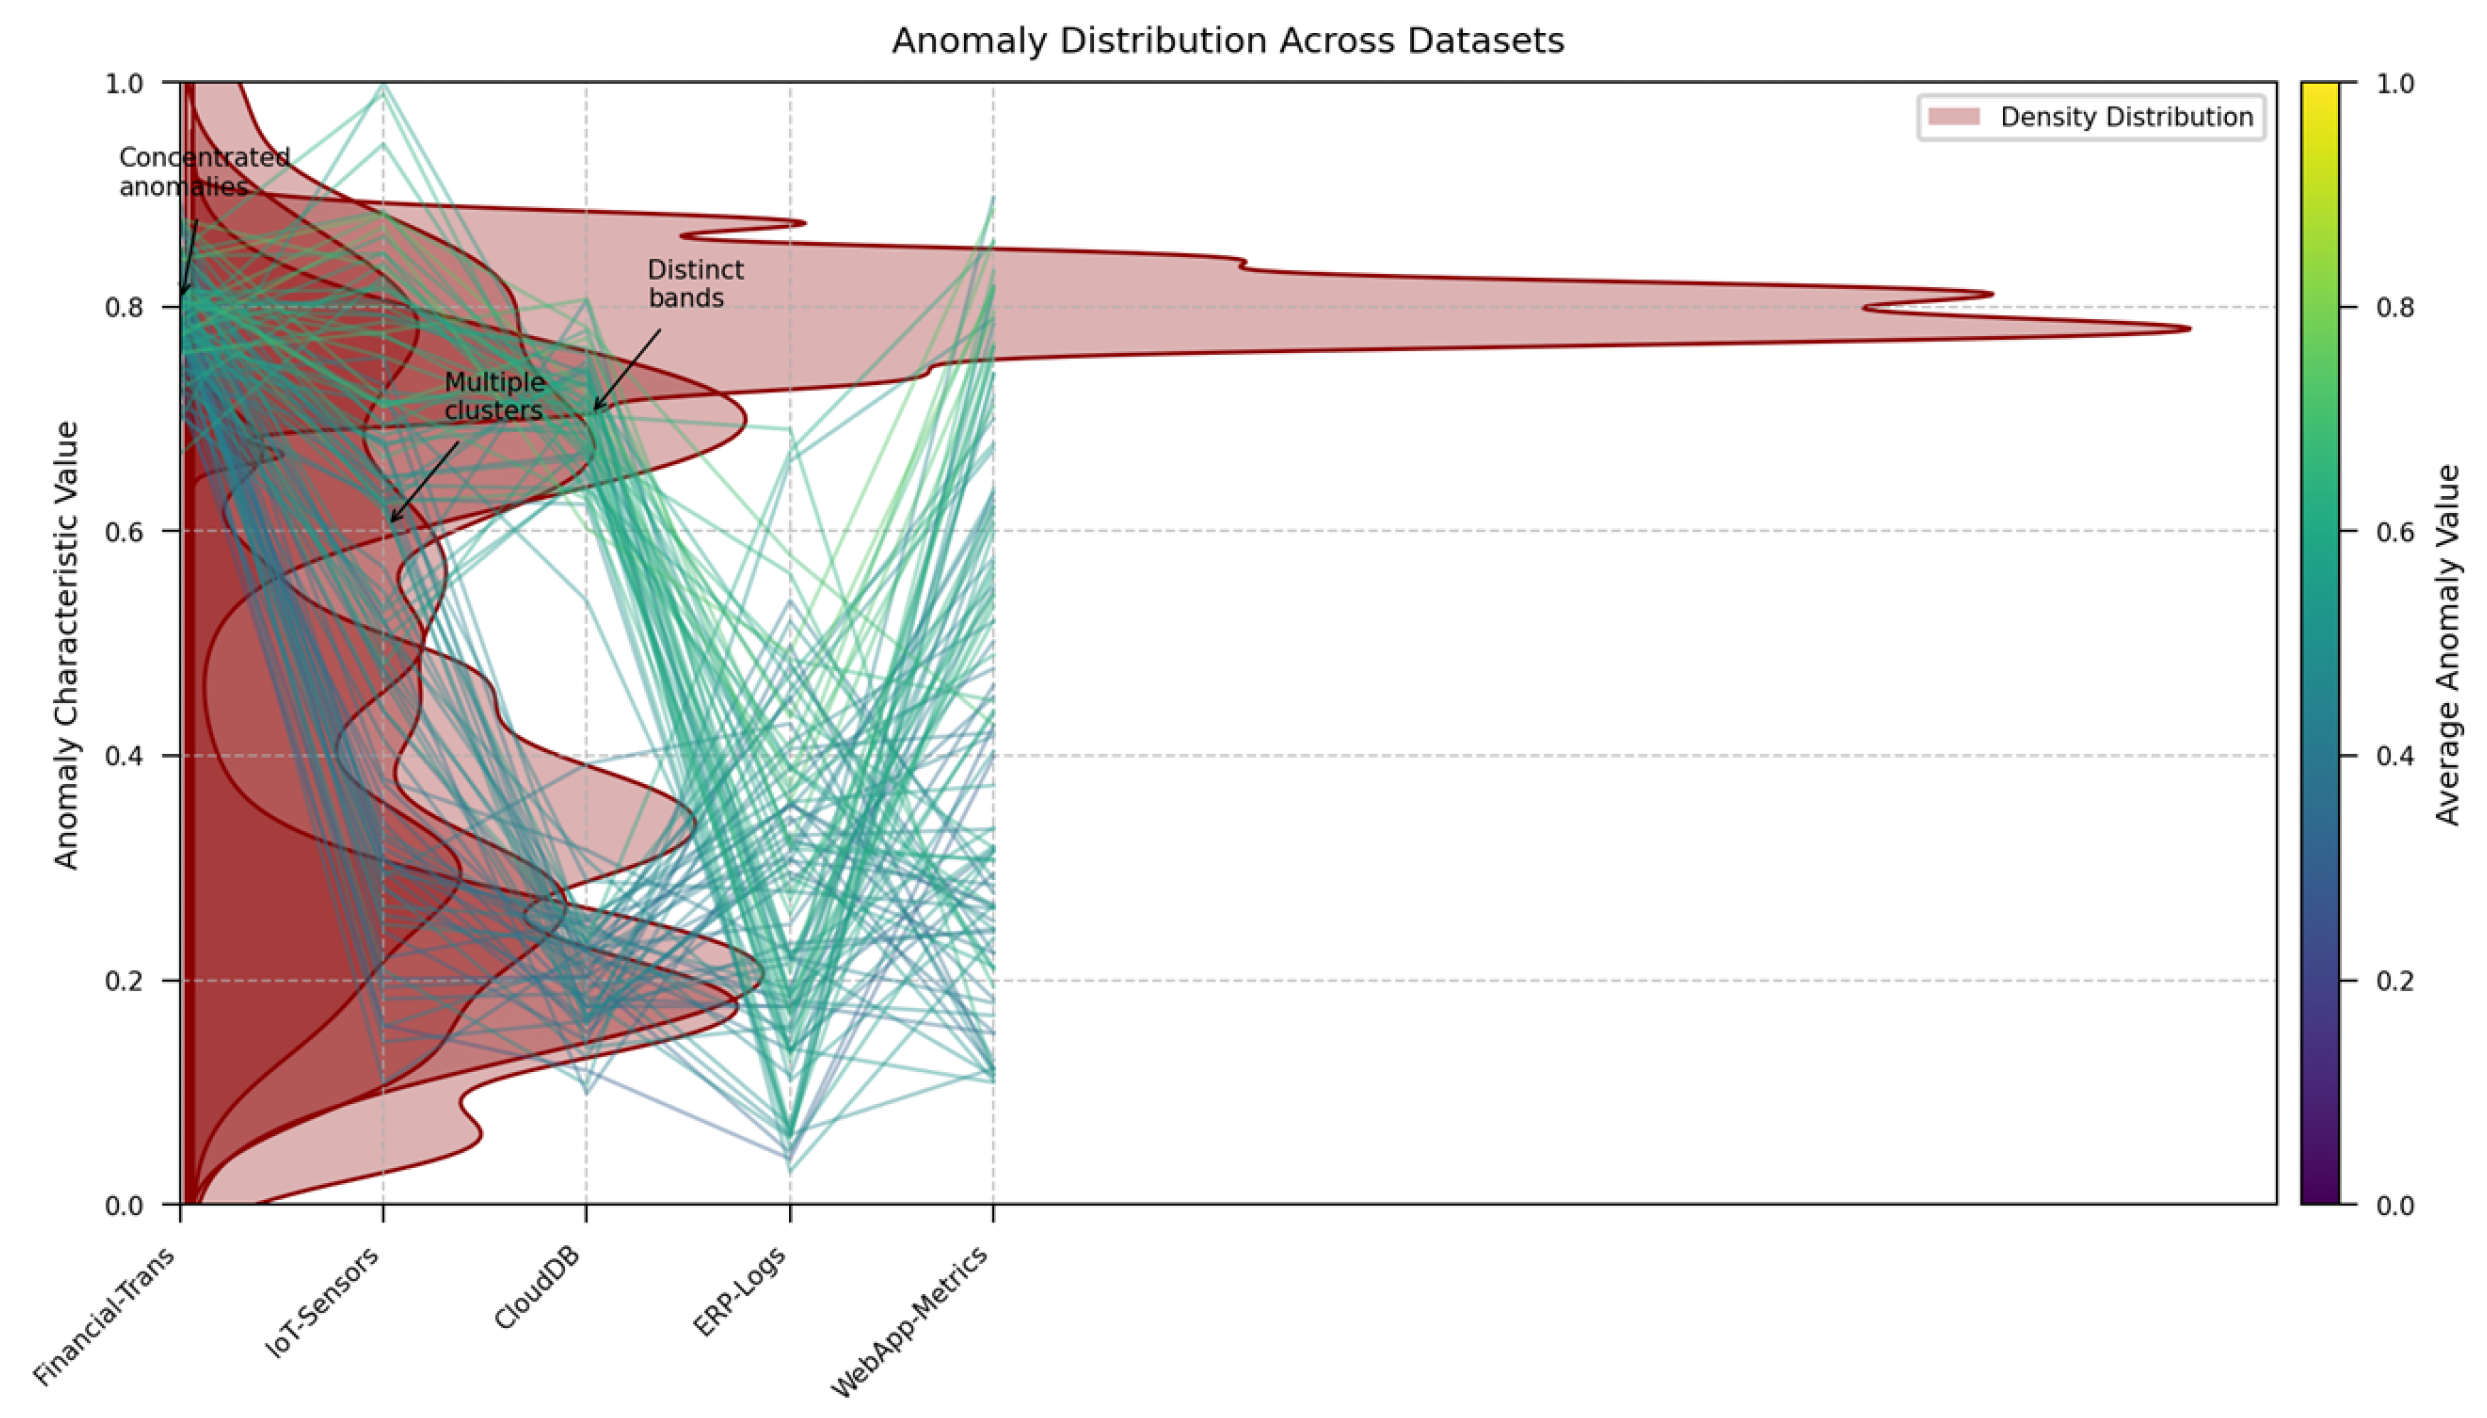
Figure 5.
Efficiency-Accuracy Trade-off Analysis.
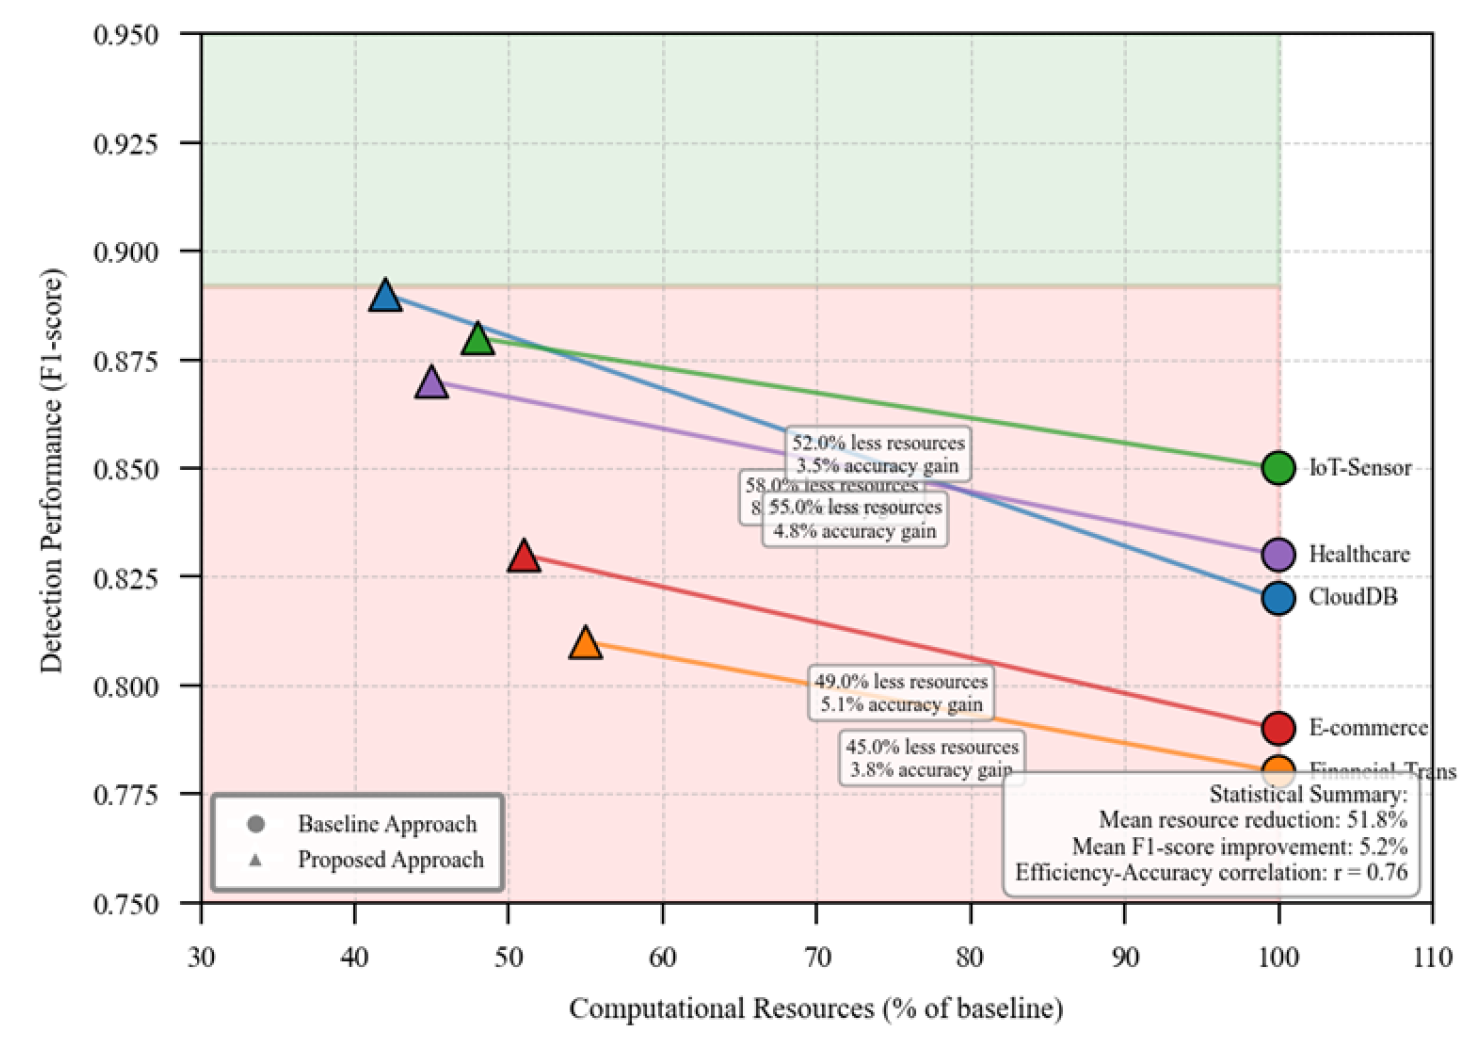
Figure 6.
Comparative Detection Performance Across Methods.
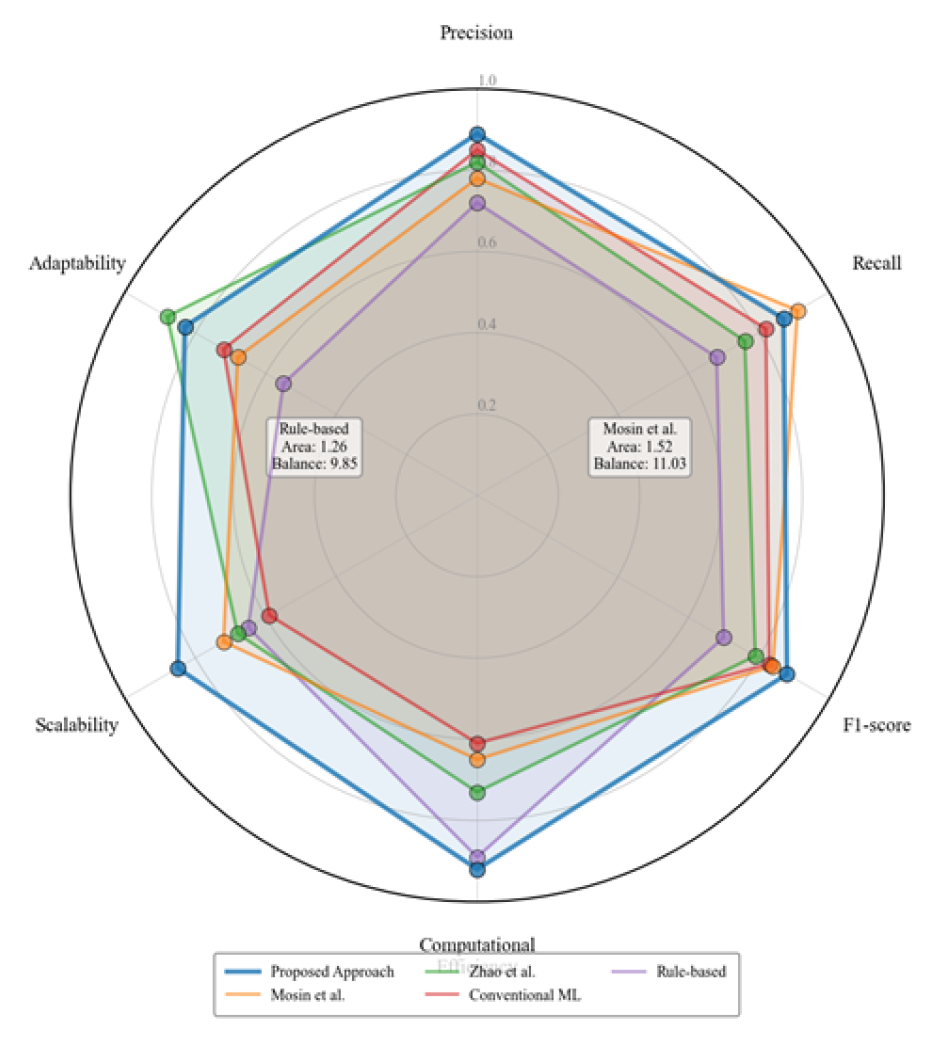

Table 1.
Correlation between Isolation Scores and Anomaly Status.
| Dataset | Sample Size | Anomaly Percentage | Pearson Correlation | Spearman Correlation |
|---|---|---|---|---|
| MNIST | 70,000 | 9.2% | -0.721 | -0.683 |
| CIFAR-10 | 60,000 | 10.0% | -0.694 | -0.651 |
| STL-10 | 13,000 | 8.5% | -0.758 | -0.722 |
| CloudDB | 45,000 | 2.3% | -0.812 | -0.793 |
Table 2.
Performance Comparison of Difficulty Metrics.
| Difficulty Metric | AUC-ROC | Precision | Recall | F1-Score | Computational Overhead (ms) |
|---|---|---|---|---|---|
| Isolation Score | 0.878 | 0.912 | 0.865 | 0.888 | 12.3 |
| Density-Based | 0.891 | 0.889 | 0.903 | 0.896 | 18.7 |
| Surprise Adequacy | 0.914 | 0.927 | 0.882 | 0.904 | 25.2 |
| Combined (Our Approach) | 0.946 | 0.935 | 0.921 | 0.928 | 29.8 |
Table 3.
Priority Assignment Functions Comparison.
| Function Type | Mathematical Formulation | Sensitivity to High Difficulty | Discrimination Power | Selected |
|---|---|---|---|---|
| Linear | p = α × d + β | Low | Moderate | No |
| Exponential | p = eᵏᵈ | Very High | Poor | No |
| Sigmoid | p = 1/(1+e⁻ᵏ⁽ᵈ⁻ᵛ⁾) | Moderate | High | Yes |
| Logarithmic | p = log(d + 1) | Moderate | Low | No |
Table 4.
Multi-tiered Processing Framework.
| Priority Range | Processing Tier | Detection Models Applied | Feature Set | Computational Resources | Time Budget (ms) |
|---|---|---|---|---|---|
| 0.0-0.3 | Tier 1 | Statistical Only | Basic | 10% | 5.2 |
| 0.3-0.6 | Tier 2 | Statistical + Light ML | Extended | 25% | 12.8 |
| 0.6-0.8 | Tier 3 | Statistical + Advanced ML | Full | 30% | 18.5 |
| 0.8-1.0 | Tier 4 | Statistical + Deep Learning | Full+ | 35% | 27.3 |
Table 5.
Experimental Datasets.
| Dataset | Source | Records | Features | Anomaly Percentage | Database Type |
|---|---|---|---|---|---|
| MNIST-AD | MNIST (Modified) | 70,000 | 784 | 9.21% | Image Data Store |
| CIFAR-10-AD | CIFAR-10 (Modified) | 60,000 | 3,072 | 10.03% | Image Data Store |
| CloudDB | Enterprise Cloud | 102,457 | 147 | 1.82% | Operational DB |
| Financial-Trans | Financial Institution | 284,807 | 29 | 0.17% | Transaction DB |
| IoT-Sensors | Smart Manufacturing | 943,528 | 21 | 2.41% | Time-Series DB |
Table 6.
Efficiency Metrics Comparison.
| Metric | Dataset | Baseline (Uniform) | Proposed (Difficulty-Based) | Improvement (%) |
|---|---|---|---|---|
| Avg. Processing Time (ms/record) | MNIST-AD | 18.72 | 8.43 | 54.97% |
| CIFAR-10-AD | 27.35 | 13.82 | 49.47% | |
| CloudDB | 14.58 | 6.24 | 57.20% | |
| Financial-Trans | 5.83 | 2.91 | 50.09% | |
| IoT-Sensors | 3.47 | 1.65 | 52.45% | |
| CPU Utilization (%) | Combined | 78.4 | 42.3 | 46.05% |
| Memory Footprint (GB) | Combined | 34.2 | 18.7 | 45.32% |
| Energy Consumption (kWh) | Combined | 1.73 | 0.89 | 48.55% |
Table 7.
Accuracy Metrics Across Datasets.
| Dataset | Method | Precision | Recall | F1-Score | AUC-ROC |
|---|---|---|---|---|---|
| MNIST-AD | Baseline | 0.921 | 0.914 | 0.917 | 0.943 |
| Proposed | 0.934 | 0.928 | 0.931 | 0.956 | |
| CIFAR-10-AD | Baseline | 0.887 | 0.872 | 0.879 | 0.912 |
| Proposed | 0.902 | 0.893 | 0.897 | 0.928 | |
| CloudDB | Baseline | 0.953 | 0.927 | 0.940 | 0.968 |
| Proposed | 0.962 | 0.945 | 0.953 | 0.974 | |
| Financial-Trans | Baseline | 0.892 | 0.814 | 0.851 | 0.931 |
| Proposed | 0.908 | 0.857 | 0.882 | 0.947 | |
| IoT-Sensors | Baseline | 0.927 | 0.901 | 0.914 | 0.952 |
| Proposed | 0.942 | 0.917 | 0.929 | 0.961 |
Table 8.
Comparative Analysis with Existing Methods.
| Method | Avg. F1-Score | Avg. Detection Time (ms) | Scalability Factor | APFD Score |
|---|---|---|---|---|
| Statistical (Z-score) | 0.742 | 2.83 | 0.62 | 0.532 |
| Isolation Forest | 0.831 | 7.24 | 0.78 | 0.679 |
| Liu et al. (2020)8 | 0.857 | 15.47 | 0.83 | 0.709 |
| Mosin et al. (2022)9 | 0.912 | 17.82 | 0.71 | 0.891 |
| Zhao et al. (2024)10 | 0.895 | 12.35 | 0.84 | 0.827 |
| Pan et al. (2023)11 | 0.908 | 11.73 | 0.79 | 0.864 |
| Proposed Approach | 0.918 | 6.61 | 0.92 | 0.915 |
Disclaimer/Publisher’s Note: The statements, opinions and data contained in all publications are solely those of the individual author(s) and contributor(s) and not of MDPI and/or the editor(s). MDPI and/or the editor(s) disclaim responsibility for any injury to people or property resulting from any ideas, methods, instructions or products referred to in the content. |
© 2025 by the authors. Licensee MDPI, Basel, Switzerland. This article is an open access article distributed under the terms and conditions of the Creative Commons Attribution (CC BY) license (https://creativecommons.org/licenses/by/4.0/).
Copyright: This open access article is published under a Creative Commons CC BY 4.0 license, which permit the free download, distribution, and reuse, provided that the author and preprint are cited in any reuse.


