
Submitted:
15 April 2025
Posted:
16 April 2025
You are already at the latest version
Abstract
Due to the fact that all services today are transmitted over the internet, they have become easier to use and more affordable. One such service is VoIP. This research focuses on the statistical analysis of VoIP user traffic with the G.711 codec and its variants (G.723, G.729). Data was provided by Intelligent Technology Partner LLC, a company offering VoIP services in Mongolia. The results of this analysis are compared with the theoretical distribution of inter-arrival time (the time between packets). Additionally, other parameters for simulation are defined based on mathematical formulas. The most influential factor in the traffic of devices connected to the internet network is the queue at the output buffer, which has been modeled using the M/D/1/∞ model, and the mathematical derivation of the model has been fully completed. Essential performance metrics, including system and queue waiting times, packet counts within the system, and their standard deviations, were obtained for environments accommodating 1 to 50 users. Simulation outcomes, derived from 1,000,000 packets, demonstrate a strong correlation with theoretical forecasts. These findings offer significant insights for enhancing VoIP system design, network planning, and prospective service advancements. The research underscores the significance of choosing the appropriate codec according to user demand to improve Quality of Service (QoS).
Keywords:
VoIP
; G.711
; queueing theory
; queueing models
; communication systems
; codec optimization
; packets
; QoS
; traffic analysis
1. Introduction
In an era of hastily evolving technology, the number of internet users worldwide reached 5.52 billion by October 2024 [1]. As internet usage increases, researching traffic models for internet access, planning and implementing technological upgrades, and improving network quality and information security services have become common objectives. Packet-switched networks are now extensively used for data transmission and voice, video services, online education, gaming, and conferencing, with demand for such services accelerating significantly since the COVID-19 pandemic [2,3]. Voice over IP (VoIP) [4] technology has become a foundational component of modern telecommunication systems, offering a flexible, cost-effective alternative to traditional voice networks [5]. Unlike conventional circuit-switched networks, VoIP operates over packet-switched networks, introducing distinct challenges in traffic management due to the non-deterministic nature of packet arrival times and the critical need for minimal delay and jitter. Both wired and wireless technologies are used to transmit data, ensuring high-speed asynchronous packet-switched inter-discipline exchanges. To satisfy a range of services directed at the user nowadays, modern end-user devices must form this tendency, in which there is both high-speed, on-demand data transfer or access and a very high “Quality of Service” or QoS standard. Therefore, next-generation communication systems are expected to require even higher data speeds and better connection quality [6]. Consequently, accurate modeling and simulation of VoIP user traffic is essential for effective network planning, resource allocation, and Quality of Service (QoS) management [7,8,9].
In Mongolia, the telecommunication operators maintain voice services based on IP networks. The Communications Regulatory Commission's first half of 2024 statistical report[10] shows a rise in internet usage in the country. This report demonstrates that 53 Internet Service Providers (ISPs) collectively utilized 218.2 Gbps of bandwidth under contractual agreements. Furthermore, the international internet bandwidth capacity increased by 22% compared to the previous year, reaching 720.5 Gbps. As of 2024, 16 companies have been approved to provide mobile, fixed-line, and international voice communication services, and 53 companies have been authorized to offer internet services, including those actively submitting statistics reports. Data gathered from mobile communication companies reveal that data usage on the 3G network increased by 9.59%, while data usage on the 4G/LTE network grew by 32.23%, rather than the previous half. As revealed above, statistics indicate that internet usage in Mongolia increases annually; nonetheless, the specific ratio numbers specified for VoIP services still need improvement. Global patterns demonstrate a steady rise in VoIP usage, implying that the same pattern is probably evident within the country. The global VoIP services industry is anticipated to attain $194.5 billion by 2024[11]. The mobile VoIP industry is projected to reach $183.7 billion by 2027, with an average annual growth rate of 21.5% since 2020[12]. Given these global trends, it is plausible to deduce that the utilization of VoIP services is increasing in Mongolia. Nonetheless, comprehensive country-specific investigations and statistical analysis are essential for a more precise comprehension of this rise.
The investigation into VoIP user traffic expels mathematical modeling and simulation from being possible. Some investigation into different codecs, such as G.711, G.723, and G.729, should give a better idea about how changes in encoding protocols affect the variables crucial to analysis—such as packet size and inter-packet intervals [13,14]. In this manner, network engineers and service providers are able to work toward more reliable and expandable VoIP services. The mathematical models and simulations provide a means through which the complex dynamics of VoIP pattern traffic explain in detail the basic processes that very well-order network performance. By emulating different scenarios of VoIP traffic across different configurations, researchers can discover how packetization and transmission protocols will affect overall efficiency. It allows for a complex look into how elements—packet size, the efficiency of codecs, and network bandwidth—interact within the VoIP network. It puts into perspective the various trade-offs that have needed to be made and possible improvements in VoIP service provision. The G.711 codec is popularly known for its high, uncompromised audio transmission quality and, therefore, forms the necessary basis when studying the fine details of VoIP traffic simulation. Developing an analytical mathematical framework based on queuing theory and key performance measures, such as delay and throughput, may allow one to determine the use of G.711 in a network scenario. This type of analysis will provide theoretically sound insights into the VoIP traffic management issues but also practically relevant recommendations for network optimization strategies and resource distribution methods. The outcome will be a marriage of the mathematical modeling and comparative simulations, aimed at furthering the VoIP technology through data-driven decision-making and effective policy formulation within the sector of telecommunications.
The study data was collected from the infrastructure of IT Partner LLC, a Mongolian company providing VoIP services. We captured and analyzed VoIP traffic transmitted via an intermediary device connected to a wired network with a 10 Mbps bandwidth, utilizing the G.711 codec with fixed 160-byte voice packets. The main aim will be finding out about the static parameters, to formulate a proposed theoretical mathematical model, and to compare the results with simulation outcomes. The main contributions of this paper are summarized as follows:
- We present a general mathematical model founded upon the M/D/1/∞ queueing system for modeling VoIP traffic with the G.711 codec. It derives eight performance metrics of interest both theoretically and by means of simulations, enabling system performance to be accurately evaluated for different loads of users.
- A massive-scale simulation (1,000,000 packets) was implemented with actual traffic parameters from IT Partner LLC. Comparison between theoretical predictions and simulated values illustrated high agreement, giving credibility to the model for use in real-world VoIP environments.
- The findings offer actionable information about what happens to queuing behavior and waiting times across different numbers of users. This allows network operators and service providers to better adapt codec choice, resource allocation, and QoS guarantees, so that the research is an important resource for future development and growth of VoIP infrastructure.
The organization of our research is as follows: The theoretical review and related works of the main technology supporting the study is provided in Section 2. The proposed mathematical model is introduced in Section 3. The simulation algorithm and the implementation of the simulation is explained in Section 4. In Section 5, we evaluate the experimental results. Finally, the results from this research have been concluded in Section 6.
2. Background and Related Works
The massive advances in telecommunications technologies in recent decades have greatly changed how people and organizations communicate, and VoIP stands at the forefront of this process. This remarkable innovation offered real-time voice conversation over the Internet but more importantly at much lower costs than those observed with traditional circuit-switched telephony systems, with many call features greatly improved. One of the most important things to note is that VoIP can support the integration with different data services consequentially by allowing the distribution of multimedia content about voice, video, and text over one channel.
The critical consideration of the current researches, including the ones with unexpected results like those in [15], underlines that VoIP technology can support huge networks, apart from the fact that its importance for resource management will contribute to reducing the probability of call blocking. Increased VoIP utilization in education, healthcare, and corporate environments points to the fact that demanding mathematical modeling, as outlined in [16], should be done to fully investigate the traffic profiles and thus ensure that the QoS is always maintained at the highest level. Such modeling becomes critical when the organizations seek to be efficient and reliable when user demands tend to fluctuate. In this regard, further VoIP developments not only keep it as a key aspect of modern communications strategies and continue to set both a challenge and form an opportunity for the enhancement of the whole telecommunications industry when there is ever-growing global demand for services that would not only be more effective, scalable, and multi-functional[17]. For example, the representation of the VoIP systems really puts into perspective how much detailed architecture is involved and explains in-depth the crucial elements involved in actually having reliable, secure, and intact communication platforms—not just for calls. Moving increasingly deeper into the digital era, grasping and applying VoIP technology will be vital to facilitate and enable its complete functionality for day-to-day communication and business interaction.
2.1. Voice over Internet Protocol
In Voice over IP, analog voice signals transmitted are first digitized and then compressed and encoded into a stream of IP packets for transmission across IP networks to the receiver. On the receiving end, this is done through a Digital-to-Analog Converter; it processes the IP packets received to reconstruct the original analog signal sequentially. Some essential parameters on which QoS depends during data transmission, including the ITU-T codec standards for VoIP coding, help maintain and ensure efficient data compression, encoding, and decoding that optimizes the performance and reliability of VoIP communications. There are several codec standards available for VoIP services, tailored to factors such as sampling rate, data rate, and compression methods. Commonly used codecs include G.711, G.722, G.723, G.726, G.728, and G.729A. Each codec differs in key parameters, including audio quality, bandwidth requirements, computational load for transmission, coding algorithms, and encoding delay. Several studies [18,19,20] have investigated how codec selection impacts VoIP service quality, analyzing parameters, and traffic patterns on end-user and intermediary devices in wireless LAN/WAN networks. Book [21], by Cisco, provides an overview of VoIP technology: it goes over key concepts like signaling, voice compression, and how VoIP will integrate with existing network infrastructures; focuses on practical design principles and implementation strategies to ensure the deployment of reliable and scalable VoIP systems. In addition, the technology white papers [22,23], provide a comprehensive overview of fundamental traffic theory, statistical traffic models, and their application to VoIP networks, taking into account typical voice codecs such as G.711, G.729, G.726, G.723.1, and G.728, with some insight concerning bandwidth consumption and performance optimization, including each with distinct parameters based on audio quality, required bandwidth, computational demand, encoding algorithms, and encoding delay. These put together are basic references necessary to understand and enhance VoIP systems concerning theoretical modeling and practical application.
This study concentrated on the widely used codecs G.711, G.723, and G.729, with particular attention given to the G.711 codec. Using G.711, fixed-size packets of 160 bytes were transmitted to analyze and improve QoS in VoIP transmissions. As detailed in Table 1, these codecs function at standard rates but offer the possibility to configure additional parameters under specific conditions. The table lists only default values, with voice packets being regenerated every 20ms. Bandwidth consumption for voice calls was computed based on [22], providing valuable insights into how codec selection impacts bandwidth utilization and overall VoIP service quality.
2.2. Mathematical Modeling Techniques for VoIP
Good communication over VoIP networks is highly dependent on the proper modeling of user traffic since it has a great impact on the quality of service provided. Various mathematical modeling methods—Poisson processes and Markov chains—have been employed for mimicking these VoIP traffic patterns in order to help the network engineers predict and further improve the performance under several situations. For example, utility-based QoS models, as identified in [24], are able to carry out assessments of application quality when there is some form of network problem. Secondly, it identifies a distributed internet traffic generator—D-ITG—which has the ability to characterize good traffic generation that can match real patterns, therefore the effect of increasing simulation accuracy [25]. The main contribution of these mathematical approaches is to further develop theoretical models and use real data to improve understanding of the behavior of VoIP traffic in order to create plans that decrease congestion and latency and generally improve the user experience.
In Table 2 shows a structured comparison of the methods used in VoIP traffic management and analysis that summarizing methodologies, strengths, limitations and key performance metrics.
Each of these has various purposes in VoIP traffic analysis: from the theoretical modeling perspectives of Queueing Theory and Markov Chains, which familiarize the basic frameworks necessary to understand and predict network behavior; up to Network Simulation, which allows for controlled experimentation on the behavior of network traffic, with fine granularity in insight into routing, protocol performance, and other patterns in traffic. The statistical analysis uses historical data, providing predictive insights to establish the anticipation of user behavior and traffic peaking. The choice of method for the VoIP network under study depends on the specific objectives, available computation resources, and data accessibility.
2.3. Proposed Network Modeling
Network modeling is vital in designing, optimizing, and analyzing modern communication systems. It involves creating mathematical models and simulation tools to illustrate and assess network behavior under various conditions. These are networks through which engineers will be able to evaluate the measure of performance, identify the bottlenecks, and determine appropriate means of enhancing system reliability and scalability[30]. In this respect, the dual focus on the theoretical and practical aspects of network modeling ensures robust solutions for emerging communication needs. Network modeling has mathematical, simulation-based, and hybrid models. Each of them has certain uses for various purposes of analysis. In general, the mathematical models will be based on queueing theory and provide an analytical model of network behavior. M/M/1 and M/G/1 queueing models are generally implemented for packet transmission delay estimates and also in assessing system stability. These are perfect in theoretical insights but mostly lack precision in handling complex real-world scenarios.
Figure 2 [31] illustrates that typical VoIP network structure and it’s TCP/IP framework, the basic flow of UDP data in VoIP system.
In modern computer networks, the packets of information are passed through some intermediate devices that rely on the principle of store-and-forward. The packets of information are temporarily stored before being forwarded to the next destination. Thus, packets of variable lengths are formed at the end devices depending upon the actual transmission network. Further, these packets go down the stack layers where they are converted to physical signals and transmitted.
Waiting time in computer networks is the delay data packets incur while traveling from source to destination. Among the factors influencing network quality, waiting time plays a critical role and can be categorized into four types of delays and can further be classified as shown in Figure 3.
- Processing Delay (Dc) - The time a device takes (e.g., router, switch) to process packet headers and make forwarding decisions.
- Queueing Delay (Dq) - Time a packet spends waiting in a queue at a network node, for example, router or switch before processing or forwarding.
- Transmission Delay (Ds) - The time taken to transmit all bits of a packet onto the transmission medium.
- Propagation Delay (Dp) - Time taken by a signal to propagate the physical medium from one node to another.
- One node delaying time is represented by Equation 1.
Dnode=Dc+Dq+Ds
The overall end-to-end delay time between one end device and another can be viewed as in Equation 2.
The queueing delay (Dq) exhibits dynamic behavior and is, therefore, the most significant factor affecting overall network transmission quality. In this study, we focus on analyzing the queueing delay in detail.
In network devices, voice traffic arrives in turns, and with the FIFO principle, the first packet arriving gets processed first. A packet is served in the order it arrives and it might be forwarded to the next destination device right after the end of its processing. This method gives complete fairness and orderly handling to packets, which are very important in voice communications for the maintenance of QoS, where timely delivery is also one of the big parameters.
As cited above, in telecommunications, queueing theory is the most general ap-proach used in modeling packet-switched systems. Queueing theory consists of a variety of models depending on the type of incoming packets and the mechanism of ser-vice. Consider a random generation of fixed-length packets by two users, Client-1 and Client-2. These packets, after receiving service from the router or service device, at a constant rate, will be forwarded onto the output network. The systems of this type can be modelled using the M/D/1/∞ queueing model.
The first letter M in this notation indicates that the arrival packets are assumed to follow the Poisson process. It can be expressed by the following probability function in Equation 3.
Where λ represents the average arrival rate of packets per unit time, k represents the number of packets that arrive in a fixed time interval, while t refers to the duration of the time interval.
In Figure 4, the arrival rate of random packets λ and the service rate μ are shown. The incoming packets are assumed to be driven by a Poisson process, which is a discrete process, whereas the time spent on the servicing of each packet and its forwarding to the output interface is assumed to occur in this case at a constant rate. In the proposed model, when two or more packets coming in within a time interval, Δt, for which the queue forms at the output interface of the router, and then the subsequent packets are temporally stored in the output buffer, waiting for their turn for service.
These queues form based on the number of users on the network and, possibly, the service capacity of the system. If arrival rates exceed the rate at which service is provided, there could be excessive queuing, hence delay and therefore a bottleneck. This model underlines how queue formation may be dynamic regarding network load and service efficiency. Insights could therefore be gained on how network performance could be best optimized without congestion in high-traffic scenarios.
3. Mathematical Model of the M/G/1/∞
3.1. Queueing Modeling Techniques for VoIP Traffic
Queueing theory is a well-established mathematical framework that can be applied to the analysis of system performance under random arrival and service times. The M/M/1, M/G/1, and G/G/1 queues are regularly applied in VoIP modeling. This paper addresses the M/G/1 queues, emphasizing their complexity and how important scheduling is to most performance metrics, such as average response time and average slowdown. In fact, accurate parameter tuning is an important optimization of M/G/1 queues for handling traffic loads. Yu Chen [32] reveals that the M/G/1 queue model is cumbersome and maximizes performance metrics for a system, such as average response time and average slowdown. Unlike the M/M/1 queue, M/G/1 queues can accept variable service times. This increases the adaptability of QoS to the various types of traffic but, on the other hand, requires tuning to parameters for real-life traffic and meeting conditions such that metrics like packet loss and jitter remain within acceptable levels [33]. Moreover, Buranova and Kartashevskiy[34] note that M/M/1 systems generally result in packet loss and jitter due to the behavior of traffic peaks, while M/G/1 queues are more flexible with regard to service times, leading to a fairly better QoS in nature but require extreme parameters tuning in processing dynamic traffics. Furthermore, [35] confirmed that M/G/1 queues have a shorter average waiting time in comparison with M/M/1 queues and, at the same time, service becomes more flexible. The authors also found that the performance of the M/G/1 system and its management over the road traffic are to be gained via high-precision tuning of parameters. Such kinds of studies stress the adaptability and rigors of M/G/1 queues, particularly that of proper parameterization under various flow conditions. Table 4 reviews the assumptions, strengths, and limitations of the common queue models which used in VoIP traffic management.
Queueing models can be very effective in developing performance characteristics of systems subject to variable loads. This will include packet loss and delay, which will directly affect VoIP QoS. These queue models offer insights into system performance, enabling network engineers to evaluate and optimize resource allocation under different conditions of traffic.
Based on the previous studies, we highlight M/G/1/∞ queue for further implementation.
3.2. M/G/1/∞ queueing design for proposed work
The M/G/1/∞ model is characterized by the following elements:
- M-Markovian Arrival Process: The arrival of customers, for instance, data packets are truly governed by a Poisson process with exponentially distributed inter-arrival time. It is rather straightforward that the arrival rate, denoted as λ, gives the average number of customers arriving in a unit of time.
- G- General Service Time Distribution: Service time is generally distributed (not necessarily exponential or deterministic). Service rate denotes as μ defines the mean service time.
- Single-server system: the system consists of a single server, which can serve one customer at a time.
- ∞: The capacity of the queue in the model is considered to be infinite, and hence any number of customers can wait in the queue.
A general schema of the model is comprised of the arrival process where the arrival to the queue follows a Poisson distribution. The arriving customers wait in the queue if the server is busy. Then there is the service process, which is one customer at a time served for a deterministic service duration by the server. Finally, the serviced customers enter the leaving action through the departure process. The flow of the system could be viewed as:
Arrival(λ) → [Queue] → [Server(μ)] → Departure
Here, M stands for a Poisson distribution given that λ is the rate, i.e., the average number of packets arriving within a fixed time interval per unit of time. G is the service process and represents the first packet in queue at time t receives service with an average duration of s. The 1 here is indicating that there is only one server serving the customers and service times are arbitrarily distributed with known mean and variance.
The average time can be calculated using the formula of Pollaczek-Khinchin (PK) expressed in Equation 4.
E[S] - Average time spent in service at the server; it can be interpreted as the expected remaining service time (unfinished work in the server) at an arbitrary instant t. If the system is idle, unfinished work, R=0.
E[Lq]: The average number of packets waiting in the buffer.
E[S]: The average service time per packet.
Little's equation states that the product of the average packet arrival rate, and the average time a packet spends in the system is equal to the average number of packets in the system[36]. Mathematically, it is shown in Equation 5.
Again, this relationship acts as a basis for the analyses of the performance of any system by relating the arrival rate with the waiting times and queue lengths.
By substituting into Equation (4), the following results are obtained:
Here, in Equation 6, λ is the average arrival rate of packets and ρ: is the utilization of the server (service utilization coefficient).
The average waiting time in the queue is expressed as:
By calculating the area of the right triangle in Figure 5, the average time can be determined, which also includes accounting for the idle time (inter-arrival time S).
The model for calculating E[R], the average remaining time, is formulated as follows.
According to Little's formula, the arrival rate λ is assumed by , and for the second moment of the service time E[S2], it is expressed as (9)
Thus, the final consequence for the average waiting time in the queue becomes (10).
According to the theory of mathematical statistics and probability, the variance of the service time S, Var[S] and C2 respectively,
Var[S]=E[S2]-(E[S])2
, C2=V[S]/E[S]2
Here, E[Ws] represents the average waiting time in the system.
If the number of packets waiting in the system and buffer is deterministic, it can be estimated as discussed earlier, according to Little's formula:
Where, E[Ls] represents the average number of packets in the system: both queue and server, λ means average arrival rate. E[Ws] is the average waiting time in the system.
Similarly, for the queue:
Where, E[Lq] is the average number of packets in the queue, and E[Wq] is the average waiting time in the queue, the formulas are derived respectively. These relationships form a basis for the analysis of queueing system performance.
Since the rate of transmission is taken to be a constant in our study, the model changes from M/G/1/∞ to M/D/1/∞. For the special case in our model where the variance is taken as zero, the model is as follows and for the M/D/1/∞model schematically presented in Figure 4, the objective is to define the following 8 parameters.
- E[Ls] - Average number of packets in the system.
- E[Lq] - Average number of packets in the queue.
- E[Ws] - Weighted average packet waiting time in the system.
- E[Wq] - The average waiting time of a packet in the queue.
- Var[Ls] - The variance of the number of packets in the system.
- Var[Lq] - Variance in the number of packets in the queue.
- Var[Ws] - The variance of the waiting time of packets in the system.
- Var[Wq] - It refers to the variance in the waiting time of packets that are in the queue.
These will be the parameters that will base the analyses on the performance of the system under conditions assumed.
The standard deviation is calculated by the square root of the value of the variance.
In the particular case in which the service time is considered constant, equations (12) to (15) above take the form:
These equations, in the M/D/1/∞ model, return the simplifications associated with the assumption of deterministic service times. The formulae derived in (16), (17), (18), and (19) represent the fundamental solutions of our model. For our purpose of studies of VoIP services, performance of this system depends not only on numbers of packets in a queue and waiting times but more important is the dispersion of these four main performance measures of this system. Hence, a major aim of this project is to theoretically and simulatedly calculate the variances and compare these four parameters. As can be seen from the reference[37], the theoretical variances of the four parameters are deduced from the following.
Where, x packet.
Where, x packet.
We will implement a simulation program in Python that calculates the parameters defined by the above eight equations. Later, the values obtained from this simulation would be compared to the theoretically calculated values in order to check for their consistency and also validate this model.
4. Simulation algorithm and Experiments
The experiments of this study were made based on the data obtained from IT Partner LLC. The samples of traffic were transmitted under wired network conditions with a 10 Mbps connection, using intermediary devices and the G.711 codec. The data gathered condition revealed in Figure 1, experimental LAN Switch model was TP-Link TL-SG1024D 24-Ports Gigabit Ethernet Switch, and the internet speed at gateway was 10Mbps.
The following statistical parameters declared in Table 5 were determined using the Wireshark tool.
Packet size is considered by the following equation (24), where 14 bytes is the header size of the layer 2-Datalink, 20 bytes is the header size of the IP layer, 8 for the header size of the UDP protocol, 12 for the header size of the RTP.
Payload=14+20+8+12+160=214 bytes
This study assumes that Poisson-type discrete voice packets with fixed packet sizes are incoming. Equation (25) considers the situation when no packets arrive at a particular moment, i.e., when k = 0 from Equation (3).
When, k>=1,
As seen in equation (26), the CDF depends on the time between randomly arriving packets. Although the time between packets is a random variable, it is specified in the foundational research that it follows an exponential distribution. Therefore, we aim to express the time between packets using a random number generator of the uniform type by performing an inverse transformation of the exponential distribution function.
Using the uniform distribution random function as shown in equation (27), the random time t with an exponential distribution parameterized by λ can be obtained through simulation. The service time or the time to process a packet is constant, and the time between incoming packets is defined by the inverse exponential formula (27) in our case.
Table 6 shows the parameters used to compare the simulation and theoretical calculations. These parameters were calculated based on the technological parameters of the G.711 codec for speech, which were discussed in the previous section.
Table 7 shows the size of the control and management fields for the physical and datalink layers in bytes.
In Table 8, the parameters ρ, μ, and λ were utilized in both the theoretical and simulation models, with the outcomes being compared in the table's final four columns. The simulation was executed using Python, and the results were computed and compared against theoretical values derived from equations (12) and (13).
In Table 8, the model is based on the condition ρ<1. The service is assumed to operate at a constant rate, and incoming packets are considered as a Poisson process.
- When ρ<1 indicates that each incoming packet can be served.
- When ρ=1, it begins a critical phase for the packets.
- When ρ>1, stability is not achieved, and packet loss occurs.
In the experiment, Client-1 and Client-2 receive voice services encoded with the G.711 codec, while other users (except Client-1 and Client-2) may be engaged in different activities, such as downloading files from the internet, browsing the web, or watching videos. In this scenario, we implemented the model in a simulated environment.
For the first time, we compared and studied following four parameters— Lq-Theoretical, Lq -Simulation, Ls-Theoretical, and Ls-Simulation—specifically for an environment with 50 users.
In Figure 7, the parameters express that the number of packets in the system (Ls-theoretical, Ls-simulation), the number of packets in the system’s buffer system waiting time (Ws-theoretical, Ws-simulation), queue waiting time (Wq-theoretical, Wq-simulation), the number of packets in the system (Ls-theoretical, Ls-simulation), the number of packets in the system’s buffer (Lq-theoretical, Lq-simulation). In Figure 6.a, the simulation results were compared with the theoretical values for Ls and Lq, the two parameters exhibit an increasing trend as the number of users grows. However, the simulation and theoretical values align perfectly with each other. As seen in Figure 6.b, the waiting times in the system and in the buffer show an increasing trend as the number of users grows. However, the theoretical and simulation values are identical.
In Figure 7, the parameters illustrate that the standard deviation of the system waiting time (STD_Ws-theoretical, STD_Ws-simulation), the standard deviation of the queue waiting time (STD_Wq-theoretical, STD_Wq-simulation), the standard deviation of the number of packets in the system (STD_Ls-theoretical, STD_Ls-simulation), and the standard deviation of the number of packets in the queue (STD_Lq-theoretical, STD_Lq-simulation). As seen in Figure 7.a, the waiting times in the system and in the buffer show an increasing trend as the number of users grows. However, the theoretical and simulation values are identical and in Figure 7.b, the dispersion of the number of packets in the system and buffer shows minimal difference.
The data from Table 8 was analyzed to produce the results depicted in Figure 6 and Figure 7. Figure 6 presents a comparison of the system's waiting time, as derived from the theoretical model and simulation values implemented in Python. As shown in Figure 7, the difference between the theoretical model and the simulation outcomes is minimal, with a high correlation coefficient of corr=0.994777. Figure 7.b compares the waiting time in the packet buffer for the experimental model under consideration using both simulation and theoretical models. The correlation coefficient between the simulation results and the theoretical model was determined to be correlation=0.96.
5. Results and Discussion
This section presents the comparative analysis of theoretical computations and simulated results based on modeling traffic of VoIP users by utilizing the M/D/1/∞ queueing model. It was evaluated on eight performance measures in user environments between 1 to 50 users. Simulations were conducted on 1,000,000 packets based on traffic data from IT Partner LLC under controlled environments with the use of the G.711 codec. Poisson distribution was used to model inter-arrival times, and it was assumed that service rate was constant, according to assumptions made in the M/D/1/∞ model.
As shown in Figure 6, there was a similar growth trend with an increase in the number of users for both theoretical and simulated values representing the number of packets in the system (Ls) and in the queue (Lq). Particularly, there was significant congruence between simulation values and theoretical predictions, validating that the queueing model accurately captures VoIP traffic dynamics among users. Figure 6(b) reveals system (Ws) and queue (Wq) waiting times. Differences between theoretical values and simulations were minimal, with maximum deviation taking place under heavy loads (ρ close to 1). The correlation coefficient of 0.9948 between the simulation values and theoretical system waiting time further confirmed the strength of the model.
The study was more extended to observe the standard deviation (STD) and variability of the four primary performance metrics: Ls, Lq, Ws, and Wq. Figure 7 demonstrates the minimal dispersion differences between simulated and theoretical values, showing high reliability of the model despite varying traffic conditions. Standard deviation correlation of 0.96 for queue waiting time highlights accuracy of the model in representing real-world variation.
Based on the experimental study of the inter-arrival times between packets, we can conclude that an exponential form exists in the distribution. Therefore, a comparison of experimental and theoretical distributions is depicted in the following figure.
Figure 8 presents the Cumulative Distribution Function (CDF) of an Inter-Arrival Time (IAT) of captured packets in a client's computer using Wireshark. One can observe that the resulting distribution is similar to the exponential distribution.
The results have practical implications for codec selection and network resource planning. Furthermore, the close match between the theoretical and the simulated output maintenances future use of models such as M/D/1/∞ in evaluating VoIP systems.
6. Conclusions
The increasing use of Voice over Internet Protocol (VoIP) technology requires an understanding of how users behave and how traffic patterns change. As smartphones and internet connections become more common, determining VoIP user traffic is essential for improving network performance and ensuring good service quality. This paper reveals different mathematical modeling techniques that could describe VoIP traffic, considering the accuracy of the models for predicting users' behavior and resource utilization. It is based on findings from previous studies coupled with ongoing simulation methodologies that the study will outline how critical mathematical modeling is in enhancing network infrastructure and service provision.
In this study, we tested and compared the theoretical and simulation results of eight parameters at both theoretical and simulation levels for environments with 1 to 5 users using the M/D/1/∞ model with 1,000,000 packets. When the experiment was conducted in a deterministic service environment with a Poisson-type input, the theoretical and simulation values were very close, and only minor changes were observed in the standard deviation. The fact that the standard deviations of waiting times all overlapped suggests that this is attributable to the M/D/1/∞ model. Further research examining the distribution under the Pareto type would be important.
Eventually, it is observed that there is a need for the development of math modeling in order to come up with better VoIP services; thus, the research shall be directed toward increasing quality and reliability in users' experiences. Such backlog in fulfilling the ever-evolving needs in VoIP technologies can only be met by working on the enhancement of modeling and simulation techniques.
Author Contributions
Conceptualization, U.Kh. and D.Ya.; methodology, D.Ya.; software, D.Ya.; validation, U.Kh., E.T., and D.Ya.; formal analysis, E.T.; resources, O.L.; data curation, D.Ya.; writing—original draft preparation, U.Kh.; writing—review and editing, U.Kh. and D.Ya; supervision, D.Ya. and H.P.; project administration, D.Ya.; funding acquisition, H.P. All authors have read and agreed to the published version of the manuscript.”
Funding
This research was supported by KOICA (Korea International Cooperation Agency) through the "Capacity Building Project for the School of Information and Communication Technology at Mongolian University of Science and Technology in Mongolia" (Contract No. P2019-00124).
Data Availability Statement
The original contributions presented in the study are included in the article, further inquiries can be directed to the corresponding authors.
Acknowledgments
We would like to express our sincere gratitude to Intelligent Technology Partner LLC for their valuable support during the data collection phase of this study. In particular, we are deeply thankful to Mr. Khunbish Nyamsuren, Chief Technology Officer (CTO), for his generous assistance.
Conflicts of Interest
The authors declare no conflicts of interest.
References
- Petrosyan, A. Internet Usage Worldwide; Statista.com, 2024; p. 68.
- Candela, M.; Luconi, V.; Vecchio, A. Impact of the COVID-19 Pandemic on the Internet Latency: A Large-Scale Study. Computer Networks 2020, 182, 107495. [Google Scholar] [CrossRef] [PubMed]
- Adhilaksono, B.; Setiawan, B. A Study of Voice-over-Internet Protocol Quality Metrics. Procedia Computer Science 2022, 197, 377–384. [Google Scholar] [CrossRef]
- Goode, B. Voice over Internet Protocol (VoIP). Proc. IEEE 2002, 90, 1495–1517. [Google Scholar] [CrossRef]
- Washima Tuleun Design of an Asterisk-Based VoIP System and the Implementation of Security Solution across the VoIP Network. World J. Adv. Res. Rev. 2024, 23, 875–906. [CrossRef]
- Kaur, S.; Singh, P.; Tripathi, V.; Kaur, R. Recent Trends in Wireless and Optical Fiber Communication. Global Transitions Proceedings 2022, 3, 343–348. [Google Scholar] [CrossRef]
- Jalendry, S.; Verma, S. A Detail Review on Voice over Internet Protocol (VoIP). IJETT 2015, 23, 161–166. [Google Scholar] [CrossRef]
- Shaw, U.; Sharma, B. A Survey Paper on Voice over Internet Protocol (VOIP). IJCA 2016, 139, 16–22. [Google Scholar] [CrossRef]
- Ali Jaish, A.; Al-Shammari, B.K.J. QUALITY OF EXPERIENCE FOR VOICE OVER INTERNET PROTOCOL (VoIP). ejuow 2023, 11, 96–105. [Google Scholar] [CrossRef]
- Communications Regulatory Commission Key indicators of licensed telecommunication service providers in Mongolia, First Half of 2024; 2024; p. 22;
- Joshi, S. 50 VoIP Statistics to Reveal the Future of Phone Systems 2024.
- Anthony, J. 75 Key VoIP Statistics: 2024 Data Analysis & Market Share 2024.
- Aftab, N.; Hassan, M.; Ashraf, M.N.; Patel, A. Performance Evaluation of G.711 and GSM Codecs on VoIP Applications Using OSPF and RIP Routing Protocols. In 2nd International Conference on Wireless Intelligent and Distributed Environment for Communication; Woungang, I., Dhurandher, S.K., Eds.; Lecture Notes on Data Engineering and Communications Technologies; Springer International Publishing: Cham, 2019; ISBN 978-3-030-11436-7. [Google Scholar]
- Prajwala, J.; Mathew, R.; Taj, N. Analysis of VoIP Traffic over LTE for Different Codecs. In Proceedings of the 2018 3rd IEEE International Conference on Recent Trends in Electronics, Information & Communication Technology (RTEICT); IEEE: Bangalore, India, May 2018; pp. 1858–1862. [Google Scholar]
- Al Ajarmeh, I. Stochastic Modeling and Time-To-Event Analysis of VoIP Traffic, DePaul University, 2013.
- Madi, N.K.M.; Othman, M. Optimizing Service Differentiation Scheme with Sized-Based Queue Management in DiffServ Networks 2012.
- Nazih, W.; Elkilani, W.S.; Dhahri, H.; Abdelkader, T. Survey of Countering DoS/DDoS Attacks on SIP Based VoIP Networks. Electronics 2020, 9, 1827. [Google Scholar] [CrossRef]
- Brak, S.E.; Bouhorma, M.; El Brak, M.; Bohdhir, A. Speech Quality Evaluation Based Codec for VoIP Over 802.11P. IJWMN 2013, 5, 59–69. [Google Scholar] [CrossRef]
- Alsahlany, A.M. Performance Analysis of VOIP Traffic Over Integrating Wireless LAN and WAN Using Different Codecs. IJWMN 2014, 6, 79–89. [Google Scholar] [CrossRef]
- Daengsi, T.; Yochanang, K.; Wuttidittachotti, P. A Study of Perceptual VoIP Quality Evaluation with Thai Users and Codec Selection Using Voice Quality - Bandwidth Tradeoff Analysis. In Proceedings of the 2013 International Conference on ICT Convergence (ICTC); IEEE: JEJU ISLAND, Korea (South), October, 2013; pp. 691–696. [Google Scholar]
- Davidson, J.; Peters, J.; Bhatia, M.; Kalidindi, S.; Mukherjee, S. Voice over IP Fundamentals (2nd Edition) (Fundamentals); Cisco Press, 2006; ISBN 1-58705-257-1.
- Cisco Systems, Inc. Modify Bandwidth Consumption Calculation for Voice Calls.
- Cisco Systems, Inc. Available online: https://www.cisco.com/c/en/us/td/docs/ios/solutions_docs/voip_solutions/TA_ISD.html (accessed on 21 September 2024).
- Mu, M.; Mauthe, A.; Garcia, F. A Utility-Based QoS Model for Emerging Multimedia Applications. In Proceedings of the 2008 The Second International Conference on Next Generation Mobile Applications, Services, and Technologies; IEEE: Cardiff, United Kingdom, 2008; pp. 521–528. [Google Scholar]
- Avallone, S.; Emma, D.; Pescapé, A.; Ventre, G. Performance Evaluation of an Open Distributed Platform for Realistic Traffic Generation. Performance Evaluation 2005, 60, 359–392. [Google Scholar] [CrossRef]
- Dshalalow, J.H. Advances in Queueing Theory, Methods; 1st (Eds.) ; CRC Press: Boca Raton, 2023; ISBN 978-1-00-341828-3.
- Kravets, O.J.; Shaytura, S.V.; Minitaeva, A.M.; Atlasov, I.V. Analysis of Routing Processes in Telecommunication Networks with Unsteady Flows Using Markov Processes. IOP Conf. Ser.: Mater. Sci. Eng. 2020, 862, 052005. [Google Scholar] [CrossRef]
- Smera, C.; Sandeep, J. Networks Simulation: Research Based Implementation Using Tools and Approaches. In Proceedings of the 2022 IEEE 3rd Global Conference for Advancement in Technology (GCAT); IEEE: Bangalore, India, October 7, 2022; pp. 1–7. [Google Scholar]
- Xi, B.; Chen, H.; Cleveland, W.S.; Telkamp, T. Statistical Analysis and Modeling of Internet VoIP Traffic for Network Engineering. Electron. J. Statist. 2010, 4. [Google Scholar] [CrossRef]
- Jafri, S.T.A.; Ahmed, I.; Ali, S. Queue-Buffer Optimization Based on Aggressive Random Early Detection in Massive NB-IoT MANET for 5G Applications. Electronics 2022, 11, 2955. [Google Scholar] [CrossRef]
- Butcher, D.; Li, X.; Guo, J. Security Challenge and Defense in VoIP Infrastructures. IEEE Trans. Syst., Man, Cybern. C 2007, 37, 1152–1162. [Google Scholar] [CrossRef]
- Chen, Y. Comparing the Influencing Factors of M/G/1 Performance Indices in Queuing Theory across Different Scheduling Approaches. ACE 2024, 46, 136–142. [Google Scholar] [CrossRef]
- Kim, K. Finite-Buffer M/G/1 Queues with Time and Space Priorities. Mathematical Problems in Engineering 2022, 2022, 1–30. [Google Scholar] [CrossRef]
- Povolzhskiy State University of Telecommunications and Informatics; Buranova, M. A.; Kartashevskiy, V.G.; Povolzhskiy State University of Telecommunications and Informatics G/G/1 Queue Analysis for Openflow Software Defined Networks. T-Comm 2022, 16, 4–13. [Google Scholar] [CrossRef]
- Tarasov, V.N.; Bakhareva, N.F. COMPARATIVE ANALYSIS OF TWO QUEUING SYSTEMS M/HE2/1 WITH ORDINARY AND WITH THE SHIFTED INPUT DISTRIBUTIONS. RIC 2019, 0, 50–58. [Google Scholar] [CrossRef]
- El-Taha, M.; Stidham, S. Little’s Formula and Extensions. In Sample-Path Analysis of Queueing Systems; International Series in Operations Research & Management Science; Springer US: Boston, MA, 1999; ISBN 978-1-4613-7620-0. [Google Scholar]
- Zaiontz, C. M/D/1 Queueing Model Available online:. Available online: https://real-statistics.com/probability-functions/queueing-theory/m-d-1-queueing-model/ (accessed on 15 July 2024).
Figure 1.
Network interface of our proposed scheme.
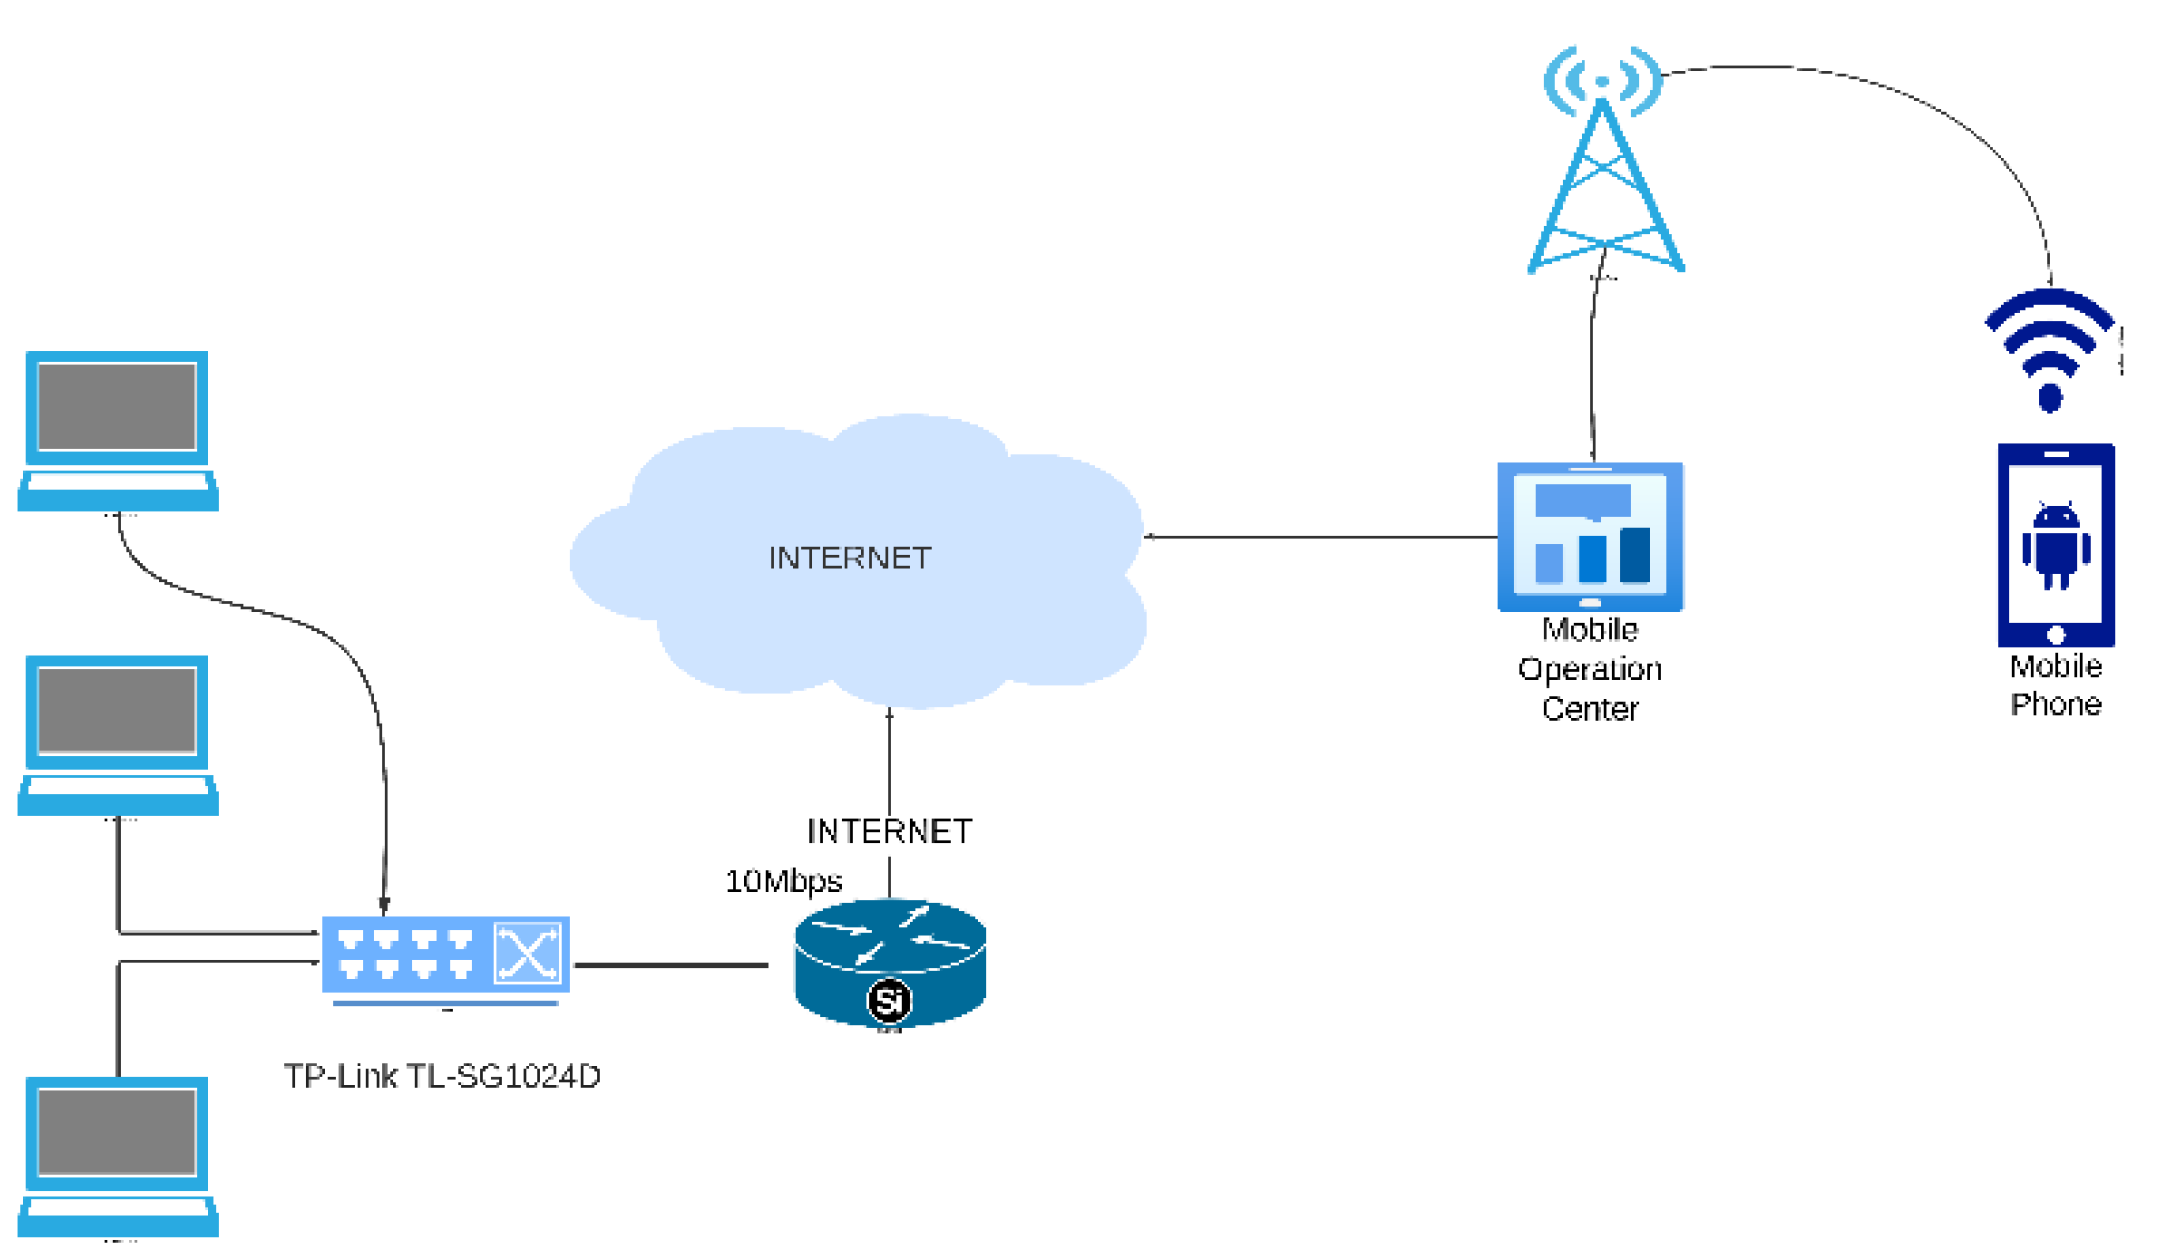
Figure 2.
VoIP Infrastructures[31]: (a) Typical VoIP network structure; (b) Voice data processing of the VoIP.
Figure 2.
VoIP Infrastructures[31]: (a) Typical VoIP network structure; (b) Voice data processing of the VoIP.
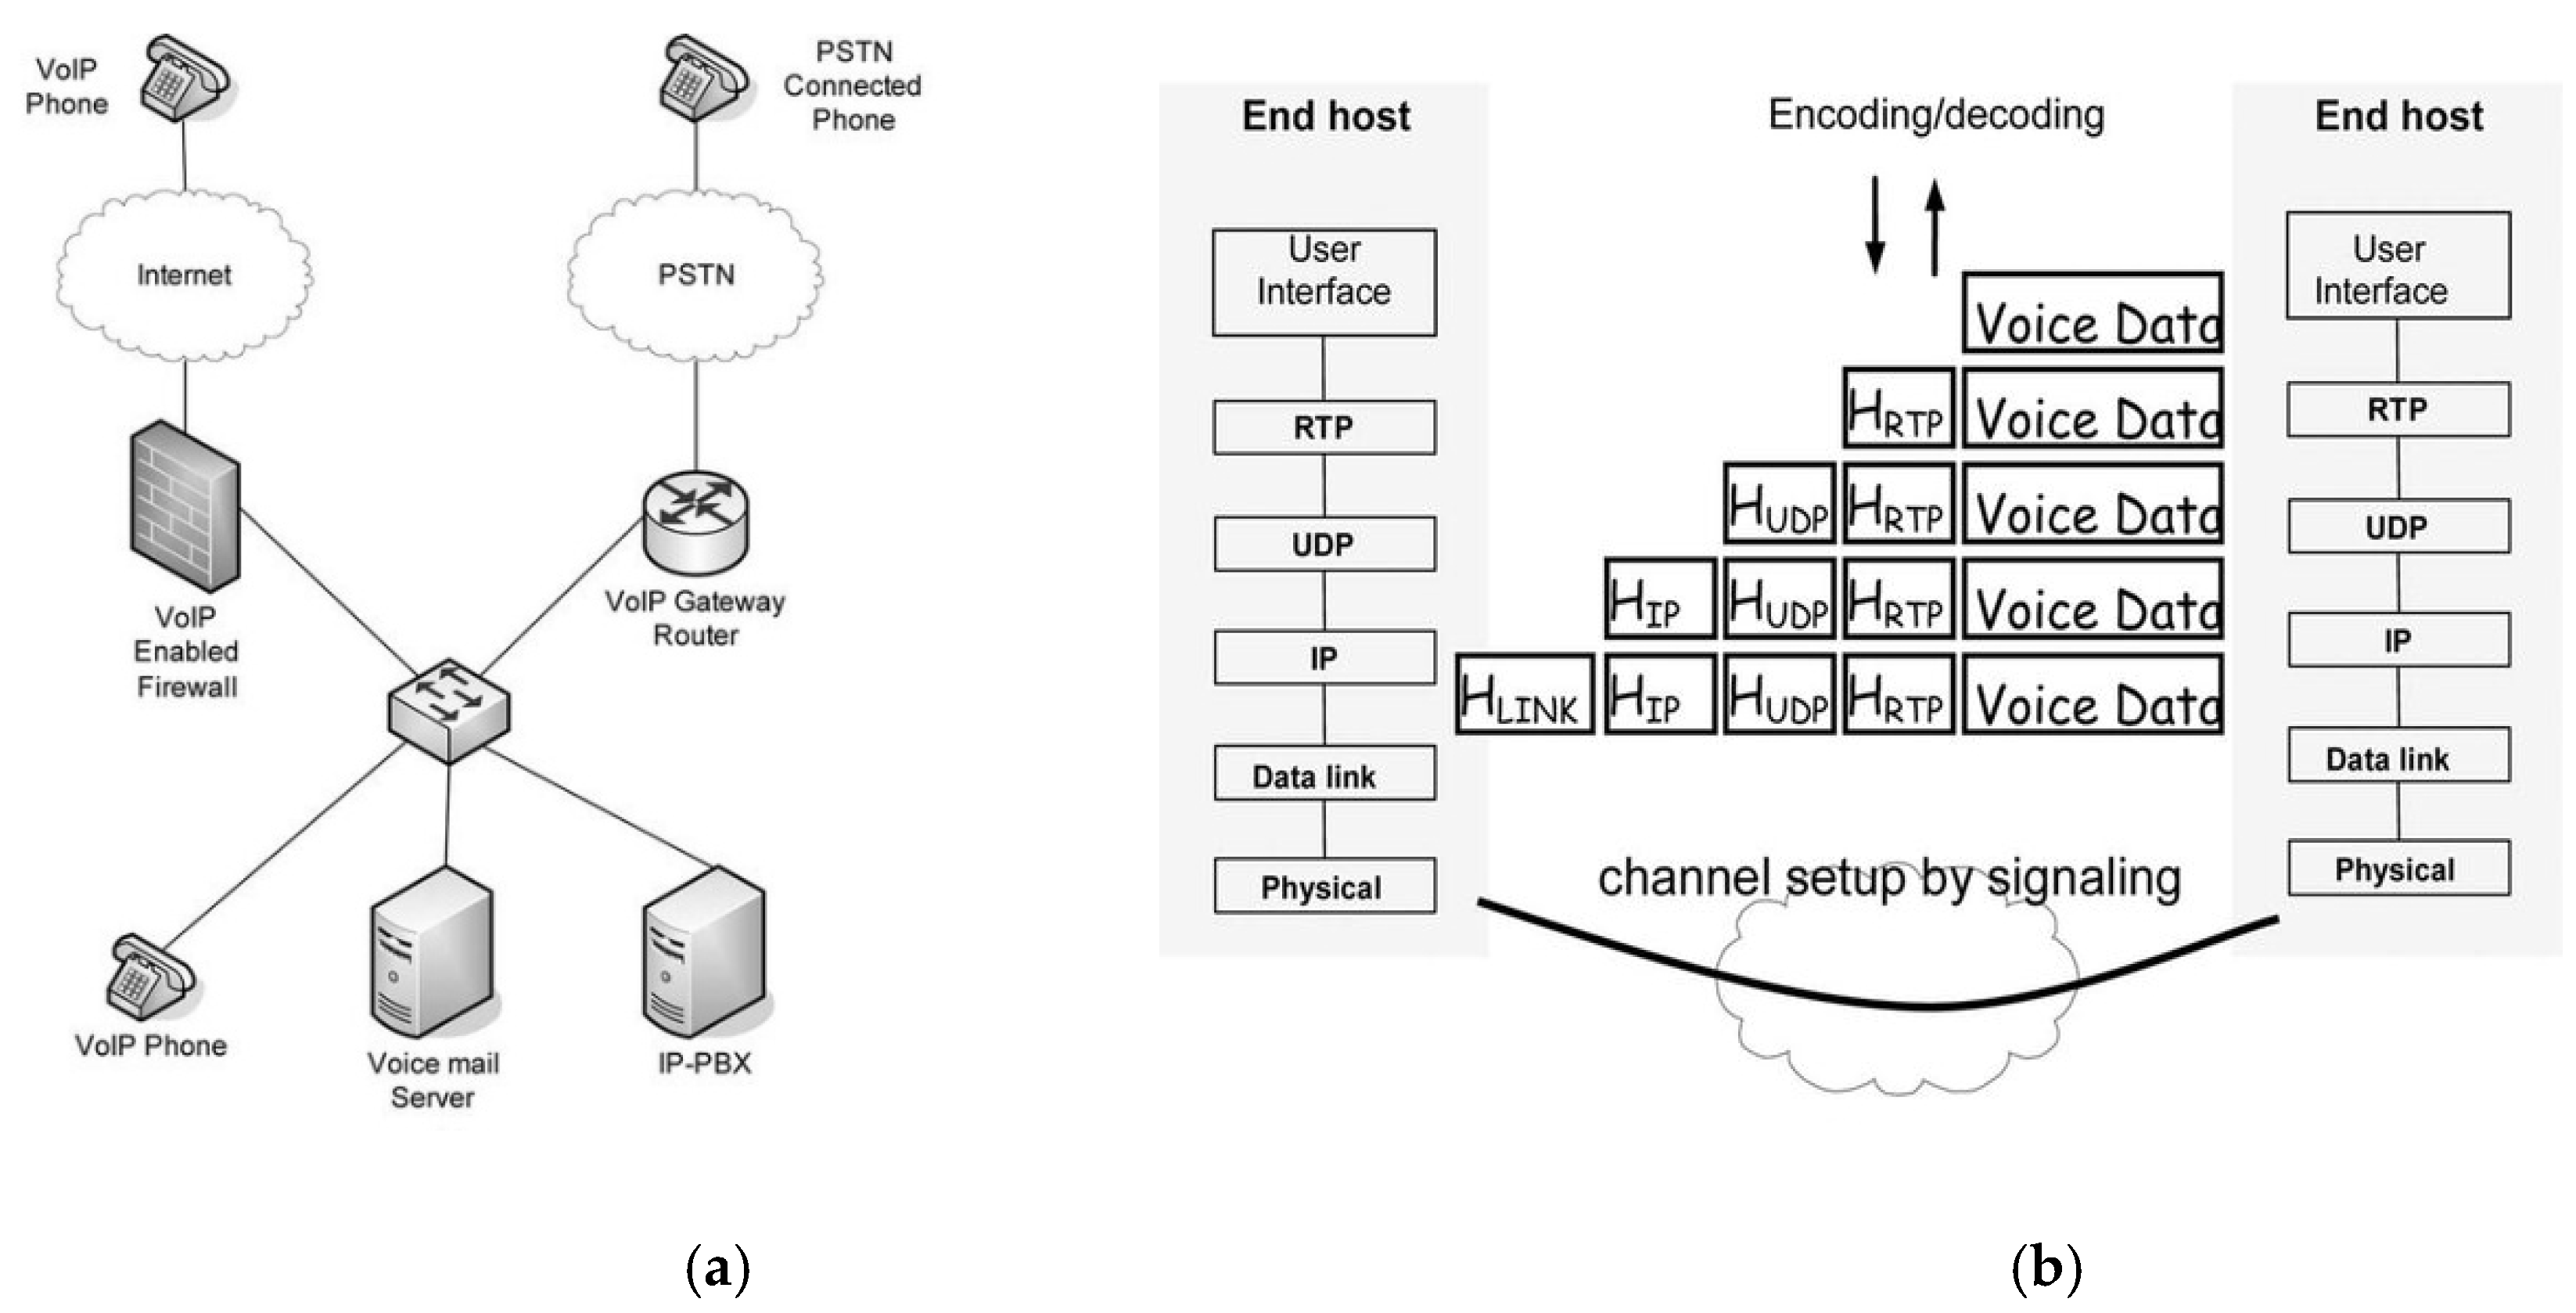
Figure 3.
Types of networks delaying time.
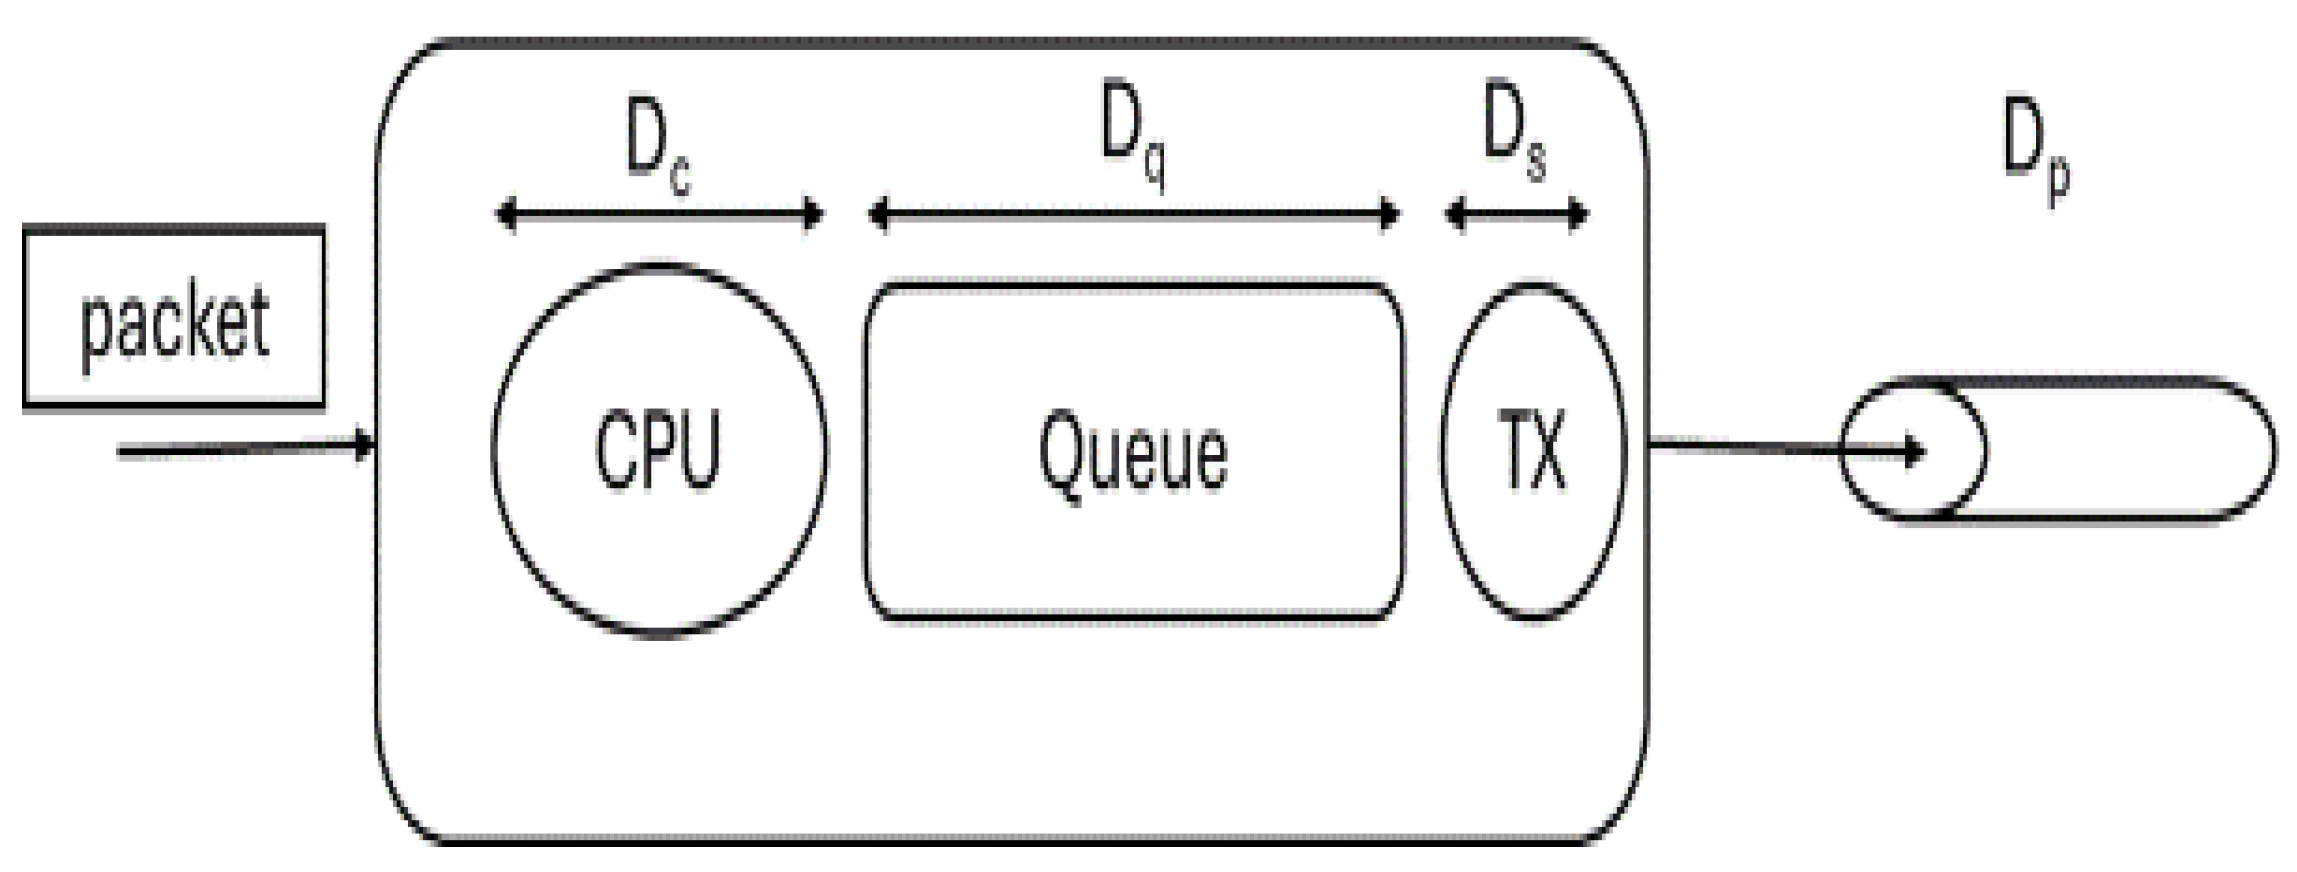
Figure 4.
General schematic of the M/D/1/∞ model.
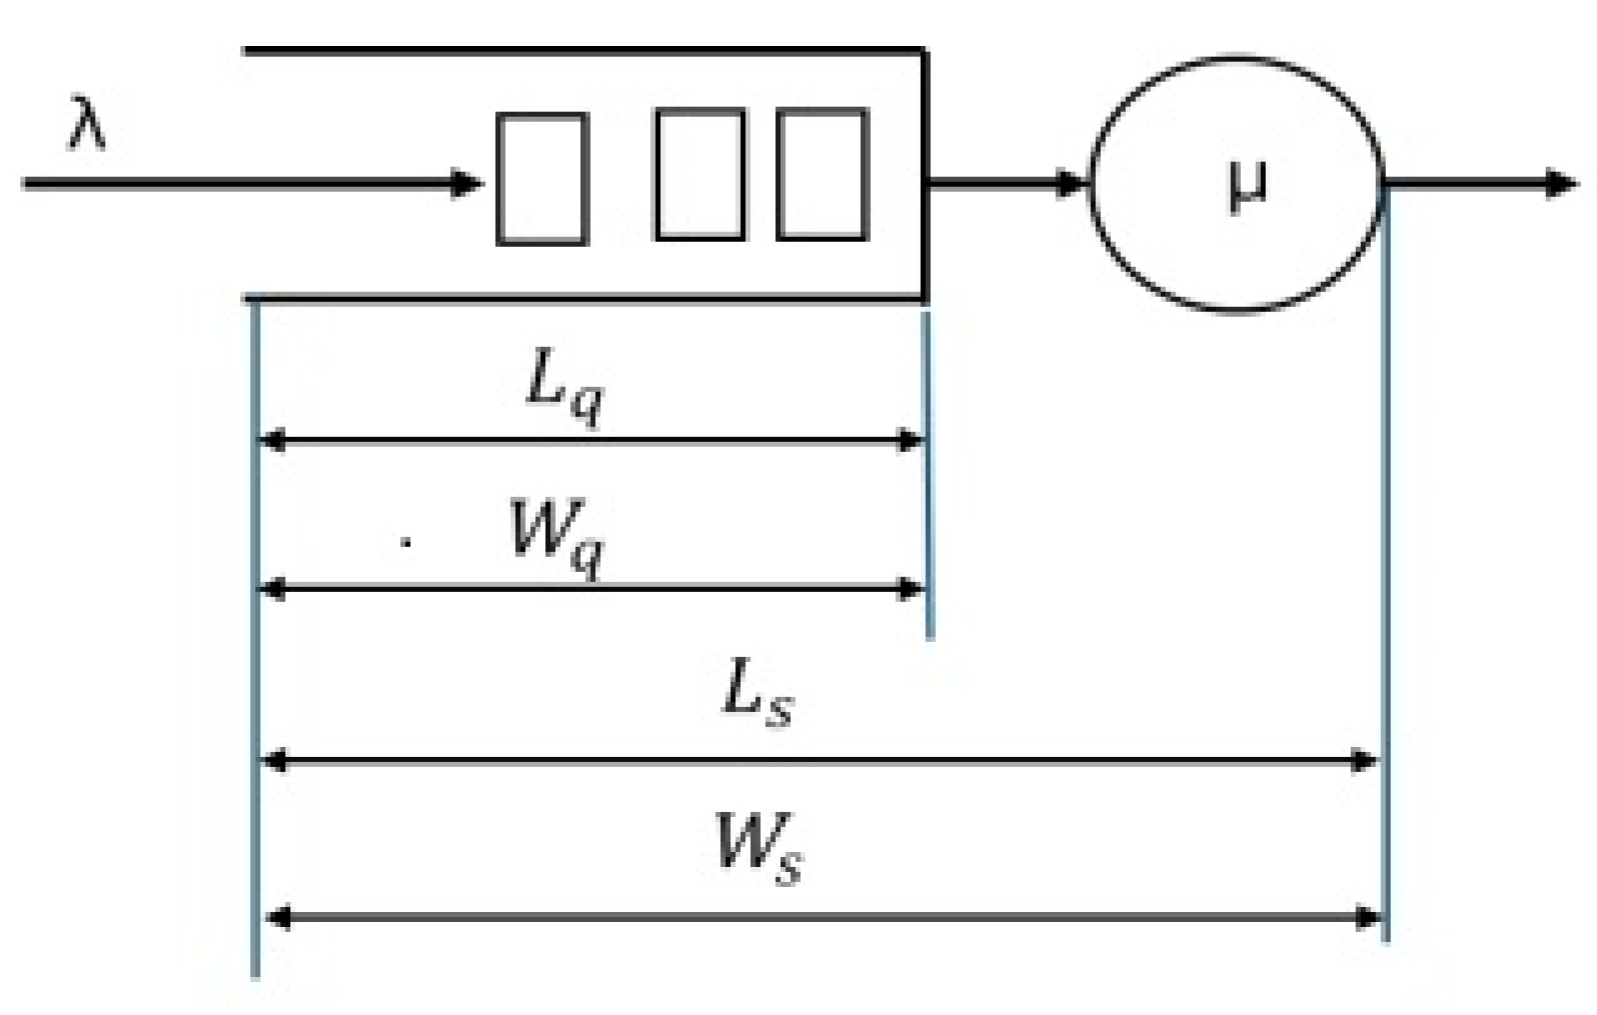
Figure 5.
E[R] inter-arrival time.
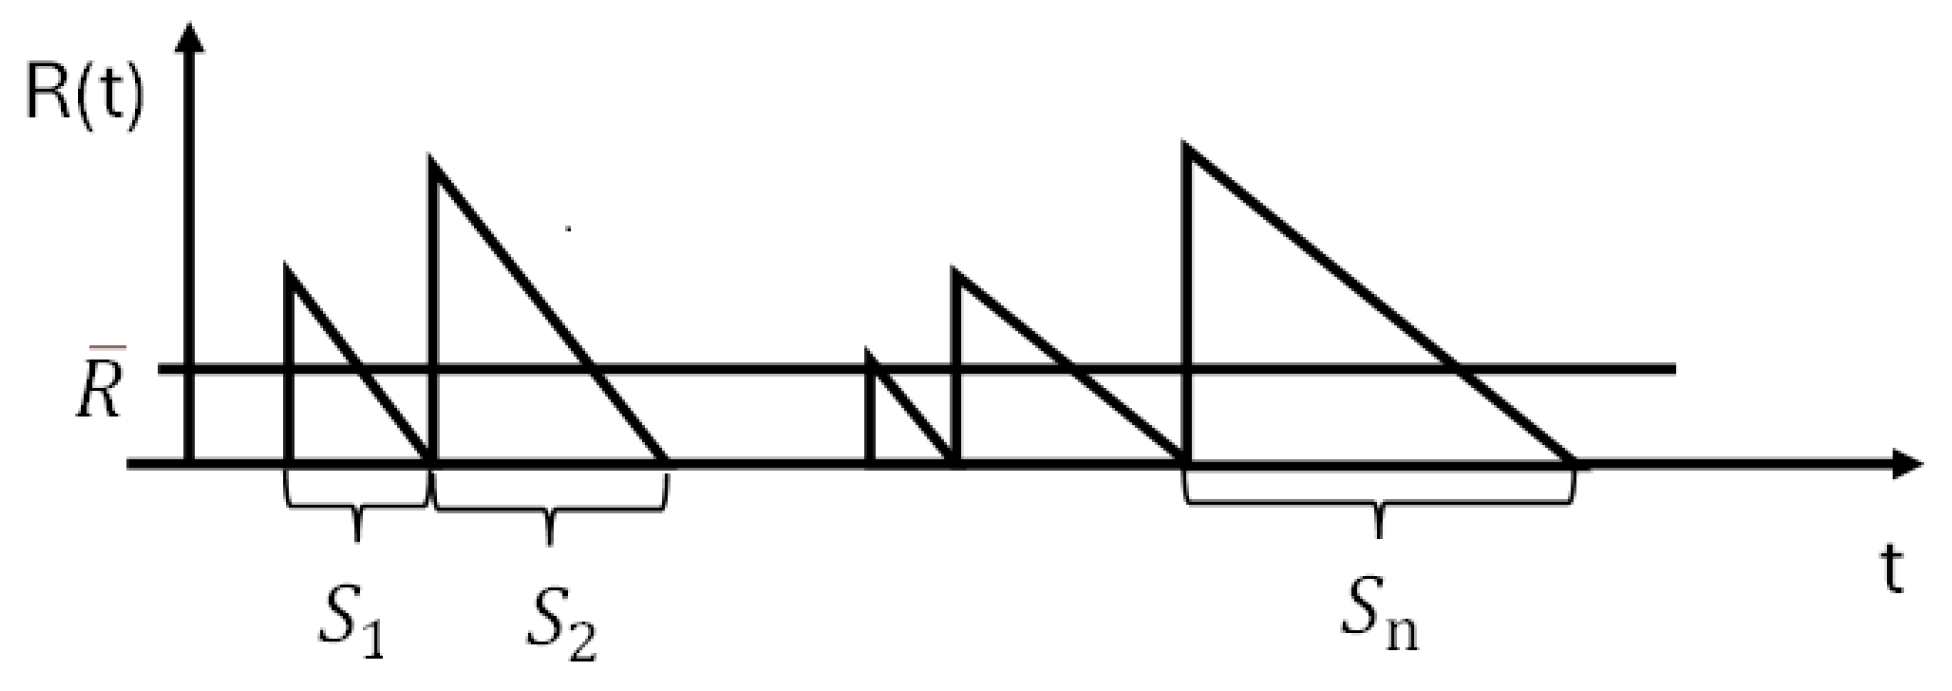
Figure 6.
The experiment comparison of the simulation and theoretical values in 50 users (a) the number of packets in the system and the system’s buffer; (b) Waiting time in the system and in the buffer.
Figure 6.
The experiment comparison of the simulation and theoretical values in 50 users (a) the number of packets in the system and the system’s buffer; (b) Waiting time in the system and in the buffer.
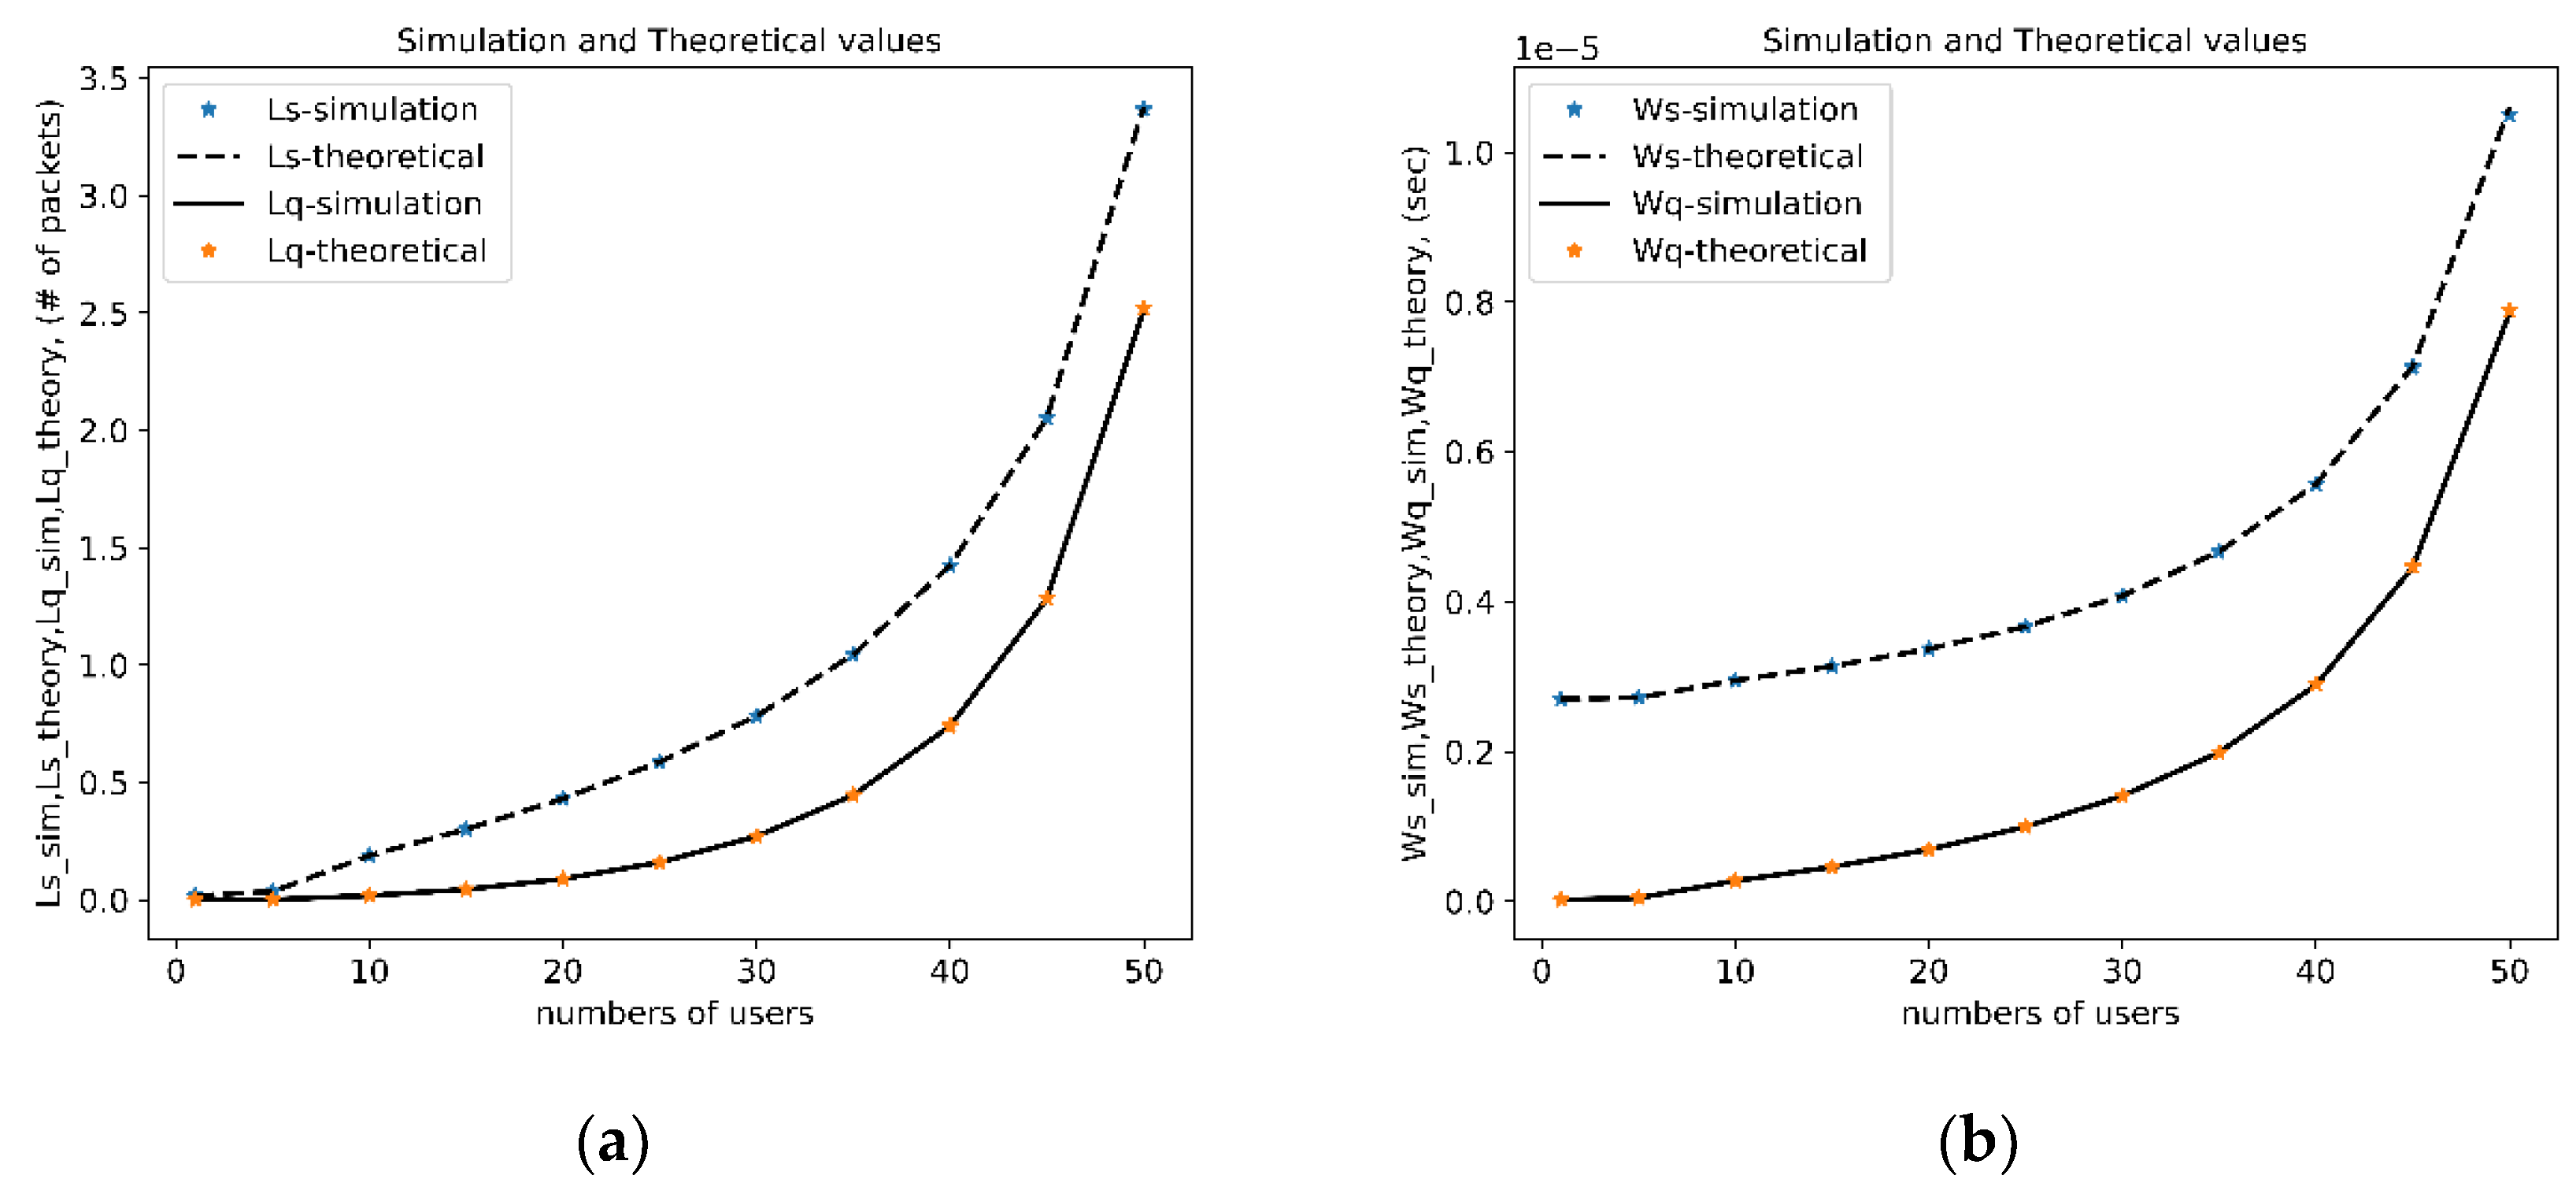
Figure 7.
The experiment comparison of the simulation and theoretical values in 50 users: (a) Dispersion of packets in the system and buffer; (b) Standard deviations of the waiting times of packets in the system and buffer.
Figure 7.
The experiment comparison of the simulation and theoretical values in 50 users: (a) Dispersion of packets in the system and buffer; (b) Standard deviations of the waiting times of packets in the system and buffer.
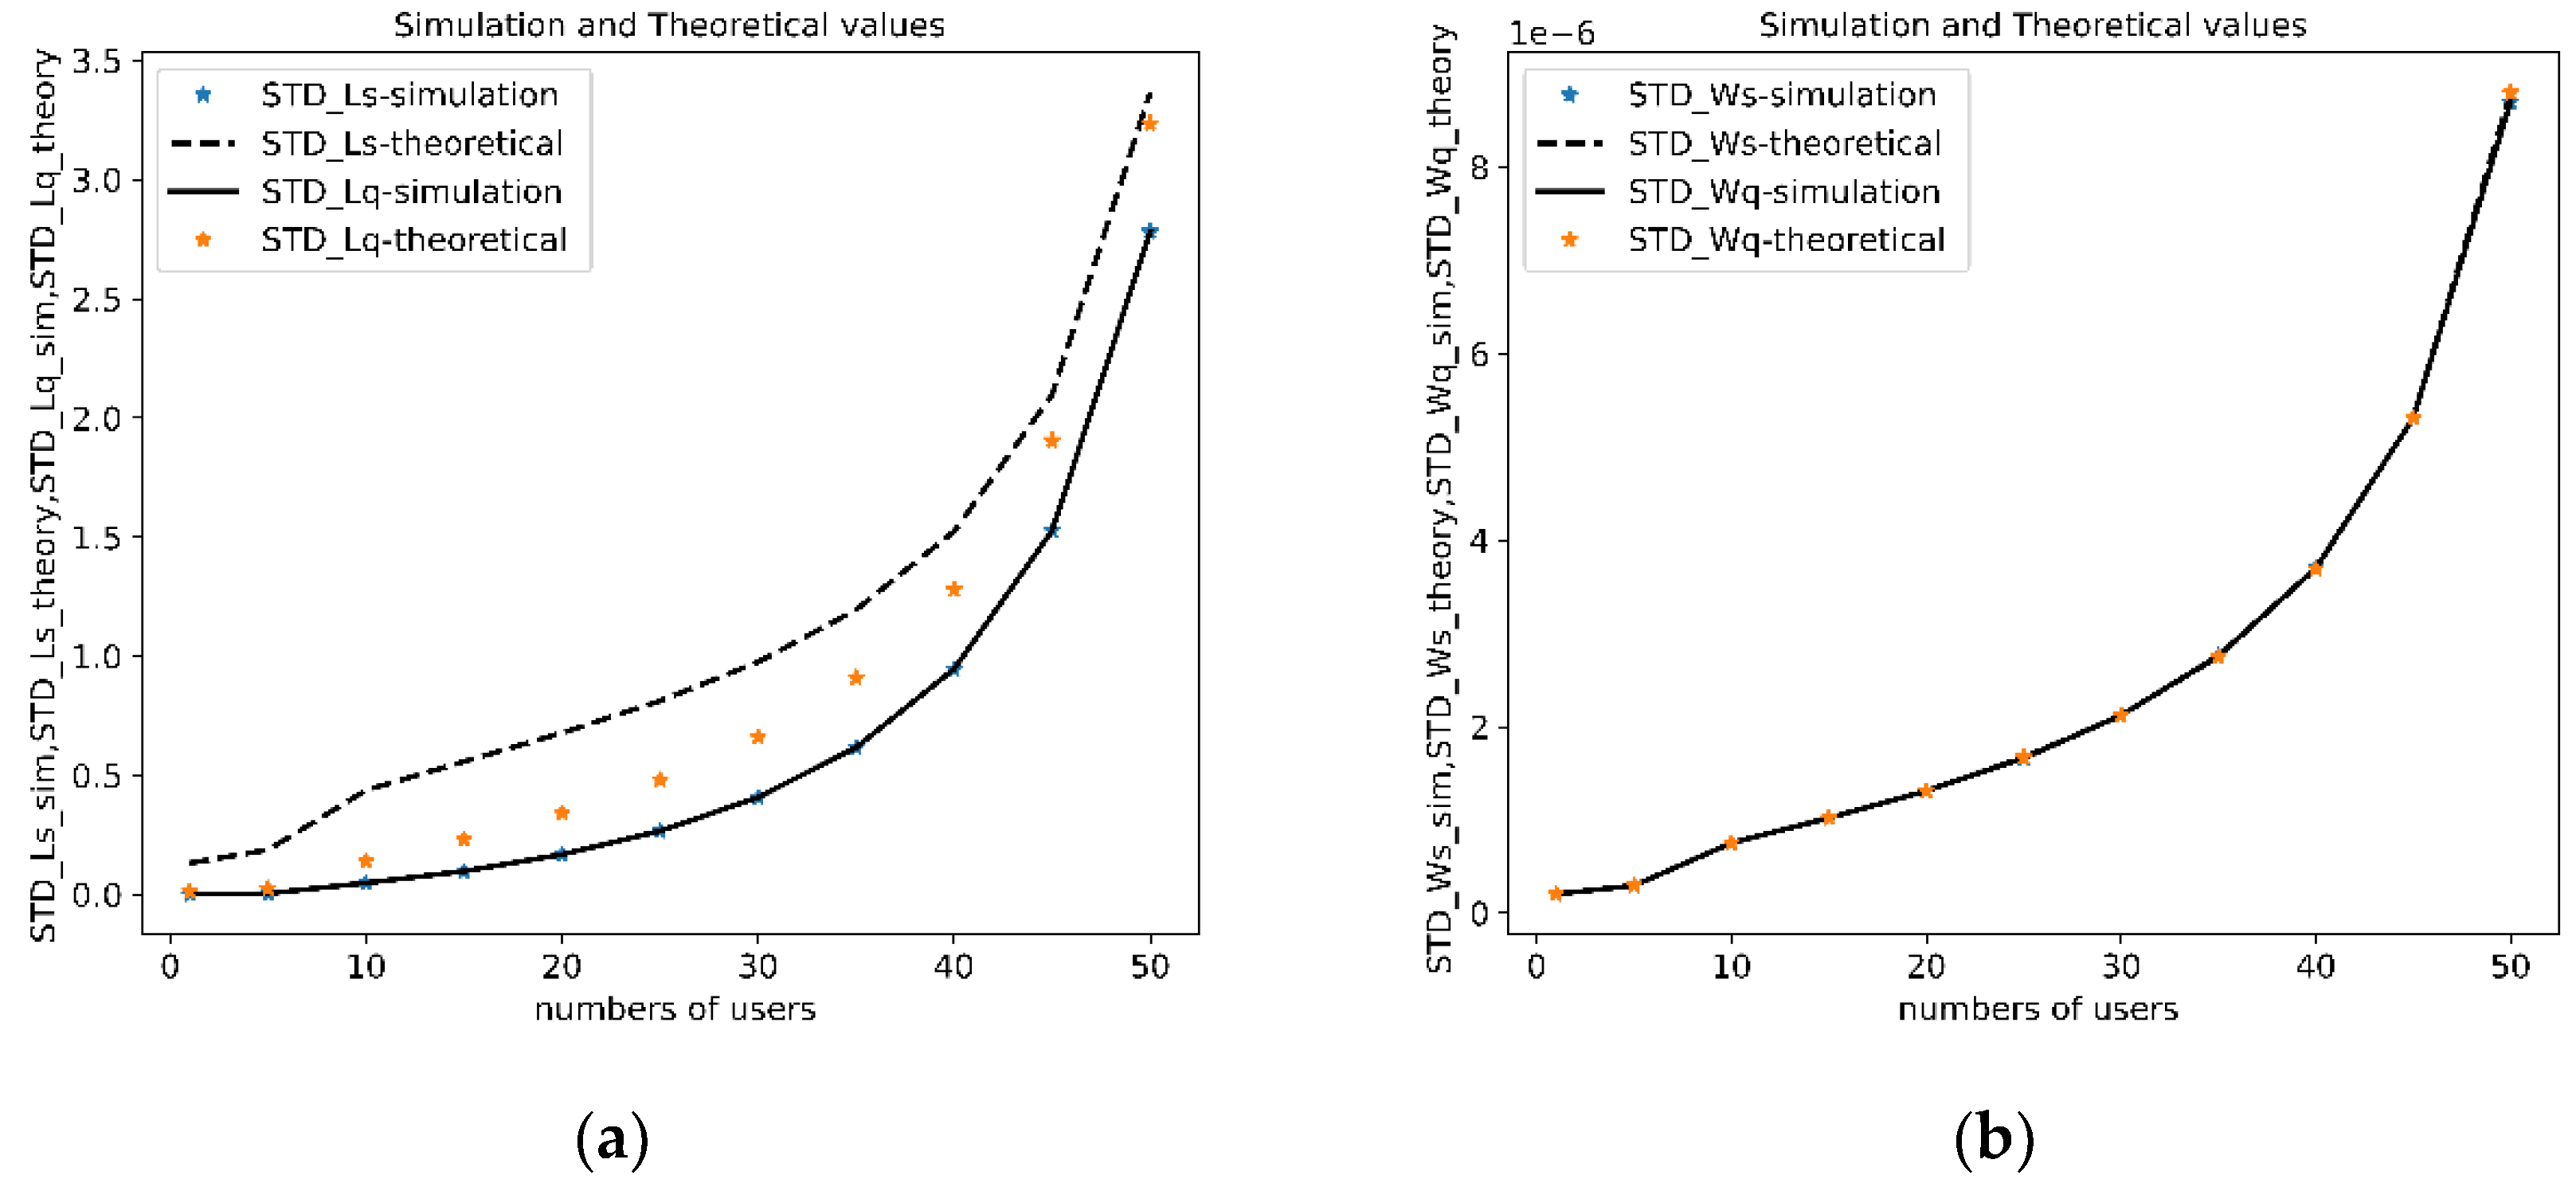
Figure 8.
Comparison of theoretical and experimental IAT (Inter Arrival Time).
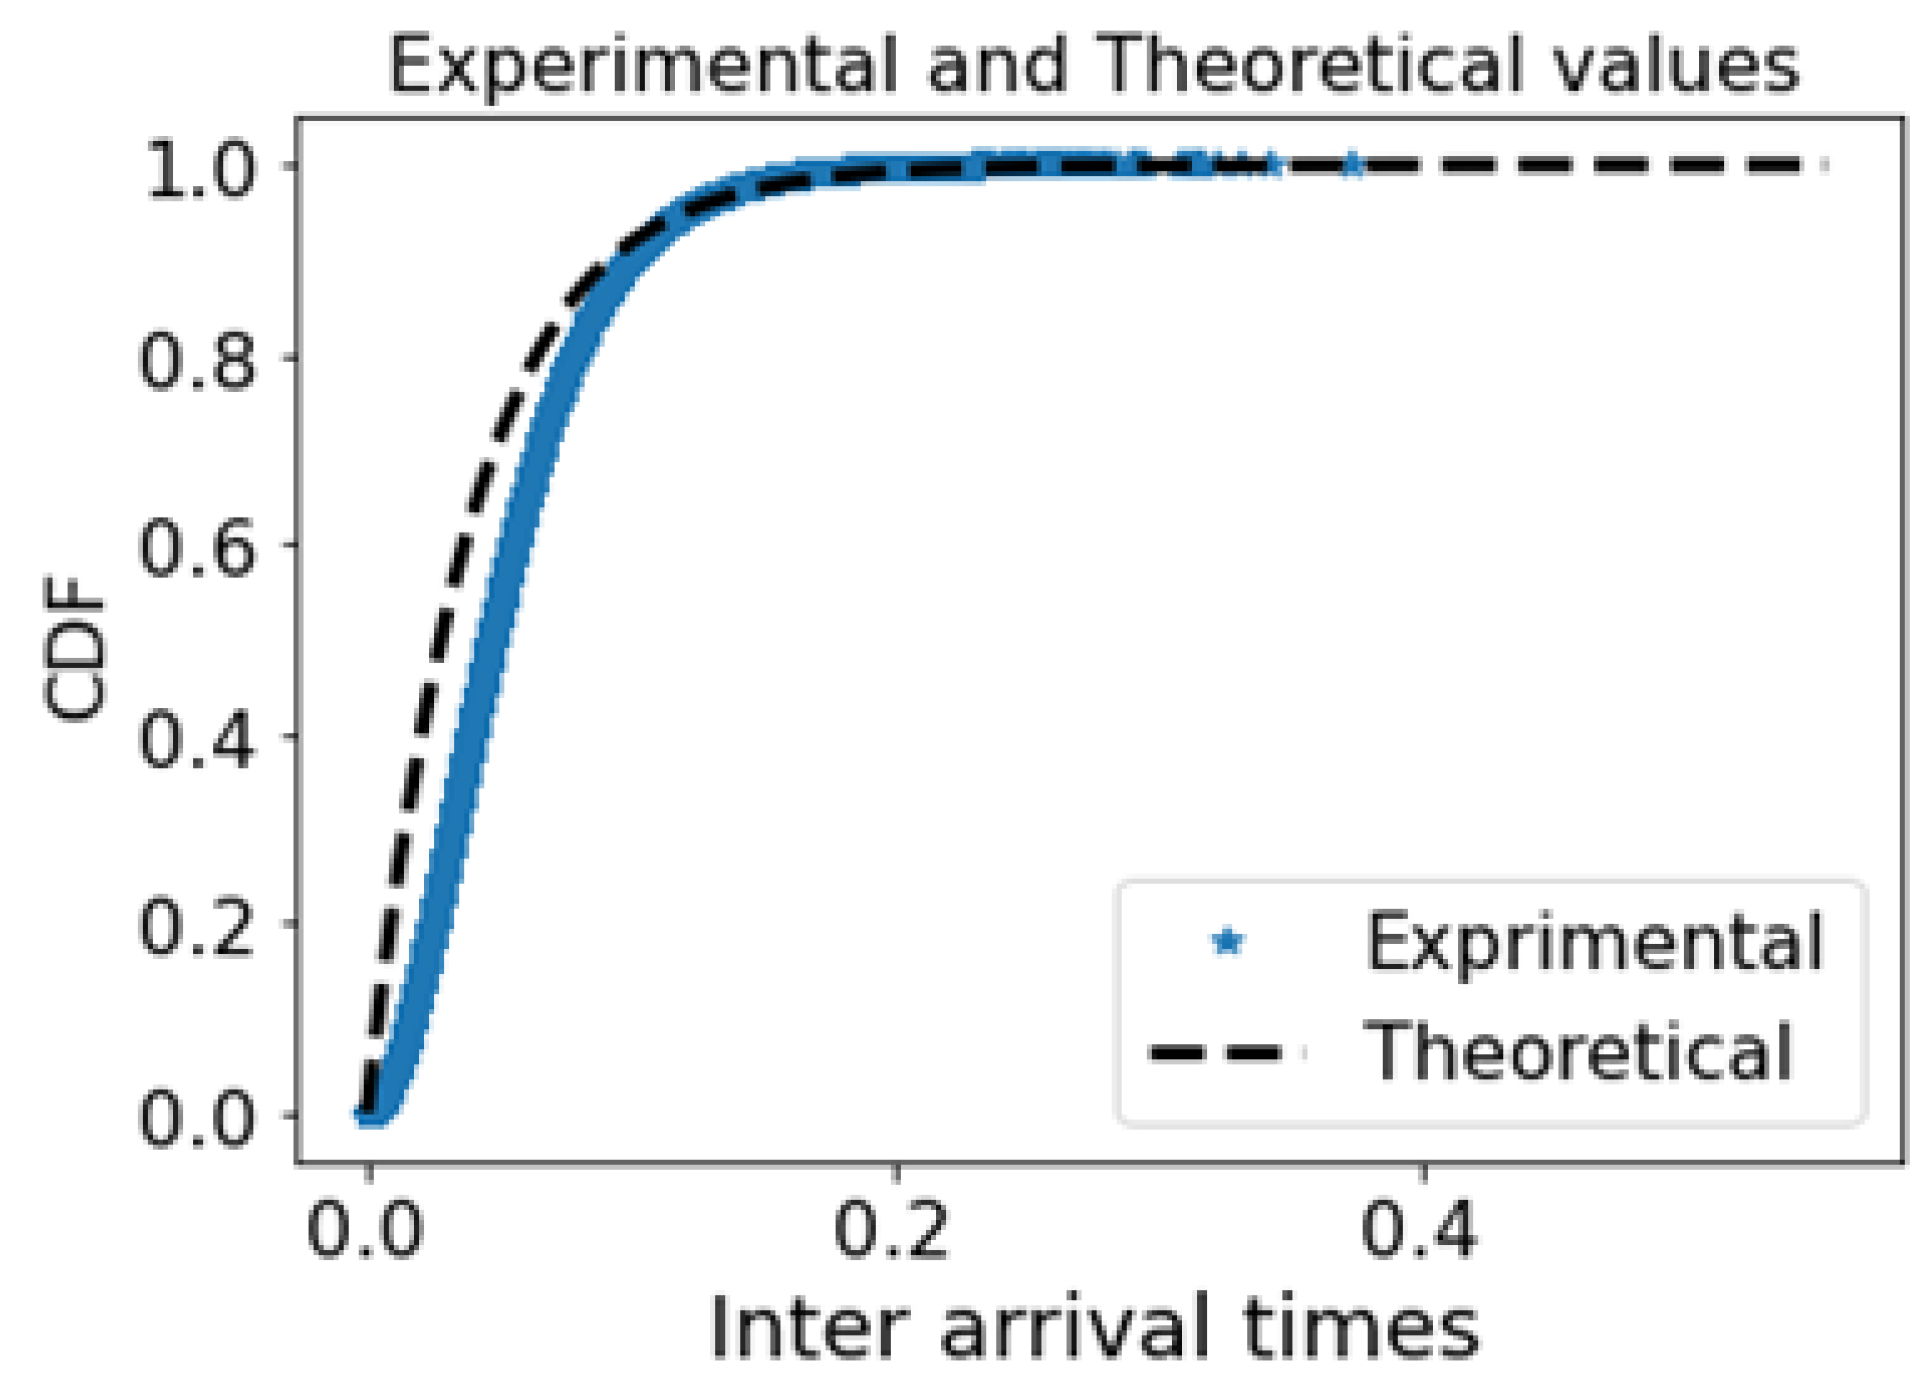

Table 1.
Types of codecs in VoIP systems [22].
Table 1.
Types of codecs in VoIP systems [22].
| Codec | In every(ms) | Voice Payload size(bytes) | Theoretical bandwidth (bps) | Used bandwidth with two directions (bps) |
| G.711 | 20 | 160 | 160*8/20mSec=64k | 85k*2=170k |
| G.729 | 20 | 20 | 20*8/20mSec=8k | 32k*2=64k |
| G.723 | 30 | 30 | 30*8/30mSec=8k | 21k*2=42k |
Table 2.
Common VoIP traffic modeling techniques.
| Technique | Methodology | Strengths | Limitations | Key Performance Metrics |
| Queueing Theory[26] | Analyzes the behavior of queuing systems in VoIP traffic management. | - Helps predict delays and optimize resource allocation. | - Assumes a steady state and may not handle abrupt traffic changes effectively. | Delay, throughput, system utilization. |
| Markov Chains[27] | Models user behavior using states and transition probabilities. | - Effective for systems with memoryless properties (e.g., exponential distributions). | - Complexity rises significantly with the number of states, complicating computation. | State probabilities, transition rates. |
| Network Simulation[28] | Emulates VoIP application performance in a controlled environment (e.g., OPNET, NS-2,3). | - Enables detailed analysis of routing, traffic patterns, and protocol behavior. | - Simplifications may lead to less accurate representation of real-world conditions. | Packet loss, jitter, latency, throughput. |
| Statistical Analysis[29] | Analyzes historical traffic data to forecast future VoIP behavior and performance. | - Provides insights into user behavior and peak traffic times. | - Dependent on the availability and accuracy of historical traffic data. | Traffic volume, user behavior metrics. |
Table 4.
Overview of common Queue Models in VoIP Traffic Analysis.
| Queue | Assumptions | Strengths | Limitations |
| M/M/1 | Single server; exponentially distributed inter-arrival and service times. | Easy to implement, simple to analyze. | Assumes Poisson arrivals, making it less accurate for bursty traffic. |
| M/G/1 | Single server with Poisson arrivals and general service time distribution. | Offers greater flexibility in modeling service times compared to M/M/1. | Analytical complexity increases due to the general distribution of service times. |
| G/G/1 | Single server with general inter-arrival and service time distributions. | Highly flexible and accurately models real-world traffic. | Difficult to analyze, as closed-form solutions for performance metrics are often unavailable. |
Table 5.
Experimental statistical parameters.
| Packet size(bytes) | Inter Arrival Time (ms) |
Experimental Average Bandwidth |
Packet size(bytes) |
| 214 | 10 | 170k | 50 |
Table 6.
Parameters used for comparative analysis between simulation and theory.
| № | Description | Parameters |
| 1 | Bandwidth (bps) | 10(e+07) |
| 2 | Packet_size(bytes) | 230 |
| 3 | Physics_header (bytes) | 20 |
| 4 | Datalink_header (bytes) | 22 |
| 5 | IP_header (bytes) | 20 |
| 6 | UDP_header (bytes) | 8 |
| 7 | DATA_SIZE (bytes) | 160 |
| 8 | Transimit_time(sec) | 0.00010 |
| 9 | Packet_rate(packets/sec) | 5434.783 |
Table 7.
Ethernet-II frame header information (bytes).
| № | Description | Parameters |
| 1 | Preamble | 7 |
| 2 | Start frame delimiter (SFD) | 1 |
| 3 | MAC destination | 6 |
| 4 | MAC source | 6 |
| 5 | 802.1Q tag (optional) | 4 |
| 6 | Ethertype (Ethernet II) or length (IEEE 802.3) | 2 |
| 7 | Payload | 42-1515 |
| 8 | Frame check sequence | 4 |
| 9 | (32 bit CRC) | 12 |
Table 8.
Parameter results for comparing mathematical models and simulations.
| № | ρ=λ/μ | λ(packets/s) | µ(packets/s) |
System MeanDelay(sec) |
Queueing Delay(sec) |
SimSystem MeanDelay(sec) |
Sim QueueingDelay(sec) |
| 1 | 0.05 | 271.74 | 5434.78 | 0.000372842 | 4.84211E-06 | 0.000374558 | 4.51E-06 |
| 2 | 0.1 | 543.48 | 5434.78 | 0.000378222 | 1.02222E-05 | 0.000378723 | 1.04E-05 |
| 3 | 0.15 | 815.22 | 5434.78 | 0.000384235 | 1.62353E-05 | 0.000384255 | 1.56E-05 |
| 4 | 0.2 | 1086.96 | 5434.78 | 0.000391 | 0.000023 | 0.000389783 | 2.48E-05 |
| 5 | 0.25 | 1358.70 | 5434.78 | 0.000398667 | 3.06667E-05 | 0.000397889 | 3.38E-05 |
| 6 | 0.3 | 1630.43 | 5434.78 | 0.000407429 | 3.94286E-05 | 0.000406696 | 4.04E-05 |
| 7 | 0.35 | 1902.17 | 5434.78 | 0.000417538 | 4.95385E-05 | 0.000410399 | 4.51E-05 |
| 8 | 0.4 | 2173.91 | 5434.78 | 0.000429333 | 6.13333E-05 | 0.000432377 | 6.12E-05 |
| 9 | 0.45 | 2445.65 | 5434.78 | 0.000443273 | 7.52727E-05 | 0.000435399 | 7.55E-05 |
| 10 | 0.5 | 2717.39 | 5434.78 | 0.00046 | 0.000092 | 0.000467104 | 9.24E-05 |
| 11 | 0.55 | 2989.13 | 5434.78 | 0.000480444 | 0.000112444 | 0.000476789 | 1.16E-04 |
| 12 | 0.6 | 3260.87 | 5434.78 | 0.000506 | 0.000138 | 0.000522255 | 1.49E-04 |
| 13 | 0.65 | 3532.61 | 5434.78 | 0.000538857 | 0.000170857 | 0.000522592 | 1.94E-04 |
| 14 | 0.7 | 3804.35 | 5434.78 | 0.000582667 | 0.000214667 | 0.000622987 | 4.87E-04 |
| 15 | 0.75 | 4076.09 | 5434.78 | 0.000644 | 0.000276 | 0.000640222 | 2.14E-04 |
| 16 | 0.8 | 4347.83 | 5434.78 | 0.000736 | 0.000368 | 0.000697183 | 3.37E-04 |
| 17 | 0.85 | 4619.57 | 5434.78 | 0.000889333 | 0.000521333 | 0.000829398 | 5.84E-04 |
| 18 | 0.9 | 4891.30 | 5434.78 | 0.001196 | 0.000828 | 0.001002789 | 4.68E-04 |
| 19 | 0.95 | 5163.04 | 5434.78 | 0.002116 | 0.001748 | 0.002071049 | 1.86E-03 |
Disclaimer/Publisher’s Note: The statements, opinions and data contained in all publications are solely those of the individual author(s) and contributor(s) and not of MDPI and/or the editor(s). MDPI and/or the editor(s) disclaim responsibility for any injury to people or property resulting from any ideas, methods, instructions or products referred to in the content. |
© 2025 by the authors. Licensee MDPI, Basel, Switzerland. This article is an open access article distributed under the terms and conditions of the Creative Commons Attribution (CC BY) license (http://creativecommons.org/licenses/by/4.0/).
Copyright: This open access article is published under a Creative Commons CC BY 4.0 license, which permit the free download, distribution, and reuse, provided that the author and preprint are cited in any reuse.


