
Submitted:
15 April 2025
Posted:
16 April 2025
You are already at the latest version
Abstract
Luxury beach hotels in tropical climates are large consumers of electricity, negatively impacting the environment and their profit margins. Energy efficiency and the incorporation of clean energy are among the main actions contributing to reducing this problem, but the implementation of this second solution is minimal among these types of hotels. A case study was conducted and found that this is primarily due to a lack of space in their facilities. Solutions are proposed by implementing agrovoltaic farms in the areas adjacent to the destination studied. The project is technically, economically, and legally feasible, and the proposed agrovoltaic farms could supply nearly 580 million kWh annually, mitigating emissions of just over 390,000 tCO2e/year and making Puerto Vallarta and Nuevo Vallarta a "Green Destination," thus contributing to meeting international GHG mitigation targets.
Keywords:
sustainable hotels
; agrovoltaics
; energy efficiency
; energy transition
1. Introduction
Hotels in tropical climates consume more electricity than those located in temperate zones, especially luxury hotels with 4 and 5 star categories [1,2,3,4,5], This high energy consumption generates greenhouse gases (GHG), with negative effects on both the environment [3,6,7], as well as the profitability of the hotel sector due to high electricity costs. Among the main actions that contribute to reducing GHG generation in buildings are energy efficiency and the incorporation of clean energy [7,8,9]. However, the adoption of this last alternative remains minimal in the hotel industry [9,10].
Faced with this problem, it was decided to study a tourist destination to identify whether it faces the same challenges, analyze the reasons behind the limited use of renewable energy, and evaluate technically and economically viable solutions. Puerto Vallarta, Jalisco, and Nuevo Vallarta, Nayarit, located among the top three beach destinations in Mexico, were selected as case studies [11].
In recent decades, the hotel industry in tropical destinations such as Puerto Vallarta and Nuevo Vallarta has faced a dual challenge: meeting the growing demand for high-end services, with their high energy consumption, and reducing its environmental footprint. In Mexico, the tourism sector contributes approximately 8.4% of greenhouse gas (GHG) emissions, according to the Instituto Nacional de Ecología y Cambio Climático (INECC) [12]. Luxury hotels, highly dependent on HVAC and lighting systems, represent a critical point in this scenario. Furthermore, in Jalisco and Nayarit, electricity costs for tourist establishments have increased by 18% in the last five years, according to the Comisión Reguladora de Energía (CRE), underscoring the need for solutions that balance profitability and sustainability [13].
Agrovoltaics emerges as an innovative alternative in this context. By integrating solar photovoltaic generation with agricultural production in the same space, land use is maximized [14] and multiple benefits are obtained: reduction of dependence on fossil fuels and mitigation of GHG emissions [15]. For regions such as Bahía de Banderas, where average solar radiation exceeds 5.3 kWh/m²/day and land availability is limited [16], This technology represents an opportunity to transform spaces that allow for the generation of clean energy and contribute to local agricultural production, reducing operating costs and strengthening self-sufficiency [17].
The objective of this study is to propose technically and economically feasible alternative solutions with a low environmental impact for hotels in Puerto Vallarta and Nuevo Vallarta to use alternative energy sources that contribute to GHG mitigation and reduce electricity costs. These alternatives include agrovoltaic models adapted to the technical, economic, and ecological needs of the hotel sector in Puerto Vallarta and Nuevo Vallarta, integrating an energy community approach between farmers and hoteliers. Given that the hotel sector faces space limitations for the installation of photovoltaic systems, farmers can implement agrovoltaic crops, optimizing the use of their land for the generation of renewable energy to supply the hotel industry. Through an interdisciplinary approach, the feasibility of this collaboration will be evaluated considering key factors [18]: The potential for energy generation, integration with local supply chains (e.g., the cultivation of native species for hotel consumption), the impact on reducing electricity costs, and mitigating GHG emissions. The results aim to offer a strategic framework that allows tropical hospitality to not only meet sustainability standards but also consolidate its position as a benchmark in eco-efficient innovation, aligning with the Sustainable Development Goals (SDGs) and the demands of an increasingly conscious tourism industry [19].
2. Materials and Methods
This study adopts an interdisciplinary approach to evaluate the feasibility of implementing agrovoltaic systems as a strategy to reduce GHG emissions, optimize energy costs, and foster energy communities between farmers and hoteliers. The project stages are described below.
-
Analysis of the local context and background review
- ○
- The energy and agricultural environment of the region was analyzed, considering public policies, current regulations and previous energy transition strategies in tourist destinations.
- ○
- National and international experiences in agrovoltaics applied to the hotel industry were examined to identify success factors and challenges.
-
Evaluation of technical and economic feasibility
- ○
- The feasibility of implementing photovoltaic systems in agricultural fields was studied, considering variables such as solar radiation, land availability, crop compatibility, and potential synergies with the hotel sector. To determine which types of alternative energy are most feasible to use in the study area, the destination’s climate was characterized for solar radiation, average temperature, wind speed, and relative humidity using three meteorological stations located at the University of Guadalajara’s Centro Universitario de la Costa, the Universidad Tecnológica de Bahía de Banderas, and the Puerto Vallarta Airport. The results were compared with satellite data.
- ○
- Investment, operation and maintenance costs were evaluated, as well as financing schemes and business models for the implementation of energy communities.
-
Characterization of energy consumption in the hotel sector
- ○
- Data on electricity consumption, rates and current energy efficiency strategies were obtained from a sample of 13 hotels with categories ranging from 2 to 5 stars using non-probability convenience sampling [20] and was interviewed in a structured manner [21] to maintenance managers in the Metropolitan Area of Puerto Vallarta and Nuevo Vallarta. The bottom-up method was used to calculate the electricity consumption and GHG emissions of Puerto Vallarta and Nuevo Vallarta based on the room-by-room indicators of the hotels that provided information.
- ○
- Energy demand patterns and opportunities for integration with renewable sources were analyzed.
-
Energy simulation and modeling
- ○
- Simulations were carried out using specialized SAM (System Advisor Model) software to model potential energy generation with photovoltaic systems in agricultural fields, considering different implementation scenarios.
- ○
- The impact on GHG emissions reductions and the economic benefits for farmers and hoteliers were estimated. To calculate Scope 1 and 2 greenhouse gas (GHG) emissions, the Greenhouse Gas Protocol (GHGP) for organizations was used. This protocol, developed by the World Resources Institute and the World Business Council for Sustainable Development (WRI and WBCSD), and used by the Secretaría de Medio Ambiente y Recursos Naturales (SEMARNAT), was used. [22,23].
-
Preparation of the proposal and implementation strategies
- ○
- Based on the results of the analysis, a model of energy communities adapted to local conditions was designed.
- ○
- Implementation strategies are proposed, considering technical, economic and regulatory aspects, as well as cooperation mechanisms between the agricultural and hotel sectors.
This approach will allow for the creation of a comprehensive framework for the adoption of agrovoltaics in tourist destinations, contributing to the sustainability of the sector and aligning with the Sustainable Development Goals (SDGs).
3. Results and Discussion
In Puerto Vallarta and Nuevo Vallarta, from 2017 to 2019, an average of 3,449,286 tourists were received annually; 63% were domestic and 37% were foreign, with 75% of the rooms occupied. The pattern [24], it shows that domestic tourists arrive at the destination especially during the hot season; while foreigners arrive when the weather is cooler (Figure 1), which is why the destination’s hotels operate and consume energy year-round, unlike other destinations that operate seasonally [25,26].
As of December 31, 2017, a total of 22,577 rooms were registered in 1-to-5-star hotels in the tourist destination, of which 22,187 rooms corresponded to 2 to 5 star hotels [24], representing 98.3% of the total categorized rooms. Of these, 20,067 rooms (90.4% of the total) belonged to luxury 4- and 5-star hotels [24].
According to the Centro Mario Molina (2015) [8], the number of rooms in Mexico grew at an average rate of 3.3% annually between 1984 and 2014, and this growth rate was confirmed by the Secretaría del Medioambiente y Recursos Naturales [27] for the period 2015-2018. For Puerto Vallarta and Nuevo Vallarta, a 3.3% annual growth in the number of rooms was observed, going from 15,495 rooms in 2007 to 22,723 rooms in 2020 [24]. Based on this steady growth, the number of rooms in 2- to 5-star hotels is estimated to reach 28,767 by 2025. Of this figure, 2,749 rooms are projected to be in 2- and 3-star hotels, and 26,019 rooms will be in luxury 4- and 5-star hotels (Table 1).
These projections highlight the expansion trend of the hotel sector in the region, which implies a growing demand for resources and, therefore, the need to optimize energy consumption and sustainability strategies in hotel infrastructure.
Of the 30 hotels where requests were made, only 13 agreed to provide information. It took more than a year of various procedures to obtain it. No information was obtained on fuel consumption from mobile sources or refrigerant consumption in air conditioning and refrigeration equipment, and none provided information on end-use energy, whether for air conditioning, lighting, or other systems. The 13 hotels that provided information were highly diverse, ranging from a boutique hotel with 28 villas to a 723-room hotel with six 10-story towers (Table 2). All hotels surveyed receive electricity from the Comisión Federal de Electricidad (CFE). They do not import chilled water, steam, district hot water, coal, compressed air, or any other external energy source. They also use liquefied petroleum gas (LPG) from private companies for cooking, laundry, and hot water, and diesel for emergency power plants. The electricity, LPG, and diesel consumption for each hotel and average values are presented in Table 2.
Estimation of Energy Consumption in the Hotel Sector
Based on the data presented in Table 2 and Table 3, the average electricity consumption per room in 2- to 5-star hotels is 19,267 kWh/room-year. However, when segmented by category, the following values are obtained:
- 2- and 3-star hotels: 5,929 kWh/room-year
- Luxury 4- and 5-star hotels: 22,184 kWh/room-year
Energy Consumption in 2017
Considering the average consumption of 19,267 kWh/room-year, the total consumption of the tourist destination in 2017 is estimated at 427 million kWh/year. However, considering the values differentiated by category, the annual energy consumption in 2017 would be 458 million kWh/year.
Energy Consumption Projection in 2025
Considering a 3.3% annual growth in the number of rooms in Puerto Vallarta and Nuevo Vallarta, and using the energy consumption coefficients by category (5,929 kWh/room-year for 2 and 3 star hotels and 22,184 kWh/room-year for 4 and 5 star hotels), it is estimated that, in 2025, the total consumption of the 2 to 5 star hotel sector will reach 593.5 million kWh/year.
Of this total, 97% of energy consumption will correspond to luxury 4- and 5-star hotels, with an estimated 577 million kWh/year (Table 4).
These values demonstrate the high energy demand of the higher-category hotel sector, highlighting the importance of implementing energy efficiency strategies and renewable sources to mitigate the environmental impact and optimize energy consumption in the tourist destination.
The average annual GHG emissions for each hotel in Table 2 and Table 3 for the period 2017 to 2019, both scope 1 and scope 2 and total in tCO2e/year, as well as GHG emissions per room and per-hotel are shown in Table 5 and an average indicator of 12.2 tCO2e/room-year is obtained.
Considering the average GHG emissions per room, segmented by hotel category, the following values are obtained:
- 2- and 3-star hotels: 4.4 tCO₂e/room-year
- 4- and 5-star hotels: 14.5 tCO₂e/room-year
Total GHG emissions for the hotel sector in 2017 were:
- 270,681 tCO₂e considering the unsegmented average
- 300,831 tCO₂e when grouped into 2- and 3-star hotels and luxury 4- and 5-star hotels
If improvements in energy efficiency and emissions reduction indicators are not implemented, GHG projections for 2025 indicate:
- 350,963 tCO₂e for unsegmented 2- to 5-star hotels
- 390,054 tCO₂e when grouped into 2- and 3-star hotels and 4- and 5-star luxury hotels (Table 6).
These values reflect the growing trend in GHG emissions from the hotel sector, highlighting the need to implement energy efficiency strategies, the adoption of renewable energy and carbon mitigation technologies to reduce the environmental impact of the tourist destination.
Regarding greenhouse gas (GHG) emissions mitigation strategies and energy efficiency, significant differences were identified between 2- and 3-star hotels and 4- and 5-star luxury hotels in the evaluated tourist destination.
2-. and 3-Star Hotels
- They have implemented the replacement of incandescent and fluorescent lighting with LED technology, although some are still in the process of transition.
- They use liquefied petroleum gas (LPG) in outdated cooking and water heating equipment, resulting in low energy efficiency and higher GHG emissions.
- They do not heat the pools, and their air conditioning systems are more than 10 years old, with reduced energy efficiency.
- They do not have a formal energy saving policy, nor programs for replacing equipment with more efficient technologies, except in cases of breakdown and whenever the cost allows it.
- They do not use the residual heat from their equipment for internal thermal processes.
- They do not have solar photovoltaic (SPV) or solar thermal (STE) systems, mainly due to economic and financial constraints. However, they have shown interest in implementing them and have rooftop space for installing these systems.
- They do not have environmental certifications or sustainability programs.
Luxury 4- and 5-Star Hotels
- They incorporate modern and efficient equipment for water heating and air conditioning, with technologies that optimize energy consumption.
- They implement energy management measures such as presence sensors for lighting control, high-efficiency motors, and chiller-type air conditioning equipment, which are less than 10 years old and include variable frequency drives to improve their energy performance.
- They take advantage of the residual heat from cooling systems to heat water, including in some cases the heating of swimming pools.
- They have well-established energy management and saving policies.
- Most of these hotels have or have had environmental certifications such as EarthCheck, and some are in the process of obtaining them.
- They use solar thermal energy (STE) as much as possible, although its implementation is limited due to the lack of rooftop space.
This analysis highlights the need for incentives and support programs for equipment modernization in lower-category hotels, as well as the growth potential in the adoption of renewable energy in the hotel sector.
Table 7 presents a detailed summary of the implementation of energy systems in hotels, indicating the presence of SPV and STE. It also specifies whether these establishments have mechanisms for the use of residual energy (AER) and whether they have incorporated advanced energy efficiency (TAE) technologies to replace equipment in the last 10 years.
An analysis of Table 1 and Table 2, without considering groupings, reveals that electrical energy consumption in hotels is 244% higher than thermal energy consumption. When grouping establishments into 2- and 3-star categories and into luxury 4- and 5-star hotels, the ratio between electrical and thermal energy consumption in the latter increases even further, reaching 276%. Although higher-category hotels have implemented various energy efficiency and energy management strategies (Table 7), the use of alternative energy sources is minimal. However, the integration of PV systems could represent a key strategy for reducing electricity consumption and mitigating greenhouse gas (GHG) emissions.
In order to characterize the climate of the destination and determine the viability of alternative energy sources, the monthly behavior of solar radiation, average temperature, wind speed and relative humidity in Puerto Vallarta and Nuevo Vallarta for the period 2017-2019 is presented below (Figure 2 and Figure 3).
Figure 4 shows the comparison of the behavior of the average monthly horizontal global insolation by NASA satellites (1990 to 2019) versus the measurements made at the Universidad Tecnológica de Bahía de Banderas (2015 to 2019) with a Lin’s concordance [28] strong between both data sources with ρc=0.9244
In this region, the average daily horizontal global insolation measured was 5.4 kWh/m2-day, with extreme values of 6.7 kWh/m2-day in May and 3.8 kWh/m2-day in December. The average annual temperature was 24.9°C, with average extremes of 21.3°C in January and 28.1°C in July. The average annual relative humidity was 82.6%, with a minimum of 79.3% in April and a maximum of 86.4% in October. This high humidity generates feelings of muggy conditions [29,30] and increases the demand for air conditioning systems, which not only reduce air temperature but also its humidity [29]. The average annual wind speed was 2.2 m/s, with a minimum of 1.8 m/s in December and a maximum of 2.7 m/s in May. Based on these data, it is concluded that the wind power generation potential in the area is limited, as at least 4 to 6 m/s are required for wind generators at a height of 10 m above the ground [31]. However, solar radiation levels are optimal for its utilization. This suggests that the implementation of solar thermal or photovoltaic systems is an efficient and viable alternative for this tourist destination. In particular, generating electricity through photovoltaic systems represents an effective solution for meeting the energy demands of the hotel sector.
A statistical analysis (Table 8) was performed to evaluate the relationship between electricity consumption, hotel occupancy, and atmospheric variables. The results indicate that occupancy had a significant impact on electricity consumption in 5 of the 13 hotels analyzed, while the average monthly temperature influenced 8 of the 13, and relative humidity in 2 of the 13. The coefficient of determination (R2) exceeded 90% in 8 of the 13 hotels, demonstrating a strong correlation between these variables and energy consumption. However, in the case of hotel 5, the coefficient of determination was remarkably low, and the causes of this atypical behavior were not clearly identified. These findings are consistent with previous studies [32]. In particular, for hotels located in tropical climates, electricity consumption is mainly related to the demand for air conditioning for thermal comfort [1,4,33].
In order to analyze the relationship between hotel occupancy, temperature and electricity consumption, Figure 5 shows the behavior of electricity consumption of hotel 11 (Table 8) during 2019 based on monthly occupancy (%) and average monthly temperature (°C). The statistical significance (p) values corresponding to this hotel are found in Table 8, where it is observed that occupancy was the factor with the greatest influence on electricity consumption, with a p value = 0.000. The regression equation obtained for this case presents a coefficient of determination (r2) of 95.94%, which indicates a high degree of fit and a strong correspondence between the model and the actual behavior of energy consumption in said period.
Four- and five-star luxury hotels in this tourist destination have indicated that the main constraint to the adoption of SPV systems is the lack of available space on their buildings’ rooftops, as well as the perceived low efficiency of these systems (Table 7). Consequently, they have opted for alternative strategies such as replacing technologies with more efficient equipment, optimizing energy management, and harnessing residual energy. Another viable alternative would be the implementation of Combined Heating and Cooling (CHCP) systems; however, natural gas is unavailable in the region, and the use of Liquefied Petroleum Gas (LPG) is considered economically unviable for generating electricity due to its high cost. Furthermore, this option would not contribute to reducing greenhouse gas (GHG) emissions into the atmosphere. However, there are agricultural fields in the surrounding areas with the potential to implement agrivoltaic systems, which have adequate space for the installation of photovoltaic infrastructure with minimal environmental impact. To take advantage of this alternative, the following solutions are proposed:
- Energy cooperative model: Farmland owners could form energy communities or cooperatives, establishing themselves as owners of the generating plants. The energy produced would be sold to luxury hotels, allowing the land to continue being used for agriculture and generating additional economic benefits.
- Hotel ownership: Luxury hotels could take ownership of the generating plants and lease the agricultural land back to the original owners, allowing them to continue their farming activities simultaneously.
- Third-party leasing model: An outside company could lease the farmland from its owners, install photovoltaic systems, and sell the generated energy to luxury hotels, guaranteeing the energy supply without the hotels having to assume the initial investment. The farmers continue to farm the plots at the same time.
The legal framework in force in Mexico for photovoltaic generation systems is governed by:
The current interconnection modalities in Mexico are classified into two categories, according to the generation capacity:
- Distributed Generation (GD),
- Wholesale Electricity Market (MEM).
In the case of Distributed Generation, the current Electricity Industry Law establishes that the maximum installed power capacity of generating plants must not exceed 0.5 MW. However, it is currently being updated to increase this limit to 0.7 MW, with the possibility of approval in 2025. All power plants with a generating capacity exceeding 0.5 MW must operate within the Wholesale Electricity Market (MEM). Based on the above and the data presented in Table 3, all hotels analyzed in the sample could participate in the MEM, given that their electricity consumption exceeds 1 MWh, which allows them to be considered Qualified Users [37].
On the other hand, the agricultural fields located near the tourist destination are part of Distrito de Riego 043, Bahía de Banderas Section. According to information provided by the Oficina de Usuarios del Agua of Distrito de Riego 043, planting permits in this area may vary annually, meaning that the same plot may be used for different crops at different times. In this context, the implementation of agrivoltaic systems should not present significant conflicts, provided that the selected plots are planted with low-growing crops (less than 3 meters), such as pineapple, watermelon, tomato, among others [38,39]. To assess the potential of these lands, an analysis was conducted of the cultivated area and the types of crops present in the area adjacent to the hotel complex. It was found that, between 2012 and 2024, the average agricultural area with planting permits was 3,397 hectares (ha), with a downward trend in recent years (Figure 6). This trend could be associated with the conversion of agricultural land to residential use, driven by the growth and expansion of the tourist destination.
The permits for crops planted in the area in the 2023-2024 cycle are shown in Table 9, highlighting the cultivation of corn with 71% of the planting permits.
Figure 7 shows a map with the distribution of crop types in the 2023-2024 season, the water supply network, roads and the electricity distribution network in Distrito de Riego 043, adjacent to the tourist destination and which has the farmland where solar farms can eventually be installed to supply electricity to luxury 4- and 5-star hotels and reduce almost 400 thousand tCO2e by 2025 alone.
Analyzing information provided by the Distrito de Riego 043 Management and local farmers, it was found that planting permits in the region can be modified annually and that some farmers rent land from plot owners. This means that the same plot can be used for different crops at different times, facilitating the implementation of agrivoltaic systems without significantly affecting agricultural production. In this context, the establishment of low-growing crops (less than 3 meters), such as pineapple, watermelon, tomato, and others, is considered viable on the plots selected for the installation of photovoltaic infrastructure [40]. It is advisable to carry out studies to verify the impact of partial shading on some of these crops, since no reports were found in the case of pineapple and watermelon, although in other crops they allow water savings, and other important benefits [41].
Solar Farm Sizing: Typical Case per Hectare
Based on the data presented in Table 3, it is estimated that in 2025 the annual energy consumption of 4- and 5-star hotels in Puerto Vallarta and Nuevo Vallarta will be 577,185,495 kWh, which is equivalent to a daily consumption of 1,581,330 kWh/day. Considering that the average daily sunlight in the destination is 5.4 kWh/m² (Figure 3) and assuming an 80% efficiency for a photovoltaic system, an installed capacity of 366 MWp is required to meet the energy demand of these hotels. For the implementation of this solar farm, the use of 600 Wp monofacial solar panels with dimensions of 2,278 mm x 1,134 mm is proposed, arranged in a 1 to 1 configuration. This distribution considers an adequate separation to avoid shading between panels during the winter, optimizing the capture of solar radiation for a latitude of 20.5 ° N (Figure 8 and Figure 9). In addition, it is proposed that the panels be installed on metallic structures at a height of 3.5 m, allowing the passage of agricultural machinery, such as tractors, and ensuring that the crops receive approximately 50% of the solar radiation that they would receive under unshaded conditions. This agrovoltaic model would not only contribute to the generation of renewable energy for the hotel sector, but would also encourage the efficient use of agricultural land, promoting a synergy between food production and electricity generation [40,42].
Figure 9 shows the layout of the photovoltaic solar farm, designed with a density of 0.88 MW/ha. In the specific case of the luxury hotels in Puerto Vallarta and Nuevo Vallarta, the area required for the development of the agrovoltaic project would be 420 hectares (ha) by 2025, which represents approximately 12% of the average crop area of Distrito de Riego 043, Banderas Bay area. Since an area of 420 ha is required for the installation of the photovoltaic panels, it is proposed that they be located on farmland near the electrical substations of Nuevo Vallarta, Banderas and San Vicente, with the objective of minimizing transmission costs and energy losses. However, it is essential to consider the technical and regulatory requirements established by the Centro Nacional de Control de Energía (CENACE), since these depend on the size of the project and the conditions of the electrical grid in the area. Regarding the interconnection to the electrical system, it is relevant to note that the energy supply in this tourist destination comes from the Comisión Federal de Electricidad (CFE), with an electrical flow from Tepic, capital of the state of Nayarit, through a 230 kV line that feeds the electrical substations S.E. Nuevo Vallarta and S.E. Vallarta Potencia [43]. From these substations, power is redistributed to other substations via a 115 kV network (Figure 10). This interconnection scheme highlights the importance of assessing the available capacity of the existing electrical infrastructure, as well as the specific requirements for access and connection to the Sistema Eléctrico Nacional (SEN), in accordance with current regulations established by the CFE and CENACE.
By performing a simulation in the System Advisor Model (SAM) program for Puerto Vallarta with coordinates 20.6084° north latitude and -105.235° longitude, the following information is obtained considering 1,470 600Wp single-facial MFVs, with 18 inverters of 50 kW each, in an-array of 21 MFVs in series with 70 arrays in parallel: an AC energy of 1,498,573 kWh and a DC energy of 1,544,810 kWh would be generated per year. The monthly generation is shown in Figure 11
To determine the investment cost of the proposed agrovoltaic system, a detailed calculation was made considering the following elements per hectare:
Basic components:
|
Additional infrastructure:
|
In total, the investment cost per hectare amounts to 20 million pesos, so the total cost for developing the project on 420 hectares is estimated at 8.4 billion pesos (420 million dollars). To evaluate the project’s economic viability, the electricity service rate structure under the High Demand Medium Voltage Hourly (GDMTH) modality in Mexico was considered. The estimated rates (pesos/kWh) for 2025 in the region are [44]:
- Base rate: $1.1762/kWh
- Intermediate rate: $1.9523/kWh
- Peak rate: $2.2824/kWh
To simplify the payback calculations, the peak tariff value was used, excluding fixed costs, distribution, capacity, and power factors. In addition, a 5% annual increase in electricity rates was considered. Based on these parameters, calculations indicate that the investment is amortized in less than six years (Table 10), making the project financially viable. The implementation of this project not only represents a significant medium-term economic benefit but would also contribute to international commitments to reducing greenhouse gas (GHG) emissions. Furthermore, the tourist destination could position itself as a “green destination,” which would strengthen its sustainable image and competitiveness in the global market.
In this context, support from the federal and state governments through economic incentives or partial financing could accelerate project implementation and maximize its environmental and economic impacts.
4. Conclusions
The project is technically, economically and legally feasible, so by implementing it so that the proposed agrovoltaic farms supply almost 580 million kWh annually, mitigating the emission of a little more than 390 thousand tCO2e/year and making the tourist destination of Puerto Vallarta and Nuevo Vallarta a “Green Destination”, thus helping Mexico comply with its international GHG mitigation commitments.
The energy consumption analysis revealed significant differences between hotels of different categories, with an average consumption of 19,267 kWh/room-year. It was determined that 4- and 5-star hotels have significantly higher consumption (22,184 kWh/room-year) compared to 2- and 3-star hotels (5,929 kWh/room-year). Consequently, projections estimate that by 2025 the hotel sector will consume 593.5 million kWh/year, with 97% of the demand attributed to higher-category hotels.
In terms of greenhouse gas (GHG) emissions, the hotel sector generated 270,681 tCO₂e in 2017, considering the overall average, and 300,831 tCO₂e when categorized by category. If current conditions continue, projected emissions by 2025 will reach up to 390,054 tCO₂e, underscoring the need for energy efficiency and emissions reduction strategies.
Deficiencies were identified in the energy management of 2- and 3-star hotels, with obsolete equipment and a lack of energy efficiency policies, in contrast to 4- and 5-star hotels, which have implemented more efficient technologies, heat recovery systems and environmental certifications.
Climate analysis indicated that wind potential in the region is limited due to average wind speeds of 2.2 m/s, while solar radiation (5.4 kWh/m²-day) represents a viable alternative for energy generation through photovoltaic and thermal systems.
Given the high electricity consumption of the hotel sector and the limited space available for rooftop photovoltaic systems, the integration of agrivoltaic systems on nearby agricultural land was proposed, with three implementation models: energy cooperatives, hotel ownership, or third-party leasing. An installed capacity of 366 MWp was estimated to cover the energy demand of luxury hotels, utilizing available solar radiation.
The study highlights the need for incentives for the adoption of renewable energy and the modernization of equipment in lower-category hotels, in addition to the importance of energy efficiency and emissions reduction strategies to mitigate the environmental impact of the tourism sector.
Author Contributions
Conceptualization: L.M.D.-A. and F.M.C.-G.; methodology, L.M.D.-A., F.M.C.-G., N.D.G.-H., E.E.O.-G. and C.P.P.-V.; software, L.M.D.-A., N.D.G.-H., E.E.O.-G., J.F.M.-A. and C.P.P.-V.; validation, L.M.D.-A., F.M.C.-G., N.D.G.-H., E.E.O.-G. and C.P.P.-V.; formal analysis, L.M.D.-A., F.M.C.-G., N.D.G.-H., and E.E.O.-G.; investigation, L.M.D.-A., F.M.C.-G., N.D.G.-H., E.E.O.-G., J.F.M.-A. and C.P.P.-V.; resources, L.M.D.-A., N.D.G.-H., E.E.O.-G. and C.P.P.-V.; data curation, L.M.D.-A., N.D.G.-H. and E.E.O.-G.; writing—original draft preparation, L.M.D.-A., F.M.C.-G., N.D.G.-H., E.E.O.-G. and J.F.M.-A.; writing—review and editing, L.M.D.-A., F.M.C.-G., N.D.G.-H., E.E.O.-G., J.F.M.-A. and C.P.P.-V.; visualization, L.M.D.-A., F.M.C.-G., N.D.G.-H. and E.E.O.-G.; supervision, L.M.D.-A., F.M.C.-G., N.D.G.-H. and E.E.O.-G.; project administration, L.M.D.-A. and C.P.P.-V.; funding acquisition, L.M.D.-A. and F.M.C.-G. All authors have read and agreed to the published version of the manuscript.
Institutional Review Board Statement
Not applicable.
Data Availability Statement
All data is provided.
Acknowledgments
We would like to thank the Technological University of Bahía de Banderas (UTBB), the University of Guadalajara (UdG) and the National Council of Humanities, Sciences and Technologies (CONAHCYT), now the Secretariat of Sciences, Humanities, Technology and Innovation (SECIHTI) of Mexico for their support.
Conflicts of Interest
The authors declare no conflicts of interest.
References
- M. V. Dat y T. Quang, A study on energy consumption of hotel buildings in Vietnam. J. Sci. Technol. Civ. Eng. (JSTCE)-HUCE 2018, 12, 109–116. [Google Scholar] [CrossRef]
- L. M. Dibene-Arriola, F. M. Carrillo-González, S. Quijas y M. C. & Rodríguez-Uribe, Energy efficiency indicators for hotel buildings. Sustainability 2021, 13, 1754. [Google Scholar]
- R. X. W. &. E. L. S. Priyadarsini, A study on energy performance of hotel buildings in Singapore. Energy and buildings 2009, 41, 1319–1324. [Google Scholar]
- M. Tang, X. Fu, H. Cao, Y. Shen, H. Deng y G. Wu,. Energy performance of hotel buildings in Lijiang, China. Sustainability 2016, 8, 1–12. [Google Scholar]
- M. Qi, Y. Shi y X. Li, A Bottom-up Method to Assess Energy Consumption of Main Departments in Five-star Hotels in China. de Building Simulation 2017, 2017. [Google Scholar]
- Centro Mario Molina, 2015. Hacia una Estrategia Nacional de Eficiencia Energética para las edificaciones de Hoteles y Restaurantes. Available online: http://www. sectur. gob. mx/2017/TuristismoSustentable/CambioClimatico/II, 2 [Accessed on 15 enero 2025].
- P. Bohdanowicz y I. Martinac, Determinants and benchmarking of resource consumption in hotels-Case study of Hilton International and Scandic in Europe. Energy and buildings 2007, 39, 82–95. [Google Scholar] [CrossRef]
- J. C. Wang y K. T. Huang, Energy consumption characteristics of hotel’s marketing preference for guests from regions perspective. Energy 2013, 52, 173–184. [Google Scholar] [CrossRef]
- Centro Mario Molina, Hacia una Estrategia Nacional de Eficiencia Energética para las edificaciones de Hoteles y Restaurantes. 2015. Available online: http://www. sectur. gob. mx/2017/TuristismoSustentable/CambioClimatico/II, 2. [Acceced: 15 enero 2025].
- K. M. &. S. Farrou, A method for energy classification of hotels: A case-study of Greece. Energy and Buildings 2012, 55, 553–562. [Google Scholar]
- Ricaurte E, Hotel sustainability benchmarking index 2017. Energy, water, and carbon 2017, 17.
- L. T. M. Esparza y S. M. A. Burne, Una aproximación a la situación turística en la región de Bahía de Banderas, México. Turismo y Sociedad 2017, 20, 105–130. [Google Scholar] [CrossRef]
- Instituto Nacional de Ecología y Cambio Climático (INECC). Available online: https://www.gob.mx/inecc/documentos/normateca-inecc (accessed on 10 March 2025).
- Comisión Reguladora de Energía (CRE). Available online: https://www.gob.mx/cre/archivo/documentos. (accessed on 10 March 2025).
- H. Dinesh y J. M. Pearce, The potential of agrivoltaic systems. Renewable and Sustainable Energy Reviews 2016, 54, 299–308. [Google Scholar] [CrossRef]
- C. Dupraz, H. Marrou, G. Talbot, L. Dufour, A. Nogier y Y. Ferard, Combining solar photovoltaic panels and food crops for optimising land use: Towards new agrivoltaic schemes. Renewable energy 2011, 36, 2725–2732. [Google Scholar] [CrossRef]
- CONAFOR-SEMARNAT, Atlas de Radiación Solar en México. Comisión Nacional Forestal, México, 2020. Available online: https://www.gob.mx/semarnat (accessed on 10 March 2025).
- H. Marrou, L. Guilioni, L. Dufour, C. Dupraz y J. Wery, Microclimate under agrivoltaic systems: Is crop growth rate affected in the partial shade of solar panels? Agricultural and Forest Meteorology 2013, 177, 117–132. [Google Scholar] [CrossRef]
- Weselek, A. Ehmann, S. Zikeli, I. Lewandowski, S. Schindele y P. Högy, Agrophotovoltaic systems: Applications, challenges, and opportunities. A review. Agronomy for Sustainable Development 2019, 39, 1–20. [Google Scholar] [CrossRef]
- R. R. Hernandez, A. Armstrong, J. Burney, G. Ryan, M.-O. K., I. Diédhiou y D. M. Kammen, Techno–ecological synergies of solar energy for global sustainability. Nature Sustainability 2019, 2, 560–568. [Google Scholar] [CrossRef]
- G. Gispert y R. M. Chávez-Dagostino, Gestión ambiental hotelera en Puerto Vallarta: motivaciones y limitantes. Nóesis. Revista de Ciencias Sociales 2021, 30, 251–269. [Google Scholar] [CrossRef]
- T. Otzen y C. Manterola, Técnicas de Muestreo sobre una Población a Estudio. International Journal of Morphology 2017, 35, 227–232. [Google Scholar] [CrossRef]
- C. Espíndola y J. Valderrama, Huella del carbono. Parte 1: conceptos, métodos de estimación y complejidades metodológicas. Información tecnológica 2012, 23, 163–176. [Google Scholar] [CrossRef]
- SEMARNAT, Teoría y conceptos generales para elaborar inventarios verificables de emisiones de gases de efecto invernadero. México. 2015. Available online: https://www.gob.mx/semarnat/documentos/teoria-y-conceptos-generales-para-elaborar-inventarios-verificables (accessed on 15 January 2025).
- Compendio Estadístico del Turismo en México 2020, DATATUR. 2021. Available online: http://www.datatur.sectur.gob.mx/SitePages/Actividades%20En%20Crucero.aspx (accessed on 1 March 2022).
- B. Rosselló-Batle, A. Moià, A. Cladera y V. Martínez, Energy use, CO2 emissions and waste throughout the life cycle of a sample of hotels in the Balearic Islands. Energy and Buildings 2010, 42, 547–558. [Google Scholar] [CrossRef]
- M. Beccali, M. La Gennusa, L. L. Coco y G. Rizzo, An empirical approach for ranking environmental and energy saving measures in the hotel sector. Renewable energy 2009, 34, 82–90. [Google Scholar] [CrossRef]
- SEMARNAT, Guía de eficiencia energética en el diseño, construcción y operación de hoteles en climas cálidos. 2020.
- J. Camacho-Sandoval, Coeficiente de concordancia para variables continuas. Acta médica costarricense 2008, 50, 211–212. [Google Scholar]
- F. Fernández G., CLIMA Y CONFORTABILIDAD HUMANA. ASPECTOS METODOLÓGICOS. Serie Geográfica 1994, 4, 109–125. [Google Scholar]
- R. L. García y B. M. Azúa, Caracterización del régimen bioclimático humano en el Área Metropolitana de Guadalajara, México. Revista Geográfica, pp. 29-56, 2018.
- J. M. Diaz, Cuantificación del perfil del viento hasta 100 m de altura desde la superficie y su incidencia en la climatología eólica. Terra 2013, 29, 81–101. [Google Scholar]
- S. Deng y J. Burnett, Study of energy performance of hotel buildings in Hong Kong. Energy and Buildings 2000, 31, 7–12. [Google Scholar] [CrossRef]
- SENER, Estudio de eficiencia energética en hoteles. 2015. Available online: https://www.gob.mx/sener/documentos/estudios-de-eficiencia-energetica (accessed on 17 May 2021).
- Cámara de Diputados del, H. Congreso de la Unión, LEY DE LA INDUSTRIA ELÉCTRICA. 2014. Available online: https://www.diputados.gob.mx/LeyesBiblio/pdf/LIElec.pdf (accessed on 16 February 2025).
- Secretaría de Gobernación, México, Diario Oficial de la Federación. 2018. Available online: https://dof.gob.mx/nota_detalle.php?codigo=5512744&fecha=09/02/2018#gsc.tab=0 (accessed on 14 December 2024).
- Comisión Reguladora de Energía, Código de Red. 2022. Available online: https://www.dof.gob.mx/nota_detalle.php?codigo=5639920&fecha=31/12/2021#gsc.tab=0 (accessed on 17 August 2023).
- SENER, ACUERDO que abroga el diverso por el que se determina el concepto de demanda y los requisitos para la agregación de Centros de Carga para ser considerados como Usuarios Calificados publicado el 26 de enero de 2016. 2017. Available online: https://www.cenace.gob.mx/Docs/16_MARCOREGULATORIO/Suministro/(DOF%202017-03-01%20SENER)%20Agregaci%C3%B3n%20de%20Centros%20de%20Carga%20para%20Usuarios%20Calificados.pdf (accessed on day month year).
- Magarelli, A. Mazzeo y G. Ferrara, Fruit Crop Species with Agrivoltaic Systems: A Critical Review. Agronomy 2024, 14, 722. [Google Scholar] [CrossRef]
- M. Kumpanalaisatit, W. Setthapun, H. Sintuya, A. Pattiya y S. N. Jansri, Current status of agrivoltaic systems and their benefits to energy, food, environment, economy, and society. Sustainable Production and Consumption 2022, 33, 952–963. [Google Scholar] [CrossRef]
- M. H. Alsharif, M. S. Younis y R. Kim, Optimal Design and Performance Analysis of an Agrivoltaic System: A Case Study in a Tropical Climate. IEEE Access 2022, 10, 105230–105246. [Google Scholar]
- N. Gomez-Casanovas, P. Mwebaze, M. Khanna, B. Branham, A. Time, E. H. DeLucia, C. J. Bernacchi, A. K. Knapp, M. J. Hoque, X. Du, E. Blanc-Betes, G. A. Barron-Gafford, B. Peng, K. Guan, J. Macknick, R. Miao y N, Conocimientos, incertidumbres y desafíos de la agrovoltaica para intensificar de forma sostenible la producción de energía y alimentos. Cell Reports Physical Science 2023, 4, 101518–10542. [Google Scholar]
- F. Ferroni y R. Hopkirk, Energy Return on Energy Invested (ERoEI) for photovoltaic solar systems in regions of moderate insolation. Energy Policy 2016, 94, 336–344. [Google Scholar] [CrossRef]
- Sistema de Información del Mercado CENACE, Programa de Ampliación y Modernización de la RNT y de la RGD. [En línea]. Available online: https://www.cenace.gob.mx/Paginas/SIM/ProgramaRNT_RDG.aspx (accessed on 24 January 2025).
- CFE, CFE Negocio Tarifas. Available online: https://app.cfe.mx/Aplicaciones/CCFE/Tarifas/TarifasCRENegocio/Tarifas/GranDemandaMTH.aspx (accessed on 10 March 2025).
Figure 1.
Average monthly occupancy (%) for national, foreign and total tourists (2017-2019) for Puerto Vallarta and Nuevo Vallarta (DATATUR, 2021).
Figure 1.
Average monthly occupancy (%) for national, foreign and total tourists (2017-2019) for Puerto Vallarta and Nuevo Vallarta (DATATUR, 2021).
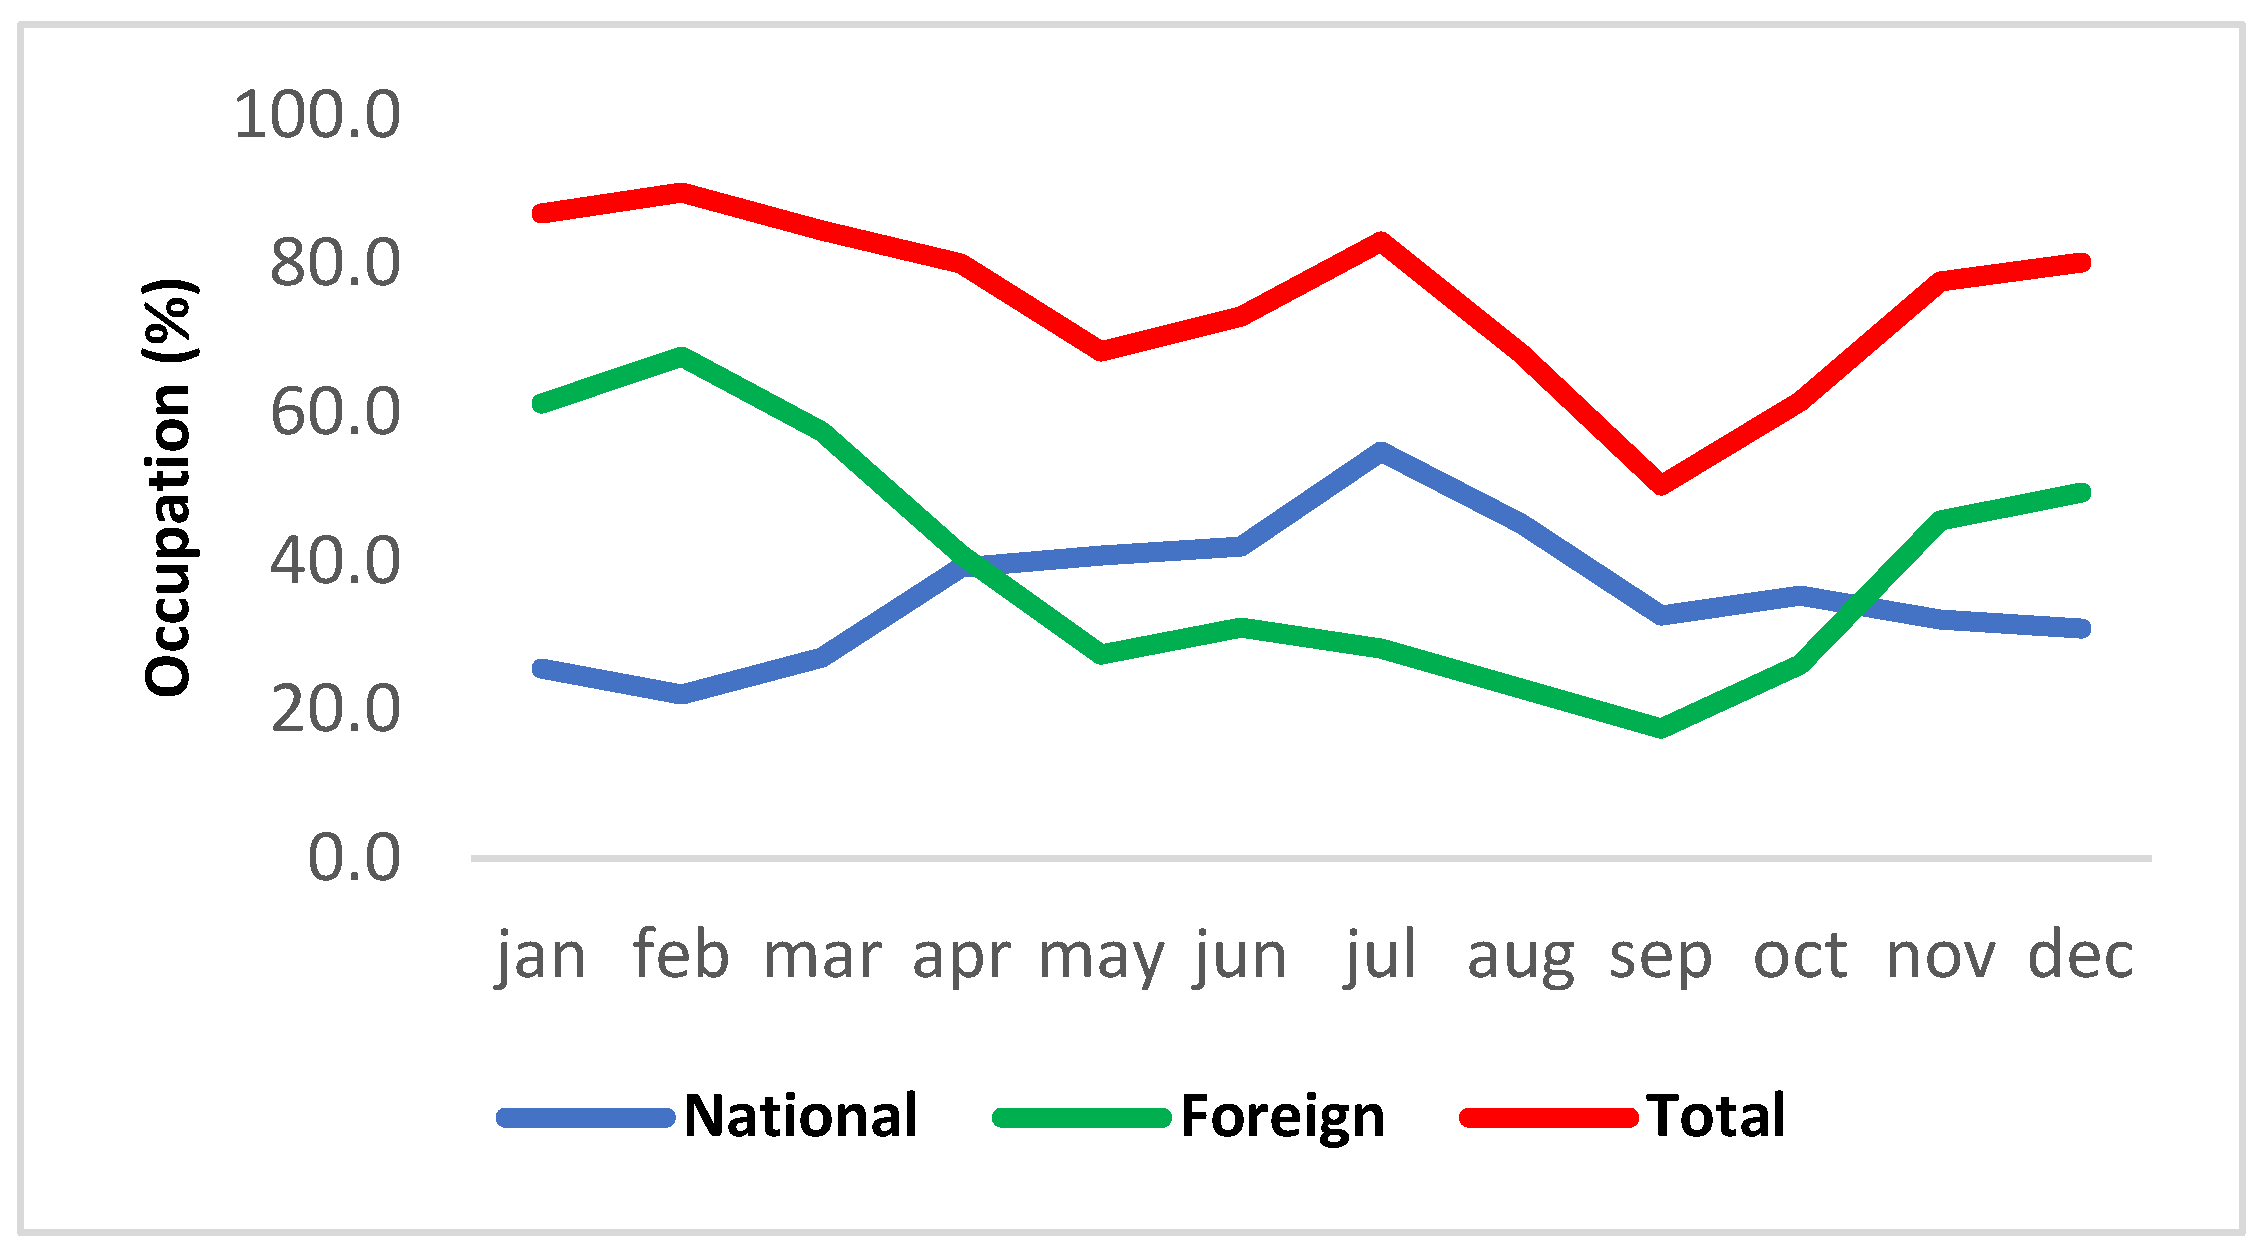
Figure 2.
a) Monthly average horizontal global radiation (kWh/m2) and b) Monthly average temperature (°C) (2015 to 2019). Source: Own elaboration.
Figure 2.
a) Monthly average horizontal global radiation (kWh/m2) and b) Monthly average temperature (°C) (2015 to 2019). Source: Own elaboration.
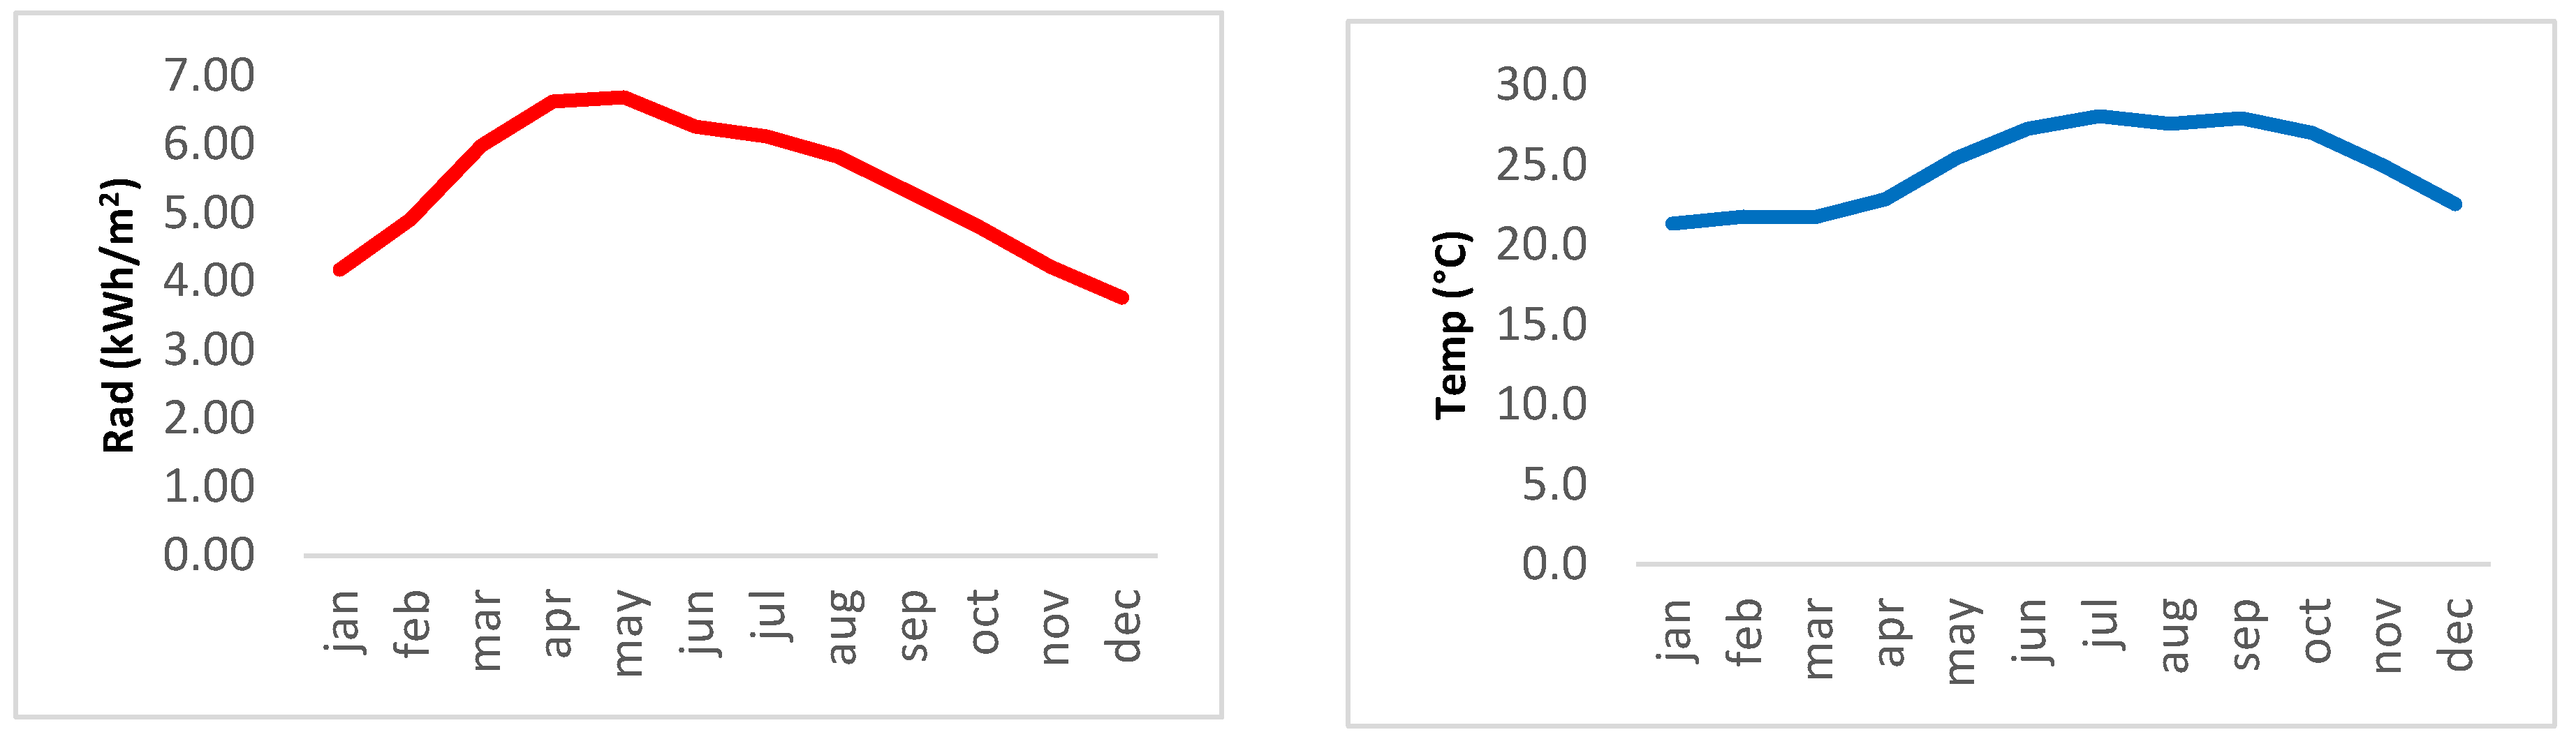
Figure 3.
a) Monthly average relative humidity and b) Monthly average wind speed (2015 to 2019). Source: Own elaboration.
Figure 3.
a) Monthly average relative humidity and b) Monthly average wind speed (2015 to 2019). Source: Own elaboration.
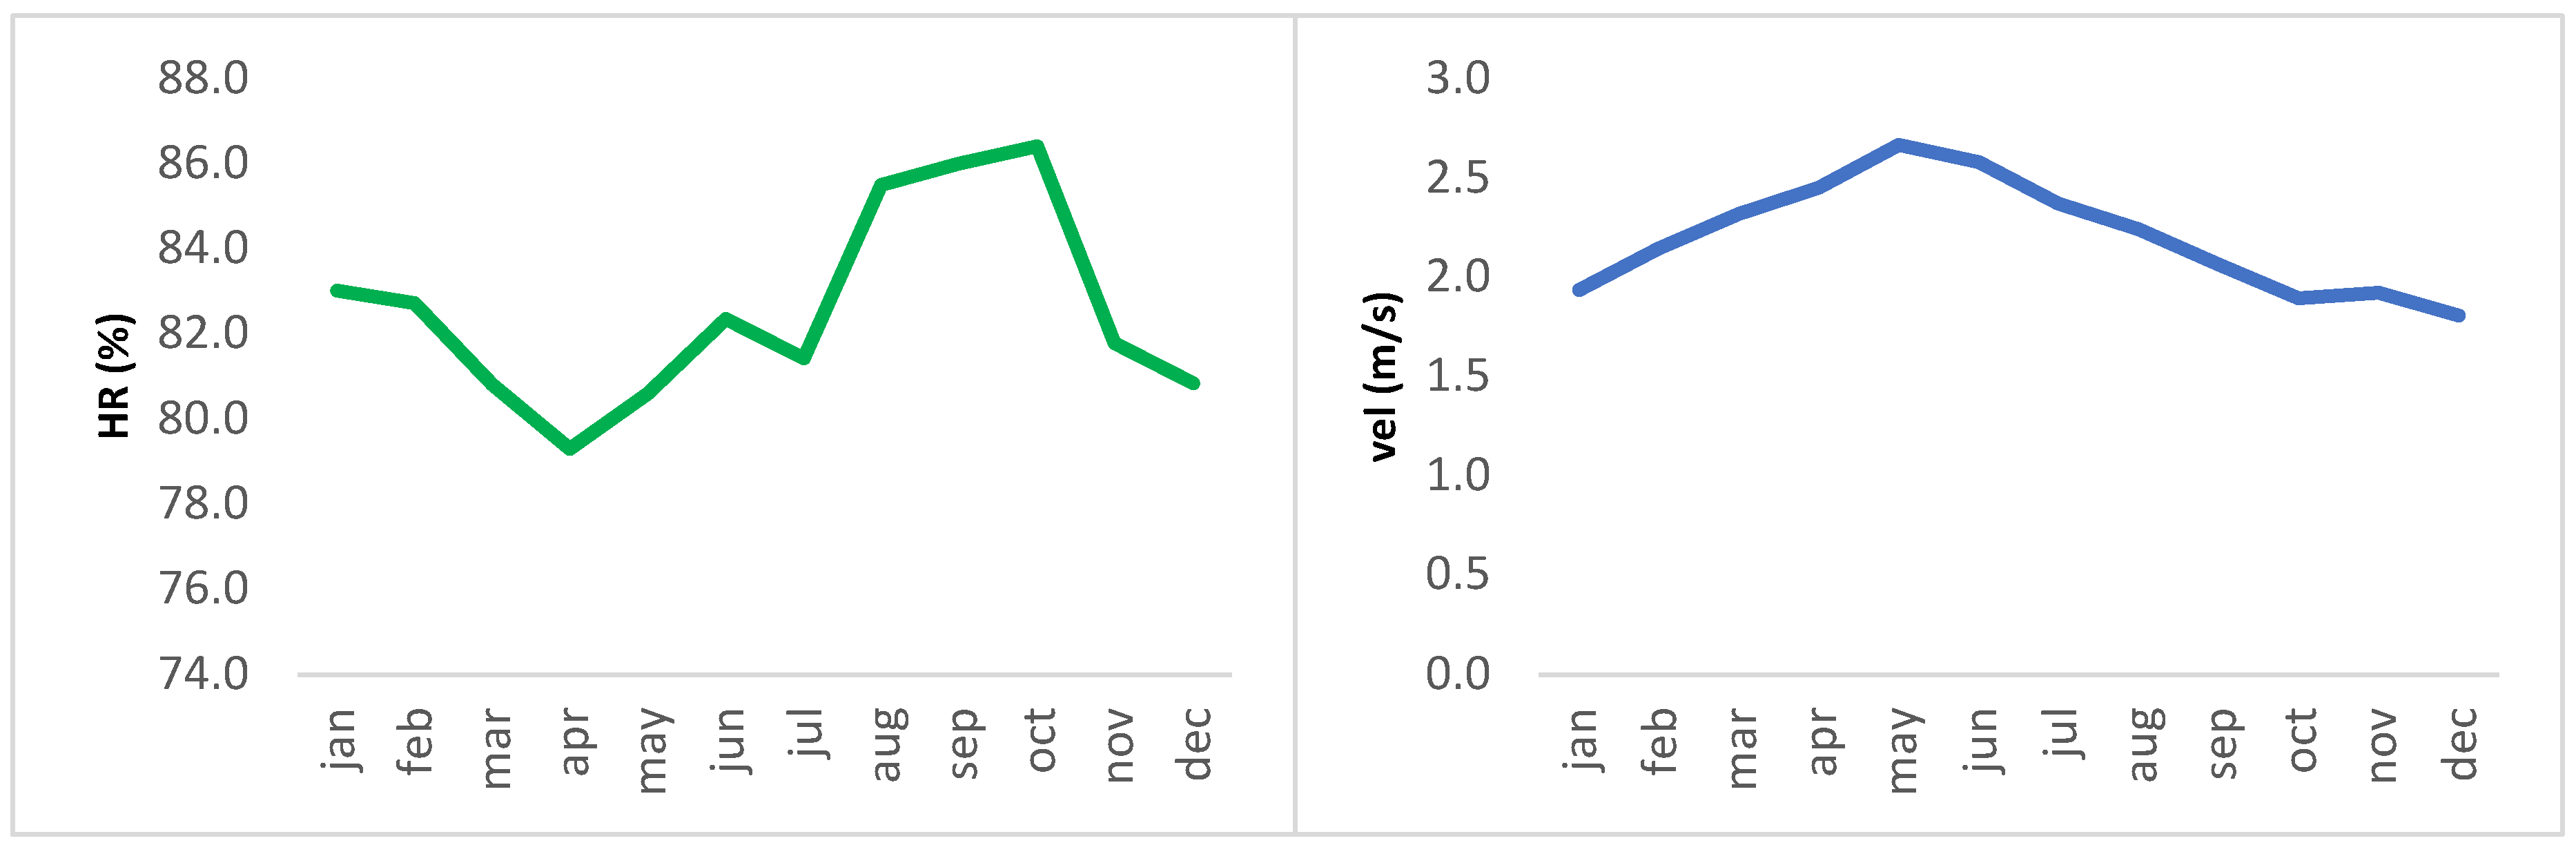
Figure 4.
Monthly average horizontal global radiation NASA vs UTBB. Source: Own elaboration.
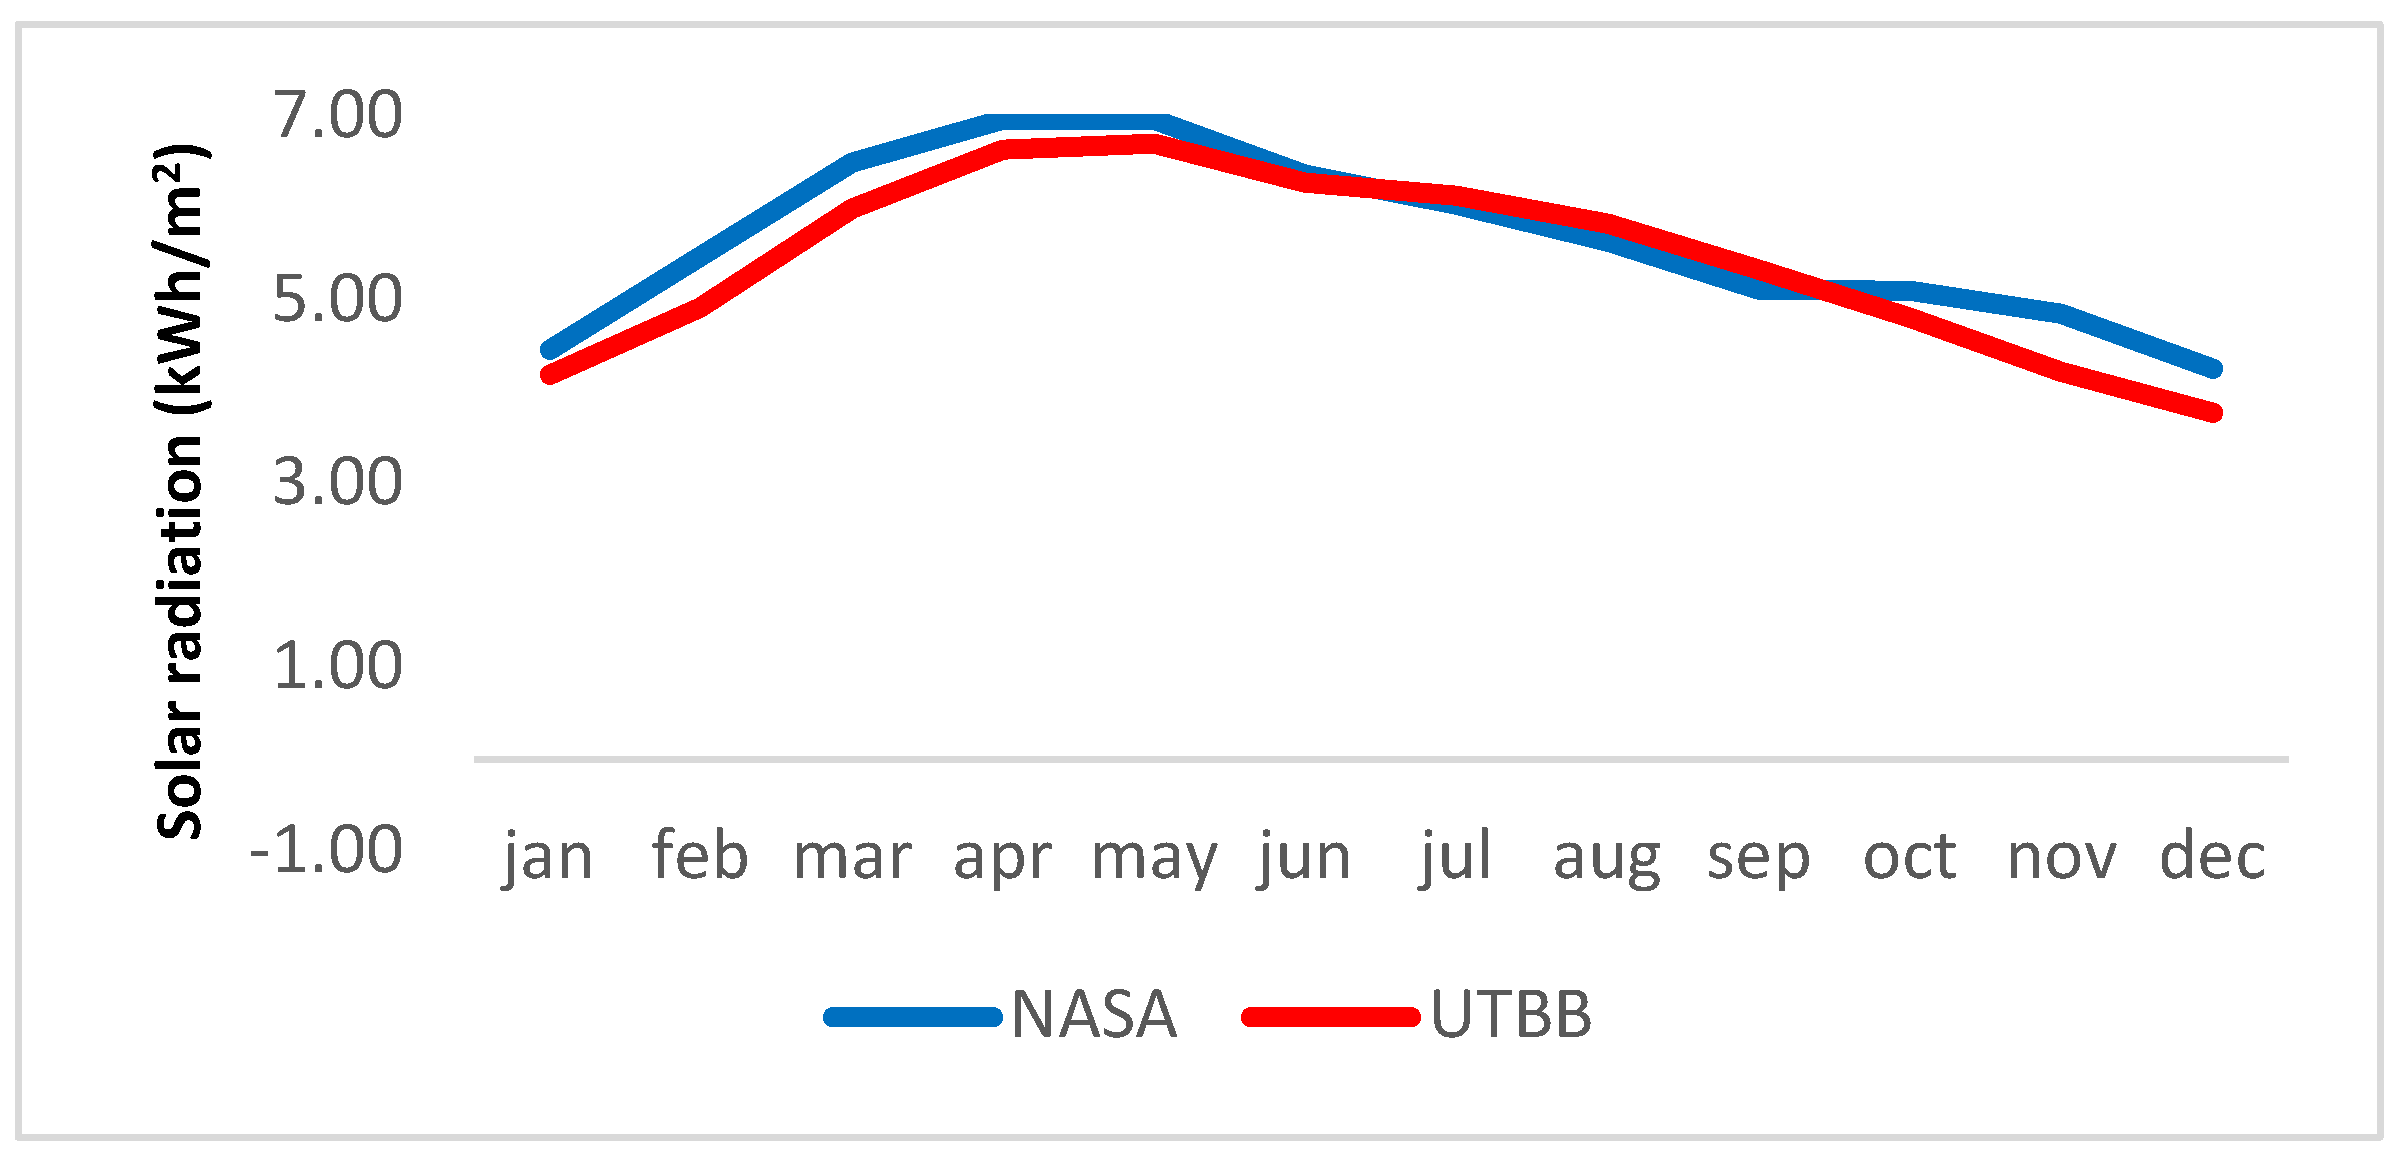
Figure 5.
Monthly electricity consumption of hotel 11 vs. average monthly temperature (°C) and average monthly occupancy (%) for the year 2019. Source: Own elaboration.
Figure 5.
Monthly electricity consumption of hotel 11 vs. average monthly temperature (°C) and average monthly occupancy (%) for the year 2019. Source: Own elaboration.
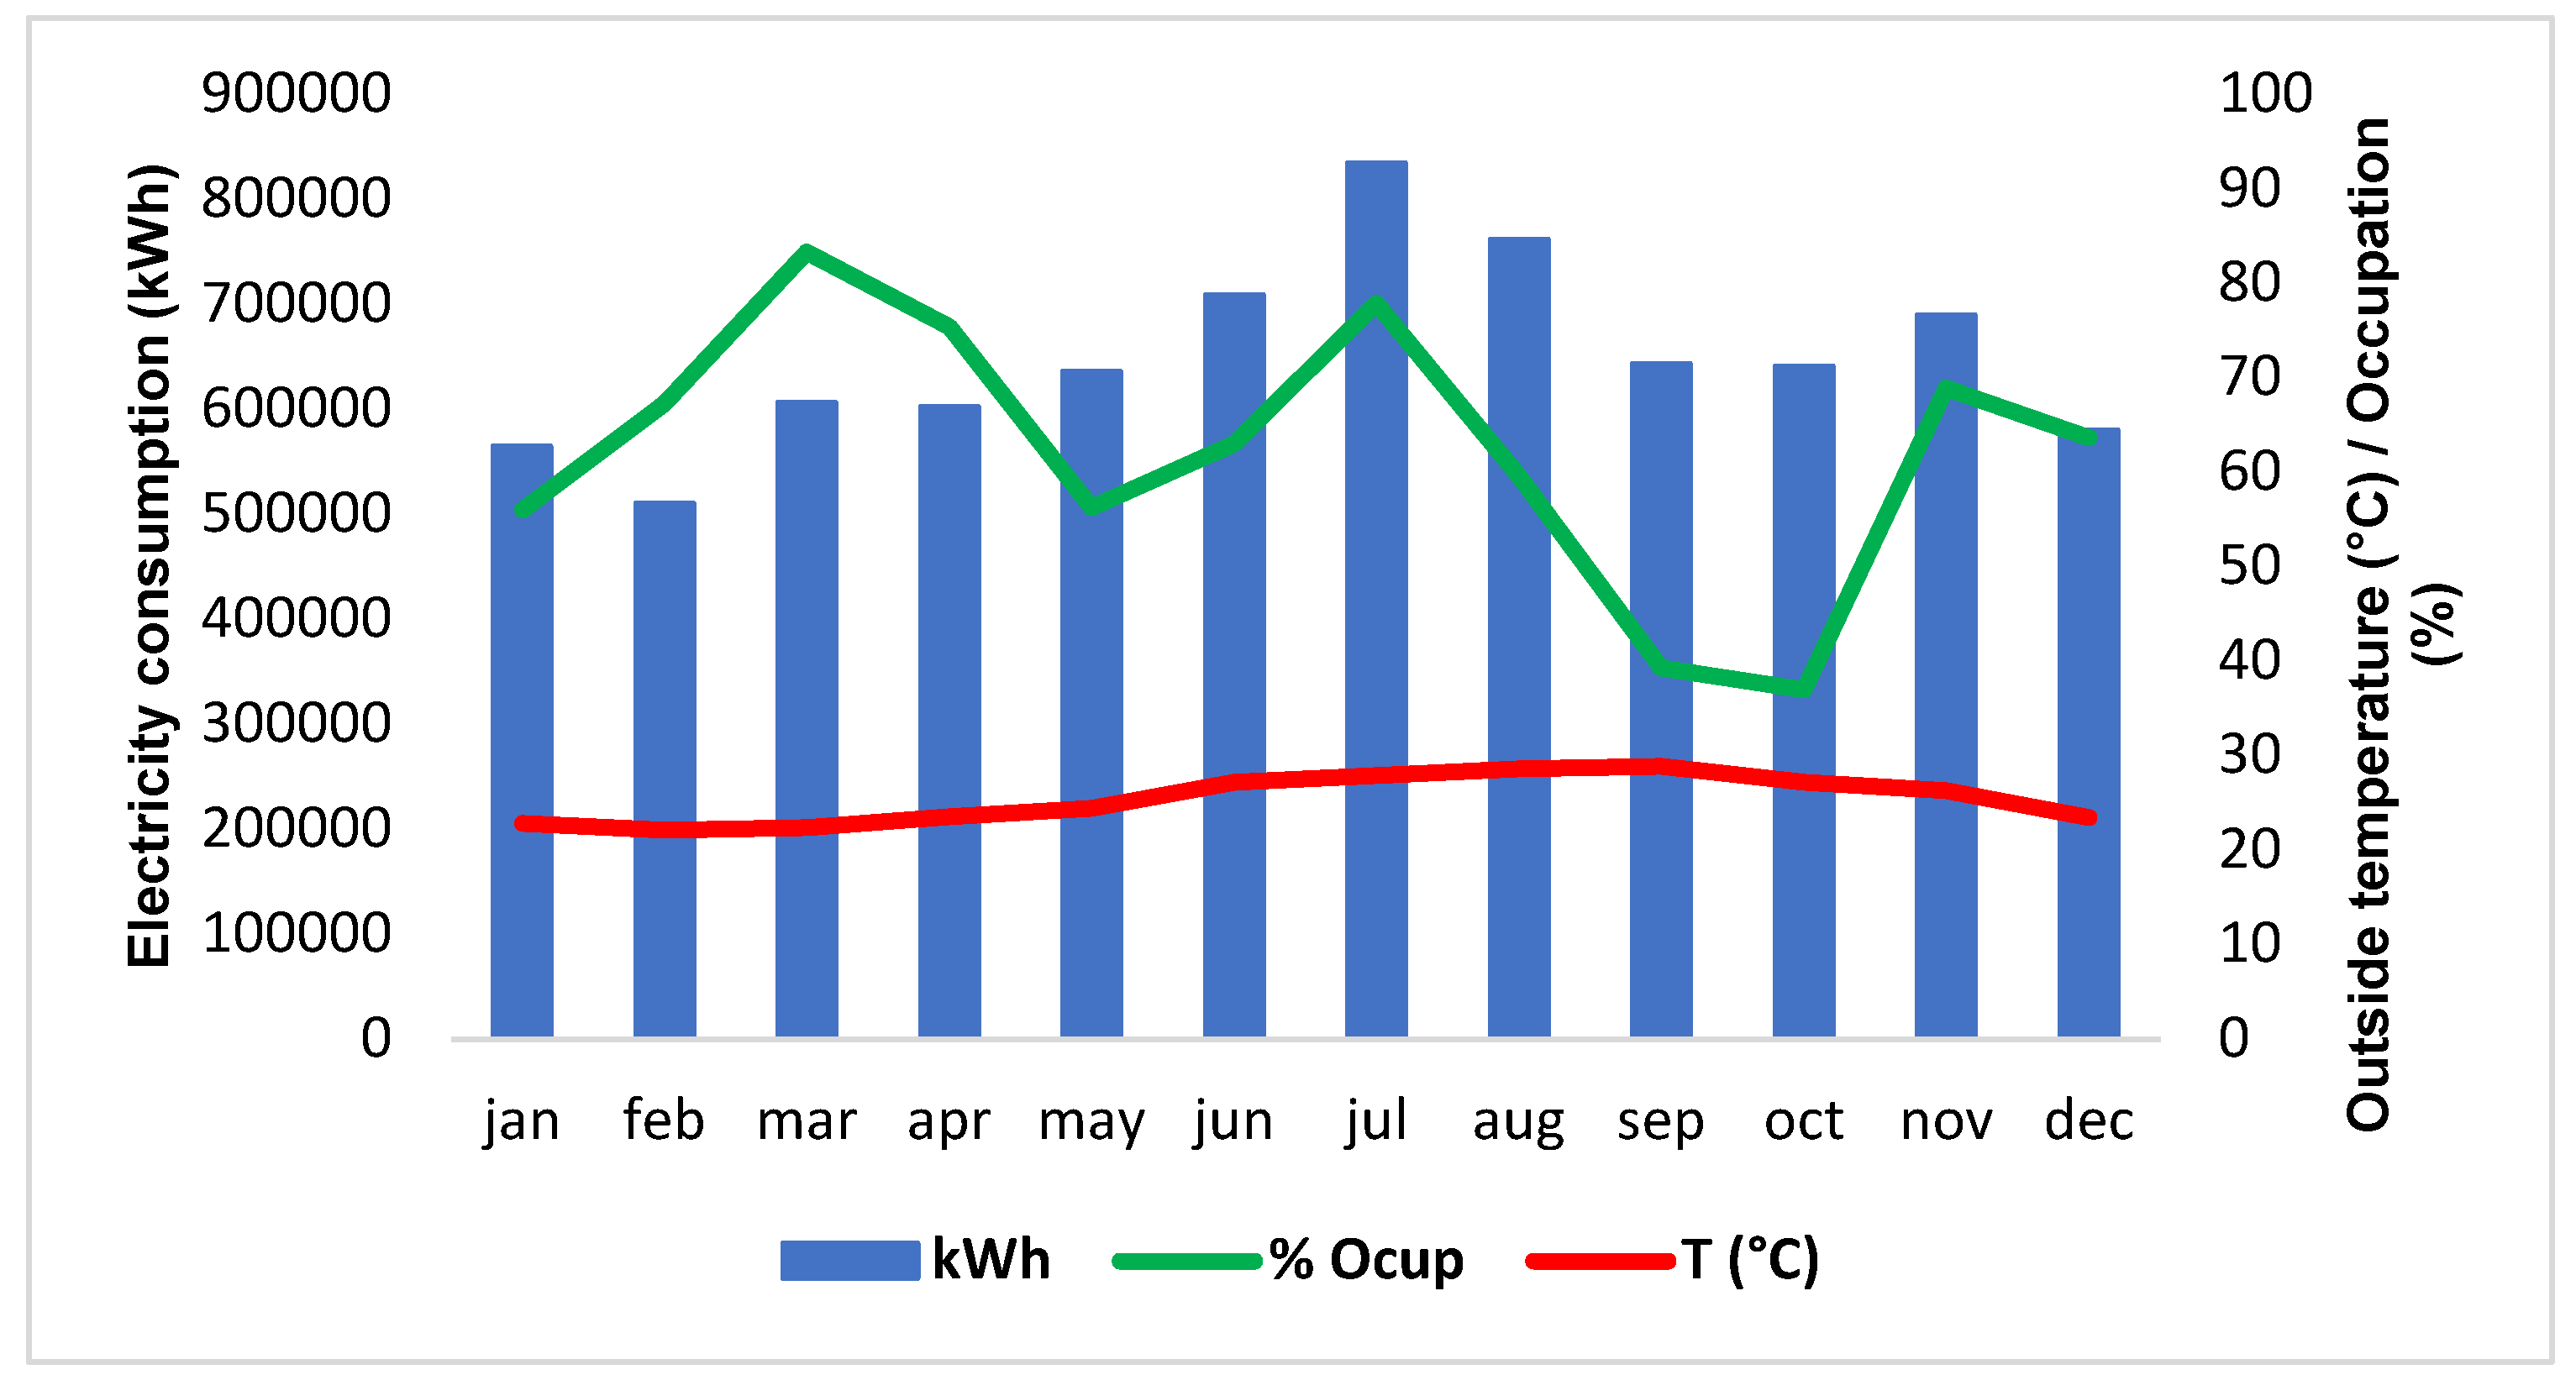
Figure 6.
Permits for planting surface in Distrito de Riego 043, Bahía de Banderas section. Source: Oficina de usuarios del agua Distrito de Riego 043.
Figure 6.
Permits for planting surface in Distrito de Riego 043, Bahía de Banderas section. Source: Oficina de usuarios del agua Distrito de Riego 043.
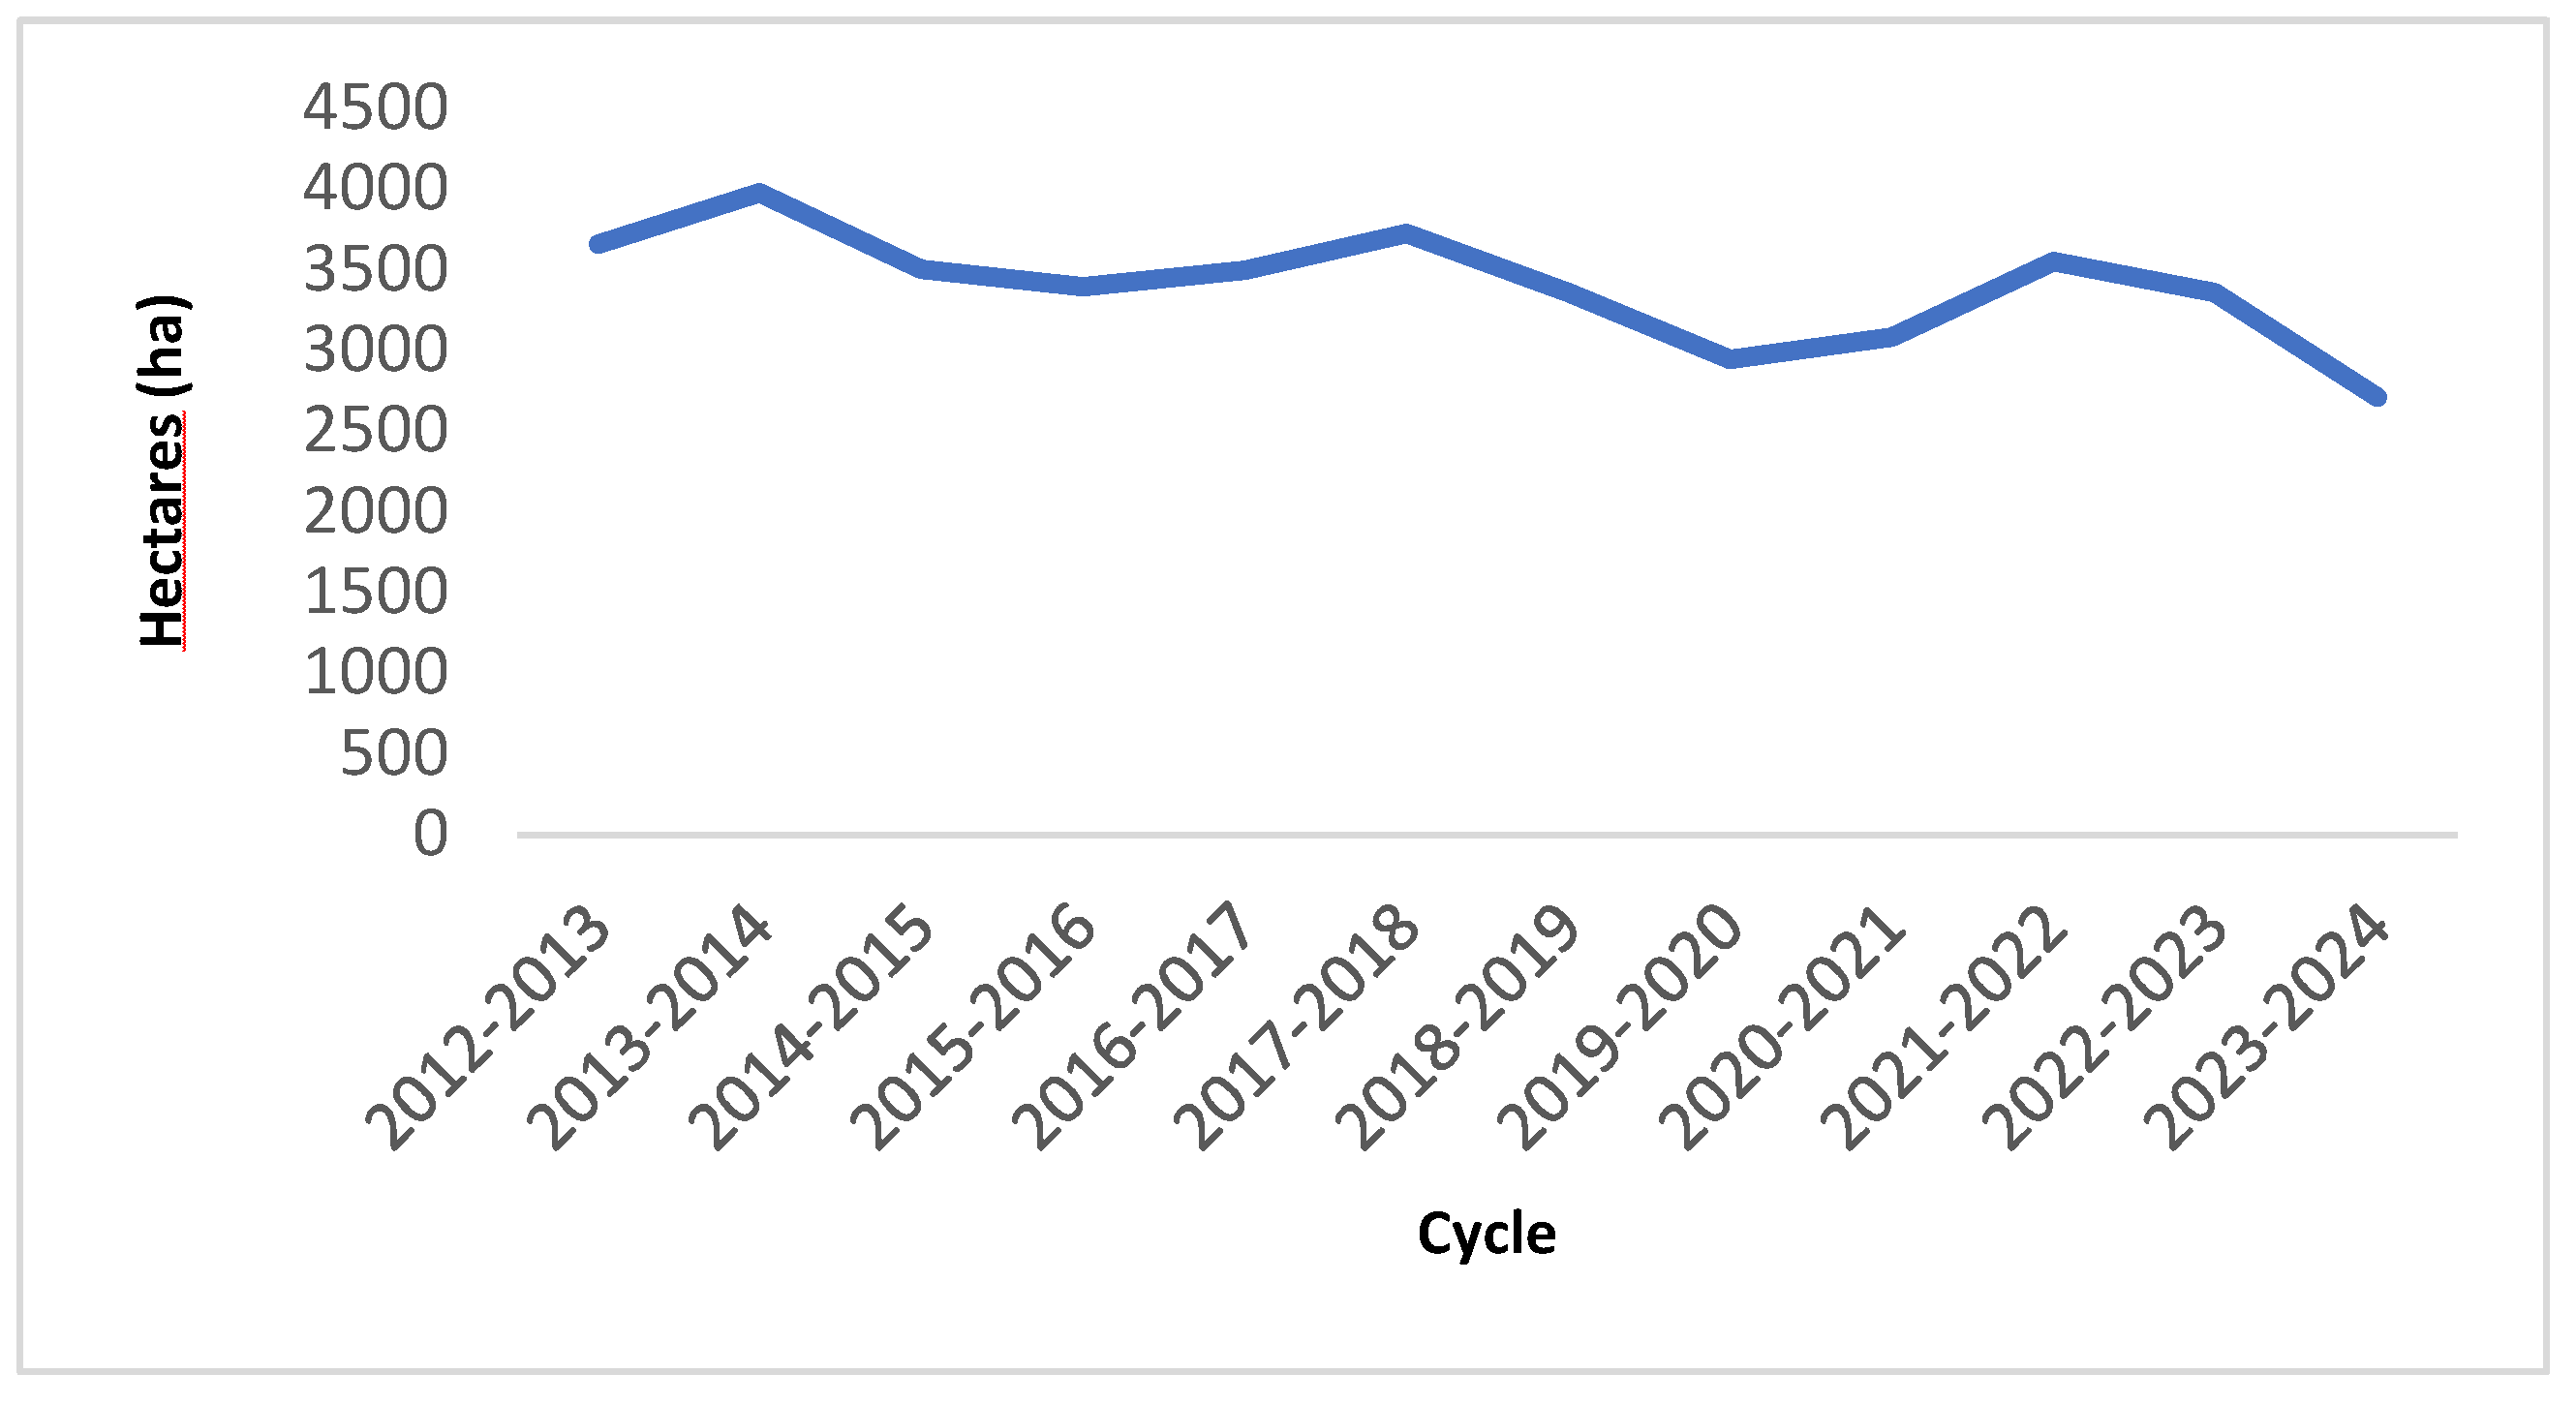
Figure 7.
Distribution of crop types in the 2023-2024 season, the water supply network, roads, and the electricity distribution network in the distrito de riego 043. Source: Own elaboration.
Figure 7.
Distribution of crop types in the 2023-2024 season, the water supply network, roads, and the electricity distribution network in the distrito de riego 043. Source: Own elaboration.
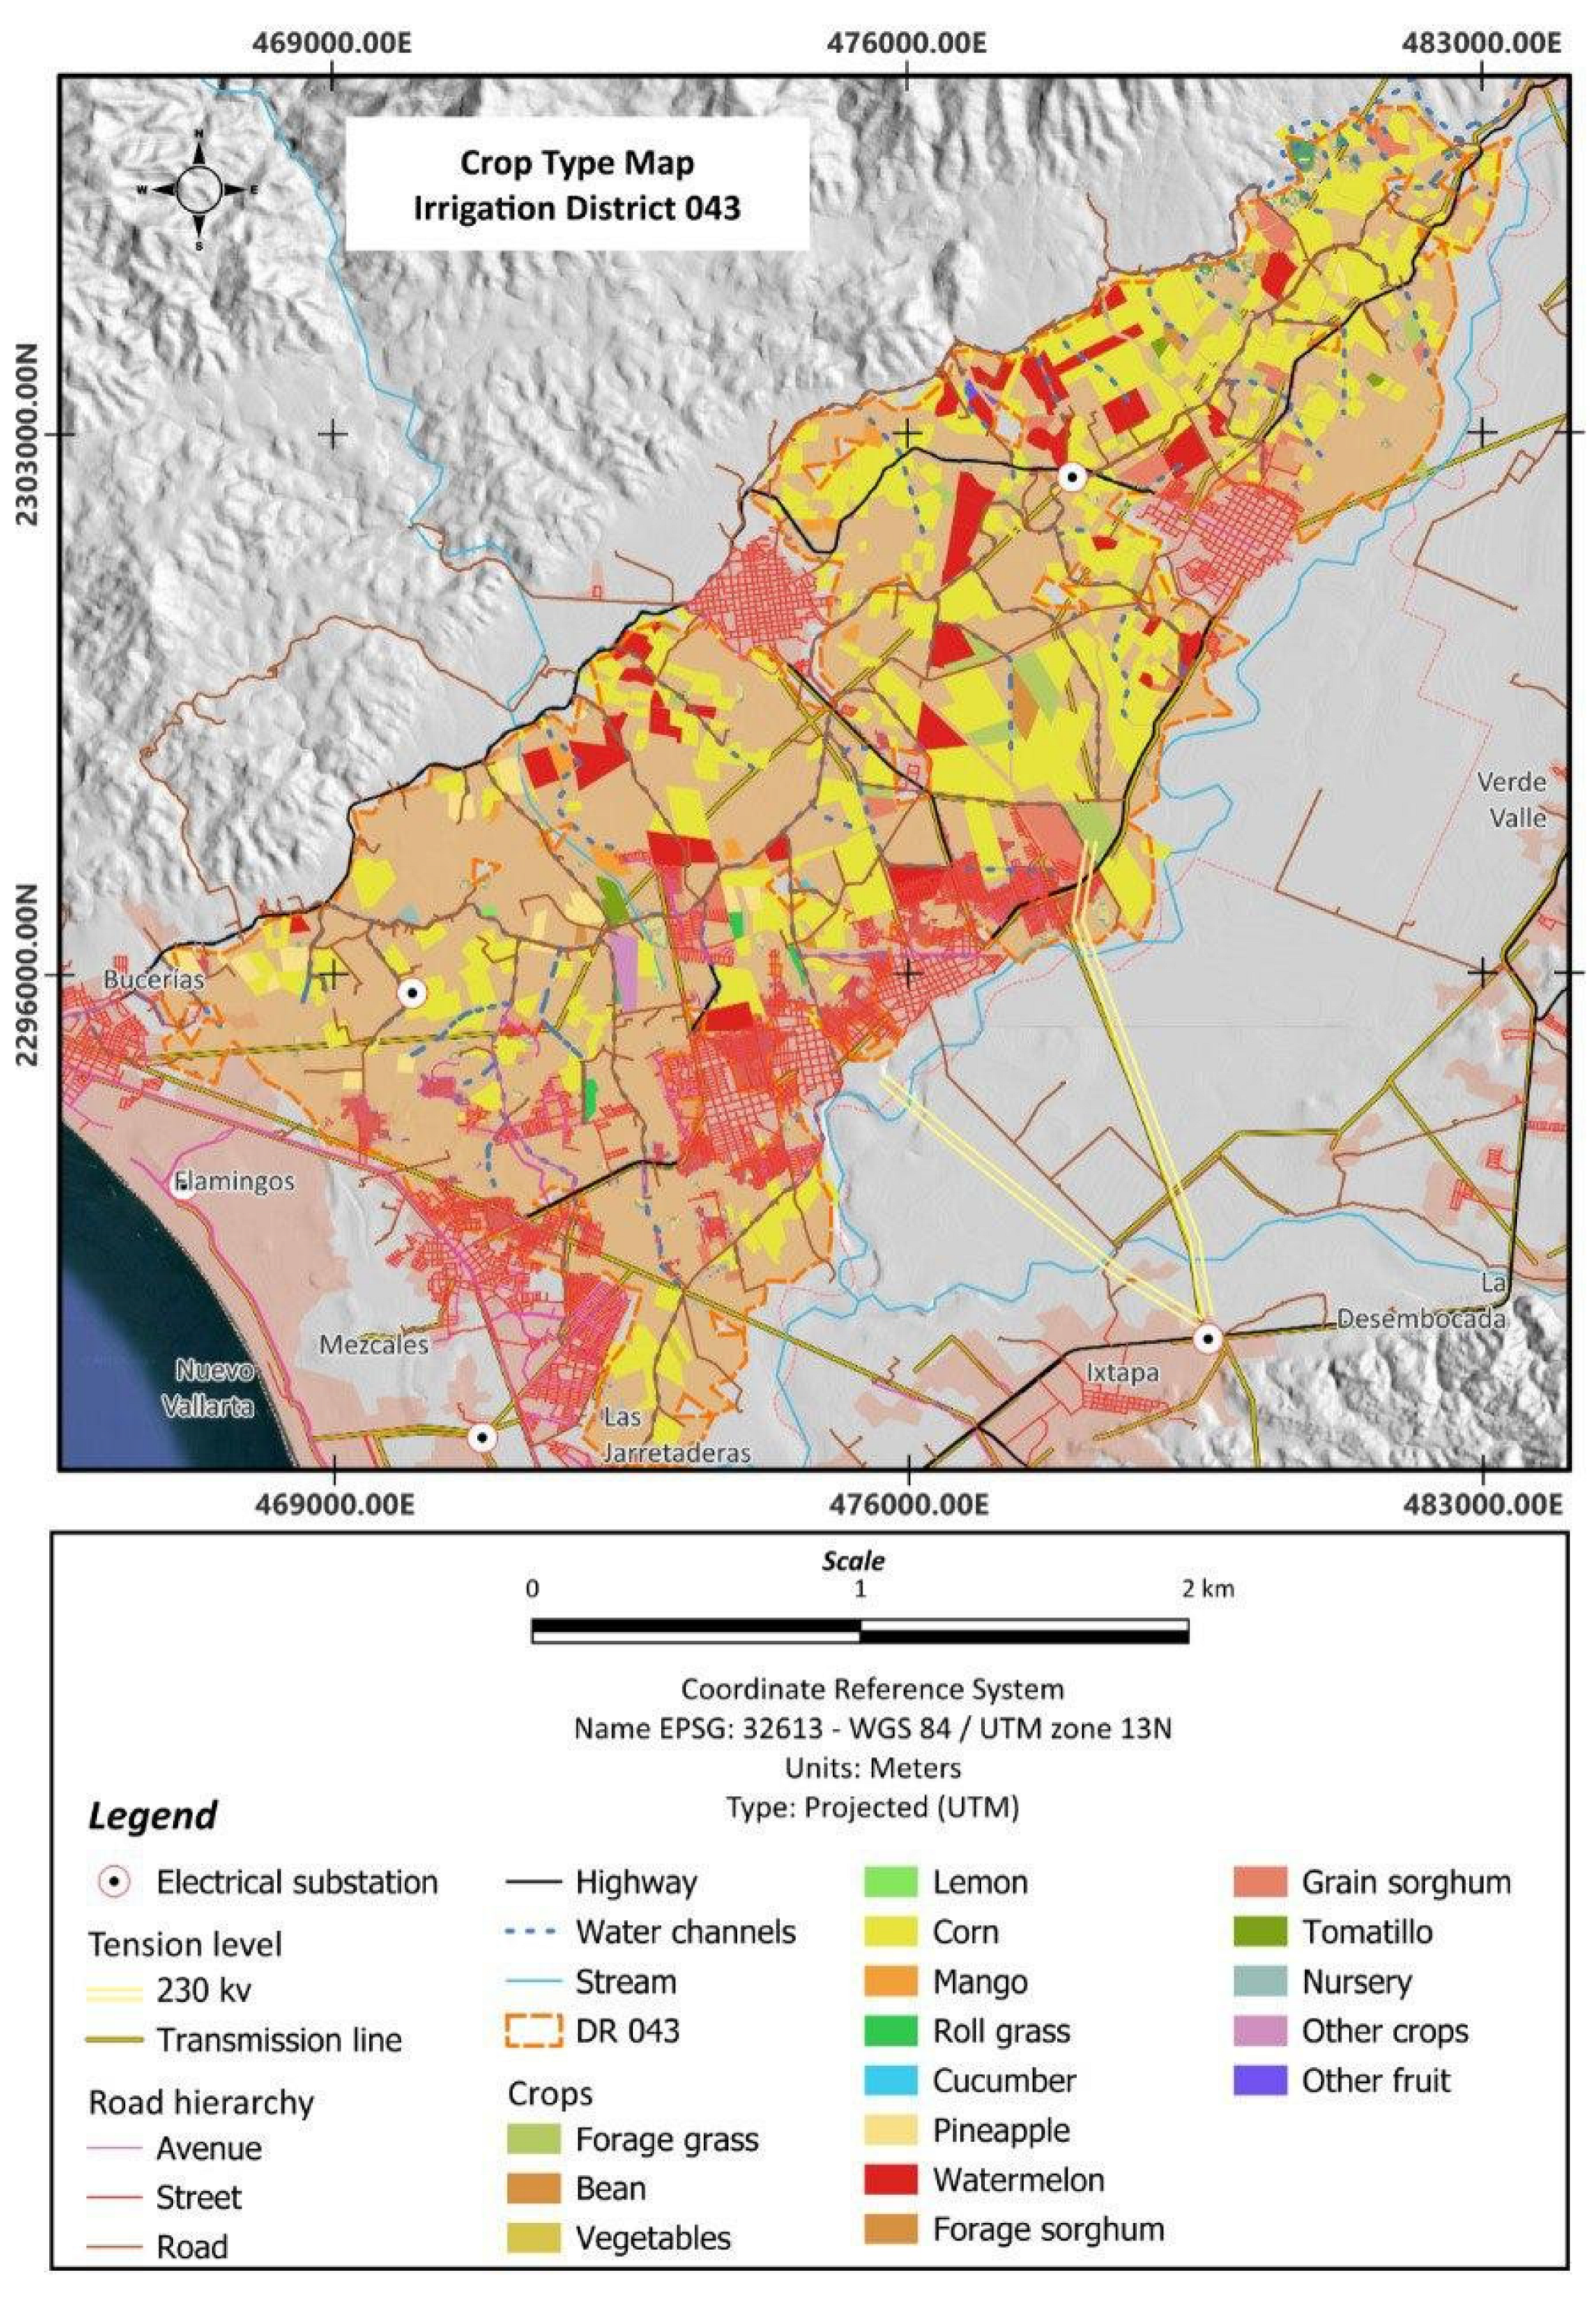
Figure 8.
Panel placement at a 20° angle facing south. Measurements in meters (m). Source: Own elaboration.
Figure 8.
Panel placement at a 20° angle facing south. Measurements in meters (m). Source: Own elaboration.
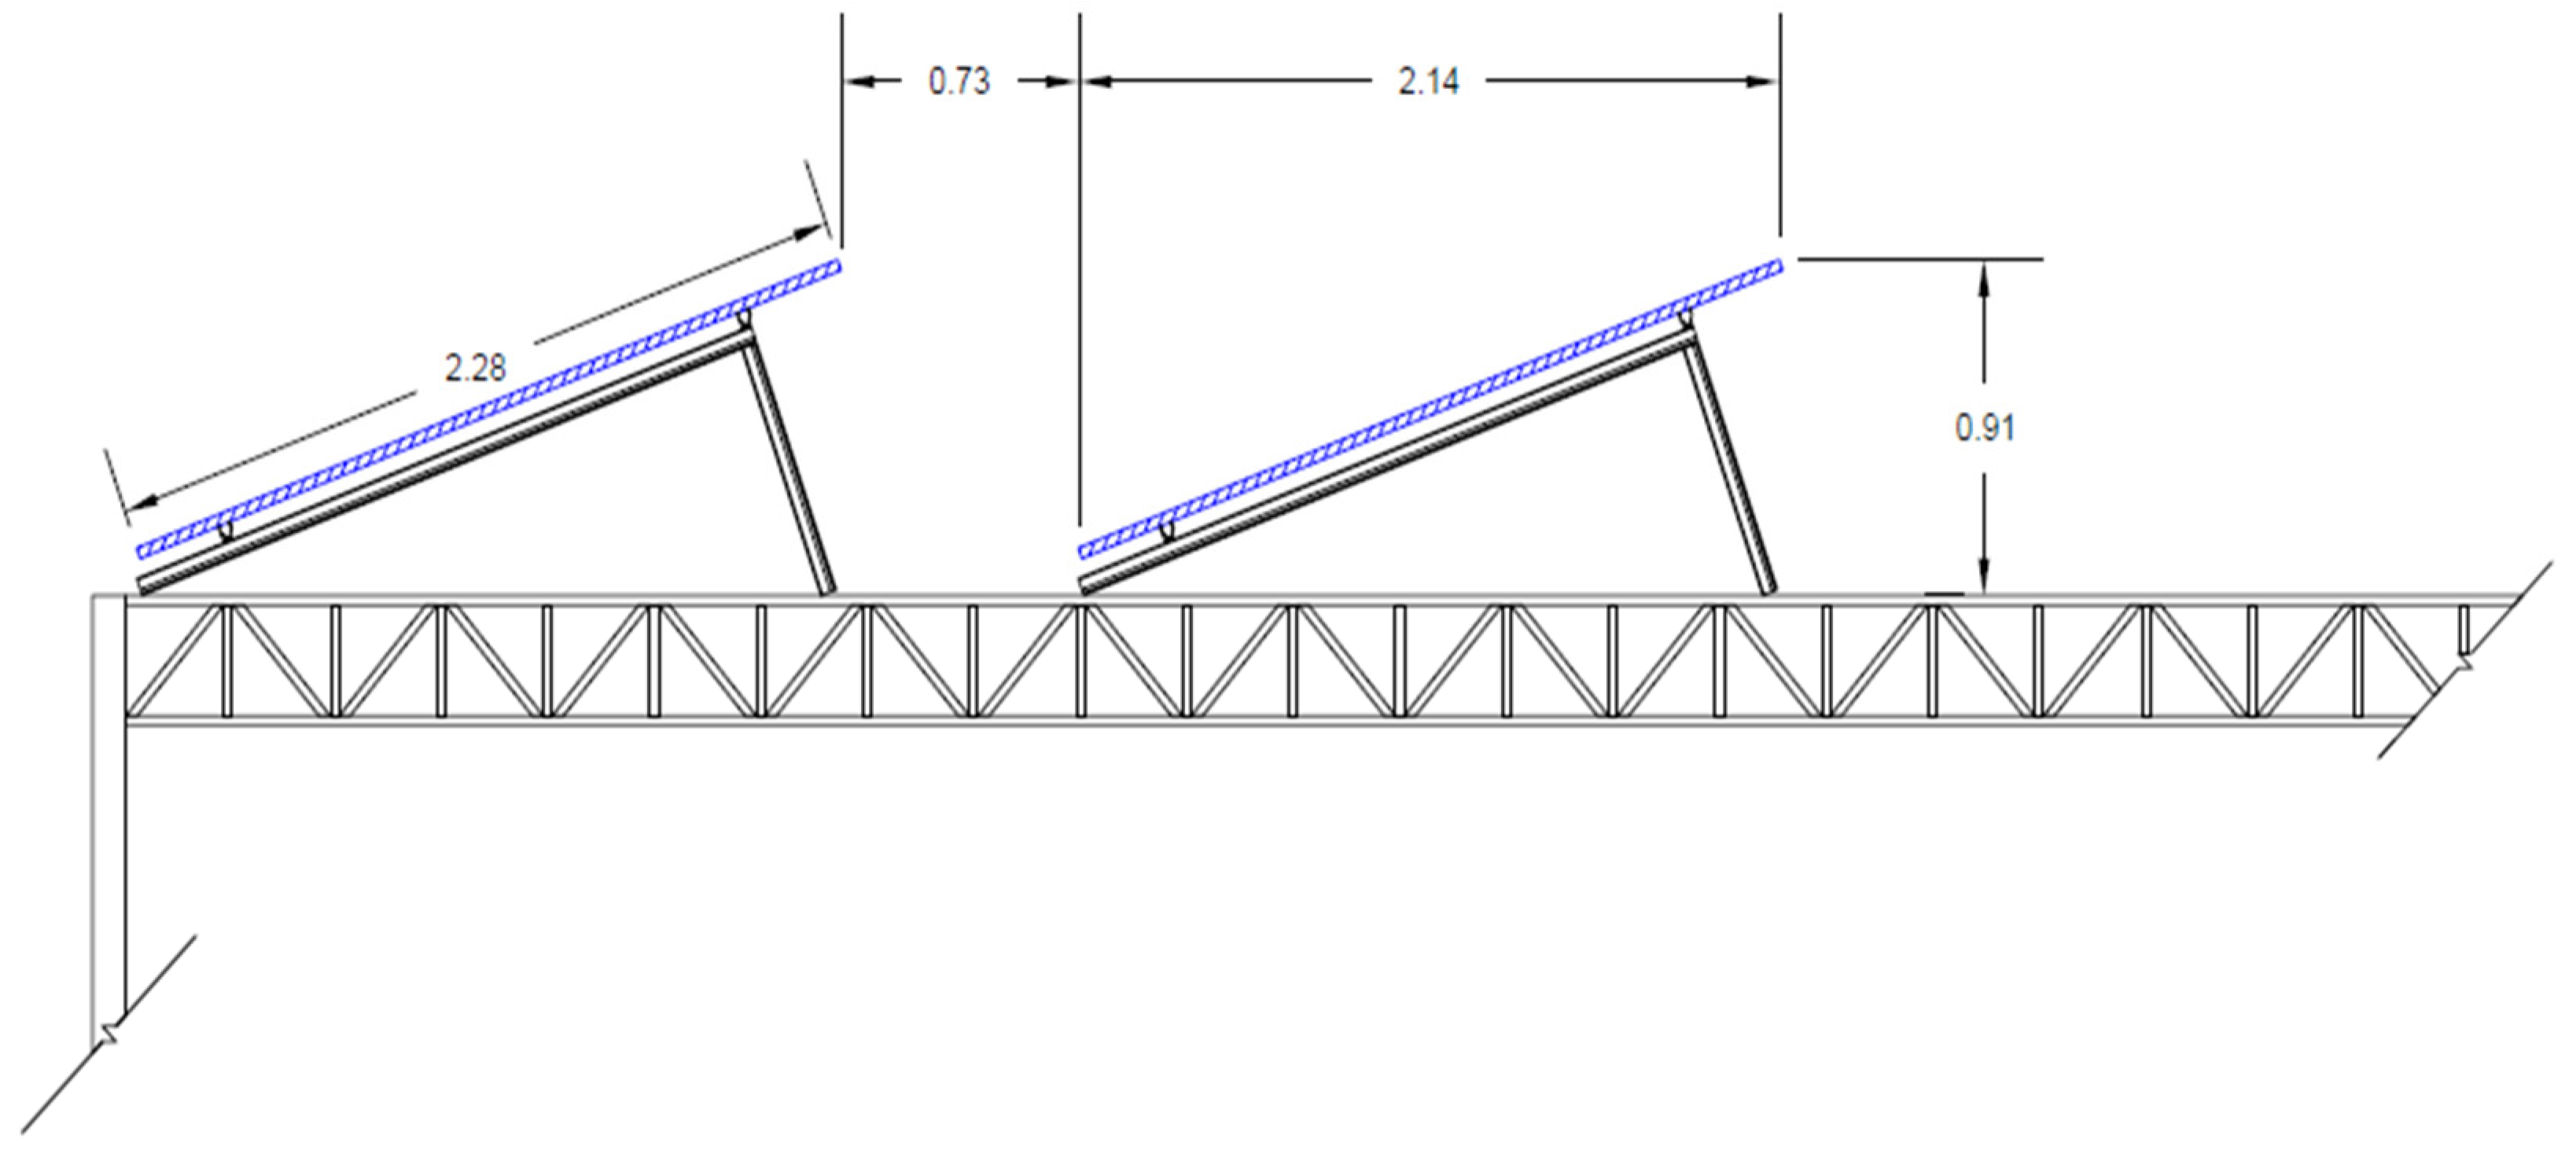
Figure 9.
Planting of 600Wp panels. Total 1,476 panels/ha or 0.88 MW/ha. Note: The dark area corresponds to the panels and the light part to the space so that they do not shade each other. Source: Own elaboration.
Figure 9.
Planting of 600Wp panels. Total 1,476 panels/ha or 0.88 MW/ha. Note: The dark area corresponds to the panels and the light part to the space so that they do not shade each other. Source: Own elaboration.
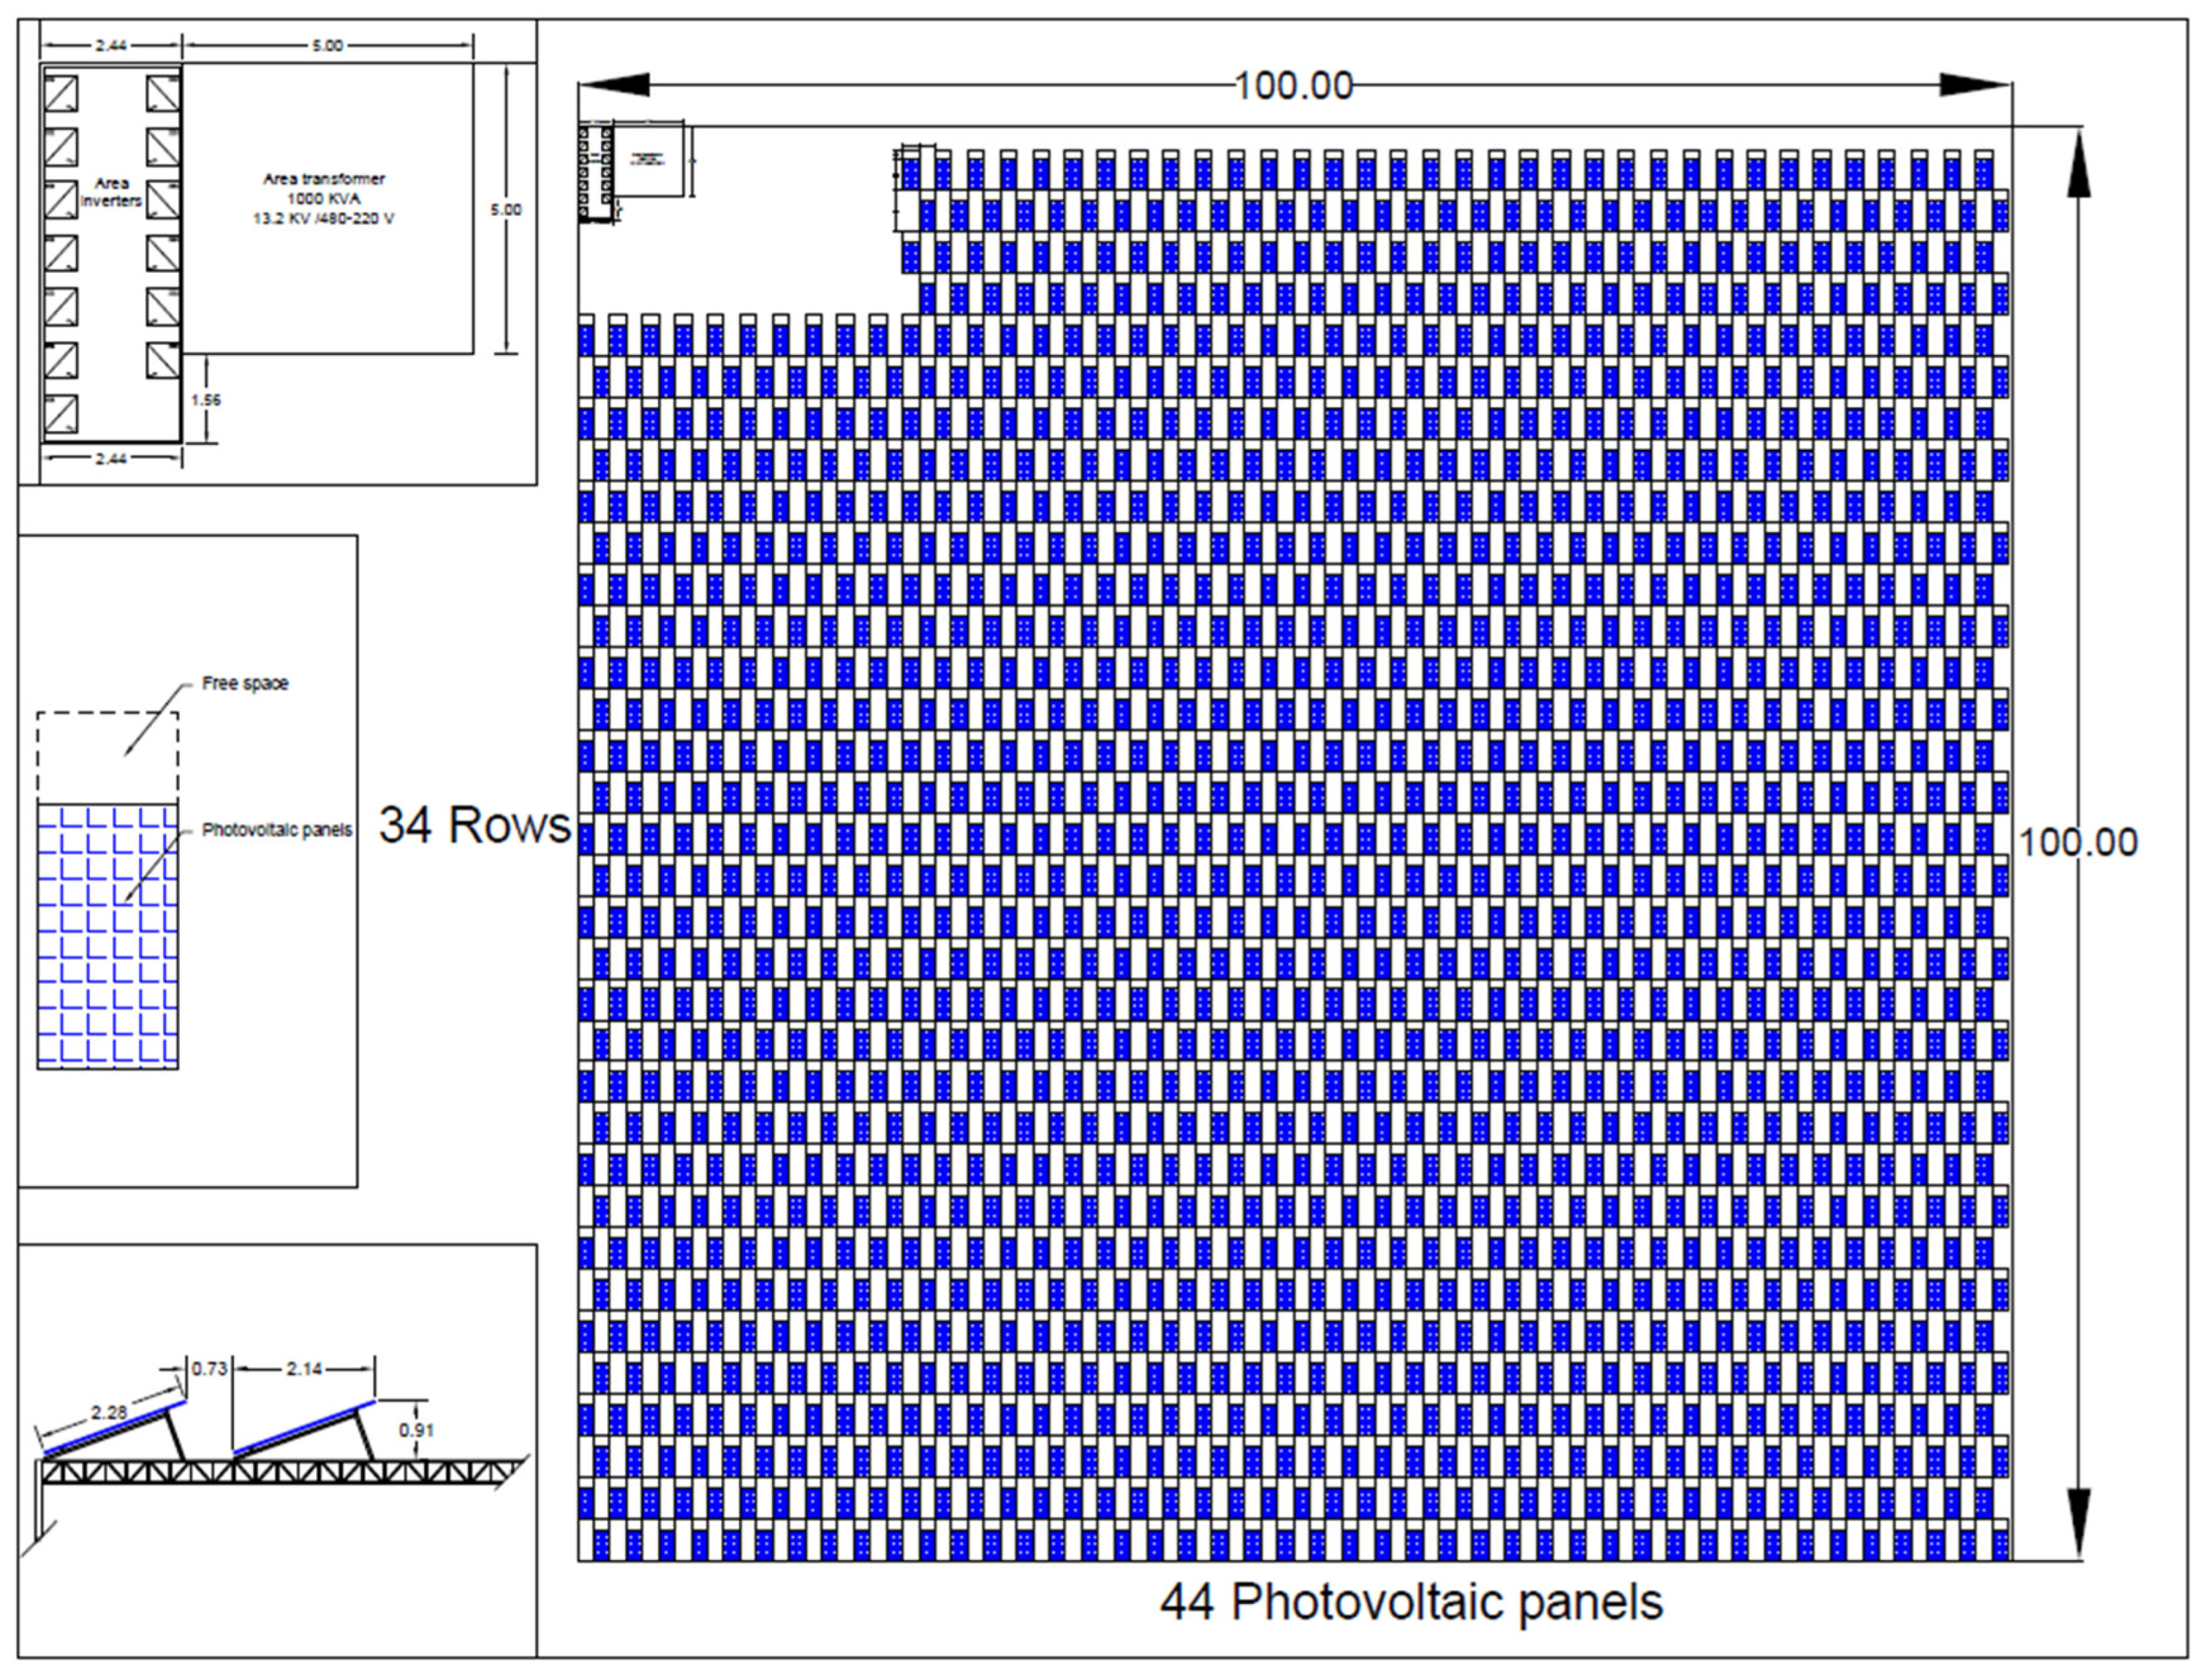
Figure 10.
230 kV and 115 kV transmission lines for Puerto Vallarta and Nuevo Vallarta. Taken from https://www.cenace.gob.mx/Docs/10_PLANEACION/DiagramasUnifilares/.
Figure 10.
230 kV and 115 kV transmission lines for Puerto Vallarta and Nuevo Vallarta. Taken from https://www.cenace.gob.mx/Docs/10_PLANEACION/DiagramasUnifilares/.
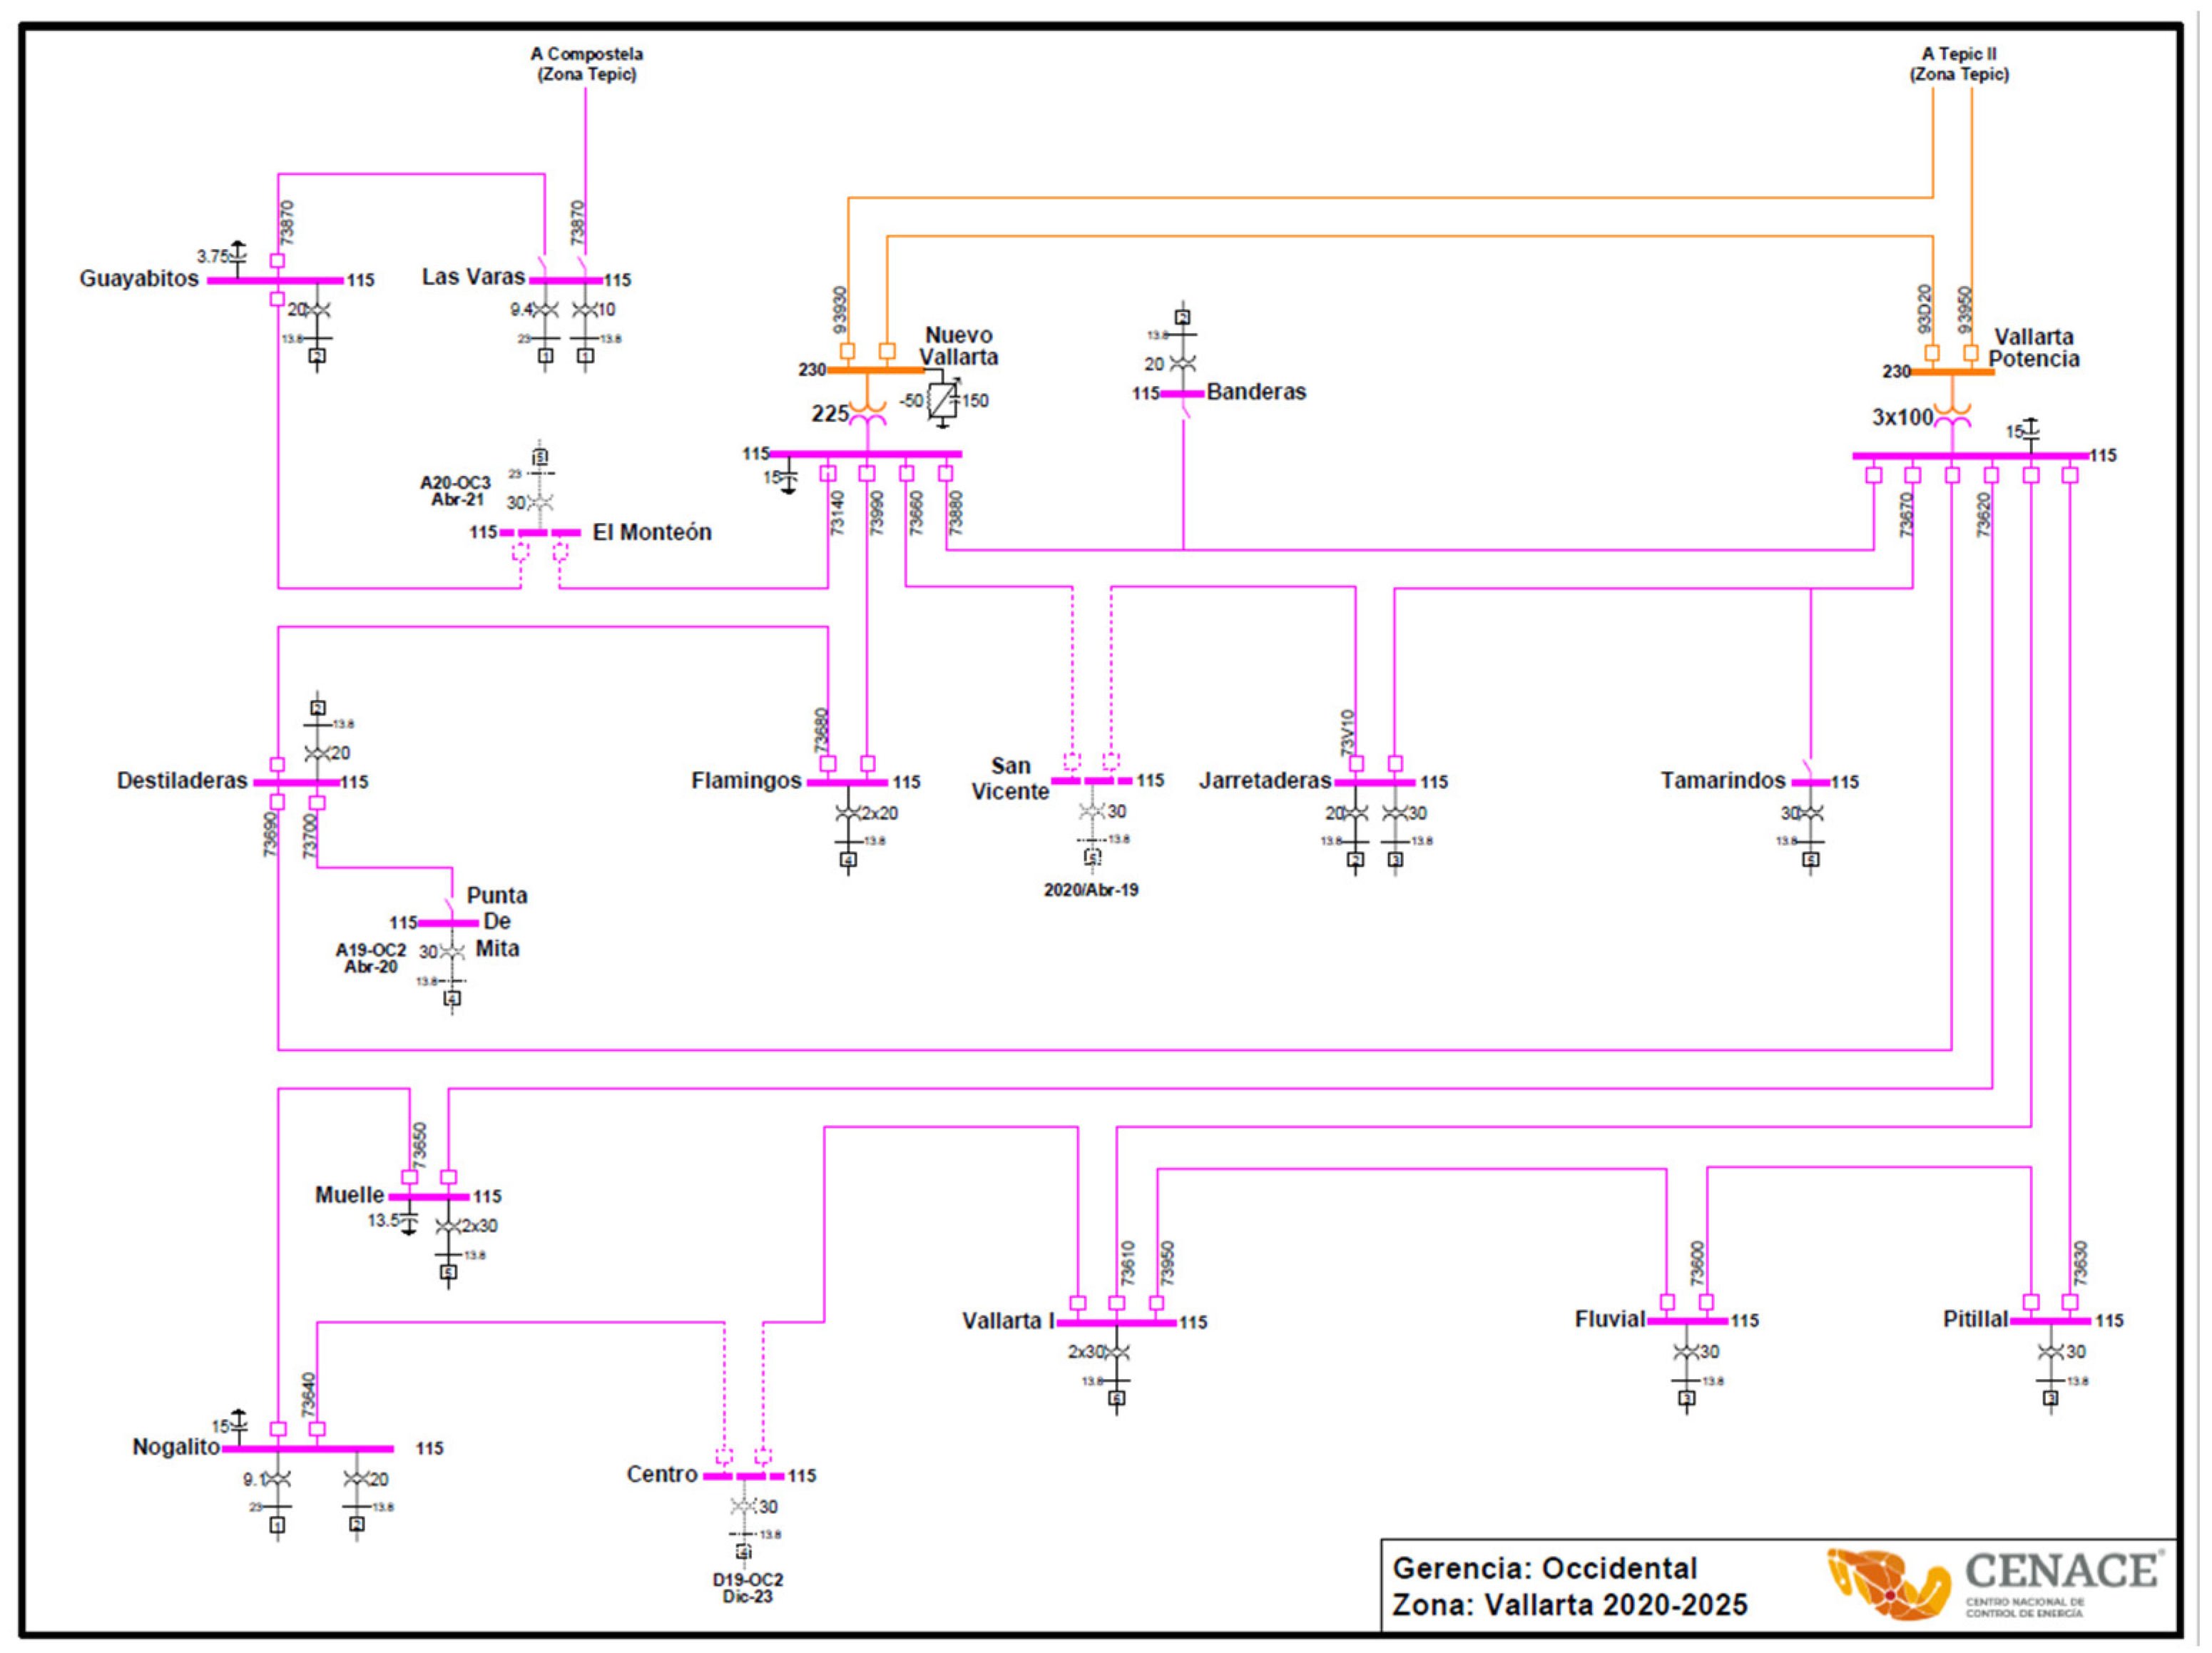
Figure 11.
Monthly photovoltaic generation in AC and DC per hectare.
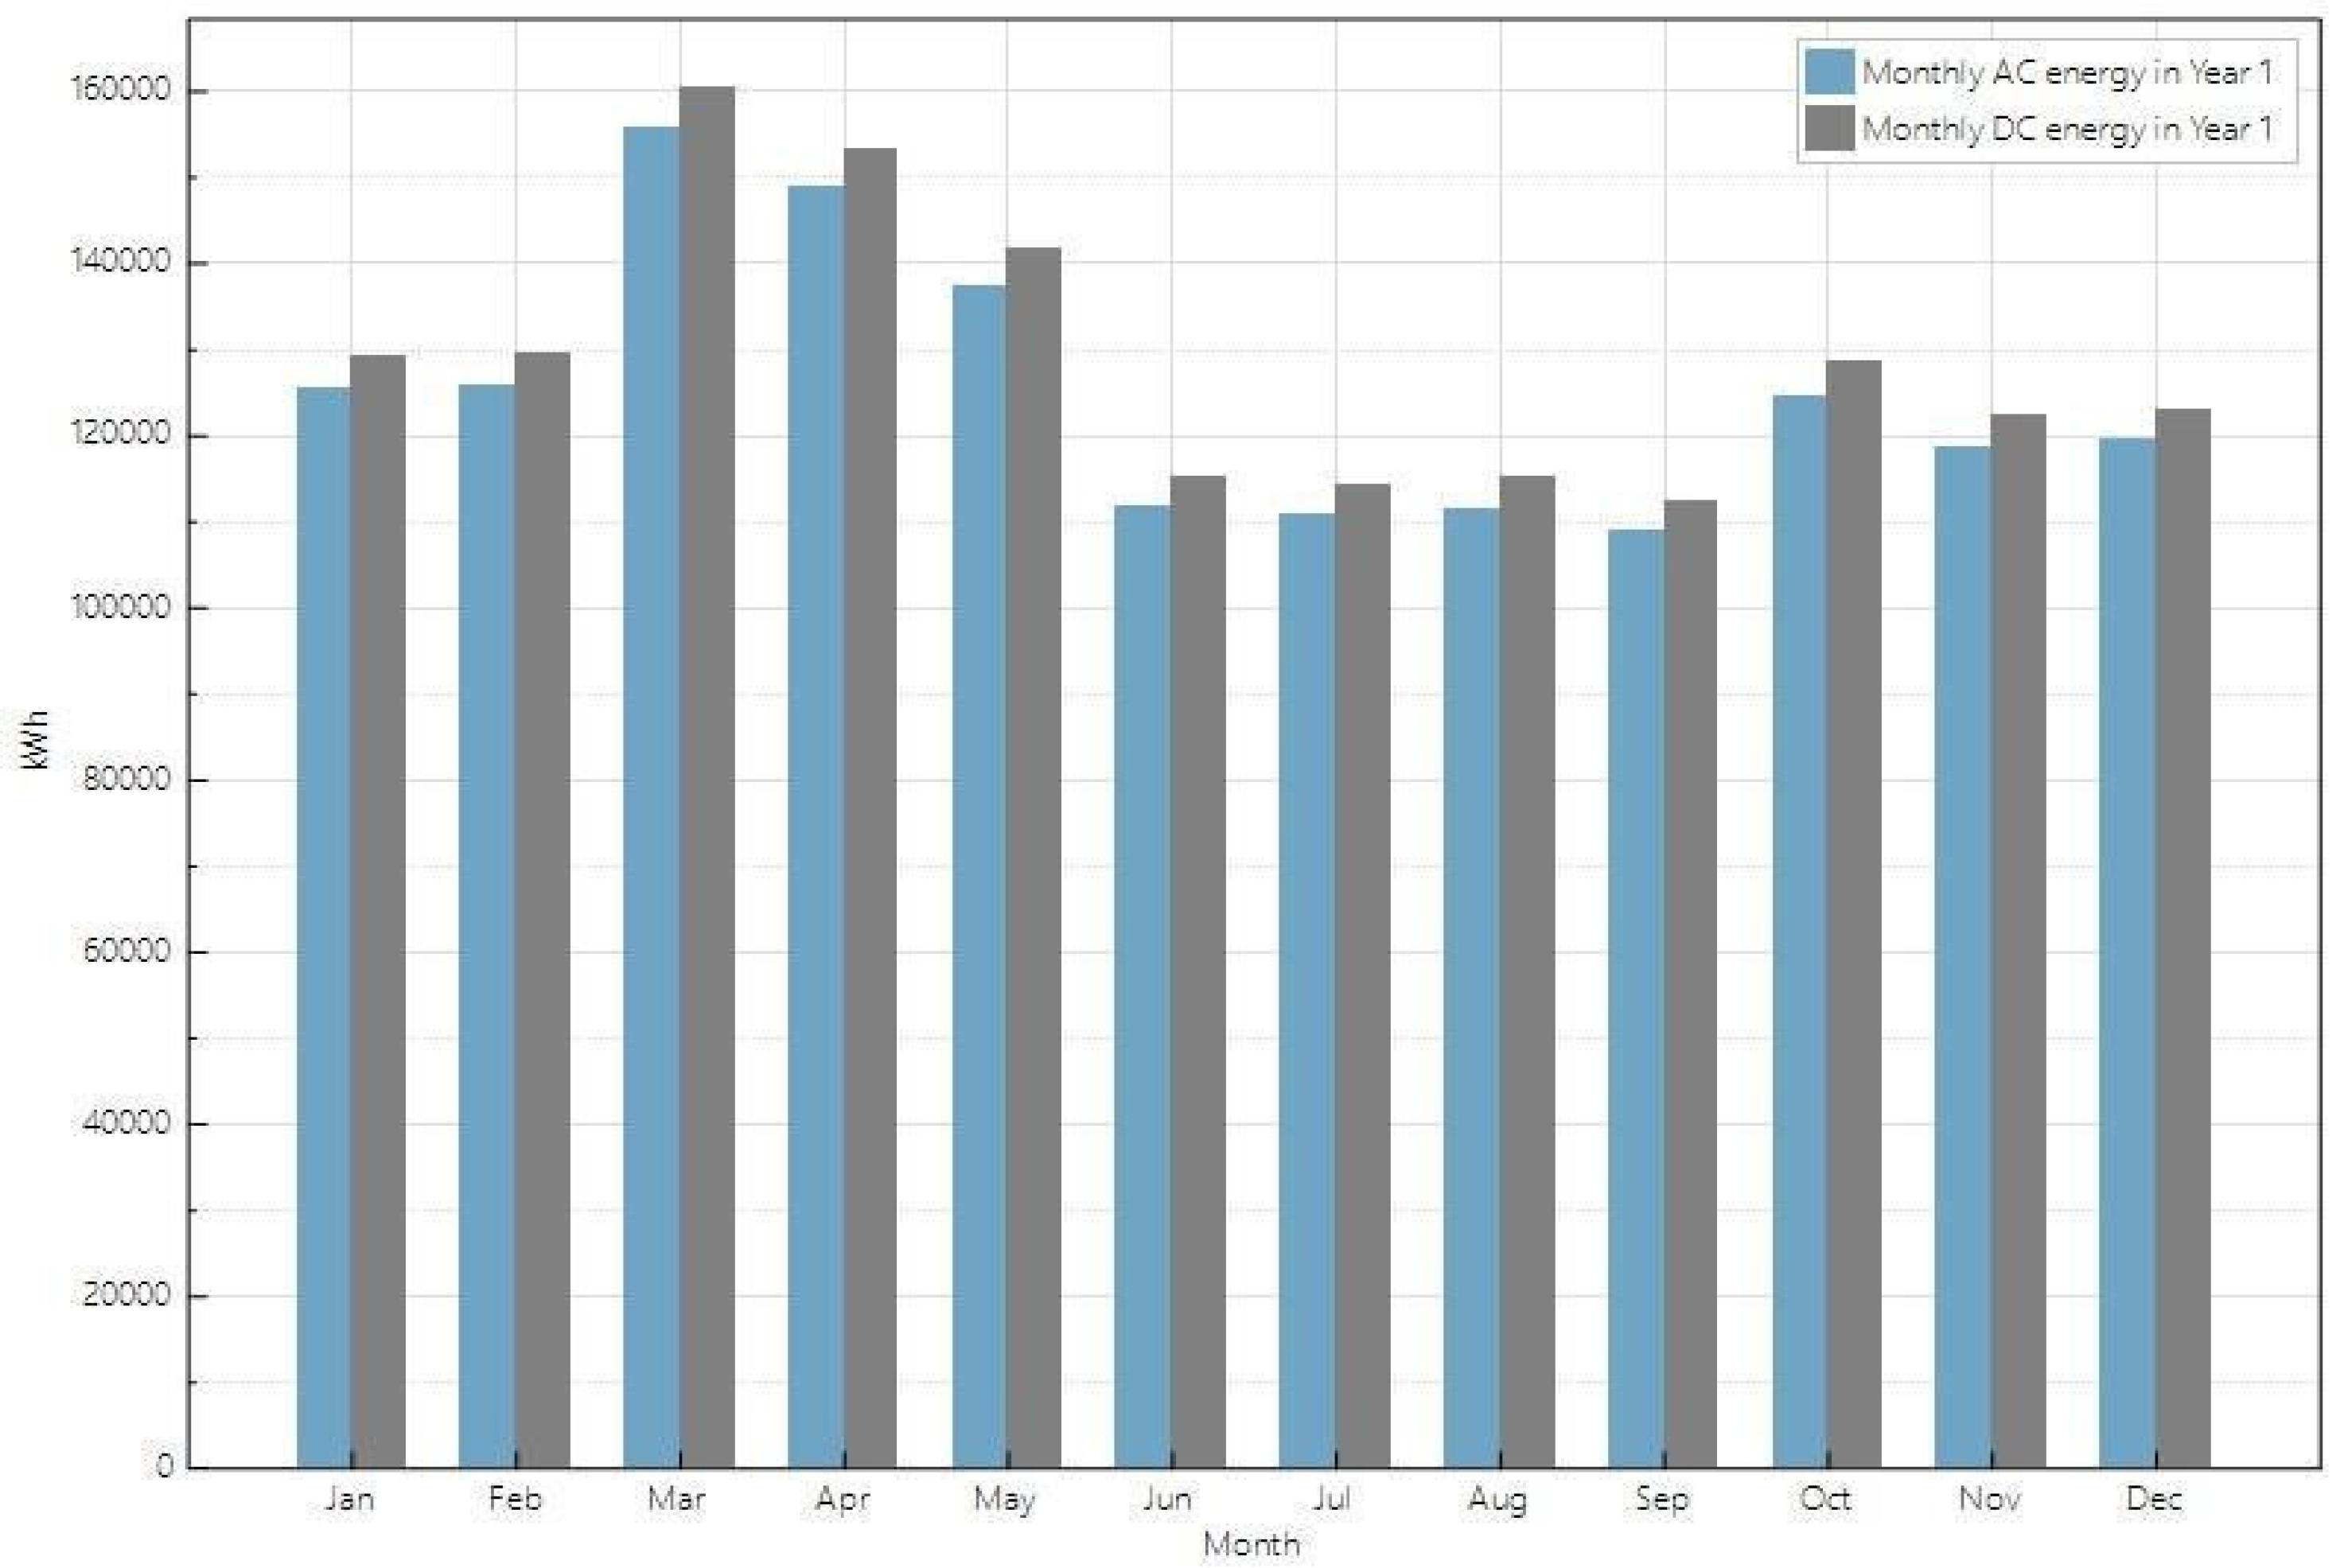

Table 1.
Rooms classified from 2 to 5 stars in Puerto Vallarta and Nuevo Vallarta.
| Year 2017 | Projection Year 2025 | ||
|---|---|---|---|
| Stars | Rooms | Stars | Rooms |
| 2 to 5 | 22,187 | 2 a 5 | 28,767 |
| 2 and 3 | 2,120 | 2 y 3 | 2,749 |
| 4 and 5 | 20,067 | 4 y 5 | 26,019 |
Source: Own elaboration.
Table 2.
Characteristics of the hotels examined.
| Hotel | Characteristics | ||||
|---|---|---|---|---|---|
| Stars | Rooms | Buildings | Floors | Other services | |
| 1 | 2 | 47 | 1 | 3 | 1 outdoor pool, 1 restaurant. |
| 2 | 3 | 620 | 13 | 3 | 5 restaurants, 2 bars, 1 spa, 5 outdoor pools. |
| 3 | 3 | 151 | 4 | 2 of 4, 1 of 5, 1 of 6 | 4 restaurants, 2 bars, 6 swimming pools (4 outdoors). |
| 4 | 5 | 366 | 4 | 3 of 6, 1 of 7 | 7 restaurants, 7 bars, 2 outdoor pools, 1 spa. |
| 5 | 4 | 99 | 30 | 28 villas of 2, 2 of 4 | 1 marina, 1 restaurant, 4 outdoor pools. |
| 6 | 4 | 495 | 5 | 2 of 1, 1 of 3, 1 of 5, 1 of 6 | 6 restaurants, 7 bars, 1 spa, 4 outdoor pools. |
| 7 | 4 | 209 | 3 | 8 | 2 restaurants, 2 bars, 1 spa, 2 outdoor pools and a lazy river. |
| 8 | 5 | 463 | 6 | 13 | 4 restaurants, 4 bars, 2 full-service spas, 1 outdoor pool. |
| 9 | 4 | 115 | 1 | 7 | *20 restaurants, 8 bars, 8 indoor pools, 15 outdoor pools, 3 spas. |
| 10 | 5 | 267 | 1 | 8 | 5 restaurants, 2 bars, 1 spa, 3 outdoor pools. |
| 11 | 5 | 168 | 1 | 8 | *20 restaurants, 8 bars, 8 indoor pools, 15 outdoor pools, 3 spas. |
| 12 | 5 | 723 | 6 | 10 | *20 restaurants, 8 bars, 8 indoor pools, 15 outdoor pools, 3 spas. |
| 13 | 5 | 362 | 3 | 2 of 8, 1 of 10 | 6 restaurants, 2 bars, 1 spa, 2 outdoor pools and 2 hot tubs. |
Source: Own elaboration. * They share these services. Note: All hotels provide air conditioning in their rooms and have laundry service.
Table 3.
Average consumption of electricity (kW-h), LPG (liters) and diesel (liters) per hotel for the years 2017 to 2019.
Table 3.
Average consumption of electricity (kW-h), LPG (liters) and diesel (liters) per hotel for the years 2017 to 2019.
| Hotel | Average annual electricity consumption (kWh) | Average annual consumption (liters) of LPG | Average annual consumption (liters) of Diesel | 1 Energy equivalent of LPG and Diesel (kWh) | Total |
|---|---|---|---|---|---|
| Electrical Energy + Thermal Energy | |||||
| (kWh) | |||||
| 1 | 116,765 | 9,384 | 0 | 63,730 | 180,495 |
| 2 | 4’503,811 | 729,000 | 600 | 4’956,859 | 9’460,670 |
| 3 | 1’213,721 | 133,914 | 150 | 910,947 | 2’124,668 |
| 4 | 4’186,697 | 222,425 | 350 | 1’514,039 | 5’700,736 |
| 5 | 978,811 | 42,303 | 100 | 288,285 | 1’267,096 |
| 6 | 8’015,701 | 741,089 | 500 | 5’037,974 | 13’053,675 |
| 7 | 6’111,336 | 575,603 | 200 | 3’911,127 | 10’022,463 |
| 8 | 6’731,983 | 694,360 | 500 | 4’720,620 | 11’452,603 |
| 9 | 5’493,796 | 14,304 | 100 | 98,133 | 5’591,929 |
| 10 | 7’534,392 | 664,764 | 250 | 4’517,147 | 12’051,539 |
| 11 | 1’377,161 | 8,668 | 170 | 60,545 | 1’437,706 |
| 12 | 24’124,264 | 288,194 | 750 | 1’964,655 | 26’088,919 |
| 13 | 8’318,726 | 625,947 | 350 | 4’254,518 | 12’573,244 |
| Total | 78’707,164 | 4’749,955 | 4020 | 32’298,580 | 111’005,744 |
Source: Own elaboration. 1INEEC, 2014 (1 liter LPG = 6.7914 kWh Net. 1 Diesel liter= 9.8845 kWh Net).
Table 4.
Electricity consumption by hotels Puerto Vallarta and Nuevo Vallarta.
| Year 2017 | Projection Year 2025 | ||
|---|---|---|---|
| Stars | Consumption (kWh/year) |
Stars | Consumption (kWh/year) |
| 2 a 5 | 427’484,908 | 2 a 5 | 554’272,534 |
| 2 y 3 | 12’569,099 | 2 y 3 | 16’296,964 |
| 4 y 5 | 445’156,620 | 4 y 5 | 577’185,495 |
| Grouped | 457’725,719 | Grouped | 593’482,460 |
Source: Own elaboration.
Table 5.
Average annual GHG emissions (tCO2e) for the period 2017 to 2019.
| Hotel | Annual average (tCO2e) | Average Total GHG (tCO2e) | Annual average (tCO2e) | |
|---|---|---|---|---|
| Scope 1 | Scope 2 | GHG per room | ||
| 1 | 15.0 | 59.0 | 74.0 | 1.6 |
| 2 | 1,166.7 | 2,424.8 | 3,591.5 | 5.8 |
| 3 | 214.4 | 649.5 | 863.9 | 5.7 |
| 4 | 356.4 | 2,249.2 | 2,605.6 | 7.1 |
| 5 | 67.9 | 494.3 | 562.2 | 17 |
| 6 | 1,185.7 | 4,224.3 | 5,410.0 | 10.9 |
| 7 | 920.5 | 3,220.7 | 4,141.1 | 19.8 |
| 8 | 1,111.0 | 3,621.7 | 4,732.7 | 10.2 |
| 9 | 23.1 | 2,774.4 | 2,797.5 | 24.3 |
| 10 | 1,063.1 | 4,052.5 | 5,115.6 | 19.2 |
| 11 | 14.3 | 695.5 | 709.8 | 4.2 |
| 12 | 462.5 | 12,182.8 | 12,645.3 | 17.5 |
| 13 | 1,001.3 | 4,478.2 | 5,479.5 | 15.1 |
| Total | 7,601.9 | 41,126.8 | 48,728.6 | 12.2 |
Source: Own elaboration.
Table 6.
GHG emissions and annual electricity consumption of hotels in Puerto Vallarta and Nuevo Vallarta in 2017.
Table 6.
GHG emissions and annual electricity consumption of hotels in Puerto Vallarta and Nuevo Vallarta in 2017.
| Hotels | Year 2017 | Year 2025 |
|---|---|---|
| stars | GHG emissions | GHG emissions |
| 2 a 5 | 270,681 | 350,963 |
| 4 y 5 | 291,574 | 378,051 |
| 2 y 3 | 9,257 | 12,003 |
| Total | 300,831 | 390,054 |
Table 7.
Use of SPV, STE, AER and TAE in the hotels studied.
| Hotel | SPV | STE | AER | TAE |
|---|---|---|---|---|
| 1 | No | No | No | Yes |
| 2 | No | Yes | No | Yes |
| 3* | Yes | Yes | No | Yes |
| 4 | No | No | Yes | Yes |
| 5 | No | No | No | Yes |
| 6 | No | No | Yes | Yes |
| 7 | No | Yes | No | Yes |
| 8 | No | No | Yes | Yes |
| 9 | No | No | Yes | Yes |
| 10 | No | Yes | No | Yes |
| 11 | No | No | Yes | Yes |
| 12 | No | No | Yes | Yes |
| 13 | No | No | No | Yes |
Source: Own elaboration. *30 panels ESFV.
Table 8.
Correlation values between the average monthly electrical energy consumption (EE, kWh) of the 13 hotels for the period 2017-2019 vs occupancy (Oc, %), temperature (Tc, °C), solar radiation (Rd, kWh/m2), relative humidity (RH, %) and wind speed (Vel, m/s).
Table 8.
Correlation values between the average monthly electrical energy consumption (EE, kWh) of the 13 hotels for the period 2017-2019 vs occupancy (Oc, %), temperature (Tc, °C), solar radiation (Rd, kWh/m2), relative humidity (RH, %) and wind speed (Vel, m/s).
| Regression analysis: EE vs. Oc, Tc, Rd, HR, Vel | ||||||
|---|---|---|---|---|---|---|
| Hotel | P value | R2 | ||||
| Oc | Tc | Rd | HR | Vel | ||
| 1 | 0.002 | 0.345 | 0.098 | 0.179 | 93.81% | |
| 2 | 0.620 | 0.000 | 0.311 | 0.109 | 0.345 | 97.07% |
| 3 | 0.060 | 0.000 | 0.739 | 0.223 | 0.113 | 96.57% |
| 4 | 0.021 | 0.000 | 0.277 | 0.015 | 0.057 | 94.89% |
| 5 | 0.991 | 0.837 | 0.986 | 0.453 | 0.798 | 29.55% |
| 6 | 0.037 | 0.007 | 0.540 | 0.316 | 0.500 | 93.48% |
| 7 | 0.017 | 0.096 | 0.347 | 0.361 | 0.070 | 72.73% |
| 8 | 0.233 | 0.005 | 0.421 | 0.152 | 0.298 | 82.03% |
| 9 | 0.974 | 0.173 | 0.509 | 0.026 | 0.754 | 82.12% |
| 10 | 0.059 | 0.001 | 0.989 | 0.930 | 0.948 | 91.61% |
| 11 | 0.000 | 0.426 | 0.196 | 0.661 | 0.238 | 95.94% |
| 12 | 0.010 | 0.184 | 0.369 | 0.099 | 0.247 | 90.15% |
| 13 | 0.081 | 0.009 | 0.839 | 0.595 | 0.851 | 82.63% |
| Significant | 5 | 8 | 0 | 2 | 0 | |
| More than 90% | 8 | |||||
Source: Own elaboration.
Table 9.
List of planting surface permits extended during the 2023-2024 cycle (hectares).
| Crop | Surface (ha) |
|---|---|
| Basil | 0 |
| Rice | 43 |
| Pumpkin | 2.6 |
| Chili | 39 |
| Beans | 5 |
| Vegetables | 1.2 |
| tomato | 23.5 |
| Lychees | 0 |
| Corn | 1,925.29 |
| Mango | 5 |
| Melon | 0 |
| Other crops | 4.5 |
| Other fruit trees | 13.45 |
| Papaya | 0 |
| Grass | 19 |
| Rolled grass | 3.75 |
| Cucumber | 2 |
| Pineapple | 70.65 |
| Banana | 0.5 |
| Watermelon | 433.4 |
| Forage sorghum | 17.25 |
| Grain sorghum | 99.41 |
| Nurseries | 1 |
| Jackfruit | 1.5 |
| Total | 2,711 |
Source: Oficina de usuarios del agua Distrito de Riego 043.
Table 10.
Amortization of the investment (Years).
| Year | Cost ($/kW-h) | Annual Cost ($) | Accumulated ($) |
|---|---|---|---|
| 2025 | 2.28 | $ 1,315,982,928.60 | $ 1,315,982,928.60 |
| 2026 | 2.39 | $ 1,381,782,075.03 | $ 2,697,765,003.63 |
| 2027 | 2.51 | $ 1,450,871,178.78 | $ 4,148,636,182.41 |
| 2028 | 2.64 | $ 1,523,414,737.72 | $ 5,672,050,920.13 |
| 2029 | 2.77 | $ 1,599,585,474.61 | $ 7,271,636,394.74 |
| 2030 | 2.91 | $ 1,679,564,748.34 | $ 8,951,201,143.08 |
Note: The currency is in pesos. Source: Own elaboration.
Disclaimer/Publisher’s Note: The statements, opinions and data contained in all publications are solely those of the individual author(s) and contributor(s) and not of MDPI and/or the editor(s). MDPI and/or the editor(s) disclaim responsibility for any injury to people or property resulting from any ideas, methods, instructions or products referred to in the content. |
© 2025 by the authors. Licensee MDPI, Basel, Switzerland. This article is an open access article distributed under the terms and conditions of the Creative Commons Attribution (CC BY) license (http://creativecommons.org/licenses/by/4.0/).
Copyright: This open access article is published under a Creative Commons CC BY 4.0 license, which permit the free download, distribution, and reuse, provided that the author and preprint are cited in any reuse.


