Submitted:
14 April 2025
Posted:
16 April 2025
You are already at the latest version
Preprints on COVID-19 and SARS-CoV-2
Abstract
This study examines the impact of the COVID-19 pandemic on the U.S. aviation industry by analyzing key operational and financial metrics alongside public health data. Drawing from multiple data sources, including the Bureau of Transportation Statistics (BTS) and Worldometers, the analysis integrates trends in passenger traffic, flight operations, airline revenue, and net income with COVID-19 case trends. The BTS data provides detailed insights into the volume and nature of airline activity, while Worldometers contributes real-time and historical COVID-19 statistics that contextualize fluctuations in industry performance. By exploring the correlation between public health developments and aviation metrics, this study offers a comprehensive understanding of how the pandemic disrupted air travel and highlights potential pathways to recovery.
Keywords:
airline industry
; financial forecasting
; XGBoost
; machine learning
; hyperparameter optimization
1. Introduction
The outbreak of the COVID-19 pandemic has brought unprecedented disruptions to nearly every aspect of society, and the U.S. air travel industry has been among the sectors most significantly affected. As the virus spread rapidly across the globe in early 2020, air traffic came to a near standstill due to travel restrictions, border closures, and widespread public health concerns. Airlines were forced to ground fleets, cancel routes, and lay off workers, while airports saw passenger volumes plummet to record lows. These changes not only impacted the financial stability of airlines but also had broader consequences for regional economies, tourism-dependent communities, and supply chains reliant on air cargo.
This study seeks to examine the multifaceted economic impact of COVID-19 on the U.S. air travel industry, exploring how dramatic reductions in passenger demand and operational activity affected revenues, employment, and broader economic productivity. By conducting a comparative analysis of industry performance before, during, and after the pandemic, the research highlights the evolving nature of airline operations and the key factors driving change. The analysis focuses on changes in passenger volumes, flight routes, cargo activity, and revenue streams, offering insight into how the industry’s business model adapted during the crisis.
In addition to operational and financial considerations, this study explores the role of public policy in shaping the industry’s response. Government interventions—including travel restrictions, mask mandates, and financial relief programs such as those introduced through the CARES Act—played a crucial role in both exacerbating and mitigating the crisis. Understanding the interplay between regulatory decisions and industry outcomes provides valuable context for evaluating the effectiveness of crisis management strategies and designing future policies to enhance industry resilience.
Furthermore, this research aims to identify emerging trends and potential pathways for recovery. As the industry transitions into a post-pandemic era, questions arise regarding long-term changes in consumer behavior, business travel demand, environmental priorities, and the role of digital innovation in ensuring safety and efficiency. By investigating how airlines and airports have adapted—and continue to adapt—this study sheds light on the opportunities for sustainable growth and innovation in a changed global landscape.
Ultimately, the goal of this research is to provide a comprehensive, data-driven perspective on the challenges and opportunities confronting the U.S. air travel sector in the wake of COVID-19. The findings are intended to inform policymakers, industry leaders, and the public, contributing to a deeper understanding of how health crises intersect with economic systems and how the aviation industry can build resilience against future disruptions.
2. Literature Review
The COVID-19 pandemic has caused a profound disruption to global economies and industries, with the air travel sector emerging as one of the most adversely affected. Given its reliance on global mobility and consumer confidence, the aviation industry was particularly vulnerable to travel bans, lockdowns, and public health concerns. This literature review synthesizes key findings from existing research, focusing on five interrelated themes: the impact on passenger numbers and flight operations, financial performance of airlines, broader economic consequences, comparative analyses linking COVID-19 trends to air travel metrics, and emerging pathways for recovery and resilience.
2.1. Impact on Passenger Numbers and Flight Operations
The immediate impact of COVID-19 on air travel was a dramatic decline in both domestic and international passenger traffic. Suau-Sanchez et al. (2020) observed that global air traffic collapsed almost overnight as governments imposed restrictions to limit virus spread. In particular, the U.S. aviation market experienced a sharp contraction, with the International Air Transport Association (IATA, 2020) reporting a 66 percent decrease in global passenger traffic in 2020 compared to 2019. Domestic travel in the U.S. was somewhat more resilient than international travel, but both segments were severely affected. Forsyth et al. (2020) further emphasized that the pace of recovery has been uneven, with domestic markets showing earlier signs of rebound, while international travel remained constrained by ongoing border controls, testing requirements, and traveler hesitancy. The steep reduction in flight operations, coupled with decreased aircraft utilization, reflected a significant underuse of industry capacity during the height of the pandemic.
2.2. Financial Performance of Airlines
The financial ramifications of the pandemic on airlines have been both immediate and far-reaching. U.S. carriers reported historic losses as revenues plummeted due to grounded fleets and limited passenger demand. Sobieralski (2020) highlighted that airlines responded with a range of cost-reduction strategies, including furloughs, early retirements, and significant cuts to route networks. Major U.S. airlines such as Delta and American Airlines reported negative net income in 2020, with operating revenues reduced by more than 60 percent compared to the previous year (Delta Air Lines, 2021; American Airlines, 2021). Although the CARES Act and subsequent federal support provided short-term relief, particularly through payroll protection programs (U.S. Treasury, 2020), questions remain regarding long-term financial stability, especially for carriers with high debt loads or limited cash reserves. The crisis has forced airlines to rethink business models, renegotiate financing terms, and reprioritize capital investments.
2.3. Economic Impact
Beyond the airlines themselves, the broader economic impact of the aviation industry’s contraction has also been extensively analyzed. Gössling et al. (2020) explored how reduced air travel has disrupted sectors such as tourism, hospitality, and international trade, resulting in widespread economic spillovers. The aviation sector’s contribution to GDP extends far beyond ticket sales, encompassing airport services, supply chains, and global commerce. As flight activity diminished, so too did the associated economic activities that rely on air connectivity. According to the OECD (2021), the U.S. economy experienced a significant downturn in 2020, with aviation-related declines playing a nontrivial role in the broader macroeconomic slowdown. Although recovery trends began emerging in 2021, persistent volatility and pandemic-related uncertainty continued to temper growth across interdependent sectors.
2.4. Comparative Analyses and COVID-19 Correlations
Several comparative studies have sought to establish empirical links between pandemic dynamics and aviation activity. Kim et al. (2021) identified a strong negative correlation between the number of COVID-19 cases and air travel demand, reinforcing the direct impact of public health crises on mobility. Their findings support the argument that traveler confidence and safety perceptions are critical levers for recovery. Additionally, research by Baker et al. (2020) underscored the importance of government intervention, noting that targeted fiscal stimulus and aviation-specific support measures helped mitigate the worst-case outcomes. These studies collectively suggest that both the scale and timing of policy responses have been instrumental in shaping the trajectory of recovery across the aviation sector.
2.5. Recovery Trajectories and Future Trends
The path to recovery has become a central theme in recent literature, with attention increasingly shifting toward innovation and resilience. Amankwah-Amoah (2020) argued that digital innovation, particularly in the form of health passports, contactless check-ins, and enhanced sanitation measures, will be key to rebuilding passenger trust and operational stability. Forecasts by IATA (2021) suggest that global air travel volumes may not return to pre-pandemic levels until 2024, a timeline that highlights the prolonged nature of recovery. However, the potential acceleration of recovery hinges on widespread vaccine adoption, coordinated international travel protocols, and the successful implementation of technological safeguards. This study contributes to the ongoing discourse by investigating whether such innovations can meaningfully shorten the recovery timeline for U.S. air travel, challenging current projections and offering a data-driven perspective on what factors may drive an earlier return to financial and operational normalcy.
3. Method
3.1. Data and Variables
This analysis incorporates operational, financial, and public health data to evaluate the performance of the U.S. airline industry and its responsiveness to external disruptions, particularly the COVID-19 pandemic. The dataset spans from 2015 to 2024, which allows for the segmentation of the timeline into three distinct phases: the pre-COVID period (2015–2019), the COVID period (2020–2021), and the post-COVID recovery period (2022–2024). Aligning and mapping the data by year and quarter enables consistent time-series comparisons across all datasets and ensures meaningful interpretation of changes over time.
The selection of variables is grounded in both domain knowledge and prior literature on aviation operations and crisis response. Operational data are sourced from the Bureau of Transportation Statistics (BTS) and include metrics aggregated by year, quarter, and airline carrier. These metrics provide a detailed view of the scale and scope of airline operations across different periods. Specifically, total payload was selected as a key measure of cargo activity, which became particularly important when passenger demand declined and airlines shifted focus to freight services. Total seats and total passengers represent supply and demand, respectively, and are foundational indicators of airline capacity utilization and consumer behavior. Total freight extends the payload variable by quantifying cargo in volume terms, while total distance and total air time offer measures of network reach and operational intensity. Together, these variables capture both the physical extent and functional load of airline operations, enabling nuanced insights into how service strategies evolved during periods of disruption and recovery.
Financial data, also from BTS, are summarized by year, quarter, and carrier to capture the economic health and resilience of the airline industry. The key financial variables were chosen to reflect core dimensions of liquidity, solvency, and leverage—each critical for evaluating how carriers managed financial risks. Total cash indicates immediate liquidity and operational flexibility in crisis conditions. Total assets provide a snapshot of firm size and capital investments, while total current liabilities reflect short-term financial obligations. Total long-term debt was included to assess the extent of financial restructuring and reliance on external financing as a coping mechanism. These financial indicators collectively allow for a multi-faceted assessment of fiscal stability across different pandemic phases.
To measure the progression and external impact of the COVID-19 pandemic, the analysis incorporates public health data from Worldometers. This source provides daily and cumulative COVID-19 case counts, which are aggregated and aligned by quarter to match the airline datasets. The inclusion of pandemic severity metrics is critical for capturing exogenous shocks and for establishing a temporal linkage between epidemiological trends and shifts in airline performance. Case count data serve as proxies for market uncertainty, regulatory disruption, and traveler behavior changes, all of which directly influence both operational decisions and financial resilience.
One notable limitation in the variable selection process was the absence of consistent, publicly available revenue data across the full study period. Revenue would have served as a direct indicator of airline performance and market response, and its exclusion represents a gap that future research should aim to address. Integrating revenue metrics would offer an even more comprehensive view of financial outcomes and strengthen the ability to assess profitability in relation to operational changes.
3.2. Modeling Approach
To investigate how operational and financial variables influenced the U.S. airline industry’s performance during the COVID-19 pandemic, this study employed the XGBoost algorithm. XGBoost, a gradient-boosted decision tree method, is well known for its ability to handle large datasets, nonlinear relationships, and complex feature interactions. Its efficiency and predictive accuracy make it particularly suitable for time-series data impacted by external shocks like a global pandemic. In this analysis, separate XGBoost models were developed for each of four financial targets: total cash, total assets, total liabilities, and total debt. By isolating each financial outcome, the study was able to assess how specific operational variables uniquely influenced different aspects of financial health across pandemic phases.
3.3. Data Preprocessing
Before training the models, a comprehensive data preprocessing pipeline was established to enhance data quality, reduce noise, and optimize input consistency across all time periods and features. The initial step involved handling missing values, which were imputed using the median for each variable rather than the mean. This choice preserved the central tendency of the data while reducing the influence of outliers, ensuring robust imputation in the presence of skewed financial and operational distributions.
To control for irregularities, outlier treatment was applied through percentile-based capping. Specifically, values above the 99th percentile were clipped to the threshold to prevent rare but extreme values—such as exceptionally high debt loads or anomalous cargo volumes—from distorting model behavior. This approach retained the underlying data variability while minimizing the risk of overfitting to infrequent outliers.
In addition to cleaning the raw data, feature engineering was performed to expand the informational depth of the dataset. Interaction terms, such as passenger volume multiplied by air time, were created to represent operational intensity, while lagged features were added to capture temporal dependencies across financial quarters. These engineered variables allowed the models to learn from both concurrent and trailing patterns in airline performance, which are especially relevant when modeling over a crisis timeline like the COVID-19 pandemic.
A key transformation applied during preprocessing was the logarithmic transformation of select skewed variables, particularly those with long-tailed distributions such as total cash, freight volume, and long-term debt. This transformation was used to normalize the data, reduce heteroscedasticity, and improve the linear separability of features—ultimately enhancing the model’s ability to capture underlying patterns without being biased by scale differences. Log transformation also contributed to better interpretability by expressing financial and operational magnitudes in relative rather than absolute terms, which is often more meaningful when analyzing growth rates or proportional changes.
Lastly, all continuous variables were standardized using z-score normalization, aligning them to a common scale with zero mean and unit variance. This step was essential to ensure that features contributed equally to model training and that the regularization mechanisms in XGBoost operated consistently across variables of differing original magnitudes.
Together, these preprocessing steps established a reliable, well-structured input dataset that enabled the machine learning models to generalize effectively across time periods and capture complex relationships between airline operations and financial health.
3.4. Train-Test Splitting and Evaluation
The dataset was divided into an 80 percent training set and a 20 percent testing set to evaluate model performance on unseen data. To ensure consistency and reproducibility across experiments, a fixed random seed was applied during the data splitting process and throughout model training, including during hyperparameter tuning and cross-validation. This helped maintain uniform data partitioning and consistent results across different runs, reducing variability introduced by random sampling. Two performance metrics were used to assess model accuracy: Root Mean Squared Error (RMSE) and Mean Absolute Error (MAE). RMSE is sensitive to large errors and provides a measure of overall prediction deviation, while MAE offers a straightforward interpretation of average prediction error. Together, these metrics provided a balanced evaluation of the models’ effectiveness in predicting financial outcomes based on operational inputs, while the use of controlled randomness enhanced the credibility and repeatability of the analysis.
3.5. Hyperparameter Tuning
To optimize model performance and ensure generalizability across varying financial prediction tasks, a thorough and systematic hyperparameter optimization strategy was implemented. Rather than relying on fixed values or manual trial-and-error tuning, the analysis employed a randomized search framework using Optuna, a state-of-the-art optimization library that automates the exploration of hyperparameter spaces. This approach allowed for efficient sampling and evaluation of numerous parameter combinations while prioritizing configurations that reduced validation error.
The search focused on tuning several core hyperparameters critical to controlling model complexity, learning dynamics, and regularization. One of the most influential parameters was the learning rate (), which governs how aggressively the model updates weights with each boosting iteration. Smaller learning rates enable more gradual and refined learning, while higher values accelerate convergence at the risk of overfitting. Tuning this parameter allowed the models to balance speed and precision based on the complexity of each financial target.
The maximum tree depth was also varied to control how detailed each individual decision tree could become. Deeper trees capture more intricate patterns and interactions, but can lead to overfitting if not appropriately constrained. In contrast, shallower trees tend to generalize better but may underfit complex relationships. By tuning this parameter independently for each financial target, the models adapted to the degree of complexity required to explain the relationships between operational inputs and financial outcomes.
Additional structural parameters included the number of estimators, which defines how many trees are used in the ensemble, and subsampling ratios—specifically, (the proportion of data samples used per tree) and (the proportion of features considered when splitting nodes). These sampling parameters introduce randomness into the training process, which helps reduce variance, guard against overfitting, and improve robustness on unseen data.
The optimization process also incorporated regularization terms, including (L2 regularization), (L1 regularization), and (minimum loss reduction required to make a further partition on a leaf node). These parameters penalize overly complex trees and help control model flexibility, especially in datasets that include noisy or collinear features.
The randomized search was guided by cross-validation, where the dataset was split into training and validation folds to assess performance across different subsets. The objective function minimized during optimization was the root mean squared error (RMSE) on the validation set, ensuring that the selected configuration balanced accuracy and generalizability. Each model—corresponding to one of the four financial targets—was independently optimized, and as a result, different hyperparameter sets were chosen for each, reflecting the distinct predictive complexity of outcomes like total cash, liabilities, assets, and debt.
By combining randomized search, regularization, and cross-validation, the hyperparameter tuning process ensured that the final XGBoost models were both expressive and stable, capable of capturing nuanced financial patterns across different operational conditions and temporal phases.
3.6. Interpretability
To enhance model transparency and explain the drivers of financial outcomes, SHAP (SHapley Additive exPlanations) values were computed for each trained model. SHAP values offer a consistent, game-theoretic approach to interpreting the contribution of each input feature to individual predictions. This interpretability framework allowed for a clear understanding of which operational metrics most influenced financial performance across different time periods. For example, the analysis revealed that freight-related features gained significant importance during the COVID period, highlighting the industry’s strategic pivot toward cargo services when passenger travel was restricted. The use of SHAP values not only improved the explainability of the results but also supported data-driven insights into how operational strategies shifted in response to evolving pandemic conditions.
3.7. Analysis
The results of the XGBoost modeling process, trained separately on datasets from the COVID period (2020–2022) and the Non-COVID period (2015–2019), reveal a substantial shift in the relative importance of operational features in predicting airline financial performance, particularly with respect to Total_Cash. These changes reflect the significant transformation in the airline industry’s operating model brought on by the pandemic.
During the Non-COVID period, Total_Distance—which represents the cumulative mileage flown—was by far the most important predictor of cash holdings, contributing an overwhelming 73.8 percent to the model’s total gain. This suggests that prior to the pandemic, the extent of an airline’s operational reach was closely associated with its financial liquidity, likely due to stable passenger traffic and predictable revenue flows tied to long-haul and high-frequency routes.
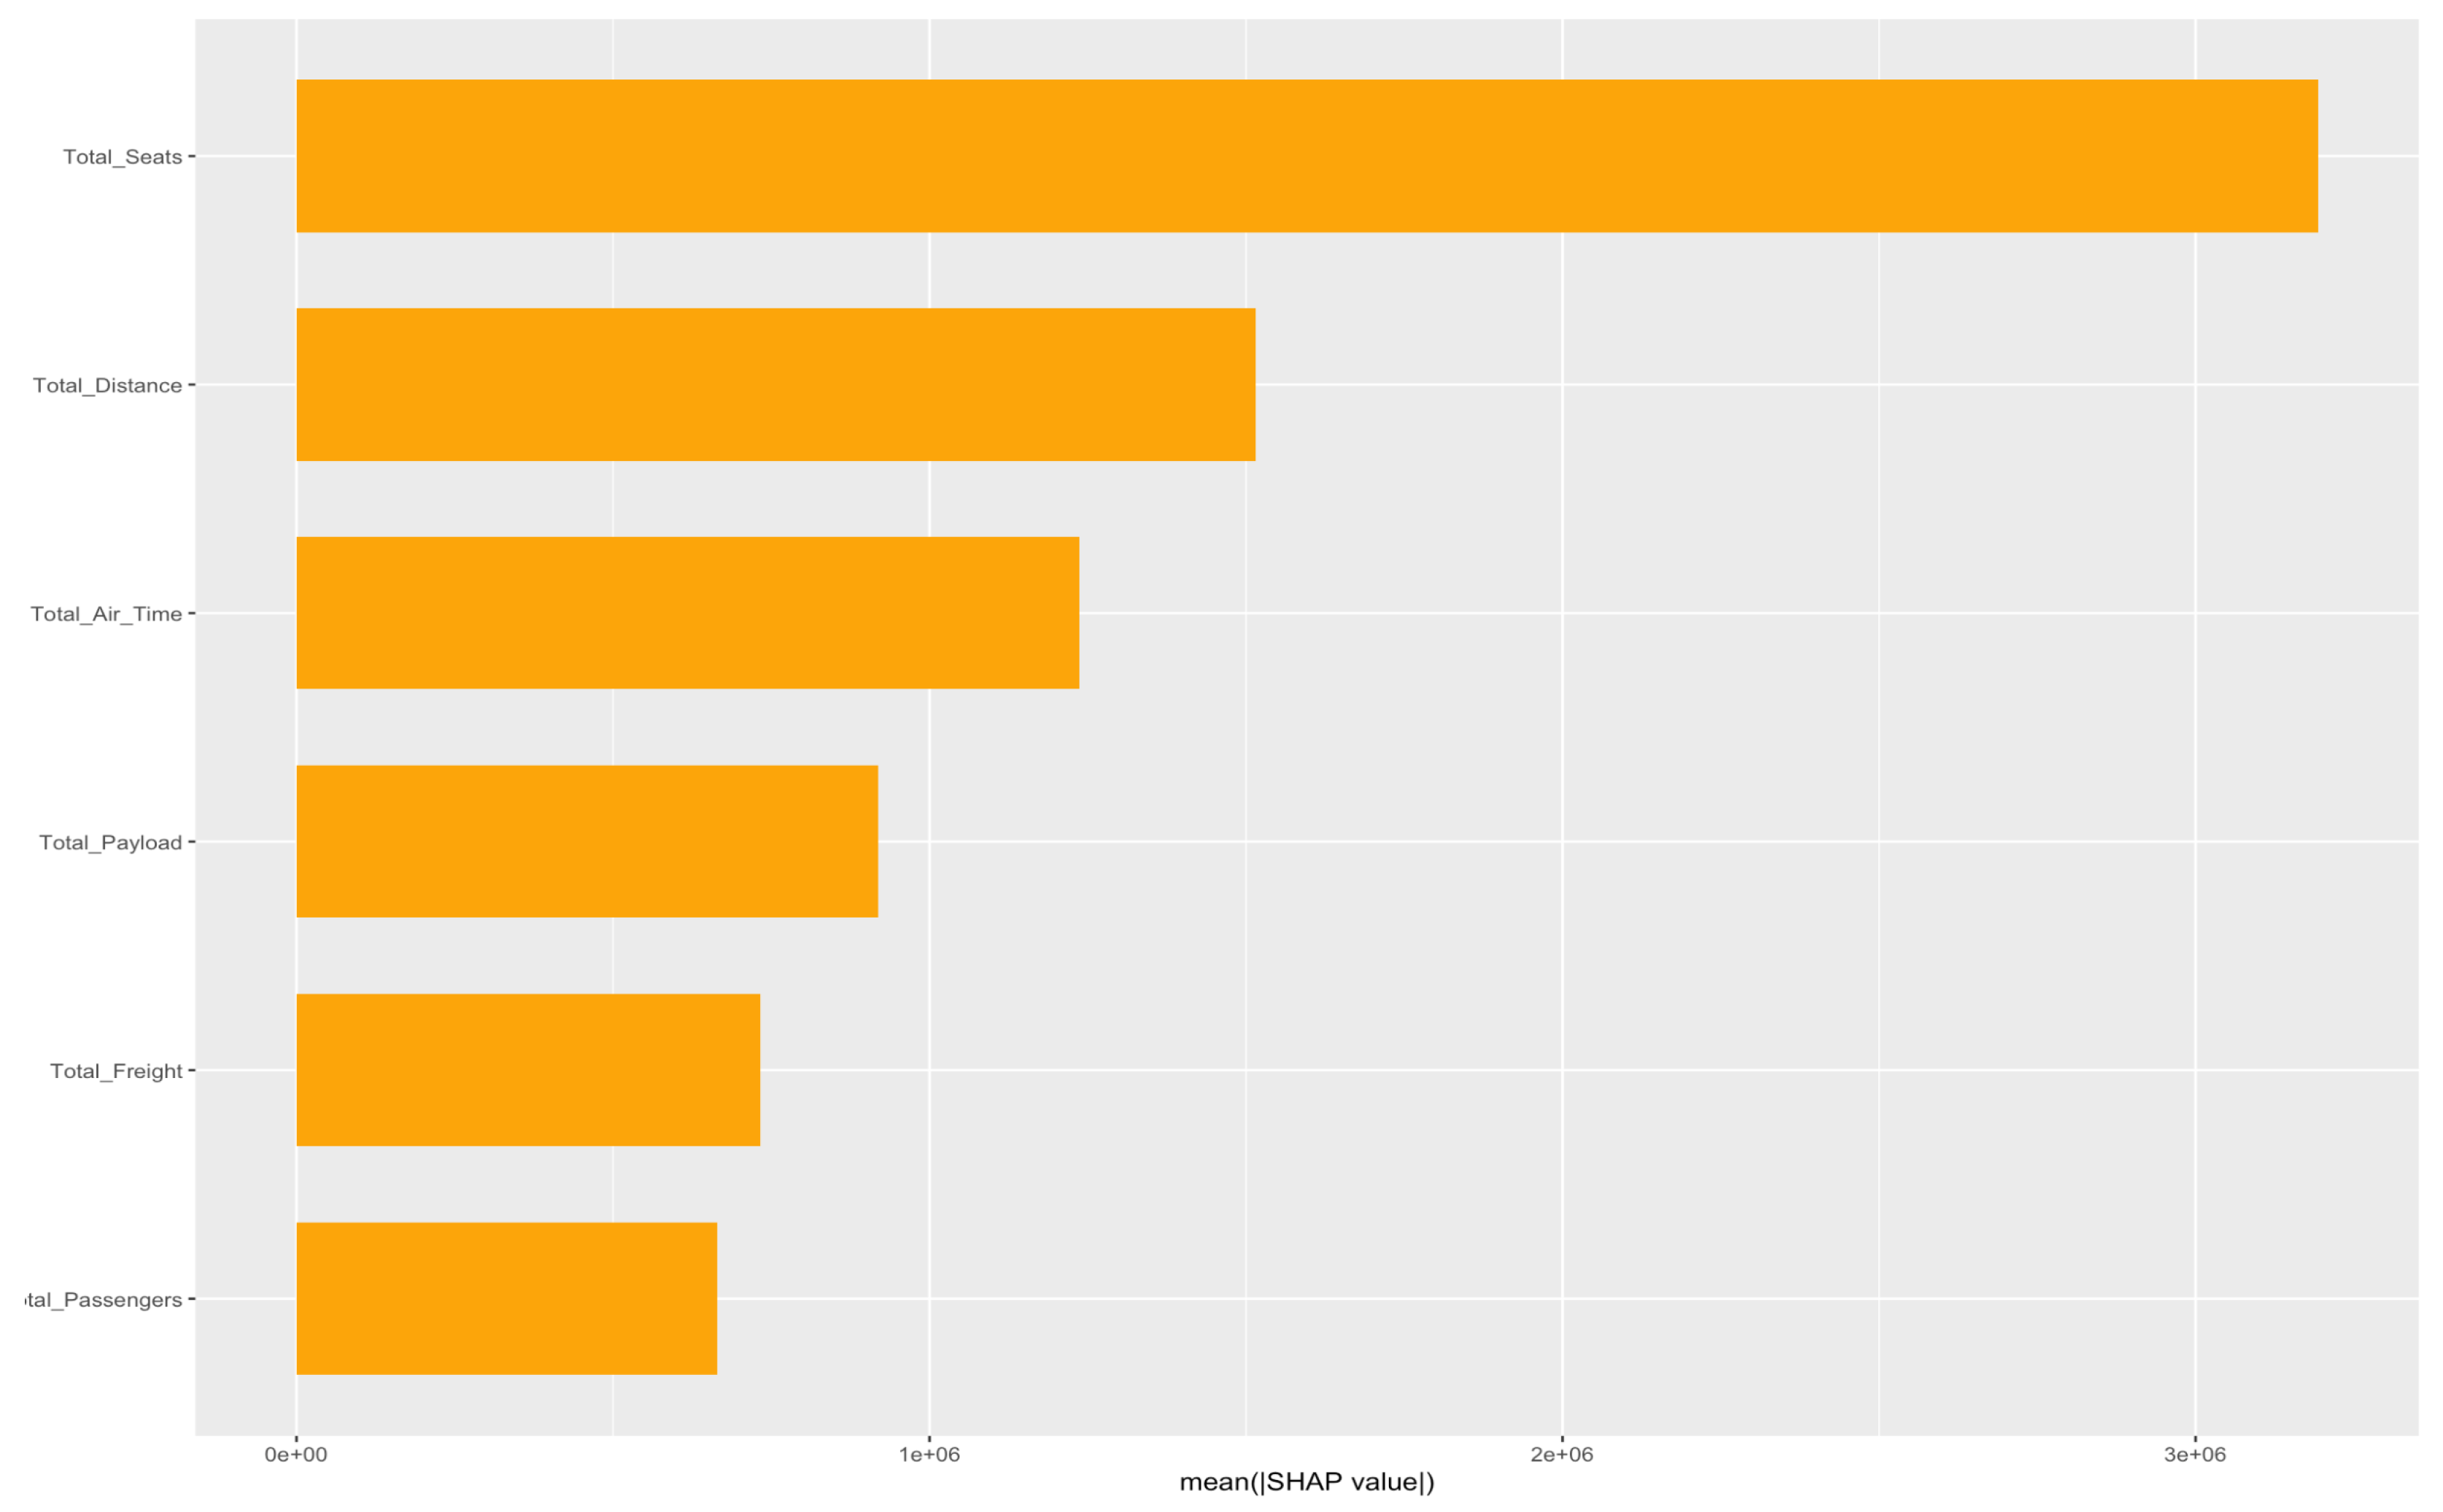
In contrast, during the COVID period, the relative importance of Total_Distance dropped precipitously to just 7.5 percent, as route networks were reduced, long-haul travel was minimized, and demand for travel became highly volatile. In place of this previously dominant feature, Total_Freight emerged as the most critical variable, contributing 51.1 percent to model gain. This dramatic shift reflects the industry’s strategic pivot toward cargo operations as a primary source of revenue amidst a collapse in passenger demand. Passenger aircraft were converted into freighters, and freight logistics became a lifeline for maintaining operations and generating cash flow.
Similarly, Total_Payload—a measure that includes both passenger and cargo weight—also saw a significant increase in importance, accounting for 31.6 percent of the predictive power during the COVID period, compared to a much smaller role in the Non-COVID model. This reinforces the centrality of transported goods, rather than people, in driving liquidity during the crisis.
In contrast, features previously tied to passenger operations lost much of their predictive value. Total_Seats, which had moderate influence pre-COVID as a proxy for capacity and revenue potential, became virtually irrelevant during the pandemic, likely due to large-scale grounding of aircraft and plummeting load factors. The decoupling of seating capacity from financial performance underscores how drastically the business model shifted in response to pandemic conditions.
These changes, illustrated in Figure 1 and Figure 2, underscore the extent to which COVID-19 redefined operational priorities. They provide strong evidence of the industry’s adaptation toward cargo-centric revenue models and its temporary departure from the traditional passenger-based business structure.
To support these insights, a robust machine learning pipeline was developed using the XGBoost algorithm to model and predict four key financial targets: Total_Cash, Total_Assets, Total_Liabilities, and Total_Debt. Operational features including payload, seats, passengers, freight, air time, and distance served as input variables. Prior to modeling, extensive preprocessing was conducted to address data quality issues—missing values were imputed using the median, and extreme outliers were capped to reduce the influence of anomalies.
A total of 400 models were trained across various configurations, utilizing 20 different hyperparameter sets combined with 5 random seeds for cross-validation. This approach ensured that the results were not artifacts of particular model settings or random data partitions but reflected generalizable patterns in the underlying data.
Model evaluation was performed using both Root Mean Squared Error (RMSE) and Mean Absolute Error (MAE). Among the four financial targets, predictions for Total_Cash were the most accurate, with a median RMSE of 1,931,776 and MAE of 852,543.9. This suggests that cash reserves, as a short-term financial metric, were most directly influenced by operational variables, particularly freight-related ones during the pandemic.
Conversely, the model struggled more with long-term balance sheet variables. Predictions for Total_Assets resulted in the highest error, with a median RMSE of 8,411,070 and MAE of 4,303,871.3, indicating that asset composition and valuation are likely influenced by factors beyond day-to-day operational metrics. Similarly, Total_Liabilities and Total_Debt were difficult to predict with high precision (RMSE values of 3,957,290 and 4,445,529, respectively), perhaps reflecting the role of strategic financing decisions, credit terms, and external economic pressures.
Feature importance values were extracted from each model to enhance interpretability and allow for further investigation into the operational drivers of financial outcomes. These results, along with the final model outputs, were systematically aggregated and visualized (Figure 3) to support a comprehensive understanding of the relationships uncovered by the models.
See Figure 3
Overall, this modeling framework provides a scalable and interpretable approach to financial forecasting within the aviation sector. The findings highlight both the potential of machine learning techniques for economic analysis and the importance of adjusting operational strategies to respond to external shocks such as global pandemics. Future work may benefit from incorporating macroeconomic indicators, airline-specific strategic decisions, or regional policy data to further enhance predictive accuracy and contextual understanding.
4. Results
The modeling framework employed automated hyperparameter tuning via Optuna to optimize XGBoost regressors for predicting four key financial targets—, , , and —based on airline operational features. Each model was independently tuned using a predefined hyperparameter search space and evaluated based on validation RMSE to identify the most performant configuration. The optimization process revealed distinct best-fit hyperparameter profiles for each target, reflecting the unique structural complexity and noise characteristics of the underlying financial relationships.
Total Cash
The optimal model for predicting favored a deep tree structure (max_depth = 12) and a high learning rate (), suggesting the need for a model capable of capturing complex, nonlinear interactions with rapid learning dynamics. The combination of substantial subsampling () and column sampling (colsample_bytree ≈ 84) supports robustness through randomness, helping to mitigate overfitting in a relatively expressive model.
Regularization parameters further indicate the model’s sensitivity to noise: moderate-to-strong penalties were applied via min_child_weight = 4, , , and . This level of regularization balances the model’s depth and learning rate, allowing it to generalize effectively without overreacting to noisy features. The results suggest that an airline’s cash position is influenced by a wide range of operational signals, potentially interacting in complex and non-intuitive ways.
Total Assets
The model for selected a shallower depth (max_depth = 4) and a slightly lower learning rate (), indicating a more stable and less complex relationship between the input features and asset valuations. The nearly complete data utilization (, colsample_bytree ≈ 0.93) suggests that including the full dataset was beneficial for generalization in this context, possibly due to lower variability in asset-related signals compared to liquidity.
The model employed relatively light regularization, with min_child_weight = 3, , , and . This configuration implies a smoother mapping from operational activity to asset totals, with fewer sharp decision boundaries. It may reflect the cumulative and slowly-changing nature of asset figures, which are less susceptible to short-term fluctuations.
Total Liabilities
The model for adopted an intermediate configuration, with a moderate tree depth (max_depth = 7) and a conservative learning rate (). These choices suggest a need for slower, more deliberate learning to avoid overfitting in a domain with potentially high noise and less predictable patterns. The high subsample ratios indicate the model benefits from using a wide variety of data without fully committing to any single subset.
More aggressive regularization was applied here, with a higher min_child_weight = 7 and elevated values for , , and . This strong regularization profile is indicative of significant variation in the underlying data and a corresponding need to constrain model flexibility. It suggests that liabilities may be influenced by less transparent or more externally driven factors, such as debt restructuring, leases, or pension obligations, that are not fully reflected in operational variables.
The model trained to predict required a deep architecture (max_depth = 11) and a high learning rate (), suggesting the existence of sharp thresholds and potentially sparse signals driving debt-related outcomes. The regularization scheme was unique in that it emphasized strong L1 and L2 penalties (, ) while minimizing the influence of (close to zero), indicating that feature sparsity and linear regularization were prioritized over tree pruning based on loss reduction.
This combination implies that may be influenced by a small number of impactful features or threshold effects, likely tied to discrete financial decisions (e.g., new debt issuance, refinancing) that align imperfectly with operational activity. The model’s architecture is consistent with a domain where binary or stepwise external events, rather than continuous trends, drive the target variable.
Summary and Implications
These results underscore the heterogeneity in modeling requirements across different financial targets, despite being derived from the same set of operational features. The divergence in optimal tree depths, learning rates, and regularization strengths reflects the distinct structural and temporal dynamics governing each financial metric.
The success of Optuna’s automated tuning strategy highlights the value of target-specific model optimization in multi-output regression tasks. Treating each financial outcome as a separate learning problem enables more accurate and interpretable models, with configurations tailored to each variable’s unique complexity and volatility.
Overall, this approach demonstrates a scalable, data-driven method for bridging operational metrics and financial forecasting in the aviation sector—one that can be extended or augmented with additional macroeconomic and firm-level features to further enhance performance and robustness in future work.
5. Discussion
Although considerable research has investigated the economic and operational impacts of the COVID-19 pandemic on the U.S. airline industry, there remains a notable gap in the use of predictive, data-driven modeling frameworks that quantify how airline operations relate to financial outcomes over time. Much of the current literature tends to rely on descriptive statistics or macroeconomic evaluations, offering high-level assessments of lost revenue, reductions in passenger volume, and the influence of government relief programs. While such analyses are important, they often lack the precision required to evaluate the dynamic interplay between operational performance—such as payload capacity, freight tonnage, air time, and seating availability—and financial indicators like liquidity, asset value, liability exposure, and long-term debt. This study addresses that gap by implementing an XGBoost-based machine learning framework that uncovers how these relationships evolved across different phases of the pandemic.
This research offers several contributions to the broader understanding of aviation economics and data-driven forecasting. First, it introduces a robust modeling pipeline capable of predicting multiple financial metrics using operational data segmented into three distinct periods: pre-COVID (2015–2019), peak-COVID (2020–2021), and post-COVID recovery (2022–2024). Through this segmentation, the analysis reveals how the pandemic prompted a structural realignment within the industry. Most notably, freight-related features emerged as dominant predictors of liquidity during the COVID period, replacing the previously significant passenger and distance-based metrics. This shift reflects the strategic turn toward cargo operations as a means of maintaining cash flow amidst a collapse in passenger demand.
The temporal structure of the analysis also enables a deeper understanding of how external shocks—particularly global health emergencies—can reshape the financial and operational contours of an industry as interconnected as aviation. By examining predictive feature patterns over time, the study sheds light on how airlines adapted their operations in response to crisis conditions, and how those adaptations impacted financial outcomes. These insights are not merely retrospective but also inform strategies for building long-term resilience and enhancing industry-wide adaptability in the face of future disruptions.
Despite these contributions, the study has several limitations that must be acknowledged. One constraint lies in the data itself, which is restricted to publicly available sources such as the Bureau of Transportation Statistics and Worldometers. As a result, the models do not incorporate internal financial statements, competitive dynamics, or qualitative assessments such as managerial decision-making or traveler sentiment—factors that could significantly influence financial performance. Additionally, the use of reported COVID-19 case counts as a proxy for pandemic severity, though broadly effective, does not account for important nuances such as regional policy heterogeneity, varying vaccination rates, or behavioral shifts in consumer travel patterns.
Furthermore, while XGBoost is a powerful algorithm for uncovering complex nonlinear relationships and ranking feature importance, it is not designed to determine causality. The observed associations between operational features and financial targets do not imply direct causal mechanisms. Consequently, although the models provide strong predictive capabilities, they do not offer definitive explanations for the underlying factors driving financial change during the pandemic.
Looking ahead, there are several promising directions for future research that could build upon this study. Expanding the feature set to include broader macroeconomic variables—such as oil prices, inflation rates, employment figures, and interest rate trends—would provide a more holistic context for interpreting financial fluctuations. Incorporating causal inference methods or advanced time-series econometric models could help distinguish statistical correlations from genuine cause-and-effect relationships, adding interpretability and policy relevance to the findings. The modeling approach presented here could also be extended beyond the airline industry to examine other modes of transportation, such as maritime shipping or rail travel, thereby contributing to a more comprehensive understanding of mobility system resilience during global crises.
Finally, the insights from this research could serve as a foundation for the development of real-time predictive tools or dashboards to support decision-making across the aviation sector. Such tools could integrate continuous data feeds and enable stakeholders to monitor key operational and financial indicators, simulate alternative policy scenarios, or assess the potential impact of emerging threats. Ultimately, the combination of machine learning, domain expertise, and actionable intelligence holds significant potential for fostering a more responsive and robust aviation industry prepared to face future challenges with greater agility and foresight.
Appendix A. Code Repository
The R Markdown file used for data preprocessing, modeling, and analysis is publicly available on GitHub at the following URL:
Readers are encouraged to refer to the repository for full implementation details, reproducibility, and additional documentation.
References
- Camilleri, M. A. (2018). Travel marketing, tourism economics and the airline product. In Tourism, Hospitality & Event Management. [CrossRef]
- Frechtling, D. (2000). Assessing the impacts of travel and tourism – Measuring economic benefits. In J. R. B. Ritchie & C. R. Goeldner (Eds.), Travel, tourism and hospitality research: A handbook for managers and researchers (2nd ed.).
- Epstein, J. M., Goedecke, D. M., Yu, F., Morris, R. J., Wagener, D. K., & Bobashev, G. (2007). Controlling pandemic flu: The value of international air travel restrictions. PLoS ONE, 2(5), e401. [CrossRef]
- Meltzer, M. I., Cox, N. J., & Fukuda, K. (1999). The economic impact of pandemic influenza in the United States: Priorities for intervention. Emerging Infectious Diseases, 5(5), 659–671. [CrossRef]
- Kaye, A. D., Okeagu, C. N., Pham, A. D., Silva, R. A., Hurley, J. J., Arron, B. L., ... & Cornett, E. M. (2021). Economic impact of COVID-19 pandemic on healthcare facilities and systems: International perspectives. Best Practice & Research Clinical Anaesthesiology, 35(3), 293–306. [CrossRef]
- Atkeson, A. (2020). What will be the economic impact of COVID-19 in the US? Rough estimates of disease scenarios. [CrossRef]
- Dergiades, T., Milas, C., Mossialos, E., & Panagiotidis, T. (2022). Effectiveness of government policies in response to the first COVID-19 outbreak. PLOS Global Public Health, 2(4), e0000242. [CrossRef]
- Devi, S. (2020). Travel restrictions hampering COVID-19 response. The Lancet, 395(10233), 1331–1332. [CrossRef]
- Chinazzi, M., Davis, J. T., Ajelli, M., Gioannini, C., Litvinova, M., Merler, S., ... & Vespignani, A. (2020). The effect of travel restrictions on the spread of the 2019 novel coronavirus (COVID-19) outbreak. Science, 368(6489), 395–400. [CrossRef]
- Rodríguez, A. B. R., Moreno-Izquierdo, L., & Perles-Ribes, J. F. (2011). Growth and internationalisation strategies in the airline industry. Journal of Air Transport Management, 17(2), 110–115. [CrossRef]
- Graham, A. (2000). Demand for leisure air travel and limits to growth. Journal of Air Transport Management, 6(2), 109–118. [CrossRef]
- Graham, A., & Metz, D. (2017). Limits to air travel growth: The case of infrequent flyers. Journal of Air Transport Management, 62, 109–120. [CrossRef]
- Meixell, M. J., & Norbis, M. (2008). A review of the transportation mode choice and carrier selection literature. International Journal of Logistics Management, 19(2), 183–211. [CrossRef]
- Atayah, O. F., Dhiaf, M. M., Najaf, K., & Frederico, G. F. (2021). Impact of COVID-19 on financial performance of logistics firms: Evidence from G-20 countries. Journal of Global Operations and Strategic Sourcing, 15(2), 172–196. [CrossRef]
- Yang, Z., Yu, S., & Notteboom, T. (2016). Airport location in multiple airport regions (MARs): The role of land and airside accessibility. Journal of Transport Geography, 52, 98–110. [CrossRef]
Figure 1.
Feature importance during the Non-COVID period
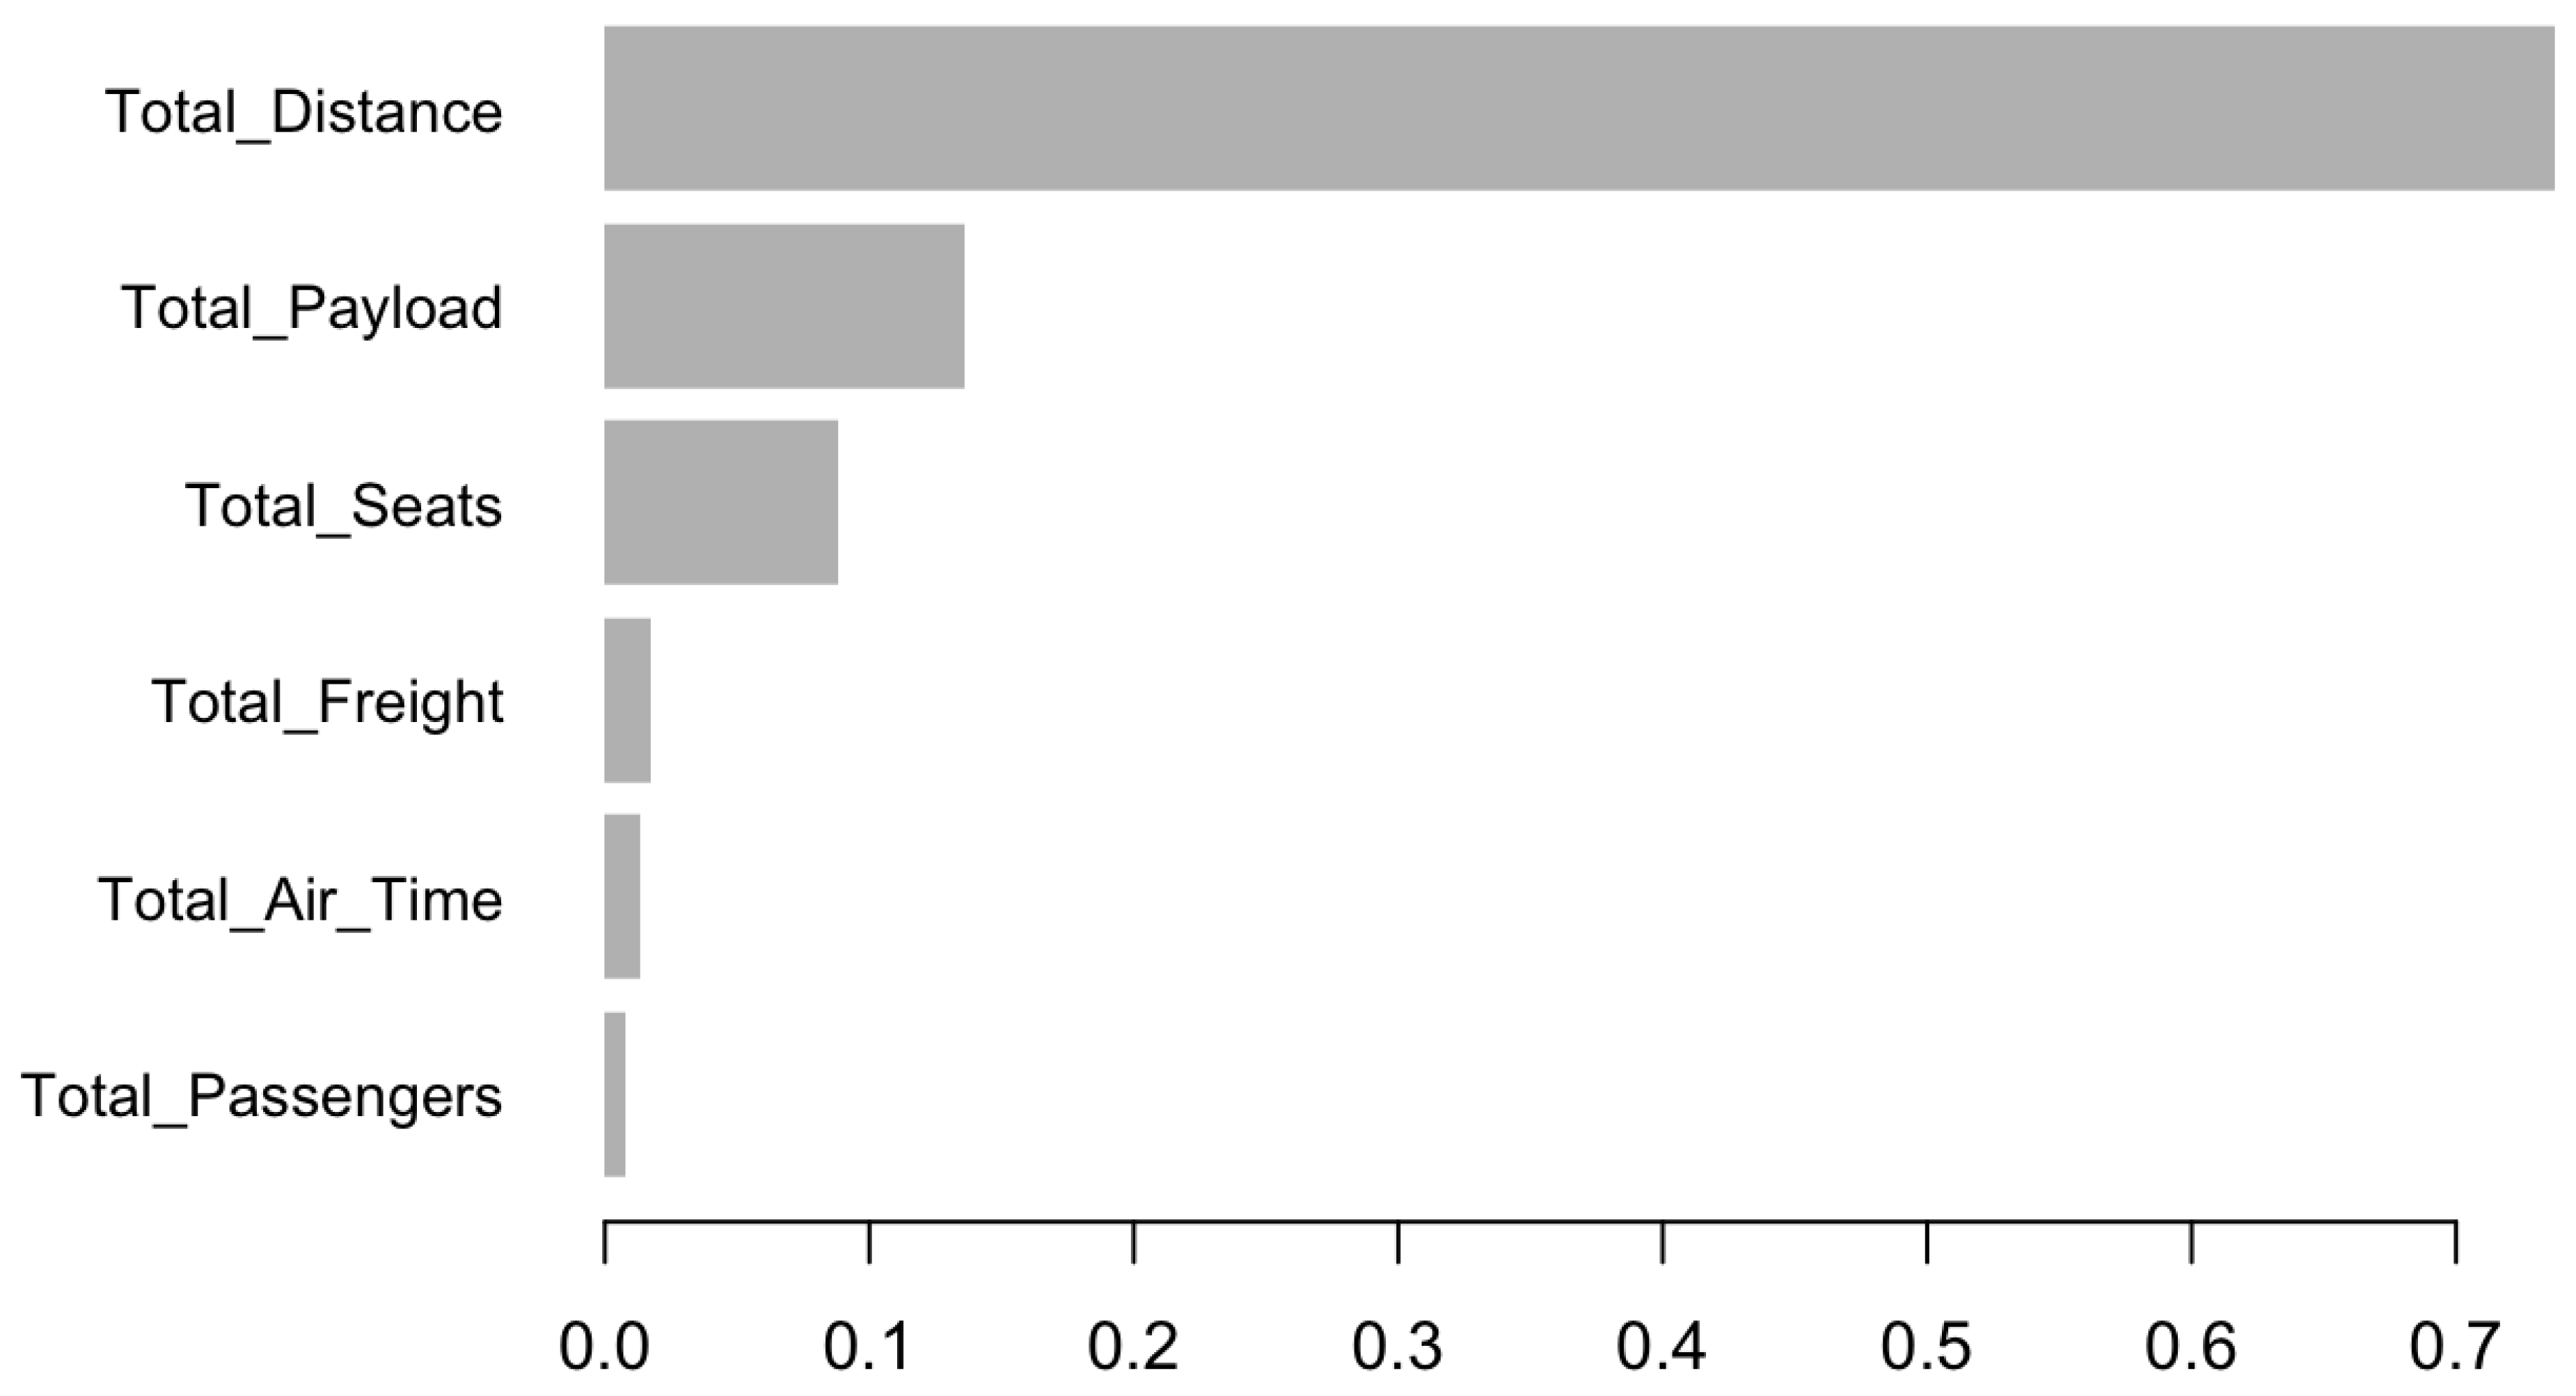
Figure 2.
Feature importance during the COVID period
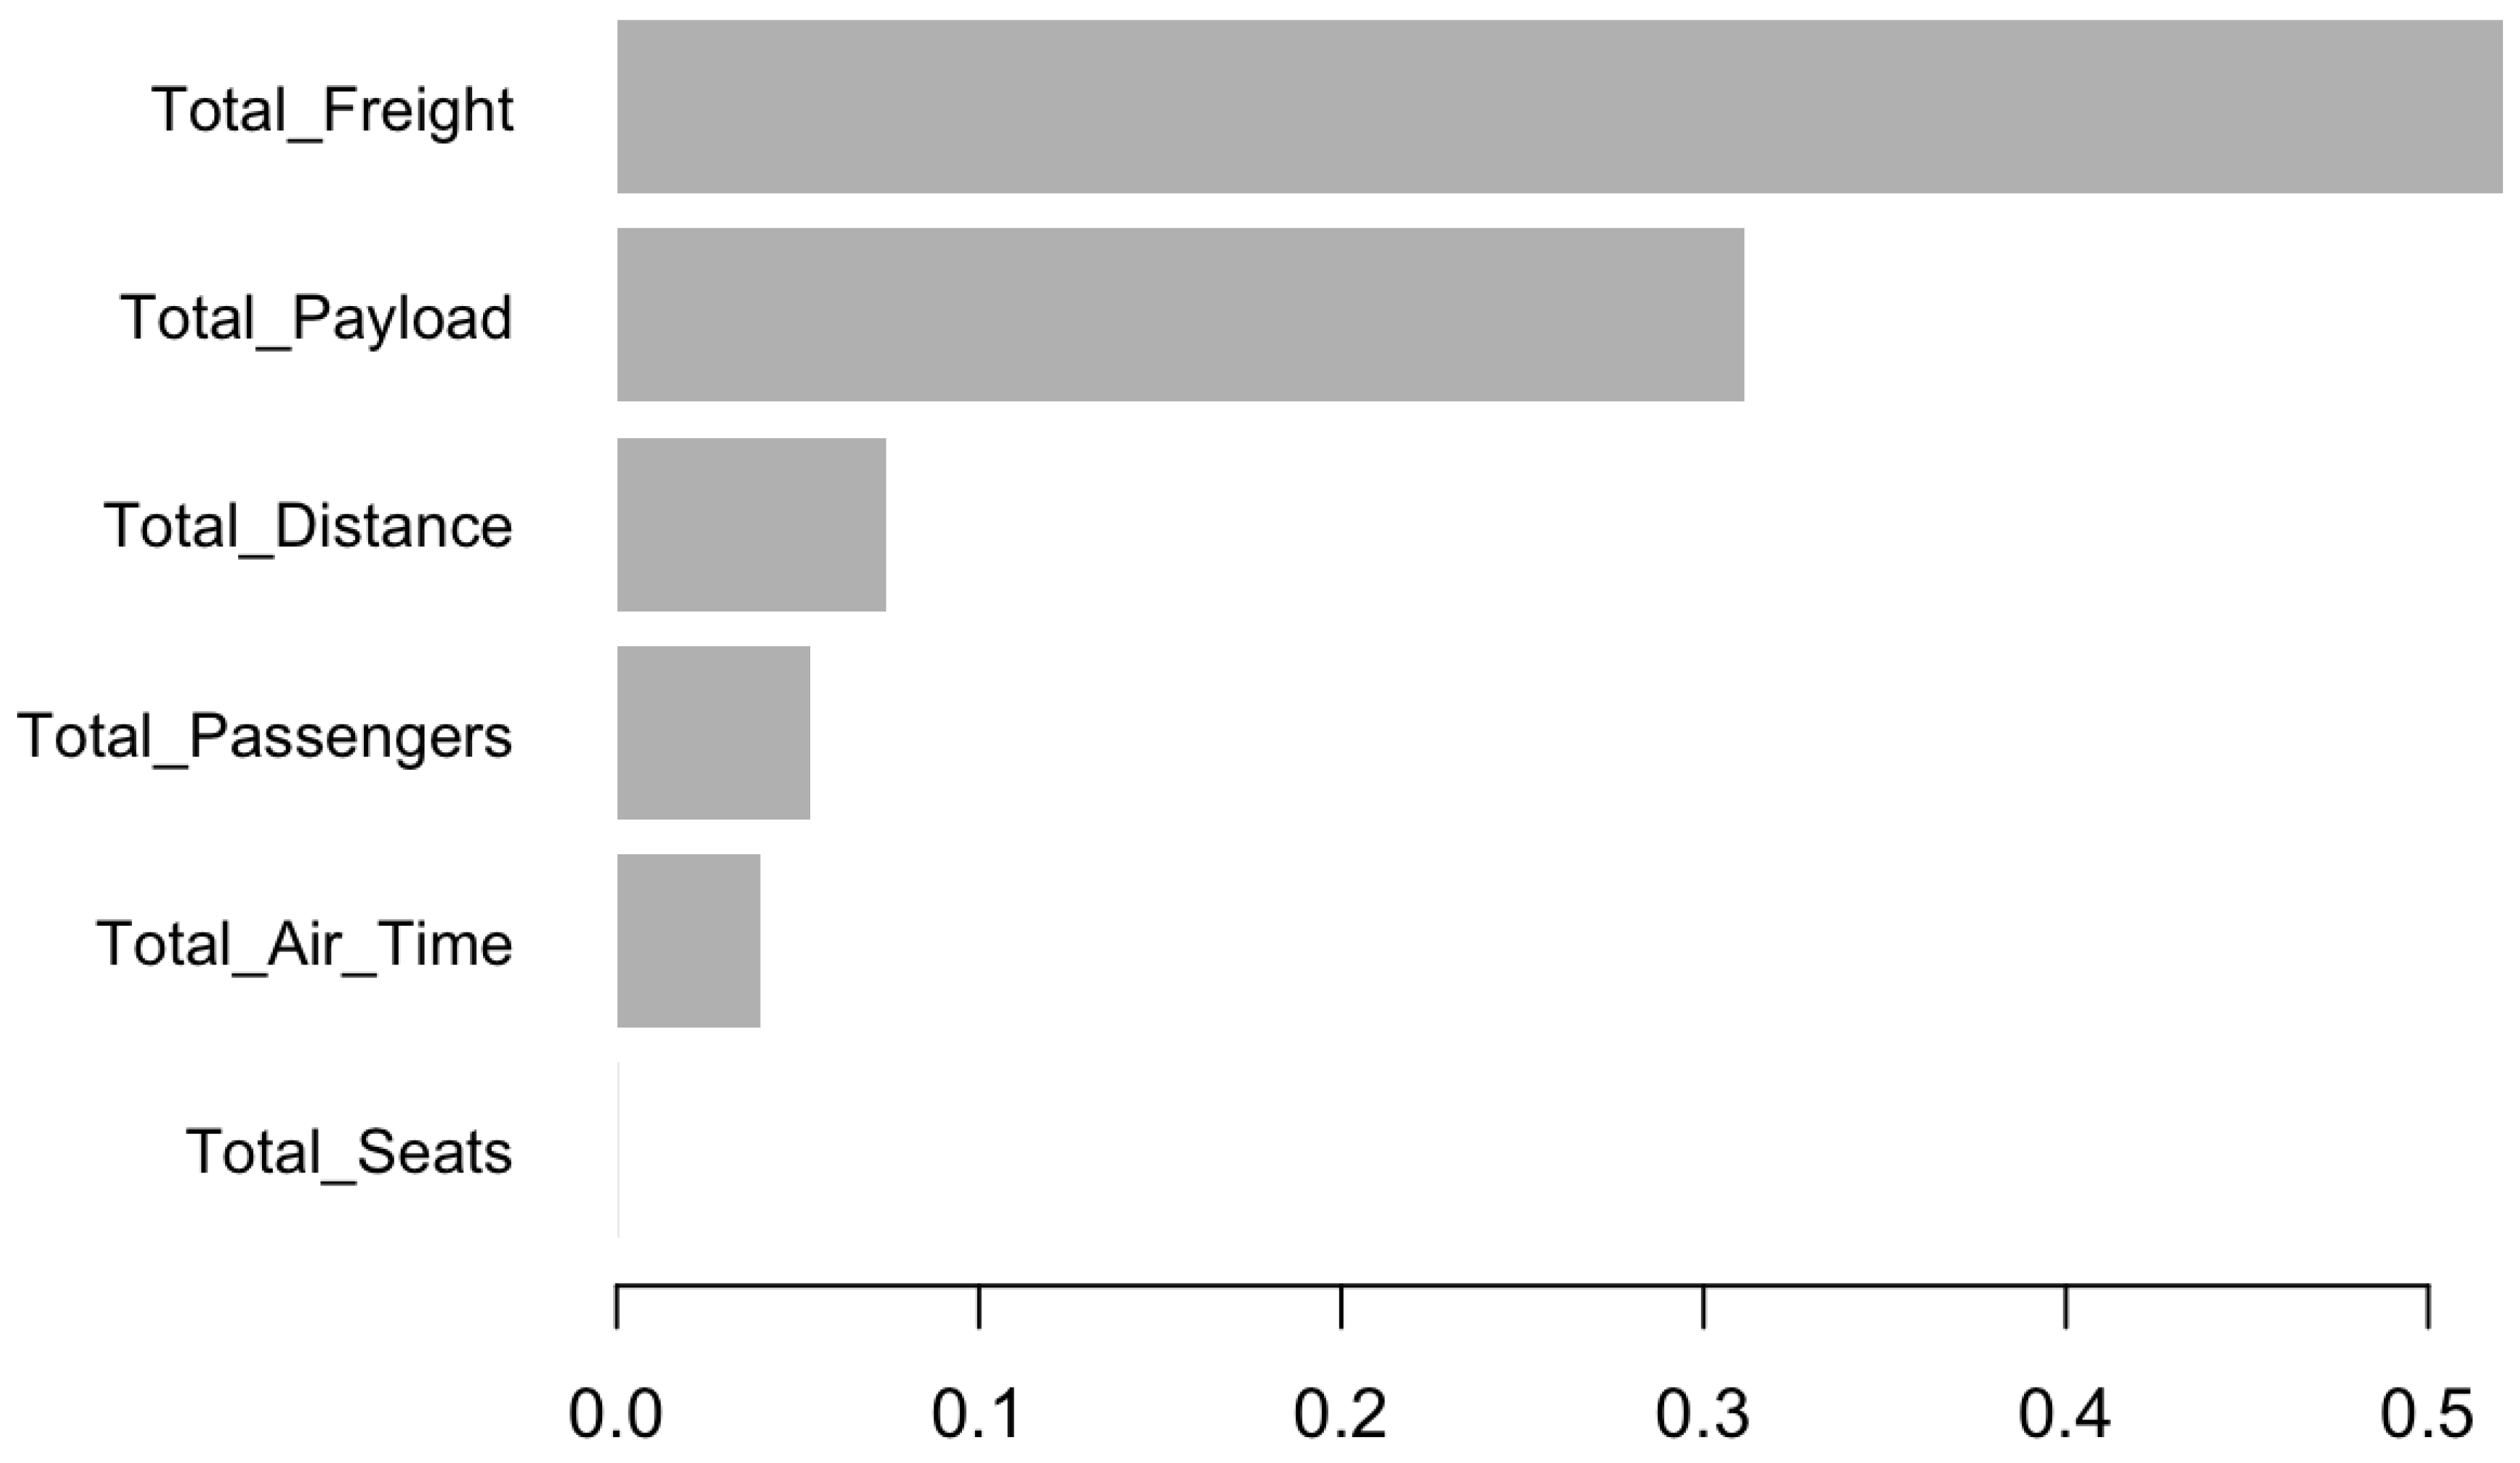
Figure 3.
Aggregated feature importance and model performance across financial targets
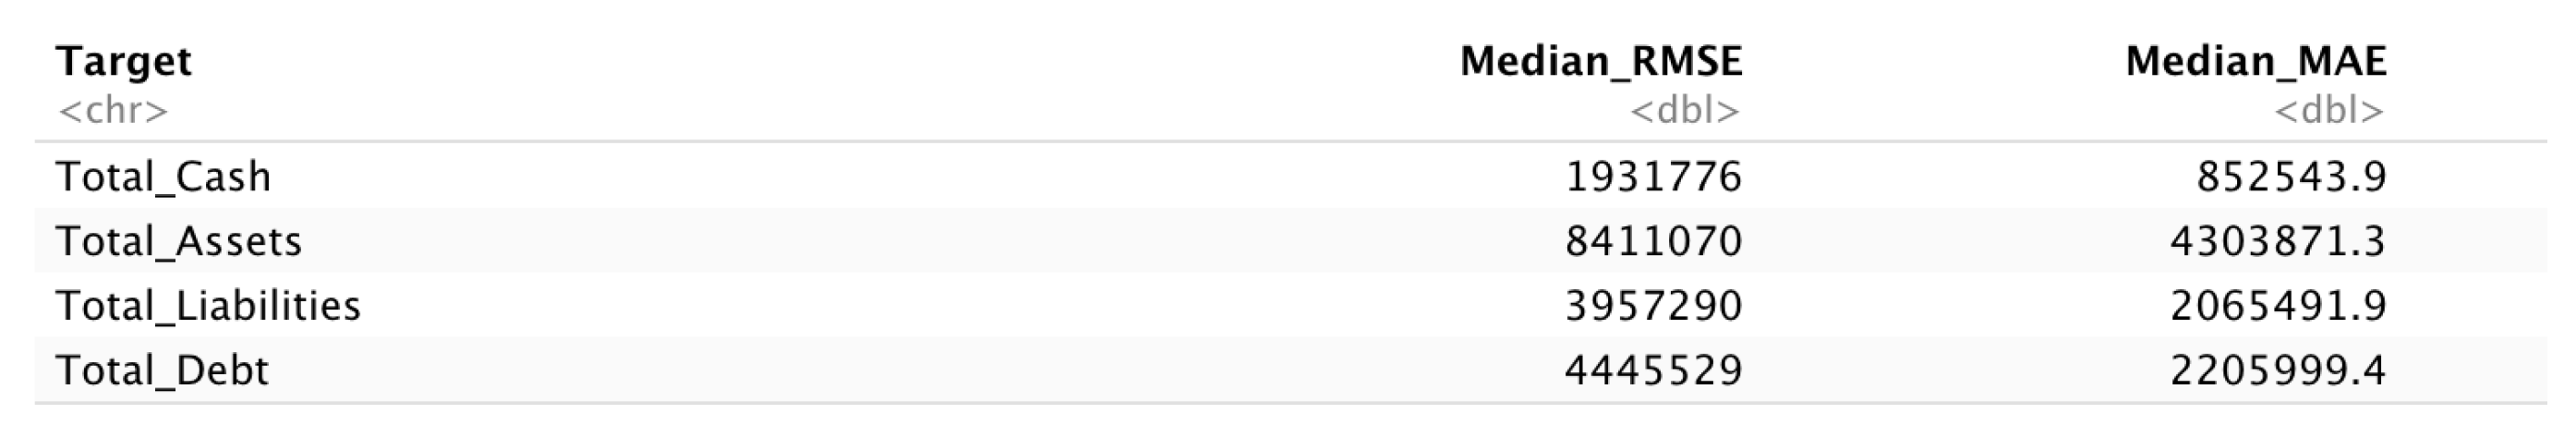
Figure 4.
Waterfall plot for Total Cash prediction contributions
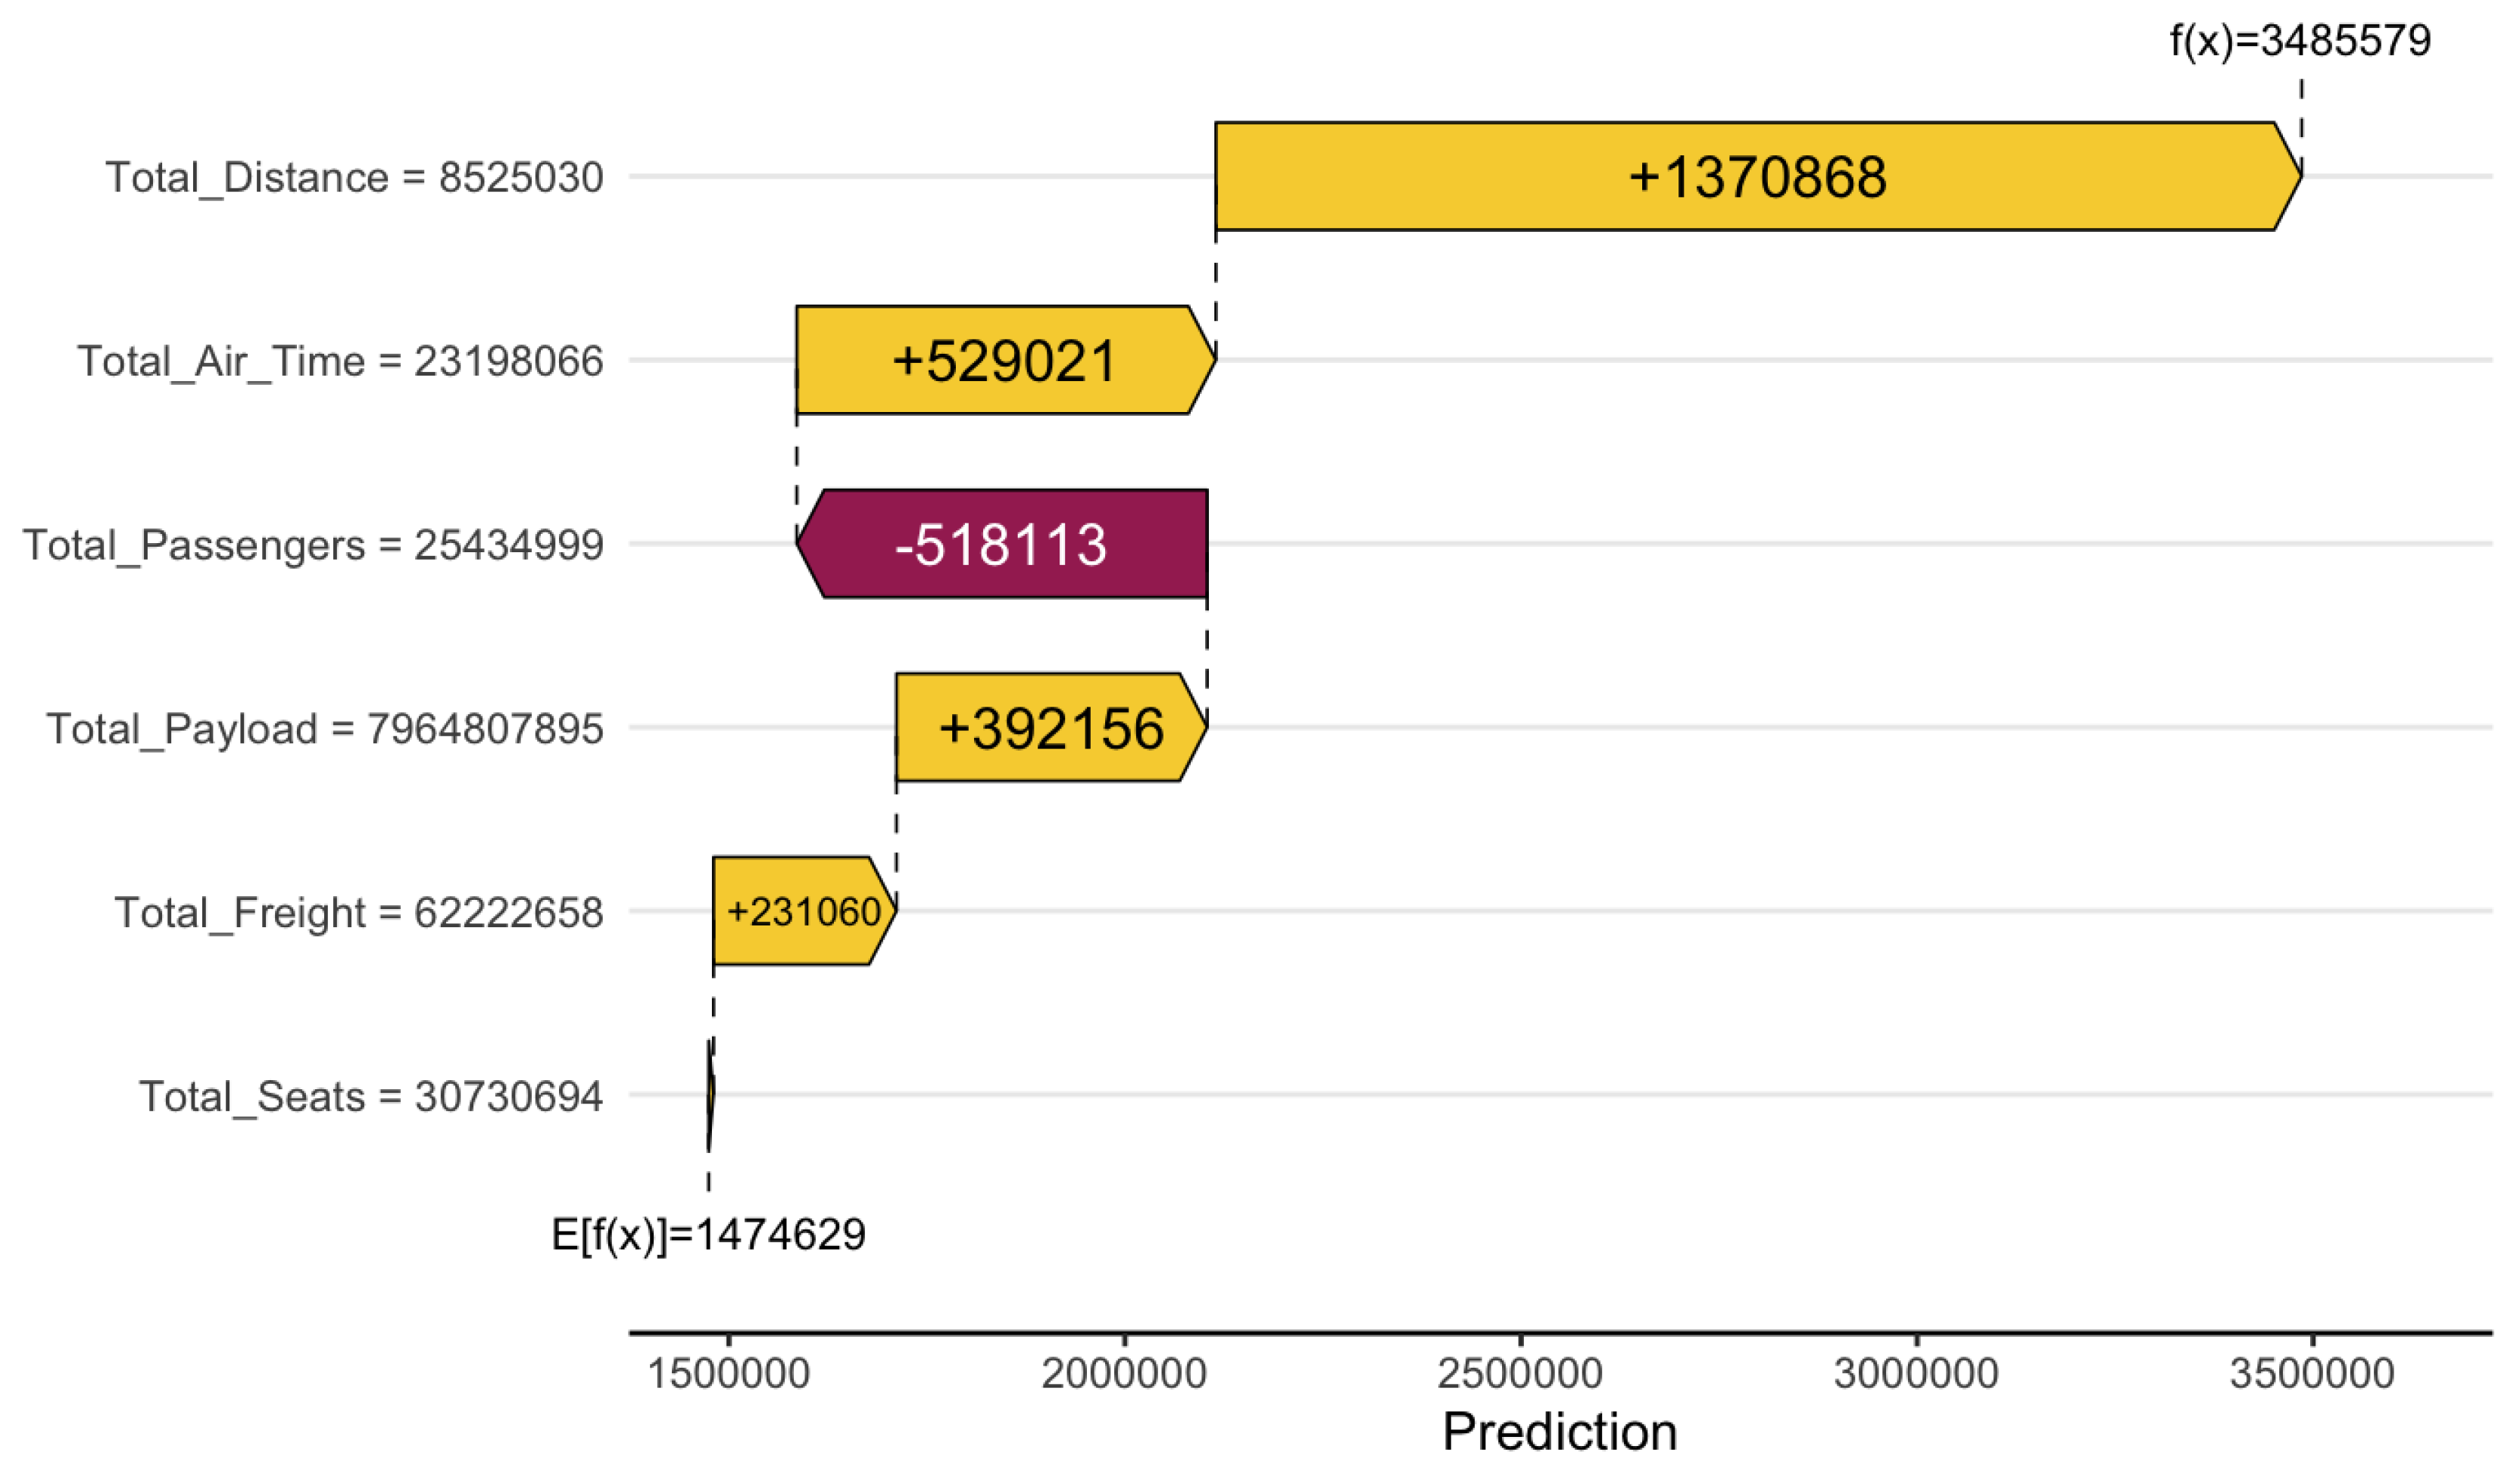
Figure 5.
Feature importance for Total Cash model
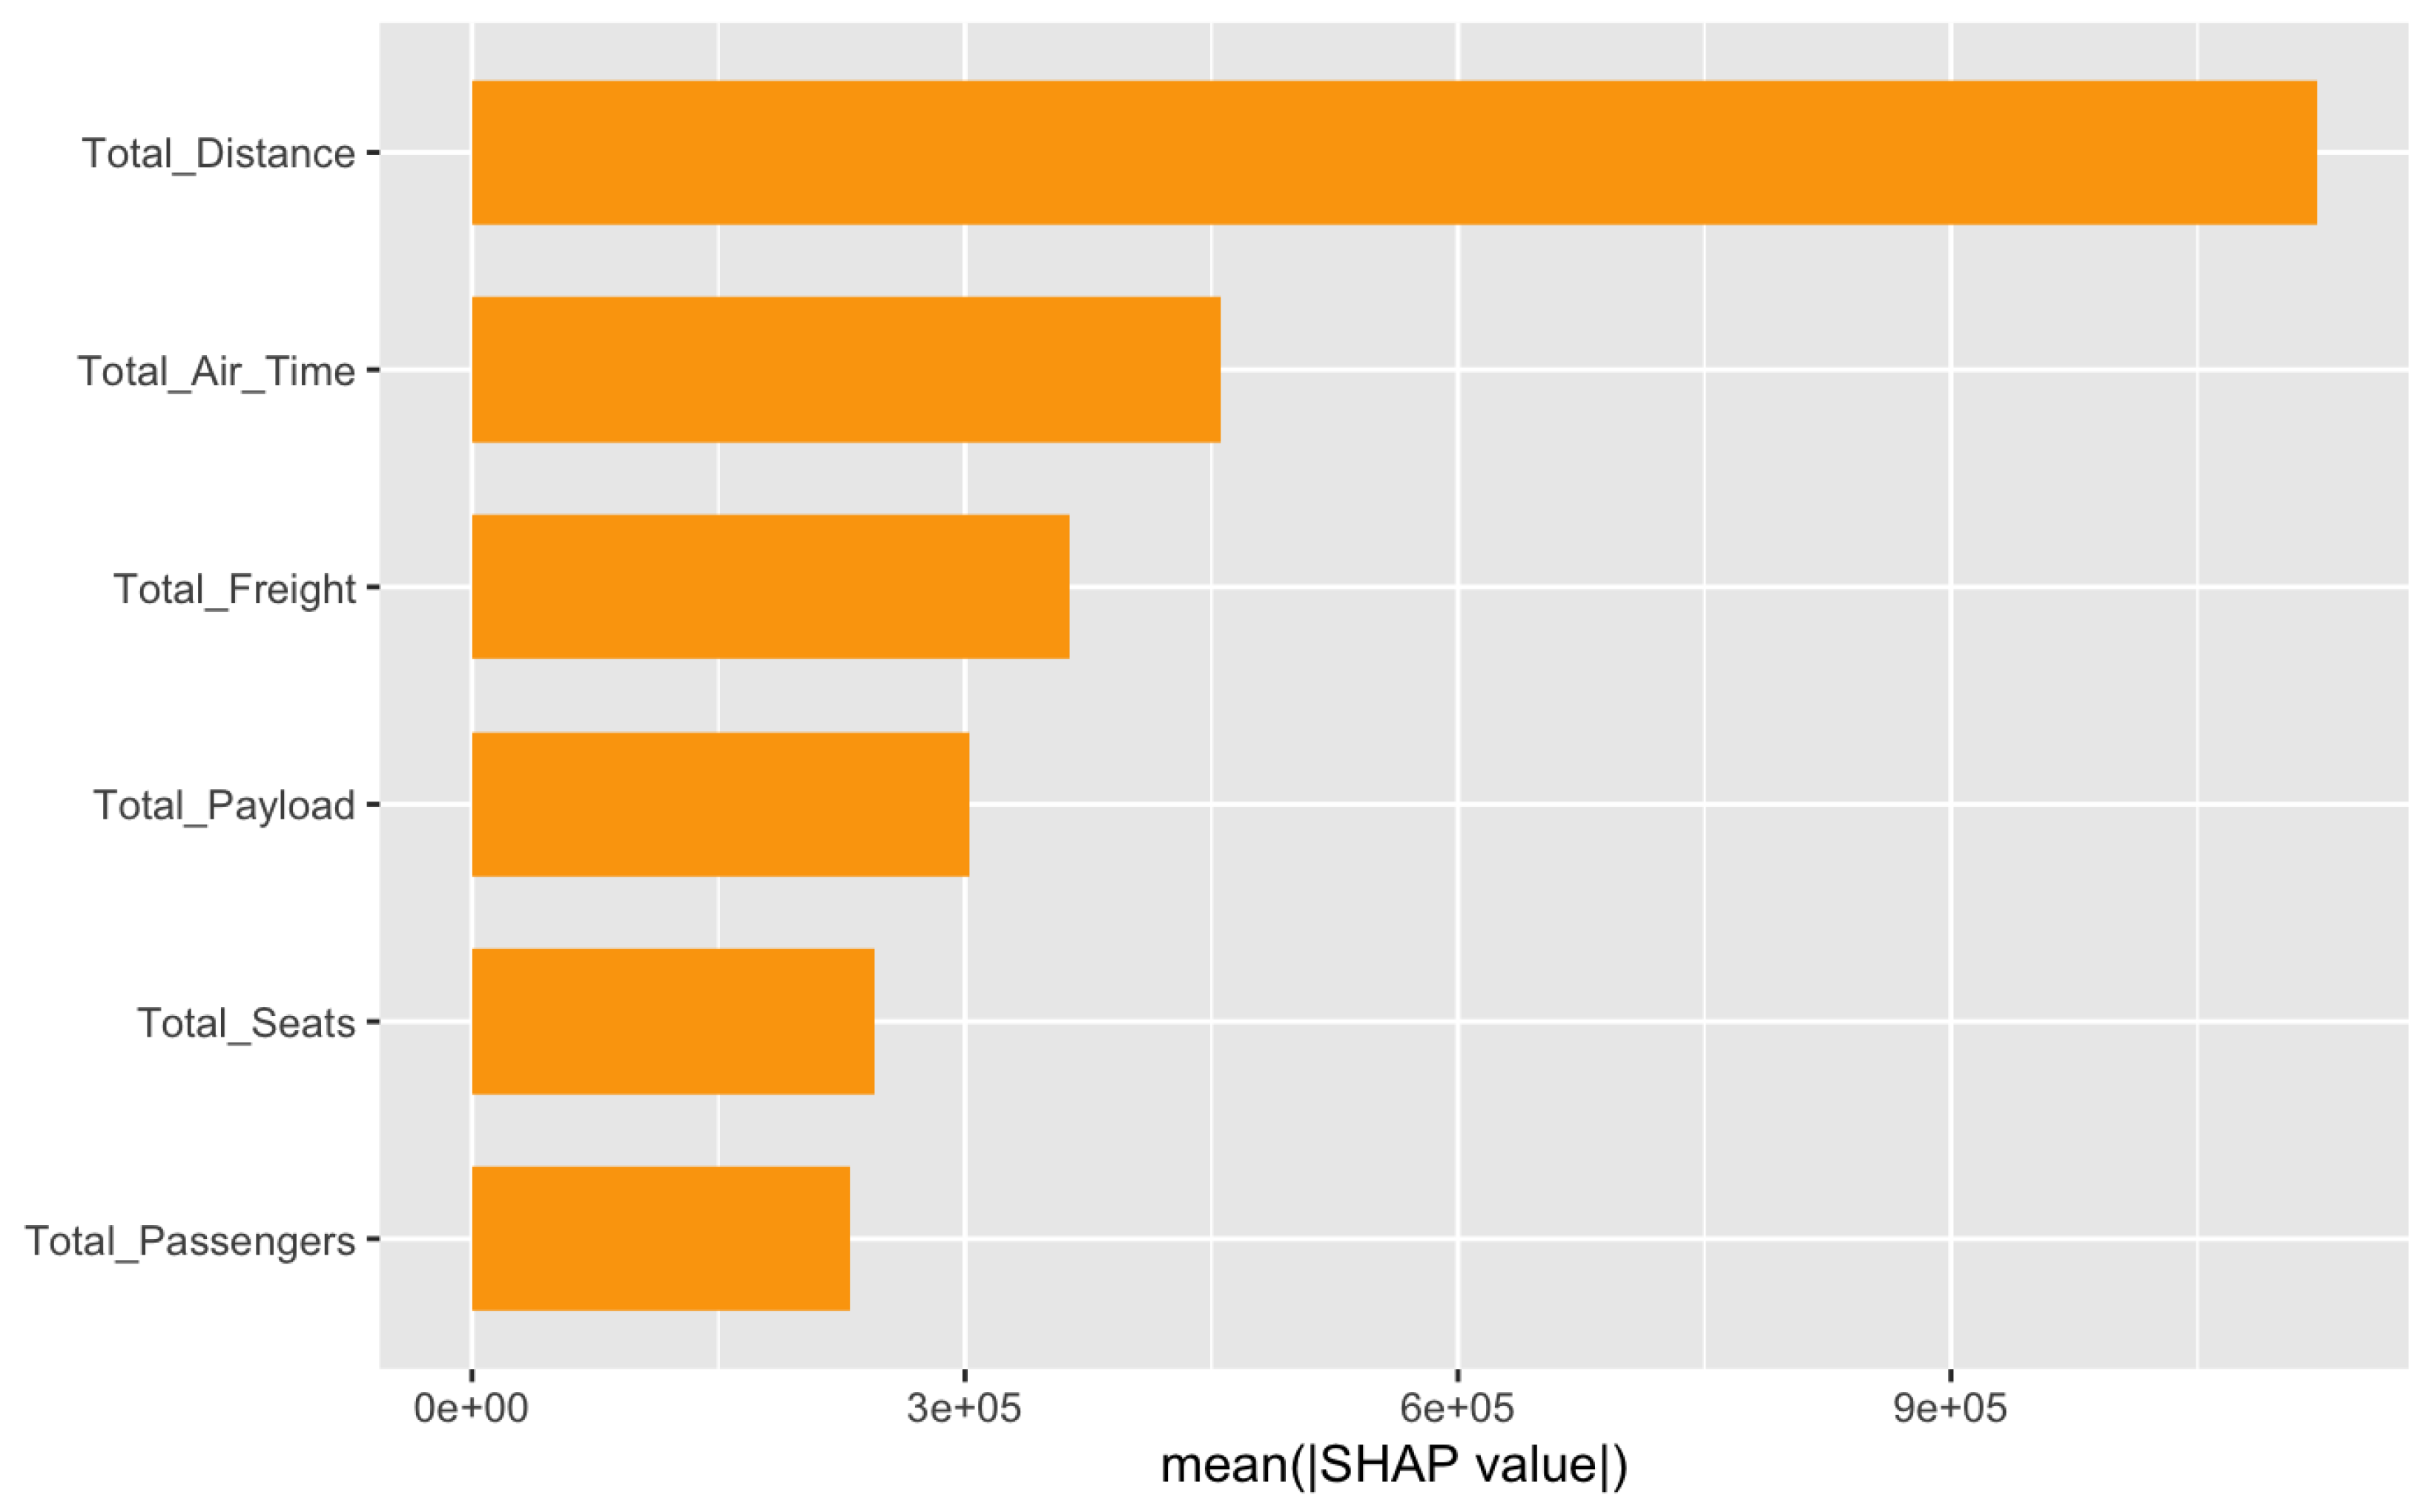
Figure 6.
Waterfall plot for Total Asset prediction contributions
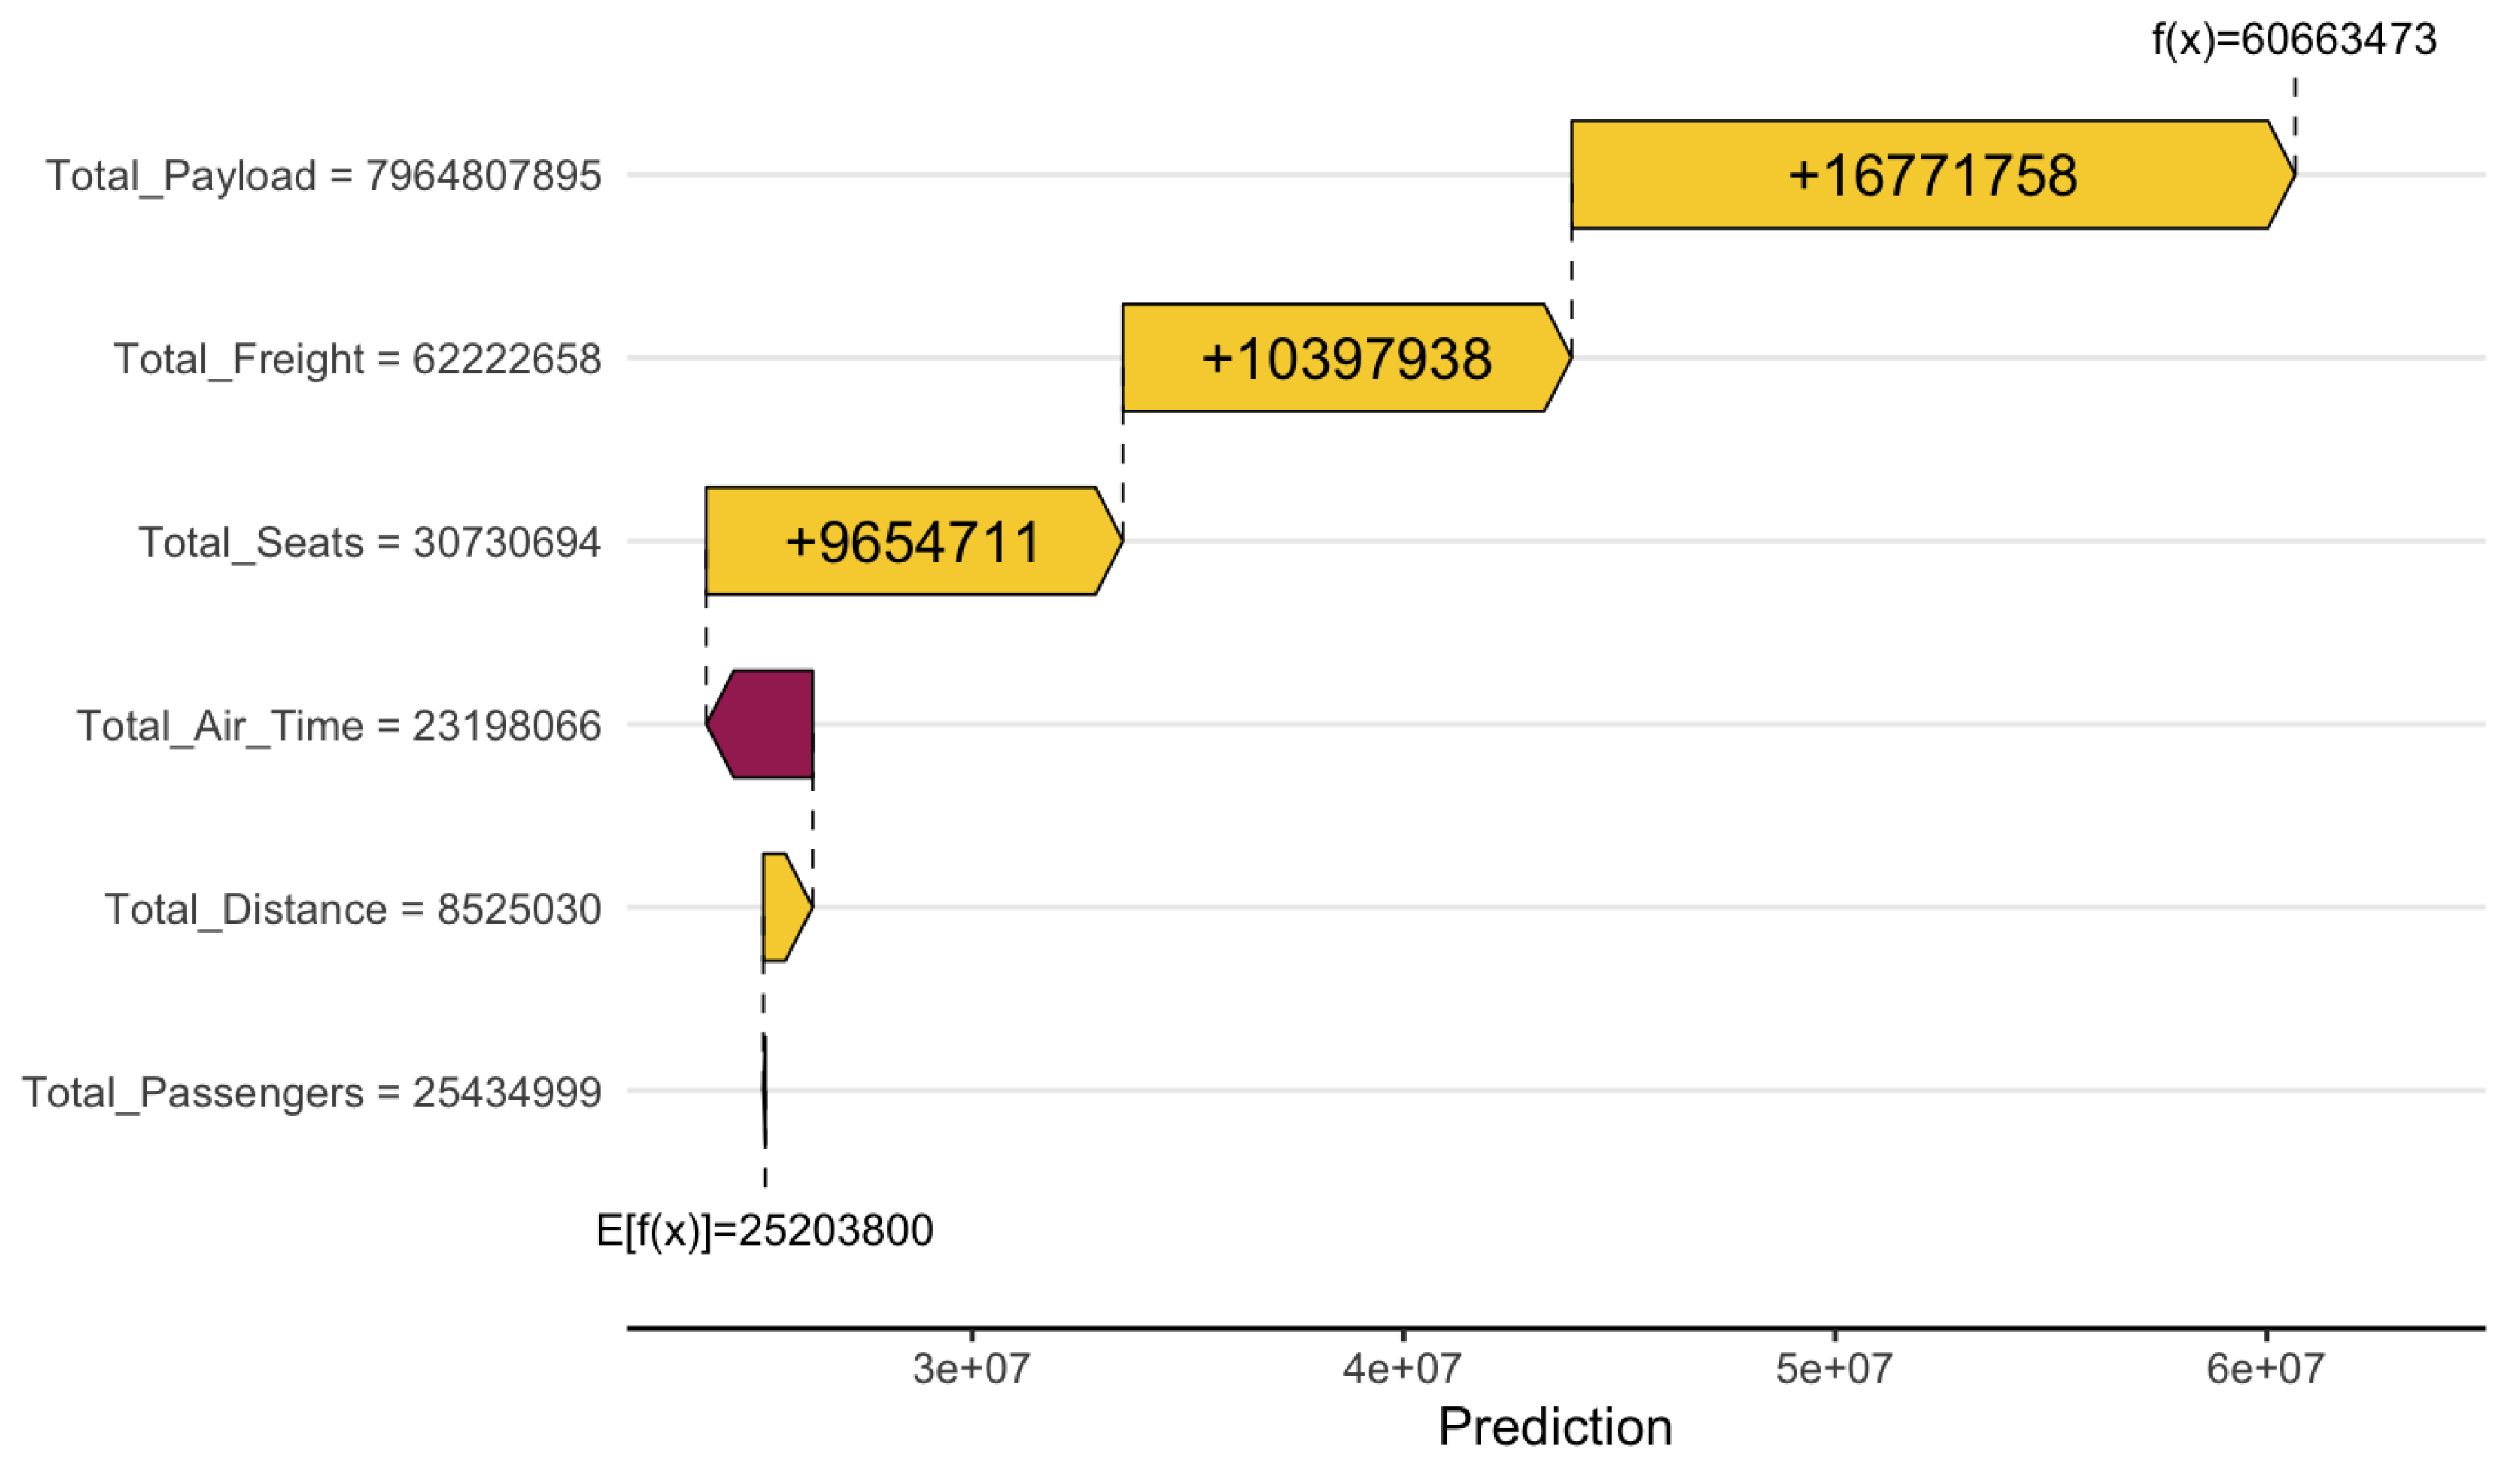
Figure 7.
Feature importance for Total Asset model
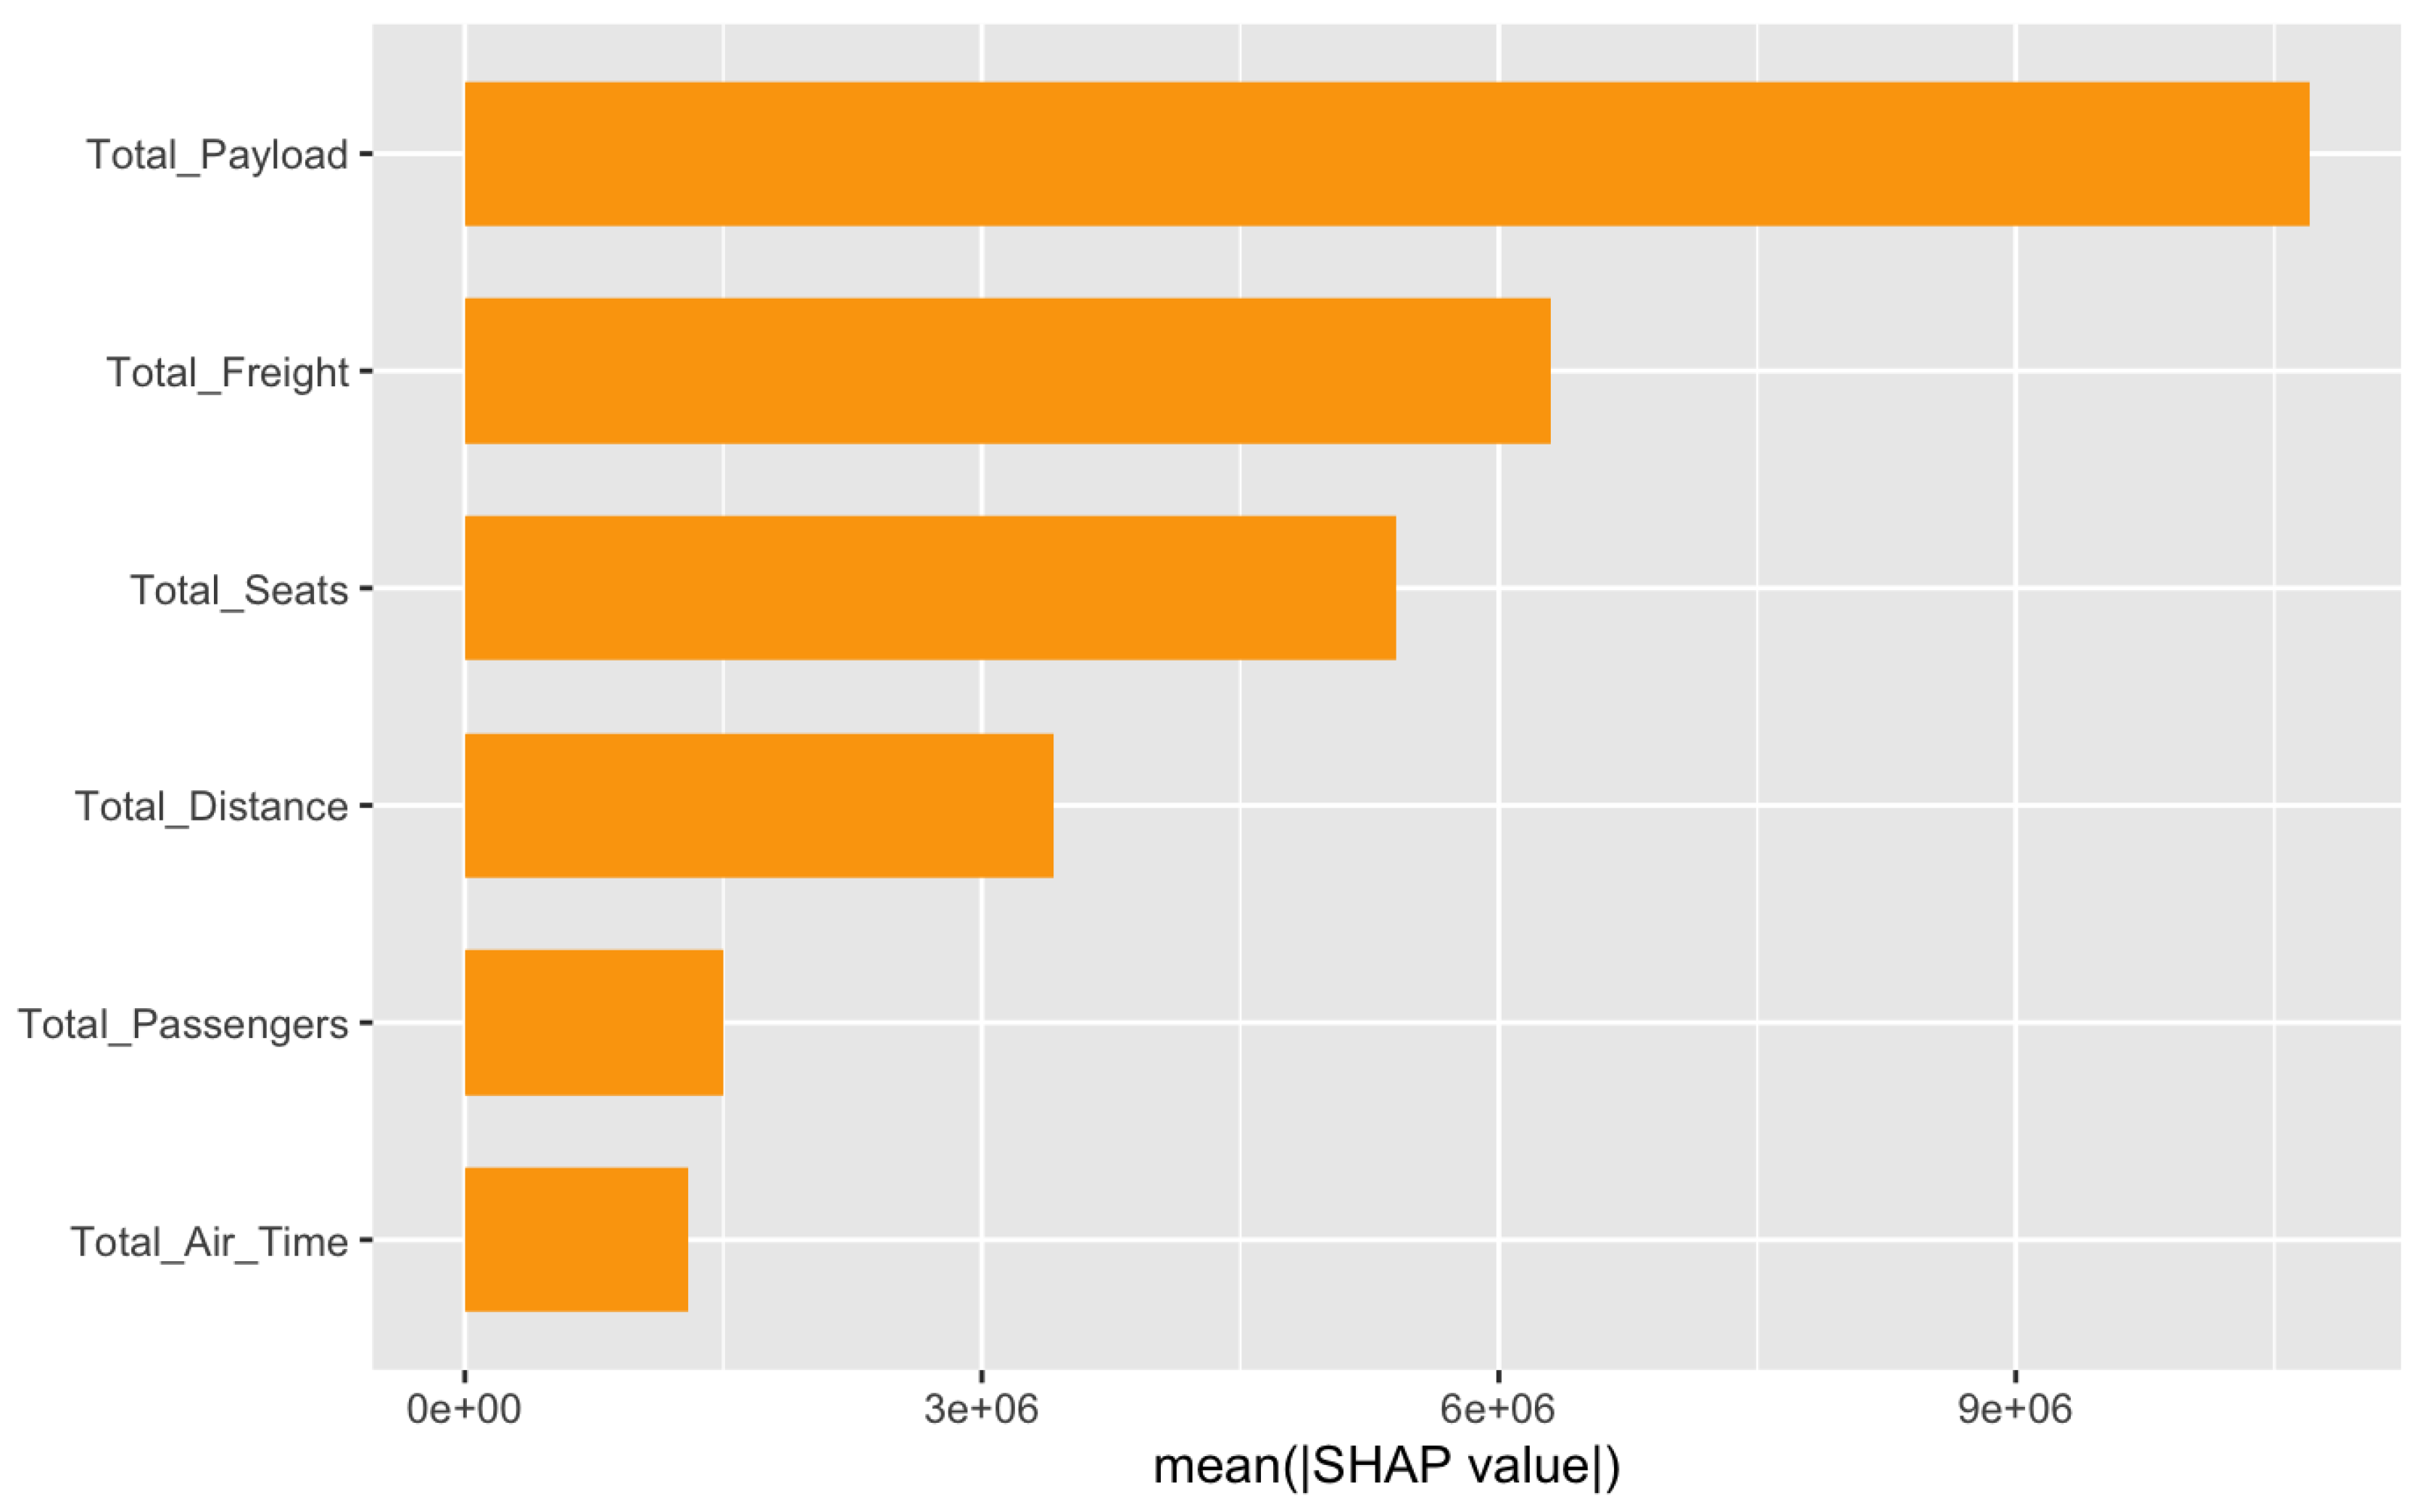
Figure 8.
Waterfall plot illustrating prediction contributions in the Total Liability model.
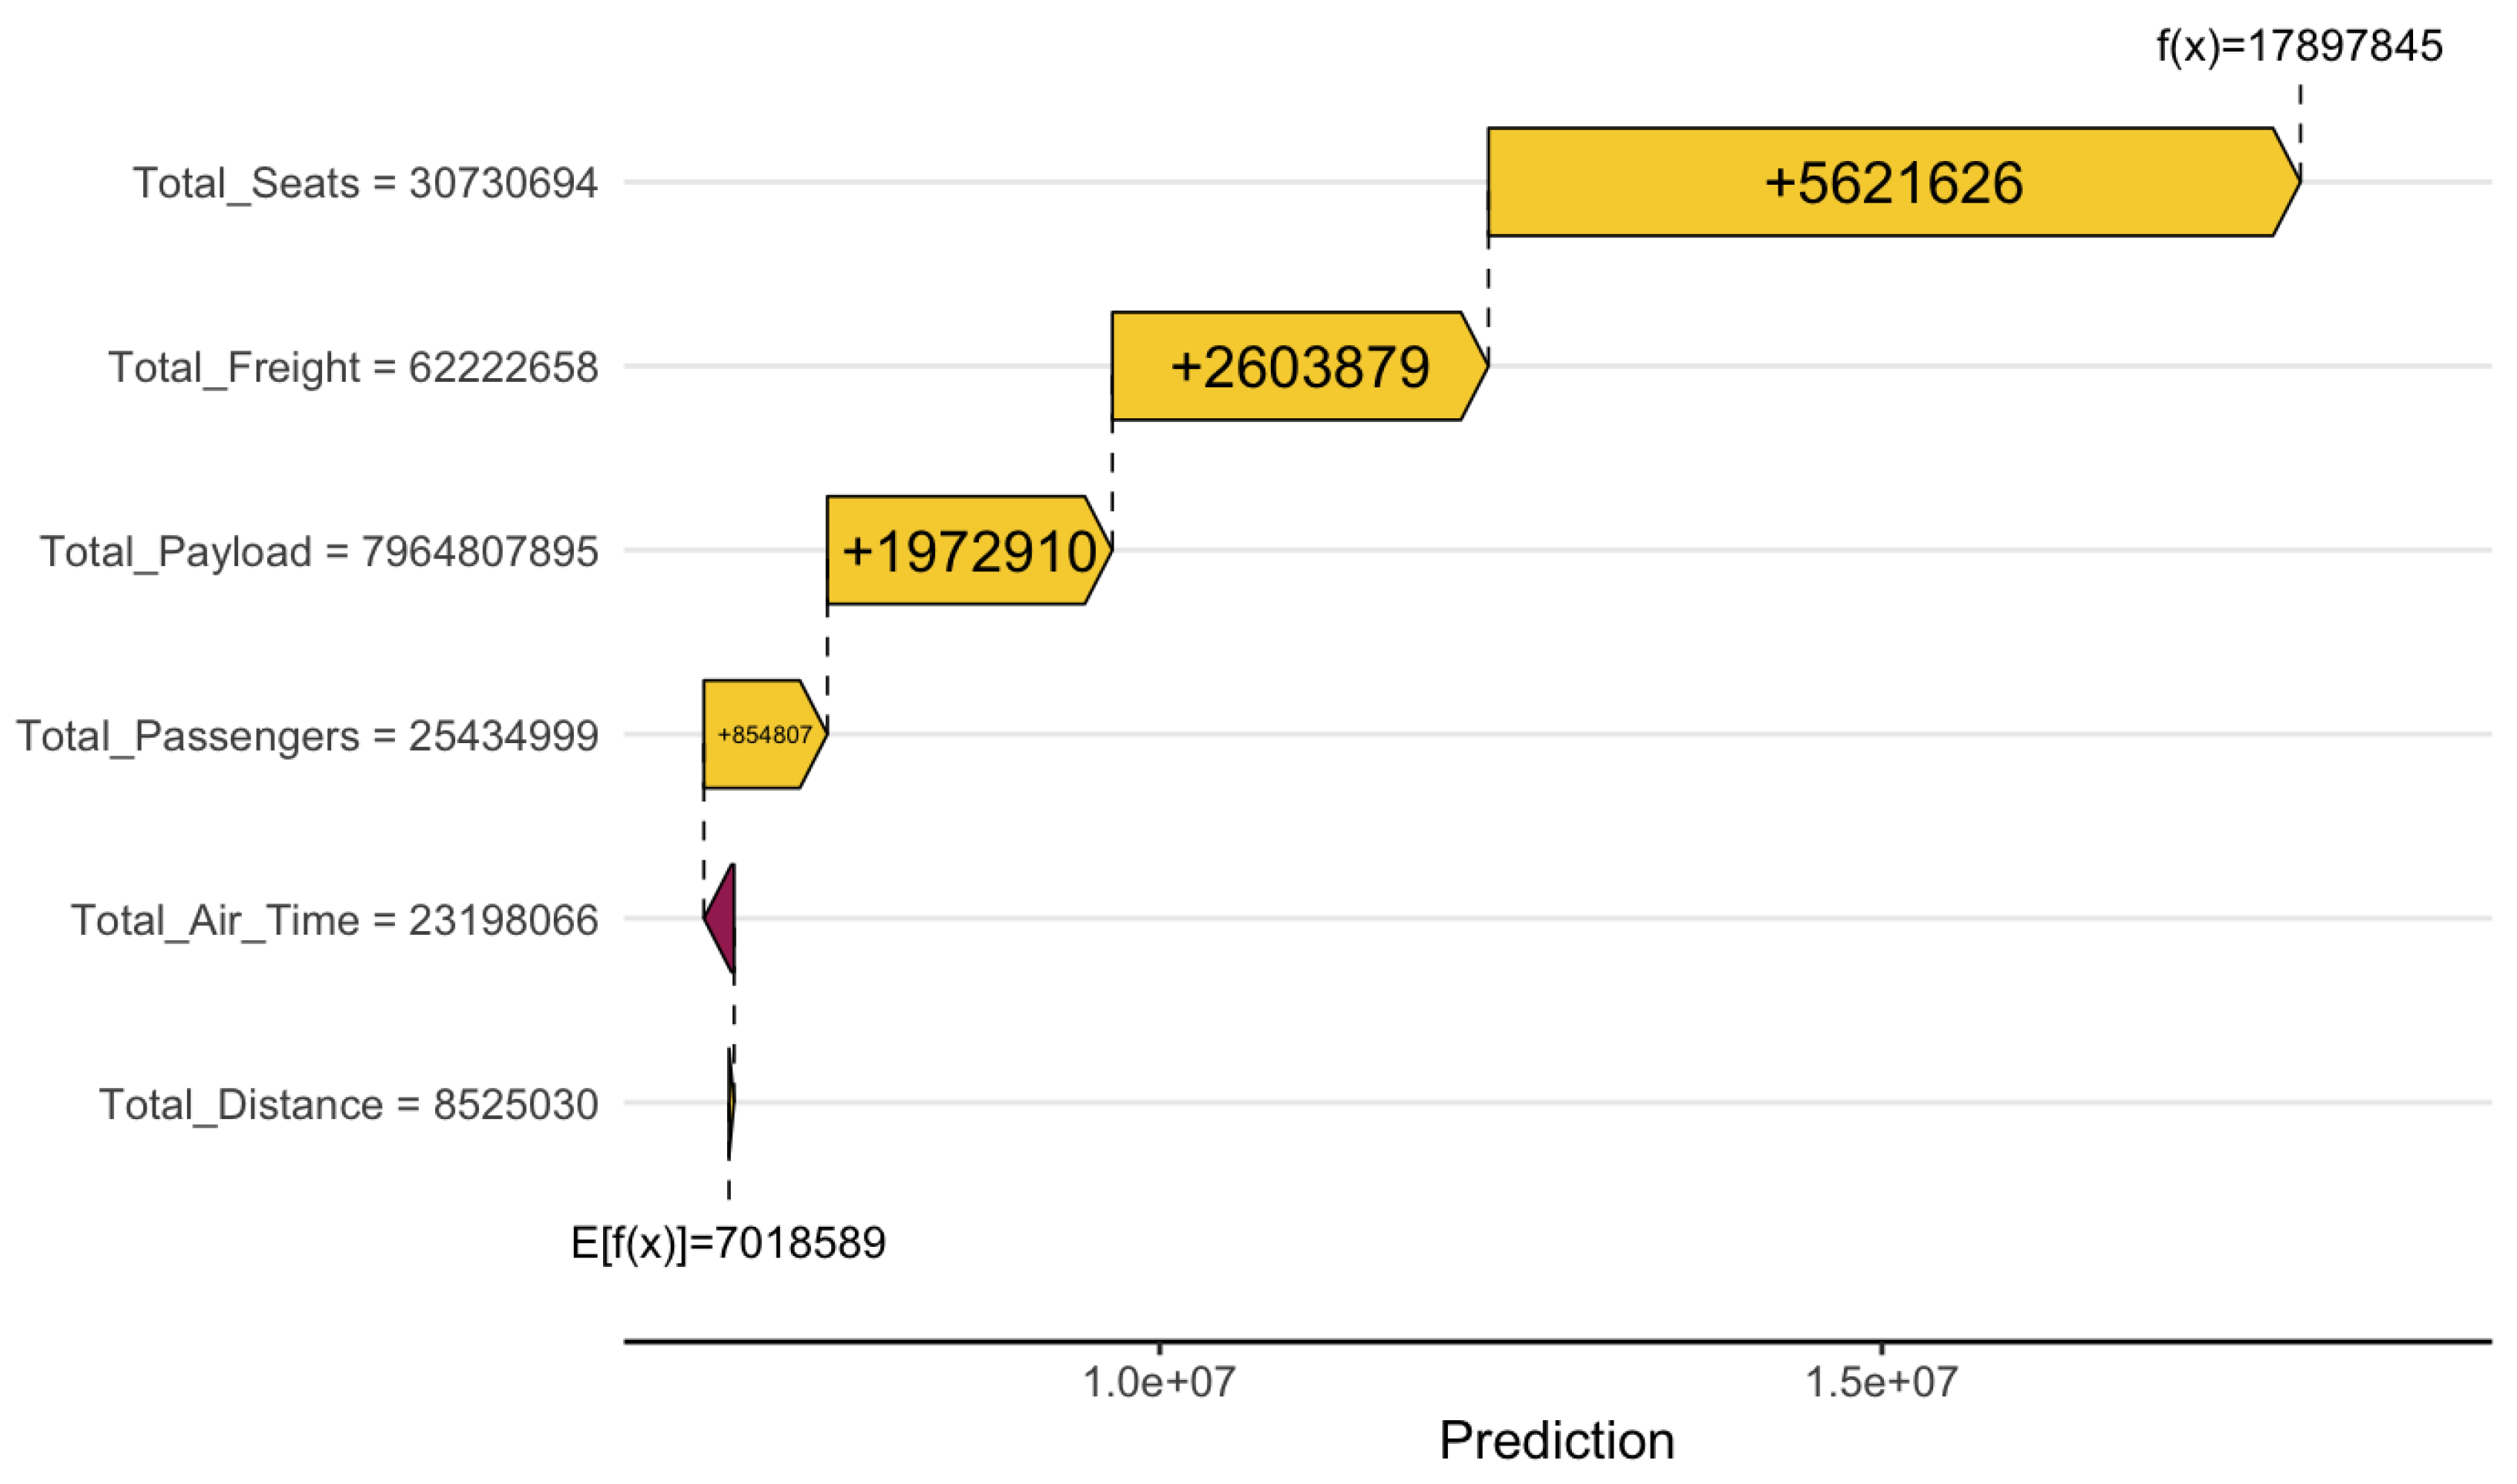
Figure 9.
Feature importance in the Total Liability model.
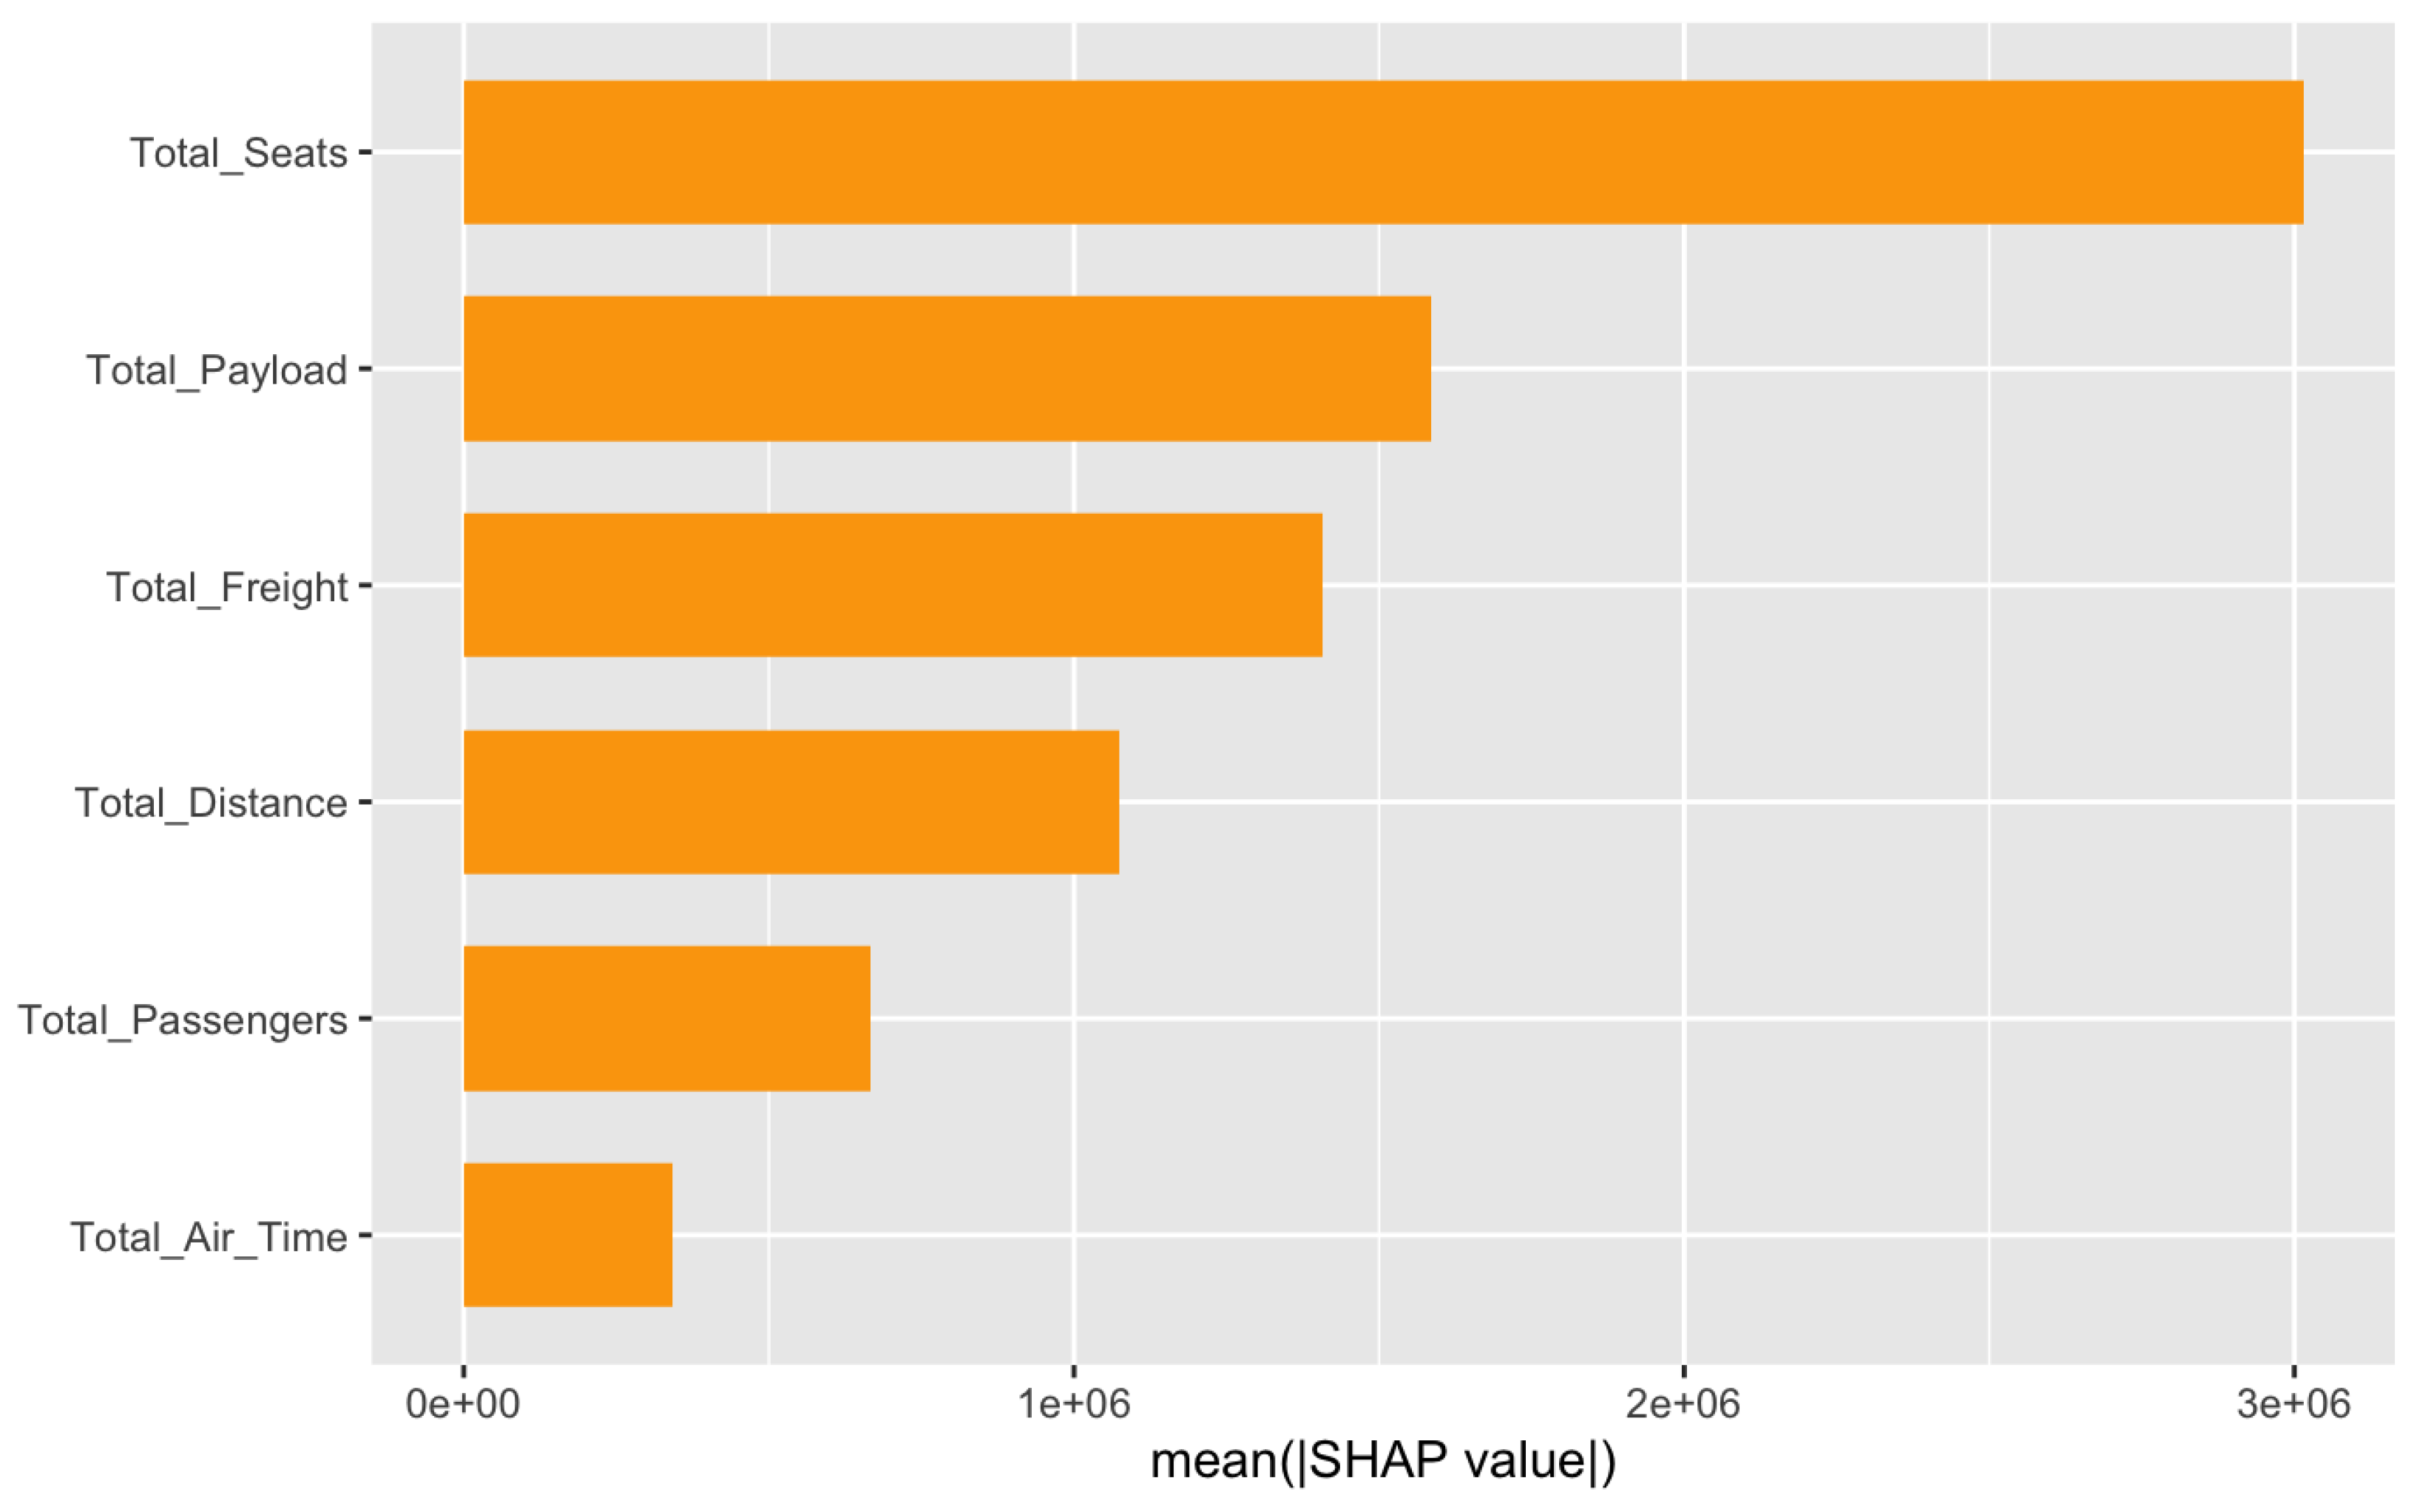
Figure 10.
Waterfall plot for Total Debt prediction contributions
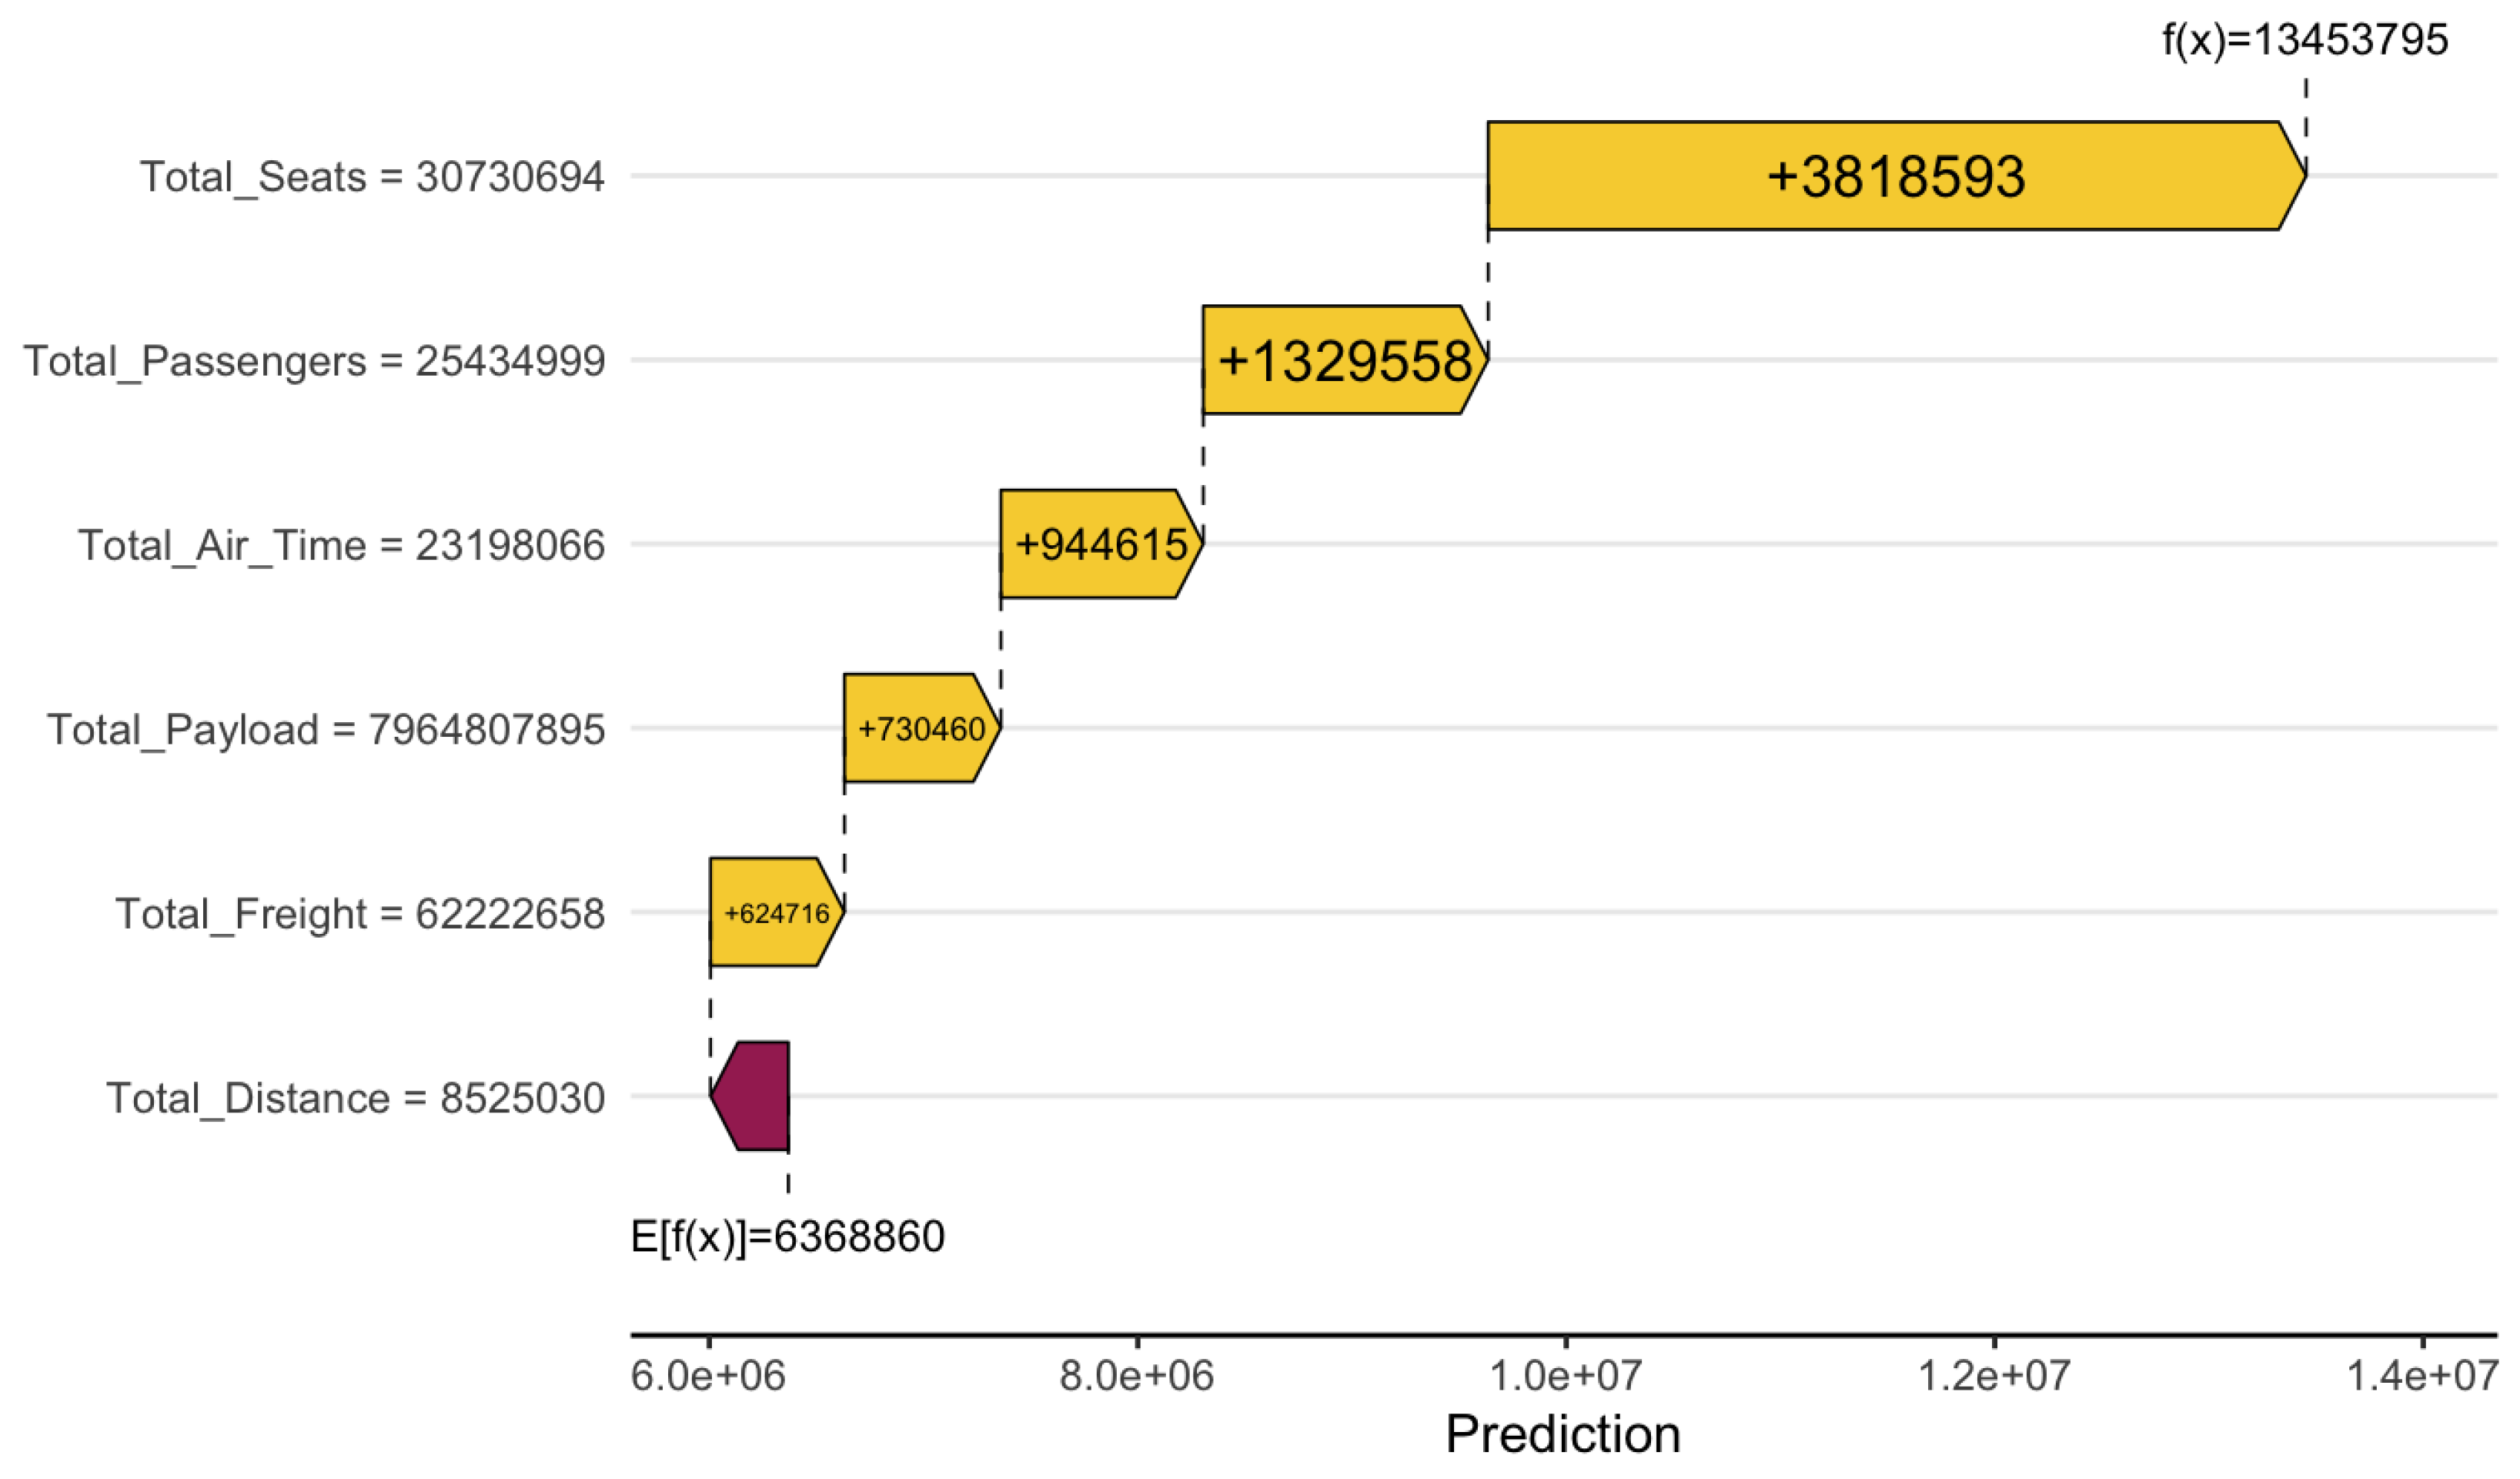
Figure 11.
Feature importance for Total Debt model
Disclaimer/Publisher’s Note: The statements, opinions and data contained in all publications are solely those of the individual author(s) and contributor(s) and not of MDPI and/or the editor(s). MDPI and/or the editor(s) disclaim responsibility for any injury to people or property resulting from any ideas, methods, instructions or products referred to in the content. |
© 2025 by the authors. Licensee MDPI, Basel, Switzerland. This article is an open access article distributed under the terms and conditions of the Creative Commons Attribution (CC BY) license (http://creativecommons.org/licenses/by/4.0/).
Copyright: This open access article is published under a Creative Commons CC BY 4.0 license, which permit the free download, distribution, and reuse, provided that the author and preprint are cited in any reuse.


