
Submitted:
09 June 2023
Posted:
12 June 2023
You are already at the latest version
Preprints on COVID-19 and SARS-CoV-2
Abstract
Chronic diseases affect a disproportionate number of United States (U.S.) Veterans, causing significant long-term health issues and affecting entitlement spending. This longitudinal study examined the health status of U.S. Veterans as compared to non-Veterans pre- and post-COVID utilizing the annual Center for Disease Control and Prevention (CDC) Behavioral Risk Factor Surveillance System (BRFSS) survey data. Age-adjusted descriptive point estimates were generated independently for 2003 through 2021, while complex weighted panel data were generated from 2011 and onward. General linear modeling revealed that the average U.S. Veteran reports a higher prevalence of disease conditions except for mental health disorders when compared to the non-Veteran. These findings were consistent with both pre- and post-COVID, however, both groups reported a higher prevalence of mental health issues during the pandemic years. The findings suggest that there have been no improvements in reducing Veteran comorbidities to non-Veteran levels and that COVID adversely affected the mental health of both populations.
Keywords:
U.S. Veteran health
; Comorbidities
; Risk-factors
; Military readiness
; COVID
1. Introduction
United States (U.S.) Veterans have worse health outcomes than non-Veterans, even after adjusting for age and other factors [1]. Previous studies have identified that obesity, diabetes, heart disease, stroke, skin cancer, other cancer, and chronic obstructive pulmonary disease (COPD) are statistically worse for Veterans than non-Veterans, even after age adjustment [1]. A 2017 study found that arthritis was more prevalent in the Veteran community [2]. Additionally, Chronic Kidney Disease (CKD) is a serious condition associated with kidney failure, cardiovascular disease, and increased probability of mortality. Veterans have a higher prevalence of CKD, approximately one in six Veterans have CKD as compared to one in seven Americans with CKD [3]. CKD risk factors include diabetes, high blood pressure, age over 60 years, obesity, heart disease, and race (i.e. African American, Hispanic, Native American, or Asian) [3]. Similarly, a retrospective study of 2006-2015 U.S. Military System data revealed higher rates of CKD for older Veterans, Black race, and senior enlisted rank [4].
Mental health issues are also prevalent among Veterans. Approximately 43% of Veterans in a large study experienced mental health issues including post-traumatic stress disorder (PTSD), depressive disorders, or substance abuse [5]. Depression is a serious diagnosis that has been associated with higher risks of mortality and morbidity [6]. Prior research on data from the 2005-2016 National Health and Nutrition Examination Surveys (NHANES) determined that the pooled prevalence of depression in Veterans was higher in comparison to the prevalence of depression for non-Veteran adults with at least one major depressive disorder reported in the National Survey on Drug Use and Health [6]. Disparities in the prevalence of depression were identified in the NHANES study; females, White Veterans, and Veterans with low-income levels or lower education levels had higher rates of depression [6]. In general, Veterans have 1.5 times higher suicide rates than the general U.S. population [7]. Additionally, Veterans with mental health issues are especially at risk for suicide when compared to non-Veterans [6,8].
The chronic diseases and mental health conditions discussed in this paper not only affect a disproportionate number of Veterans but are also known to cause significant long-term health issues and negatively impact the U.S. economy. According to the Centers for Disease Control and Prevention (CDC), expenses for individuals with chronic diseases and mental health conditions accounted for 90% of the annual U.S. healthcare expenses [9]. In particular, heart disease and stroke cost the healthcare system $216 billion per year and account for the majority (33%) of annual disease-specific mortalities [9].
COVID-19 Impacts on Health
The impact of the COVID-19 global pandemic on the health and well-being of Veteran and non-Veteran populations in the U.S. is still being studied. This phenomenon disrupted healthcare, and access to services, caused social isolation, and created many other disturbances that impacted the health of different populations. These issues disproportionately impacted those who are of racial/ethnic minorities, have lower socioeconomic status, have less education, and are veterans [10]. Some of the newest research on Veterans has shown that COVID-19 inflicts post-traumatic stress disorder (PTSD) among some Veterans [11]. Consequently, some Veterans resort to using alcohol and cannabis according to a six-month follow-up survey during and after the COVID-19 pandemic [12]. Linjawi et al. (2023) pointed out that the pandemic adversely affected cancer patients because of the shortage of medical supplies, beds, and healthcare workers in hospitals [13].
As every illness does perhaps weaken the immunity to a disease, COVID-19 was no exception. The co-morbidities associated with COVID-19 are recognized in the research literature. Notable co-morbidities of COVID-19 include inflammatory lung or other organ injury [10,14,15]. The challenges faced by health scientists include separating the influence of co-morbidities on COVID-19 or vice versa. Khunti et al. (2023) illustrated that people with diabetes, in particular, experienced a disproportionately increased risk of hospitalization and mortality due to COVID-19 [16].
To be specific, Resendes et al. (2023) explained the frailty of COVID-19, which is an age-related syndrome for hospitalization [17]. Weaver et al. (2022) reported that one out of every six Veterans who were diagnosed with COVID-19 was re-admitted to the hospital within 90 days [18]. The longer the hospital stays, the greater the likelihood of re-admission especially when the Veteran had multiple co-morbidities, smoked, or lived in an urban area. The Tsampasian et al. (2023) systematic review and meta-analysis demonstrated that age, gender, and some comorbidities were associated with severe COVID-19 [19]. McGuire et al. (2023) found that Veterans’ social isolation since COVID-19 became significant and resulted in worse mental health outcomes [20]. Gujral et al. (2023) pursued the impact of COVID-19 on Veterans’ suicide risk within the healthcare system [21]. Akhtar et al. (2023) summarized that COVID-19 increased the risk for cardiovascular illness [22].
This research extends a previous study [1], which provided descriptive age-adjusted point estimates of the health status of U.S. Veterans versus non-Veterans for the years 2003-2019. This study adds on the data for 2020 and 2021 to highlight any population differences that may have occurred as a result of the global pandemic. As in the previous study, specific dependent variables of interest included the reported prevalence of obesity, heart disease, stroke, skin cancer, other cancers, COPD, arthritis, mental health, kidney disease, and diabetes. The CDC advises against combining data before 2011 due to changes in its Behavioral Risk Factor Surveillance System (BRFSS) survey [23], so the inferential analysis was restricted to the combined surveys from 2011 through 2021. It was hypothesized that prevalence rates for Veterans would be different from non-Veterans based on previous work [1], and we further hypothesized that some changes in prevalence would be seen pre and post-COVID-19 for Veterans and non-Veterans.
2. Materials and Methods
BRFSS data sets from 2003 through 2021 provided by the CDC were analyzed. BRFSS is an annual state-based and territory-based health survey that canvases adults over the age of 18 in the United States, three US territories (Puerto Rico, US Virgin Islands, and Guam), and the District of Columbia [24]. The survey relies on household and cellular telephone surveys of non-institutionalized adults. Approximately 400,000 surveys per year are conducted, and the survey is publicly available through the CDC [23,25,26]. These data sets provide information about chronic diseases in the U.S. and use complex sampling methods requiring equally complex weighting schemes [23,25,26].
Data from 2003 through 2021 (the latest available year) was used to evaluate comparatively U.S. Veteran versus non-Veteran disease prevalence. Of specific interest was the prevalence of obesity, heart disease, stroke, skin cancer, other cancer, COPD, arthritis, mental health, kidney disease, and diabetes. Further, we investigated whether there were prevalence changes for either or both groups pre and post-COVID periods defined as before 2020 versus 2020 through 2021, the latest year of available data. Quasibinomial general linear models (GLM) investigated the effects of demographics, socioeconomic factors geographic region, year, Veteran status, COVID-19 period, and the interaction between COVID-19 and Veteran status.
Using the BRFSS sampling weights, age-adjusted disease prevalence was estimated for each year individually from 2003 through 2021 to provide descriptive insight. The years 2011 through 2021 were then estimated together as a panel series. Previous years (2003 through 2010) were not used in the panel series due to BRFSS sampling changes [23]. The 2003 through 2010 data are not directly comparable to more recent data (e.g., 2011 through 2021) because of changes in the weighting methodology and the addition of cell phone sampling. The pre-2011 surveys do provide the best available point estimates for those years and are thus used for descriptive analysis (uncombined).
2.1. Sample
Table 1 provides the unweighted sample and the weighted population estimates for Veterans and non-Veterans from 2011 through 2021. The unweighted data are the BRFSS data that were collected with the phone surveys. When BRFSS surveys are conducted, some areas may not have good survey coverage, may have a low response rate, or may exhibit variations in response rates. BRFSS data-weighting adjusts for these conditions by making the total number of cases (i.e., survey responses) equal to the population estimates for each geographic region (state, territory, or district), which in turn provides a more accurate representation of the population [24,26].
The total Veteran population estimate for all study years was 465,008,694 and the total non-Veteran population estimate was 3,610,450,803. For all study years, an average of 11.41% of the population respondents identified as Veterans. The average percentage of Veterans represented in each annual estimated population survey declined across the years from 13.62% in 2003 to 9.73% in 2021.
2.2. Study Variables
Table 2 displays dependent variables, independent variables, and demographic, socioeconomic, and graphic controls in the study. It also shows the coding and description for each variable.
2.2.1. Dependent Variables
For the dependent variables aside from ‘mental health’, respondents were provided the opportunity to respond ‘yes’, ‘no’, and ‘do not know/not sure’, and some observations were missing or not asked. The proportion missing for each of the dependent variables except for ‘overweight/obese’ status was less than 1%. Approximately 10% of overweight/obese responses were missing. In all cases, the statistical mode was imputed for these variables. For the ‘mental health’ variable, respondents were asked to self-report the number of days in the last 30 days that their mental health, which includes stress, depression, and problems with emotion, was not good. We recoded the mental health variable to be dichotomous with ‘1’ indicating that a respondent reported any number of days that their mental health was not good and ‘0’ otherwise.
2.2.2. Independent Variables
The first independent variable, Veteran status, was coded identically for all years except for 2009. Collapsing this variable to ‘yes’ and ‘other than yes’ provided the consistency needed for analysis. There were less than 1% of these responses that were blank whereas the blank responses were imputed with the modal response of non-Veteran.
The second independent variable, COVID-19, was a linear spline variable. For years prior to 2019, the value of the spline was zero. For 2020 and 2021, the values were 1 and 2 respectively. The use of splines allows for a separate slope once an event has occurred. For example, assume that the result of a GLM is Y = 10 + 5 × COVID. Before 2020, the estimate for this model would be 10. For 2020, and 2021, the estimates would be 15 and 20 respectively (a linear change). Thus, the spline allows for a secondary slope associated with COVID.
Finally, an interaction term between COVID and Veteran status was included. This interaction term helps differentiate effects based on Veteran versus non-Veteran status pre and post COVID-19.
2.2.3. Control Variables
Demographic Variables
Demographic control variables included categorical age and race variables as well as gender (1=male, 0=otherwise) and marital status (collapsed to 1=married, 0=otherwise). Race was recoded to two variables, race (1=Caucasian, 0=Otherwise) and ethnicity (1=Hispanic, 0=Otherwise). Age was already an imputed variable with coded categories: 1=18–24, 2=25–34, 3=35–44, 4=45–54, 5= 55–64,6= 65+.
Socioeconomic Variables
Socioeconomic controls included income, education, and employment. All three were evaluated as dichotomous variables. Income was coded as 1=$75,000 or more, 0=otherwise. For education, the coding was 1=college graduate, 0=otherwise. Employment was recategorized as 1=employed for wages (modal response), 0=otherwise.
Geographic Variable
One geographic control variable, ‘Census Division’ was created for this study by collapsing states into divisions. Specifically, we collapsed the BRFSS ‘State’ variable, based on Federal Information Procession codes, into Census Bureau divisions as follows: 1 = New England, 2 = East North Central, 3 = East South Central, 4 = Middle Atlantic, 5 = Mountain, 6 = Pacific, 7 = South Atlantic, 8 = West North Central, 9 = West South Central, 10 = Territories.
Time Variable
A variable (Year) provided a temporal measure for analyzing changes over time. We postulated that linear effects might exist for the period analyzed (2011-2021).
2.3. Model and Methods
2.3.1. Descriptive Models
For each dependent variable and each year, we built age-adjusted models percentages reported by health condition by year and by Veteran status, to evaluate differences between Veteran and non-Veteran reported health issues.
2.3.2. General Linear Models
Our study team also built a quasi-binomial general linear model using the 2011-2021 data. The quasibinomial allows for non-integer binomial responses and adds a separate measure for dispersion not totally measured by the binomial [27]. All analyses were conducted in R Statistical software using epitools for age-adjustments and the survey package for applying complex weighting [28,29]. For the unweighted data, logistic regression would have been appropriate. However, when the survey package weights are applied to the BRFSS data for population estimation, the dichotomous dependent variables could have fractional values. Thus, general linear models with a quasi-binomial link function from the R survey package were used for the weighted survey analysis because they allow fractional values of integers.
3. Results
3.1. Descriptive Statistics
Table 3 presents the age-adjusted comparisons of all the dependent variables for Veterans and non-Veterans by year and rolled up for years 2011 through 2021. The years 2003-2010 are displayed, but as mentioned they cannot be combined due to changes in the BRFSS data-weighting and data collection by the CDC. At the far right of Table 3, referencing the combined years in the Y11-21 column, we see that for this period Veterans had higher rates of self-reported obesity (71% vs 60%), diabetes (19% vs 16%), heart disease (12% vs 7%), stroke (6% vs. 5%), skin cancer (17% vs 12%), other cancers (13% vs 12%), COPD (10% vs 9%), and kidney disease (5% vs 4%).
Both groups have the same age-adjusted percentages for arthritis (37%) for the combined years in the Y11-2, but the mental health (depression) rates were lower for Veterans (31% vs. 38%). Indeed, the mental depression rates were lower for Veterans for each year in this analysis. A review of the age-adjusted table values indicates that the trends for the variables across the years 2003 to 2021 show little variance.
Of interest is that mental health issues (depression) for both groups slowly increased between 2019 and 2021, the years of COVID-19. (COVID-19 began in November 2019, meaning that two survey months were included in the BRFSS responses for that year). Before 2019, the percentage of Veterans and non-Veterans reporting mental health issues was 30.06% and 36.50%, respectively. From 2019 onward, the percentages increased to 34.25% and 40.75%, respectively.
3.2. General Linear Model, 2011 through 2021
Table 4 displays the quasibinomial General Linear Models (GLM) for each of the dependent variables with indicator variables for the years 2011-2021. For the GLM, the dependent variables were the disease processes and mental health status, there was one GLM generated for each of these co-morbidities. GLM results show the odds ratios for the control variables (demographic, socioeconomic, and geographic), Veteran status, and year the data were collected. The control variables increase the internal validity by limiting the effect of extraneous variables associated with the co-morbidities and with geographic location (e.g. culture).
3.2.1. Veteran Status
Odds ratios (OR) greater than 1.0 may indicate the disease/event/illness is more likely to occur for any respondents in that category, and OR less than 1.0 may indicate it is less likely to occur, depending on statistical significance. Examining the variable ‘Veteran’ in Table 4, we see that Veterans have higher odds of having every health condition in the table when compared to non-Veterans except for mental health disorders which are not significantly different from that of non-Veterans. Specifically, the odds ratio for mental health is 0.992 These results agree with the age-adjusted percentages by health condition by year (Table 3) which indicate the self-reported percentages for depression were lower for Veterans when compared to non-Veterans.
3.2.2. COVID Spline
Further, the pre-post COVID-19 splines suggested mixed effects across the dependent variables. Specifically, obesity/overweight and mental health issues had statistically significant OR that were greater than 1.0 (1.008 and 1.069, respectively). Stroke, skin cancer, cancer, COPD, arthritis, kidney disease, and diabetes had statistically significant OR less than 1.0. The spline was not significant for heart disease.
3.2.3. Interaction between Veteran Status and pre/during COVID-19
When considering the interaction between the COVID-19 spline and Veterans, Veterans were less likely than non-Veterans to report obesity/overweight during COVID-19. Veterans were, however, more likely during COVID-19 to report skin cancer, cancer, COPD, arthritis, and kidney disease.
3.2.4. Control Variables
Table 4 also displays results for the socioeconomic, demographic, geographic, and temporal control variables. Results indicate that the odds of obesity, heart disease, stroke, skin cancer, other cancers, COPD, arthritis, kidney disease, or diabetes, generally increase with age (see Figure 1). Conversely, the risk of mental health disorders declines. Caucasians had higher risks of having heart disease, skin cancer, other cancers, COPD, and arthritis and lower risks of all other diseases. Hispanics had higher odds for overweight/obesity, skin cancer, and diabetes. Males were more likely to report overweight/obese status, heart disease, stroke, skin cancer, and diabetes. Married individuals were more likely to report being overweight/obese and report skin cancer.
Those with income greater than $75,000 were more likely to report being obese/overweight status and having skin cancer. College graduates were more likely to report skin cancer or other cancers. Wage employees were more likely to report being obese/overweight.
Large regional variations existed for each dependent variable (Region 1=referent group). Region 2 had the highest odds for overweight/obesity, stroke, cancer, COPD, arthritis, kidney disease (tied with Region 10), and diabetes. Region 8 had the highest odds of heart disease, while Region 7 had the highest odds of skin cancer. For mental health issues, Region 6 had the highest odds ratio.
Odds ratios for all years were greater than 1.0 for stroke, skin cancer, cancer, COPD, mental health disorders, kidney disease, and diabetes for the Veterans. For obesity/overweight status and arthritis, odds ratios were lower than 1.0 for the Veterans.
4. Discussion
This longitudinal study aimed to update the health status of U.S. Veterans from 2003 to 2021 when compared to non-Veterans and include data from years of the COVID-19 pandemic. The results show overall Veterans have higher odds of all investigated morbidities other than mental health disease. Conversely, odds of diseases during COVID-19 were lower for all morbidities with the exception of mental health. The reason for these lower odds is unknown but may be attributable to delayed health care and discovery of these morbidities. Mental health issues associated with COVID-19 are well known, and the higher odds ratio is expected. These results agree with previous studies that found Veterans have a lower health status than non-Veterans [1-6].
The interaction between Veteran status and the COVI1D-19 spline produced some interesting results. Obesity/overweight, skin cancer, COPD, arthritis, and kidney disease odds ratios, while still higher for Veterans overall changed at a lower rate than that of non-Veterans. Prior to COVID-19, Veterans had 1.261 to 1.000 odds of reporting obesity/overweight status. During 2020, those odds reduced to 1.251 to 1.000 after accounting for the interaction effect. Similarly Veteran to non-Veteran odds ratios prior to COVID-19 for skin cancer, COPD, arthritis, and kidney disease were 1.311, 1.352, 1.259, and 1.135, respectively. These odds changed to 1.309, 1.409, 1.316, and 1.142 in 2020. No other significant interactions were detected.
The results also illustrate that odds of the reporting investigated diseases generally increase with age (until age 65+ where obesity/overweight status and COPD decline) with the exception of mental health odds. These odds decrease nearly linearly (from 0.884 to 0.261) by age group. Caucasians report higher odds versus other groups of all investigated morbidities other than obesity/overweight status, stroke, kidney disease, and diabetes. Hispanics reported lower odds of heart disease, stroke, cancer, COPD, arthritis, and mental health disorders. Males reported higher odds ratios for cancer, arthritis, mental health disorders, and kidney disease. Those reported being married were associated with lower odds in every category with the exception of obesity/overweight status and skin cancer.
With the exception of overweight/obesity status, those making more than $75,000 per annum had lower odds of morbidities. The same finding held for those who were wage employees versus self-employed, unemployed, or other status. With the exception of cancer, college graduates also had lower odds of morbidities.
Geographic effects were mixed. Region 2 had higher odds of all morbidities other than mental health disorders versus Region 1. Region 3 had universally lower odds than Region 1. Temporal effects were also mixed, and the effect sizes were small (odds ratios between 0.983 and 1.026).
This study has one major limitation that requires explication. BRFSS data are self-reported, thus they may not be as accurate as measured data (i.e. clinical observations). Moreover, respondents may exhibit bias by over or under-reporting on self-rating questions. Some respondents may not feel comfortable reporting their true depression levels because of social or job related concerns.
Limitations
One limitation of this study is that BRFSS data are self-reported thus it is not as accurate as measured data (i.e. clinical observations). Moreover, respondents may exhibit bias by over or under-reporting on self-rating questions. Some respondents may not feel comfortable reporting their true depression levels because of social or job-related concerns. In the absence of the true values, whether the under or over-reporting by the respondents is not quite confirmed.
5. Conclusions
Overall, Veterans continue to experience disproportionely higher odds of obesity/overweight status, heart disease, stroke, skin cancer, cancer, COPD, arthritis, kidney disease, and diabetes. Veterans do, however, report lower rates of mental health disorders. COVID-19 did not materially affect the higher odds that Veterans experienced for all morbidities except for mental health. These findings continue to suggest that there still exists a lack of effective interventions for the Veteran population from public agencies such as the U.S. Veteran’s Administration (VA), and private organizations serving Veterans (e.g. Veterans of Foreign Wars, American Legion).
Author Contributions
Conceptualization: Jose Betancourt and Lawrence Fulton; Methodology, Lawrence Fulton and Ram Shanmugam; Validation, Diane Dolezel, and Gerardo J. Pacheco; Formal analysis, Lawrence Fulton and Diane Dolezel; Investigation, Paula Stigler Granados and Ram Shanmugam; Resources, Lawrence Fulton; Data curation, Lawrence Fulton; Writing—original draft preparation, Diane Dolezel, and Gerardo J. Pacheco; Writing—review and editing, Paula Stigler Granados and Gerardo J. Pacheco; Project administration, Jose Betancourt. All authors have read and agreed to the published version of the manuscript.
Conflicts of Interest
All authors declare they have no conflicts of interest.
References
- Betancourt:, J.A. : Granados, P.S.; Pacheco, G.J.; Reagan, J.; Shanmugam, R.; Topinka, J.B.; Beauvais, B.M.; Ramamonjiarivelo, Z.H.; Fulton, L.V. Exploring Health Outcomes for U.S. Veterans Compared to Non-Veterans from 2003 to 2019. Healthcare 2021, 9, 604. [Google Scholar] [CrossRef] [PubMed]
- Rivera, J.C.; Amuan, M.E.; Morris, R.M.; Johnson, A.E.; Pugh, M.J. Arthritis, comorbidities, and care utilization in veterans of operations enduring and Iraqi Freedom. Journal of orthopaedic research : official publication of the Orthopaedic Research Society 2017, 35, 682–687. [Google Scholar] [CrossRef] [PubMed]
- American Kidney Fund. Veterans and kidney disease Available online: https://www.kidneyfund.org/get-assistance/veterans-and-kidney-disease (accessed on.
- James D. Oliver, III; Robert, N.; Lindsay, R.G.; Amanda, B.; Meda, E.P.; Nilka Ríos, B.; Tracey Pérez, K.; Eric, S.M. Prevalence and Characteristics of CKD in the US Military Health System: A Retrospective Cohort StudyPlain-Language Summary. Kidney Medicine 2022, 4. [Google Scholar] [CrossRef]
- McKinnon, C.R.G., J. T. Weight reduction goal achievement among veterans with mental health diagnoses. J. Am. Psychiatr. Nurs. Assoc. 2019, 25, 257–265. [Google Scholar] [CrossRef] [PubMed]
- Liu, Y.; Collins, C.; Wang, K.; Xie, X.; Bie, R. The prevalence and trend of depression among veterans in the United States. Journal of Affective Disorders 2019, 245, 724–727. [Google Scholar] [CrossRef] [PubMed]
- Ruiz, F.; Burgo-Black, L.; Hunt, S.C.; Miller, M.; Spelman, J.F. A Practical Review of Suicide Among Veterans: Preventive and Proactive Measures for Health Care Institutions and Providers. Public Health Reports 2023, 138, 223–231. [Google Scholar] [CrossRef] [PubMed]
- Sokol, Y.; Gromatsky, M.; Edwards, E.R.; Greene, A.L.; Geraci, J.C.; Harris, R.E.; Goodman, M. The deadly gap: Understanding suicide among veterans transitioning out of the military. Psychiatry Research 2021, 300. [Google Scholar] [CrossRef] [PubMed]
- National Center for Chronic Disease Prevention and Health Promotion. Health and Economic Costs of Chronic Diseases. Available online: https://www.cdc.gov/chronicdisease/about/costs/index.htm (accessed on.
- Seligman, B. , Ferranna, M., Bloom, D. E.. Social determinants of mortality from COVID-19: A simulation study using NHANES. PLoS medicine 2021, 18. [Google Scholar]
- Marquardt, C.A.; Chu, C.; Hill, J.E.; Venables, N.C.; Kuzenski, L.; Davenport, N.D.; Disner, S.G.; Finn, J.A.; Gilmore, C.S.; Erbes, C.R.; et al. Evaluating resilience in response to COVID-19 pandemic stressors among veteran mental health outpatients. Journal of Psychopathology and Clinical Science 2023, 132, 26–37. [Google Scholar] [CrossRef]
- Pedersen, E.R.; Davis, J.P.; Fitzke, R.E.; Lee, D.S.; Saba, S. American Veterans in the Era of COVID-19: Reactions to the Pandemic, Posttraumatic Stress Disorder, and Substance Use Behaviors. Int J Ment Health Addict 2023, 21, 767–782. [Google Scholar] [CrossRef]
- Linjawi, M.; Shakoor, H.; Hilary, S.; Ali, H.I.; Al-Dhaheri, A.S.; Ismail, L.C.; Apostolopoulos, V.; Stojanovska, L. Cancer Patients during COVID-19 Pandemic: A Mini-Review. Healthcare (Basel) 2023, 11. [Google Scholar] [CrossRef]
- Feyman, Y.; Auty, S.G.; Tenso, K.; Strombotne, K.L.; Legler, A.; Griffith, K.N. County-level impact of the COVID-19 Pandemic on excess mortality among U.S. veterans: A population-based study. The Lancet Regional Health - Americas 2022, 5. [Google Scholar] [CrossRef]
- Rentsch, C.T. , Kidwai-Khan, F., Tate, J. P., Park, L. S., King Jr, J. T., Skanderson, M.,... & Justice, A. C. Patterns of COVID-19 testing and mortality by race and ethnicity among United States veterans: A nationwide cohort study. PLoS medicine 2020, 17. [Google Scholar]
- Khunti, K.; Valabhji, J.; Misra, S. Diabetes and the COVID-19 pandemic. Diabetologia 2023, 66, 255–266. [Google Scholar] [CrossRef] [PubMed]
- Resendes, N.M. , Chada, A., Torres-Morales, A., Fernandez, M., Diaz-Quiñones, A., Gomez, C.,... & Ruiz, J. G. Association between a Frailty Index from Common Laboratory Values and Vital Signs (FI-LAB) and Hospital and Post-Hospital Outcomes in Veterans with COVID-19 Infection. Journal of nutrition, health & aging 2023, 27. [Google Scholar]
- Weaver, F.M. Hospital Readmissions Among Veterans Within 90 Days of Discharge Following Initial Hospitalization for COVID-19. PREVENTING CHRONIC DISEASE PUBLIC HEALTH RESEARCH, PRACTICE, AND POLICY 2022, 19. [Google Scholar] [CrossRef] [PubMed]
- Tsampasian, V.; Elghazaly, H.; Chattopadhyay, R.; Debski, M.; Naing, T.K.P.; Garg, P.; Clark, A.; Ntatsaki, E.; Vassiliou, V.S. Risk Factors Associated With Post-COVID-19 Condition A Systematic Review and Meta-analysis. JAMA INTERNAL MEDICINE 2023. [Google Scholar] [CrossRef]
- McGuire, A.P.; Elmore, C.; Szabo, Y.Z.; Kurz, A.S.; Mendoza, C.; Umucu, E.; Creech, S.K. Exploring the trajectory and correlates of social isolation for veterans across a 6-month period during COVID-19. PLoS ONE 2023, 17, 1–14. [Google Scholar] [CrossRef]
- Gujral, K.; Bahraini, N.; Brenner, L.A.; Van Campen, J.; Zulman, D.M.; Illarmo, S.; Wagner, T.H. VA's implementation of universal screening and evaluation for the suicide risk identification program in November 2020 –Implications for Veterans with prior mental health needs. PLoS ONE 2023, 17, 1–16. [Google Scholar] [CrossRef]
- Akhtar, Z.; Trent, M.; Moa, A.; Tan, T.C.; Froebert, O.; MacIntyre, C.R. The impact of COVID-19 and COVID vaccination on cardiovascular outcomes. EUROPEAN HEART JOURNAL SUPPLEMENTS 2023, 25, A42–A49. [Google Scholar] [CrossRef] [PubMed]
- US Centers for Disease Control and Prevention. Behavioral Health Risk Factor Surveillance System (BRFSS) 2011 Survey Data and Documentation. Available online: https://www.cdc.gov/brfss/annual_data/annual_2011.htm (accessed on 04/23/2023).
- U.S. Centers for Disease Control and Prevention. Behavioral Risk Factor Surveillance System. Available online: https//www.cdc.gov/brfss/annual_data/annual_data.htm (accessed on.
- US Centers for Disease Control and Prevention. Behavioral Risk Factor Surveillance System (BRFSS) Historical Questions. Available online: https://healthdata.gov/dataset/behavioral-risk-factor-surveillance-system-brfss-historical-questions#:~{}:text=BRFSS%20Survey%20Data.,cdc.gov%2Fbrfss (accessed on 04/23/2023).
- U.S. Centers for Disease Control and Prevention. Survey Data & Documentation. Available online: https://www.cdc.gov/brfss/data_documentation/index.htm (accessed on.
- Fulton, L.V.; Adepoju, O.E.; Dolezel, D.; Ekin, T.; Gibbs, D.; Hewitt, B.; McLeod, A.; Liaw, W.; Lieneck, C.; Ramamonjiarivelo, Z.; et al. Determinants of Diabetes Disease Management, 2011-2019. HEALTHCARE 2021, 9, 944. [Google Scholar] [CrossRef] [PubMed]
- Aragon, T.J. epitools: Epidemiology Tools, R package version 0.5-10.1; 2020.
- R Core Team R: A Language and Environment for Statistical Computing, R Foundation for Statistical Computing: Vienna, Austria,: 2018.
Figure 1.
Odds Ratios by Disease by Age Group (excludes Mental Health).
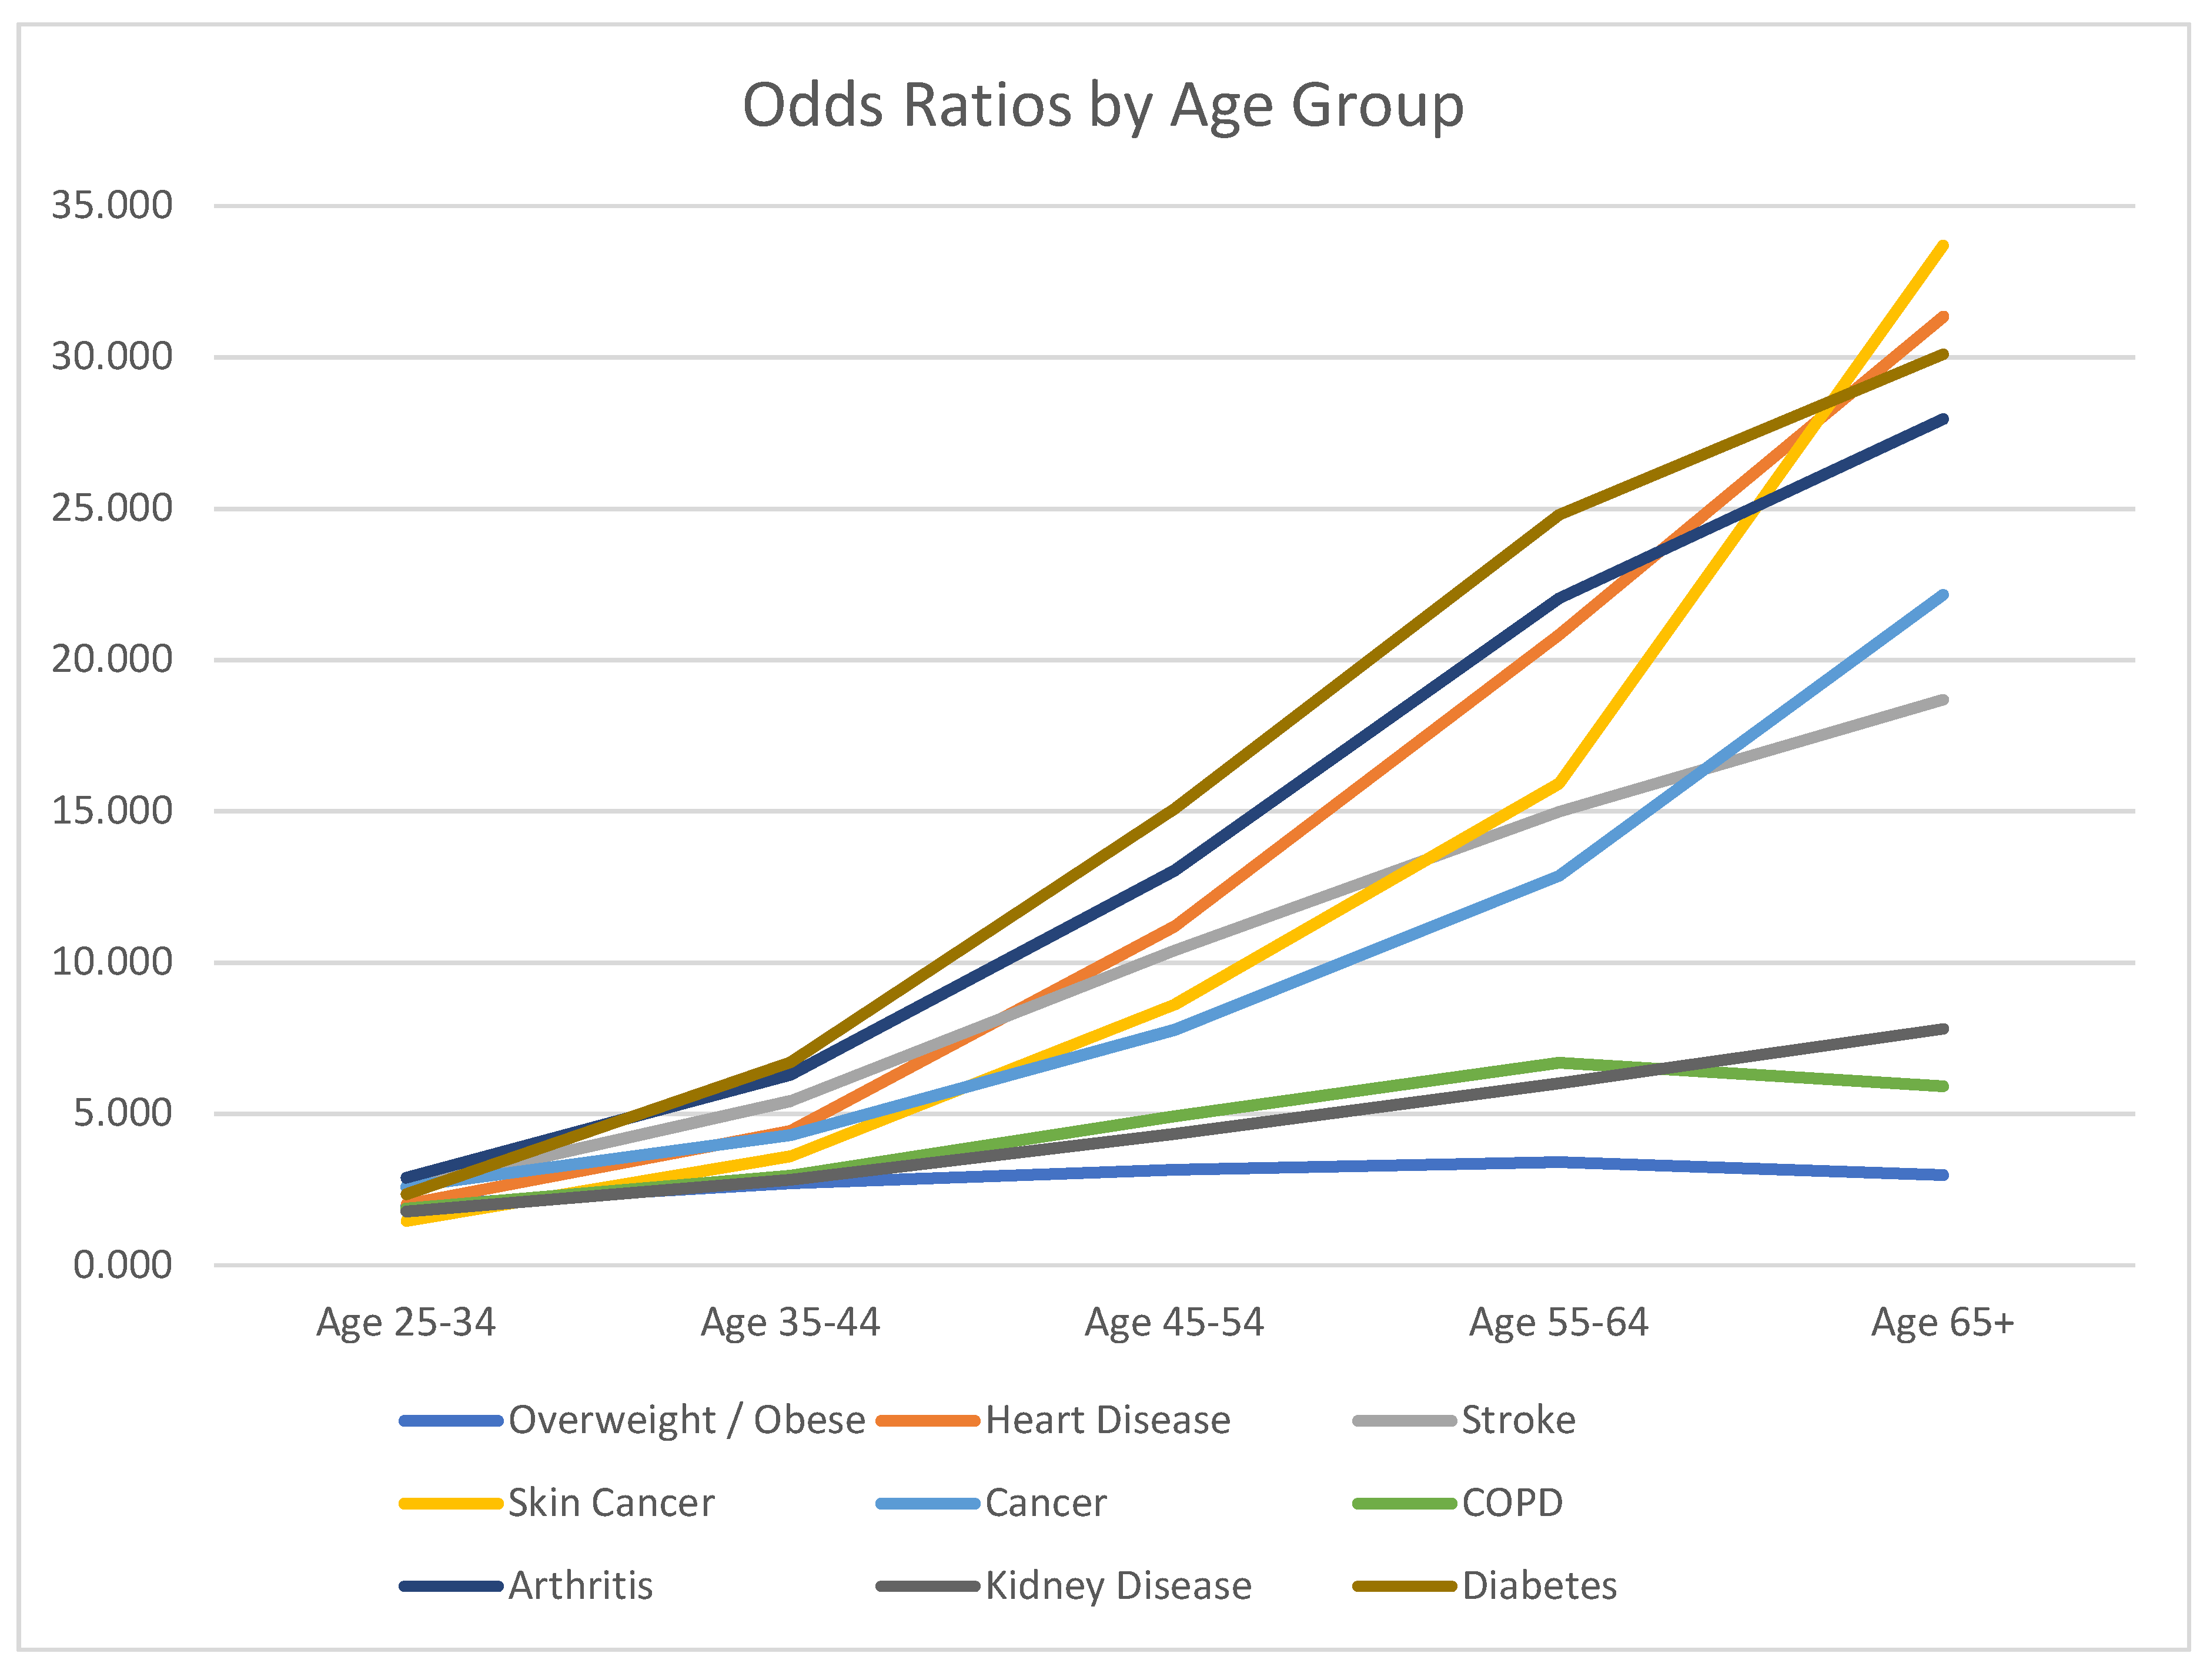

Table 1.
Sample and population estimates by Veteran status 2003-2021.
| Year | Non-Vet Population (weighted) | Vet Population (weighted) | %Veteran | Non-Vet Sample (unweighted) | Vet Sample (unweighted) | %Veteran |
|---|---|---|---|---|---|---|
| 2003 | 190,348,049 | 30,003,072 | 13.62% | 228,159 | 36,525 | 13.80% |
| 2004 | 191,637,278 | 29,746,086 | 13.44% | 260,982 | 42,840 | 14.10% |
| 2005 | 194,578,583 | 29,532,523 | 13.18% | 305,107 | 51,005 | 14.32% |
| 2006 | 198,138,945 | 29,118,914 | 12.81% | 304,989 | 50,721 | 14.26% |
| 2007 | 202,498,717 | 27,673,461 | 12.02% | 370,990 | 59,922 | 13.91% |
| 2008 | 205,615,985 | 27,244,684 | 11.70% | 358,433 | 56,076 | 13.53% |
| 2009 | 208,756,506 | 26,249,349 | 11.17% | 374,909 | 57,698 | 13.34% |
| 2010 | 211,037,577 | 26,048,662 | 10.99% | 390,643 | 60,432 | 13.40% |
| 2011 | 212,198,501 | 25,812,791 | 10.85% | 441,873 | 64,594 | 12.75% |
| 2012 | 216,959,427 | 26,098,283 | 10.74% | 415,817 | 59,870 | 12.59% |
| 2013 | 219,968,409 | 26,056,006 | 10.59% | 430,268 | 61,505 | 12.51% |
| 2014 | 220,704,167 | 27,778,365 | 11.18% | 402,544 | 62,120 | 13.37% |
| 2015 | 224,174,518 | 27,172,620 | 10.81% | 383,614 | 57,842 | 13.10% |
| 2016 | 227,144,466 | 27,006,670 | 10.63% | 422,384 | 63,919 | 13.14% |
| 2017 | 229,254,924 | 26,398,281 | 10.33% | 392,148 | 57,868 | 12.86% |
| 2018 | 230,694,063 | 27,379,324 | 10.61% | 381,382 | 56,054 | 12.81% |
| 2019 | 226,740,688 | 25,689,603 | 10.18% | 365,038 | 53,230 | 12.73% |
| 2020 | 234,258,521 | 26,149,949 | 10.04% | 353,737 | 48,221 | 12.00% |
| 2021 | 222,097,968 | 23,943,672 | 9.73% | 386,175 | 52,518 | 11.97% |
| Totals | 3,610,450,803 | 465,008,694 | 11.41% | 6,229,280 | 952,221 | 13.26% |
Table 2.
Variables in the Study.
| Variable | Description |
|---|---|
| Dependent Variables | |
| Overweight/Obese | Body mass index greater than 25.00? 1=Yes, 0=Otherwise |
| Angina or coronary heart disease | Had angina or coronary heart disease? 1=Yes, 0=Otherwise |
| Stroke | Had a stroke? 1=Yes, 0=Otherwise |
| Skin cancer | Had skin cancer? 1=Yes, 0=Otherwise |
| Other cancer | Had any other types of cancer? 1=Yes, 0=Otherwise |
| COPD | Had C.O.P.D., emphysema or chronic bronchitis? 1=Yes, 0=Otherwise |
| Arthritis | Arthritis, rheumatoid arthritis, gout, lupus, or fibromyalgia? 1=Yes, 0=Otherwise |
| Mental Health1 | 1= One or more days out of 30 of poor mental health, 0=Otherwise |
| Kidney Disease2 | Had kidney disease? 1=Yes, 0=Otherwise |
| Diabetes | Had diabetes? 1=Yes, 0=Otherwise |
| Demographic Controls | |
| Age | Imputed age category: 1=18–24, 2=25–34, 3=35–44, 4=45–54,5= 55–64,6= 65+ |
| Race | 1=Caucasian, 0=Otherwise |
| Ethnicity | 1=Hispanic, 0=Otherwise |
| Gender | 1=Birth Sex Male, 0=Birth Sex Female |
| Marital Status | 1=Married, 0=Otherwise |
| Socioeconomic Controls | |
| Income | Total household income: 1=$75 K+, 0=Otherwise |
| Education | 1=Graduated college or technical school, 0=Otherwise |
| Employment | 1=Employed for wages, 0=Otherwise |
| Geographic Controls | |
| Division | 1 = New England, 2 = East North Central, 3 = East South Central, 4 = Middle Atlantic, 5 = Mountain, 6 = Pacific, 7 = South Atlantic, 8 = West North Central, 9 = West South Central, 10 = Territories |
| Time | Year, 2011-2021 |
| Independent Variables | |
| Veteran Status | 1=Active, Reserve, or National Guard in United States Armed Forces, 0=Otherwise |
| COVID-19 Period | 0=Prior to 2020, 1=2020, 2=2021 |
| 1 Includes depression, stress, emotions | |
| 2 Not including kidney stones, bladder infection, or incontinence | |
Table 3.
Age-adjusted percentages reported by health condition by year by Veteran status.
| Y2003 | Y2004 | Y2005 | Y2006 | Y2007 | Y2008 | Y2009 | Y2010 | Y2011 | Y2012 | Y2013 | Y2014 | Y2015 | Y2016 | Y2017 | Y2018 | Y2019 | Y2020 | Y2021 | Y11-21 | |
| Overweight/Obese Non-Vet | 0.56 | 0.57 | 0.58 | 0.58 | 0.59 | 0.60 | 0.60 | 0.61 | 0.60 | 0.60 | 0.60 | 0.59 | 0.59 | 0.59 | 0.59 | 0.60 | 0.60 | 0.59 | 0.59 | 0.60 |
| Overweight/Obese Vet | 0.70 | 0.70 | 0.70 | 0.71 | 0.72 | 0.73 | 0.73 | 0.73 | 0.73 | 0.72 | 0.72 | 0.72 | 0.71 | 0.71 | 0.71 | 0.72 | 0.71 | 0.70 | 0.71 | 0.71 |
| Diabetes Non-Vet | 0.11 | 0.12 | 0.13 | 0.13 | 0.14 | 0.14 | 0.14 | 0.14 | 0.15 | 0.15 | 0.16 | 0.16 | 0.16 | 0.17 | 0.17 | 0.17 | 0.17 | 0.17 | 0.17 | 0.16 |
| Diabetes Vet | 0.13 | 0.13 | 0.14 | 0.15 | 0.16 | 0.15 | 0.16 | 0.16 | 0.18 | 0.18 | 0.18 | 0.18 | 0.19 | 0.19 | 0.19 | 0.20 | 0.19 | 0.20 | 0.19 | 0.19 |
| Heart Disease Non-Vet | 0.08 | 0.08 | 0.08 | 0.08 | 0.07 | 0.08 | 0.08 | 0.08 | 0.08 | 0.08 | 0.07 | 0.08 | 0.07 | 0.07 | 0.07 | 0.07 | 0.07 | 0.07 | ||
| Heart Disease Vet | 0.13 | 0.14 | 0.13 | 0.14 | 0.13 | 0.14 | 0.13 | 0.13 | 0.13 | 0.13 | 0.12 | 0.12 | 0.12 | 0.12 | 0.11 | 0.12 | 0.11 | 0.12 | ||
| Stroke Non-Vet | 0.05 | 0.05 | 0.05 | 0.05 | 0.05 | 0.05 | 0.05 | 0.05 | 0.05 | 0.05 | 0.05 | 0.05 | 0.05 | 0.05 | 0.05 | 0.05 | 0.05 | 0.05 | ||
| Stroke Vet | 0.06 | 0.06 | 0.06 | 0.06 | 0.06 | 0.06 | 0.06 | 0.06 | 0.06 | 0.06 | 0.06 | 0.06 | 0.06 | 0.07 | 0.07 | 0.06 | 0.06 | 0.06 | ||
| Skin Cancer Non-Vet | 0.11 | 0.11 | 0.11 | 0.11 | 0.12 | 0.11 | 0.12 | 0.12 | 0.12 | 0.12 | 0.12 | 0.12 | ||||||||
| Skin Cancer Vet | 0.16 | 0.16 | 0.16 | 0.17 | 0.17 | 0.16 | 0.17 | 0.17 | 0.18 | 0.16 | 0.18 | 0.17 | ||||||||
| Cancer Non-Vet | 0.11 | 0.11 | 0.11 | 0.11 | 0.12 | 0.11 | 0.12 | 0.12 | 0.12 | 0.12 | 0.12 | 0.12 | ||||||||
| Cancer Vet | 0.13 | 0.12 | 0.13 | 0.12 | 0.13 | 0.13 | 0.14 | 0.14 | 0.14 | 0.15 | 0.14 | 0.13 | ||||||||
| COPD Non-Vet | 0.08 | 0.08 | 0.08 | 0.09 | 0.08 | 0.08 | 0.09 | 0.09 | 0.09 | 0.09 | 0.09 | 0.09 | ||||||||
| COPD Vet | 0.09 | 0.09 | 0.10 | 0.10 | 0.10 | 0.10 | 0.11 | 0.11 | 0.11 | 0.12 | 0.11 | 0.10 | ||||||||
| Kidney Disease Non-Vet | 0.03 | 0.04 | 0.04 | 0.04 | 0.04 | 0.04 | 0.04 | 0.05 | 0.05 | 0.05 | 0.05 | 0.04 | ||||||||
| Kidney Disease Vet | 0.03 | 0.04 | 0.04 | 0.04 | 0.04 | 0.05 | 0.05 | 0.05 | 0.05 | 0.06 | 0.05 | 0.05 | ||||||||
| Arthritis Non-Vet | 0.37 | 0.38 | 0.38 | 0.39 | 0.37 | 0.38 | 0.37 | 0.38 | 0.37 | 0.37 | 0.37 | 0.37 | ||||||||
| Arthritis Vet | 0.36 | 0.38 | 0.37 | 0.37 | 0.37 | 0.38 | 0.37 | 0.39 | 0.37 | 0.38 | 0.39 | 0.37 | ||||||||
| Mental Health Non-Vet | 0.37 | 0.37 | 0.36 | 0.37 | 0.36 | 0.36 | 0.36 | 0.36 | 0.37 | 0.37 | 0.35 | 0.35 | 0.36 | 0.36 | 0.38 | 0.39 | 0.41 | 0.40 | 0.44 | 0.38 |
| Mental Health Vet | 0.31 | 0.31 | 0.30 | 0.30 | 0.28 | 0.30 | 0.30 | 0.30 | 0.30 | 0.30 | 0.29 | 0.29 | 0.30 | 0.30 | 0.31 | 0.32 | 0.35 | 0.33 | 0.38 | 0.31 |
| Veterans>Non-Veterans, Veterans<Non-Veterans | ||||||||||||||||||||
Table 4.
Results of the Quasibinomial General Linear Models (Odds-Ratios).
| Variable. | Overweight / Obese | Heart Disease | Stroke | Skin Cancer | Cancer | COPD | Arthritis | Mental Health | Kidney Disease | Diabetes | ||||||||||||||||||
|---|---|---|---|---|---|---|---|---|---|---|---|---|---|---|---|---|---|---|---|---|---|---|---|---|---|---|---|---|
| Age 25-34 | 1.963 | *** | 2.026 | *** | 2.578 | *** | 1.473 | *** | 2.600 | *** | 1.882 | *** | 2.892 | *** | 0.883 | *** | 1.782 | *** | 2.347 | *** | ||||||||
| Age 35-44 | 2.710 | *** | 4.448 | *** | 5.428 | *** | 3.599 | *** | 4.315 | *** | 2.959 | *** | 6.302 | *** | 0.782 | *** | 2.833 | *** | 6.722 | *** | ||||||||
| Age 45-54 | 3.162 | *** | 11.200 | *** | 10.399 | *** | 8.612 | *** | 7.784 | *** | 4.921 | *** | 13.042 | *** | 0.675 | *** | 4.345 | *** | 15.096 | *** | ||||||||
| Age 55-64 | 3.418 | *** | 20.837 | *** | 14.997 | *** | 15.928 | *** | 12.863 | *** | 6.691 | *** | 22.034 | *** | 0.526 | *** | 6.017 | *** | 24.804 | *** | ||||||||
| Age 65+ | 2.993 | *** | 31.346 | *** | 18.687 | *** | 33.689 | *** | 22.158 | *** | 5.923 | *** | 27.962 | *** | 0.261 | *** | 7.816 | *** | 30.104 | *** | ||||||||
| Caucasian | 0.970 | *** | 1.152 | *** | 0.765 | *** | 6.467 | *** | 1.370 | *** | 1.317 | *** | 1.218 | *** | 1.267 | *** | 0.868 | *** | 0.598 | *** | ||||||||
| Hispanic | 1.172 | *** | 0.900 | *** | 0.667 | *** | 1.255 | *** | 0.840 | *** | 0.674 | *** | 0.704 | *** | 0.871 | *** | 1.034 | NS | 1.031 | * | ||||||||
| Male | 1.812 | *** | 1.682 | *** | 1.095 | *** | 1.049 | *** | 0.637 | *** | 0.823 | *** | 0.658 | *** | 0.627 | *** | 0.968 | * | 1.214 | *** | ||||||||
| Married | 1.062 | *** | 0.865 | *** | 0.711 | *** | 1.090 | *** | 0.954 | *** | 0.644 | *** | 0.854 | *** | 0.674 | *** | 0.831 | *** | 0.941 | *** | ||||||||
| Income>$75K | 1.102 | *** | 0.768 | *** | 0.592 | *** | 1.185 | *** | 0.957 | *** | 0.529 | *** | 0.810 | *** | 0.882 | *** | 0.759 | *** | 0.708 | *** | ||||||||
| College Grad | 0.689 | *** | 0.746 | *** | 0.646 | *** | 1.256 | *** | 1.015 | * | 0.470 | *** | 0.681 | *** | 0.986 | ** | 0.799 | *** | 0.658 | *** | ||||||||
| Wage Employee | 1.199 | *** | 0.476 | *** | 0.356 | *** | 0.768 | *** | 0.653 | *** | 0.471 | *** | 0.627 | *** | 0.776 | *** | 0.472 | *** | 0.677 | *** | ||||||||
| Region 2 | 1.104 | *** | 1.235 | *** | 1.289 | *** | 1.450 | *** | 1.030 | * | 1.305 | *** | 1.170 | *** | 0.917 | *** | 1.044 | * | 1.220 | *** | ||||||||
| Region 3 | 0.804 | *** | 1.006 | NS | 0.871 | *** | 0.969 | * | 0.977 | + | 0.882 | *** | 0.892 | *** | 0.920 | *** | 0.855 | *** | 0.926 | *** | ||||||||
| Region 4 | 0.797 | *** | 0.814 | *** | 0.878 | *** | 1.465 | *** | 0.977 | * | 0.843 | *** | 0.858 | *** | 1.001 | NS | 1.034 | + | 0.832 | *** | ||||||||
| Region 5 | 0.773 | *** | 0.897 | *** | 0.824 | *** | 1.062 | *** | 1.025 | * | 0.861 | *** | 0.893 | *** | 0.971 | *** | 0.865 | *** | 0.872 | *** | ||||||||
| Region 6 | 0.752 | *** | 0.847 | *** | 0.855 | *** | 1.403 | *** | 0.995 | NS | 0.783 | *** | 0.796 | *** | 1.060 | *** | 0.950 | * | 0.869 | *** | ||||||||
| Region 7 | 0.881 | *** | 1.032 | * | 1.027 | + | 1.534 | *** | 0.986 | NS | 1.020 | + | 0.913 | *** | 0.871 | *** | 1.008 | NS | 0.992 | NS | ||||||||
| Region 8 | 1.026 | + | 1.927 | *** | 0.583 | *** | 0.853 | ** | 0.941 | + | 0.821 | *** | 1.017 | NS | 0.550 | *** | 0.773 | *** | 0.961 | * | ||||||||
| Region 9 | 0.976 | *** | 0.927 | *** | 0.963 | * | 1.061 | *** | 0.984 | NS | 0.859 | *** | 0.858 | *** | 0.847 | *** | 0.875 | *** | 0.935 | *** | ||||||||
| Region 10 | 0.973 | ** | 1.050 | ** | 1.099 | *** | 1.275 | *** | 0.972 | + | 0.973 | + | 0.883 | *** | 0.887 | *** | 1.044 | + | 1.074 | *** | ||||||||
| Year | 0.998 | ** | 0.984 | *** | 1.021 | *** | 1.004 | * | 1.005 | ** | 1.013 | *** | 0.997 | ** | 1.012 | *** | 1.030 | *** | 1.016 | *** | ||||||||
| Veteran | 1.261 | *** | 1.337 | *** | 1.277 | *** | 1.308 | *** | 1.481 | *** | 1.339 | *** | 1.253 | *** | 0.992 | NS | 1.124 | *** | 1.112 | *** | ||||||||
| COVID | 1.006 | * | 0.993 | NS | 0.972 | ** | 0.987 | * | 0.990 | + | 0.972 | *** | 0.989 | ** | 1.069 | *** | 0.955 | *** | 0.988 | * | ||||||||
| Veteran×COVID | 0.986 | + | 0.986 | NS | 0.978 | NS | 1.016 | + | 1.011 | NS | 1.056 | *** | 1.035 | *** | 0.995 | NS | 1.049 | ** | 0.992 | NS | ||||||||
| ***p<0.001, **p<0.01, *p<0.05, +p<0.10, NS=not significant | ||||||||||||||||||||||||||||
Disclaimer/Publisher’s Note: The statements, opinions and data contained in all publications are solely those of the individual author(s) and contributor(s) and not of MDPI and/or the editor(s). MDPI and/or the editor(s) disclaim responsibility for any injury to people or property resulting from any ideas, methods, instructions or products referred to in the content. |
© 2023 by the authors. Licensee MDPI, Basel, Switzerland. This article is an open access article distributed under the terms and conditions of the Creative Commons Attribution (CC BY) license (http://creativecommons.org/licenses/by/4.0/).
Copyright: This open access article is published under a Creative Commons CC BY 4.0 license, which permit the free download, distribution, and reuse, provided that the author and preprint are cited in any reuse.


