

Submitted:
13 April 2025
Posted:
15 April 2025
You are already at the latest version
Abstract
This paper addresses the critical challenges in network security, particularly in Internet of Medical Things (IoMT), through advanced machine learning approaches. We propose a high-performance cybersecurity framework leveraging a carefully fine-tuned XGBoost classifier to detect malicious attacks with superior predictive accuracy while maintaining interpretability. Our comprehensive evaluation compares the proposed model with a well-regularized logistic regression baseline using key performance metrics. Additionally, we analyze the security-cost trade-off in designing machine learning systems for threat detection and employ SHAP (SHapley Additive exPlanations) to identify key features driving predictions. We further introduce a late fusion approach based on max voting that effectively combines the strengths of both models. Results demonstrate that while XGBoost achieves higher accuracy (0.97) and recall (1.00) compared to logistic regression, our late fusion model provides a more balanced performance with improved precision (0.98) and reduced false negatives, making it particularly suitable for security-sensitive applications. This work contributes to the development of robust, interpretable, and efficient machine learning solutions for addressing evolving cybersecurity challenges in networked environments.
Keywords:
Machine Learning
; IoMT
; Network Security
; XGBoost
; Late Fusion
; SHAP
; Cybersecurity
; Logistic Regression
; Intrusion Detection
1. Introduction
The growing complexity and frequency of cyberattacks present substantial challenges to network security, especially as technological advances accelerate. With the proliferation of interconnected devices, particularly in sensitive domains such as healthcare, the need for robust, adaptive, and intelligent threat detection mechanisms has become critical [1,2].
Traditional network security approaches, such as Next-Generation Firewalls (NGFWs) [3] and modern Intrusion Detection and Prevention Systems (IDPS) [4], often struggle to keep pace with increasingly sophisticated cyber threats. This requires advanced computational techniques capable of dynamically detecting and mitigating potential security breaches [3,4].
The Internet of Medical Things (IoMT) is particularly vulnerable to cyber-attacks due to its reliance on interconnected medical devices communicating through protocols such as Bluetooth, WiFi, and MQTT. These attacks pose severe risks, compromising not only sensitive patient data but also critical healthcare infrastructure [1,2]. The consequences of such breaches extend beyond data privacy, potentially affecting patient safety and disrupting healthcare services.
Machine learning (ML) has emerged as a transformative paradigm in cybersecurity, offering powerful tools to analyze complex network traffic patterns and detect anomalies with high precision [5,6]. Recent advances in ensemble learning techniques, such as XGBoost, have demonstrated significant potential to develop resilient and generalizable threat detection models [7,8]. These approaches leverage sophisticated algorithms to capture intricate relationships within network data, surpassing traditional rule-based detection systems.
Despite significant progress in ML-based security frameworks, several challenges persist, including the need to balance detection accuracy, computational efficiency, model interpretability, and generalization to evolving threat landscapes [9,10]. Furthermore, minimizing both false positives and false negatives remains a complex optimization problem in security-sensitive applications.
Ensuring robust and efficient detection of malicious attacks remains a critical challenge in cybersecurity. Altough machine learning, particularly ensemble-based approaches, has shown promise in addressing these issues, designing a well-regularized and interpretable model that optimally balances security and computational cost remains an open research problem.
In this work, we develop a high-performance yet generalizable machine learning framework for the detection of malicious attacks. By leveraging a carefully fine-tuned XGBoost classifier [7], our objective is to achieve superior predictive accuracy while maintaining interpretability. Additionally, we assess the trade-offs involved in security-sensitive ML applications, where reducing both false positives and false negatives is crucial. To enhance transparency and gain deeper insights into the model’s decision-making process, we employ SHAP (SHapley Additive exPlanations) [8] to identify key features driving predictions. Through rigorous evaluation and comparison with a well-regularized logistic regression baseline, our study provides a comprehensive perspective on the efficacy of advanced ensemble learning techniques in cybersecurity.
More specifically, the contributions of this paper can be summarized as follows.
- We propose a well-regularized and fine-tuned XGBoost classifier that achieves high performance while preserving generalization;
- We conduct a comprehensive performance evaluation, comparing the proposed model with a well-regularized and fine-tuned logistic regression baseline using metrics such as accuracy and precision;
- We analyze the trade-off between security and cost in designing a machine learning system for detecting malicious attacks;
- We employ SHAP (SHapley Additive exPlanations), an interpretation technique, to identify key factors/features driving predictions;
- We introduce a late fusion approach based on max voting to improve detection accuracy by leveraging the strengths of both XGBoost and logistic regression, ensuring an effective balance between security and operational cost.
The paper is organized as follows. Section 2 outlines the most relevant existing work. Section 3 discusses data collection and preprocessing. Section 4 presents the mathematical modeling of the proposed machine learning model. Section 5 discusses the results of the proposed machine learning model and compares them with logistic regression as a baseline. Section 6 compares this paper with existing work. Finally, Section 7 concludes the paper.
2. Related Work
The increasing frequency of cyberattacks, including Denial-of-Service (DoS) and Advanced Persistent Threats (APT), has markedly turned the focus of the academic and professional communities towards a more rigorous analysis of threats at the network level [9]. In recent decades, extensive research efforts have been dedicated to unraveling the complexities of cyber threats and advancing the development of cutting-edge detection and mitigation strategies over the past decade [10,11,12]. Notably, the covert nature of attack traffic often enables these threats to bypass conventional detection mechanisms at the network layer, presenting significant challenges in maintaining network security.
In response to these evolving threats, recent studies have placed significant emphasis on enhancing the security frameworks of Internet of Medical Things (IoMT) devices, which are increasingly being targeted due to the critical nature of the data they handle [1,2]. These devices, which range from diagnostic to therapeutic types, are interconnected through various protocols such as Bluetooth, WiFi, and MQTT, making them susceptible to sophisticated cyber-attacks.
The deployment of Machine Learning (ML) techniques has been pivotal in addressing these vulnerabilities. Advanced ML models, such as Decision Trees, Random Forests, Gradient Boosting, XGBoost, Recurrent Neural Networks (RNNs), and Isolation Forests, have been widely adopted to scrutinize network traffic and detect anomalies indicative of potential security breaches [5]. These techniques harness the power of statistical analysis, feature engineering, and principal component analysis to refine detection accuracy [6].
Chunchun et al. [13] have explored the role of machine learning (ML) in enhancing IoT security. The work provides a comprehensive review of ML techniques applied to IoT security, focusing on emerging trends and challenges. The paper discusses various supervised and unsupervised learning approaches for detecting threats in IoT networks and highlights their effectiveness in mitigating cyber threats. However, it lacks an in-depth analysis of generative AI and its integration with ML for IoT security [13].
El-Saleh et al. [14] explore the opportunities and challenges of the Internet of Medical Things (IoMT) in healthcare, emphasizing its role in improving patient care through connected devices. They highlight the integration of AI, machine learning, and Blockchain to enhance security, mitigate cyber threats, and ensure reliable communication in IoMT systems. Their study underscores the importance of digital technologies in managing pandemics and securing healthcare data.
Deep learning (DL) has been widely used to detect cyber threats in IoT networks, particularly against DDoS attacks. The study in [15] examines various DL-based approaches for detecting DDoS attacks, with a focus on feature fusion techniques to enhance accuracy. The authors present a detailed evaluation of different models and their performance in real-world scenarios. While the study provides valuable insights into IoT security, its narrow focus on DDoS detection limits its applicability to broader IoT security challenges [15].
Judith et al. [16] propose a deep learning-based IDS for IoMT, focusing on man-in-the-middle attacks. While their work primarily addresses classification accuracy, our research emphasizes the balance of false positives and negatives in security-sensitive applications. Furthermore, our work analyzes the trade-off between security and cost in designing a ML system for detecting malicious attacks.
In the domain of IoMT security and optimization, Rahmani et al. [17] proposed a novel approach inspired by human brain astrocyte cells to map dataflow in IoMT networks and detect defective devices. Their work introduces an astrocyte-flow mapping (AFM) algorithm based on the biological process of phagocytosis to enhance communication efficiency and identify faulty network components. By implementing this biomimetic approach on mesh-based communication infrastructures, they achieved impressive improvements in total runtime (60.85%) and energy consumption (52.38%) compared to conventional methods. While our work focuses on machine learning techniques for attack detection, their research complements our approach by addressing the fundamental infrastructure-level challenges in IoMT deployments. Their biological inspiration for network optimization provides an interesting contrast to our data-driven security framework, highlighting the diverse approaches being explored to enhance IoMT reliability and performance [17].
Recently, Alfatemi et al. [18] propose a neural network model for DDoS attack detection, integrating Gaussian noise to enhance robustness and generalization. Their streamlined architecture ensures rapid processing, with experiments demonstrating its effectiveness in real-world security applications [18].
Reinforcement Learning (RL) has gained attention for its potential to enhance IoT security by enabling adaptive and automated threat detection. The survey in [19] provides an extensive review of RL-based approaches applied to IoT security, outlining their strengths and limitations. It explores different RL algorithms, their applicability in intrusion detection, and the challenges of deploying RL models in IoT environments. However, the paper focuses mainly on RL without considering hybrid ML approaches or federated learning techniques that could further enhance security in distributed IoT networks [19].
The integration of Deep Reinforcement Learning (DRL) in IoT networks has shown promise in addressing dynamic security threats. Frikha et al. [20] reviews the application of RL and DRL for IoT security, particularly in wireless IoT systems. It highlights use cases where DRL-based models improve network security by dynamically adapting to threats in real time. However, the paper focuses mainly on wireless communication aspects and does not explore recent advances in hybrid methodologies or generative AI for IoT security [20].
In a more recent work, Jagatheesaperumal et al. [21] provide a comprehensive review of Distributed Reinforcement Learning (DRL) approaches to improve IoT security in heterogeneous and distributed networks. Their work highlights the advantages of DRL in addressing dynamic and evolving security threats while also discussing design factors, performance evaluations, and practical implementation considerations [21].
Zachos et al. [22] developed a hybrid Anomaly-based Intrusion Detection System for IoMT networks using novelty and outlier detection algorithms (OCSVM, LOF, G_KDE, PW_KDE, B_GMM, MCD, and IsoForest) capable of identifying unknown threats while maintaining low computational cost on resource-constrained devices. While both our works address IoMT security through machine learning, our approach differs by employing XGBoost and logistic regression with a late fusion strategy, focusing on optimizing the security-cost trade-off through model interpretability via SHAP analysis. Additionally, our work emphasizes balancing false positives and negatives in security-sensitive applications, whereas their research prioritizes lightweight implementation for IoT devices.
Alamleh et al. [23] proposed a multi-criteria decision-making (MCDM) framework to standardize and benchmark ML-based intrusion detection systems specifically for federated learning in IoMT environments. Their approach differs from our work by focusing on developing evaluation standards using the fuzzy Delphi method and applying group decision-making techniques to rank different classifiers. Although they found BayesNet to be optimal and SVM least effective in their federated learning context, our research demonstrates the superiority of XGBoost over traditional models and introduces a late fusion approach to balance security and performance. Unlike their emphasis on standardization across multiple classifiers, our work concentrates on model interpretability through SHAP analysis and the optimization of security-relevant metrics like false negative reduction in a non-federated environment.
Fall detection (FD) systems integrated with the Internet of Medical Things (IoMT) have been extensively studied for their role in healthcare and personal safety. Jiang et al. [24] provide a comprehensive review of wearable sensor-based FD techniques, categorizing them into threshold-based, conventional machine learning, and deep learning methods, while also summarizing relevant datasets for performance evaluation. In contrast, our work focuses on Distributed Reinforcement Learning for IoT security, emphasizing probabilistic modeling and adaptive decision making rather than classification-based detection systems. This distinction highlights the broader application of our approach in securing IoT environments beyond specific healthcare use cases.
Machine learning-based intrusion detection systems (IDS) are widely explored for securing IoMT environments. Alsolami et al. [25] evaluate ensemble learning methods, including Stacking, Bagging, and Boosting, for cyberattack detection using the WUSTL-EHMS-2020 dataset, finding Stacking to be the most effective. While their work focuses on evaluating classification models, our approach leverages probabilistic modeling and distributed reinforcement learning for adaptive and dynamic threat mitigation in IoT security. This distinction emphasizes our focus on decision-making under uncertainty rather than static classification-based intrusion detection.
In a more recent work, Alalwany et al. [26] propose a real-time intrusion detection system (IDS) that leverages a stacking ensemble of machine learning and deep learning classifiers, implemented within a Kappa Architecture for continuous data processing. While their approach focuses on classification-based IDS for cyberattack detection, our work emphasizes probabilistic modeling and distributed reinforcement learning to secure IoT environments. This distinction highlights our focus on adaptive decision-making and dynamic threat mitigation rather than solely improving classification accuracy.
3. Data Collection & Preprocessing
The CIC IoMT 2024 dataset [27] presents a comprehensive benchmark to evaluate the security of Internet of Medical Things (IoMT) devices. The dataset comprises 18 distinct cyberattacks on a testbed of 40 IoMT devices (25 real, 15 simulated) across multiple protocols, including Wi-Fi, MQTT, and Bluetooth. The attacks are categorized into five major classes: DDoS, DoS, Recon, MQTT, and Spoofing. This dataset enables researchers to evaluate and develop security solutions, including machine learning models, to enhance IoMT security.
3.1. Dataset
The dataset consists of network traffic records with five input features: Source, Destination, Protocol, Length, and Info. These features describe communication flow, protocol type, and packet details. The target variable, Attack, is binary ({0,1}), indicating whether the instance is benign (0) or an attack (1).
Figure 1 shows the distribution of attack and non-attack instances in both the training and the testing datasets. The dataset exhibits a significant class imbalance, with attack instances vastly outnumbering non-attack instances. Specifically, in the training set (Figure 1a), attack instances account for 998,391 cases, whereas non-attack instances total only 217,493. A similar pattern is observed in the test set (Figure 1b), where attack instances (251,708) greatly exceed non-attack instances (65,330). Such an imbalance suggests that relying solely on accuracy as a performance metric may be misleading, as a model could achieve high accuracy by predominantly predicting the majority class. Instead, more informative evaluation metrics such as precision, recall, and the F1-score should be considered to properly assess the model’s effectiveness in detecting minority class instances.
4. Mathematical Model
In this section, we present the rigorous mathematical formulation underlying the proposed machine learning model, which employs Extreme Gradient Boosting (XGBoost) with regularization [7].
4.1. Feature Representation
Let be the given dataset, where:
- denotes the feature vector associated with the i-th sample,
- is the corresponding binary target variable,
- m represents the total number of training samples,
- is the number of predictive features.
4.2. Boosting Framework and Model Representation
Building upon gradient boosting principles [28], XGBoost [7] constructs an ensemble of regression trees, where the output predicted for a given sample at iteration t is given by:
where each represents a regression tree. The model is trained to minimize a specified cost function (aka the objective function).
4.3. Regularized Objective Function
The optimization objective at iteration t consists of a differentiable convex loss function ℓ along with a regularization term to control model complexity:
The regularization term penalizes complex trees to prevent overfitting and is defined as:
where controls the complexity penalty on the number of leaves , represents the L1 regularization term enforcing sparsity, and
where:
- controls the complexity penalty on the number of leaves ,
- represents the leaf weight parameters,
- represents the regularization term enforcing sparsity,
- controls the regularization to prevent overfitting.
4.4. Second-Order Approximation for Optimization
To enable efficient optimization, the objective function is approximated using a second-order Taylor expansion:
where:
- is the first-order gradient,
- is the second-order gradient.
This formulation leverages first- and second-order information, leading to more stable and efficient gradient-based updates.
4.5. Optimal Leaf Weights and Split Criterion
For each leaf node j, the optimal weight assignment minimizing the objective is given by:
where denotes the set of samples falling into leaf j.
Furthermore, the gain from performing a split at a given node j is expressed as:
where and denote the left and right child nodes resulting from the split. The split is accepted if the gain exceeds a pre-defined threshold.
This mathematical formulation provides a robust foundation for binary classification tasks, particularly for the detection of cybersecurity attacks, where the ability to handle complex network data is crucial for accurate predictions.
Table 1 presents the grid of hyperparameters used to fine-tune the XGBoost model. The table includes various values for key parameters such as the number of estimators (), learning rate (), tree depth, minimum child weight (), subsample ratio (), column sample by tree (), and the regularization parameters (). These configurations were tested to determine their impact on model performance.
Table 2 displays the best combination of hyperparameters, selected based on accuracy and precision. The optimal configuration includes 50 estimators, a learning rate of 0.1, a tree depth of 1, and regularization parameters () set to 1000. The selected model achieved high performance, with a test accuracy of 97% and a training accuracy of 97%. Similarly, the precision values were 96% for the test set and 97% for the training set, indicating strong predictive capabilities while maintaining consistency between the training and testing phases. This model provided the best trade-off between generalization and predictive performance.
4.6. Late Fusion Model
Late fusion (aka, decision-level fusion) is a technique that combines the predictions of multiple classifiers to improve overall performance [29]. Unlike early fusion, which merges features before training, late fusion aggregates the final predictions of different models to make a more robust decision. This approach takes advantage of the strengths of individual classifiers, mitigating their weaknesses by making a more informed decision [29].
4.6.1. Mathematical Formulation
Given two models, XGBoost and LR (see Appendix A), their predicted probabilities for an instance belonging to the positive class are defined as:
where (detailed in Table 2) and (detailed in Table A2) are the learned parameters of the XGBoost and LR models, respectively.
Instead of using a weighted average, the final classification decision is obtained using a max voting approach:
where is a predefined threshold (typically but can be optimized; in our case, ). This logical "OR" operation ensures that an instance is classified as an attack (1) if either of the models predicts it as such with a probability of or greater.
4.6.2. Fusion Strategy Justification
The max voting fusion rule prioritizes minimizing false negatives (FN), which is critical in security applications where undetected attacks pose significant risks, while also aiming to reduce unnecessary alerts (false positives). The rationale behind this method is:
- XGBoost excels at minimizing false positives (FP), reducing unnecessary alerts.
- LR reduces false negatives (FN), improving attack detection.
- Max voting (i.e., late fusion) ensures that if either model predicts an attack, the instance is flagged as an attack, aiming to minimize false negatives (FN) and false positives (FP) while maintaining a balance between them for a more robust model.
5. Results and Analysis
This section provides a detailed evaluation of different models based on specific performance metrics.
Table 3 presents a comparative analysis of performance metrics for the XGBoost, Logistic Regression (LR), and Late Fusion models. The results indicate that XGBoost outperforms LR in terms of accuracy (0.97 vs. 0.95) and recall (1.00 vs. 0.89), suggesting a superior capability to correctly identify positive instances. However, the Late Fusion model achieves a more balanced performance, with an accuracy of 0.96 and an F1 score of 0.94, demonstrating an improved overall robustness.
Although LR exhibits slightly higher precision than XGBoost (0.95 vs. 0.96), the Late Fusion model achieves the highest precision (0.98), ensuring fewer false positives. Additionally, its recall (0.91) is higher than that of LR but slightly lower than XGBoost. These findings suggest that the Late Fusion approach effectively balances precision and recall, making it a more reliable choice for minimizing false negatives while maintaining strong classification performance.
Table 4 presents a comparative analysis of the confusion matrices for the XGBoost, Logistic Regression, and Late Fusion models, highlighting their classification performance in distinguishing between benign and attack instances. The diagonal elements represent correctly classified instances, while the off-diagonal elements indicate misclassifications.
XGBoost correctly classifies 55,884 benign instances and 251,347 attack instances. However, it misclassifies 9,446 benign samples as attacks (false positives) and 361 attack samples as benign (false negatives). In contrast, the Logistic Regression model correctly identifies 51,061 benign instances and 251,519 attack instances, but misclassifies 14,269 benign samples as attacks and only 189 attack instances as benign.
The Late Fusion model, which combines both classifiers, achieves a balance between the two. Correctly classifies 53,291 benign instances and 251,495 attack instances, reducing false negatives to 213, which improves over XGBoost (361) while remaining close to Logistic Regression (189). Additionally, it results in 12,039 false positives, maintaining a lower FP rate than Logistic Regression while being slightly higher than XGBoost. This trade-off improves security by reducing false negatives while keeping false positives relatively controlled.
In our case study, precision is the most critical metric when prioritizing security over cost. The LR model misclassified only 189 attack instances as benign, whereas XGBoost misclassified 361, indicating that LR may be more reliable in minimizing false negatives. However, XGBoost had a significantly lower false positive rate, misclassifying only 9,446 benign instances as attacks compared to 14,269 for LR. This trade-off suggests that XGBoost may be preferable when reducing unnecessary security interventions is a priority.
The Late Fusion Model balances both aspects by combining the strengths of XGBoost and Logistic Regression. It reduces false negatives to 213, significantly less than XGBoost (361) while remaining close to LR (189), enhancing security by minimizing undetected attacks. Furthermore, it misclassifies 12,039 benign instances as attacks, achieving a false positive rate lower than LR (14,269) but slightly higher than XGBoost (9,446).
These results indicate that while LR minimizes false negatives, making it more reliable for detecting attacks, XGBoost reduces false positives, which can lower operational costs by preventing unnecessary security escalations. The Late Fusion Model provides a balanced solution, offering improved security over XGBoost by reducing false negatives while keeping false positives lower than Logistic Regression. This makes it a more robust choice when both security and operational efficiency are critical considerations.
Figure 2 presents the Receiver Operating Characteristic (ROC) curves for both GBoost and LR, illustrating their classification performance. The XGBoost model demonstrates a better predictive capacity, as evidenced by its higher AUC (0.93) compared to LR (0.89). The ROC curve for XGBoost remains consistently above that of LR, indicating a better trade-off between sensitivity and specificity across various classification thresholds. Furthermore, the proximity of the XGBoost curve to the top left corner suggests that it achieves higher true positive rates while maintaining lower false positive rates, confirming its effectiveness in distinguishing between classes. The results confirm that non-linear boosting techniques, such as XGBoost, outperform traditional linear models in capturing complex patterns within the data.
Figure 3 presents a comparison of XGBoost and LR, examining the cost and performance (accuracy) relative to the number of iterations.
Figure 3a shows that the cost of XGBoost decreases steadily with iterations for both the training and test sets, indicating efficient learning. In particular, the training and test curves remain close, indicating that the XGBoost model does not overfit.
Similarly, for the LR model (Figure 3b), the cost decreases steadily with iterations for both the training and test sets, indicating efficient learning. The close alignment of the training and test curves suggests that the model does not overfit.
Figure 3c shows that the accuracy of the XGBoost model consistently improves for both the training and test sets. In addition, test accuracy closely follows training accuracy, demonstrating strong generalization (i.e., the model does not overfit). Specifically, the model achieves an accuracy of 97% on both sets and a precision of 97% for the training set and 96% for the test set, confirming that the XGBoost model does not overfit.
Figure 3d shows that the accuracy of the LR model increases smoothly with the number of iterations for the training and test sets. The close alignment of the training and test curves suggests minimal overfitting. Additionally, the test accuracy improves slightly less than that of XGBoost. Specifically, the LR model achieves an accuracy of 95% and a precision of 95% on both sets, confirming its generalization (i.e., its ability to generalize to an unseen dataset).
Overall, XGBoost outperforms LR, showing a better cost reduction and slightly higher accuracy.
Figure 4 shows the SHAP-based feature importance distribution for the XGBoost model. The "Info" feature is the most influential, accounting for 64.08% of the model’s decision-making process. "Source" contributes 36.73%, signifying a high influence. Meanwhile, "Protocol" and "Length" contribute 6.79% and 2.33%, respectively. Finally, "Destination" (0.06%) has minimal impact. These results suggest that "Info" serves as the primary driver of the model’s predictions, with secondary contributions from "Source" and then "Protocol".
6. Comparison with Existing Work
This section positions our proposed approach within the broader landscape of machine learning methods for IoMT security.
Our proposed approach distinguishes itself from existing work in several key aspects:
6.1. Methodological Distinctions
While most recent studies in IoMT security focus on specific algorithms or ensemble methods, our work introduces a comprehensive framework that combines two classifiers.
6.2. Security-Cost Trade-Off Analysis
A distinctive contribution of our work is the explicit analysis of the security-cost trade-off in machine learning-based threat detection systems. While Zachos et al. [22] focus on computational efficiency for resource-constrained devices, and Alamleh et al. [23] develop a multi-criteria decision-making framework for federated learning, neither addresses the operational implications of false positive/negative rates.
Our analysis reveals that logistic regression is preferable in environments where minimizing false negatives is paramount, while XGBoost provides advantages where reducing false positives is critical. This nuanced perspective is largely absent in the existing literature, which typically focuses on accuracy without considering the asymmetric costs of different types of errors in security applications.
6.3. Model Interpretability and Feature Optimization
Unlike many approaches that prioritize accuracy over transparency, our work emphasizes interpretability through SHAP analysis. This enables practical insights such as the identification of non-contributory features, contrasting with "black-box" approaches common in recent literature.
Our SHAP analysis identifies the "Destination" feature as non-contributory to model performance, suggesting opportunities for feature reduction. This finding distinguishes our work from approaches such as Dadkhah et al. [2], who use Isolation Forest with a predefined feature set without analyzing feature contributions.
6.4. Performance and Dataset Considerations
Our comprehensive evaluation includes precision, recall, F1- score, and false positive/negative rates, providing a more complete picture of model performance in security contexts. Our use of the CIC IoMT 2024 dataset with multi-protocol support enhances generalizability compared to studies using more specialized or simulated datasets.
Notably, Alalwany et al. [26] use the NSL-KDD dataset, which lacks the IoMT-specific threats and protocol diversity found in newer datasets like CIC IoMT 2024. Similarly, Alamleh et al. [23] focus on federated learning environments, which introduce challenges different from our centralized model approach.
6.5. Discussion
In the context of this research, we recommend the use of logistic regression in environments where minimizing false negatives is paramount, even at the potential cost of increased false positives. This is particularly relevant in scenarios where failing to detect a threat carries significant risks, such as in critical healthcare infrastructure where patient safety could be compromised.
In contrast, XGBoost is advantageous in environments where reducing false positives is critical, as this can lead to tangible cost reductions, such as minimizing the need for manual verification of benign alerts. This consideration is especially important in large-scale IoMT deployments where limited security personnel must efficiently assess potential threats.
Our late fusion approach, by leveraging the strengths of individual models, offers a robust solution to detect critical threats while also mitigating false positives, thus achieving a balance between security efficacy and operational cost. This balance is crucial in practical deployments, where both security and efficiency must be optimized simultaneously.
The SHAP analysis provides not only theoretical insight but also practical implementation advantages. Both the XGBoost and logistic regression models identify that the "Destination" feature does not contribute significantly to their performance. Consequently, this feature can be removed and the models re-trained, potentially improving their computational efficiency without sacrificing detection capability.
Future work should explore the adaptation of our framework to emerging threat vectors and protocols in IoMT environments, as well as investigating the potential of federated learning approaches to enhance privacy while maintaining detection performance across distributed healthcare networks.
7. Conclusion
This paper presents a comprehensive approach to addressing cybersecurity challenges in network environments using advanced machine learning techniques. Our research demonstrates the effectiveness of ensemble learning, specifically XGBoost, in detecting malicious attacks with high accuracy while maintaining model interpretability. The comparative analysis against a well-regularized logistic regression baseline reveals important insights into the performance trade-offs between these approaches.
XGBoost demonstrated superior overall performance with an accuracy of 0.97 and a perfect recall (1.00), indicating its effectiveness in minimizing false negatives, a critical consideration in security applications. However, our analysis revealed that logistic regression achieved fewer false negatives in absolute terms (189 compared to XGBoost’s 361), despite its lower overall accuracy (0.95) and recall (0.89).
To take advantage of the complementary strengths of both approaches, we introduced a late fusion model based on max voting, which achieved a balanced performance profile with accuracy of 0.96, precision of 0.98, and recall of 0.91. This hybrid approach significantly reduced false negatives compared to XGBoost while maintaining fewer false positives than logistic regression, offering an effective compromise between security assurance and operational efficiency.
The SHAP analysis provided valuable insights into the decision-making process, revealing that the "Info" feature contributed most significantly (64.08%) to predictions, followed by "Source" (36.73%) and "Protocol" (6.79%). This transparency improves trust in the model and provides actionable intelligence for security practitioners.
Our findings suggest that while non-linear boosting techniques like XGBoost generally outperform traditional linear models in capturing complex patterns, the optimal approach for security-sensitive applications may involve combining multiple models to balance precision and recall requirements. Future work should focus on extending these methods to address evolving threat landscapes and explore additional interpretability techniques to further enhance the transparency of machine learning-based security systems. Furthermore, investigating the application of these approaches to other domains beyond IoMT could provide valuable insight into their generalizability and broader utility in cybersecurity.
Abbreviations
The following abbreviations are used in this paper:
| ML | Machine Learning |
| LG | Logistic Regression |
| DoS | Denial of Service |
| IoMT | Internet of Medical Things |
Appendix A. Logistic Regression
This appendix provides detailed information on the hyperparameter tuning and mathematical formulation of the Logistic Regression model used in this study. Includes the grid of hyperparameters explored during model selection, the optimal hyperparameters identified through the grid search, and the corresponding mathematical model employed for classification. These elements were crucial in ensuring optimal performance and generalization of the model.
Appendix A.1. Hyperparameter Tuning
Table A1 shows the hyperparameter grid used to fine-tune the Logistic Regression model. The regularization strength C takes values of , , , and , controlling the trade-off between model complexity and overfitting. The penalty term considers both and regularization, which influence the weight distribution. Additionally, two solvers, liblinear and saga, are evaluated for their efficiency in solving the optimization problem.

Table A1.
Hyperparameter Grid for Logistic Regression.
| Hyperparameter | Values |
|---|---|
| Regularization Strength (C) | |
| Penalty | , |
| Solver | liblinear, saga |
Table A2 presents the optimal hyperparameters selected for the Logistic Regression model. The model achieved its best performance with a regularization strength of , an penalty, and the liblinear solver. These values were determined through a grid search (see Table A1), ensuring an optimal balance between generalization and performance.
Table A2.
Optimal Hyperparameters for Logistic Regression.
| Hyperparameter | Optimal Value |
|---|---|
| Regularization Strength (C) | |
| Penalty | |
| Solver | liblinear |
In contrast, when using a regularization strength , the model achieved a high training accuracy (96%) but a significantly lower test accuracy (56%). This substantial performance gap indicates severe overfitting, which means that the model does not generalize well to unseen data.
Appendix A.2. Mathematical Model
Logistic Regression models the probability of a binary outcome using the sigmoid function:
Given the optimal hyperparameters (, penalty, liblinear solver), the model is trained by minimizing the regularized negative log-likelihood:
where is the predicted probability, N is the number of samples, and controls the regularization strength, preventing overfitting by penalizing large weights.
Appendix A.3. Feature Importance Analysis
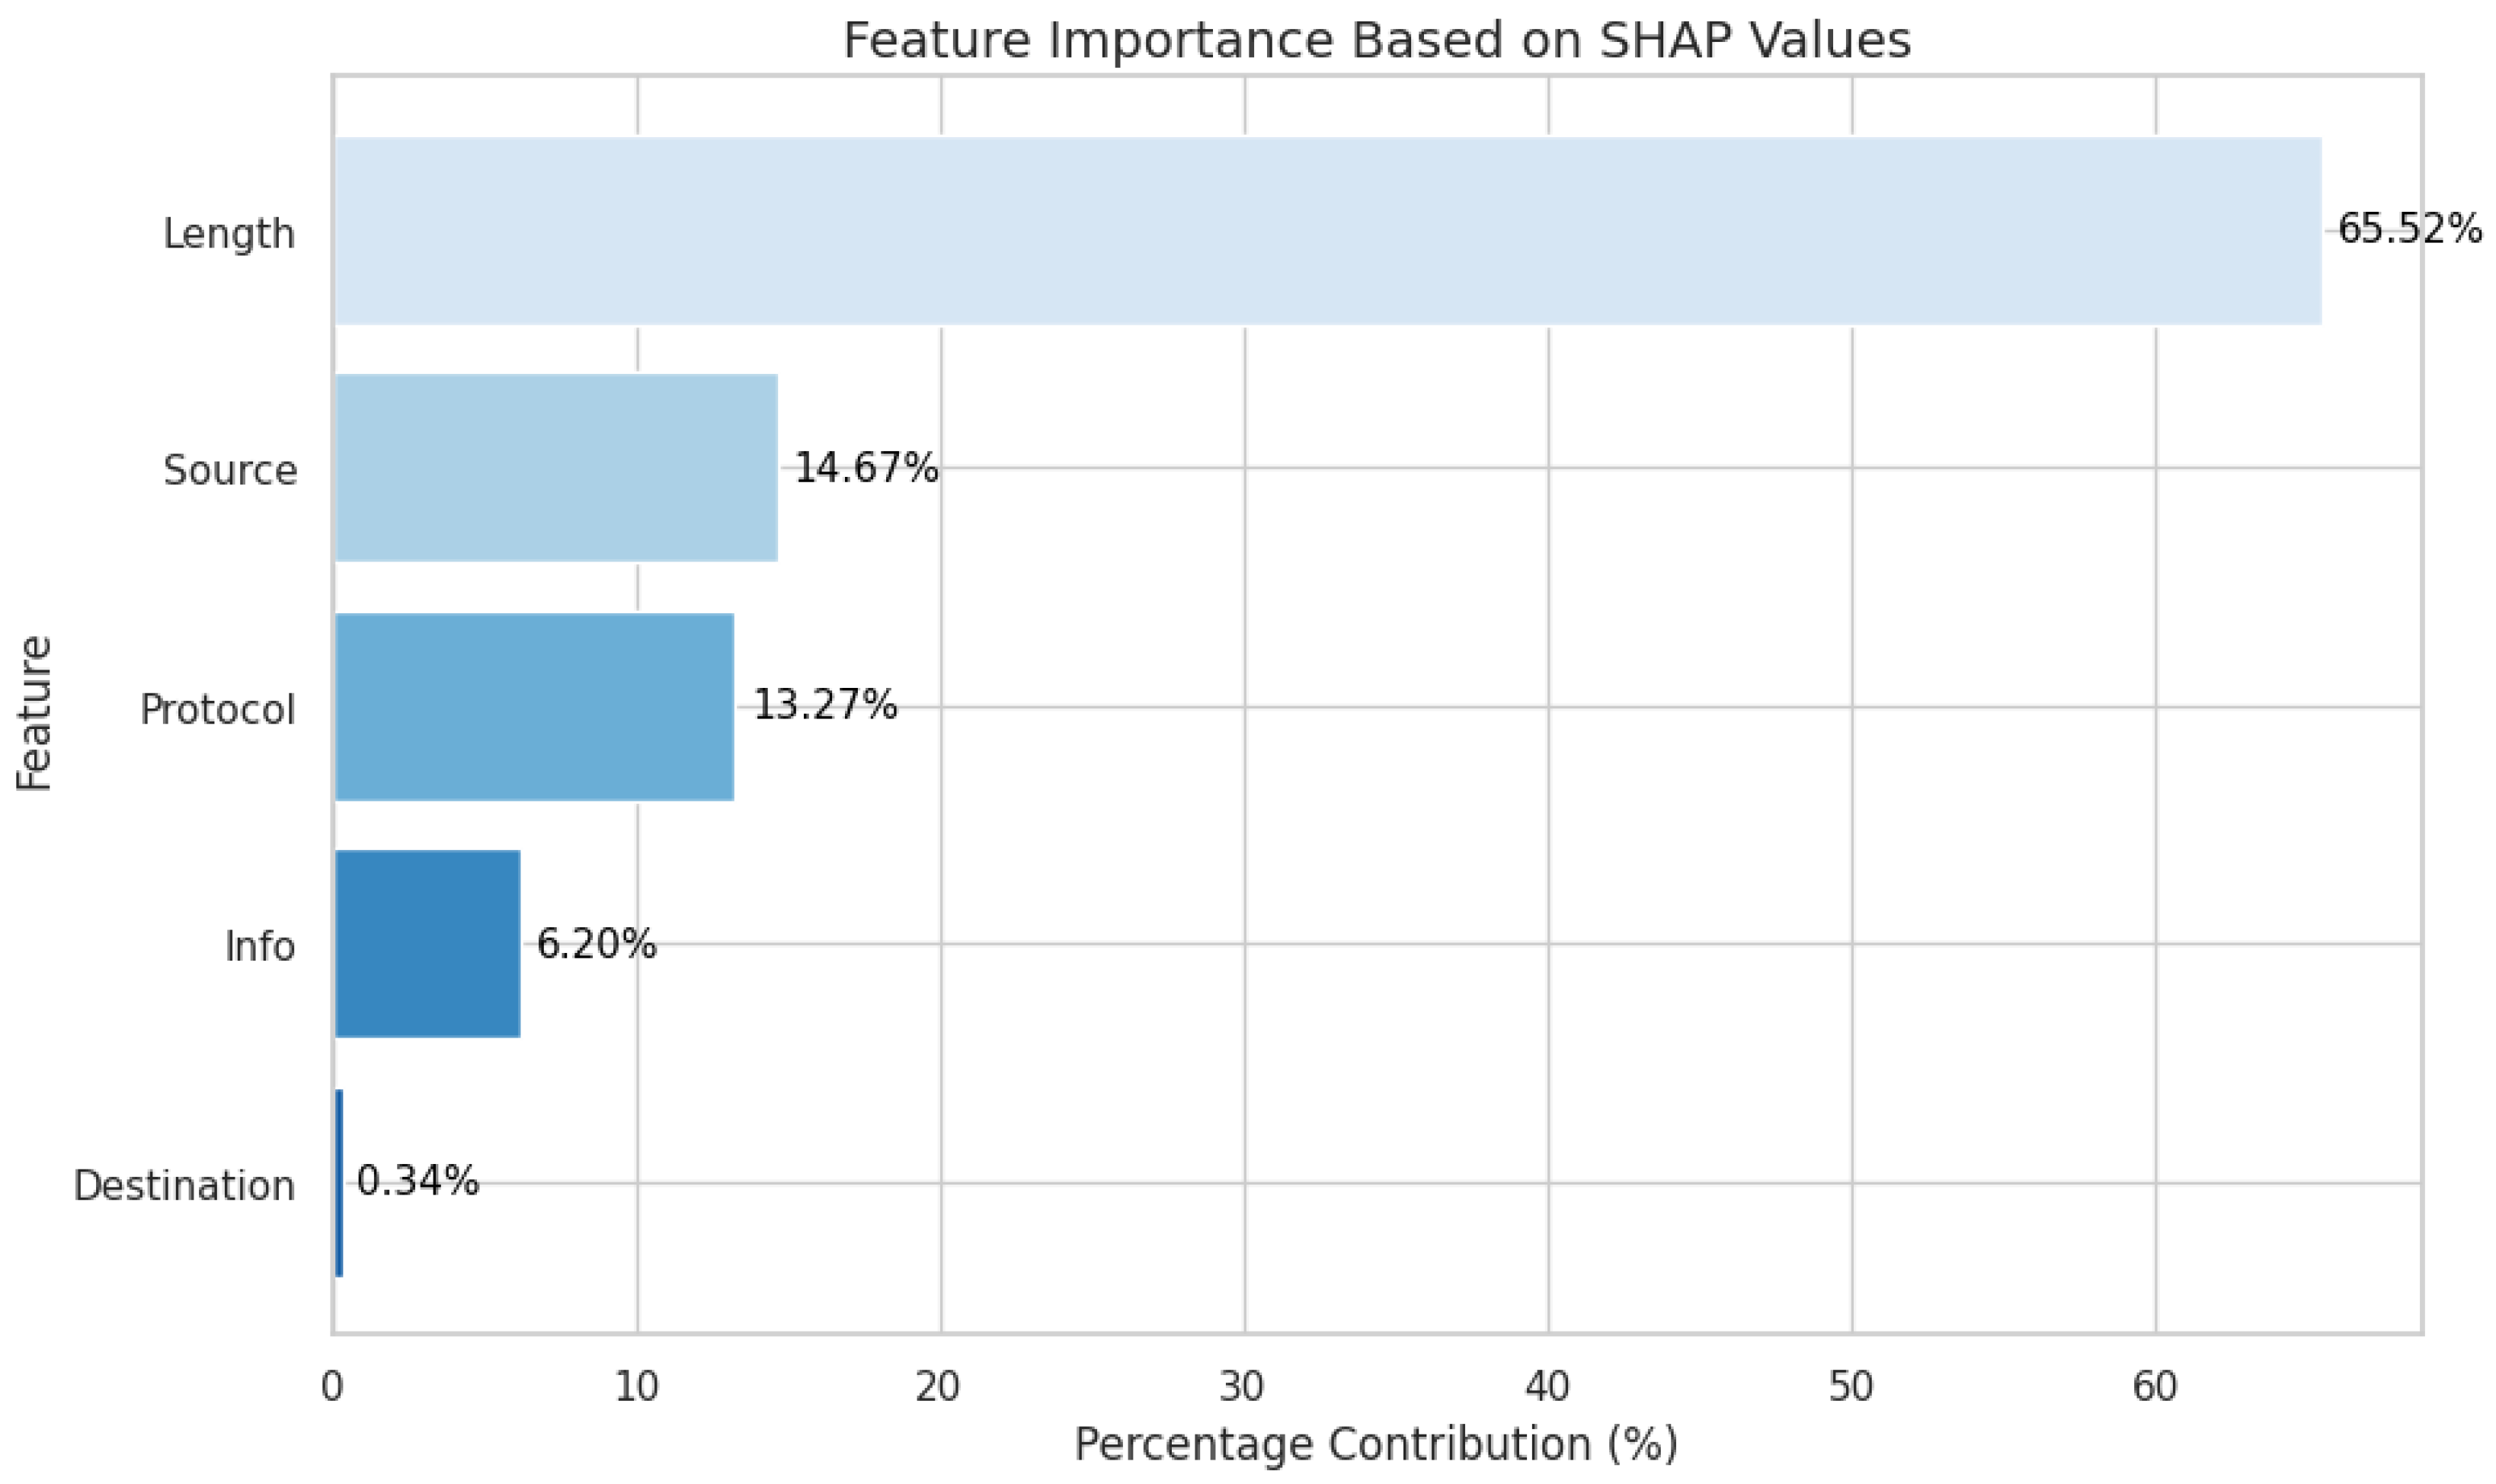
Figure A1 illustrates the SHAP-based feature importance distribution. The "Length" attribute/feature is the most influential, accounting for 65.52% of the model’s decision-making process. "Source" and "Protocol" contribute 14.67% and 13.27%, respectively, signifying moderate influence. Meanwhile, "Info" (6.20%) and "Destination" (0.34%) have minimal impact. These results suggest that "Length" serves as the primary driver of the model’s predictions, with secondary contributions from "Source" and "Protocol."
Figure A1.
Feature importance based on SHAP values.
References
- Ahmed, S.F.; et al. Insights into Internet of Medical Things (IoMT): Data fusion, security issues and potential solutions. Information Fusion 2024, 102, 102060. [Google Scholar] [CrossRef]
- Dadkhah, S.; et al. CICIoMT2024: Attack Vectors in Healthcare devices-A Multi-Protocol Dataset for Assessing IoMT Device Security. 2024. Available online: https://www.preprints.org/manuscript/202402.0898/download/final_file.
- Liang, J.; Kim, Y. Evolution of firewalls: Toward securer network using next generation firewall. In Proceedings of the 2022 IEEE 12th Annual Computing and Communication Workshop and Conference (CCWC). IEEE; 2022; pp. 0752–0759. [Google Scholar]
- Thapa, S.; Mailewa, A. The role of intrusion detection/prevention systems in modern computer networks: A review. In Proceedings of the Conference: Midwest Instruction and Computing Symposium (MICS), Vol. 53; 2020; pp. 1–14. [Google Scholar]
- Thakkar, A.; Lohiya, R. A review on challenges and future research directions for machine learning-based intrusion detection system. Archives of Computational Methods in Engineering 2023, 30, 4245–4269. [Google Scholar] [CrossRef]
- Hernandez-Jaimes, M.L.; et al. Artificial intelligence for IoMT security: A review of intrusion detection systems, attacks, datasets and Cloud-Fog-Edge architectures. Internet of Things 2023, 100887. [Google Scholar] [CrossRef]
- Chen, T.; Guestrin, C. XGBoost: A Scalable Tree Boosting System. In Proceedings of the Proceedings of the 22nd ACM SIGKDD International Conference on Knowledge Discovery and Data Mining (KDD). ACM, 2016; pp. 785–794. [Google Scholar] [CrossRef]
- Lundberg, S.M.; Lee, S.I. A Unified Approach to Interpreting Model Predictions. Advances in Neural Information Processing Systems 2017, 30. [Google Scholar]
- David, J.; Thomas, C. Discriminating flash crowds from DDoS attacks using efficient thresholding algorithm. JPDC. Elsevier, 2021; Volume 152, pp. 79–87. [Google Scholar] [CrossRef]
- Zheng, J.; et al. Realtime DDoS defense using COTS SDN switches via adaptive correlation analysis. TIFS. IEEE; In TIFS; 2018; Volume 13, pp. 1838–1853. [Google Scholar] [CrossRef]
- Rahouti, M.; et al. SYNGuard: Dynamic threshold-based SYN flood attack detection and mitigation in software-defined networks. IET Networks 2021, 10, 76–87. [Google Scholar] [CrossRef]
- Liang, X.; Znati, T. An empirical study of intelligent approaches to DDoS detection in large scale networks. In Proceedings of the ICNC. IEEE; 2019; pp. 821–827. [Google Scholar]
- Ni, C.; Li, S.C. Machine learning enabled industrial iot security: Challenges, trends and solutions. Journal of Industrial Information Integration 2024, 38, 100549. [Google Scholar] [CrossRef]
- El-Saleh, A.A.; Sheikh, A.M.; Albreem, M.A.; Honnurvali, M.S. The internet of medical things (IoMT): opportunities and challenges. Wireless networks 2025, 31, 327–344. [Google Scholar] [CrossRef]
- Nuhu, A.; Raffei, A.F.M.; Ab Razak, M.F.; Ahmad, A. Distributed Denial of Service Attack Detection in IoT Networks using Deep Learning and Feature Fusion: A Review. Mesopotamian Journal of CyberSecurity 2024, 4, 47–70. [Google Scholar] [CrossRef]
- Judith, A.; Kathrine, G.J.W.; Silas, S. Efficient deep learning-based cyber-attack detection for internet of medical things devices. Engineering Proceedings 2023, 59, 139. [Google Scholar]
- Rahmani, A.M.; Ali Naqvi, R.; Ali, S.; Hosseini Mirmahaleh, S.Y.; Alswaitti, M.; Hosseinzadeh, M.; Siddique, K. An astrocyte-flow mapping on a mesh-based communication infrastructure to defective neurons phagocytosis. Mathematics 2021, 9, 3012. [Google Scholar] [CrossRef]
- Alfatemi, A.; Oliveira, D.; Rahouti, M.; Hafid, A.; Ghani, N. Precision DDoS Detection through Gaussian Noise-Augmented Neural Networks. In Proceedings of the 2024 15th International Conference on Network of the Future (NoF). IEEE; 2024; pp. 178–185. [Google Scholar]
- Uprety, A.; Rawat, D.B. Reinforcement learning for iot security: A comprehensive survey. IEEE Internet of Things Journal 2020, 8, 8693–8706. [Google Scholar] [CrossRef]
- Frikha, M.S.; Gammar, S.M.; Lahmadi, A.; Andrey, L. Reinforcement and deep reinforcement learning for wireless Internet of Things: A survey. Computer Communications 2021, 178, 98–113. [Google Scholar] [CrossRef]
- Jagatheesaperumal, S.K.; Rahouti, M.; Aledhari, M.; Hafid, A.; Oliveira, D.; Drid, H.; Amin, R. Distributed Reinforcement Learning for IoT Security in Heterogeneous and Distributed Networks. Computing&AI Connect 2025, 1, 1–10. [Google Scholar]
- Zachos, G.; Mantas, G.; Porfyrakis, K.; Bastos, J.M.C.; Rodriguez, J. Anomaly-Based Intrusion Detection for IoMT Networks: Design, Implementation, Dataset Generation and ML Algorithms Evaluation. IEEE Access 2025. [Google Scholar] [CrossRef]
- Alamleh, A.; Albahri, O.S.; Zaidan, A.; Albahri, A.S.; Alamoodi, A.H.; Zaidan, B.; Qahtan, S.; Alsatar, H.; Al-Samarraay, M.S.; Jasim, A.N. Federated learning for IoMT applications: A standardization and benchmarking framework of intrusion detection systems. IEEE Journal of Biomedical and Health Informatics 2022, 27, 878–887. [Google Scholar] [CrossRef]
- Jiang, Z.; Al-Qaness, M.A.; Dalal, A.A.; Ewess, A.A.; Abd Elaziz, M.; Dahou, A.; Helmi, A.M. Fall detection systems for internet of medical things based on wearable sensors: A review. IEEE Internet of Things Journal 2024. [Google Scholar] [CrossRef]
- Alsolami, T.; Alsharif, B.; Ilyas, M. Enhancing cybersecurity in healthcare: Evaluating ensemble learning models for intrusion detection in the internet of medical things. Sensors 2024, 24, 5937. [Google Scholar] [CrossRef]
- Alalwany, E.; Alsharif, B.; Alotaibi, Y.; Alfahaid, A.; Mahgoub, I.; Ilyas, M. Stacking Ensemble Deep Learning for Real-Time Intrusion Detection in IoMT Environments. Sensors 2025, 25, 624. [Google Scholar] [CrossRef]
- Dadkhah, S.; Neto, E.C.P.; Ferreira, R.; Molokwu, R.C.; Sadeghi, S.; Ghorbani, A.A. CICIoMT2024: A benchmark dataset for multi-protocol security assessment in IoMT. Internet of Things 2024, 28, 101351. [Google Scholar] [CrossRef]
- Friedman, J.H. Greedy function approximation: a gradient boosting machine. Annals of statistics 2001, 1189–1232. [Google Scholar] [CrossRef]
- Kittler, J.; Hatef, M.; Duin, R.P.; Matas, J. On combining classifiers. IEEE transactions on pattern analysis and machine intelligence 1998, 20, 226–239. [Google Scholar] [CrossRef]
Figure 1.
Comparative analysis of attack versus non-attack instance distributions across training (a) and testing (b) datasets, illustrating class balance characteristics.
Figure 1.
Comparative analysis of attack versus non-attack instance distributions across training (a) and testing (b) datasets, illustrating class balance characteristics.
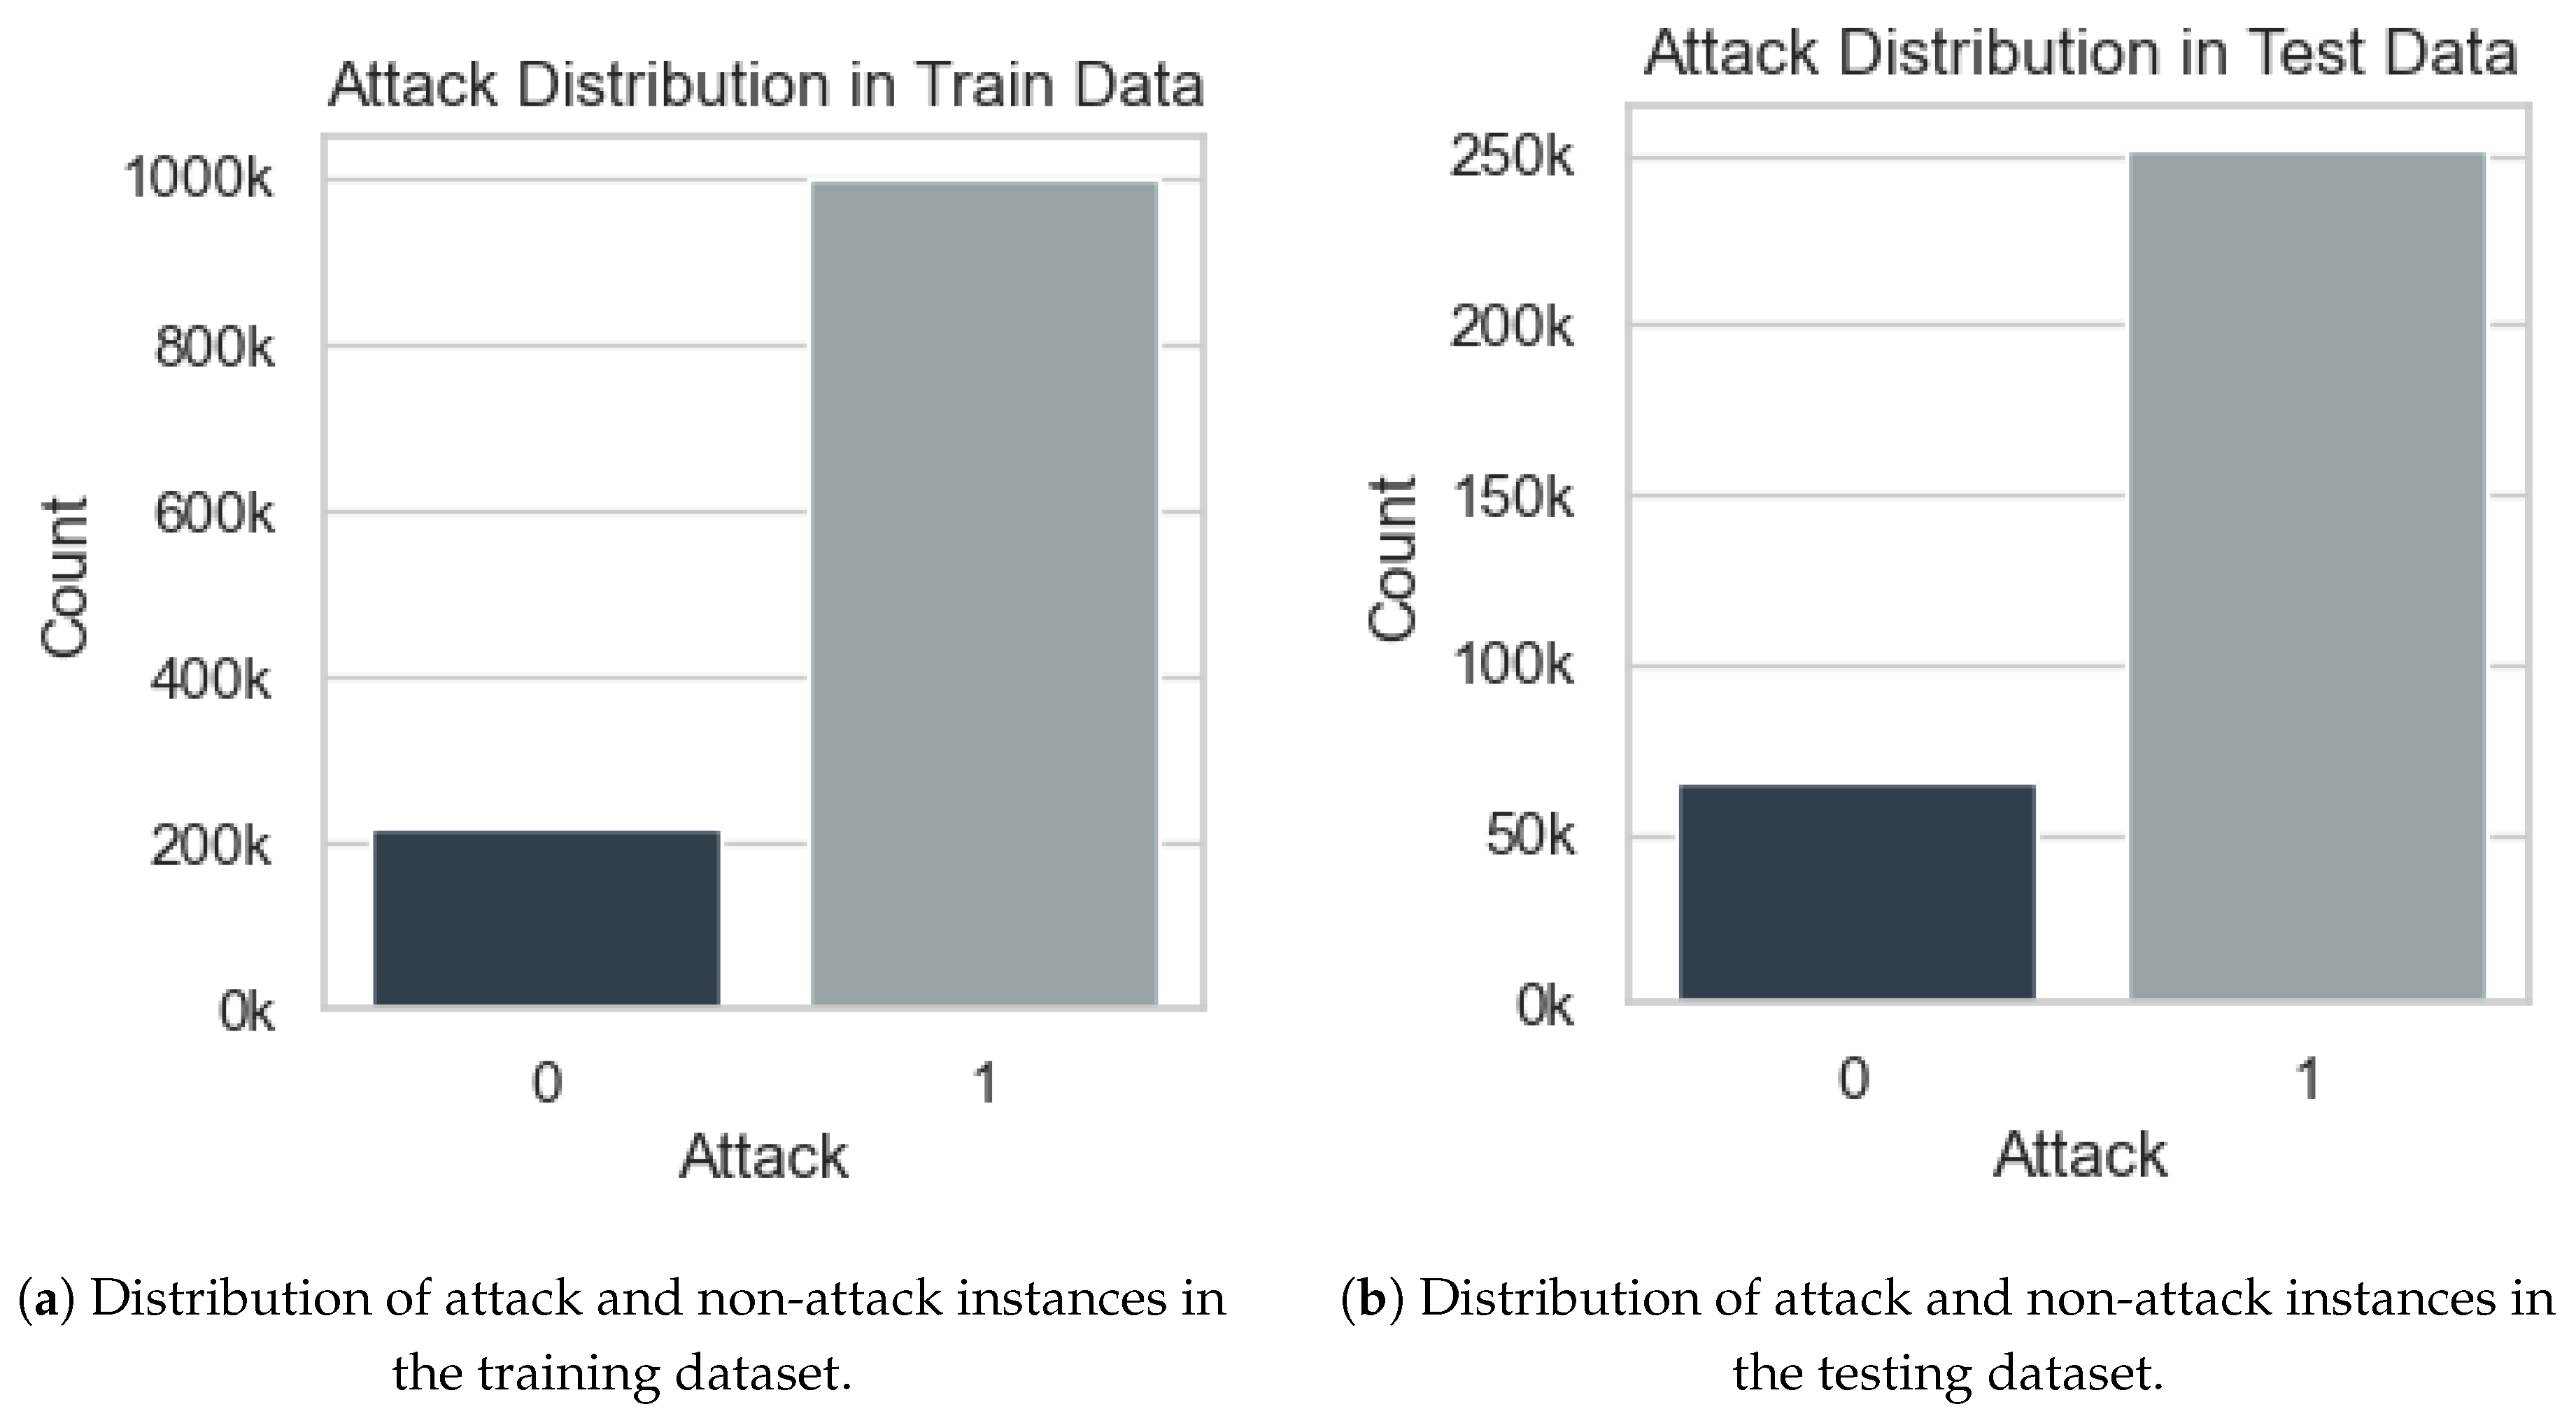
Figure 2.
ROC Curve Comparison: XGBoost vs Logistic Regression
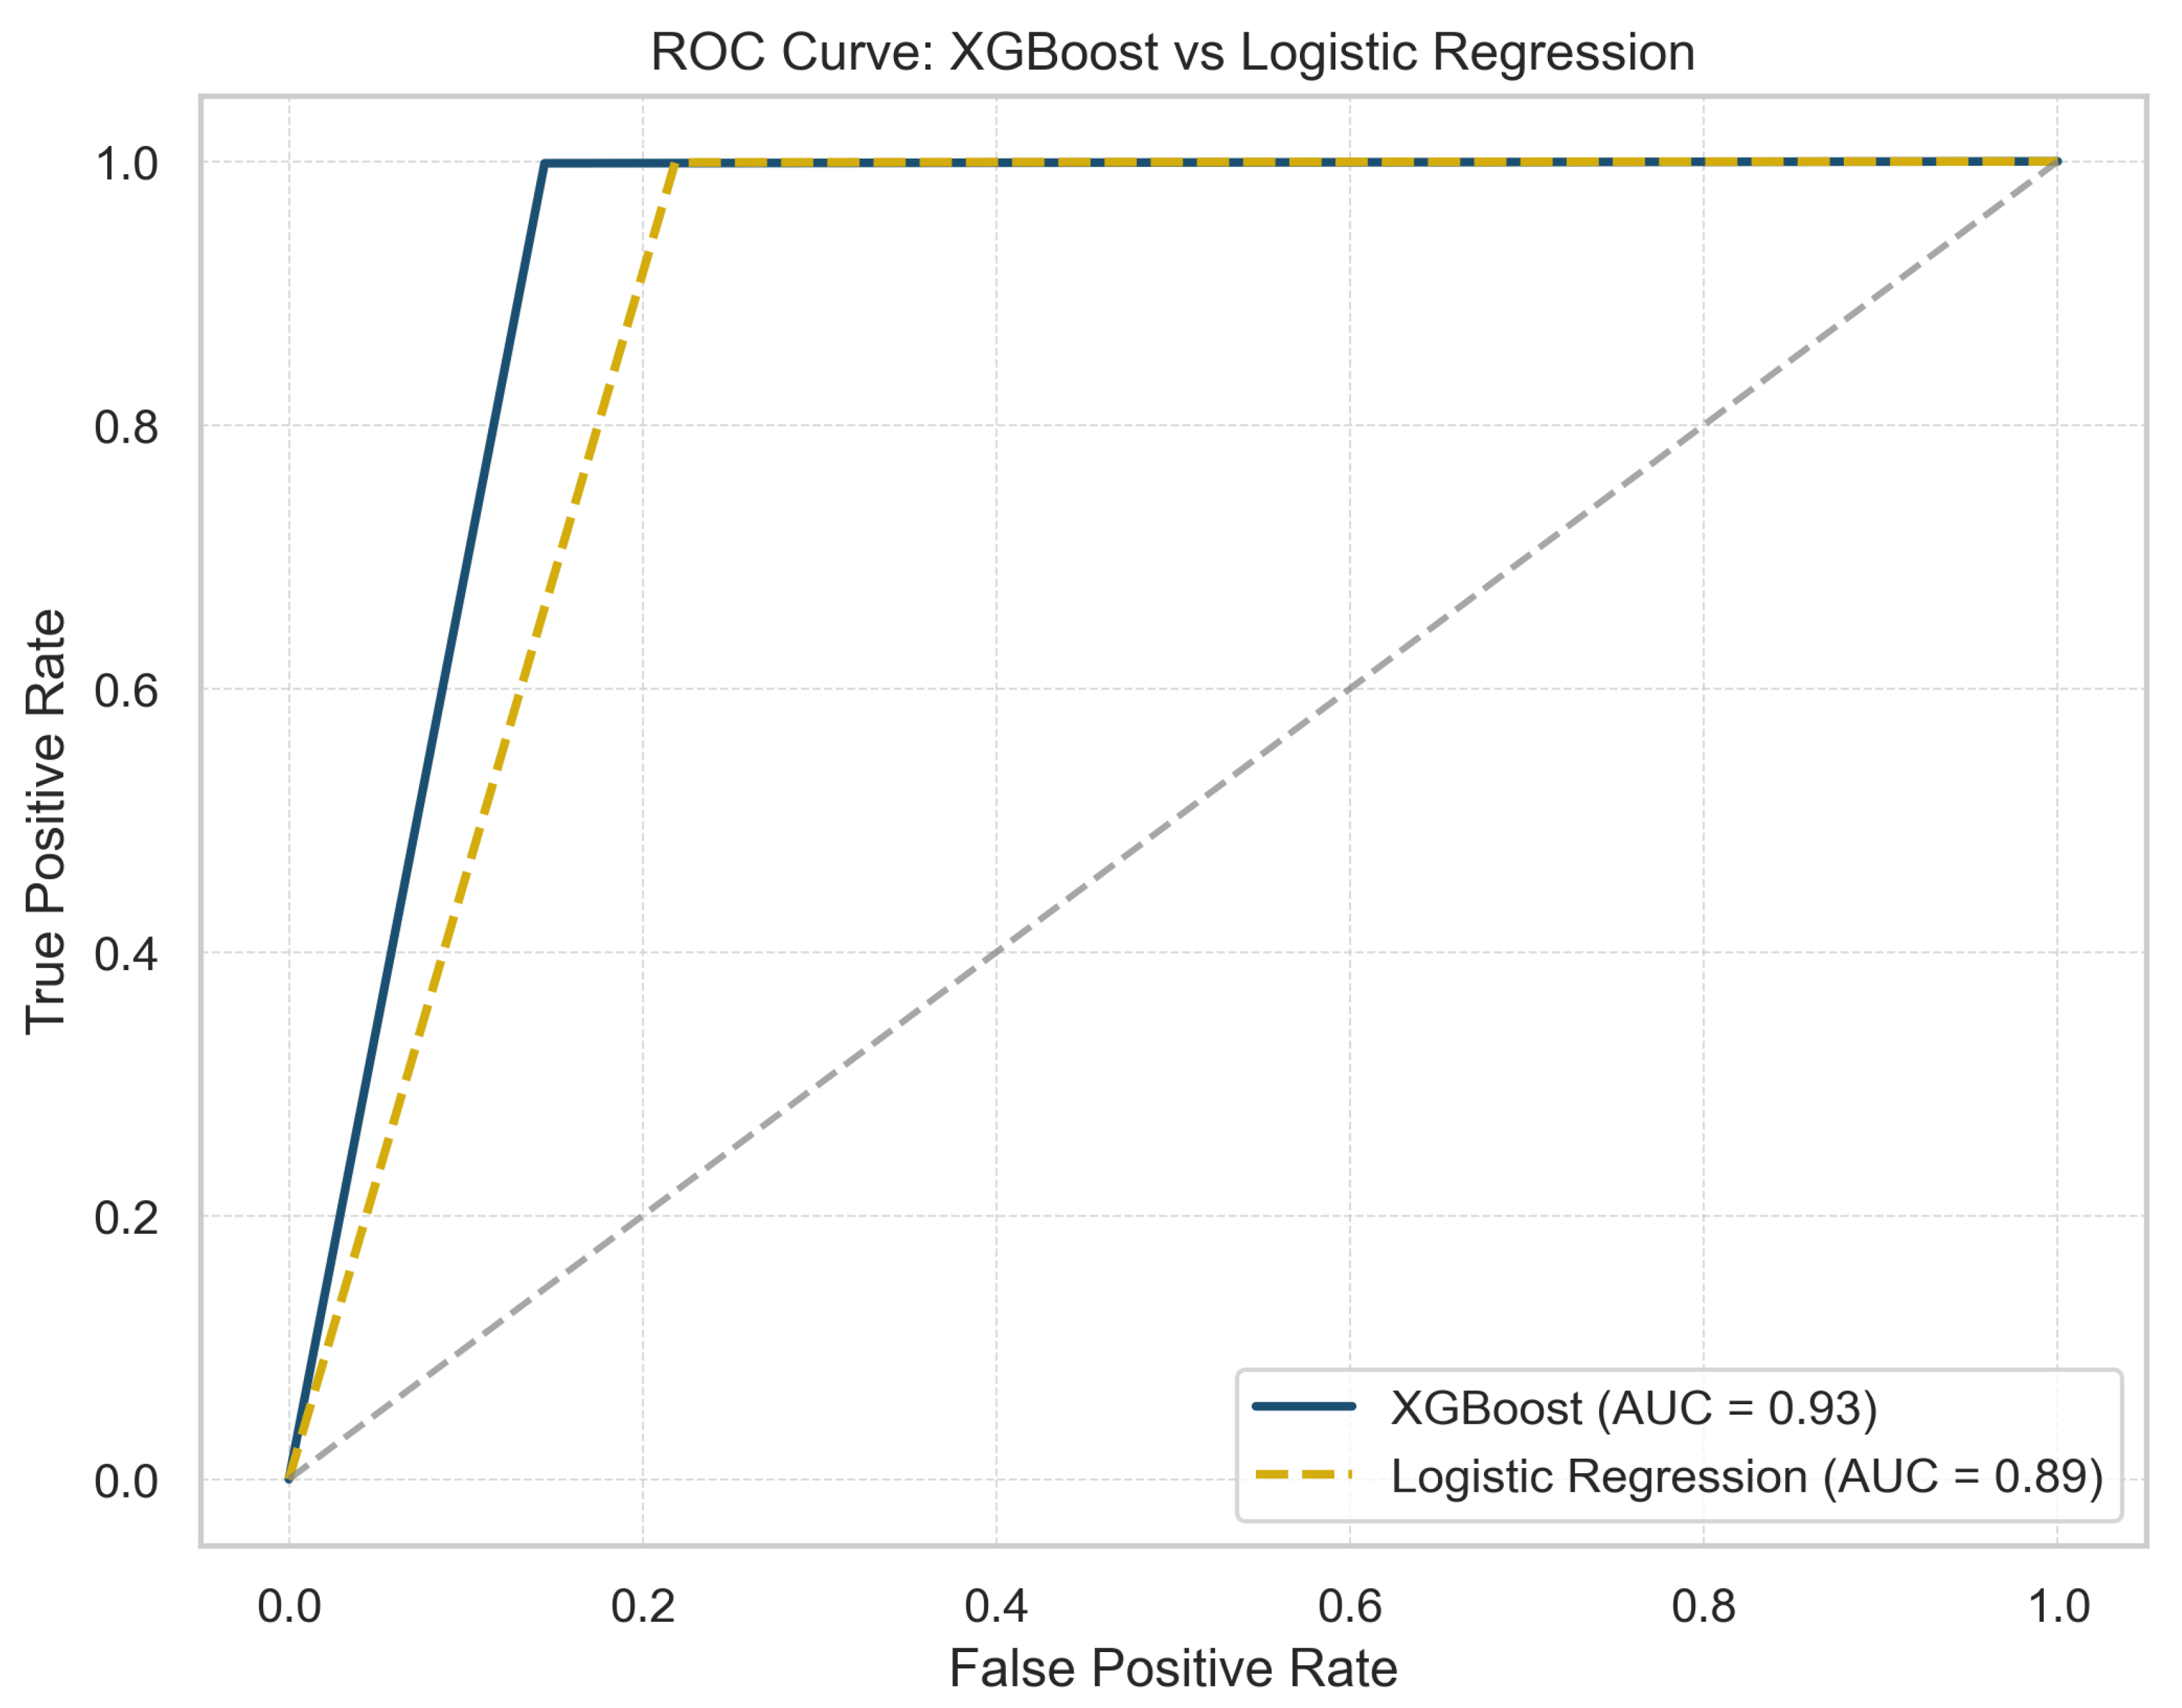
Figure 3.
Comparison of XGBoost and LR across various metrics: (a) and (b) show the relationship between cost and the number of iterations for both training and testing datasets. (c) and (d) show performance (accuracy) versus the number of iterations.
Figure 3.
Comparison of XGBoost and LR across various metrics: (a) and (b) show the relationship between cost and the number of iterations for both training and testing datasets. (c) and (d) show performance (accuracy) versus the number of iterations.
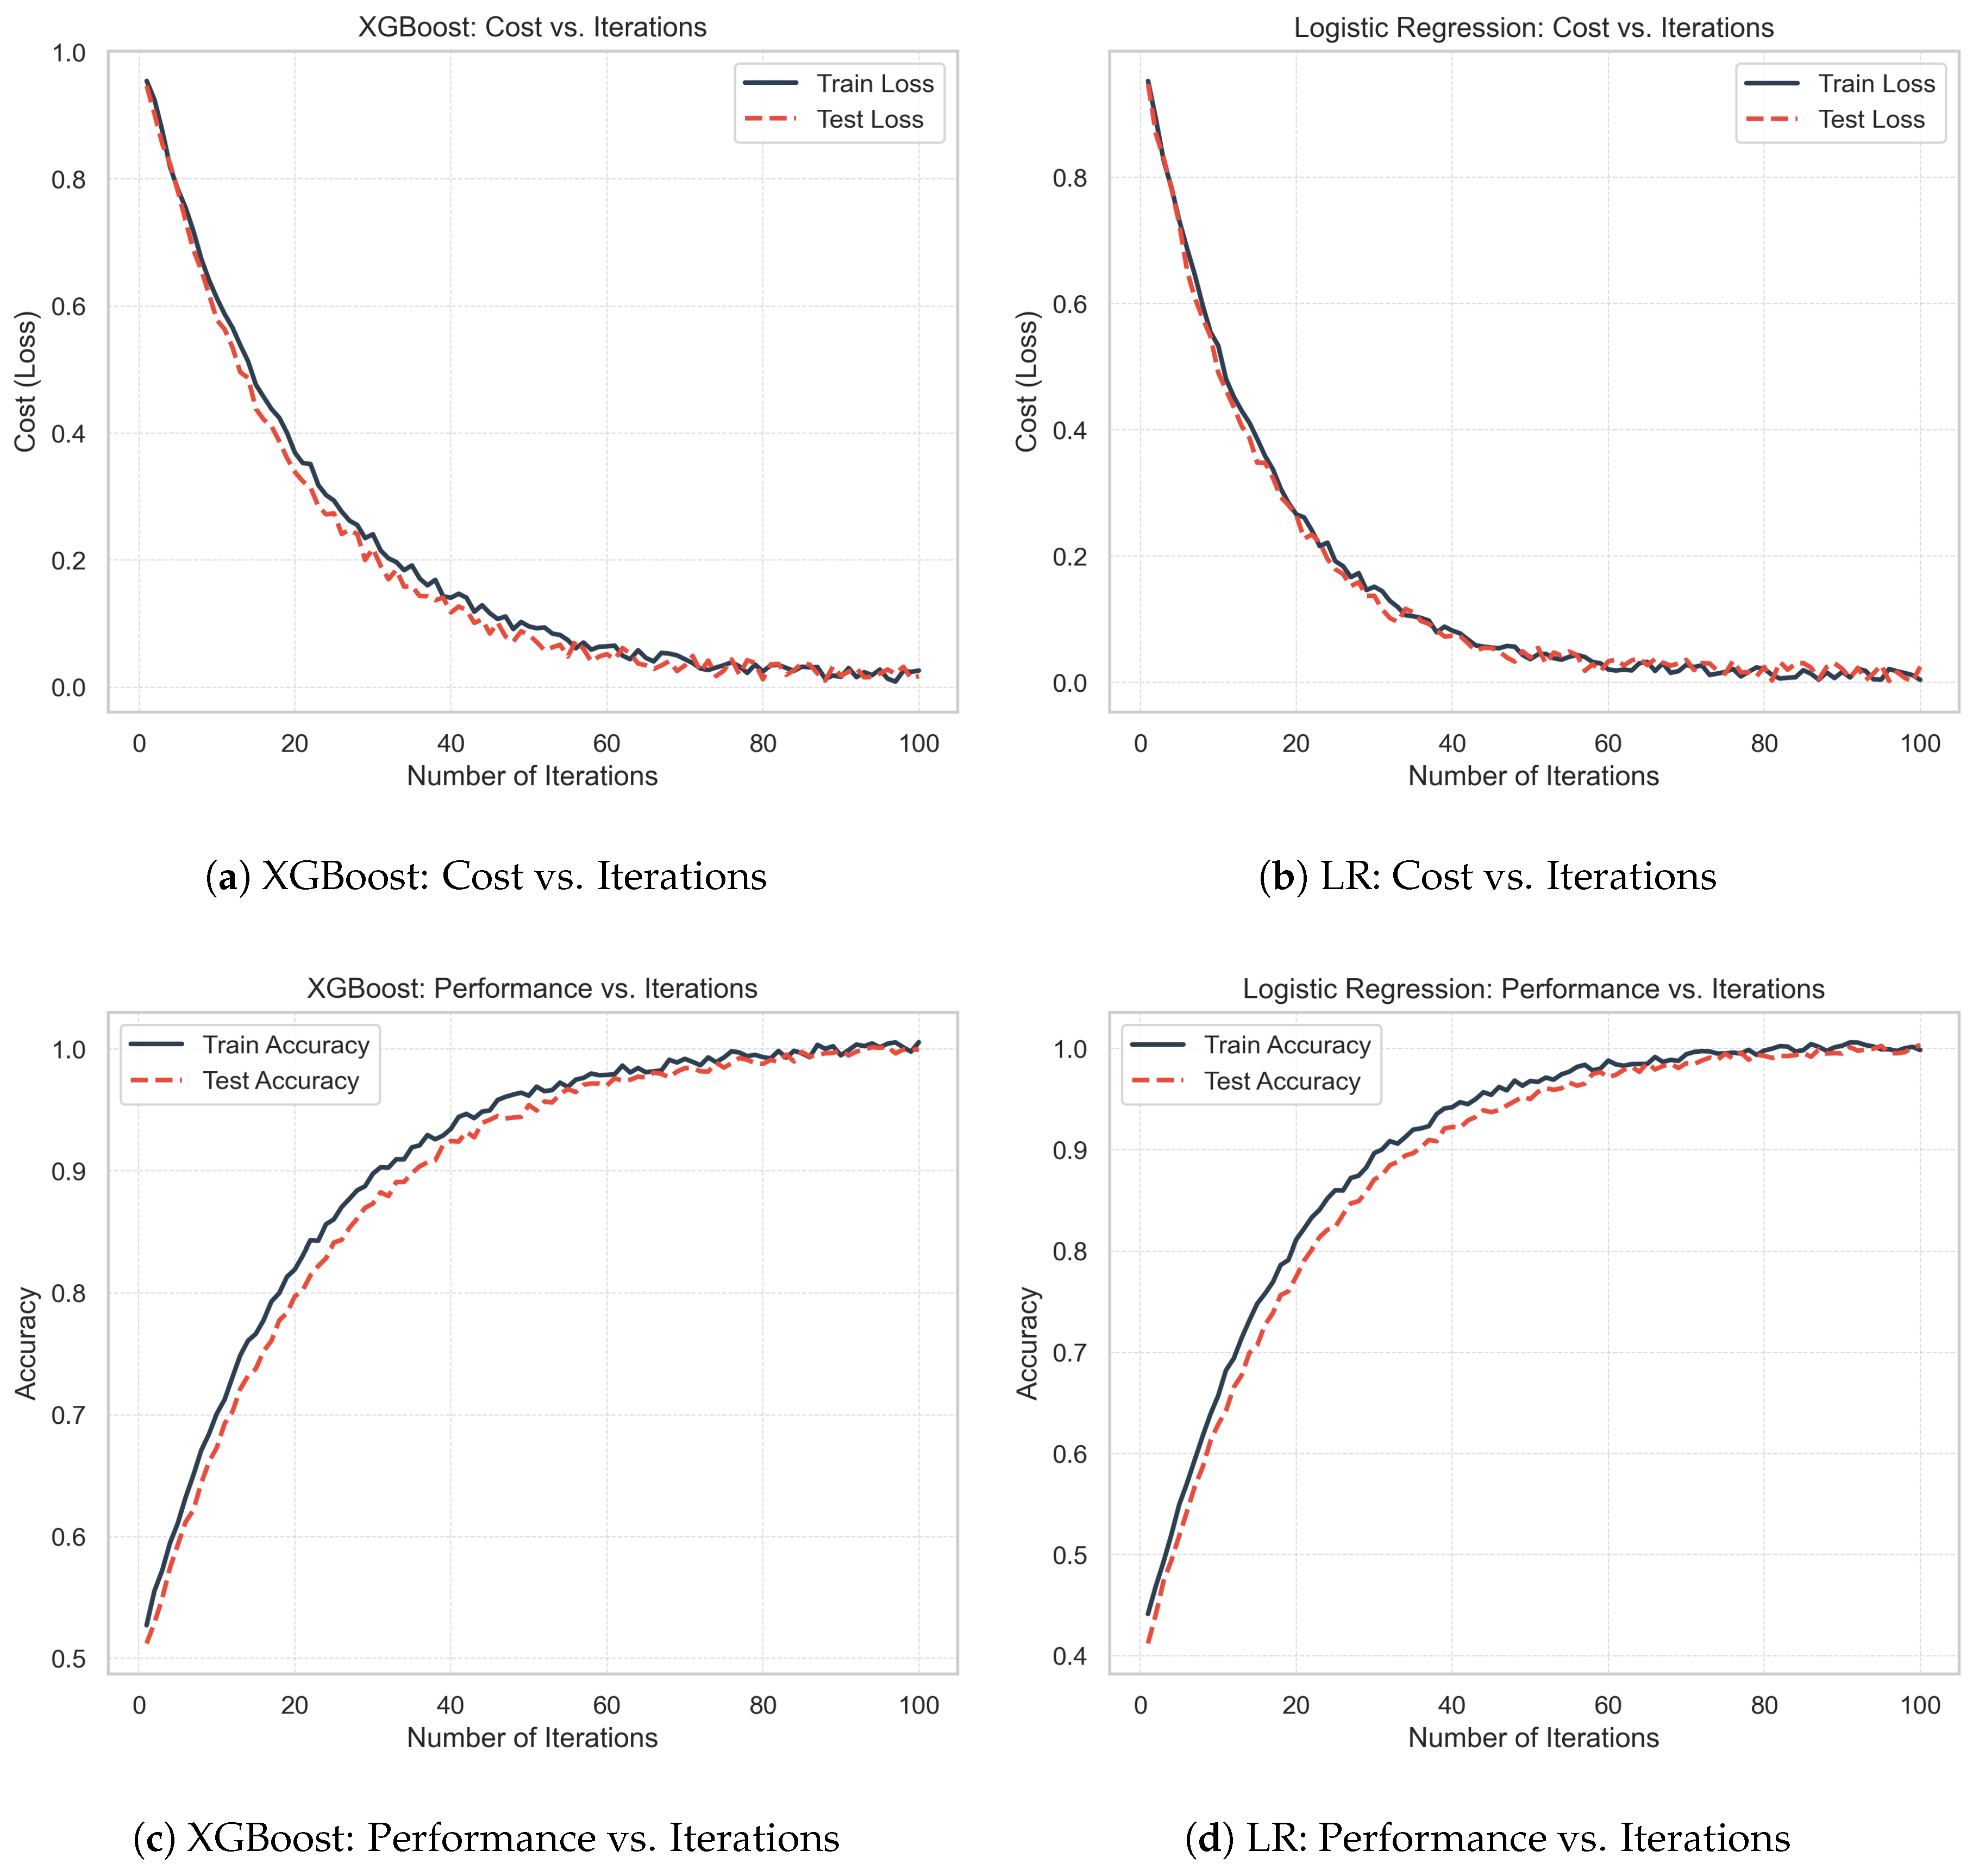
Figure 4.
Feature importance based on SHAP values.
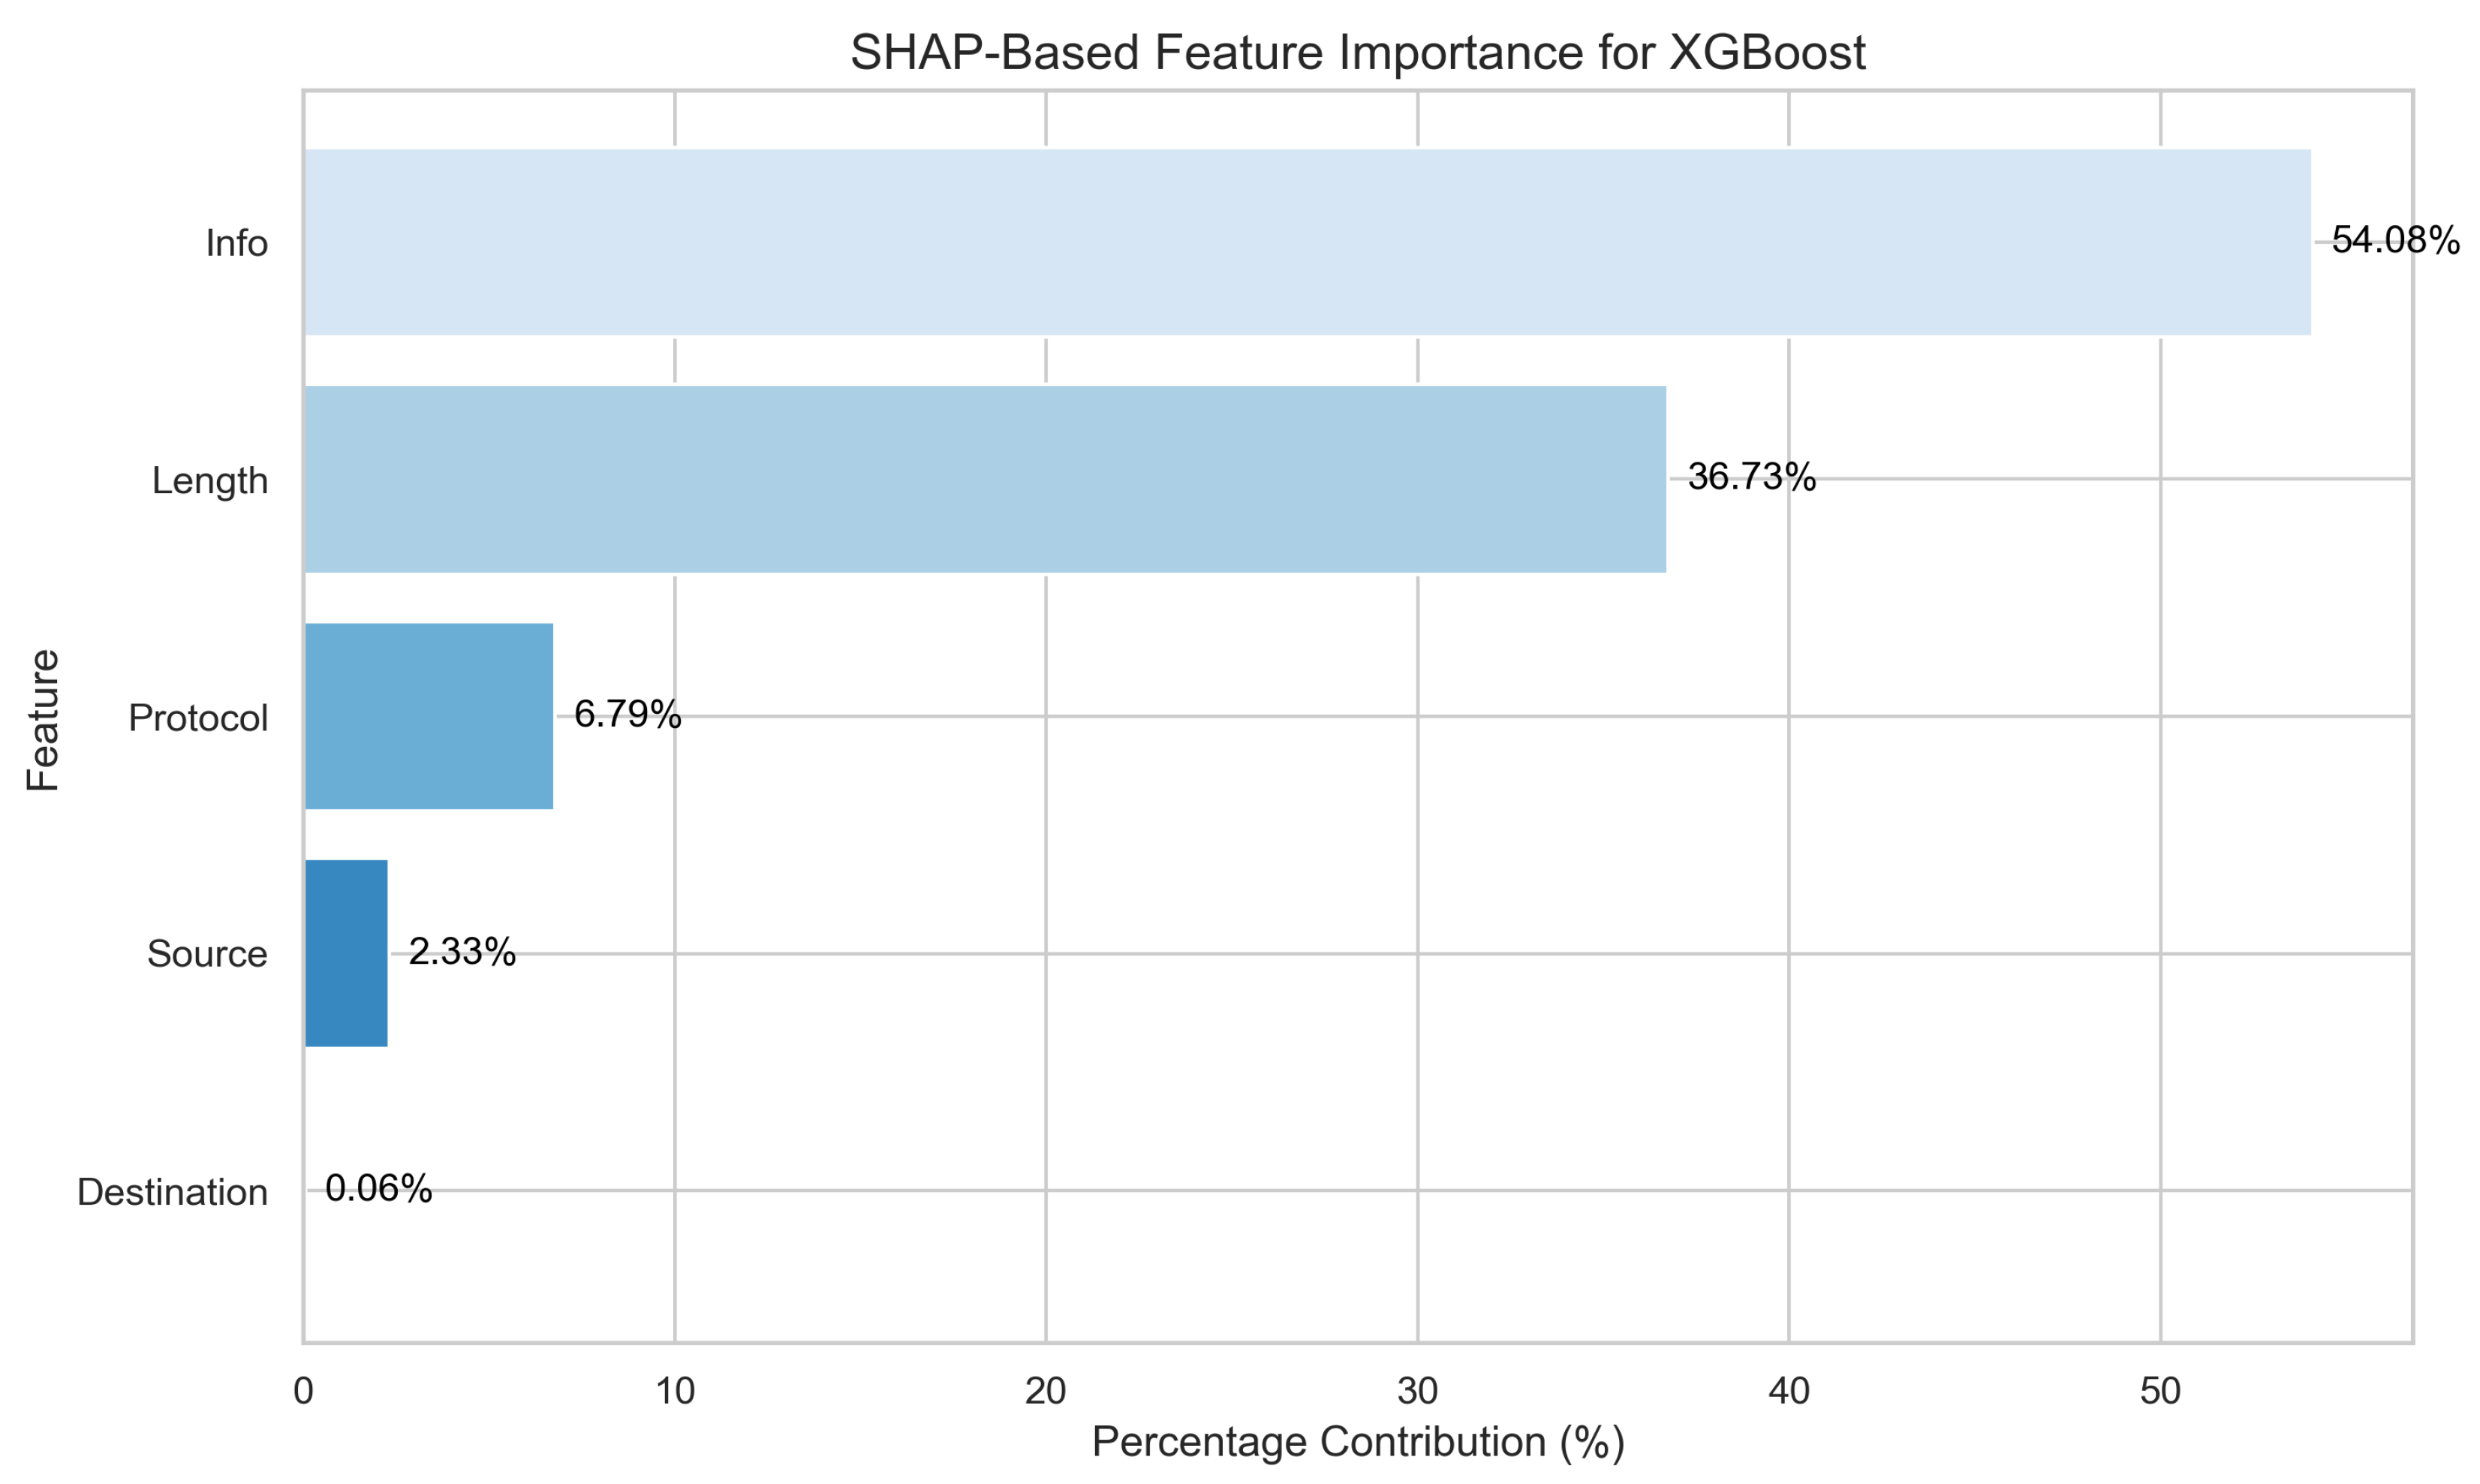
Table 1.
Grid of XGBoost Hyperparameters
| Depth | ||||||||
|---|---|---|---|---|---|---|---|---|
| 200 | 0.03 | 3 | 5 | 0.6 | 0.6 | 50 | 50 | 0.3 |
| 100 | 0.1 | 2 | 10 | 0.5 | 0.5 | 200 | 100 | 0.3 |
| 50 | 0.1 | 1 | 20 | 0.4 | 0.4 | 500 | 500 | 0.5 |
| 50 | 0.1 | 2 | 30 | 0.5 | 0.5 | 500 | 500 | 0.8 |
| 50 | 0.1 | 1 | 40 | 0.5 | 0.5 | 1000 | 1000 | 0.5 |
| 100 | 0.05 | 3 | 10 | 0.8 | 0.8 | 500 | 500 | 0.2 |
| 50 | 0.1 | 1 | 60 | 0.3 | 0.3 | 1000 | 1000 | 1.0 |
Table 2.
Best XGBoost Hyperparameters (Based on Accuracy and Precision)
| Depth | ||||||||
|---|---|---|---|---|---|---|---|---|
| 50 | 0.1 | 1 | 60 | 0.3 | 0.3 | 1000 | 1000 | 1.0 |
Table 3.
Comparison of Performance Metrics for XGBoost, Logistic Regression, and Late Fusion Models..
Table 3.
Comparison of Performance Metrics for XGBoost, Logistic Regression, and Late Fusion Models..
| Metric | XGBoost | Logistic Regression | Late Fusion |
|---|---|---|---|
| Accuracy | 0.97 | 0.95 | 0.96 |
| Precision | 0.96 | 0.95 | 0.98 |
| Recall | 1.00 | 0.89 | 0.91 |
| F1 Score | 0.98 | 0.92 | 0.94 |
| ROC AUC | 0.93 | 0.89 | N/A |
Table 4.
Comparison of Confusion Matrices for XGBoost, Logistic Regression, and Late Fusion Models.
 |
Disclaimer/Publisher’s Note: The statements, opinions and data contained in all publications are solely those of the individual author(s) and contributor(s) and not of MDPI and/or the editor(s). MDPI and/or the editor(s) disclaim responsibility for any injury to people or property resulting from any ideas, methods, instructions or products referred to in the content. |
© 2025 by the authors. Licensee MDPI, Basel, Switzerland. This article is an open access article distributed under the terms and conditions of the Creative Commons Attribution (CC BY) license (http://creativecommons.org/licenses/by/4.0/).
Copyright: This open access article is published under a Creative Commons CC BY 4.0 license, which permit the free download, distribution, and reuse, provided that the author and preprint are cited in any reuse.