Submitted:
13 April 2025
Posted:
14 April 2025
You are already at the latest version
Abstract
This study proposes a deep learning-driven stock market sentiment analysis and prediction framework based on the fusion model of convolutional neural network (CNN) and long short-term memory network (LSTM). Natural language processing (NLP) technology is used to extract the sentiment features of financial news and social media texts, and a high-dimensional feature space is constructed by combining the market transaction data.CNN is responsible for local feature extraction, and LSTM is used for time-series modeling to realize the accurate prediction of market sentiment. Experimental results show that the model outperforms a single deep learning model in terms of mean square error (MSE), coefficient of determination ( ) and F1-score, which proves the effectiveness of the fusion method. The research results provide scientific support for financial market prediction and investment decision-making.
Keywords:
Computer systems organization
; Embedded and cyber-physical systems
; System on a chip
1. Introduction
As the core of the financial market, the stock market fluctuations are affected by multiple factors such as macroeconomics, policy regulation and market sentiment. In recent years, the role of investor sentiment in stock market prediction has become more and more prominent, and accurate portrayal of market sentiment is of great significance in improving prediction accuracy. Traditional financial models are difficult to effectively quantify market sentiment, while deep learning technology provides a new solution for sentiment-driven stock market prediction by virtue of its powerful feature extraction capability. Convolutional neural networks (CNNs) excel in pattern recognition and feature extraction, while long-short-term memory networks (LSTMs) are able to effectively capture the long-term dependence of time series data.
2. Stock Market Sentiment Data Acquisition and Preprocessing
2.1. Data Collection Methods
The acquisition of stock market sentiment data is a key link in constructing sentiment analysis and prediction models, and the main sources include unstructured data such as news text, social media, financial forums and investor comments, as well as market behavior data such as trading volume and volatility [1]. Web crawler technology (e.g., Scrapy or BeautifulSoup) is utilized to regularly crawl text data on mainstream financial websites, stock forums (e.g., Snowball, Oriental Wealth) and social media (e.g., Weibo, Twitter), and organize them with timestamps to ensure the temporal order and integrity of the data. Application Program Interface (API) such as Alpha Vantage, Tushare are used to obtain historical trading data to ensure the authority and usability of the data. To quantify stock market sentiment, textual sentiment analysis methods can be introduced. The sentiment polarity score is set to calculate the sentiment index, where the sentiment score of the text is calculated by the pre-trained word vector model (e.g. Word2Vec, BERT) and the overall market sentiment is obtained by the weighted average method:
where N is the total number of texts, wi represents the text weights, and f(Ti)represents the sentiment score of text i. To enhance the accuracy of the data, a multi-source data fusion strategy is introduced to ensure that the input data meets the learning requirements of the convolutional neural network by correlating the transaction data with the textual sentiment data and normalizing the data by a time window T.
2.2. Emotion Feature Extraction
Sentiment feature extraction is the core aspect of constructing stock market sentiment analysis model, and its key lies in mining effective sentiment information from unstructured text data and constructing high-dimensional feature representation by combining market behavior data [2]. Based on natural language processing (NLP) technology, the text data are subjected to segmentation, de-duplication and lexical annotation, and pre-trained word vector models (e.g., Word2Vec, BERT) are used to map the text to a high-dimensional vector space in order to obtain the semantic information of the vocabulary. The word vector representation of the text T is set as , which is calculated as follows:
where is the word vector of the ith word and N is the number of words in the text. To further enhance the
expression of sentiment features, a combination of sentiment lexicon (e.g.,
Loughran-McDonald Financial Sentiment Dictionary) and deep learning methods are
used to analyze the text for sentiment polarity, calculate the positive
sentiment score and negative sentiment score , and define the market sentiment index:
The index can effectively measure the fluctuating trend of market sentiment. The Long Short-Term Memory (LSTM) network or attention mechanism is introduced to extract sequential sentiment features to improve the ability of capturing sentiment changes [3]. The extracted textual sentiment features are fused with market behavior data to provide high quality inputs to the convolutional neural network model.Market features include daily open/close prices, high/low prices, trading volume, turnover rate, and volatility index, which are aligned temporally with sentiment data to form a unified feature space.
2.3. Data Pre-Processing Techniques
Data preprocessing is an important step to improve the stability and generalization ability of convolutional neural network (CNN) model training, which mainly includes text data cleaning, feature normalization, time series alignment and dimension reduction processing. First, the collected text data are normalized, including the removal of HTML tags, special symbols, deactivated words, and the reduction of lexical redundancy by using stemming (Stemming) and lemma reduction (Lemmatization) [4]. For sentiment word vector representation, pre-trained models (e.g., Word2Vec, GloVe) are used for text vectorization to convert unstructured text into high-dimensional numerical features. Let the text T consist of N words, and its embedding representation is:
where is a d-dimensional word vector to ensure that the model can effectively capture semantic information. The market sentiment data is normalized to eliminate the effect of magnitude. Let the original sentiment index sequence be , then min-max normalization is applied:
where and are
the maximum and minimum values of the sequence, respectively. This treatment
ensures that the data are between [0,1] and
improves the numerical stability of the model. To ensure the temporal
consistency of text data and market data, a sliding window mechanism is used
for time series alignment, defining a time window W to aggregate data at a
fixed interval Δt, which is formally
represented as:
Principal Component Analysis (PCA) or Autoencoder is used for feature dimensionality reduction to remove redundant information and improve computational efficiency. After the above processing, the resulting data can be better adapted to CNN model training and improve the accuracy and stability of prediction [5].
3. Convolutional Neural Network Model Design
3.1. Network Architecture
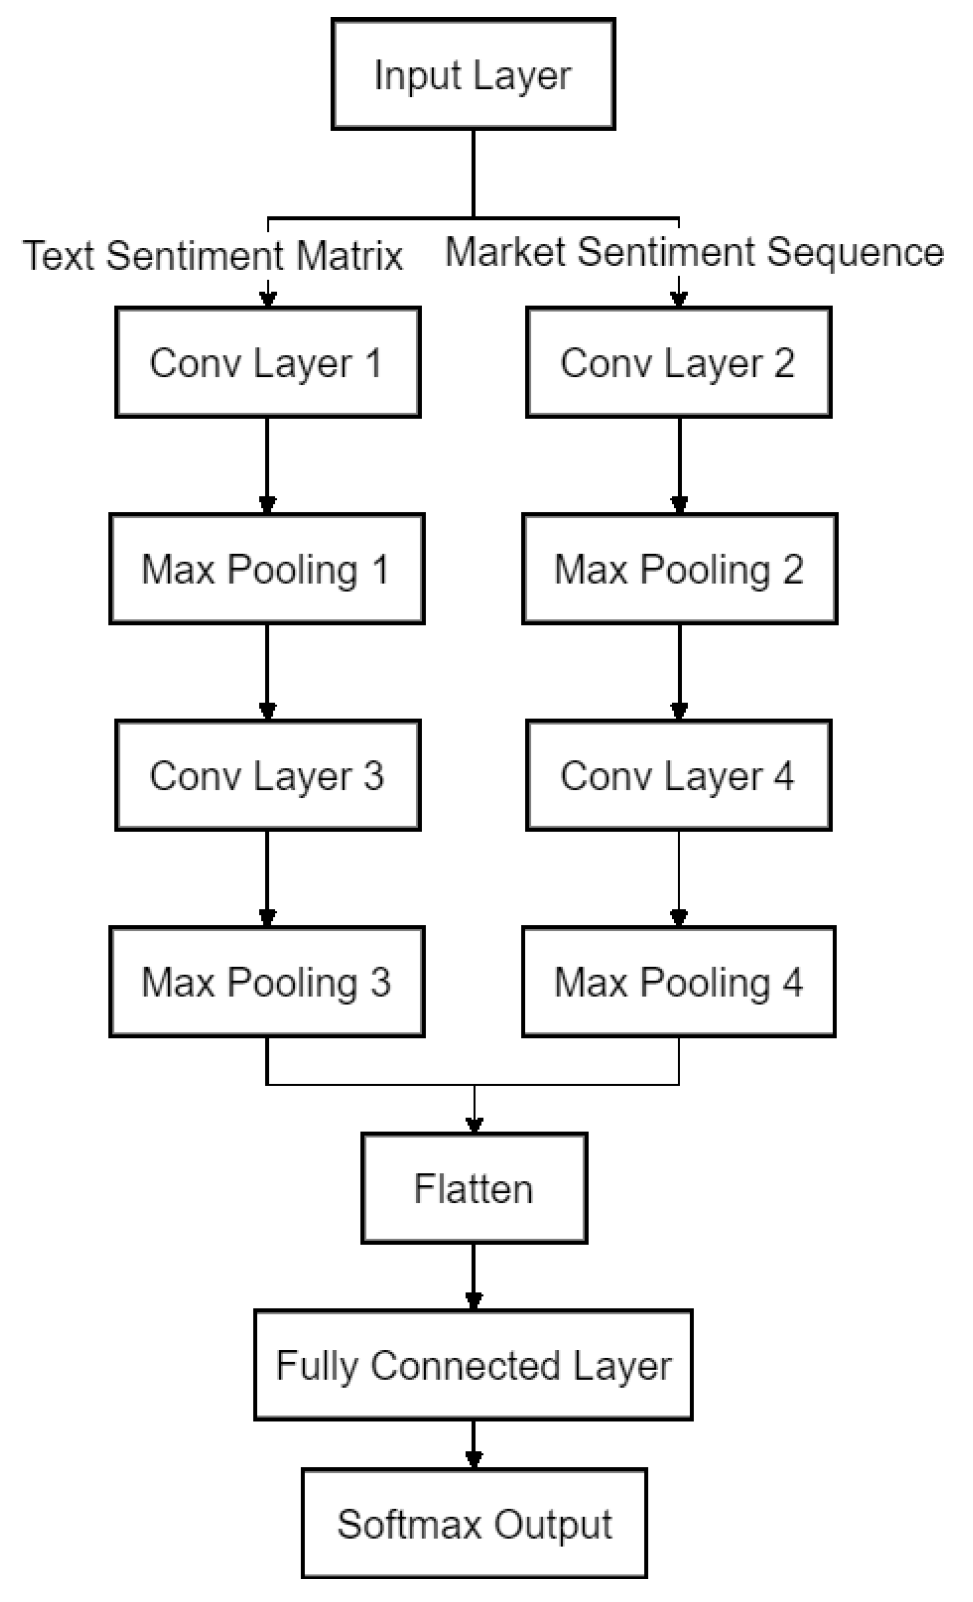
Convolutional neural networks (CNNs) have excellent feature extraction capabilities in stock market sentiment analysis and prediction, and their hierarchical structure can effectively capture local patterns and temporal features of market sentiment [6]. In this study, we design a deep CNN model that fuses textual sentiment features and market data, and the overall architecture includes an input layer, a convolutional layer, a pooling layer, a fully connected layer, and an output layer. The input layer receives two types of data: first, the text sentiment feature matrix (where N is the text length and d is the word vector dimension); and second, the market sentiment time series (where T is the time window size). Subsequently, the convolutional layer performs local feature extraction with multiple one-dimensional convolutional kernels :
where k is the convolutional kernel size and f(⋅) is the ReLU activation function. The pooling layer adopts Max Pooling to reduce the computational complexity and enhance the feature expression ability at the same time. After multi-layer convolution and pooling, the fully-connected layer performs high-dimensional feature fusion and outputs the market sentiment prediction value through the Softmax activation function.
Figure 1.
Network Architecture Diagram.
3.2. Optimization of Model Parameters
In order to improve the prediction accuracy and generalization ability of convolutional neural network (CNN) in stock market sentiment analysis, this study optimizes the model in several aspects, such as hyperparameter adjustment, regularization strategy and optimization algorithm [7]. Convolutional kernel size (Kernel Size) directly affects the local sensory field of feature extraction, and different sizes (e.g., 3×3, 5×5, 7×7) of convolutional kernels are selected for comparison in the experiments, and the optimal configuration is finally selected. The number of channels (Filters) of the convolutional layer determines the expressive ability of the network, and a gradual increase in the number of channels (e.g., 32→64→128) is used to enhance the feature extraction ability of the model. To prevent the model from overfitting, L2 regularization (Weight Decay) and Dropout strategy are used. The Dropout ratio is set to 0.5 in the fully connected layer to randomly deactivate some neurons, thus enhancing the generalization ability of the model [8]. In addition, Batch Normalization is applied after each convolutional layer to stabilize the gradient update and improve the convergence speed.Hyperparameter tuning is performed using grid search and random search techniques on parameters such as learning rate (0.001–0.01), dropout rate (0.3–0.6), batch size (32–128), and number of LSTM units (50–200). The best configuration was selected based on validation loss.
In terms of optimization algorithm selection, the comparison experiments include SGD (Stochastic Gradient Descent), Adam (Adaptive Moment Estimation) and RMSprop optimizers, and the results show that Adam has faster convergence in this task and can obtain a better solution in a shorter time [9]. Dynamic Learning Rate Scheduling (DLS) is used to set a large learning rate (e.g., 0.001) at the beginning of the training period and gradually decay it during the training process to avoid local optimal traps. Figure 2 shows the effect of different optimization strategies on model convergence, in which the model with Adam optimization with Dropout and Batch Normalization has the fastest convergence speed and the lowest final loss value, indicating that the optimization strategy effectively improves the model performance.
3.3. Deep Learning Algorithm Selection
In the task of stock market sentiment analysis and prediction, the selection of deep learning algorithms directly affects the feature extraction ability and prediction accuracy of the model. This study mainly compares convolutional neural network (CNN), long short-term memory network (LSTM) and fusion model (CNN-LSTM), and selects the optimal algorithm by combining with the experimental results.CNN has strong local feature extraction ability, and is able to extract the local patterns in the sentiment text and the time-series features of the market sentiment data through the convolutional kernel. Let the input data be X. The convolution operation is defined as follows:
where W is the convolutional kernel, b is the bias term, and f(⋅) is the ReLU activation function. Although CNN has advantages in spatial feature extraction, it is weakly dependent on long time series. In contrast, LSTM overcomes the gradient vanishing problem of RNN through gating mechanisms (forgetting gate, input gate, output gate) and is more suitable for processing time series sentiment data.The state update of LSTM is as follows:
Where and are the weights
of the forgetting gate and the input gate, respectively, and is the current cell state. LSTM can effectively capture the long-term dependence of market sentiment, but the computational complexity is high. In order to integrate the feature extraction capability of CNN and the time-series modeling capability of LSTM, this study adopts a combined CNN-LSTM model, i.e., CNN is used to extract local pattern features first, and then LSTM is used for time-series dependency modeling [10 ]. This method has optimal performance in the stock market sentiment prediction task, combining computational efficiency and prediction accuracy.CNN is primarily responsible for identifying local textual sentiment patterns and short-term fluctuations in market metrics, while LSTM captures long-range dependencies and temporal trends, such as delayed sentiment effects on price movements. This division of labor enhances both local precision and temporal continuity in predictions.
4. Experiments in Stock Market Sentiment Analysis and Forecasting
4.1. Experimental Data Set
This study constructs an experimental dataset for stock market sentiment analysis and prediction based on a multi-source data fusion strategy, with data sources including mainstream financial websites, social media platforms and stock exchange market data. The dataset covers core features such as stock market index, trading volume, and market sentiment index, and the time span covers nearly five years to ensure the comprehensiveness and timeliness of the data. Text sentiment data is obtained through text mining of financial news, forum comments, etc., and natural language processing (NLP) technology is utilized to calculate text sentiment scores. Specifically, financial news articles were collected from Reuters, Bloomberg, and Yahoo Finance, while social media data were gathered using Twitter’s official API (filtered for stock-related hashtags) and the Chinese platform Snowball (Xueqiu). In total, over 100,000 financial texts and 300,000 social media posts were gathered over a 5-year period.The sentiment index uses a combination of the Loughran-McDonald Financial Sentiment Dictionary and the BERT pre-training model to calculate positive and negative market sentiment scores. The trading market data (e.g., stock index, volume, volatility, etc.) are obtained through financial data APIs such as Tushare and Wind to ensure the accuracy and authority of the data. The experimental dataset is cleaned, de-duplicated and normalized, resulting in a standardized data table that includes features such as date, stock index, trading volume, and market sentiment. Table 1 shows the experimental data, which is used to train and evaluate deep learning models to explore the impact of market sentiment on stock market volatility.
4.2. Evaluation Indicators
In order to comprehensively evaluate the performance of convolutional neural networks (CNNs) in stock market sentiment analysis and prediction tasks, this study selects key evaluation metrics from three dimensions of prediction accuracy, model stability, and computational efficiency, including mean square error (MSE), mean absolute error (MAE), coefficient of determination ( ), and F1-score.
- (1)
- Mean Square Error (MSE) measures the average squared error between the model's predicted value and the true value and is calculated as follows:Where, yi is the true value, is the model predicted value, and n is the number of samples. The smaller the MSE, the lower the model prediction error.
- (2)
- Mean Absolute Error (MAE) measures the average absolute error between the predicted value and the true value and is defined as follows:
Compared to MSE, MAE is insensitive to outliers and provides a more stable measure of the model's error level.
- (3)
- The coefficient of determination ( ) reflects the goodness of fit of the model, ranging from 0 to 1, and is calculated as follows:Where is the mean of the true values. The closer the value is to 1, the better the predictive ability of the model.
- (4)
- The F1-score combines the Precision and Recall of the prediction and is used to measure the performance of the sentiment categorization task and is calculated as follows:
The higher the F1-score, the better the classification effect of the model. Through the above multi-dimensional evaluation indexes, the prediction effect of the model can be comprehensively measured to ensure the reliability and stability of the stock market sentiment analysis model.
4.3. Analysis of Experimental Results
This study analyzes and predicts stock market sentiment data based on different deep learning models and quantitatively evaluates the experimental results. CNN, LSTM, CNN-LSTM and the benchmark model (linear regression) are selected for comparison to measure the performance of different models in the stock market sentiment prediction task. From the experimental results, the CNN-LSTM model performs the best in all evaluation metrics with MSE and MAE of 0.015 and 0.082, respectively, which are lower than those of CNN (0.025, 0.110 and LSTM (0.018, 0.095), indicating that CNN-LSTM combines the local feature extraction capability of CNN and the time-series modeling capability of LSTM, and has higher accuracy in the sentiment prediction task with higher accuracy. Meanwhile, its value reaches 0.92, which is significantly higher than that of the benchmark model (0.75), indicating that the model is able to fit stock market sentiment fluctuations more accurately.CNN-LSTM has the highest F1-score (0.87) on the sentiment classification task, which provides better classification performance compared to CNN (0.78) and LSTM (0.82).

Table 2.
Comparison table of experimental results.
| Model | MSE | MAE | Score | F1-score |
| CNN | 0.025 | 0.110 | 0.85 | 0.78 |
| LSTM | 0.018 | 0.095 | 0.89 | 0.82 |
| CNN-LSTM | 0.015 | 0.082 | 0.92 | 0.87 |
| Baseline (Linear Regression) | 0.045 | 0.150 | 0.75 | 0.65 |
CNN-LSTM performs optimally in stock market sentiment analysis and prediction tasks due to its combination of convolutional feature extraction and time-series modeling capabilities, which can effectively improve the ability to accurately capture market sentiment and the reliability of stock market trend prediction.Although this study focuses on CNN, LSTM, and their fusion, future work should consider comparisons with advanced transformer-based models such as BERT or FinBERT, which have demonstrated superior performance in capturing contextual language nuances. However, due to computational constraints and latency issues in real-time financial environments, the current study prioritizes lightweight architectures. Nevertheless, incorporating transformers into hybrid models remains a promising direction.
4.4. Model Performance Comparison
In order to comprehensively assess the practical application value of different models in the stock market sentiment analysis task, this study conducts a comparative analysis in four dimensions: training time, inference time, model parameter size and prediction accuracy. The experimental results show that the CNN-LSTM model has the highest prediction accuracy of 88.7%, which is significantly better than CNN (82.5%), LSTM (85.3%), and the benchmark model (75.1%). Due to the complex structure of CNN-LSTM, the training time is the longest (240s) and the inference time (9.1ms) is also higher than the other models, indicating a higher computational cost. Meanwhile, the parameter size of the model reaches 85MB, which is far more than that of CNN (45MB) and LSTM (60MB), but it is still in the acceptable range with guaranteed prediction accuracy. The benchmark model (linear regression) has the shortest training time (30s) and the lowest inference time (2.5ms), but its prediction accuracy is only 75.1%, which is not able to capture the stock market sentiment fluctuations effectively.CNN-LSTM has the optimal prediction ability for high-precision demand scenarios, whereas CNN and LSTM, as lightweight models, are suitable for scenarios with limited computational resources.
Table 3.
Comparison table of model performance.
| Model | Training Time (s) | Inference Time (ms) | Parameter Size (MB) | Accuracy (%) |
| CNN | 120 | 5.2 | 45.0 | 82.5 |
| LSTM | 180 | 7.8 | 60.0 | 85.3 |
| CNN-LSTM | 240 | 9.1 | 85.0 | 88.7 |
| Baseline (Linear Regression) | 30 | 2.5 | 1.2 | 75.1 |
Considering the model performance and computational overhead, CNN-LSTM performs best in the stock market sentiment analysis task and provides a high-precision solution for market sentiment prediction.
5. Conclusion
In this study, a convolutional neural network (CNN)-based stock market sentiment analysis and prediction model is constructed and combined with a long-short-term memory network (LSTM) to further optimize the temporal feature extraction capability. Through multi-source data fusion and deep learning methods, the results show that the CNN-LSTM model has optimal performance in the stock market sentiment prediction task, and it outperforms the single model of CNN and LSTM in terms of mean squared error (MSE), coefficient of determination ( ) and F1-score. The experimental data show that there is a significant correlation between market sentiment and stock market volatility, and the deep learning method can effectively mine market sentiment features and improve stock market prediction accuracy. Meanwhile, the comparative analysis of model performance shows that CNN-LSTM achieves a good balance between computational cost and prediction accuracy. Future research can further optimize the model structure by combining the attention mechanism and reinforcement learning to improve the real-time and stability of stock market sentiment prediction.
References
- Chen, K.; Zhao, S.; Jiang, G.; He, Y.; Li, H. The green innovation effect of the digital economy. Int. Rev. Econ. Finance 2025, 99. [Google Scholar] [CrossRef]
- Diao S, Huang S, Wan Y. Early detection of cervical adenocarcinoma using immunohistochemical staining patterns analyzed through computer vision technology[C]//The 1st International scientific and practical conference “Innovative scientific research: theory, methodology, practice”(–06, 2024) Boston, USA. International Science Group. 2024. 289 p. 2024: 256. 03 September.
- Diao S, Wan Y, Huang S, et al. Research on cancer prediction and identification based on multimodal medical image fusion[C]//Proceedings of the 2024 3rd International Symposium on Robotics, Artificial Intelligence and Information Engineering. 2024: 120-124.
- Gong C, Lin Y, Cao J, et al. Research on Enterprise Risk Decision Support System Optimization based on Ensemble Machine Learning[C]//Proceeding of the 2024 5th International Conference on Computer Science and Management Technology. 2024: 1003-1007.
- Gong C, Zhong Y, Zhao S, et al. Application of Machine Learning in Predicting Extreme Volatility in Financial Markets: Based on Unstructured Data[C]//The 1st International scientific and practical conference “Technologies for improving old methods, theories and hypotheses”(–10, 2025) Sofia, Bulgaria. International Science Group. 2025. 405 p. 2025: 47. 07 January.
- Huang S, Diao S, Wan Y, et al. Research on multi-agency collaboration medical images analysis and classification system based on federated learning[C]//Proceedings of the 2024 International Conference on Biomedicine and Intelligent Technology. 2024: 40-44.
- Huang S, Diao S, Zhao H, et al. The contribution of federated learning to AI development[C]//The 24th International scientific and practical conference “Technologies of scientists and implementation of modern methods”(–21, 2024) Copenhagen, Denmark. International Science Group. 2024. 431 p. 2024: 358. 18 June.
- Jian X, Zhao H, Yang H, et al. Self-Optimization of FDM 3D Printing Process Parameters Based on Machine Learning[C]//The 24th International scientific and practical conference “Technologies of scientists and implementation of modern methods”(–21, 2024) Copenhagen, Denmark. International Science Group. 2024. 431 p. 2024: 369. 18 June.
- Jiang, G.; Huang, S.; Zou, J. Impact of AI-Driven Data Visualization on User Experience in the Internet Sector. Sci. J. Technol. 2024, 6, 1–8. [Google Scholar] [CrossRef]
- Meng Q, Wang J, He J, et al. Research on Green Warehousing Logistics Site Selection Optimization and Path Planning based on Deep Learning[J]. 2025.
- Shimin L E I, Ke X U, Huang Y, et al. An Xgboost based system for financial fraud detection[C]//E3S Web of Conferences. EDP Sciences, 2020, 214: 02042.
- Shui H, Sha X, Chen B, et al. Stock weighted average price prediction based on feature engineering and Lightgbm model[C]//Proceedings of the 2024 International Conference on Digital Society and Artificial Intelligence. 2024: 336-340.
- Yang, J.; Tian, K.; Zhao, H.; Feng, Z.; Bourouis, S.; Dhahbi, S.; Khan, A.A.; Berrima, M.; Por, L.Y. Wastewater treatment monitoring: Fault detection in sensors using transductive learning and improved reinforcement learning. Expert Syst. Appl. 2024, 264. [Google Scholar] [CrossRef]
- Zhao, H.; Chen, Y.; Dang, B.; Jian, X. Research on Steel Production Scheduling Optimization based on Deep Learning. 2024 4th International Symposium on Artificial Intelligence and Intelligent Manufacturing (AIIM). LOCATION OF CONFERENCE, ChinaDATE OF CONFERENCE; pp. 813–816.
- Zhao S, Lu Y, Gong C, et al. Research on Labour Market Efficiency Evaluation Under Impact of Media News Based on Machine Learning and DMP Model[J]. 2025.
Figure 2.
Effect of different optimization strategies on model convergence.
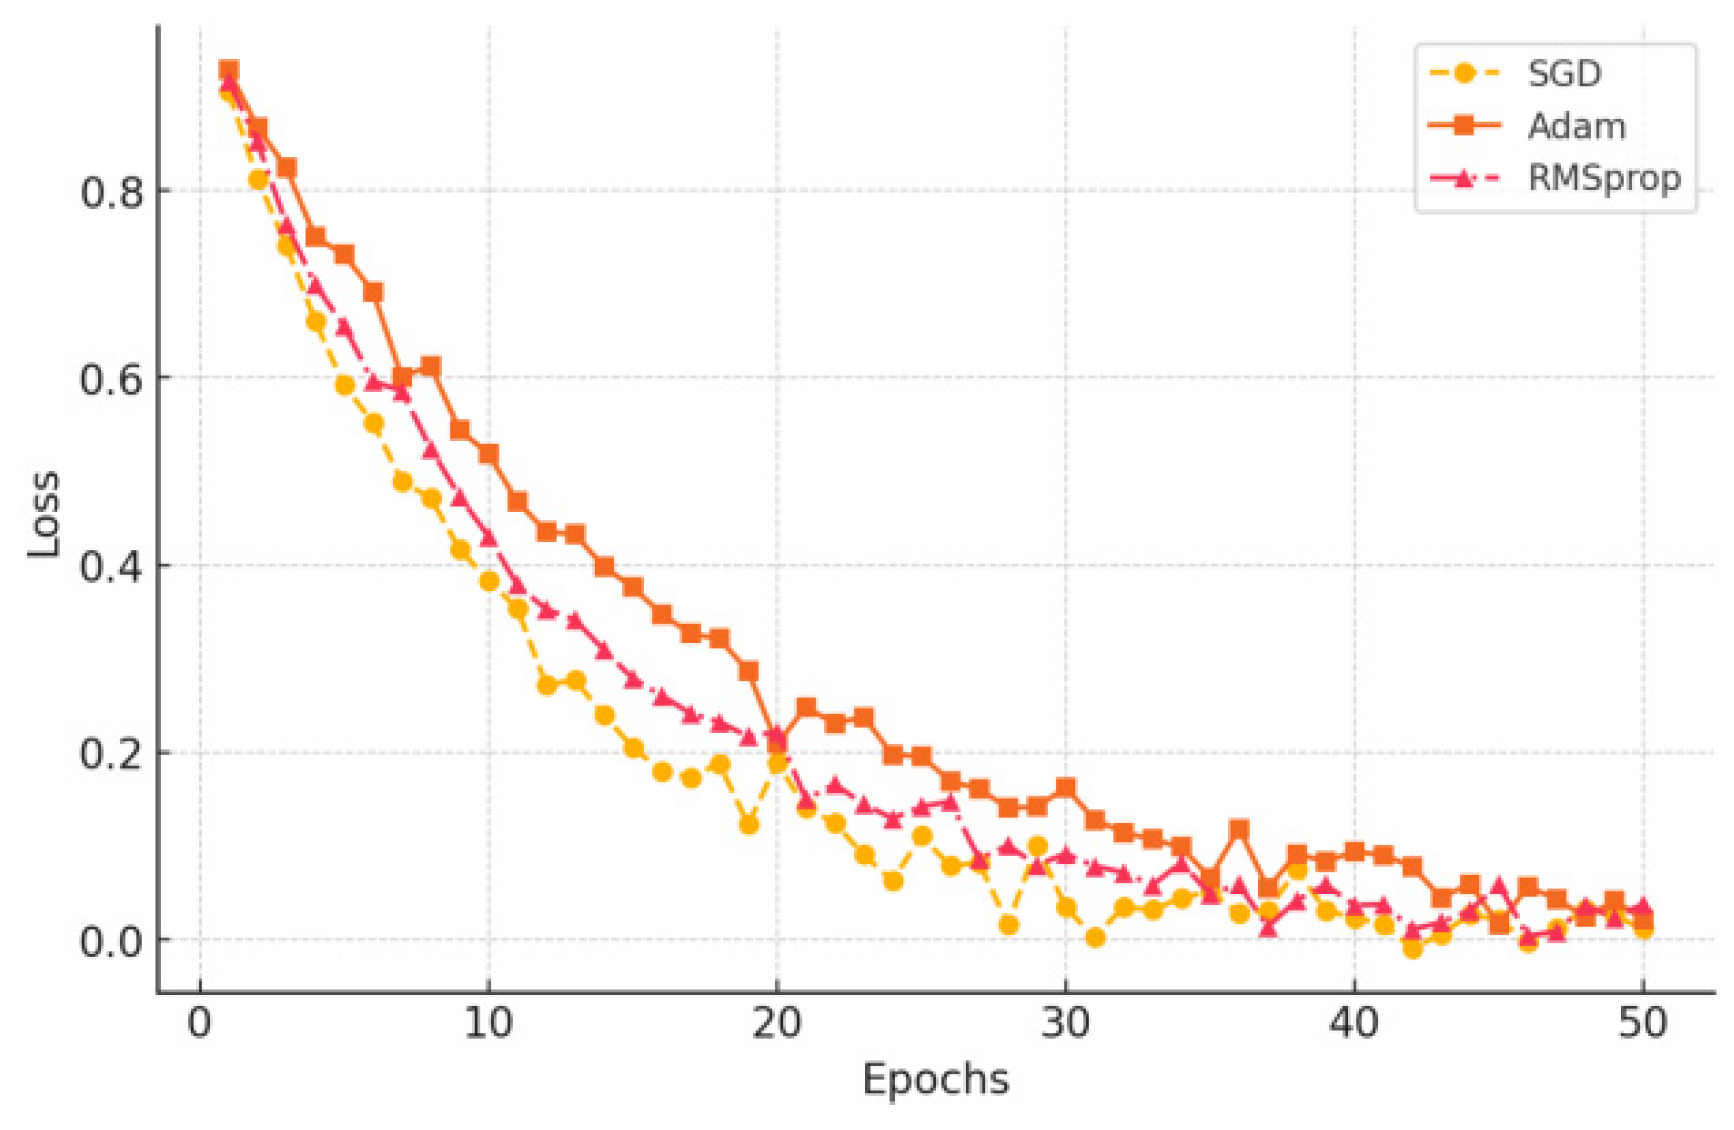
Table 1.
Experimental data set.
| Date | Stock Index | Trading Volume | Positive Sentiment | Negative Sentiment | Sentiment Index |
| 2024-01-01 | 3450.25 | 1.2 × 10⁹ | 0.65 | 0.30 | 0.35 |
| 2024-01-02 | 3482.10 | 1.35 × 10⁹ | 0.72 | 0.22 | 0.50 |
| 2024-01-03 | 3425.75 | 1.1 × 10⁹ | 0.60 | 0.35 | 0.25 |
| 2024-01-04 | 3501.30 | 1.5 × 10⁹ | 0.75 | 0.20 | 0.55 |
| 2024-01-05 | 3550.40 | 1.6 × 10⁹ | 0.80 | 0.15 | 0.65 |
Disclaimer/Publisher’s Note: The statements, opinions and data contained in all publications are solely those of the individual author(s) and contributor(s) and not of MDPI and/or the editor(s). MDPI and/or the editor(s) disclaim responsibility for any injury to people or property resulting from any ideas, methods, instructions or products referred to in the content. |
© 2025 by the authors. Licensee MDPI, Basel, Switzerland. This article is an open access article distributed under the terms and conditions of the Creative Commons Attribution (CC BY) license (http://creativecommons.org/licenses/by/4.0/).
Copyright: This open access article is published under a Creative Commons CC BY 4.0 license, which permit the free download, distribution, and reuse, provided that the author and preprint are cited in any reuse.


