Submitted:
08 April 2025
Posted:
08 April 2025
You are already at the latest version
Abstract
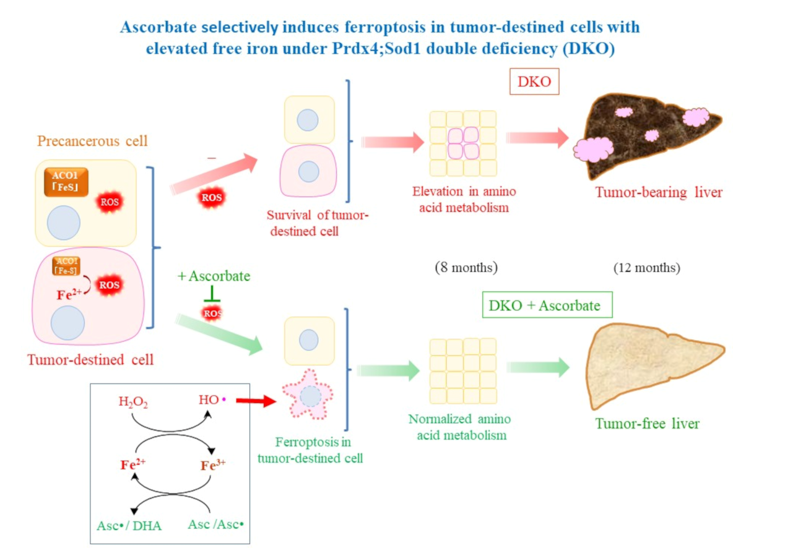
Oxidative stress as well as endoplasmic reticulum (ER) stress are the major underlying factors that promote non-alcoholic steatohepatitis (NASH), which eventually leads to hepatocarcinogenesis. Knockout (KO) of superoxide dismutase 1 (Sod1) causes impaired lipid metabolism and an increase in hepatocarcinogenesis in aged mice whereas lipid overload alone neither induces NASH nor increases the incidence of tumor development in them. The double knockout (DKO) of Sod1 and peroxiredoxin 4 (Prdx4), a thiol oxidase that resides in the ER, causes NASH-mimicking symptoms even at younger ages. We found that in addition to high mortality, any surviving DKO mice develop hepatocellular carcinoma within the first year of life. The administration of a physiological dose of L-ascorbate (1.5 mg/ml) in drinking water decreased the rates of mortality and effectively prevented tumor development. Precancerous lesions showed higher reactivity to a ferroptosis-specific antibody compared with tumor lesions. Analyses of liver tissues from 8-month-old DKO mice revealed that upregulation in the metabolic pathways of amino acids were robustly suppressed by supplementation with L-ascorbate, which suggested a possible role in hepatocarcinogenesis. Iron-regulatory protein and aconitase activity were decreased in the DKO mice regardless of their ascorbate status. Given the dominant occurrence of ferroptosis in precancerous cells, it is conceivable that supplementation with ascorbate along with aberrant iron metabolism selectively induces the death of cells destined for tumorigenic proliferation at the precancerous stage. An adequate intake of ascorbate in daily life could ameliorate the tumorigenic processes that are promoted by the hepatic steatosis elicited by oxidative insult
Keywords:
nonalcoholic steatohepatitis
; hepatic tumor
; endoplasmic reticulum stress
; oxidative stress
; iron regulatory protein
1. Introduction
Non-alcoholic fatty liver disease (NAFLD) is defined as an accumulation of more than 5% of fat in hepatocyte volume when there is no history of alcohol overconsumption. Such a condition has been known to advance to nonalcoholic steatohepatitis (NASH) in 2-5% of the general population [1,2]. Without appropriate treatment, NASH could progress to the formation of a hepatic tumor through cirrhosis, and inflammation plays a primary role in this process [3,4]. Reactive oxygen species (ROS) are generally elevated under inflammation, and oxidative stress is believed to be a potential underlying mechanism for tumorigenic processes [5,6]. However, because of the lack of suitable animal models reproducing the pathogenic processes, the underlying mechanisms in the progression of this disease remain ambiguous.
Since superoxide is a primary oxygen radical produced by a variety of oxygen-consuming reactions, it could be converted to more harmful ROS such as hydroxyl radicals in the presence of free iron. Superoxide dismutase (SOD) plays a pivotal role in preventing oxidative damage and associated diseases that result from ROS [7]. Knockout (KO) of Sod1 encoding cytosolic Cu and Zn-containing SOD increases susceptibility to liver steatosis in mice [8], which is associated with impairment of the secretion of lipoproteins due to endoplasmic reticulum (ER) stress [9]. Whereas hepatic tumors develop spontaneously in some populations of aged Sod1-KO mice [10], neither co-deficiency of the tumor suppressor gene Ataxia-telangiectasia mutated (ATM) acting in DNA repair nor treatment with an antioxidant such as α-tocopherol affects either survival or tumorigenesis in Sod1-KO mice [11]. Even when mice that harbor both a loss of the Sod1 gene and the obese diabetic (db) mutation in the leptin receptor have been fed a high-fat diet for a long period of time, they do not develop NASH despite an extraordinary accumulation of visceral fat and massive deposits of lipid droplets in the liver [12]. Thus, the combination of oxidative stress caused by Sod1 deficiency and either DNA damage or high-fat loading does not promote the development of either NASH or hepatic tumors in mice.
ER stress is considered another underlying promoter of NASH and tumorigenesis in the liver [13,14]. Conventional cultivation of primary hepatocytes isolated from Sod1-KO mice stimulates lipogenesis in part through the aberrant activation of sterol regulatory element binding transcription proteins (SREBPs) that could be activated by ER stress as well as by sterol insufficiency [15,16]. Peroxiredoxin (PRDX) 4 is an ER-resident thiol oxidase that participates in the oxidative folding of nascent proteins in the secretory pathway by means of the oxidizing the power of hydrogen peroxide [17,18]. While individual ablation of either Prdx4 [19] or endoplasmic reticulum oxidoreductin 1 (ERO1) [20] shows subtle phenotypic abnormalities, a double deficiency of these genes leads to consumption of ascorbate (Asc) and results in atypical scurvy in mice due to aberrant collagen synthesis [21]. In line with these observations, transgenic overexpression of Prdx4 mitigates NASH and/or type 2 diabetes induced by the feeding of a high-fructose diet [22]. Furthermore, the administration of hepato-carcinogen N-nitrosodiethylamine increases the incidence of tumor development in Prdx4-KO mice compared with that in wild-type (WT) mice, but the transgenic overexpression of Prdx4 consistently decreases the rate [23]. Thus, Prdx4 plays a role in maintaining liver homeostasis through normalization of the ER function.
Mice with a double knockout of Sod1 and Prdx4, which are referred to as DKO mice in this communication, show NASH-like symptoms that are not evident in either Sod1-KO or Prdx4-KO mice [24]. In the current study, we found that DKO mice raised under conditions of conventional breeding for 1 year developed hepatic tumors and that supplementation of Asc in drinking water markedly decreased the rates of both mortality and tumors. Since iron metabolism is prone to impairment in DKO mice, Asc in association with free iron likely eliminates cells that are destined for tumorigenic transformation at the precancerous stage.
2. Results
2.1. Hepatic Tumor Development in Sod1- and Prdx4 Double-Deficient Mice Was Suppressed by Supplementation with Asc
We previously reported the development of NASH-related symptoms in DKO mice even at a young age [24]. Herein, we describe our observation of four genotypic types of male mice: WT, Sod1-KO, Prdx4-KO, and DKO, for as long as one year after birth. The plasma Asc content is reportedly low in Sod1-KO mice [25,26,27,28], making Asc a candidate tumor suppressor by countering oxidative stress. Therefore, we supplemented Asc (1.5 mg/ml of water) to additional groups of Sod1-KO and DKO mice. While the DKO mice also showed lower plasma Asc levels compared with that of WT and Prdx4-KO mice, supplementation with Asc resulted in plasma Asc levels comparable to those in WT mice (Figure 1A). DKO mice exhibited a high incidence of death, which was ameliorated by supplementation with Asc (Figure 1B). Autopsies after one year of breeding revealed many tumor nodules on the livers of the DKO mice (Figure 1C). While the frequency of tumor-bearing livers is increased in Sod1-KO mice to some extent, DKO mice typically exhibit a higher incidence of liver tumors that also are larger than those observed in Sod1-KO mice. By contrast, Asc supplementation strikingly suppressed tumor development in the livers of both Sod1-KO and DKO mice. Mortality in DKO mice at a young adult stage was thought unlikely to be due to tumors, as tumors were barely detectable at 8 months of age.
Because innate immune cells play key roles in inflammation and are associated with tumor development [5,6], we examined blood cells in WT, DKO and DKO mice with Asc supplementation at 4 and 8 months of age (Supplementary Figure 1). Low levels of body weight and low concentrations of red blood cells (RBC) observed in the DKO mice could be phenotypic properties intrinsic to Sod1 deficiency [9,29]. Concentrations of the white blood cells, notably lymphocytes and granulocytes, were high in DKO mice at 4 months of age, which was in line with inflammatory conditions that are characteristic of NASH, and Asc supplementation seemed to have exhibited a negligible effect. Unexpectedly, there was less of a difference in the lymphocyte concentrations in WT and DKO mice at 8 month of age. Also, plasma levels of inflammatory cytokines (TNFα, IL-1β, and IFN-γ) showed no significant differences among the three groups of mice at 8 months of age (data not shown). These data imply that DKO mice suffering severe inflammatory damages are prone to die before developing tumors and that those with relatively mild NASH phenotypes survive longer and eventually develop hepatic tumors. Since macrophages are largely involved in inflammatory processes [3,4], we isolated peritoneal macrophages at 4 months of age, treated them with LPS in vitro, and measured the expressions of several markers for activated macrophages. The measurement of markers for activated macrophages such as nitric oxide production, CD80, and CD11b, however, showed no evident differences among the groups of mice (Supplementary Figure 2). Thus, it was unlikely that aberrant macrophage function was responsible for the excessive inflammatory responses in DKO mice.
2.2. Histopathological Analyses of the Livers in Tumor-Bearing Mice
Next, we performed pathological analyses of the livers in DKO mice with or without Asc supplementation and compared the results with those of WT mice. Despite the development of tumors, H&E staining showed no evident fibrosis in any group of DKO mice (Figure 2A). When compared with WT mice, the precancerous lesions in DKO mice had caused lymphocyte infiltration and regenerative tissue changes in the livers. Supplementation with Asc suppressed the hepatocyte atypia that is characterized by enlarged nuclei and irregular size. Ferroptosis refers to iron-dependent, non-apoptotic cell death, and is thought to be a cause of NASH [30,31]. Therefore, we performed immunohistochemical analysis of the livers using FerAb, which specifically recognizes ferroptotic cells [26]. While FerAb staining showed a clear increase in positivity in the DKO group compared with that performed on the WT group, the effect of administered Asc was not evident. It appeared that, rather than cancer cells, atypical cells with enlarged nuclei in non-cancerous areas showed the most marked effect of staining even (Figure 2B), which suggests that cells in precancerous lesions undergo ferroptosis to a greater extent than cancer cells.
2.3. Proteomics Analysis Revealed an Elevation of Amino Acid Metabolism in Precancerous Livers
Due to the high frequency of hepatic tumor development following NASH, the DKO mice were considered to be a useful model for analysis of the tumorigenic process. We performed proteomic analyses of the livers of the DKO mice at 8 months of age in which obvious tumor nodules had not yet developed and compared the results with those of WT mice. A volcano plot shows that the contents of many proteins were elevated in the livers of DKO mice compared with those of WT mice (Figure 3A, supplementary Table 1). These proteins were normalized by Asc administration that significantly suppressed tumor for mation, which suggested the involvement of these proteins in the tumorigenic process. A Venn diagram shows that Asc administration normalized 131 proteins that had been upregulated in the DKO mice, but 8 proteins were downregulated in the DKO mice compared with WT mice (Figure 3B). GO analysis showed that the upregulated genes were largely associated with amino acid metabolism, while the downregulated genes appeared to not be mutually associated.
2.4. Analyses of Metabolites in Precancerous Livers
Given the involvement of altered metabolic pathways in tumorigenesis, we performed metabolomics analysis of the liver extracts (supplementary Table 2). Volcano plots indicate that many metabolites were either increased or decreased in the livers of DKO mice compared with that in wild type, and Asc supplementation normalized some of them (Figure 4A). Another Venn diagram indicates that half of the 18 upregulated metabolites in the DKO mice were significantly normalized by Asc administration (Figure 4B), while 8 out of the 34 downregulated metabolites were normalized.
A heat map suggests changes in the metabolic pathways involved in glycometabolism, which includes glycolysis, the pentose phosphate pathway, and amino acid metabolism (Figure 5A). The nLC-MS/MS system employed in this study could not distinguish between some metabolites that had the same molecular mass, which includes citrate/isocitrate and glucose-6-phosphate/glucose-1-phosphate/fructose-6-phosphate. Elevation of sedoheptulose 7-phosphate, an intermediary compound of the pentose phosphate pathway, suggests that carbon flux to the pentose phosphate pathway was increased (Figure 5B). Changes in some amino acid levels implies the stimulation of amino acid catabolism. Intermediary compounds of the TCA cycle were similar in DKO and WT mice, but Asc supplementation in the DKO mice increased some of these compounds.
2.5. Upregulation in Antioxidative Proteins and Stimulated Proteolysis as Consequences of Oxidative Stress
Many gene products involved in antioxidation and detoxification reactions were elevated in the livers of DKO mice (Figure 6A), and we considered this upregulation to be a compensatory response to oxidative stress due to Sod1 deficiency. Nrf2 is the master regulator of the antioxidant system, and it is stabilized in response to oxidative insult and is translocated to the nucleus to induce multiple genes, which includes those acting in antioxidation [32]. To examine the participation of Nrf2 in the expressions of antioxidant genes, we isolated nuclei from the livers of 8-month old DKO mice and examined the Nrf2 content via immunoblot analysis using an anti-Nrf2 antibody. Although there were large individual differences, the Nrf2 protein translocated to the nucleus tended to increase in the DKO mouse livers, which was not affected by Asc supplementation (Figure 6B). This trend was also confirmed via quantitative PCR. Since there was also a large individual difference in body sizes at 8-months old, we examined the relationship between body weight and nuclear Nrf2 content and discovered an inverse correlation (Figure 6C). Activation of Nrf2 prominently occurred in DKO mice with less body weight, which was likely caused by severe liver damage that was a result of stress. This trend was not changed by Asc supplementation, which suggests an insufficiency to inhibit promotion to the precancerous stage. Therefore, the inhibition of tumor progression appears to involve the need to suppress subsequent processes via supplementation with Asc. Elevated oxidation is one of the mechanisms of altered gene expression, which is why we tried to evaluate the state of protein oxidation via the detection of carbonyl proteins. It was surprising to see, however, that regardless of Asc supplementation the levels of carbonyl proteins in the livers of DKO mice were lower compared with those of WT mice (Supplementary Figure 3). Because the polyubiquitination of oxidatively damaged proteins and aged proteins accelerates their degradation by proteasome [33,34], we used an anti-ubiquitin antibody to evaluate the levels of polyubiquitinated proteins via western blot analysis and found subtle elevations in the levels in DKO mice (Supplementary Figure 4). These collective data suggest that polyubiquitination preferentially occurs in oxidatively damaged proteins in DKO mouse livers, which stimulates their degradation by proteasomes, although the proteolytic capacity of the proteasomes was unchanged as judged by levels of the catalytic β-subunits β1, β2 and β5 (Supplementary Figure 5).
2.6. Implications of Aberrant Iron Metabolism in DKO Mice
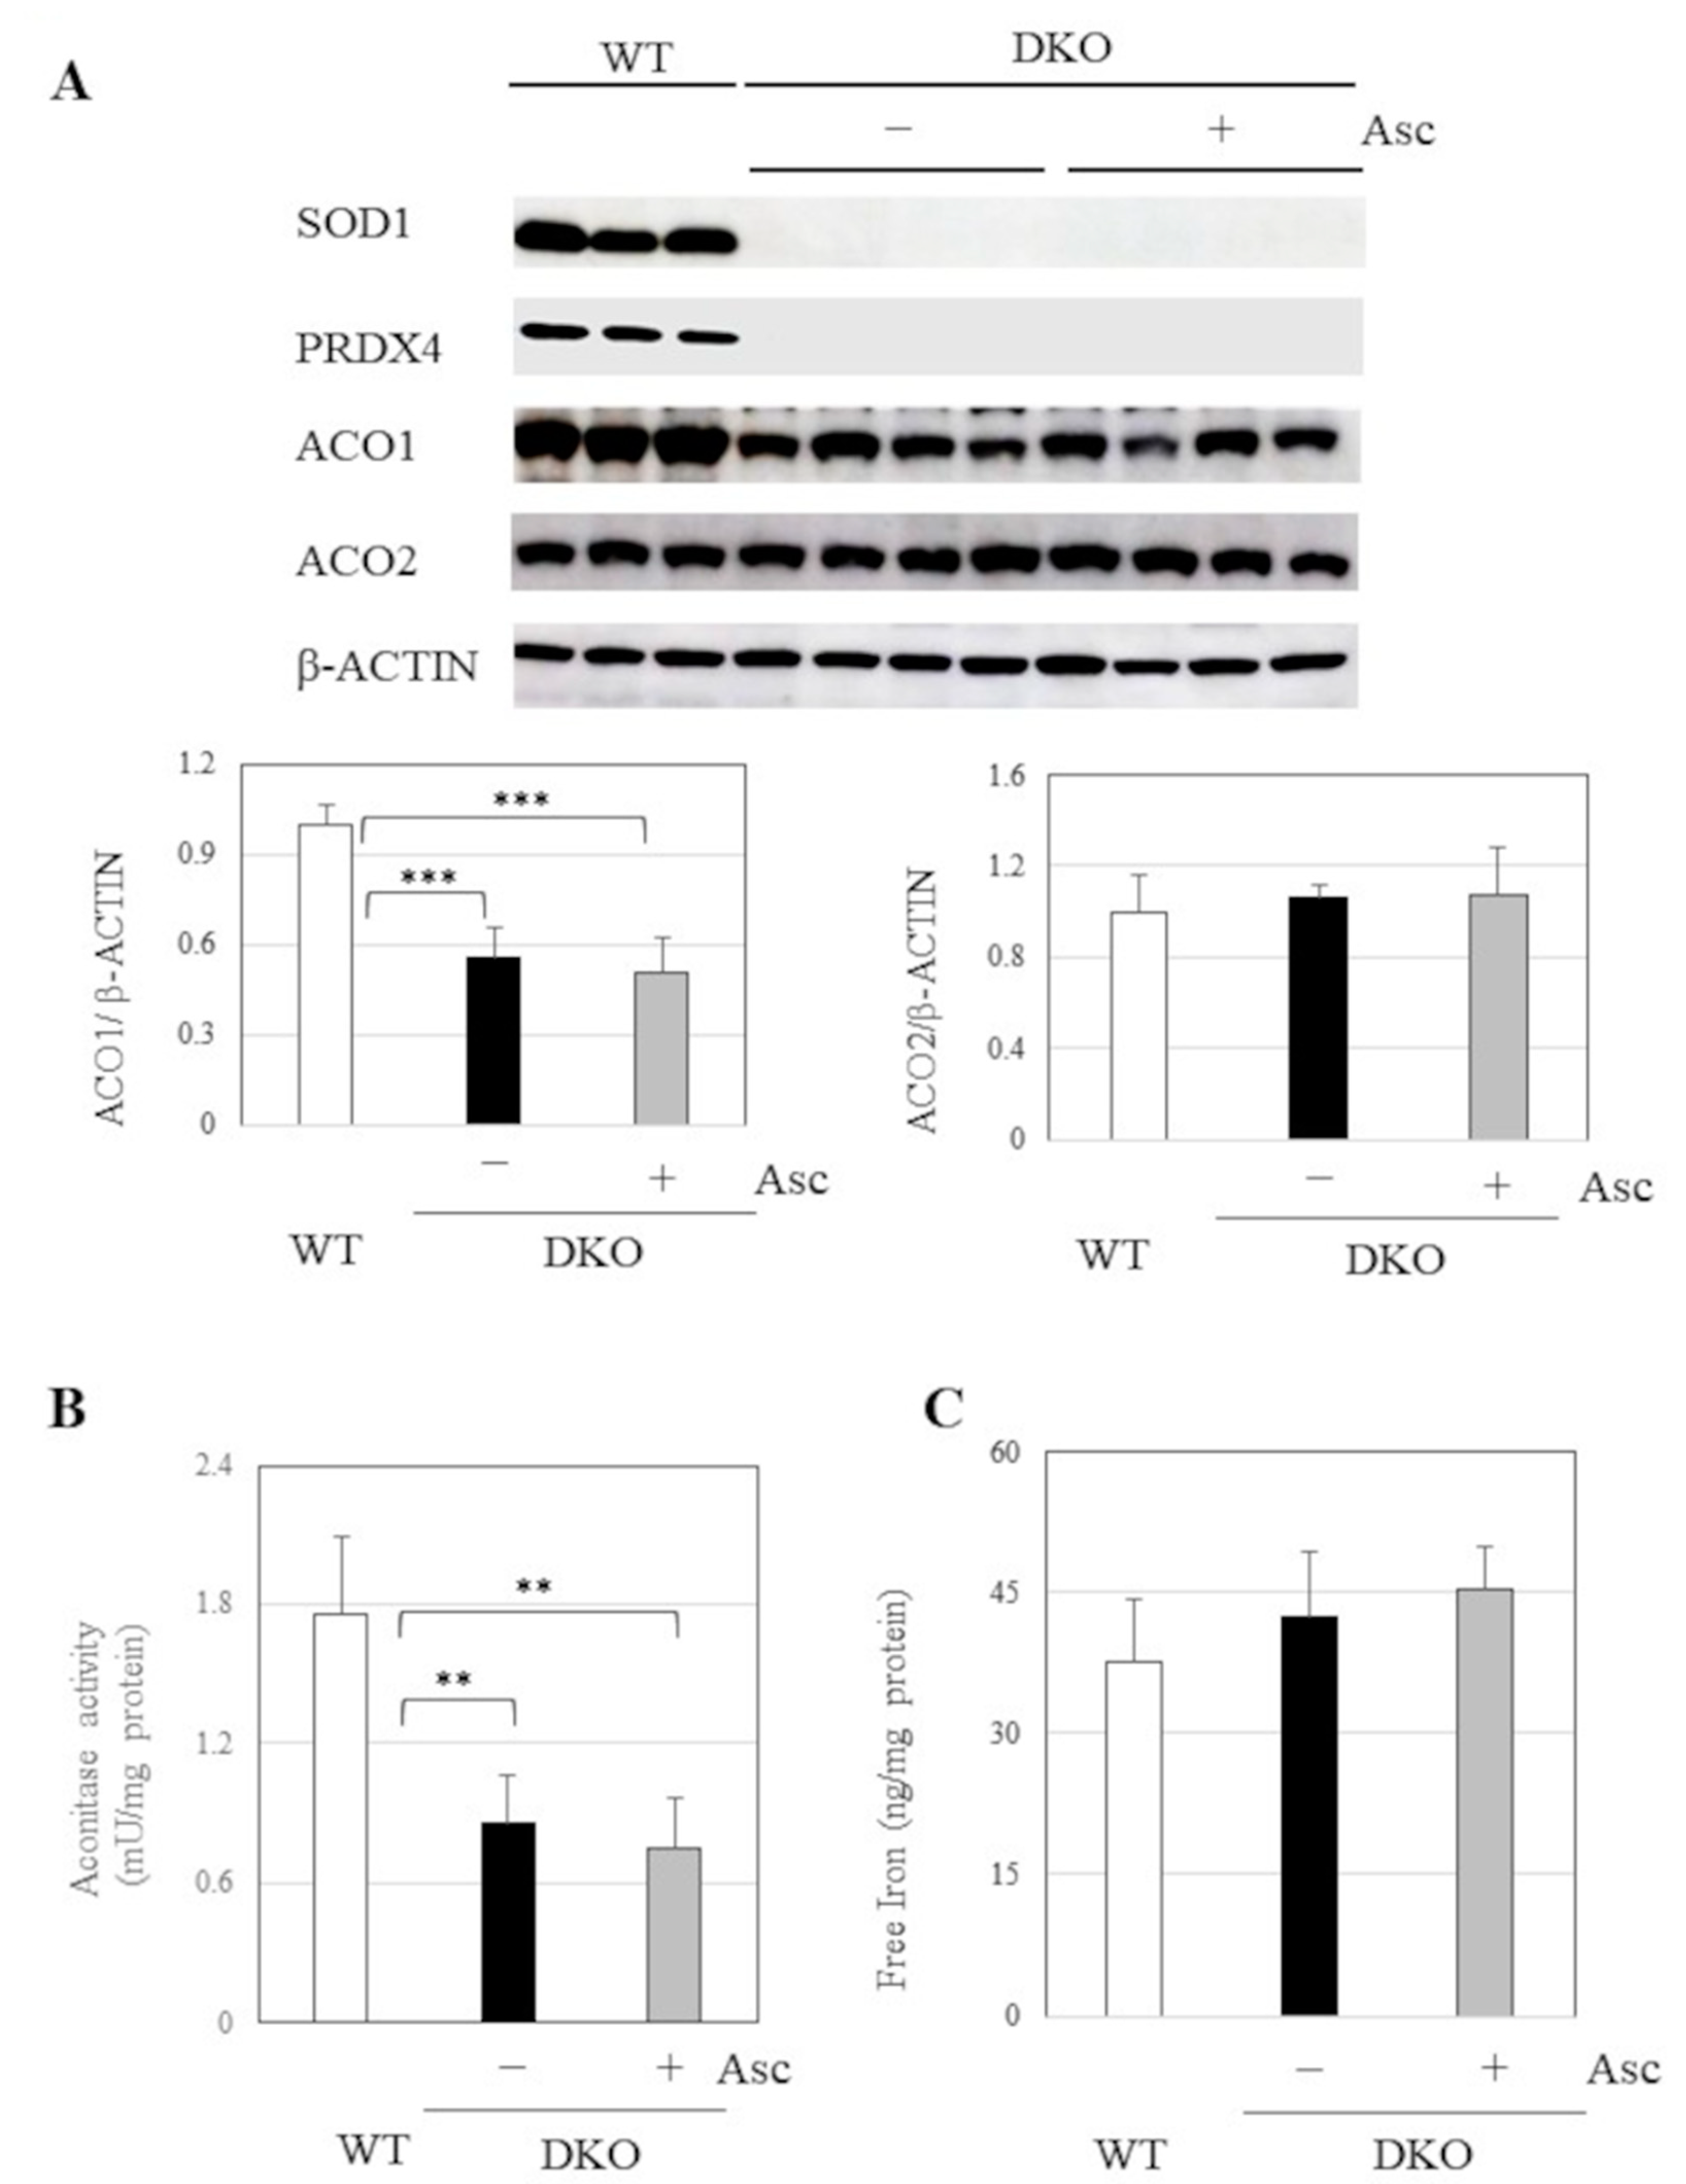
Since the combined presence of free iron and peroxides induces ferroptosis, an iron-dependent, non-apoptotic form of cell death, through the generation of hydroxyl radicals [35,36], we examined the content of cytosolic aconitase ACO1 that acts as an iron regulatory element-binding protein in iron homeostasis [37] along with the enzyme ACO2 that acts in the tricarboxylic acid cycle (TCA) in mitochondria. Western blot analysis indicated that the content of ACO1 was low in the livers of DKO mice, but that of ACO2 was not, and this was regardless of Asc status (Figure 7A). Aconitase activity is an intrinsic function of both ACO1 and ACO2, which is concomitantly decreased by half in DKO mice regardless of Asc status (Figure 7D), although no change was observed in the free-iron content (Figure 7C). The lack of change in citrate/isocitrate and the decrease in itaconic acid content collectively suggests that the function of the TCA cycle that involves ACO2 activity is maintained in DKO mice. Thus, iron metabolism regulated by ACO1 appeared to be impairedin DKO mice and is suspected to be responsible for hepatic tumorigenesis under Asc insufficiency.
3. Discussion
A novel finding of this study is that supplementation of DKO mice with physiological levels of Asc did not prevent mediated promotion to a precancerous state through NASH, but significantly suppressed progression to liver tumors (Figs. 1 and 2). Antioxidation is a well-established function of Asc [38,39], and amelioration of the survival rate of DKO mice could be attributed to the ability to eliminate ROS. Long-term exposure to stress conditions likely causes cell death and compensatory effects that promote cell proliferation, which then increases the risk of tumorigenic transformation by inducing mutation [40]. Increased amino acid metabolism supports the aberrant proliferation of hepatic cells in DKO mice. In addition to its antioxidant activity, Asc antithetically promotes the production of ROS in the presence of free iron [38,39]. Tumor cells are known to exhibit aberrant iron metabolism and to contain greater levels of free iron compared with that found in normal cells [36]. Given the presence of supplemented Asc and the elevation in free iron, the resultant ROS tend to cause ferroptosis in tumor-prone cells, which could consequently suppress tumor development in DKO mice with Asc supplementation. Thus, the antithetical effects of Asc; protecting cells from oxidative damage and inducing ferroptosis in tumor-prone precancesous cell, appears to cooperate in enhancing survival and suppressing tumors in DKO mice.
The antitumor effects of Asc have been debated since the original proposal by Linus Pauling [27,28]. The advantageous effects of Asc on cancer treatment is rationalized in recent studies, which reveals potential action of pharmacologically high doses of Asc could exert therapeutic effects on advanced tumors [28,41,42]. The tumoricidal effect likely relies on the generation of ROS via the redox reaction of Asc, which is associated with free iron-mediated catalytic reactions [41,43] and/or glutathione-involved reactions [28]. Herein, we have described how physiological doses of Asc could be beneficial in preventing hepatic tumor development. Since Asc is a potent electron-donating compound, direct elimination of radical species and alleviation of ER stress are likely mechanisms for survival of young mice via the normalization of cellular functions [38,44]. To our surprise, however, oxidative protein damage, as judged by carbonyl protein content, was decreased rather than increased in DKO mice. This unusual phenomena could partially be explained by the stimulation of polyubuiquitination of oxidized proteins and the subsequent degradation by proteasomes. ACO1 protein was one of proteins decreased in DKO mice. Its degradation could be caused by the disruption of iron-sulfur clusters via increases in ROS [37,45], leading to disrupt iron homeostasis in some precancerous cells, notably those destined for tumorigenic transformation under active proliferation. This condition is thought to occur in only a limited number of precancerous cells that arise in a given period of time, rather than occurring throughout the liver. Accordingly, the free iron generated in this way is limited and would not affect the total amount of free iron in the liver. Nevertheless, for individual cells, redox recycling of free iron in the presence of Asc could promote the production of hydroxyl radicals that would stimulate the production of lipid peroxidation [38,39], which would consequently result in ferroptosis [35].
ROS cause a variety of diseases by inducing dysfunction and death in cells, and in severe cases ER stress also stimulates cell-death pathways [46]. While Prdx4 deficiency alone slightly increases the development of hepatic tumors, treatment with N-nitrosodiethylamine markedly enhances tumor development in Prdx4-KO mice [23]. Since ROS are abundantly produced during the detoxification of xenobiotics such as nitrosodiethylamine via the cytochrome P450/reductase system [47], elevation in both oxidative and ER stress appears to promote tumor development in Prdx4-KO mice. Also, Asc deficiency markedly increases both the lethality and development of hepatic tumors in mice following treatment with nitrosodiethylamine [48]. In DKO mice, SOD1 deficiency increases ROS with a concomitant decline in Asc levels, along with an inducement of ER stress due to PRDX4 deficiency. Cell death precedes tissue fibrosis, which is thought to promote the development of tumors [13,30]. Nevertheless, fibrotic change was not observed in the livers of DKO mice. This could be due to insufficient levels of Asc, which is a cofactor required for collagen synthesis [21], along with a disturbing excretion of fibrotic proteins due to impaired ER function. However, since fibrosis itself is important for maintaining tissue morphology, impaired fibrosis could weaken tissue architecture and lead to functional disorders, which could be associated with the premature death of mice.
Stronger positivity to FerAb in precancerous lesions compared with that in cancer lesions in the same liver (Figure 2) implies that ferroptotic cell death is more common in the precancerous cells destined for proliferation and tumorigenesis. Low levels of ACO1 likely lead to an increase in free iron, notably in cells meant for tumorigenic transformation and growth, although in the present study we could find no difference in the free iron levels in the precancerous livers of the DKO mice compared with the levels in WT mice at 8 months of age. However, because only a small number of tumorigenic cells arose over a short period of time, the free iron content in the liver could likely have been averaged out. Thus, it is possible that the selective removal of malignant cells by Asc-involved ferroptosis could suppress carcinogenesis without increasing the overall content of free iron.
Because Asc has diverse functions, other mechanisms could also be involved in its antitumor effect. For instance, Asc-involved prolyl hydroxylation is responsible for suppressing HIF1α, which is a master regulator of the hypoxia pathway for tumorigenesis under normoxygenic conditions [49,50]. Asc is also required to activate TET-involved methyl-cytosine demethylation, which could suppress tumorigenesis via the epigenetic activation of tumor-suppressor genes [51,52]. Further research is needed to understand the cancer-suppressing effects of Asc, which has such diverse functions.
4. Materials and Methods
4.1. Mice
Prdx4-KO mice were originally established in our institution [19]. Sod1-KO mice were purchased from Jackson Laboratories (Bar Harbor, ME, USA). These mice were backcrossed to C57BL/6N background mice more than 10 times. Establishing and breeding the DKO mice was described in our previous study [24]. All of the mice were weaned at 30 days of age and fed a standard diet (Picolab 5053; LabDiet, St Louis, MO, USA) ad libitum with free access to water. The drinking water of additional groups of DKO and Sod1-KO mice was supplemented with Asc (1.5 mg Asc/ml), as described in the literature [53]. The animal room was maintained under specific pathogen-free conditions at a constant temperature of 20–22 ºC with a 12 h alternating light-dark cycle. Animal experiments were performed in accordance with the Declaration of Helsinki under protocols approved by the Animal Research Committee at Yamagata University [ethical licence/protocol number; R6069].
4.2. Blood Cell Counting
Blood was collected from hearts in the presence of ethylenediaminetetraacetic acid (EDTA). Hematological examination was carried out using an automated blood cell analyzer (VetScan HM5 v2.31, Abaxis, CA, USA). Red blood cells, platelets, and total white blood cells (WBCs) were separately counted, and WBCs were further classified as either lymphocytes, monocytes, or granulocytes.
4.3. Histological Analyses of Livers
Livers were harvested immediately after euthanization, immersed in a 10% formalin solution, and fixed for 3 days at room temperature. Thereafter, the formalin solution was replaced with a 70% ethanol solution and stored in a 70% ethanol solution at room temperature until embedding in paraffin. The sections (5 μm in thickness) were stained with hematoxylin-eosin (H&E). Immunostaining was performed using the Leica Bond Max automated system (Leica, Bannockburn, IL, USA) and a Bond Intense R Detection Kit (DS9263). Immunostaining was preceded by a 10 min immersion in BOND Epitope Retrieval Solution 1 (AR9961). FerAb [54] were diluted at 2 µg/mL with BOND Primary Antibody Diluent (AR9352). Biotin conjugated goat anti-rat IgG(H+L) antibody (1/500) was used as the secondary antibody. Tissues were counterstained with hematoxylin for nuclear staining. Microphotographs were taken using a BX53 and a DP22 (Olympus, Tokyo, Japan).
4.4. Measurement of the Reduced Form of Asc
A fluorescent probe, 15-(Naphthalen-1-ylamino)-7-aza-3, 11-dioxadispiro [5.1.58.36] hexadecan-7-oxyl (Naph-DiPy), was synthesized and used to measure the Asc, as described in the literature [55]. The Asc concentration was calculated by measuring the fluorescence at an excitation wavelength of 310 nm and an emission wavelength of 430 nm using a microplate reader (Valioskan Flash, Thermo Fisher Scientific, Waltham, MA, USA).
4.5. Preparation of Plasma and Liver Lysate
Blood collected in the presence of EDTA was centrifuged at 2,400 x g for 5 min, and then the plasma fraction was subjected to analysis. Liver tissues dissected from mice were homogenized in a lysis buffer (25 mM tris-HCl, pH 7.5) containing 150 mM NaCl, 1% NP-40, 1% sodium deoxycholate, and 0.1% SDS supplemented with a protease inhibitor cocktail (P8340; Sigma-Aldrich, St. Louis, MO, USA)) using a glass-Teflon homogenizer on ice and then subjected to centrifugation at 17,400 x g at 4 ºC. Protein concentrations of the supernatant were determined using a Pierce® BCA™ protein assay kit (Thermo Fisher Scientific).
4.6. Proteomics Analysis
Liver lysate samples (50 µg) were reduced using dithiothreitol (10 mM) followed by alkylation with iodoacetamide (25 mM). Following hydrolysis with trypsin, reaction mixtures were desalted using a C-Tip (Nikkyo Technos, Tokyo, Japan), as previously described in the literature [56]. The desalted peptide solution was analyzed via nanoflow liquid chromatography tandem mass spectrometry (nLC-MS/MS) using an Easy nLC 1000 system (Thermo Fisher Scientific) connected to a quadrupole orbitrap mass spectrometer (Q-Exactive; Thermo Fisher Scientific) equipped with a nanoelectrospray emitter. The measurement conditions were previously described in the literature [57].
Raw file reads were matched against the Swiss-Prot house mouse database (17,162 sequences), using a Proteome Discoverer (version 1.4; Thermo Fisher Scientific) with the SequestHT and Mascot (version 2.8.0.1; Matrix Science, Tokyo, Japan) search engines. Precursor and fragment mass tolerances were set to 10 ppm and 0.04 Da, respectively. A fixed modification for S-carbamidomethylated cysteine and two maximum missed cleavage sites for trypsin were established. The results were filtered using a Percolator with a false discovery rate of 1%. The peak area of each identified peptide was estimated using a Proteome Discoverer. The intensity of unique peptides was used to calculate the protein intensity. An intensity-based absolute quantification (iBAQ) algorithm was used to calculate the protein quantification values [58].
4.7. Metabolite Analysis
Sample preparation and metabolite measurements were performed as described in the literature [59] with minor modifications. Alkylation was performed by treatment with 20 mM N-ethylmaleimide in 50 mM ammonium bicarbonate. Equal volumes of methanol containing both 10 µM of N-methylmaleimide-derivatized glutathione and 10 µM of L-methionine sulfone were added as internal standards. Following the addition of an equal volume of chloroform, the mixture was centrifuged at 12,000 × g for 15 min at 4 ºC. The upper aqueous layer was lyophilized, dissolved in one-third volume of deionized water, and analyzed by LC-MS. A Q-exactive Hybrid Quadrupole-Orbitrap mass spectrometer (Thermo Fisher Scientific) equipped with a heated electrospray ionization source was operated in the positive and negative ionization modes. The Ultimate 3000 LC system consisted of a WPS-3000 TRS autosampler, a TCC-3000 RS column oven, and an HPG-3400RS quaternary pump (Dionex, Sunnyvale, CA, USA). A SeQuant ZIC-pHILIC column (2.1 × 150 mm, 5 µm particle size; Merck KGaA, Darmstadt, Germany) and an Acquity UPLC BEH Amide column (2.1 x 100 mm, 1.7 µm particle size; Waters Corp., Milford, MA, USA) were used to quantify as many metabolites as possible. For the ZIC-pHILIC column, the mobile phase A contained 20 mM of ammonium bicarbonate at pH 9.8, and the mobile phase B was 100% acetonitrile. For the BEH Amide column, mobile phase A was 0.1% formic acid and mobile phase B was 99.9% acetonitrile and 0.1% formic acid. System control and data acquisition were performed using Xcalibur 2.2 software.
All raw data collected were imported into Compound Discoverer 2.1 software (Thermo Fisher Scientific) for compositional determination. Elemental composition was searched using Compound Discoverer 2.1 against the mzVault metabolite database that was built in February 2017 based on accurate mass and isotopic patterns. Tentative metabolite identification was performed by comparing the observed full MS ions and MS/MS fragment ions, and validated identification was performed using reference standards. Compounds were grouped with a mass tolerance of 20 ppm and a retention time tolerance of 1 min and quantified based on the relative ameliorated peak area of each signal in the mass spectrum.
4.8. Protein Data Annotation
Gene ontology (GO) analysis of the differentially expressed genes was performed using the protein analysis through evolutionary relationships (PANTHER) classification system, and was adjusted for multiple testing via Bonferroni correction (GO database Released 2023-11-15). The P-value of each GO term above 0.05 was excluded from the analysis. The number of differentially expressed genes for particular GO terms was compared with the total number of genes assigned to each term, and enriched GO terms were presented. Differentially expressed genes were categorized as biological processes.
4.9. Isolation and Cultivation of Elicited Peritoneal Macrophages
Peritoneal macrophages were collected and cultured as described previously in the literature [60]. Briefly, mice were given an intraperitoneal injection of 2 mL of a 4% thioglycolate broth. Four days after this injection, macrophages were collected from peritoneal lavage by centrifugation at 1,000 rpm for 5 minutes. To lyse the residual red blood cells (RBCs), 1 ml of RBC lysis buffer (155 mM NH4Cl, 10 mM KHCO3, and 0.1 mM EDTA) was added to each pellet. Cells were cultured at 1.0 x 10⁶ cells/1 mL in complete RPMI 1640 medium (RPMI 1640, 10% fetal bovine serum, 100 units/mL penicillin, and 100 mg/mL streptomycin) with or without Asc (50 μM) and with or without bacterial LPS (1 µg/mL, Fujifilm Wako Pure Chemical Corporation, 127-05141) for 24 h at 37 ºC.
4.10. Flow Cytometric Analyses of LPS-Treated Macrophages In Vitro
Peritoneal macrophages from WT and DKO mice were separately treated with LPS for 24 h as described above. The cells were then incubated with rat anti-CD11b antibody (11-595-C100; Exbio Praha, as) and rabbit anti-CD80 antibody (bs-1479R; Bioss Inc., Woburn, MA, USA) at 1/2500 in PBS containing 5% FBS for 30 min on ice. The secondary antibody goat anti-rabbit IgG H&L (Alexa Fluor® 488; Invitrogen, Tokyo, Japan) and goat anti-donkey IgG H&L (Alexa Fluor® 647, Invitrogen) were incubated at 1/2500 for 30 min on ice in darkness. The cells were washed and subjected to flow cytometric analysis using a FACS Melody cell sorter (Becton, Dickinson and Company, Franklin Lakes, NJ, USA), and were analyzed using Flow Jo version 10.8.1 software.
4.11. Preparation of Nuclear Fractions to Detect Nrf2
Liver tissues excised from mice were manually homogenized in 9 vol. of 0.25 M sucrose containing 3.3 mM of CaCl2 and 5 mM of MgCl2 using a glass-Teflon homogenizer on ice and subjected to centrifugation at 600 x g for 10 min. After washing twice with the same buffer, the pellets (nuclear fraction) were resuspended in 0.34 M of sucrose. Protein concentration was measured using a Pierce® BCA™ protein assay kit. The abundance of the nuclear fractionation was confirmed by immunoblotting using anti-histone H2A.x (3522-1; Epitmics, California, USA) as a nuclear protein marker.
4.12. Immunoblotting
Proteins in liver lysates (20–30 µg) were separated by SDS-polyacrylamide gel electrophoresis (SDS-PAGE) and blotted onto PVDF membranes. The blots were blocked with 5% skim milk in tris-buffered saline containing 0.1% Tween-20 (TBST), and were then incubated with the antibodies. The primary antibodies used were: SOD1 [53], ACO1 (12406-1-AP; Proteintech Group Inc.), ACO2 (67509-1-IG; Proteintech Group Inc.), Prdx4 [53], Nrf2 (16396-1-AP; Proteintech Group Inc.), histone H2A.x, 20Sα (BML-PW8195; Enzo Life Sciences), β1 (BML-PW8140; Enzo Life Sciences), β2 (BML-PW9300; Enzo Life Sciences), β5 (BML-PW8895; Enzo Life Sciences), and β-actin (sc-69879; Santa Cruz Biotechnology, Dallas, TX, USA). Either horseradish peroxidase (HRP)-conjugated goat anti-rabbit IgG (sc-2357, Santa Cruz Biotechnology) or anti-mouse IgG (sc-2005, Santa Cruz Biotechnology) antibodies were used as the secondary antibodies. After washing, immune reactive bands were detected by measuring the chemiluminescence using an Immobilon western chemiluminescent HRP substrate (EMD Millipore, Temecula, CA, USA) on an image analyzer (ImageQuant LAS500; GE Healthcare, Buckinghamshire, UK).
4.13. Detection of Carbonylated Proteins
Levels of protein carbonyl groups were assessed using a protein carbonyl assay kit (Abcam, Cambridge, MA, USA) according to the manufacturer’s instructions. Liver lysate samples (10 mg/mL) were chilled on ice for 20 min with an equal volume of 2 x extraction buffer and centrifuged at 17,400 x g for 20 min. The supernatant was mixed with an equal volume of 12% SDS, incubated with a 2,4-dinitrophenylhydrazine solution for 15 min at room temperature, and then neutralized. Samples (2 μg) were separated on 12% SDS-polyacrylamide gel and blotted onto a polyvinylidene difluoride (PVDF) membrane (GE Healthcare, Chicago, IL, USA). Blots were blocked and incubated with anti-DNP antibody, followed by HRP-conjugated secondary antibody. After washing with TBST, the antibody binding was visualized using an Immobilon western chemiluminescent HRP substrate (Merck Millipore, Burlington, MA, USA) and detected using an image analyzer (ImageQuant LAS 500; GE Healthcare). Signal intensities were quantified using ImageJ software (http://imagej.nih.gov/ij/) [61].
4.14. Detection of Ubiquitinated Proteins
The liver lysate samples (20 µg) were separated by SDS-PAGE and blotted onto PVDF membranes. The blots were blocked with 5% skim milk in TBST, and then incubated overnight at 4 ºC with mouse anti-ubiquitin (Ub) monoclonal antibody (sc-8017; Santa Cruz Biotechnology) diluted in TBST containing 5% skim milk. After three washes with TBST, the blots were incubated with HRP-conjugated anti-mouse secondary antibody. Positive signals were visualized and quantified as described above.
4.15. Measurement of Aconitase Activity
Aconitase activity was measured via a coupled enzyme reaction in which citrate is converted to isocitrate using an aconitase activity assay kit (MAK051, Sigma-Aldrich) according to the manufacturer’s instructions. Briefly, liver tissues were homogenized in an ice-cold assay buffer using a glass-Teflon homogenizer and centrifuged at 800 x g for 10 min at 4 ºC. Samples were diluted 2-fold in assay buffer, and 50 μL samples were transferred to 96-well microplates. Reaction mixtures containing an enzyme mix and the substrate (50 μL) were mixed with each sample and incubated at 25 ºC for 45 min. Developer (10 μL) was added to each well, mixed, and incubated at 25 ºC for 10 min. The absorbance at 450 nm was measured and the amounts of isocitrate generated were calculated from a standard curve. The activities were corrected according to total protein content.
4.16. Reverse Transcription (RT)-PCR and Quantitative RT-PCR Analyses of the Produced DNA
RNA from mouse livers was purified by means of ISOGEN II (Nippongene, Tokyo, Japan). cDNA was prepared using a primescript cDNA synthesis kit (TaKaRa, Kyoto, Japan). The cDNAs were amplified using the corresponding primers (Supplementary Table 3) followed by separation on agarose gels. Quantitative RT-PCR analyses were performed using the Step One real-time PCR system (Applied Biosystems, Tokyo, Japan) and the Thunderbird SYBR qPCR mix (TOYOBO, Osaka, Japan) according to the manufacturer’s recommendations.
4.17. Measurement of Free Iron in the Liver Homogenate
Free-iron concentrations in the liver were determined by observing visible coloration due to the formation of a chelate complex between ferrozine and iron using an iron assay kit (Metallo assay; Metallogenics Co., Ltd., Chiba, Japan) according to the manufacturer’s instructions. Briefly, the lung lysate was adjusted to pH 2-3 by adding hydrochloric acid, with centrifugation at 15,000 rpm for 15 min, and then the supernatant was collected. Iron concentration in the supernatant was determined by measuring the iron-ferrozine complex at a wavelength of 562 nm. Liver-iron concentrations were corrected for total protein content.
4.18. Statistical Analysis
Statistical analyses were performed using JMP version 12.2.0 software (SAS Institute, Cary, NC, USA). All results are expressed as the mean ± the standard error (SE) for at least triplicate experiments. Statistical analyses were performed using either a Student’s t-test for comparisons of two groups or a one-way analysis of variance (ANOVA), which was followed by a Tukey-Kramer test for comparisons of multiple groups. P-values less than 0.05 were considered significant.
5. Conclusions
The combined genetic ablations of Sod1 and Prdx4 mice synergistically aggravated hepatic damages that led to an increase in fatality and to tumor development in surviving mice via the coupling of oxidative and ER stress. The metabolic processes of primary nutrients were coordinately upregulated in the precancerous lesions of DKO mice, which could stimulate transformation to malignant cells and tumorigenic proliferation. Asc robustly suppressed tumorigenesis in the liver, which suggests that sufficient intake of Asc in daily life could prevent the aggravation of fatty liver diseases that are likely caused under such stressful conditions.
Supplementary Materials
The following supporting information can be downloaded at the website of this paper posted on Preprints.org, Figure S1: Body weights and contents of Asc and blood cells in WT, DKO and DKO mice supplemented with Asc at 4 and 8 months of age, S2: DKO mice showed no differences in the ability to produce NO via LPS-stimulated primary macrophages, S3: Changes in the carbonyl contents of proteins extracted from WT mice, DKO mice, and DKO mice supplemented with Asc, S4: Changes in the contents of polyubiquitinated proteins extracted from WT mice, DKO mice, and DKO mice supplemented with Asc, S5: No changes in proteasomal subunits among mice groups, and S6: Raw western blots for Figure 7A. Table S1: Comparison of proteome of livers of DKO with WT mice, S2: Comparison of metabolites of livers of DKO with WT mice, and S3: Primer sequences for quantitative RT-PCR.
Author Contributions
Conceptualization、J.F.; methodology, T.O., Y.M, and S.T.; formal analysis, T.O., Y.M, and S.T.; investigation, T.S, T.H., and Y.M.; resources, K.-I. Y. and C.Y.; writing, J.F.; funding acquisition, T.O., S.T. and J.F. All authors have read and agreed to the published version of the manuscript.
Funding
This research was funded by the JSPS KAKENHI (23K06410) to T.O., JSPS KAKENHI (24K10074) and Yamagata University the YU-COE program (S6) to J.F., JSPS KAKENHI (JP19H05462, JP20H05502) and JST CREST (JPMJCR19H4) to S.T.
Data Availability Statement
The raw data and analysis files have been deposited to the ProteomeXchange Consortium via the jPOST partner repository [62] with the data set identifier PXD058371 (JPST003491).
Conflicts of Interest
The authors declare no conflicts of interest.
Abbreviations
The following abbreviations are used in this manuscript:
| ER | endoplasmic reticulum |
| NAFLD | non-alcoholic fatty liver disease |
| KO | knockout |
| Sod1 | superoxide dismutase 1 |
| DKO | double knockout |
| Prdx4 | peroxiredoxin 4 |
| NASH | nonalcoholic steatohepatitis |
| ROS | reactive oxygen species |
| ATM | Ataxia-telangiectasia mutated |
| db | obese diabetic |
| SREBPs | sterol regulatory element binding transcription proteins |
| ERO1 | endoplasmic reticulum oxidoreductin 1 |
| Asc | ascorbate |
| WT | wild-type |
| EDTA | ethylenediaminetetraacetic acid |
| WBCs | white blood cells |
| H&E | hematoxylin-eosin |
| Naph-DiPy | 15-(Naphthalen-1-ylamino)-7-aza-3, 11-dioxadispiro [5.1.58.36] hexadecan-7-oxyl |
| nLC-MS/MS | nanoflow liquid chromatography tandem mass spectrometry |
| iBAQ | intensity-based absolute quantification |
| GO | Gene ontology |
| RBCs | red blood cells |
| SDS-PAGE | SDS-polyacrylamide gel electrophoresis |
| TBST | tris-buffered saline containing 0.1% Tween-20 |
| HRP | horseradish peroxidase |
| PVDF | polyvinylidene difluoride |
| Ub | ubiquitin |
| RT | Reverse transcription |
| SE | standard error |
| TCA | tricarboxylic acid cycle |
References
- Goh, G.B.; McCullough, A.J. Natural History of Nonalcoholic Fatty Liver Disease. Dig. Dis. S. 2016, 61, 1226–1233. [Google Scholar] [CrossRef] [PubMed]
- Ioannou, G.N. Epidemiology and risk-stratification of NAFLD-associated HCC. J. Hepatol. 2021, 2021. 75, 1476–1484. [Google Scholar] [CrossRef]
- Marengo, A.; Rosso, C.; Bugianesi, E. Liver Cancer: Connections with Obesity, Fatty Liver, and Cirrhosis. Annu. Rev. Med. 2016, 67, 103–117. [Google Scholar] [CrossRef] [PubMed]
- Kohlhepp, M.S.; Liu, H.; Tacke, F.; Guillot, A. The contradictory roles of macrophages in non-alcoholic fatty liver disease and primary liver cancer-Challenges and opportunities. Front. Mol. Biosci. 2023, 10, 1129831. [Google Scholar] [CrossRef]
- Chen, Z.; Tian, R.; She, Z.; Cai, J; Li, H. Role of oxidative stress in the pathogenesis of nonalcoholic fatty liver disease. Free Radic. Biol. Med. 2020, 15, 116–141. [Google Scholar] [CrossRef]
- Sutti, S.; Albano, E. Adaptive immunity: an emerging player in the progression of NAFLD. Nat. Rev. Gastroenterol. Hepatol. 2020, 17, 81–92. [Google Scholar] [CrossRef]
- Fridovich. I. Superoxide radical and superoxide dismutases. Annu. Rev. Biochem. 1995, 64, 97–112. [Google Scholar] [CrossRef] [PubMed]
- Uchiyama, S.; Shimizu, T.; Shirasawa, T. CuZn-SOD deficiency causes ApoB degradation and induces hepatic lipid accumulation by impaired lipoprotein secretion in mice. J. Biol. Chem. 2006, 281, 31713–31719. [Google Scholar] [CrossRef]
- Kurahashi, T.; Konno, T.; Otsuki, N.; Kwon, M.; Tsunoda, S.; Ito, J.; Fujii, J. A malfunction in triglyceride transfer from the intracellular lipid pool to apoB in enterocytes of SOD1-deficient mice. FEBS Lett. 2012, 586, 4289–4295. [Google Scholar] [CrossRef]
- Elchuri, S.; Oberley, T.D.; Qi, W.; Eisenstein, R.S.; Jackson Roberts, L.; Van Remmen, H.; Epstein, C.J.; Huang, T.T. CuZnSOD deficiency leads to persistent and widespread oxidative damage and hepatocarcinogenesis later in life. Oncogene 2005, 24, 367–380. [Google Scholar] [CrossRef]
- Erker, L.; Schubert, R.; Elchuri, S.; Huang, T.T.; Tarin, D.; Mueller, K.; Zielen, S.; Epstein, C.J.; Wynshaw-Boris, A. Effect of the reduction of superoxide dismutase 1 and 2 or treatment with alpha-tocopherol on tumorigenesis in Atm-deficient mice. Free Radic. Biol. Med. 2006, 41, 590–600. [Google Scholar] [CrossRef]
- Ito, J.; Ishii, N.; Akihara, R.; Lee, J.; Kurahashi, T.; Homma, T.; Kawasaki, R.; Fujii, J. A high-fat diet temporarily renders Sod1-deficient mice resistant to an oxidative insult. J. Nutr. Biochem. 2017, 40, 44–52. [Google Scholar] [CrossRef]
- Wang, M.; Kaufman, R.J. The impact of the endoplasmic reticulum protein-folding environment on cancer development. Nat. Rev. Cancer. 2014, 14, 581–597. [Google Scholar] [CrossRef]
- Luna-Marco, C.; Ubink, A.; Kopsida, M.; Heindryckx, F. Endoplasmic Reticulum Stress and Metabolism in Hepatocellular Carcinoma. Am. J. Pathol. 2023, 193, 1377–1388. [Google Scholar] [CrossRef] [PubMed]
- Sekiya, M.; Hiraishi, A.; Touyama, M.; Sakamoto, K. Oxidative stress induced lipid accumulation via SREBP1c activation in HepG2 cells. Biochem. Biophys. Res. Commun. 2008, 375, 602–607. [Google Scholar] [CrossRef] [PubMed]
- Lee, J.; Homma, T.; Kurahashi, T.; Kang, E.S.; Fujii, J. Oxidative stress triggers lipid droplet accumulation in primary cultured hepatocytes by activating fatty acid synthesis. Biochem. Biophys. Res. Commun. 2015, 464, 229–235. [Google Scholar] [CrossRef]
- Sato, Y.; Kojima, R.; Okumura, M.; Hagiwara, M.; Masui, S.; Maegawa, K.; Saiki, M.; Horibe, T.; Suzuki, M.; Inaba, K. Synergistic cooperation of PDI family members in peroxiredoxin 4-driven oxidative protein folding. Sci. Rep. 2013, 3, 2456. [Google Scholar] [CrossRef] [PubMed]
- Fujii, J.; Ochi, H.; Yamada, S. A comprehensive review of peroxiredoxin 4, a redox protein evolved in oxidative protein folding coupled with hydrogen peroxide detoxification. Free Radic. Biol. Med. 2024, 227, 336–354. [Google Scholar] [CrossRef]
- Iuchi, Y.; Okada, F.; Tsunoda, S.; Kibe, N.; Shirasawa, N.; Ikawa, M.; Okabe, M.; Ikeda, Y.; Fujii, J. Peroxiredoxin 4 knockout results in elevated spermatogenic cell death via oxidative stress. Biochem. J. 2009, 419, 149–158. [Google Scholar] [CrossRef]
- Zito, E; Chin, K. T.; Blais, J.; Harding, H.P.; Ron, D. ERO1-beta, a pancreas-specific disulfide oxidase, promotes insulin biogenesis and glucose homeostasis. J. Cell Biol. 2010, 188, 821–832. [Google Scholar] [CrossRef]
- Zito, E.; Hansen, H.G.; Yeo, G.S.; Fujii, J.; Ron, D. Endoplasmic reticulum thiol oxidase deficiency leads to ascorbic acid depletion and noncanonical scurvy in mice. Mol. Cell 2012, 48, 39–51. [Google Scholar] [CrossRef]
- Nabeshima, A.; Yamada, S.; Guo, X.; Tanimoto, A.; Wang, K.Y.; Shimajiri, S.; Kimura, S.; Tasaki, T.; Noguchi, H.; Kitada, S.; Watanabe, T.; Fujii, J.; Kohno, K.; Sasaguri, Y. Peroxiredoxin 4 protects against nonalcoholic steatohepatitis and type 2 diabetes in a nongenetic mouse model. Antioxid. Redox Signal. 2013, 19, 1983–1998. [Google Scholar] [CrossRef] [PubMed]
- Guo, X.; Noguchi, H.; Ishii, N.; Homma, T.; Hamada, T.; Hiraki, T.; Zhang, J.; Matsuo, K.; Yokoyama, S.; Ishibashi, H.; Fukushige, T.; Kanekura, T.; Fujii, J.; Uramoto, H.; Tanimoto, A.; Yamada, S. The Association of Peroxiredoxin 4 with the Initiation and Progression of Hepatocellular Carcinoma. Antioxid. Redox Signal. 2019, 30, 1271–1284. [Google Scholar] [CrossRef] [PubMed]
- Homma, T.; Kurahashi, T.; Lee, J.; Nabeshima, A.; Yamada, S.; Fujii, J. Double Knockout of Peroxiredoxin 4 (Prdx4) and Superoxide Dismutase 1 (Sod1) in Mice Results in Severe Liver Failure. Oxid. Med. Cell. Longev. 2018, 2018, 2812904. [Google Scholar] [CrossRef] [PubMed]
- Sentman, M.L.; Granström, M.; Jakobson, H.; Reaume, A.; Basu, S.; Marklund, S.L. Phenotypes of mice lacking extracellular superoxide dismutase and copper- and zinc-containing superoxide dismutase. J. Biol. Chem. 2006, 281, 6904–6909. [Google Scholar] [CrossRef]
- Ishii, N.; Homma, T.; Lee, J.; Mitsuhashi, H.; Yamada, K.I.; Kimura, N.; Yamamoto, Y.; Fujii, J. Ascorbic acid and CoQ10 ameliorate the reproductive ability of superoxide dismutase 1-deficient female mice. Biol. Reprod. 2020, 102, 102–115. [Google Scholar] [CrossRef]
- Cameron, E.; Pauling, L. Supplemental ascorbate in the supportive treatment of cancer: prolongation of survival times in terminal human cancer. Proc. Natl. Acad. Sci. USA. 1976, 73, 3685–3689. [Google Scholar] [CrossRef]
- Reczek, C.R.; Chandel, N.S. CANCER. Revisiting vitamin C and cancer. Science 2015, 350, 1317–1318. [Google Scholar] [CrossRef]
- Iuchi, Y.; Okada, F.; Onuma, K.; Onoda, T.; Asao, H.; Kobayashi, M.; Fujii, J. Elevated oxidative stress in erythrocytes due to a SOD1 deficiency causes anaemia and triggers autoantibody production. Biochem. J. 2007, 402, 219–227. [Google Scholar] [CrossRef]
- Horn, P; Tacke, F. Metabolic reprogramming in liver fibrosis. Cell Metab. 2024, 36, 1439–1455. [Google Scholar] [CrossRef]
- Shen, X.; Yu, Z.; Wei, C.; Hu, C.; Chen, J. Iron metabolism and ferroptosis in nonalcoholic fatty liver disease: what is our next step? Am. J. Physiol. Endocrinol. Metab. 2024, 326, E767–E775. [Google Scholar] [CrossRef]
- Yamamoto, M.; Kensler, T.W.; Motohashi, H. The KEAP1-NRF2 System: a Thiol-Based Sensor-Effector Apparatus for Maintaining Redox Homeostasis. Physiol. Rev. 2018, 98, 1169–1203. [Google Scholar] [CrossRef] [PubMed]
- Davies, K.J. Protein damage and degradation by oxygen radicals. I. general aspects. J. Biol. Chem. 1987, 262, 9895–9901. [Google Scholar] [CrossRef]
- Demasi, M.; Netto, L.E.; Silva, G.M.; Hand, A.; de Oliveira, C.L.; Bicev, R.N.; Gozzo, F.; Barros, M.H.; Leme, J.M.; Ohara, E. Redox regulation of the proteasome via S-glutathionylation. Redox Biol. 2013, 2, 44–51. [Google Scholar] [CrossRef] [PubMed]
- Stockwell, B.R. Ferroptosis turns 10: Emerging mechanisms, physiological functions, and therapeutic applications. Cell 2022, 185, 2401–2421. [Google Scholar] [CrossRef] [PubMed]
- Motooka, Y.; Toyokuni, S. Ferroptosis As Ultimate Target of Cancer Therapy. Antioxid. Redox Signal. 2023, 39, 206–223. [Google Scholar] [CrossRef]
- Rouault. T.A. The role of iron regulatory proteins in mammalian iron homeostasis and disease. Nat. Chem. Biol. 2006, 2, 406–414. [Google Scholar] [CrossRef]
- Njus, D.; Kelley, P.M.; Tu, Y.J.; Schlegel, H.B. Ascorbic acid: The chemistry underlying its antioxidant properties. Free Radic. Biol. Med. 2020, 159, 37–43. [Google Scholar] [CrossRef]
- Fujii, J.; Osaki, T.; Bo, T. Ascorbate Is a Primary Antioxidant in Mammals. Molecules 2022, 27, 6187. [Google Scholar] [CrossRef]
- Klaunig, J.E.; Kamendulis, L.M. The role of oxidative stress in carcinogenesis. Annu. Rev. Pharmacol. Toxicol. 2004, 44, 239–267. [Google Scholar] [CrossRef]
- Chen, Q.; Espey, M.G.; Sun, A.Y.; Lee, J.H.; Krishna, M.C.; Shacter, E.; Choyke, P.L.; Pooput, C.; Kirk, K.L.; Buettner, G.R.; Levine, M. Ascorbate in pharmacologic concentrations selectively generates ascorbate radical and hydrogen peroxide in extracellular fluid in vivo. Proc. Natl. Acad. Sci. USA. 2007, 104, 8749–8754. [Google Scholar] [CrossRef] [PubMed]
- Villagran, M.; Ferreira, J.; Martorell, M.; Mardones, L. The Role of Vitamin C in Cancer Prevention and Therapy: A Literature Review. Antioxidants 2021, 10, 1894. [Google Scholar] [CrossRef]
- Ghanem, A.; Melzer, A.M.; Zaal, E.; Neises, L.; Baltissen, D.; Matar, O.; Glennemeier-Marke, H.; Almouhanna, F.; Theobald, J.; Abu El Maaty, M.A.; Berkers, C.; Wölfl, S. Free Radic. Biol. Med. 2021, 163, 196–209. [CrossRef]
- Pozzer, D.; Invernizzi, R.W.; Blaauw, B.; Cantoni, O.; Zito, E. Ascorbic Acid Route to the Endoplasmic Reticulum: Function and Role in Disease. Antioxid. Redox Signal. 2021, 34, 845–855. [Google Scholar] [CrossRef]
- Castro, L.; Tórtora, V.; Mansilla, S.; Radi, R. Aconitases: Non-redox Iron-Sulfur Proteins Sensitive to Reactive Species. Acc Chem. Res. 2019, 52, 2609–2619. [Google Scholar] [CrossRef]
- Walter, P.; Ron, D. The unfolded protein response: from stress pathway to homeostatic regulation. Science 2011, 334, 1081–1086. [Google Scholar] [CrossRef] [PubMed]
- Hrycay, E.G.; Bandiera, S.M. Involvement of Cytochrome P450 in Reactive Oxygen Species Formation and Cancer. Adv. Pharmacol. 2015, 74, 35–84. [Google Scholar] [CrossRef] [PubMed]
- Ishii, N.; Homma, T.; Guo, X.; Yamada, K.I.; Yamada, S.; Fujii, J. Ascorbic acid prevents N-nitrosodiethylamine-induced hepatic injury and hepatocarcinogenesis in Akr1a-knockout mice. Toxicol. Lett. 2020, 333, 192–201. [Google Scholar] [CrossRef]
- McGettrick, A.F.; O'Neill, L.A.J. The Role of HIF in Immunity and Inflammation. Cell Metab. 2020, 32, 524–536. [Google Scholar] [CrossRef]
- Kaelin, W.G. Jr.; Ratcliffe, P.J. Oxygen sensing by metazoans: the central role of the HIF hydroxylase pathway. Mol. Cell 2008, 30, 393–402. [Google Scholar] [CrossRef]
- Mikkelsen SU, Gillberg L, Lykkesfeldt J, Grønbæk K. The role of vitamin C in epigenetic cancer therapy. Free Radic. Biol. Med. 2021, 170, 179–193. [Google Scholar] [CrossRef] [PubMed]
- Berretta, M.; Quagliariello, V.; Maurea, N.; Di Francia, R.; Sharifi, S.; Facchini, G.; Rinaldi, L.; Piezzo, M.; Manuela, C.; Nunnari, G.; Montopoli, M. Multiple Effects of Ascorbic Acid against Chronic Diseases: Updated Evidence from Preclinical and Clinical Studies. Antioxidants 2020, 9, 1182. [Google Scholar] [CrossRef] [PubMed]
- Homma, T.; Takeda, Y.; Nakano, T.; Akatsuka, S.; Kinoshita, D.; Kurahashi, T.; Saitoh, S.; Yamada, K.I.; Miyata, S.; Asao, H.; Goto, K.; Watanabe, T.; Watanabe, M.; Toyokuni, S.; Fujii, J. Defective biosynthesis of ascorbic acid in Sod1-deficient mice results in lethal damage to lung tissue. Free Radic. Biol. Med. 2021, 162, 255–265. [Google Scholar] [CrossRef]
- Kobayashi, S.; Harada, Y.; Homma, T.; Yokoyama, C.; Fujii, J. Characterization of a rat monoclonal antibody raised against ferroptotic cells. J. Immunol. Methods. 2021, 489, 112912. [Google Scholar] [CrossRef]
- Matsuoka, Y.; Yamato, M.; Yamasaki, T.; Mito, F.; Yamada, K. Rapid and convenient detection of ascorbic acid using a fluorescent nitroxide switch. Free Radic. Biol. Med. 2012, 53, 2112–2118. [Google Scholar] [CrossRef] [PubMed]
- Osaki, T.; Sugiyama, D.; Magari, Y.; Souri, M.; Ichinose, A. Rapid immunochromatographic test for detection of anti-factor XIII A subunit antibodies can diagnose 90 % of cases with autoimmune haemorrhaphilia XIII/13. Thromb. Haemost. 2015, 113, 1347–1356. [Google Scholar] [CrossRef]
- Homma, T.; Fujiwara, H.; Osaki, T.; Fujii, S.; Fujii, J. Consequences of a peroxiredoxin 4 (Prdx4) deficiency on learning and memory in mice. Biochem. Biophys. Res. Commun. 2022, 621, 32–38. [Google Scholar] [CrossRef]
- Schwanhäusser, B.; Busse, D.; Li, N.; Dittmar, G.; Schuchhardt, J.; Wolf, J.; Chen, W.; Selbach, M. Global quantification of mammalian gene expression control. Nature 2011, 473, 337–342. [Google Scholar] [CrossRef]
- Kobayashi, S.; Homma, T.; Okumura, N.; Han, J.; Nagaoka, K.; Sato, H.; Konno, H.; Yamada, S.; Takao, T.; Fujii, J. Carnosine dipeptidase II (CNDP2) protects cells under cysteine insufficiency by hydrolyzing glutathione-related peptides. Free Radic. Biol. Med. 2021, 174, 12–27. [Google Scholar] [CrossRef]
- Kobayashi, S; Hamashima, S. ; Homma, T.; Sato, M.; Kusumi, R.; Bannai, S.; Fujii, J.; Sato, H. Cystine/glutamate transporter, system xc-, is involved in nitric oxide production in mouse peritoneal macrophages. Nitric Oxide 2018, 78, 32–40. [Google Scholar] [CrossRef]
- Schneider, C.A.; Rasband, W.S.; Eliceiri, K.W. "NIH Image to ImageJ: 25 years of image analysis". Nat. Methods. 2012, 9, 671–675. [Google Scholar] [CrossRef] [PubMed]
- Okuda, S.; Watanabe, Y.; Moriya, Y.; Kawano, S.; Yamamoto, T.; Matsumoto, M.; Takami, T.; Kobayashi, D.; Araki, N.; Yoshizawa, A.C.; Tabata, T.; Sugiyama, N.; Goto, S.; Ishihama, Y. jPOSTrepo: an international standard data repository for proteomes. Nucleic Acids Res. 2017, 45, D1107–D1111. [Google Scholar] [CrossRef] [PubMed]
Figure 1.
Asc alleviated tumor development and death rates in DKO mice (A) Plasma Asc was measured using a fluorescent probe. The animal numbers are listed parenthetically. (B) Male DKO mice with (1.5 mg/ml in drinking water) or without Asc supplementation were observed for up to one year; N=10 each. (C) Representative livers of DKO mouse at indicated ages. Incidences of tumor-bearing mice in four genetic groups of mice. Asc was supplemented to groups of SOD1KO and DKO mice. Mice were euthanized after one year, and the numbers of visible hepatic tumors were determined. **, P<0.01; ***, P<0.001.
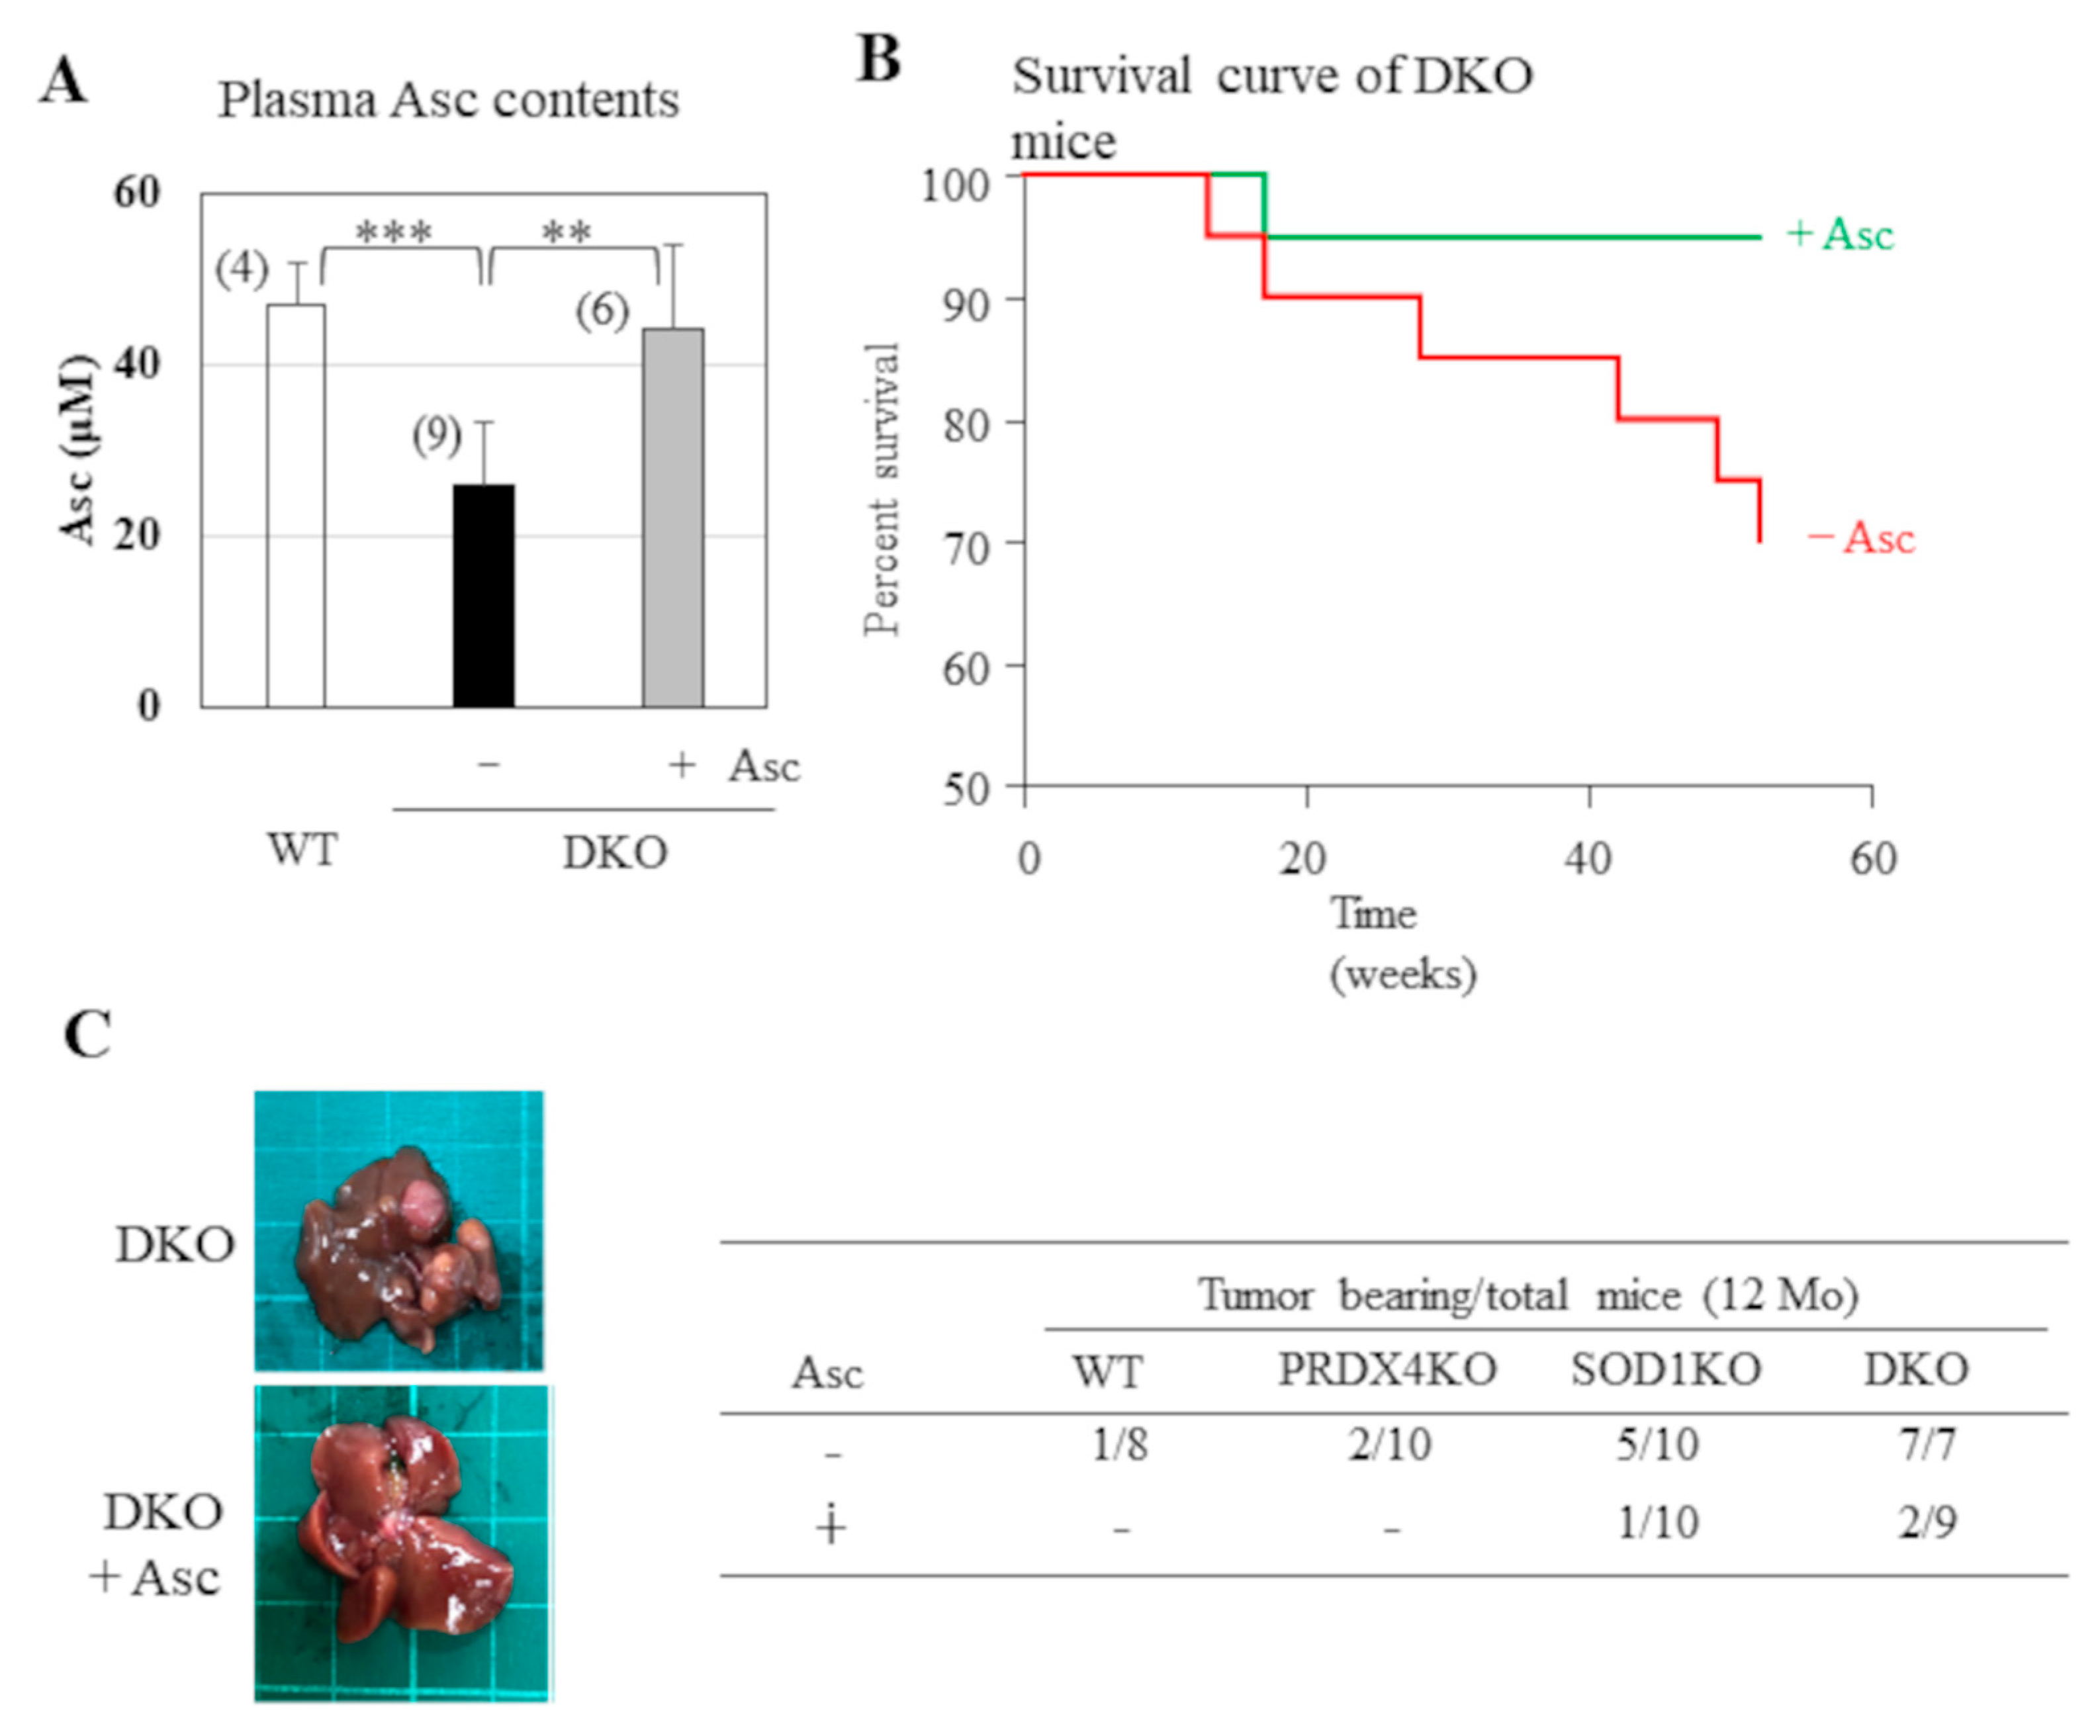
Figure 2.
Histological analyses of mice livers. (A) Liver sections (5 µm in thickness) of WT, DKO, and DKO mice supplemented with Asc (DKO + Asc) at 12 months of age were subjected to H&E staining and immunohistochemical staining using FerAb. (B) Cancer and precancerous areas are indicated by the red arrows and dotted lines, respectively. N=4 each.
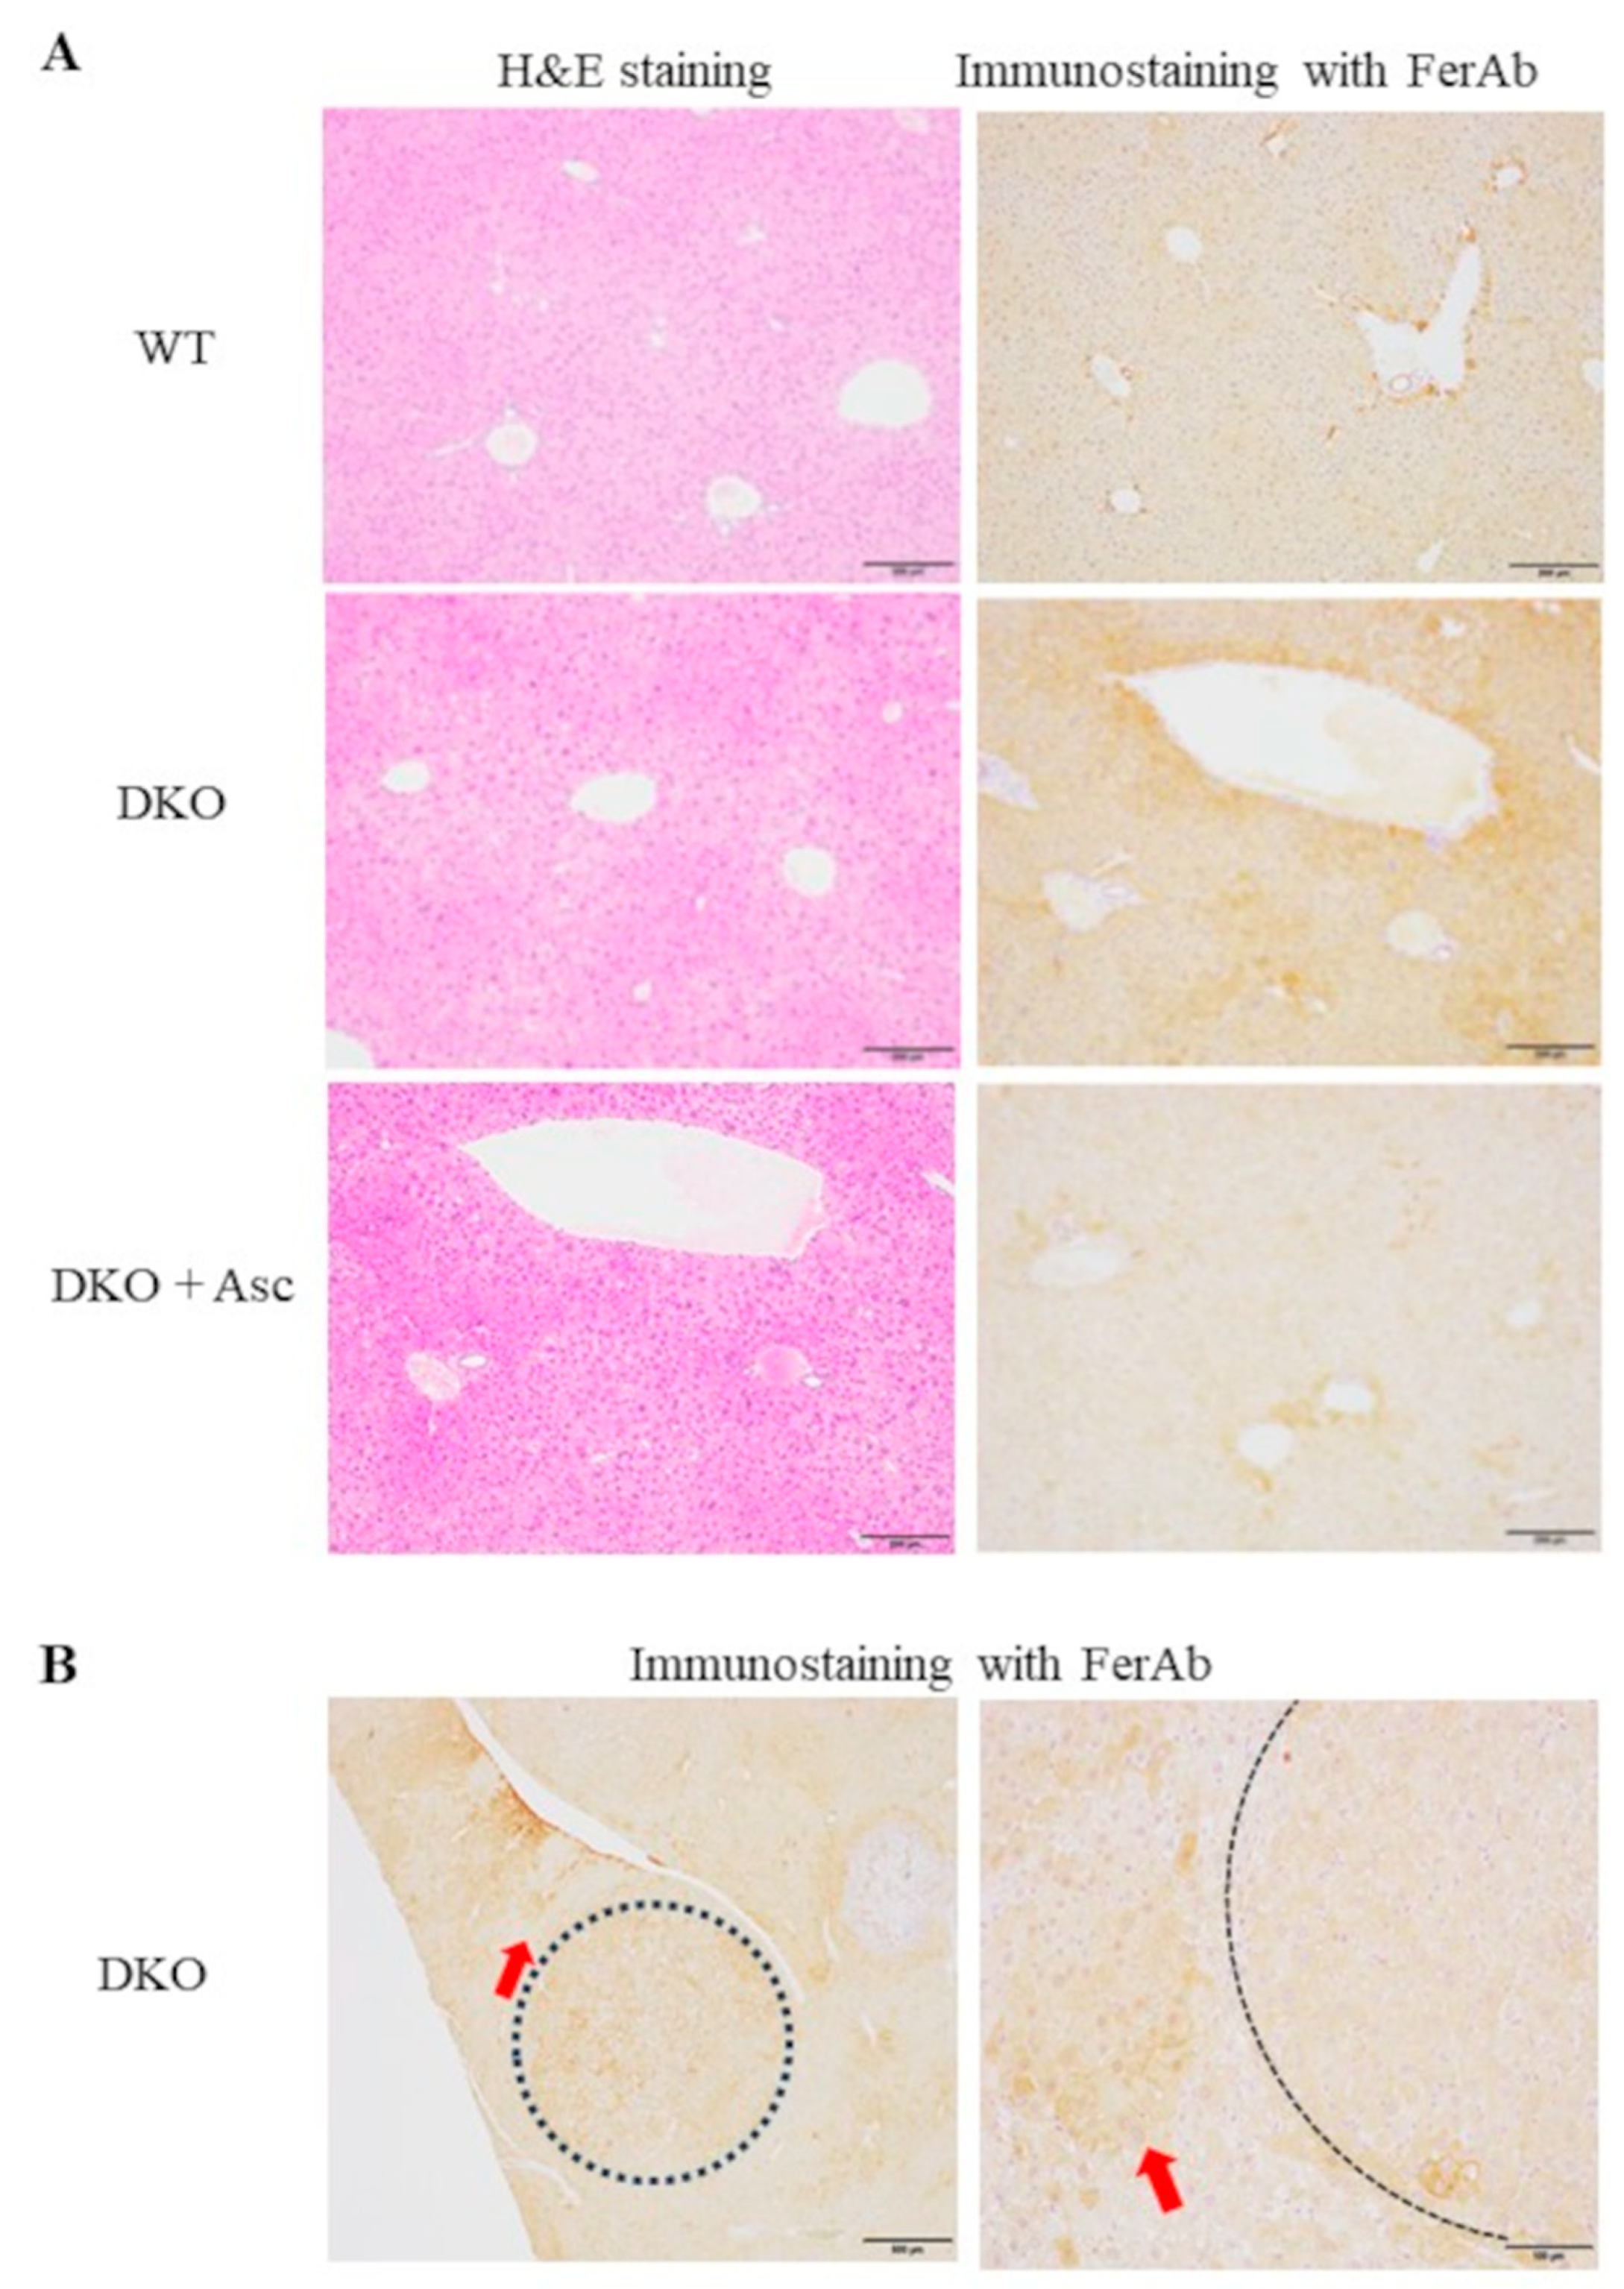
Figure 3.
Proteomic analyses of the livers of WT mice and DKO mice with or without Asc supplementation. Proteins were extracted from the liver tissues of mice at 8 months of age and subjected to trypsinization followed by proteomic analyses via nLC-MS/MS. (A) The volcano plot of the data compares the proteins in DKO mice vs. those in WT mice (left panel) and proteins in DKO mice supplemented with Asc (DKO + Asc) vs. proteins in WT mice (right panel). The blue and red lines indicate 0.5- and 2-fold levels in DKO mice against the levels in WT and levels in DKO mice supplemented with Asc against levels in WT mice, respectively. (B) The Venn diagram indicates the numbers of proteins that were either upregulated (left: ratio > 1.5; P-value < 0.05) or downregulated (right: ratio < 0.67; P-value < 0.05) between two mice groups. The results of the GO enrichment analysis of the proteomics data appear at the bottom. P-value < 1.0E-10; Fold enrichment > 15. Number of animals is 3 each.
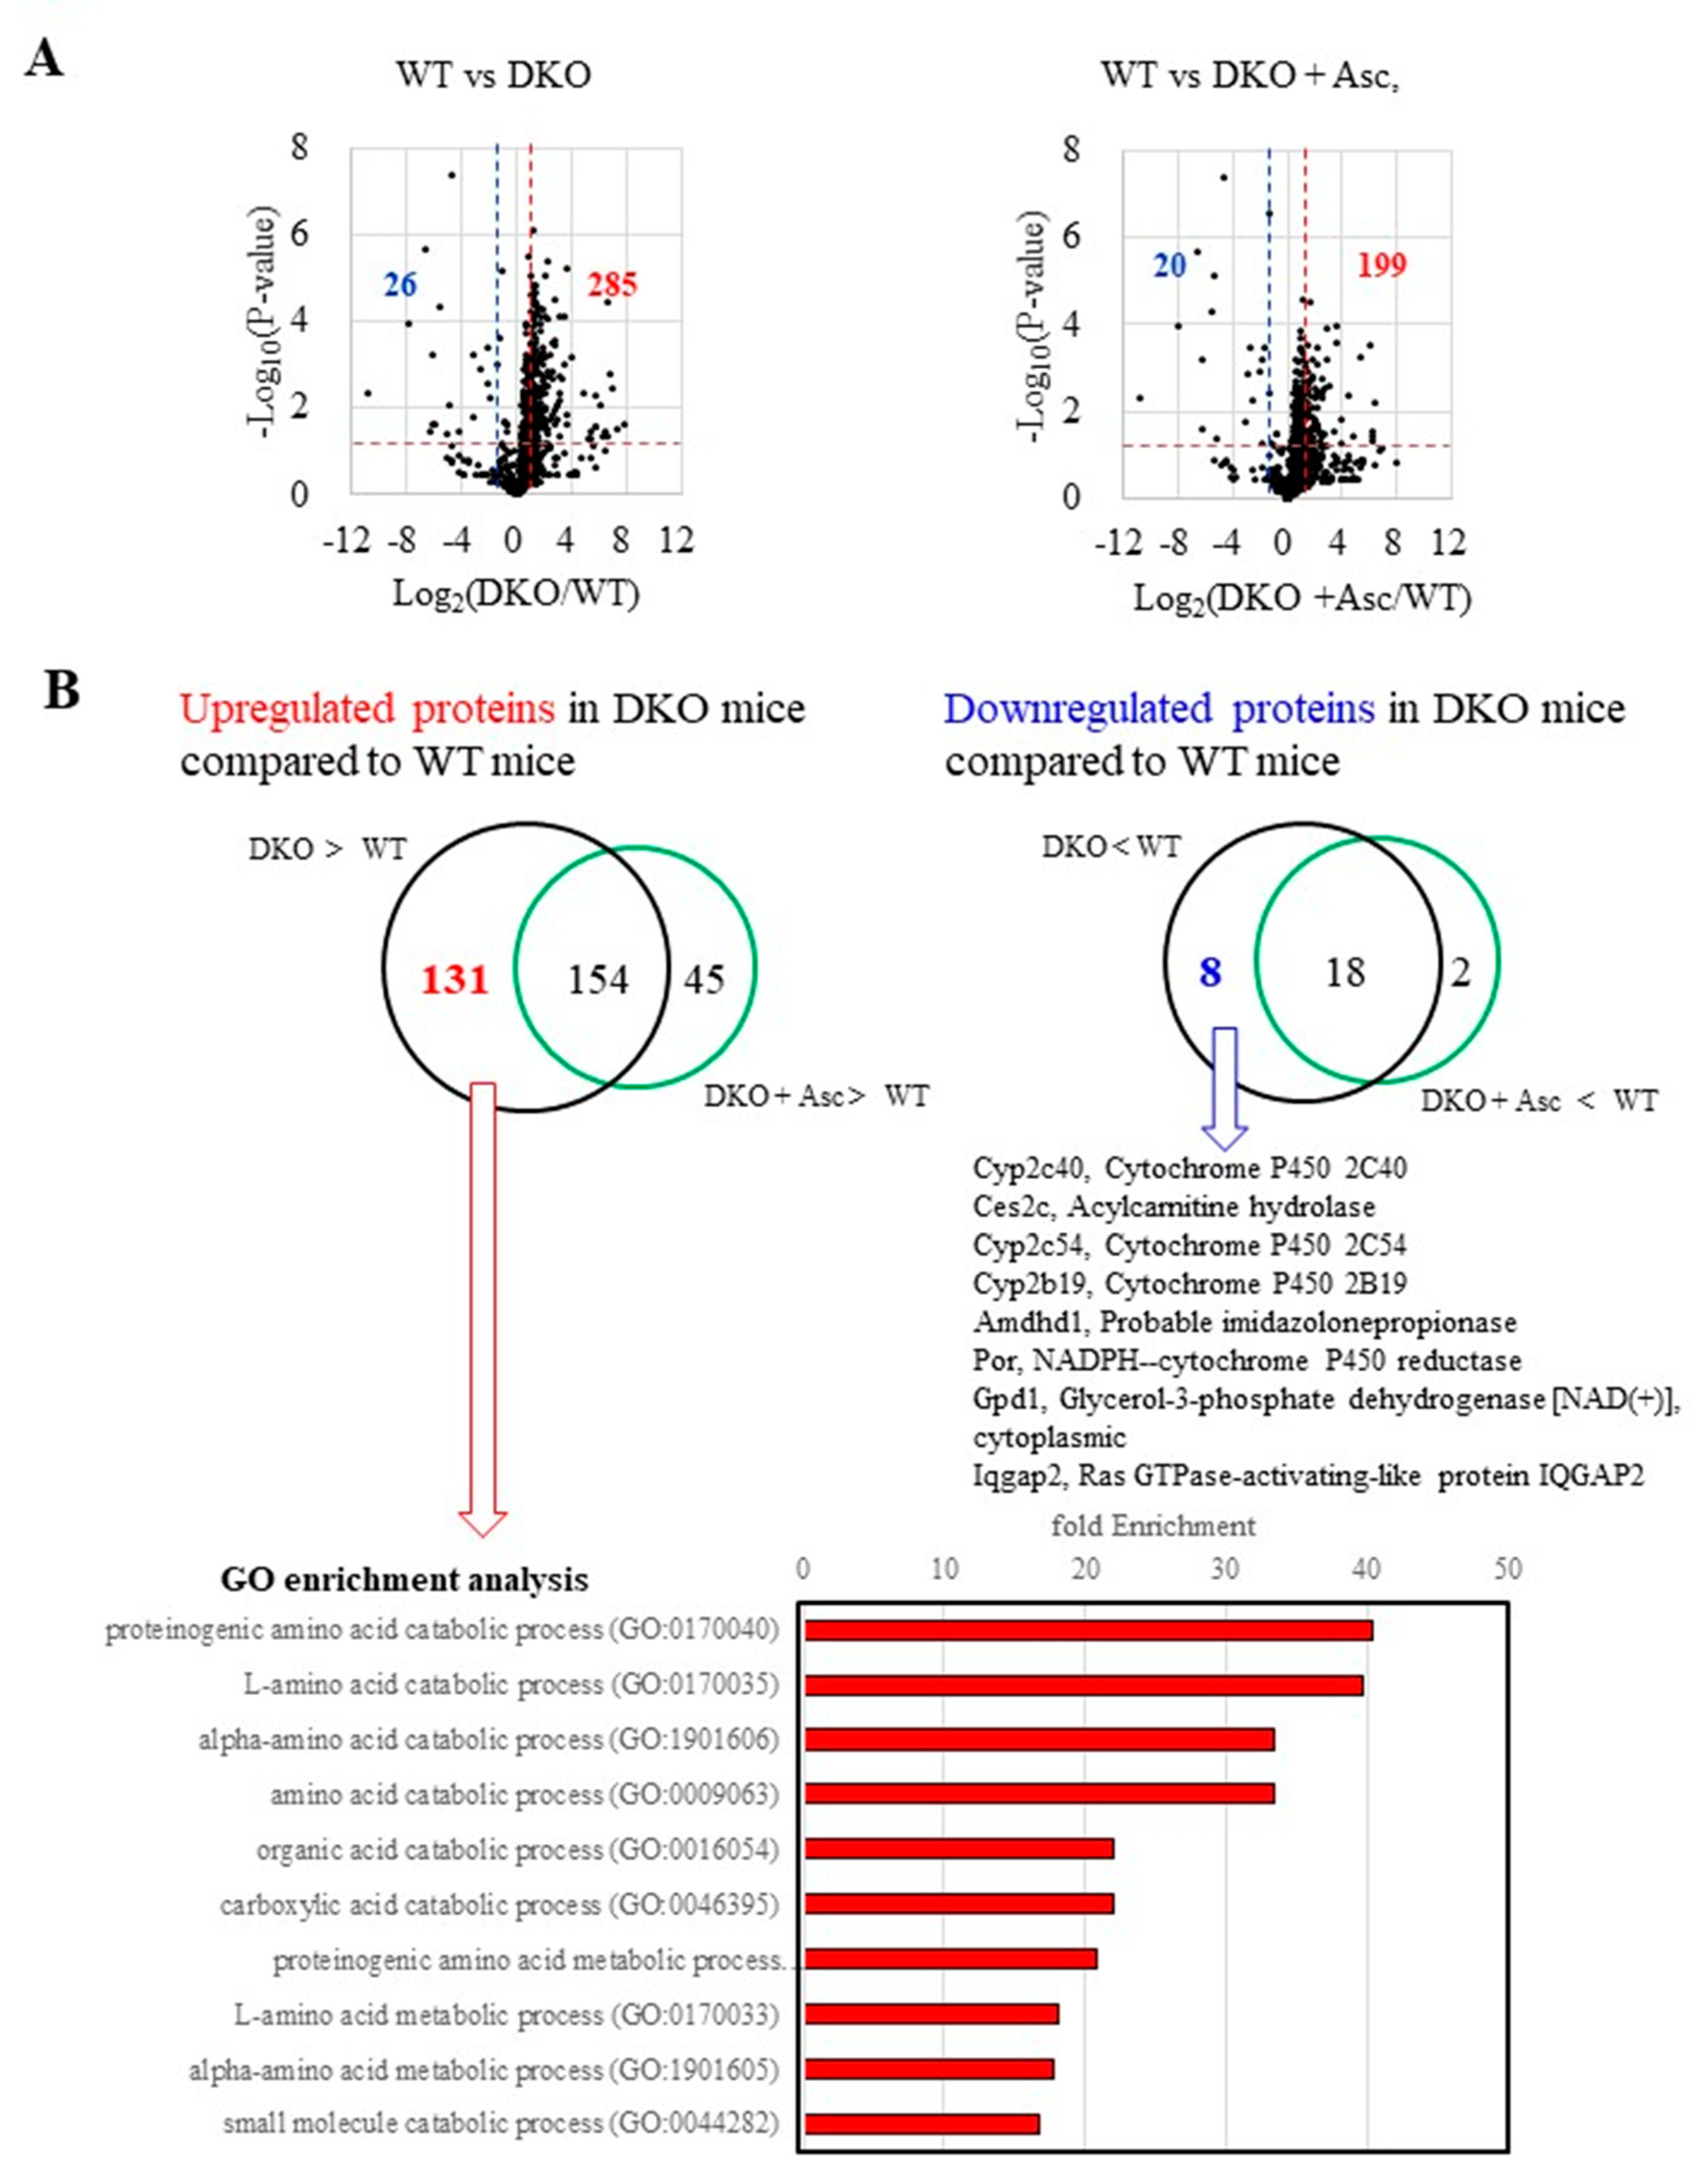
Figure 4.
Comparison of metabolites among three mice groups. Soluble components were extracted from liver tissues and subjected to analyses by means of nLC-MS/MS. (A) The volcano plot of the data compares the proteins in DKO mice vs. the proteins in WT mice (left panel) and the proteins in DKO mice supplemented with Asc (DKO + Asc) vs. the proteins in WT mice (middle panel). The blue and red lines indicate 0.5- and 2-fold levels for the DKO mice against the levels for WT mice and those of DKO mice supplemented with Asc against those of WT mice, respectively. (B) The Venn diagram indicates the numbers of metabolites that were either upregulated (left: ratio > 1.5; P-value < 0.05) or downregulated (right: ratio < 0.67; P-value < 0.05) between two mice groups. The metabolites that were either elevated or decreased in DKO mouse but normalized by the Asc supplementation are listed. Number of animals is 3 each.
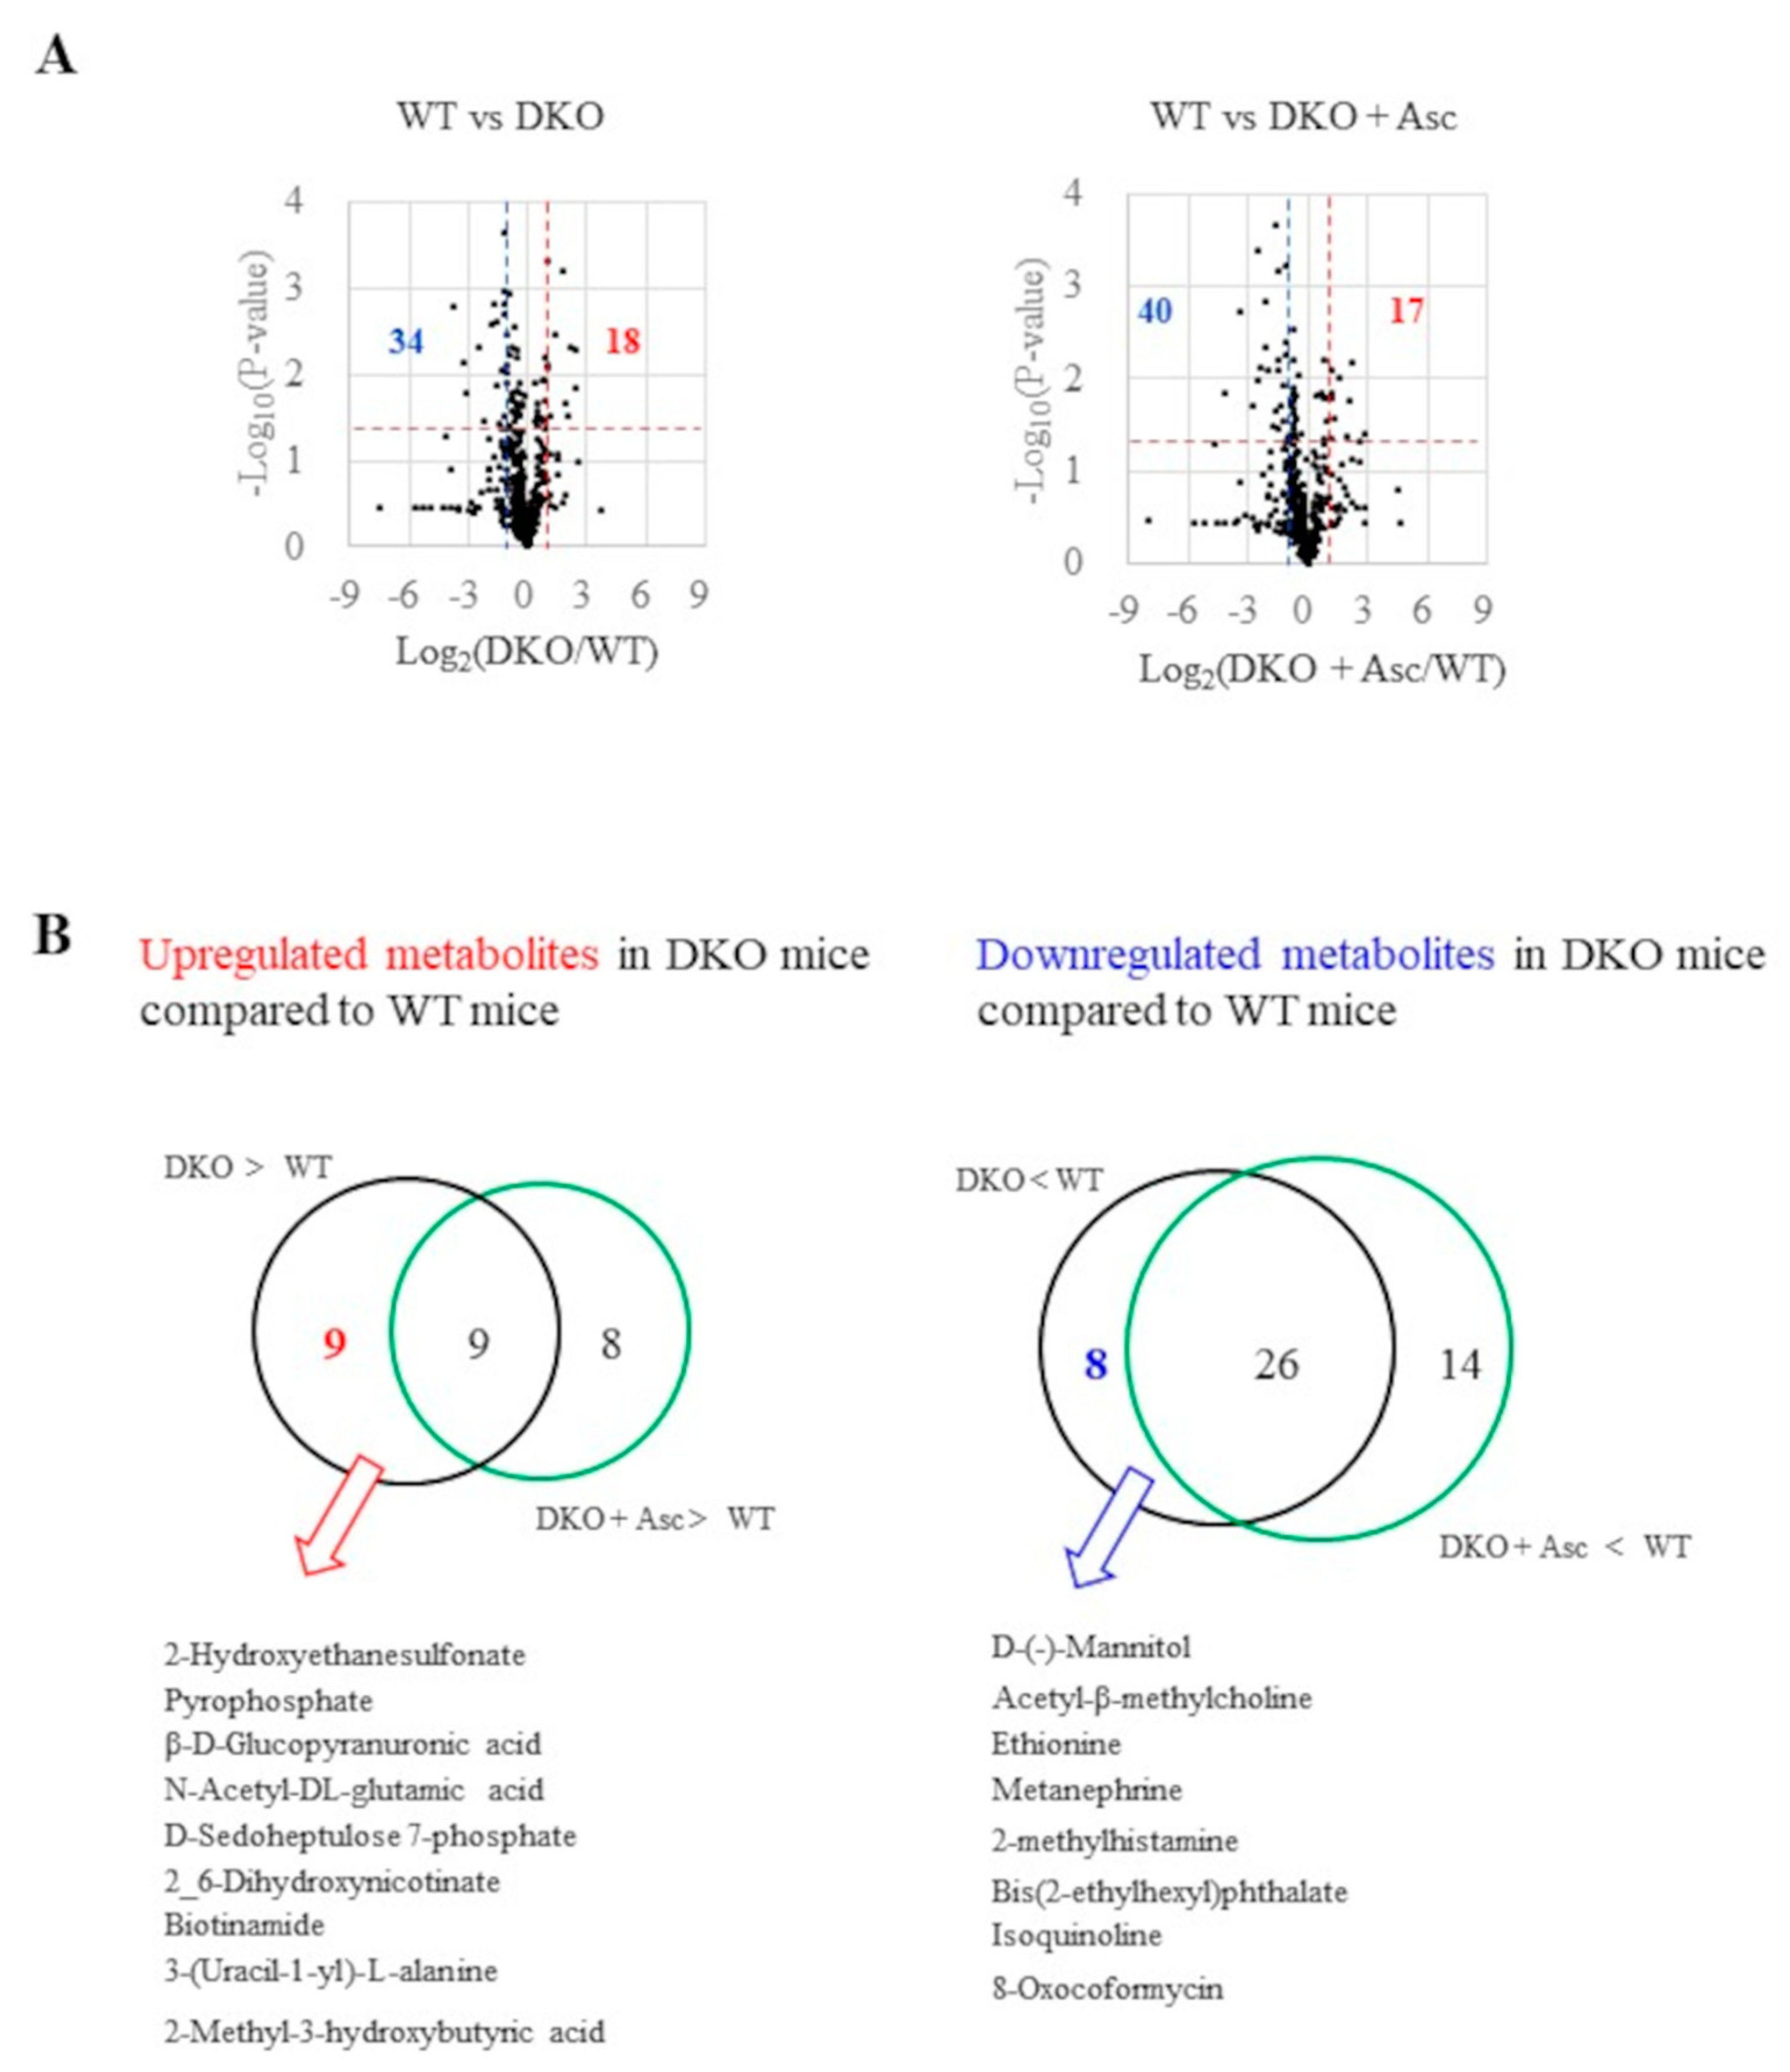
Figure 5.
Changes in metabolites among three groups of mice. (A) A heat map of glycometabolism and amino acids for three groups of mice. (B) Representative metabolites of central metabolism are depicted in the scheme of glycolysis that is linked to the pentose phosphate pathway and in the TCA cycle as it is linked to the urea cycle.
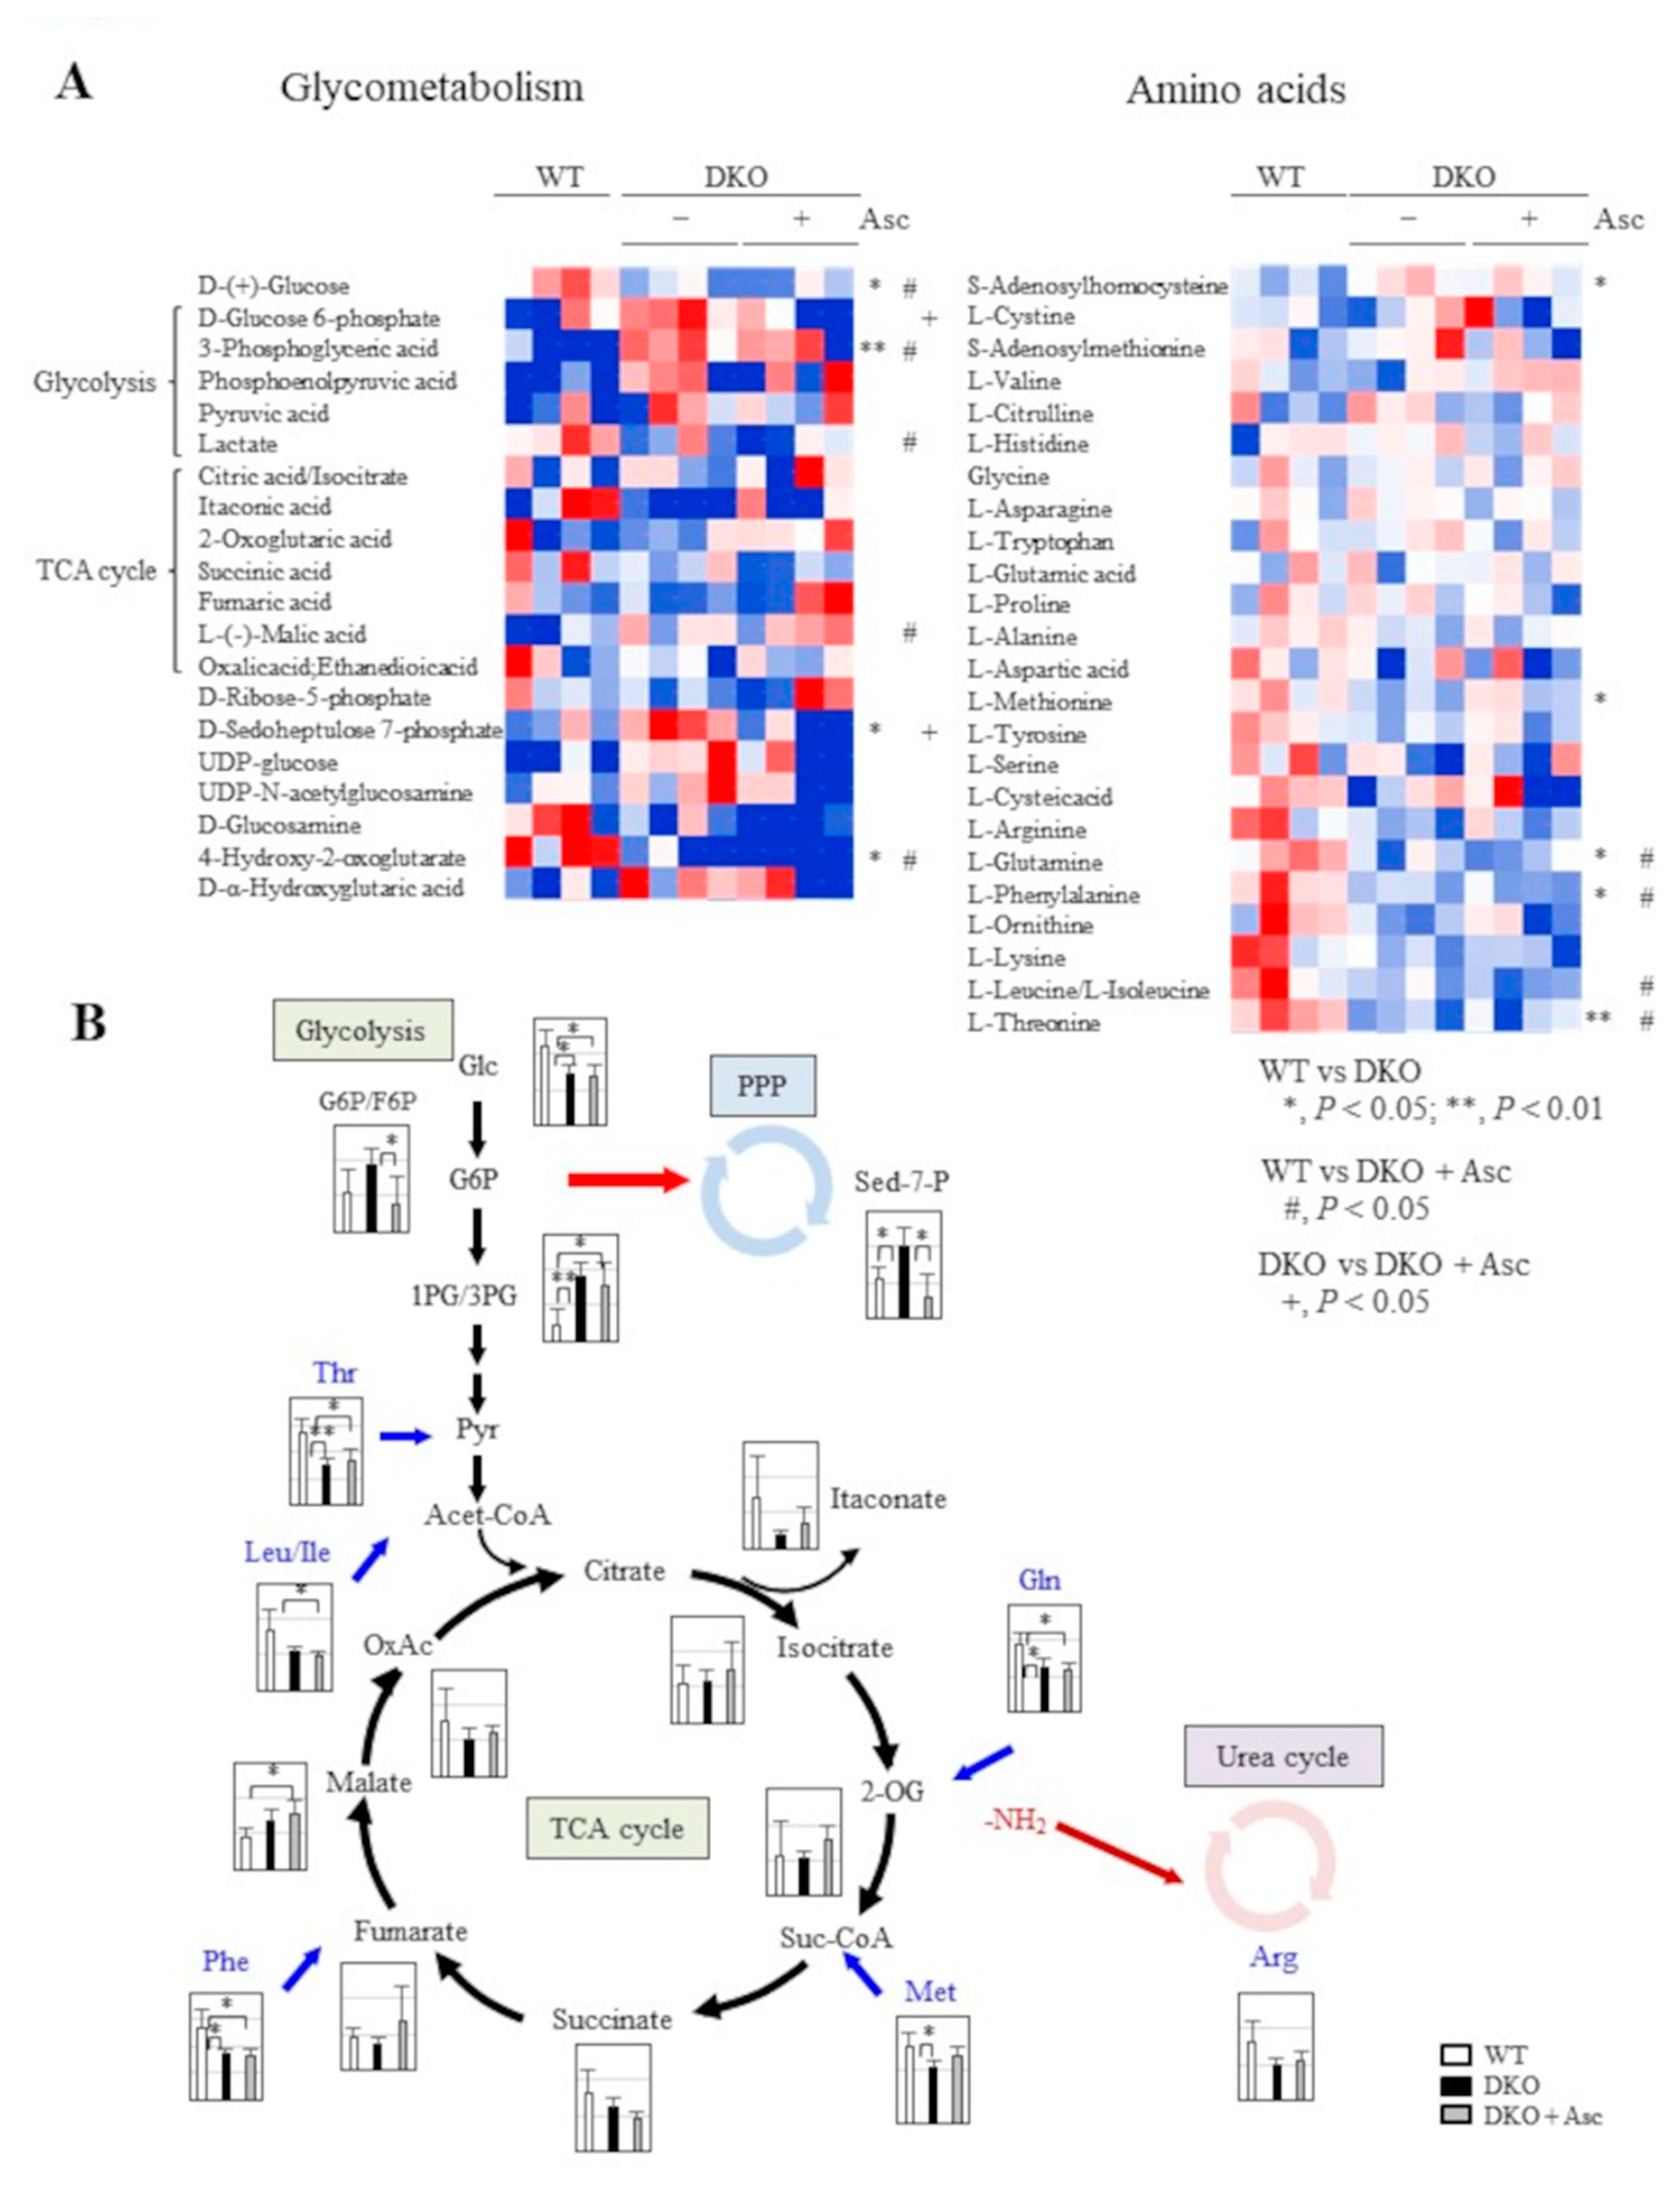
Figure 6.
Upregulation of antioxidant proteins and changes in Nrf2 in the liver. (A) A heat map of the antioxidant proteins (GO;0006979: response to oxidative stress; 35/412 proteins) among three groups of mice. (B) Immunoblot analysis was performed on liver proteins using an antibody against anti-Nrf2 antibody (top panels). The signal intensity was quantified using ImageJ software and is expressed here relative to the histone H2A band (middle panel). Nrf2 mRNA was measured using quantitative PCR and is expressed here relative to β-actin mRNA (bottom panel). The numbers of animals are shown in parentheses. (C) The abundance of Nrf2 relative to histone H2A was plotted against the body weights in each group of mice.
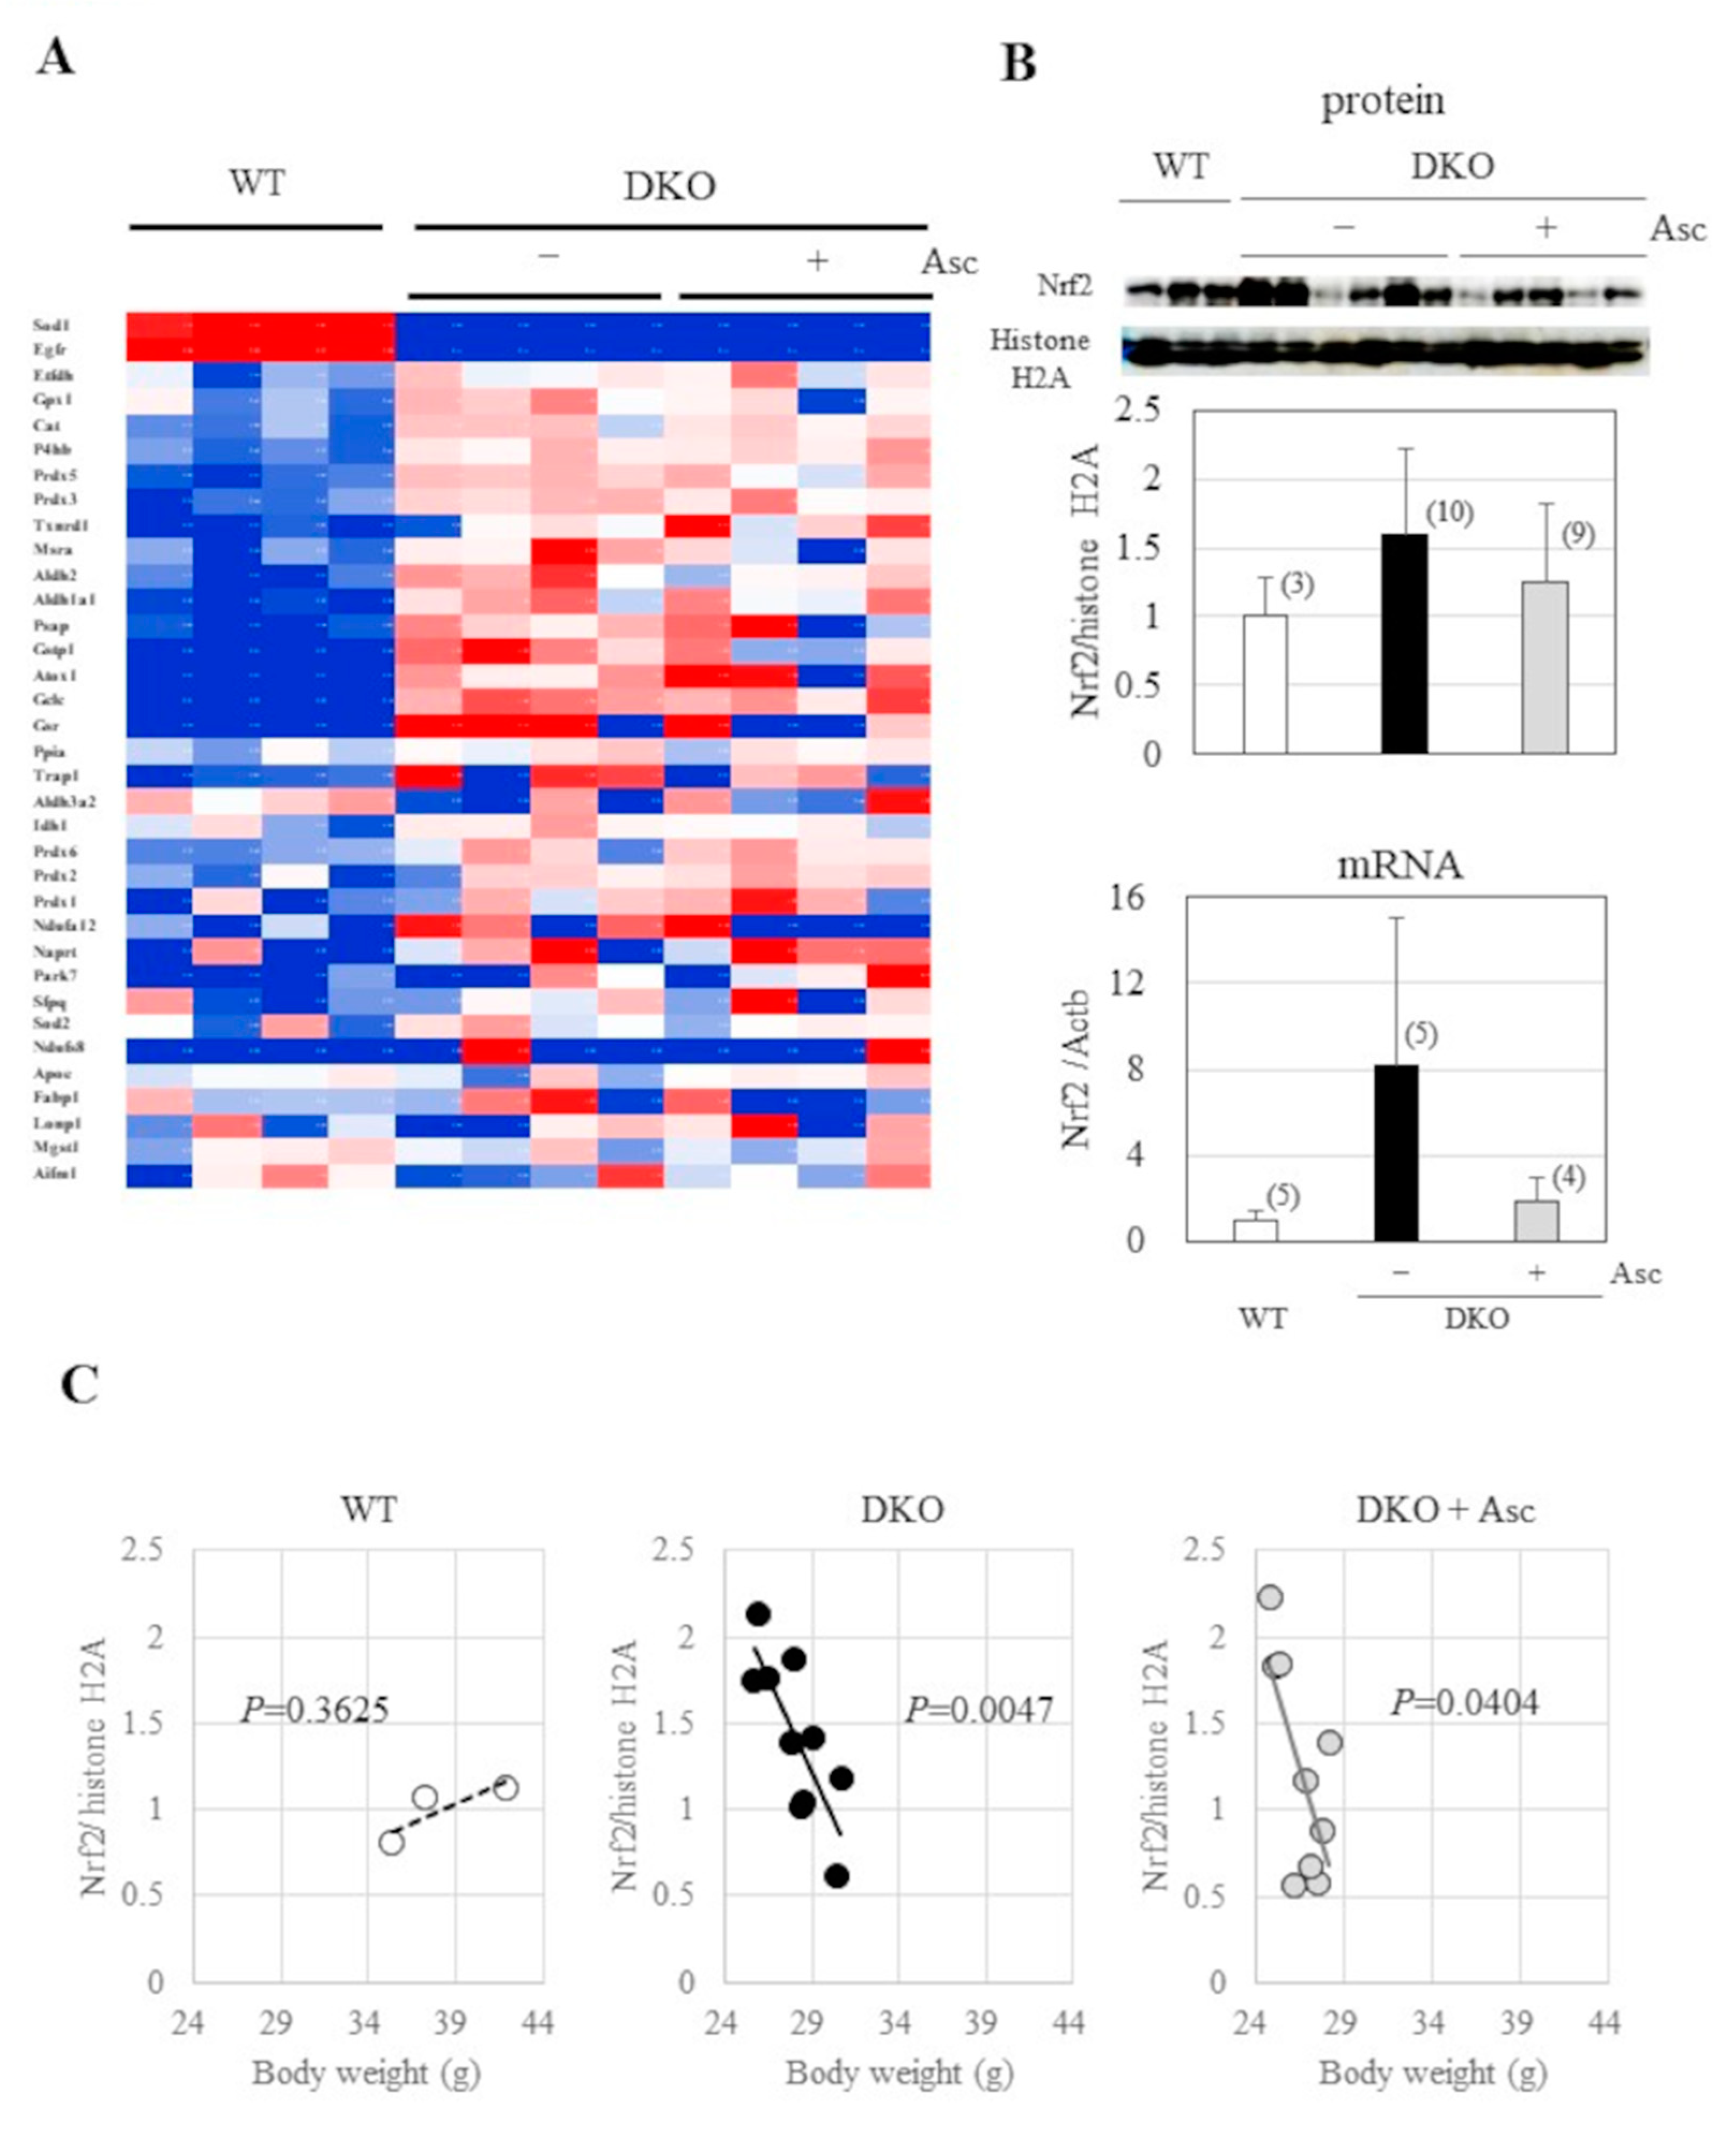
Figure 7.
Changes in the status of ACOs and iron (A) Immunoblot analysis was performed on liver proteins using an antibody against SOD1, PRDX4, ACO1, and ACO2 and beta-actin. The signal intensity was quantified using ImageJ software and is expressed relative to the β-actin band. ***, P<0.001 (B) Aconitase activity was determined using a commercial assay kit without a further addition of iron. (C) Iron contents were determined using an iron assay kit; N=4 each in all experiments.
Disclaimer/Publisher’s Note: The statements, opinions and data contained in all publications are solely those of the individual author(s) and contributor(s) and not of MDPI and/or the editor(s). MDPI and/or the editor(s) disclaim responsibility for any injury to people or property resulting from any ideas, methods, instructions or products referred to in the content. |
© 2025 by the authors. Licensee MDPI, Basel, Switzerland. This article is an open access article distributed under the terms and conditions of the Creative Commons Attribution (CC BY) license (http://creativecommons.org/licenses/by/4.0/).
Copyright: This open access article is published under a Creative Commons CC BY 4.0 license, which permit the free download, distribution, and reuse, provided that the author and preprint are cited in any reuse.


