
Submitted:
18 May 2025
Posted:
20 May 2025
You are already at the latest version
Abstract
Determining carbon sources and sinks is crucial for understanding the global carbon cycle; however, the enigma of the 'missing' sinks remains unresolved. Recent studies have proposed carbonate weathering as a potential carbon sink, underscoring the need to clarify its mechanisms. Previous investigations of carbonate weathering largely relied on soil profiles, which were limited by the rarity of incipient weathering layers. Therefore, we have little knowledge about carbonate incipient weathering processes. To address this gap, spheroidal-weathered dolostones were collected from Neoproterozoic Liangjiehe Formation (Nanhua System) in Guizhou, China. The pristine dolostone exhibits δ13C values ranging from -5.26 to -3.35‰ and δ18O values from -13.79 to -12.83‰. These isotopic signatures suggest that the dolostone formed under the high-latitude, cold climatic conditions that were prevalent during the Nanhua Period. Comprehensive petrographic and geochemical analyses of the spheroidal-weathered dolostones revealed two distinct stages of incipient weathering. In Stage I, nickel (Ni) and cobalt (Co) contents decrease. The δ13C values fluctuate between -7.61 and -2.52‰, while δ18O values range from -12.22 to -8.06‰. These observations indicate a weakly acidic microenvironment. In Stage II, there is an enrichment of manganese (Mn), with δ13C values extending from -16.56 to -12.43‰ and δ18O values from -8.46 to -7.03‰. These clues suggest a transition to a neutral microenvironment, with the isotopic compositions of carbon and oxygen in the dolomite influenced by atmospheric carbon dioxide (CO2) and atmospheric precipitation. This study presents a pioneering investigation into the mineralogical and geochemical variations associated with carbonate incipient weathering processes. The variation in C-O isotopes during carbonate incipient weathering may indicate the re-precipitation of HCO3⁻, suggesting that the carbon-sink contribution of carbonate weathering to the global carbon cycle could be overestimated.
Keywords:
carbonate
; spheroidal weathering
; carbon isotope
; oxygen isotope
; REEs
1. Introduction
Subtle variations in the global carbon cycle can lead to significant fluctuations in atmospheric CO2 concentrations, thereby influencing the stability of the global climate[1,2,3]. To mitigate the greenhouse effect and combat global warming, it is essential to have a comprehensive understanding of the mechanisms that govern the global carbon cycle, including its sources, sinks, and their spatio-temporal distributions[1,2]. Previous research has extensively focused on terrestrial carbon sinks, particularly in relation to forest carbon sequestration and agricultural soil erosion sinks[4,5]. However, even after accounting for net forest carbon sequestration within terrestrial carbon sink systems, the global carbon cycle remains unbalanced, highlighting the well-documented phenomenon known as the ‘missing carbon sink’ [6,7]. Recently, carbonate weathering has emerged as a crucial component of the global carbon sink system, significantly influencing the regulation of global climate change [1,6,8]. Through biogeochemical processes such as the global water cycle and aquatic photosynthesis, the dissolution of carbonate rocks contributes to carbon sequestration over both short and long time scales, potentially addressing the gaps in the global carbon sink framework[2,6,8]. During the weathering-induced dissolution process, carbonate rocks absorb atmospheric CO2. Compared to other minerals, carbonate minerals exhibit a higher susceptibility to dissolution, thereby providing substantial capacity for carbon sequestration[1]. The reaction equation of carbonate weathering is shown as follows: CaCO3(s)+CO2(g)+H2O(l)⇌Ca2+(aq)+2HCO3−(aq). This is a reversible reaction process. Under laboratory conditions, the reverse reaction occurs easily, releasing CO2 again. However, in natural conditions, the addition of exogenic waters such as atmospheric precipitation and surface runoff dilutes HCO3- and Ca2+, preventing the reaction from reaching equilibrium[9]. During the weathering process, CO2 is converted into the form of HCO3-, which is transported to the ocean, rivers, aquatic plants, and caves where it is sequestered, with only a small portion being re-released[10,11]. Carbonate weathering contributes approximately 0.5–0.9 Pg C yr−1 to the global carbon cycle, which is about 0.45–0.82 times that of forest ecosystem carbon sinks[12,13]. Therefore, carbonate weathering is considered an important missing carbon source. As carbonate weathering serves as a vital pathway for reducing atmospheric CO2 and maintaining equilibrium between carbon sources and sinks, understanding its entire processes is critical for research on global climate change and achieving carbon neutrality goals.
Extensive research has already been conducted on carbonate weathering, leading to significant advancements in understanding weathering rates, soil formation, and mineralization dynamics[8,11]. Traditional studies have relied on weathered soil profiles to elucidate elemental migration patterns during the weathering process[14,15]. Utilizing weathered soil profiles to reveal carbonate weathering is difficult because soil composition is complex. In addition to in situ weathering, soil may also be influenced by dust deposition, the transport of external water, and soil filtration. These factors can significantly hinder our understanding of carbonate weathering[14,15,16]. In addition, the intense weathering of carbonate rocks often makes it challenging to preserve the incipient weathering layer within soil profiles, thereby hindering researchers' ability to understand the incipient weathering process[14,15]. To our knowledge, there is a research gap in understanding the carbonate incipient weathering processes, as well as the associated elemental and isotopic changes. Previous researchers have not yet provided a clear definition of 'carbonate incipient weathering'. Given that carbonate incipient weathering is a crucial part of the overall carbonate weathering process, studying it is of great importance for understanding laterite formation and the role of carbonate weathering in carbon dioxide sequestration.
Guizhou Province, a paradigm of karst topography replete with carbonate rocks, is of particular interest. In the Datangpo region, mining and road construction have generated numerous artificial carbonate rock exposures. Notably, the dolomite lens of the Liangjiehe Formation, interbedded within sandstone, is relatively unaffected by other factors. Having been exposed to the air for merely a few years, it has formed a carbonate spheroidal weathering crust but has not yet weathered into soil. This makes it an ideal subject for studying the carbonate incipient weathering processes. The mineralogical and geochemical characteristics of spheroidal-weathered dolostones from the Liangjiehe Formation may be affected by carbonate incipient weathering, thereby documenting fluid sources and environmental alterations throughout these processes. With advancements in in-situ analytical techniques, we are now able to investigate the detailed mineralogy, geochemistry, and isotopic geochemistry of spheroidal-weathered dolostones, from core to rim, to elucidate the processes and mechanisms involved in carbonate incipient weathering.
Consequently, this study collected lenticular, spheroidal-weathered dolostones from the Liangjiehe formation in Zhaiying Town, Songtao County, Guizhou Province, China. Comprehensive investigations were conducted into the mineralogy, geochemistry, and isotopic geochemistry to explore the processes associated with carbonate incipient weathering.
2. Geological setting
The study area is located in the Datangpo region of Songtao County, Guizhou Province, China. Geologically, it lies at the intersection of the southeastern margin of the Yangtze Block, within the Nanhua Basin, and the Jiangnan Orogenic Belt (Figure 1a & Figure 1b). This extensional basin was formed as a result of the global breakup of the Rodinia supercontinent[17,18]. The basin contains a series of carbonate rocks, including rhodochrosite and dolomite[19]. The stratigraphic sequence in the study area is part of the Nanhua System (Figure 1b), which includes the following formations, listed from oldest to youngest: Liangjiehe Formation, Tiesiaoao Formation, Datangpo Formation, and Nantuo Formation[17]. An angular unconformity is observed between the Liangjiehe Formation of the Nanhua System and the underlying Banxi Group of the Qingbaikou System[17,20]. The Nantuo Formation of the Nanhua System is in para-unconformity contact with the Doushantuo Formation[21]. The low-temperature sedimentary sequence of the Nanhua System records two glacial events. The mixed rocks and sandstones of the Liangjiehe and Tiesiaoao Formations are indicative of the Sturtian glaciation (~720-663 Ma), which is characterized by poor roundness[22]. In contrast, the glaciomarine mixed rocks, siltstones, and sandstones of the Nantuo Formation document the Marinoan glaciation (~654-635 Ma), with thicknesses ranging from 60 to 200 meters[19,21]. The Datangpo Formation consists of interglacial sediments deposited between the Sturtian and Marinoan glaciations. It spans approximately 10 million years (~663-654 Ma), is conformably in contact with both the underlying Tiesiaoao Formation and the overlying Nantuo Formation, and has a thickness that varies between 30 and 700 meters[19].
3. Material and Method
The samples used in this study were primarily obtained from the Liangjiehe (Figure 1c). These samples are fragments from spheroidal-weathered dolostones. Within the sandstone of the Liangjiehe Formation, there is a lenticular spheroidal-weathered dolostone measuring approximately 126 cm in length and 32 cm in width (Figure 1f). Its surface displays a reddish-brown weathering crust with a laminated texture (Figure 2a & Figure 2b). The lenticular dolostone was located beside a mine-pit road and have been exposed due to the recent construction of the mine-pit road. The lenticular dolostone shows typical spheroidal weathering crust but has not yet weathered into soil. When struck with a hammer, it reveals three distinct layers from the inside out (Figure 2a): a bluish-grey layer (P zone), a yellowish-brown layer (S1 zone), and a reddish-brown layer (S2 zone).
3.1. Petrographic Observation
To observe mineral-phase transformations, samples include three-layer of spheroidally weathered dolostone were made into thin sections and analyzed using a microscope for mineral identification. Those sections were prepared using the Struers Labotom-15 cutting machine, selecting appropriate cross for sectioning. These were then flattened and polished with the Struers Tegramin polisher. Crystal Bond was applied to adhere the polished setions to glass slides, followed by cutting 200 μm sub-sections with the Struers Accutom-50 and final polishing to a thickness of approximately 40-60 μm.
After preparation, these sections were photographed using a stereo microscope (Leica EZ4W) to identify minerals species. Polarizing microscopy (Zeiss Scope.A1) was employed to observe and document the characteristics and positions.
3.2. Scanning Electron Microscopy (SEM)
To elucidate mineral phase variations in different spheroidal weathered crust layer, SEM-EDS analysis was performed. SEM experiments were conducted at the Guangdong Marine Resources and Coastal Engineering Laboratory, where gold-sputtered samples were mounted on conductive tape and placed in the evacuated chamber of a VEGA3 TESCAN field-emission SEM. Images were captured in backscatter mode at 20 kV and 1 nA, with a scan speed of approximately 90 s per image. EDS spectra, acquired for approximately 20 s each, aided in mineral identification.
3.3. X-ray Diffraction (XRD) Mineral Identification
XRD of powder samples determined mineral content changes in different spheroidal weathered crust layer. For powder samples XRD, about 50 mg of powder is drilled with a dental drill in-situ of spheroidal weathered crust layer. The powder is ground to below 200 mesh with an agate mortar, placed on a slide, flattened, and then tested by XRD. The powder samples XRD is performed on a PANalytical X'Pert Pro MDP with a Cu target, at 60 kV, 55 mA, covering 6- 50° (2θ), with a step size of 0.02°/s. XRD data is collected via X'pert Data Collector and analyzed using HighScore Plus for mineral phase identification.
Micro-XRD analysis was conducted to identify carbonate species changes in different spheroidal weathered crust layer. A fragment, containing P zone、S1 zone and S2 zone, was selected and sliced to a thickness about 100 mm. The slices were attached to glass fiber tubes. The rotation range of the platform was adjusted. Under the lens, the dolomite matrix in different spheroidal weathered crust layer was located in situ for XRD diffraction experiments.The D/MAX RAPID II XRD was used for micro-XRD, which equipped with a Mo radiation, operated at 50 kV and 30 mA, scanning diffraction angles from 2° to 44° at a step size of 0.02°/s. Diffraction patterns were converted to angle-intensity series using 2DP software, and mineral identification was performed with the PDXL software provided by Rigaku Corporation[23,24].
3.4. Trace and REEs Analysis
To elucidate the migration of elements in different spheroidal weathered crust layer, this study employed LA-ICP-MS to quantify the elemental contents, the points of LA-ICP-MS are shown in Figure 3b. Given that carbonate rocks primarily consist of Ca(Mg)CO3, the major elements of focus were Ca and Mg. Additionally, considering the established correlation between carbonate rocks and manganese deposits in the Datangpo area, where carbonate lens occurrences are often accompanied by manganese ore layers[17,18], the study also investigated the contents of Mn and Fe. To track the changes in redox conditions and REEs content during the weathering process, the contents of Ni, Co, and REEs were also tested.
In-situ LA-ICP-MS analysis was performed. Samples were analyzed using the GeoLas Pro 193-nm ArF excimer laser ablation system coupled with an Agilent 7900 ICP-MS. Helium was used as the carrier gas, with a spot size of 32 μm, energy density of 5 J/cm², and repetition rate of 5 Hz. NIST610 and NIST612 served as external standards for trace element calibration every ten points, and data were processed using Iolite software.
3.5. Carbon and Oxygen Isotope Analysis
To facilitate a more comprehensive comparison and analysis of carbon and oxygen isotope, this study additionally collected unaltered dolomite (TJT1) in the study strata and carbonaceous mudstones (TZYY) from the Datangpo Formation strata for carbon and oxygen isotope testing (Figure 1c). The unaltered dolomite were collected to serve as a reference for primary mineral and geochemistry characters. The carbonaceous mudstones were sampled to investigate potential links between weathering and manganese mineralization (Figure 1d & Figure 2g & Figure 3a).
The positions of C-O isotope analysis are shown in Figure 3a-3c. Each samples, approximately 200 μg, were obtained by using a dental drill in situ drilled from section. These powders were loaded into glass tubes, evacuated with high-purity helium, and reacted with 100% pure phosphoric acid for 24 hours to convert it to CO2[25,26,27,28]. The GasBench II system was used to introduce the gas into a Thermo Scientific 253 Plus isotope ratio mass spectrometer for analysis. Calibration was performed using the international standard NBS-18 (δ¹³C = -5.014‰, δ¹⁸O = -23.2‰), and results were reported in δ units (‰) relative to the Vienna Pee Dee Belemnite (V-PDB) standard.
3.6. Calculate Method
Migration Coefficient
To represent elemental accumulation and depletion, migration coefficient were calculated by using the formula :
RE = (X - Y) / Y
(1)
Where X represents the average elemental content in the current stage, and Y represents the average elemental content in pristine dolomite. Given the heterogeneity of carbonates and potential measurement errors associated with instrumentation, elements with an absolute RE value greater than 0.5 were defined as significantly depleted/enriched.
Cerium (Ce) Anomaly
The Ce anomaly, a commonly used indicator in REEs studies, serves to distinguish redox environments[29,30,31]. In this research, the Ce anomaly is calculated using the formula:
Ce/Ce* = 2CeN/(LaN + PrN)
(2)
Where N represents normalization values based on the Post-Archean Australian Shale (PAAS)[32].
4. Result
4.1. SEM and Microscope
Under SEM, P zone exhibits a denser texture with a dolomite matrix and occasional quartz grains (Figure 4a). When examined under optical microscope, pristine dolomite appears bluish-gray, with a fine-grained and compact microcrystalline dolomite matrix, intercalated with occasional quartz grains (Figure 4b).
SEM exhibits that dolomite in S1 zone has a relatively loose matrix composed of a mixture of dolomite and weathering residue, with occasional fractures filled with calcite (Figure 4c). Microscopically, dolomite in S1 zone is predominantly yellowish-brown, with a matrix comprising creamy fine-grained dolomite and yellowish-brown fine-grained weathering residues (Figure 4d). Occasional fractures are filled with creamy calcite, displaying yellowish-brown hues.
SEM analysis of dolomite in S2 zone indicates an even looser matrix, dominated by weathering residues with lesser dolomite and more frequent quartz grains (Figure 4e). Fractures are wider and primarily filled with weathering residues. Under microscope, dolomite in S2 zone appears reddish-brown, with quartz grains more prevalent, a reddish-brown weathering residues matrix, and occasional creamy dolomite remnants (Figure 4f). Fractures are predominantly filled with pale yellow material.
4.2. XRD Pattern
The powder XRD test results are presented in Figure 5a. By comparing the XRD data with standard mineral cards (PDF-2024), three minerals were identified: dolomite, quartz, and feldspar. The prominent peaks of dolomite (1 1 ), (1 1 3), and (1 1 0) were all detected in the XRD spectra, along with the strong quartz peaks (1 0 1), (1 0 0), and (1 1 2). The intense peak of feldspar (0 0 2) was also present, confirming the presence of dolomite, quartz, and feldspar as the dominant minerals in the rock. Notably, the quartz peak intensities follow the trend P zone < S1 zone < S2 zone (Figure 5a), consistent with SEM and microscopic observations, indicating an increase in quartz content from P zone to S2 zone. As the degree of weathering intensifies increase, the content and peak intensities of feldspar increase.
In-situ XRD identified that the peak position of dolomite (1 1 ) at different weathering stages didn't change significantly, which indicates that the dolostone matrix's mineral phase remained stable, with only dissolution occurring(Figure 5b).
4.3. LA-ICP-MS Data
In S1 zone, notable depletion was observed for Mg, Ca, Co, and Ni, while significant enrichment was evident for Mo (Figure 6a & Figure 7). In S2 zone, notable enrichment was observed for Mn, Mo, and Zn, while significant depletion was evident for Mg and Ca (Figure 6b & Figure 7). The REEs patterns in P zone, S1 zone, and S2 zone exhibit similar trends (Figure 8), with the ratio of light REEs (LREEs) vs. heavy REEs (HREE) varying minimally (P zone =3.74 ppm, S1 zone = 2.86 ppm, S2 zone = 3.21 ppm) (Table 1). This indicates that significant fractionation of REEs did not occur during the weathering process. The total REEs content exhibits a trend of initial decrease followed by an increase, as evident from the REEs distribution map (Figure 9). Specifically, higher REEs concentrations are observed in the P zone, which decrease in S1 zone, and then slightly increase again in S2 zone (Table 2). The overall Ce anomaly ranges from 0.76 to 1.99. Notably, a significant increase in the Ce/Ce* ratio is observed from P zone to S2 zone (Figure 7f).
4.4. Carbon and Oxygen Isotopes
The δ13C values of unaltered dolostone (TJT1) ranged from -6.07 to -2.76‰, with an average of -3.99 ‰, while the δ18O values ranged from -14.73 to -12.40‰, averaging -13.32‰. For the carbonaceous mudstones (TZYY), the δ13C values ranged from -9.65 to -7.99‰, averaging -8.55‰, and the δ18O values ranged from -13.63 to -10.35‰, averaging -11.68 ‰ (Table.3).
P zone exhibited δ13C values ranging from -5.26 to -3.35‰, averaging -4.18‰, and δ18O values ranging from -13.79 to -12.83‰, averaging -13.38 ‰, consistent with the isotopic signatures of the unaltered dolomite (TJT1)(Figure 10). S1 zone showed δ13C values ranging from -7.61 to -2.52‰, averaging -4.87‰, and δ18O values ranging from -12.22 to -8.06‰, averaging -10.49‰. S2 zone displayed δ13C values ranging from -16.56 to -12.43‰, averaging -14.17 ‰, and δ18O values ranging from -8.46 to -7.03‰, averaging -7.93 ‰ (Figure 11).
5. Discussion
5.1. Petrograph and Geochemistry Features Reveal Two Stages of Carbonate Incipient Weathering
The spherically weathered dolostone exhibits three distinct layers in hand specimens (Figure 1f & Figure 2a & Figure 3b). The innermost layer is bluish-grey and represents pristine dolomite (P zone). The middle layer is yellowish-brown (S1 zone), indicating dolostone that has just begun to weather. The outermost layer is reddish-brown, corresponding to dolostone that has been subjected to prolonged weathering (S2 zone). Besides color differences, the S1 and S2 zones also show significant differences in petrography, redox conditions, and acidity-alkalinity conditions.
Under the microscope, the S1 zone is relatively dense with few fractures, while the S2 zone is looser and more fractured (Figure 4). In terms of redox conditions, the Ce/Ce* ratio increases from the S1 zone to the S2 zone (Figure 7f). Ce is a redox-sensitive element predominantly existing as Ce3+ and Ce4+. In oxidizing aquatic environments, Ce3+ is oxidized to Ce4+, which is insoluble and tends to precipitate[33]. During carbonate weathering with fluid involvement, more Ce3+ precipitates from the fluid in more oxidizing areas, raising the local Ce content and thus the Ce/Ce* ratio. Thus, the increasing Ce/Ce* from the S1 to the S2 zone indicates a more oxidizing environment. From an acidity-alkalinity perspective, the S1 zone shows substantial Ni and Co loss (Figure 6a). The geochemical properties of Co and Ni indicate their solubility in acidic oxidizing environments and precipitation under alkaline conditions[34].This indicates that the S1 zone has an acidic environment. In the S2 zone, Ni and Co no longer show significant loss, but Mn shows significant enrichment (Figure 6b). Mn(II) is more readily oxidized to insoluble Mn(III) or Mn(IV) oxides under neutral or near-neutral conditions[35]. Thus, the S2 zone has a near-neutral environment.
Given the significant differences in rock properties, porosity, redox, and acidity-alkalinity conditions between the S1 and S2 zones, this study suggests taht they record two distinct stages of carbonate incipient weathering. In Stage I, carbonates interact with atmospheric CO2 and water to produce weakly acidic carbonic acid (H2CO3). This reaction initiates the leaching of Ca²⁺ and Mg²⁺ from the carbonates via interstitial water, resulting in dolomite dissolution and structural disintegration. During this stage, elements such as Ni and Co are solubilized in the weakly acidic interstitial water and subsequently removed, leading to their depletion. Stage II is characterized by an increased production of HCO3⁻ as the reaction between carbonates, water, and CO2 continues. This process gradually elevates the pH of the interstitial water as HCO3⁻ accumulation, which will hinder Ni and Co depletion. Concurrently, as the pH increases, which Mn(II) in the interstitial water reacts with oxygen to form manganese oxides or hydroxides.
5.2. Carbonate Incipient Weathering Indicates Lateritic Soil Formation Model
Carbonate weathering is often associated with laterite formation, yet the academic community still disputes the origin of laterite. Currently, four main hypotheses exist regarding laterite formation[36,37,38]:(1) In-situ weathering, where laterite forms as carbonate weathers in place, leaching carbonate minerals and leaving residual materials; (2) Dissolution-metasomatism, where laterite forms because carbonate reacting with external fluids rich in Al, Si, Fe, etc., forming clay minerals via metasomatism; (3) Clastic sedimentation, proposing that laterite is deposited by eolian or fluvial processes; and (4) Polygenetic theory, attributing laterite formation to a combination of the above factors.
This study, examining the petrology and geochemistry of spheroidal weathered dolostone, suggests that in the study area, laterite most likely originates from in-situ weathering of carbonate rocks. Supporting evidence includes: (1) Under microscopes and SEM, the rock matrix was observed to loosen and residual materials to accumulate with intensifying weathering, characteristic of in-situ weathering hypothesis (Figure 4). (2) Powder XRD analysis of P zone revealed over 50% dolomite, alongside significant quartz, feldspar, etc., indicating sufficient material in dolomite for laterite formation (Figure 5a). (3) No remarkable Al or Fe enrichment was detected in the S1 and S2 zones, implying limited metasomatic interaction between fluids and carbonate minerals (Figure 6). (4) The REE distribution patterns of the S1 and S2 zones resemble those of P zone, suggesting minimal external-source sediment input (Figure 8).
Thus, the overlying laterite on carbonate rocks in the study area is most plausibly formed by in-situ weathering of carbonate rocks.
5.3. C-O Isotopes Variation During Carbonate Incipient Weathering
In studies of stalagmites, oxygen isotope values of carbonate are believed to correlate with atmospheric precipitation, serving as indicators of monsoon rainfall and the effects of monsoon climate[39,40,41]. During the formation of carbonate rocks, oxygen isotopes predominantly inherit the isotopic signal from atmospheric precipitation[39]. Notably, variations in the oxygen isotopes of atmospheric precipitation display a significant latitude effect, with higher latitudes resulting in greater isotopic fractionation and consequently lighter oxygen isotope values[39].
The dolostone of this study were formed during the Neoproterozoic Era, a period characterized by the presence of numerous glacial deposits in the Yangtze Block. This suggests that the latitude of the Yangtze Block during the Neoproterozoic was higher than it is today[21]. Consequently, due to the latitude effect on atmospheric precipitation, carbonates formed during the Neoproterozoic are expected to exhibit lighter oxygen isotope values compared to modern carbonates. The range of oxygen isotope values in the P-zone of this study, range from -14.73 to -12.40‰, is indeed lighter than those of modern carbonates formed in Zhijin Cave (-10 to -8‰)[42], Guiizhou province. It is aligning with the isotopic characteristics of carbonates formed during the Neoproterozoic. In the S2 zone, the range of oxygen isotope values is -8.46 to -7.04‰, with an average of -7.83‰ (Figure 10 & Figure 11), which is consistent with the isotopic characteristics of modern carbonates from Zhijin Cave . These modern carbonates are in isotopic equilibrium with atmospheric precipitation, inheriting the isotopic signature of current atmospheric precipitation[42]. The S1 zone displays oxygen isotope values that are intermediate between those of P zone and S2 zone, indicating a gradual increase in weathering intensity from the S1 zone to the S2 zone, accompanied by a progressive alignment with the oxygen isotope values of modern carbonates. This suggests that variations in carbonate oxygen isotope values during weathering are influenced by atmospheric precipitation (Figure 11).
The carbon isotope composition of carbonates can provide insights into the composition and origin of the fluids involved in their formation[26,27,43]. During the formation of carbonates, the carbon isotopic signature is closely linked to the isotopic composition of dissolved inorganic carbon (DIC) in the fluids utilized, with minimal isotopic fractionation occurring during the precipitation of carbonates from DIC[44,45]. The carbon isotopic signature of DIC is primarily determined by its source. There are three main sources of DIC: (1) dissolution from surrounding rocks; (2) the reaction between atmospheric CO2 and water; and (3) the reaction between CO2 produced by plant and root respiration and water[1,46,47]. The pristine dolostone in this study is embedded within the sandstone strata of the Liangjiehe Formation (Figure 1c). Given that the surrounding rocks are sandstone, the influence of DIC from these rocks is considered minimal. Moreover, the dolostone was encased by sandstone of the Liangjiehe Formation, which suggests limited exposure to the atmosphere during their formation. This indicates that the DIC during the dolostone formation was primarily derived from the reaction between CO2 produced by plant and root respiration and water. The CO2 generated by vegetation and root respiration in the overlying strata reacted with water to form DIC, which was subsequently transported by pore water to precipitate as the dolostone. The similarity in REEs partitioning patterns between the pristine dolomite and pore water further supports this hypothesis (Figure 8).
The influence of vegetation on DIC is regulated by two factors: vegetation cover and the ratio of C3 to C4 plants. Increased vegetation cover results in a higher proportion of organic matter in the soil, which enhances respiration and organic matter decomposition[1,14]. This decomposition typically produces CO2 with lighter δ13C values, leading to lighter δ13C values for DIC. Additionally, the C3/C4 plant ratio affects DIC values, as different plant types (C3 and C4) employ distinct photosynthetic pathways, resulting in the release of CO2 with varying δ13C values[48]. C3 plants (e.g., trees and most shrubs) exhibit lower δ13C values (-32 to -25‰), whereas C4 plants (e.g., corn, sorghum, and prairie grasses) have higher δ13C values (-14 to -10‰). C3 plants thrive in moist and cool climates, while C4 plants are adapted to hot and arid environments. An increase in the C3/C4 plant ratio would consequently lead to lighter δ13C values for DIC[49,50].
During the Neoproterozoic Period, the Yangtze Block was characterized as a relatively cold region, exhibiting lower vegetation cover compared to contemporary conditions [51]. Consequently, carbonates formed during the Neoproterozoic should display heavier carbon isotope values than those of modern carbonates. The carbon isotope values of P zone (-6.07 to -2.76‰) are heavier than those of stalagmites from Zhijin Cave (-11 to -6‰), aligning with the isotopic characteristics expected for carbonates formed during the Neoproterozoic Period. In the S2 zone, carbon isotope values fluctuate between -16.56 and -12.43‰, with an average of -14.17‰ (Figure 10 & Figure 11). Atmospheric CO2 typically has carbon isotope values ranging from -12 to -8‰. During rapid carbonate precipitation, carbon isotope values can be approximately 2‰ lighter than those of DIC[52]. Therefore, the carbon isotope signature of S2 zone’s carbonates is consistent with those expected from rapid precipitation influenced by atmospheric CO2. S1 zone exhibits carbon isotope values that are intermediate between those of P zone and S2 zone (Figure 10 & Figure 11), indicating a gradual increase in weathering intensity from the S1 to the S2 zone, along with a progressive approach toward the carbon isotope values of atmospheric CO2. This implies that variations in carbon isotope values during weathering are influenced by the carbon isotopic composition of atmospheric CO2.
In summary, this study demonstrates that the oxygen and carbon isotope compositions of Neoproterozoic pristine dolomite lenses were governed by the oxygen isotope composition of atmospheric precipitation and the carbon isotope composition of DIC, which was influenced by the vegetation cover decrease during the Neoproterozoic Period. Due to the cold climate and high latitudes prevalent during the Neoproterozoic Period, carbon isotopes in carbonates were heavier than those formed in modern times, while oxygen isotopes were lighter. During incipient weathering processes, the oxygen isotope composition of carbonates was influenced by modern atmospheric precipitation, whereas the carbon isotope composition was affected by modern atmospheric CO2.
5.4. Carbonate Re-Precipitation During Carbonate Incipient Weathering
During carbonate incipient weathering, a significant change in C-O isotopic values was observed in this study. The isotopes were influenced by atmospheric precipitation oxygen and atmospheric CO2 carbon isotopes. If only carbonate dissolution occurred during carbonate incipient weathering, C-O isotopic values would remain stable. However, these changes were observed in this study, which indicates re-precipitation of carbonates during carbonate incipient weathering pprocesses. Atmospheric precipitation and CO2 reacted with carbonates to form HCO3-, which then re-precipitated as carbonate minerals. This re-precipitation process may release CO2, which hasn't been considered in the carbon-sink calculations of carbonate weathering. This could lead to an overestimation of the carbon-sequestration capacity of carbonate weathering and affect global carbon-reservoir calculations.
The proportion of re-precipitated carbonates in the initial weathering zone is neither too high nor too low. Powder XRD data shows that carbonates are barely detectable in the weathering zone (Figure 5a). This might be due to low carbonate content (< 5%) or the amorphous state of newly-formed carbonates. Geochemical data shows that Ca ions were lost by about 85% in the S2 zone (Figure 6), so newly-formed carbonates would account for no more than 15%. However, the detectable carbonate C-O isotopic signals in the MAT-253 Plus indicate that carbonate content isn't too low. Further research is needed to quantitatively describe the proportion of re-precipitated carbonates in the carbonate incipient weathering process.
6. Conclusion
In recent years, carbonate weathering has emerged as a significant global carbon sink, highlighting the critical need to investigate the mechanisms underlying the weathering of carbonate rocks. Research on these mechanisms primarily relies on weathered soil profiles; however, intense carbonate weathering often leads to the absence of the incipient weathering horizon within these profiles, which hinders a comprehensive understanding of incipient weathering processes and their regulatory mechanisms. In this study, we utilize surface-weathered dolostone to elucidate the processes of incipient weathering in carbonates. The following conclusions were drawn:
1. The δ13C and δ18O isotope ratios of pristine dolomite, ranging from -5.26 to -3.35‰ and -13.79 to -12.83‰, respectively, suggest that dolomite formation occurred under high-latitude, cold climatic conditions during the Nanhua Period.
2. The study identifies two distinct stages of incipient weathering in dolomite. In Stage I, there is a significant decrease of Ni and Co indicate the presence of a weakly acidic microenvironment. The fluctuating δ13C values (-7.61 to -2.52‰) and δ18O values (-12.22 to -8.06‰) , which indicate carbonate is re-precipitated. In Stage II, there is an enrichment of Mn which reflects a transition to a neutral environment. The δ13C values ranging from -16.56 to -12.43‰ and δ18O values from -8.46 to -7.03‰, which are influenced by atmospheric CO2 and atmospheric precipitation.
3. The mineralogical, geochemical, and carbon-oxygen isotopic characteristics of the surface-weathered carbonate rock provide a systematic documentation of the incipient weathering processes of carbonate rocks, positioning it as a potential proxy for studying these processes.
This study focuses on the spheroidal weathered dolostone in Guizhou, China. However, the observed phenomena are not region-specific and are likely to be widespread. We believe that similar phenomena occur elsewhere on Earth. In this study, we observed carbonate re-precipitation during the incipient weathering of carbonate. But the proportion of re-precipitation carbonates wasn't accurately quantified. Future research will further explore this to better assess carbonate weathering contributions to the global carbon cycle. We also look forward to more studies on the spheroidal weathering of carbonate rocks from other regions to uncover the patterns of carbonate incipient weathering.
Author Contributions
X.Y. & X.Sun. designed the experiments and wrote this paper; Q.S. contributed to the sample preparation and analysis. All authors have read and agreed to the published version of the manuscript.
Funding
This research was financed by the Lingnan Normal University Youth Doctor Project (ZL22037).
Data Availability Statement
The data presented in this study are available on request from the author.
Acknowledgments
Thank you to Professor Zhou Qi for providing information on the sampling sites. Gratitude is extended to Yang LiMing and others for their assistance during sampling. Appreciation is expressed to Dr. Hu Wanwan for supplying information regarding paleogeography and paleoclimatology.
Conflicts of Interest
The authors declare that they have no known competing financial interests or personal relationships that could appear to have influenced the work reported.
References
- Zeng, S.; Liu, Z.; Kaufmann, G. Sensitivity of the global carbonate weathering carbon-sink flux to climate and land-use changes. Nat. Commun. 2019, 10, 1–10. [Google Scholar] [CrossRef] [PubMed]
- Lechuga-Crespo, J.L.; Sauvage, S.; Ruiz-Romera, E.; van Vliet, M.T.H.; Probst, J.L.; Fabre, C.; Sánchez-Pérez, J.M. Global carbon sequestration through continental chemical weathering in a climatic change context. Sci. Rep. 2021, 11, 1–8. [Google Scholar] [CrossRef]
- Liu, Z.; Deng, Z.; Davis, S.; Ciais, P. Monitoring global carbon emissions in 2022. Nat. Rev. Earth Environ. 2023, 4, 205–206. [Google Scholar] [CrossRef]
- Quinton, J.N.; Govers, G.; Van Oost, K.; Bardgett, R.D. The impact of agricultural soil erosion on biogeochemical cycling. Nat. Geosci. 2010, 3, 311–314. [Google Scholar] [CrossRef]
- Liu, L.; Sayer, E.J.; Deng, M.; Li, P.; Liu, W.; Wang, X.; Yang, S.; Huang, J.; Luo, J.; Su, Y.; et al. The grassland carbon cycle: Mechanisms, responses to global changes, and potential contribution to carbon neutrality. Fundam. Res. 2023, 3, 209–218. [Google Scholar] [CrossRef]
- Zeng, S.; Liu, Z.; Groves, C. Large-scale CO2 removal by enhanced carbonate weathering from changes in land-use practices. Earth-Science Rev. 2022, 225, 103915. [Google Scholar] [CrossRef]
- Jiao, K.; Liu, Z.; Wang, W.; Yu, K.; Mcgrath, M.J.; Xu, W. Carbon cycle responses to climate change across China’s terrestrial ecosystem: Sensitivity and driving process. Sci. Total Environ. 2024, 915, 170053. [Google Scholar] [CrossRef]
- Knapp, W.J.; Tipper, E.T. The efficacy of enhancing carbonate weathering for carbon dioxide sequestration. Front. Clim. 2022, 4. [Google Scholar] [CrossRef]
- Bai X, Zhang S, Smith P, Li C, Xiong L, Du C, Xue Y, Li Z, Long M, Li M, Zhang X, Yang S, Luo Q, Shen X. Resolving controversies surrounding carbon sinks from carbonate weathering. Sci. Sin. Terrae 2024, 54, 2747–2761. [Google Scholar]
- Pan, Y.; Zhang, H.; Wang, C.; Zhou, Y. Impact of land use change on regional carbon sink capacity: Evidence from Sanmenxia, China. Ecol. Indic. 2023, 156, 111189. [Google Scholar] [CrossRef]
- Ott, R.; Gallen, S.F.; Helman, D. Erosion and weathering in carbonate regions reveal climatic and tectonic drivers of carbonate landscape evolution. Earth Surf. Dyn. 2023, 11, 247–257. [Google Scholar] [CrossRef]
- Marcé, R.; Obrador, B.; Morguí, J.A.; Lluís Riera, J.; López, P.; Armengol, J. Carbonate weathering as a driver of CO2 supersaturation in lakes. Nat. Geosci. 2015, 8, 107–111. [Google Scholar] [CrossRef]
- Nõges, P.; Cremona, F.; Laas, A.; Martma, T.; Rõõm, E.I.; Toming, K.; Viik, M.; Vilbaste, S.; Nõges, T. Role of a productive lake in carbon sequestration within a calcareous catchment. Sci. Total Environ. 2016, 550, 225–230. [Google Scholar] [CrossRef]
- Mo, C.; Xin, S.; Huang, F.; Cao, J.; Xiao, J. Characteristics of Dissolution Changes in Carbonate Rocks and Their Influencing Factors in the Maocun Basin, Guilin, China. Water (Switzerland) 2023, 15. [Google Scholar] [CrossRef]
- Morse, J.W.; Arvidson, R.S. The dissolution kinetics of major sedimentary carbonate minerals. Earth-Science Rev. 2002, 58, 51–84. [Google Scholar] [CrossRef]
- Boettger, J.D.; Kubicki, J.D. Equilibrium and kinetic isotopic fractionation in the CO2 hydration and hydroxylation reactions: Analysis of the role of hydrogen-bonding via quantum mechanical calculations. Geochim. Cosmochim. Acta 2021, 292, 37–63. [Google Scholar] [CrossRef]
- Ma, Z.; Liu, X.; Yu, W.; Du, Y.; Du, Q. Redox conditions and manganese metallogenesis in the Cryogenian Nanhua Basin: Insight from the basal Datangpo Formation of South China. Palaeogeogr. Palaeoclimatol. Palaeoecol. 2019, 529, 39–52. [Google Scholar] [CrossRef]
- Wu, J.; Tan, Z.; Jia, W.; Chen, J.; Peng, P. Nitrogen isotopes and geochemistry of the basal Datangpo Formation: Contrasting redox conditions in the upper and lower water columns during the Cryogenian interglaciation period. Palaeogeogr. Palaeoclimatol. Palaeoecol. 2024, 637, 112005. [Google Scholar] [CrossRef]
- Zhou, Q.; Wu, C.; Hu, X.; Yang, B.; Zhang, X.; Du, Y.; Xu, K.; Yuan, L.; Ni, J.; Hu, D.; et al. A new metallogenic model for the giant manganese deposits in northeastern Guizhou, China. Ore Geol. Rev. 2022, 149, 105070. [Google Scholar] [CrossRef]
- Zhou, C.; Tucker, R.; Xiao, S.; Peng, Z.; Yuan, X.; Chen, Z. New constraints on the ages of Neoproterozoic glaciations in south China. Geology 2004, 32, 437–440. [Google Scholar] [CrossRef]
- Evans, D.A.D.; Li, Z.X.; Kirschvink, J.L.; Wingate, M.T.D. A high-quality mid-Neoproterozoic paleomagnetic pole from South China, with implications for ice ages and the breakup configuration of Rodinia. Precambrian Res. 2000, 100, 313–334. [Google Scholar] [CrossRef]
- Jiang, G.; Shi, X.; Zhang, S.; Wang, Y.; Xiao, S. Stratigraphy and paleogeography of the Ediacaran Doushantuo Formation (ca. 635-551Ma) in South China. Gondwana Res. 2011, 19, 831–849. [Google Scholar] [CrossRef]
- Lu, Y.; Sun, X.; Xu, H.; Konishi, H.; Lin, Z.; Xu, L.; Chen, T.; Hao, X.; Lu, H.; Mann, J.P. Formation of dolomite catalyzed by sulfate-driven anaerobic oxidation of methane: Mineralogical and geochemical evidence from the northern South China Sea. Am. Mineral. 2018, 103, 720–734. [Google Scholar] [CrossRef]
- Yang, X.; Sun, X.; Li, D.; Lin, Z.; Chen, T.; Lin, H. Sediment Mineralogy and Geochemistry and Their Implications for the Accumulation of Organic Matter in Gashydrate Bearing Zone of Shenhu, South China Sea. Minerals 2023, 13, 1419. [Google Scholar] [CrossRef]
- Yang, X.; Zhang, Y.; Sun, X. Marine sediment nitrogen isotopes and their implications for the nitrogen cycle in the sulfate-methane transition zone. Front. Mar. Sci. 2023, 9, 1–16. [Google Scholar] [CrossRef]
- Yang, X.; Sun, X.; Li, D.; Lin, Z.; Lu, Y.; Liang, Y.; Zhang, Y. Elemental and isotopic response of different carbon components to anaerobic oxidation of methane: A case study of marine sediments in the Shenhu region, northern South China Sea. J. Asian Earth Sci. 2021, 206, 104577. [Google Scholar] [CrossRef]
- Lu, Y.; Yang, X.; Lin, Z.; Sun, X.; Yang, Y.; Peckmann, J. Reducing microenvironments promote incorporation of magnesium ions into authigenic carbonate forming at methane seeps: Constraints for dolomite formation. Sedimentology 2021, 68, 2945–2964. [Google Scholar] [CrossRef]
- Lin, Z.; Sun, X.; Peckmann, J.; Lu, Y.; Xu, L.; Strauss, H.; Zhou, H.; Gong, J.; Lu, H.; Teichert, B.M.A. How sulfate-driven anaerobic oxidation of methane affects the sulfur isotopic composition of pyrite: A SIMS study from the South China Sea. Chem. Geol. 2016, 440, 26–41. [Google Scholar] [CrossRef]
- Caetano-Filho, S.; Paula-Santos, G.M.; Dias-Brito, D. Carbonate REE + Y signatures from the restricted early marine phase of South Atlantic Ocean (late Aptian – Albian): The influence of early anoxic diagenesis on shale-normalized REE + Y patterns of ancient carbonate rocks. Palaeogeogr. Palaeoclimatol. Palaeoecol. 2018, 500, 69–83. [Google Scholar] [CrossRef]
- Liao, J.; Sun, X.; Li, D.; Sa, R.; Lu, Y.; Lin, Z.; Xu, L.; Zhan, R.; Pan, Y.; Xu, H. New insights into nanostructure and geochemistry of bioapatite in REE-rich deep-sea sediments: LA-ICP-MS, TEM, and Z-contrast imaging studies. Chem. Geol. 2019, 512, 58–68. [Google Scholar] [CrossRef]
- Bayon, G.; Birot, D.; Ruffine, L.; Caprais, J.C.; Ponzevera, E.; Bollinger, C.; Donval, J.P.; Charlou, J.L.; Voisset, M.; Grimaud, S. Evidence for intense REE scavenging at cold seeps from the Niger Delta margin. Earth Planet. Sci. Lett. 2011, 312, 443–452. [Google Scholar] [CrossRef]
- Balaram, V. Rare earth elements: A review of applications, occurrence, exploration, analysis, recycling, and environmental impact. Geosci. Front. 2019, 10, 1285–1303. [Google Scholar] [CrossRef]
- Hu, Y.; Feng, D.; Peckmann, J.; Roberts, H.H.; Chen, D. New insights into cerium anomalies and mechanisms of trace metal enrichment in authigenic carbonate from hydrocarbon seeps. Chem. Geol. 2014, 381, 55–66. [Google Scholar] [CrossRef]
- Rinklebe, J.; Shaheen, S.M. Geochemical distribution of Co, Cu, Ni, and Zn in soil profiles of Fluvisols, Luvisols, Gleysols, and Calcisols originating from Germany and Egypt. Geoderma 2017, 307, 122–138. [Google Scholar] [CrossRef]
- Wang, D.; He, Y.; Chen, Y.; Yang, F.; He, Z.; Zeng, T.; Lu, X.; Wang, L.; Song, S.; Ma, J. Electron transfer enhancing the Mn(II)/Mn(III) cycle in MnO/CN towards catalytic ozonation of atrazine via a synergistic effect between MnO and CN. Water Res. 2023, 230, 119574. [Google Scholar] [CrossRef]
- Zhang Liankai, Ji Hongbing, Liu Xiuming, Wei Xiao, Luo Gang, Wang Shijie, Nguyen Dai Trung, Nguyen Quoc Dinh.Genetic mechanism and elemental evolution of weathering laterite crust overlying carbonate rocks in tropical areas[J]. Geology in China.2021, 48(2):651-660(in Chinese with English abstract).
- Zhang, li; Ji, H. ; Gao, J.; Li, J. Geochemistry of elements in typical carbonate weathered profiles of Guizhou Plateau.Geochemstry. 2015, 44, 323–336.
- Beckford, H.O.; Chu, H.; Song, C.; Chang, C.; Ji, H. Geochemical characteristics and behaviour of elements during weathering and pedogenesis over karst area in Yunnan–Guizhou Plateau, southwestern China. Environ. Earth Sci. 2021, 80, 1–21. [Google Scholar] [CrossRef]
- Li, H.; Liu, X.; Tripati, A.; Feng, S.; Elliott, B.; Whicker, C.; Arnold, A.; Kelley, A.M. Factors controlling the oxygen isotopic composition of lacustrine authigenic carbonates in Western China: implications for paleoclimate reconstructions. Sci. Rep. 2020, 10, 1–17. [Google Scholar] [CrossRef]
- Li, J.; Liu, S.; Shi, X.; Zhang, H.; Cao, P.; Li, X.; Lukens, W.E. Applicability and Variability of Chemical Weathering Indicators and Their Monsoon-Controlled Mechanisms in the Bay of Bengal. Front. Earth Sci. 2021, 9. [Google Scholar] [CrossRef]
- Liu, X.; Liu, J.; Chen, S.; Chen, J.; Zhang, X.; Yan, J.; Chen, F. New insights on Chinese cave δ18O records and their paleoclimatic significance. Earth-Science Rev. 2020, 207, 103216. [Google Scholar] [CrossRef]
- Kuo, T.S.; Liu, Z.Q.; Li, H.C.; Wan, N.J.; Shen, C.C.; Ku, T.L. Climate and environmental changes during the past millennium in central western Guizhou, China as recorded by Stalagmite ZJD-21. J. Asian Earth Sci. 2011, 40, 1111–1120. [Google Scholar] [CrossRef]
- Consolaro, C.; Rasmussen, T.L.; Panieri, G.; Mienert, J.; Bünz, S.; Sztybor, K. Carbon isotope (d13C) excursions suggest times of major methane release during the last 14 kyr in Fram Strait, the deep-water gateway to the Arctic. Clim. Past 2015, 11, 669–685. [Google Scholar] [CrossRef]
- Kienast, M.; Calvert, S.E.; Pelejero, C.; Grimalt, J.O. A critical review of marine sedimentary δ13Corg-pCO2 estimates: New palaeorecords from the South China sea and a revisit of other low-latitude δ13Corg-pCO2 records. Global Biogeochem. Cycles 2001, 15, 113–127. [Google Scholar] [CrossRef]
- Meister, P.; Liu, B.; Khalili, A.; Böttcher, M.E.; Jørgensen, B.B. Factors controlling the carbon isotope composition of dissolved inorganic carbon and methane in marine porewater: An evaluation by reaction-transport modelling. J. Mar. Syst. 2019, 200, 103227. [Google Scholar] [CrossRef]
- Hare, V.J.; Loftus, E.; Jeffrey, A.; Ramsey, C.B. Atmospheric CO2 effect on stable carbon isotope composition of terrestrial fossil archives. Nat. Commun. 2018, 9. [Google Scholar] [CrossRef]
- Cotrufo, M.F.; Lavallee, J.M. Soil organic matter formation, persistence, and functioning: A synthesis of current understanding to inform its conservation and regeneration; 1st ed.; Elsevier Inc., 2022; Vol. 172; ISBN 9780323989534.
- Wu, C.; Xia, G.; Wagreich, M.; Rodríguez-López, J.P.; Sun, X.; Liu, C.; Yi, H. Early Miocene expansion of C4 vegetation on the northern Tibetan Plateau. Glob. Planet. Change 2019, 177, 173–185. [Google Scholar] [CrossRef]
- Jolivet, M.; Boulvais, P. Global significance of oxygen and carbon isotope compositions of pedogenic carbonates since the Cretaceous. Geosci. Front. 2021, 12, 101132. [Google Scholar] [CrossRef]
- Shengqiang, Y.; Shiguo, W.; Thomas, L.; Genshun, Y.; Fuliang, L.; Feng, C.; Hairong, W.; Li, L. Fine-grained Pleistocene deepwater turbidite channel system on the slope of Qiongdongnan Basin, northern South China Sea. Mar. Pet. Geol. 2009, 26, 1441–1451. [Google Scholar] [CrossRef]
- Peng, Y.; Bao, H.; Jiang, G.; Crockford, P.; Feng, D.; Xiao, S.; Kaufman, A.J.; Wang, J. A transient peak in marine sulfate after the 635-Ma snowball Earth. Proc. Natl. Acad. Sci. U. S. A. 2022, 119, 1–7. [Google Scholar] [CrossRef]
- Guo, Y.; Deng, W.; Wei, G. Experimental Constraints on Clumped Isotope Fractionation During BaCO3 Precipitation. Geochemistry, Geophys. Geosystems 2022, 23, 1–15. [Google Scholar] [CrossRef]
- Chen, L.; Jin, M.; Wang, X.; Wang, H.; Li, N. The effects of diagenetic processes and fluid migration on rare earth element and organic matter distribution in seep-related sediments: A case study from the South China Sea. J. Asian Earth Sci. 2020, 191, 104233. [Google Scholar] [CrossRef]
- Johannesson, K.H.; Lyons, W.B.; Bird, D.A. Rare earth element concentrations and speciation in alkaline lakes from the western U.S.A. Geophys. Res. Lett. 1994, 21, 773–776. [Google Scholar] [CrossRef]
Figure 1.
Location information of sampling sites. a. The study area, located in the Datangpo region of Songtao County, Guizhou Province, corresponds to the paleogeographic junction of the Yangtze Block within the Nanhua Basin and the Jiangnan Orogenic Belt (modified after Peng et al., 2022). b. The sampling sites for this study were positioned within the strata which was formed during the Nanhua Period (modified after Zhou et al., 2022). c. The Nanhuan (Cryogenian) System stratigraphic sections involved in this study include Liangjiehe, Tiesiao, and Datangpo Group (modified after Zhou et al., 2022). d. Datangpo Group carbonaceous mudstone outcrop. e. The spheroidal-weathered carbonate lens at the top of the Liangjiehe Group. f. The spheroidal-weathered dolostone at the bottom of the Liangjiehe Group.
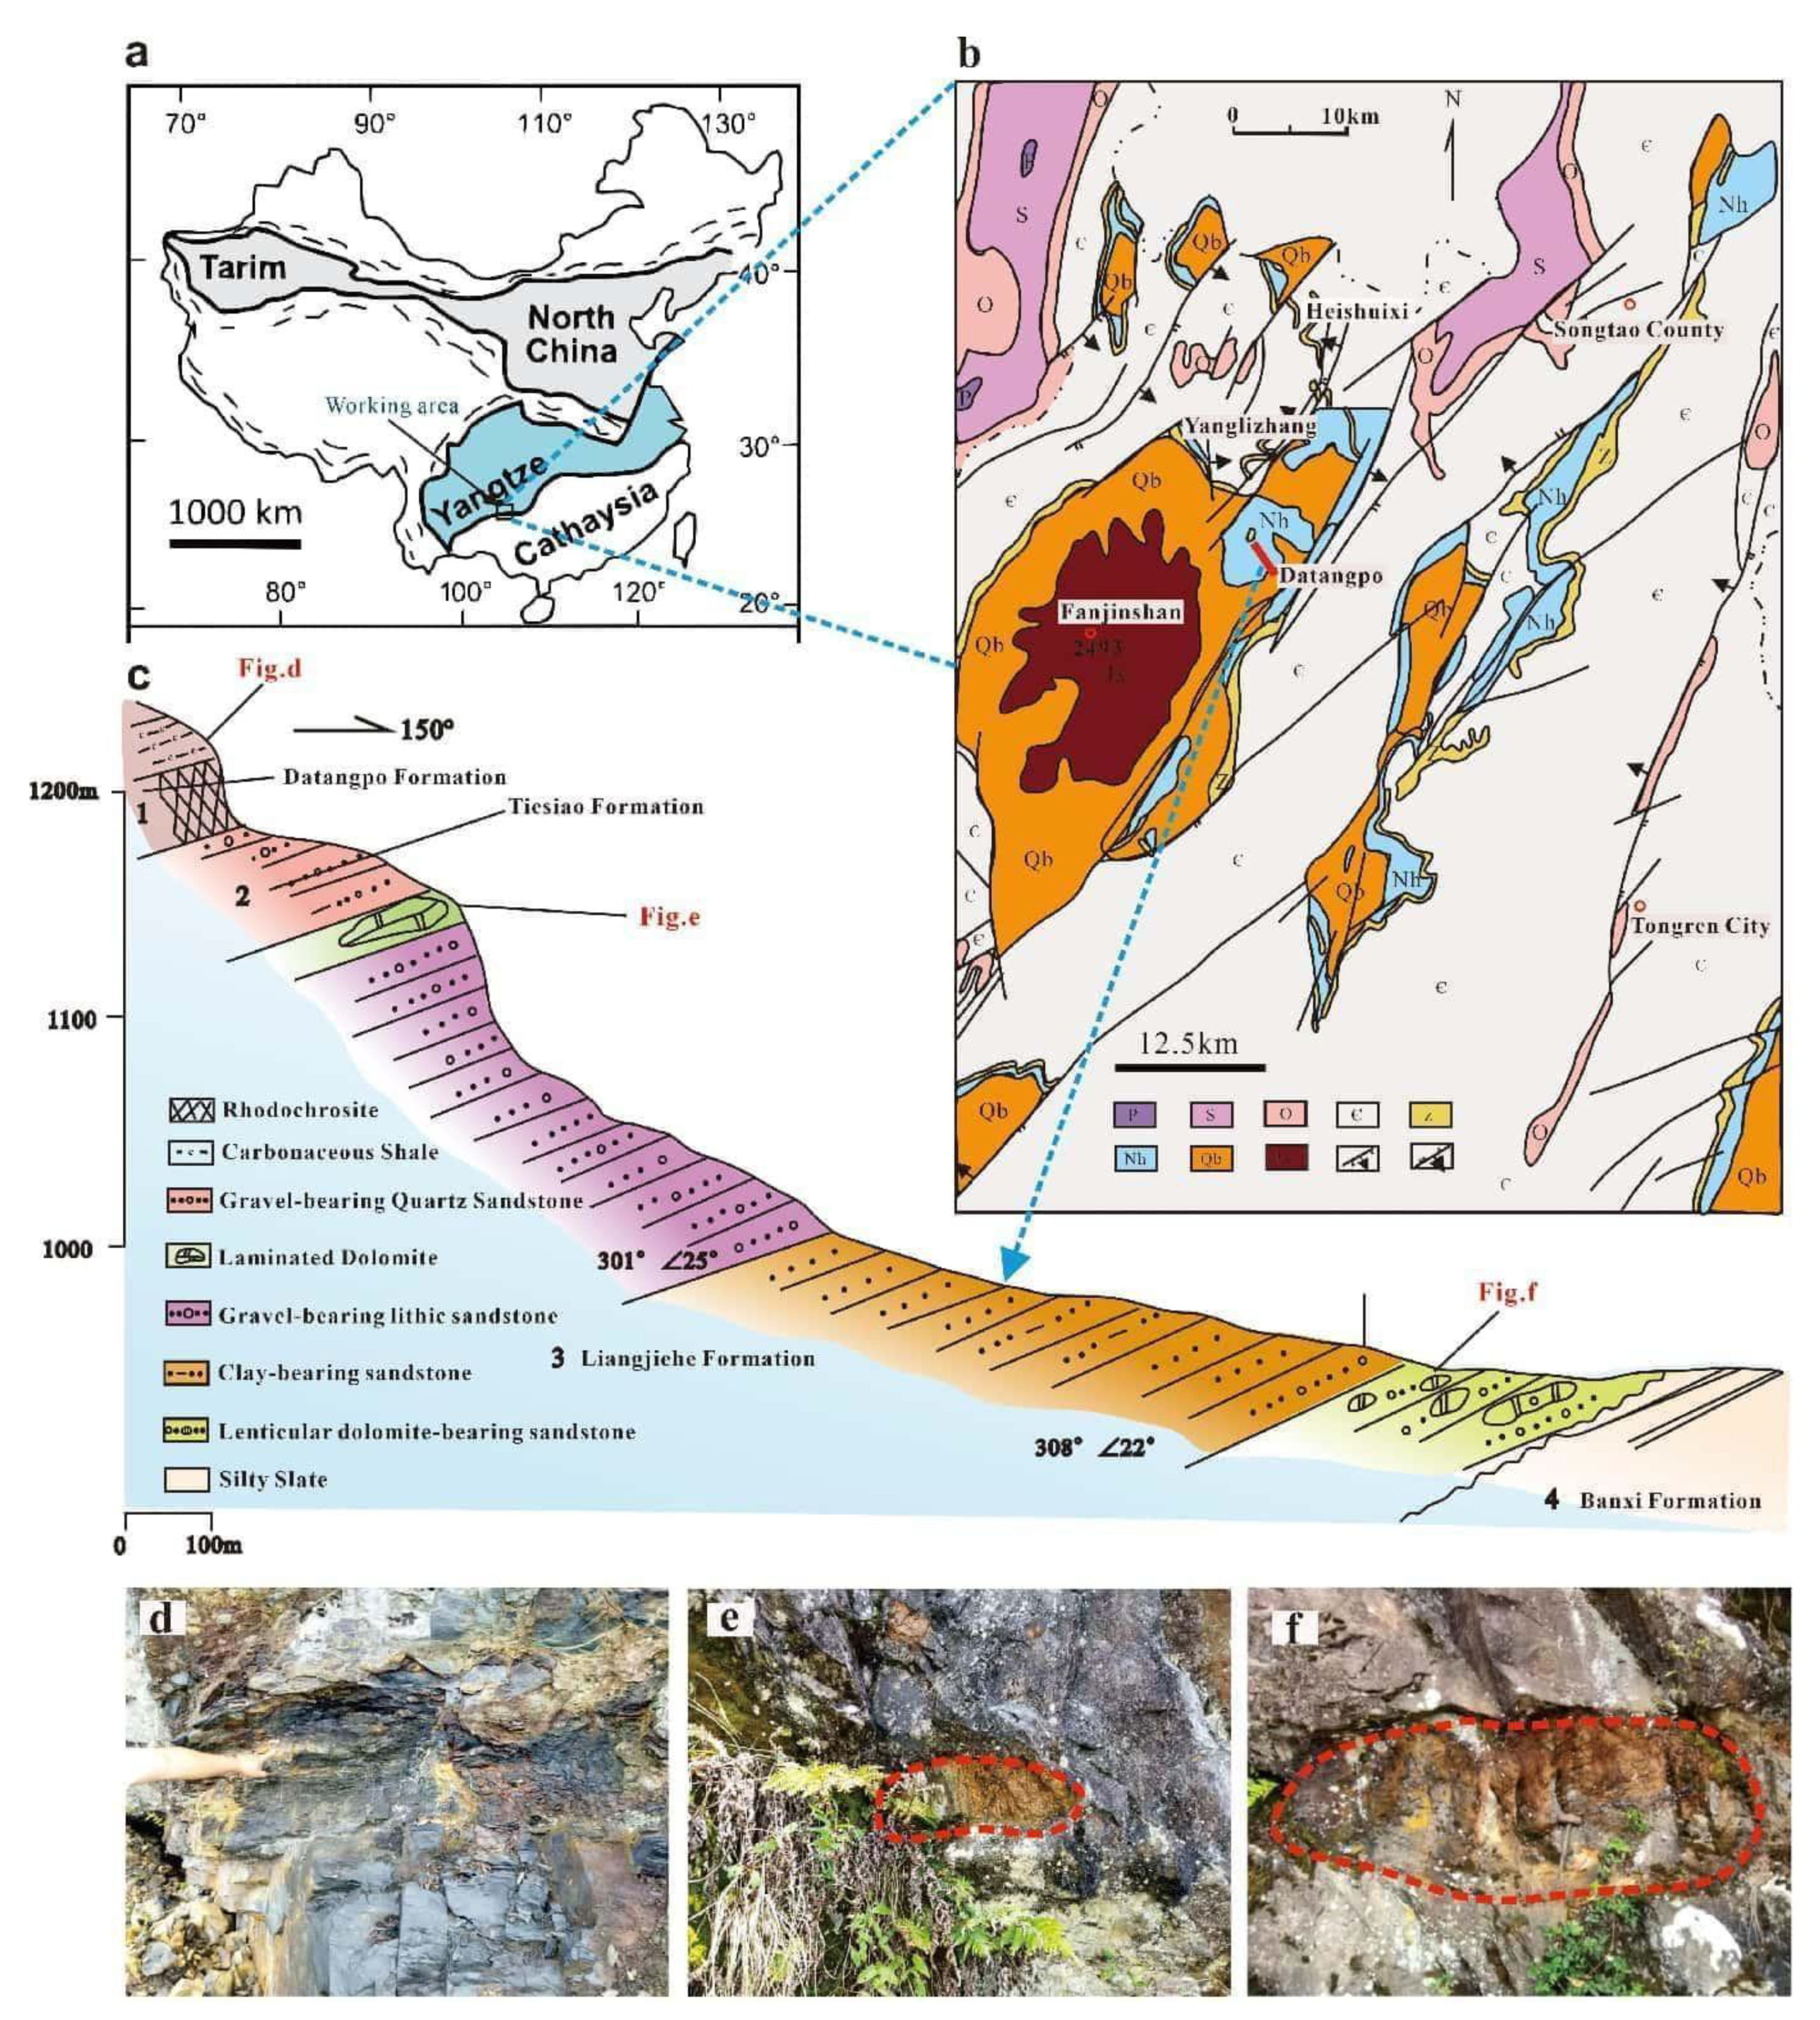
Figure 2.
Samples collected from study region. a. The spheroidal-weathered dolostone shows three distinctly different colored zones, representing the P zone, the S1 zone, and the S2 zone. b. The spheroidal-weathered dolostone surface exhibits fine laminated structures. c&d. Dolostone with a yellow-brown weathering crust. e.The sandstone from Liangjiehe Group. f.The sandstone from Tiesiao Group. g. The carbonaceous mudstone from Datangpo Group. h.The interior of the spheroidal-weathered dolostone that has not been affected by weathering.
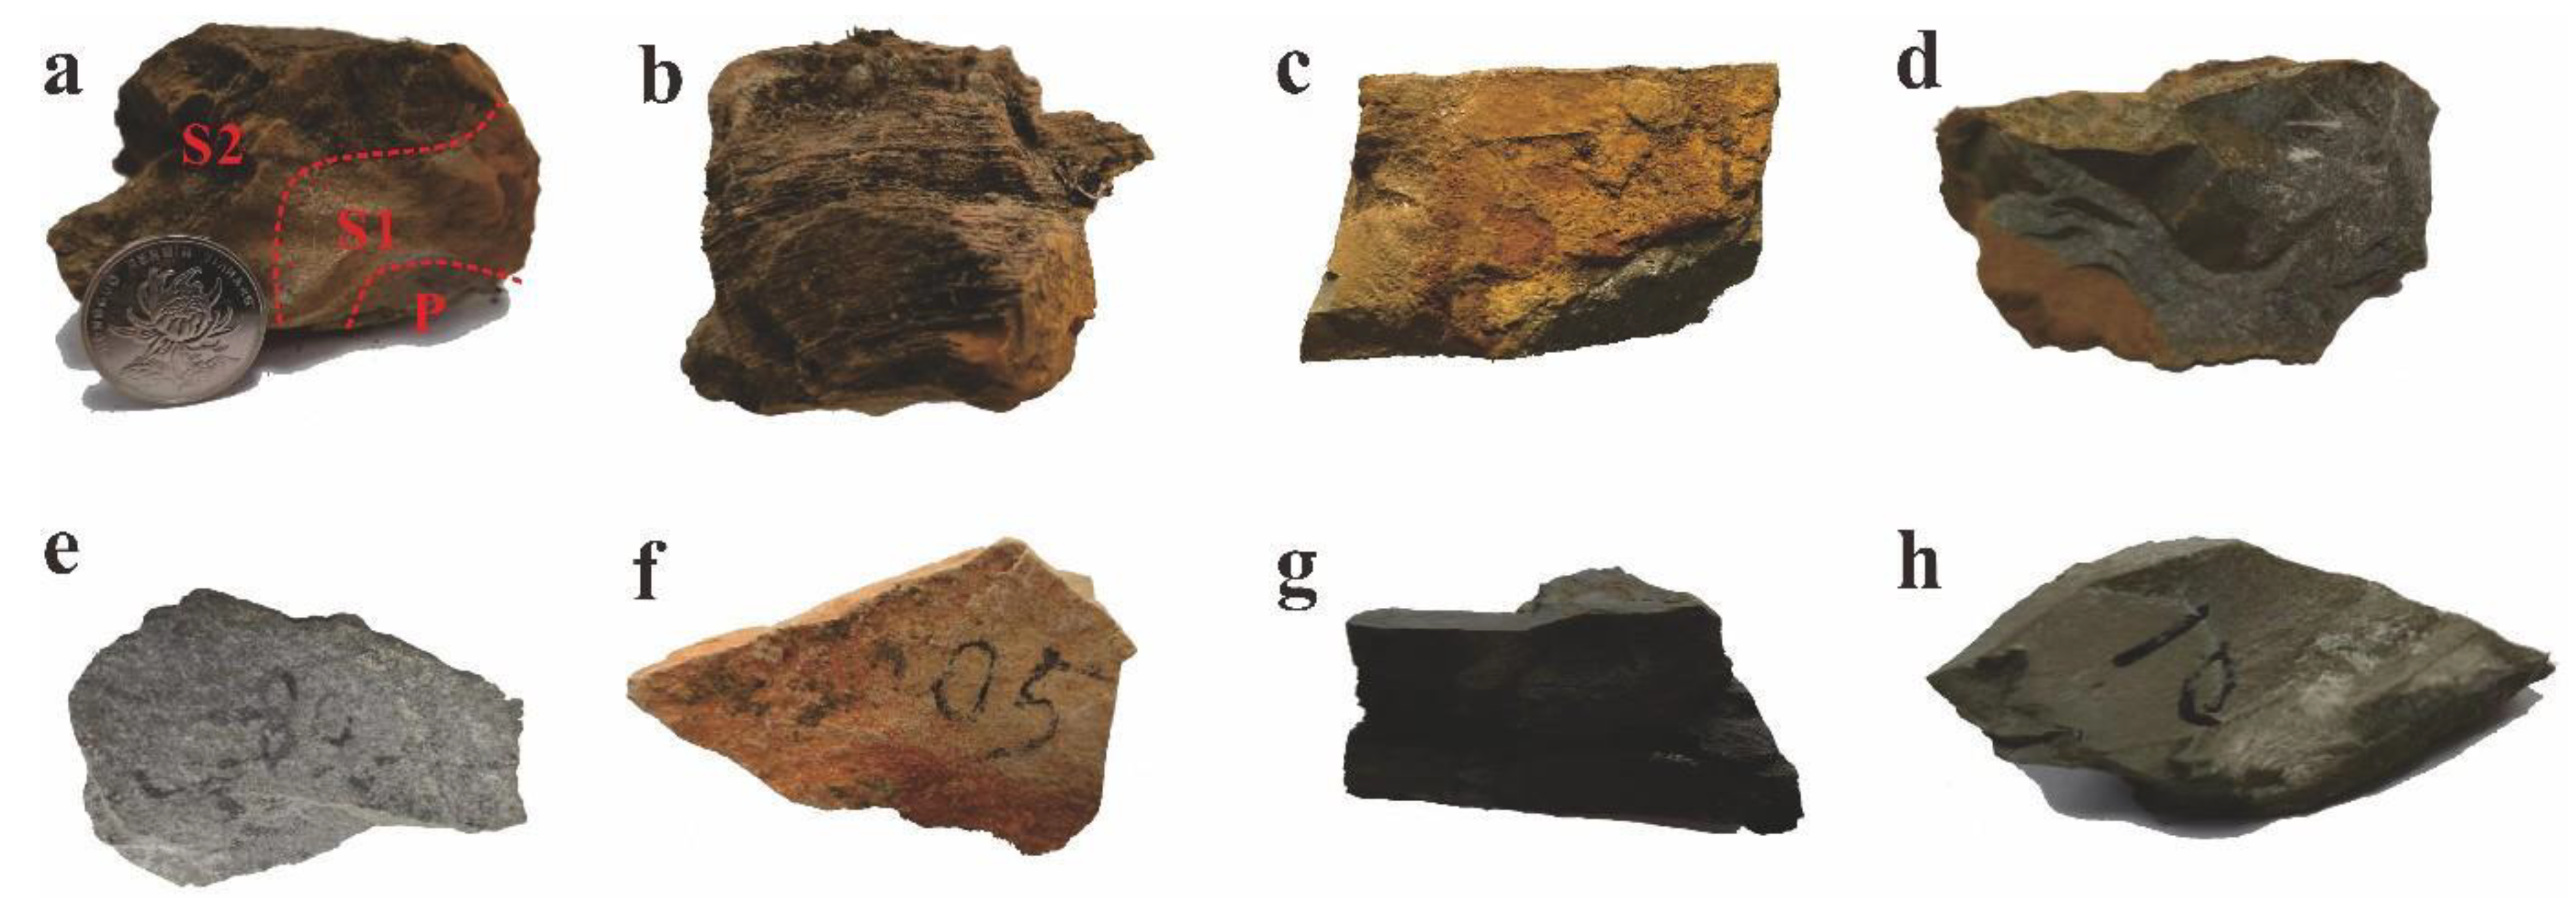
Figure 3.
Carbonate samples slice and C-O isotope analysis points. a.The carbonaceous mudstone from Datangpo Group, with interspersed pyrite (TZYY). b. The spheroidal-weathered dolostone, which exhits three distinct color zones are clearly visible (P zone, S1 zone and S2 zone). c.Unaltered dolomite appear blueish-gray (TJT1).
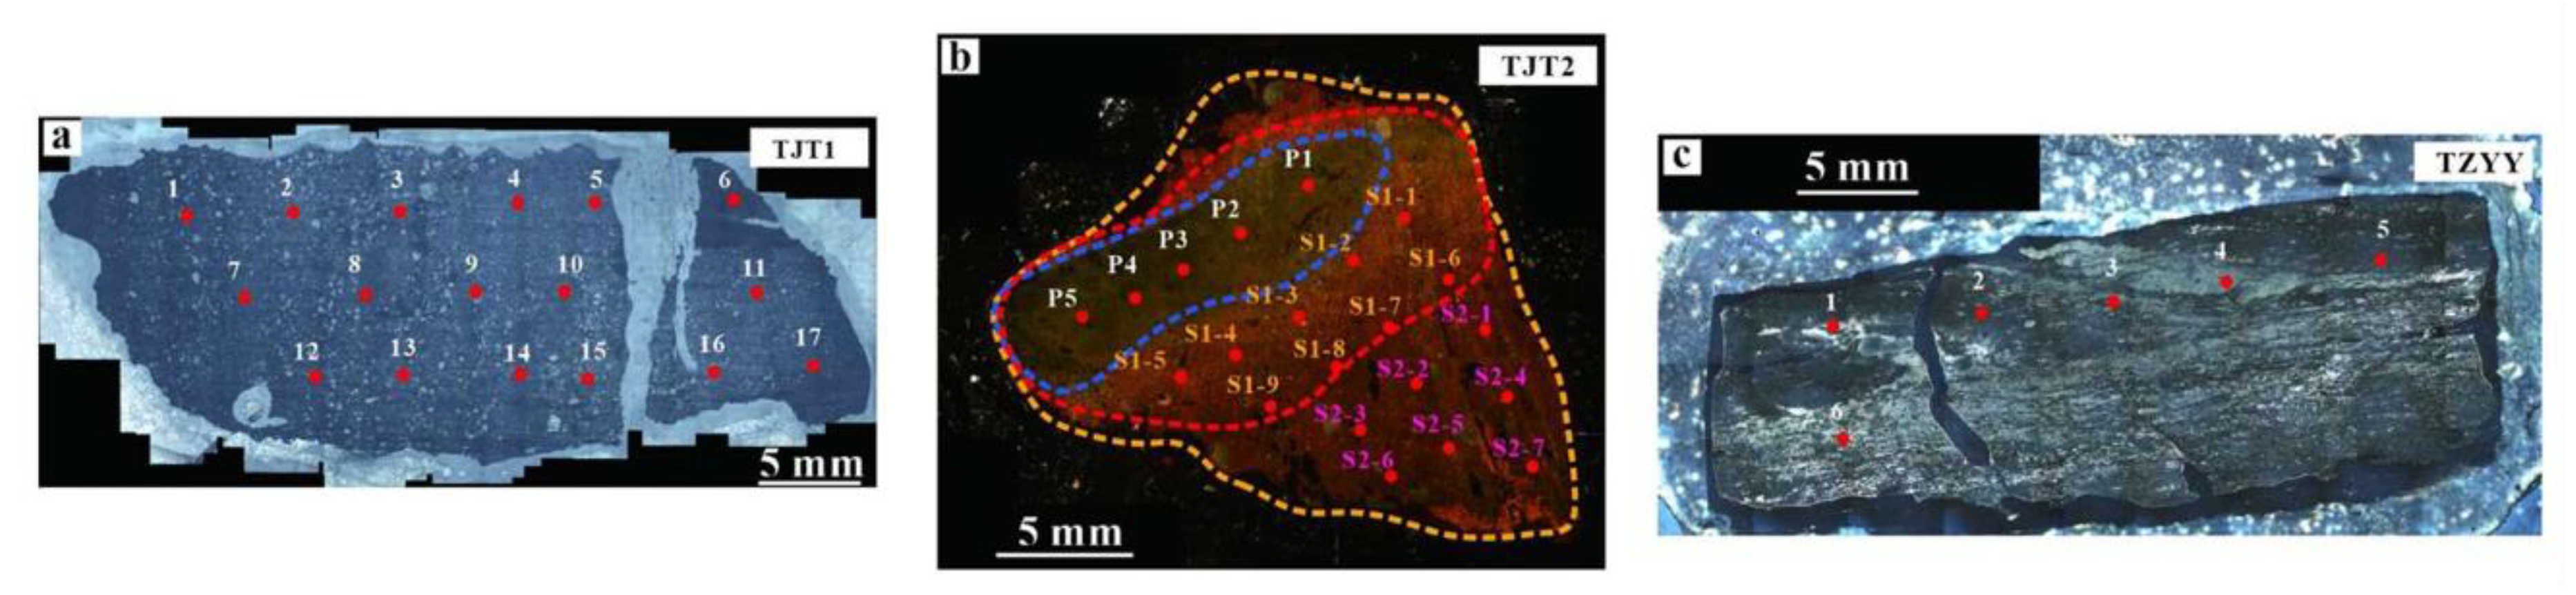
Figure 4.
Comparative analysis of mineralogy in different spheroidal-weathered crust layers. a. SEM image of P zone, revealing a dense matrix and quartz grains. b. SEM image of S1 zone, showing a more porous matrix and fractures. c. SEM image of S2 zone, displaying an even more porous and cavernous matrix, with fillings in fractures resembling the matrix. d.Microscope image of P zone, displaying a relatively dense, bluish-gray matrix with quartz grains visible. e. Microscope image of S1 zone, distinctly showing a yellowish-brown matrix with a decrease in bluish-gray dolomite minerals. f. Microscope image of S2 zone, observing a significant increase in quartz grains, leading to a cloudier matrix, alongside residual milky-white dolomite.
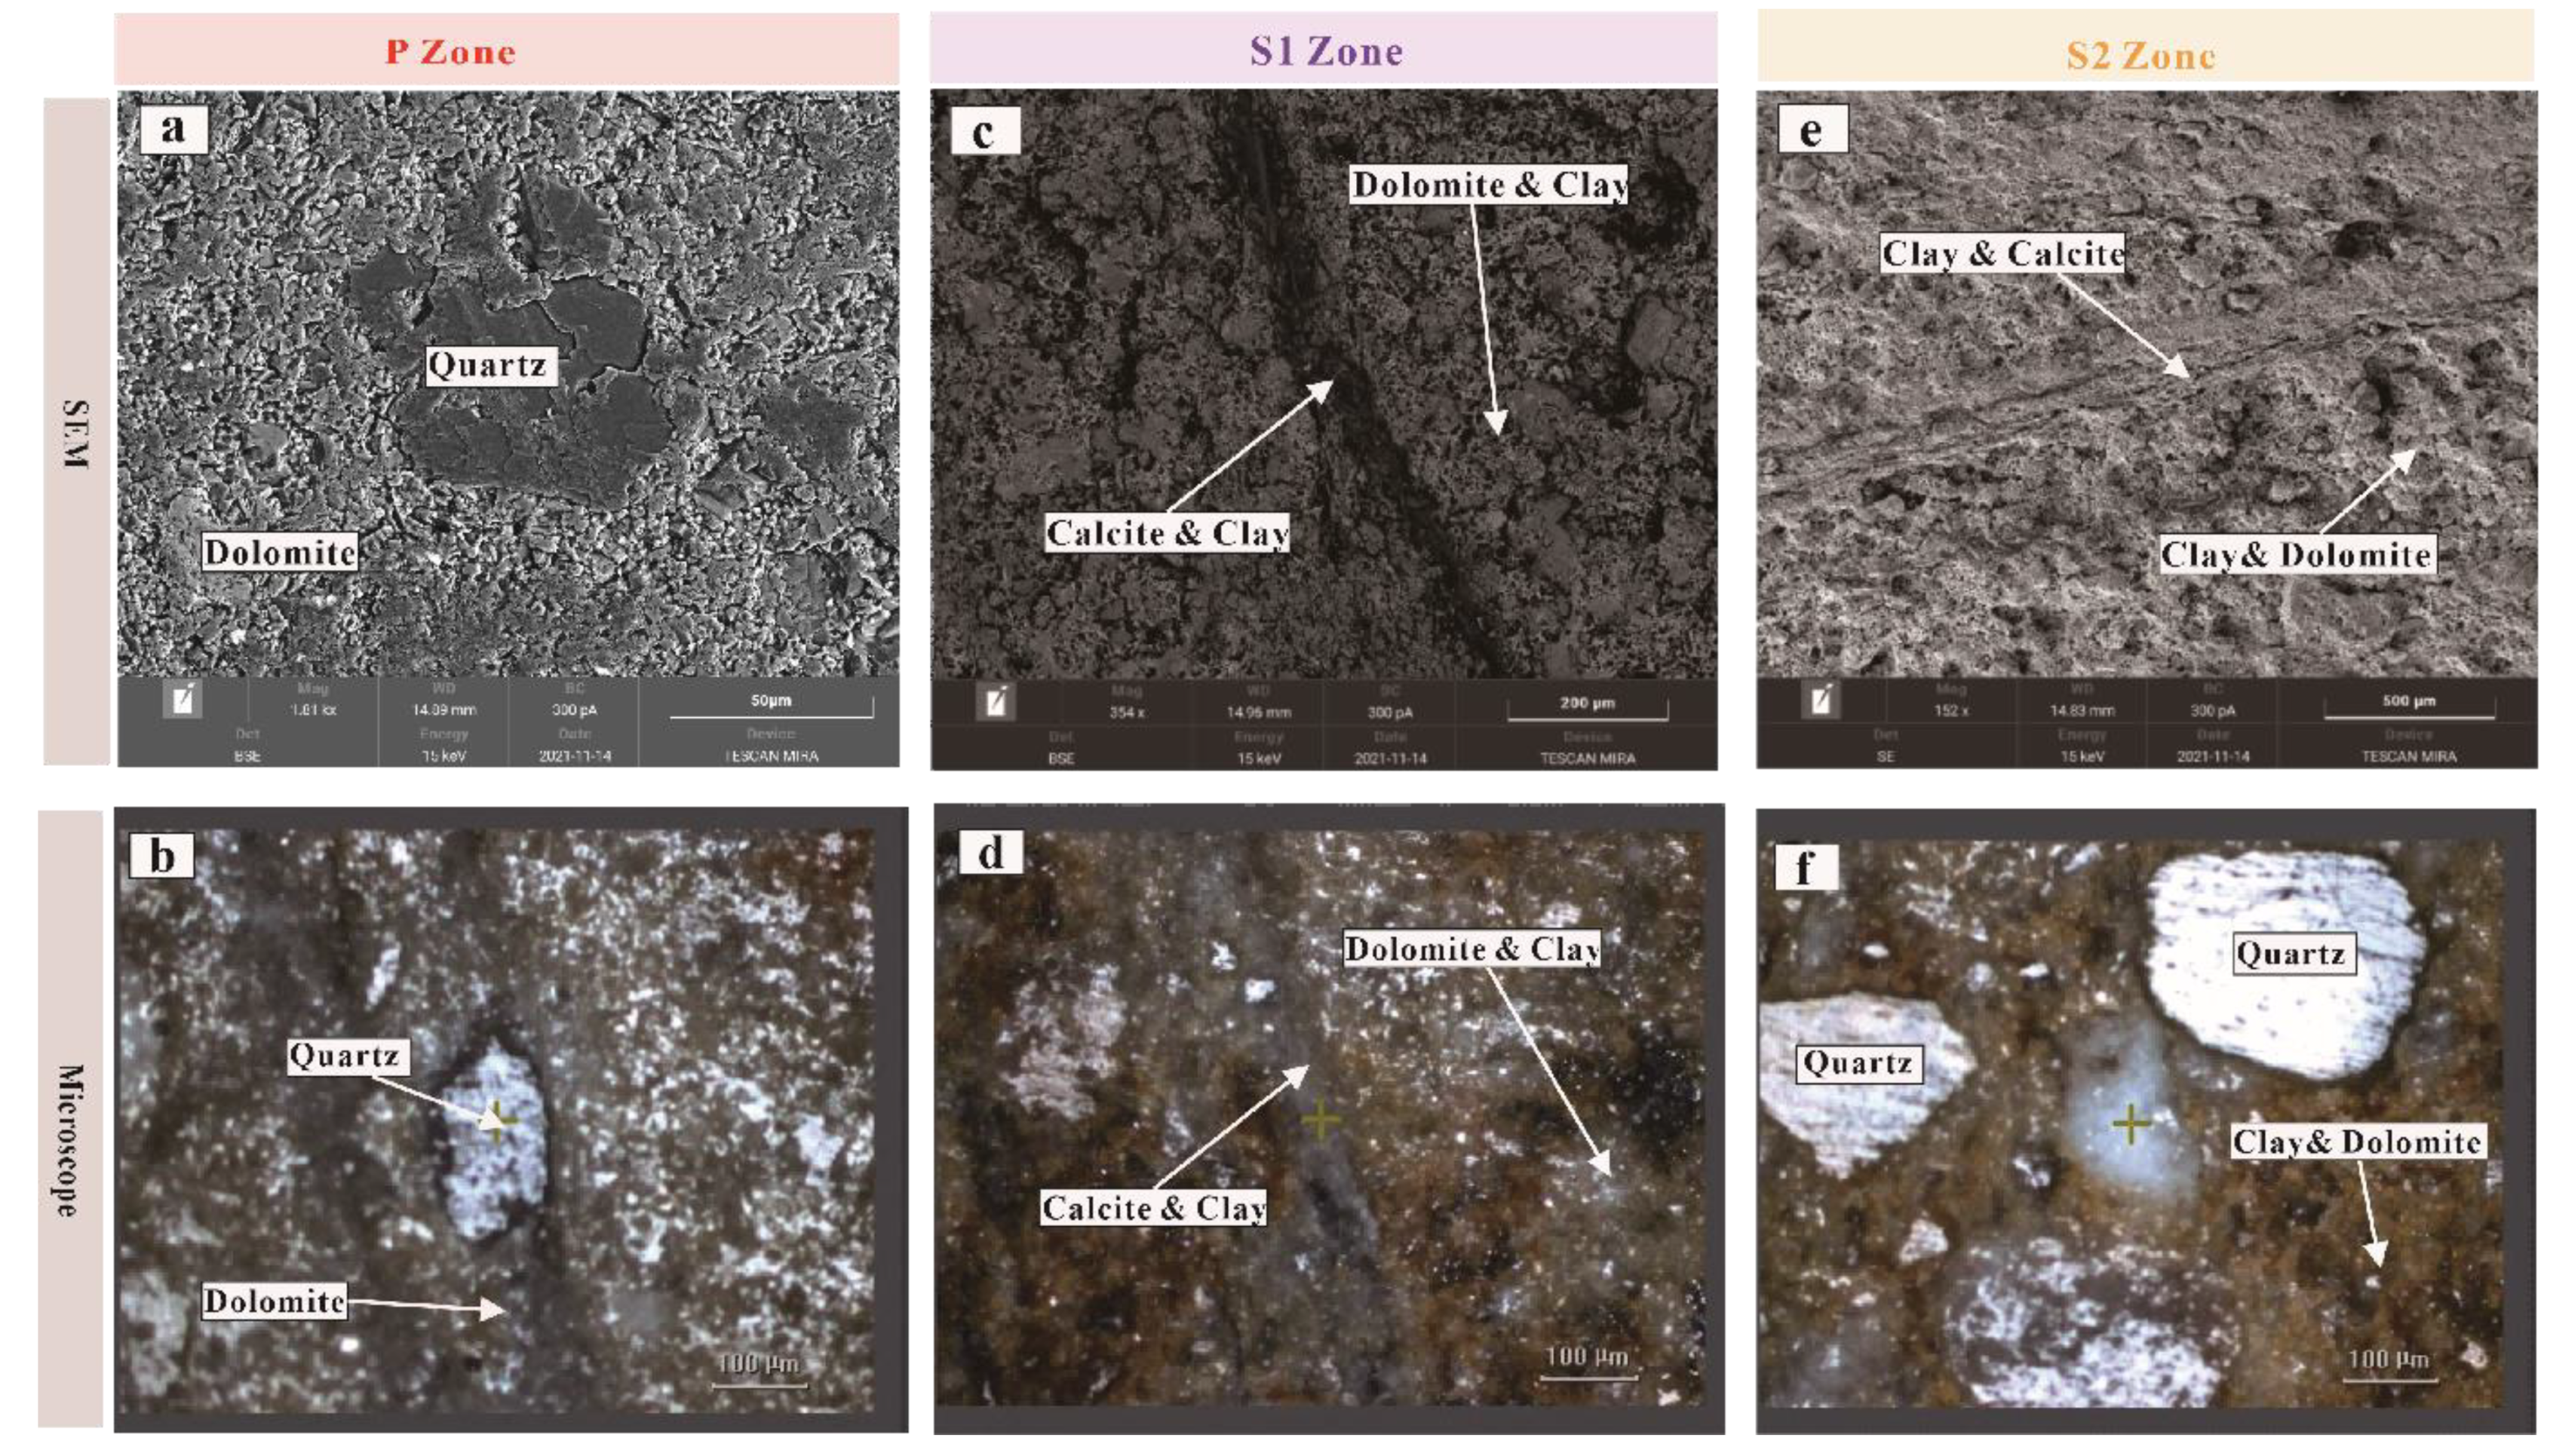
Figure 5.
The XRD in different spheroidal-weathered crust layers. a.The powder XRD data, when compared with Cu-target standard minerals, identified the main minerals in the dolomite as dolomite, quartz, and feldspar. The peak intensities of quartz and feldspar increase from P zone to S2 zone. b.The in-situ XRD data of carbonate matrix grains in different spheroidal-weathered crust layers, when compared with Mo-target standard minerals, no diagenetic transformation between carbonate species occurred.
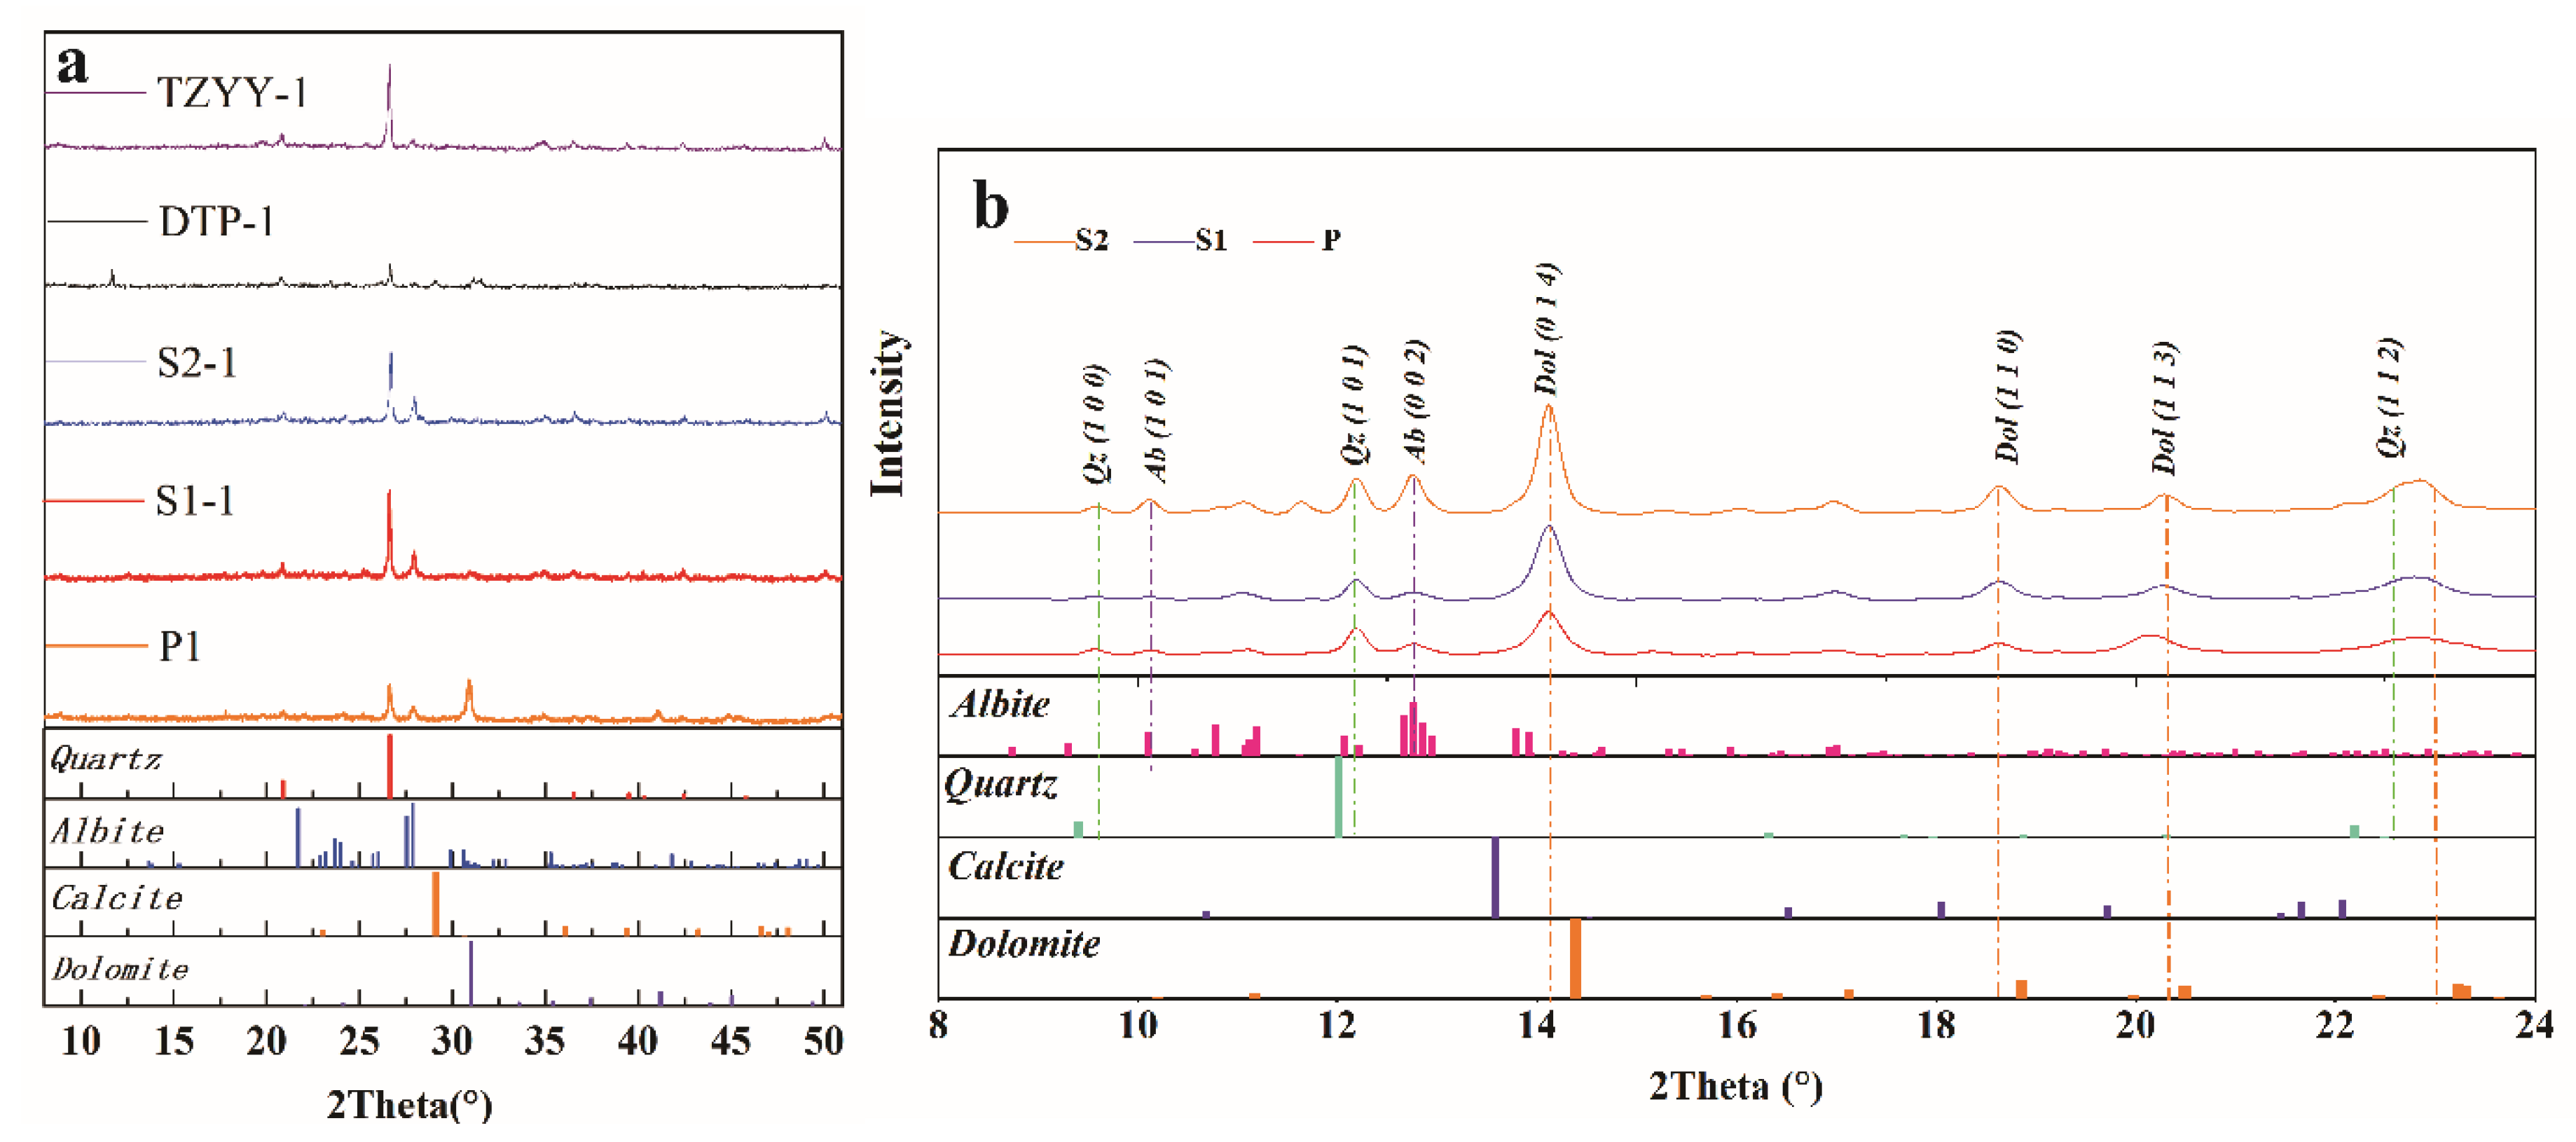
Figure 6.
Element variation in different spheroidal-weathered crust layers. a. In the S1 zone, significant depletion of Mg and Ca elements is observed, accompanied by notable depletion of Ni and Co elements. Conversely, there is significant enrichment of Mo. b. In the S2 zone, Mg and Ca elements continue to be significantly depleted, while Mn, Zn, and Mo elements exhibit notable enrichment.
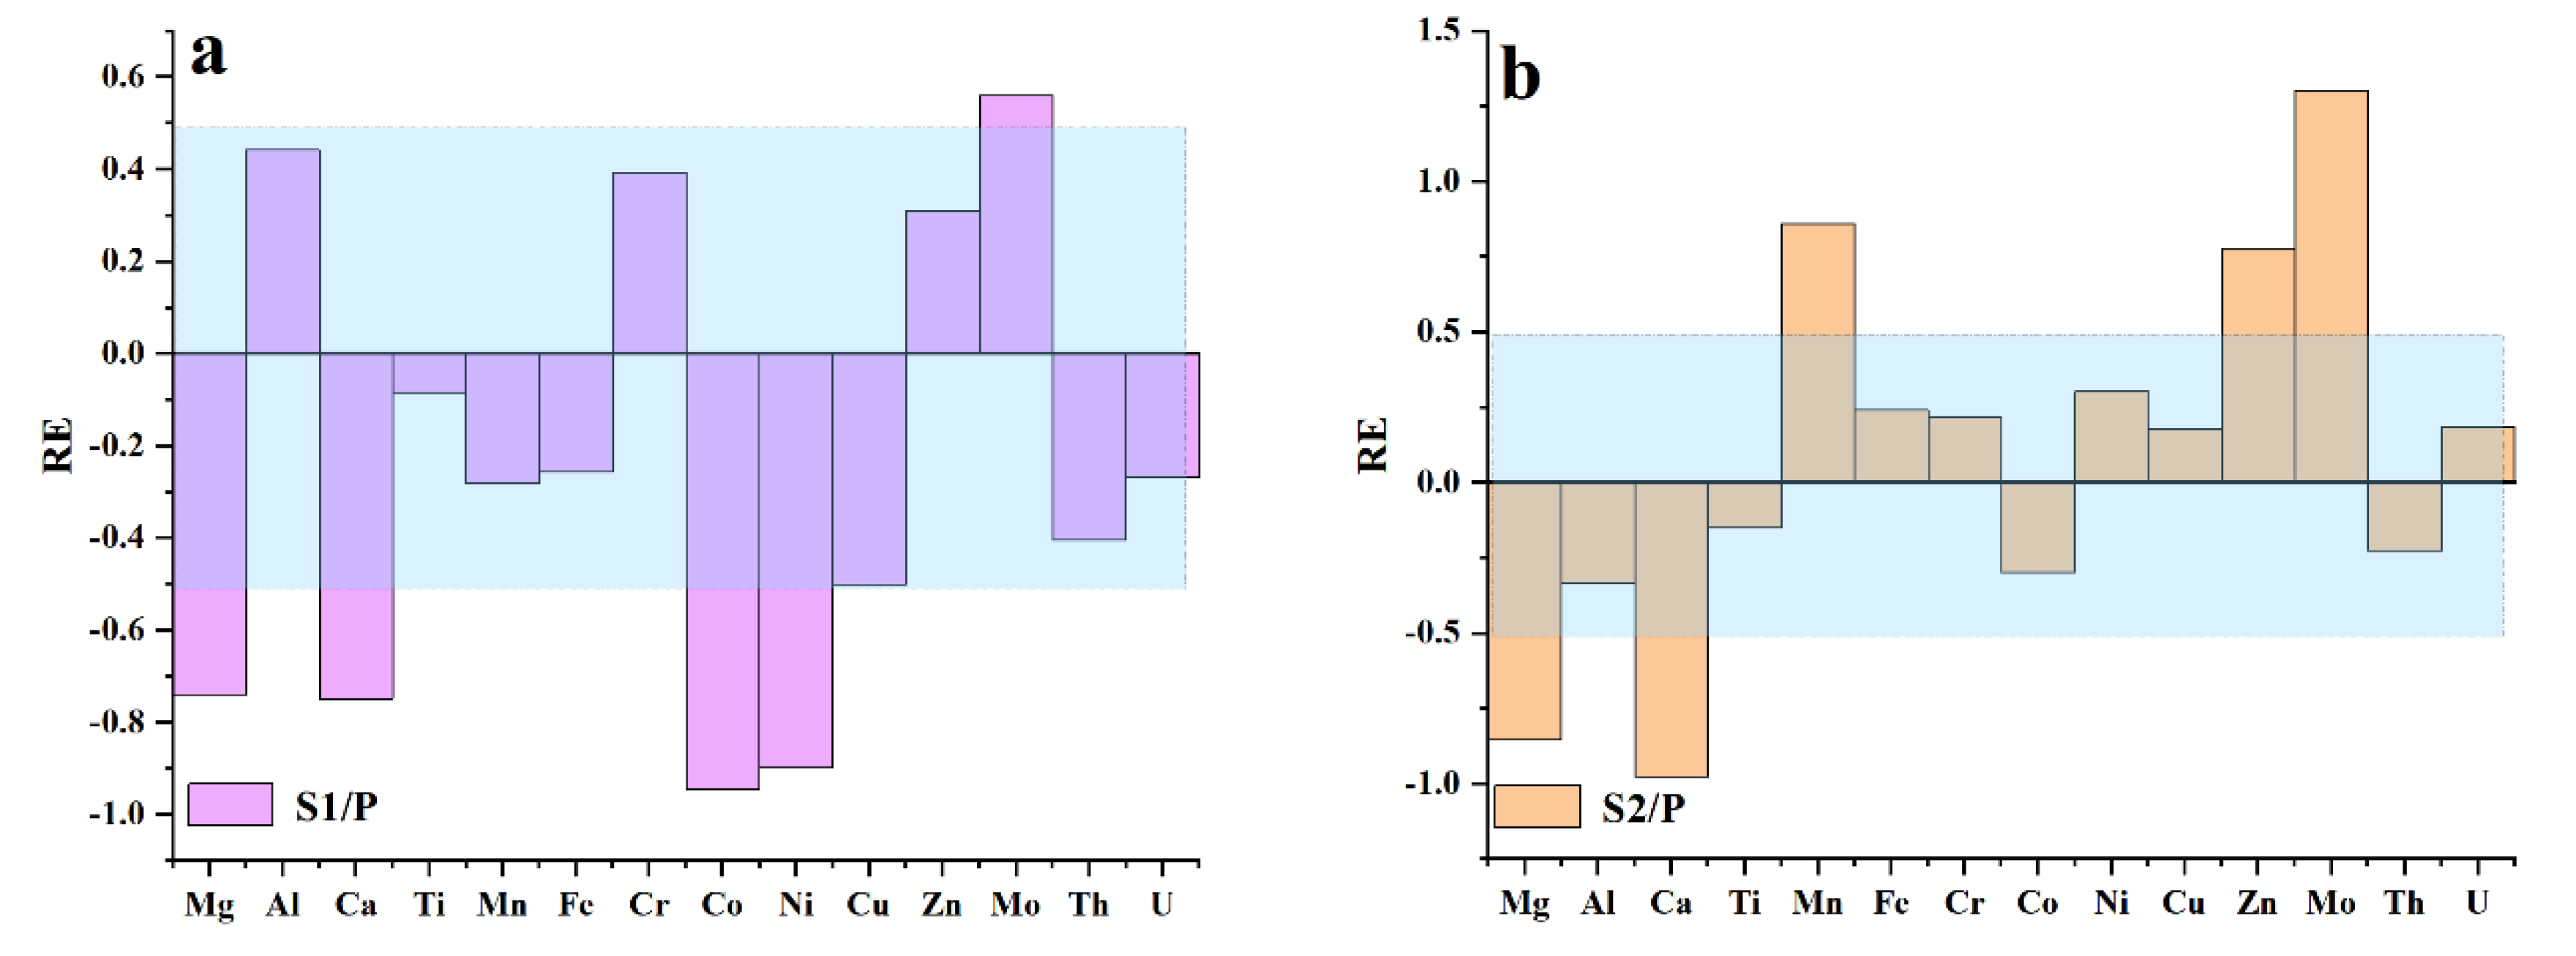
Figure 7.
Variation of element contents. a. Variation of Ca content. The Ca content gradually decreases with increasing weathering intensity. b. Variation of Mg content. c. Variation of Mg/Ca ratio. d.Variation of Mo content. e. Variation of Mn content. f. Variation of Ce/Ce* ratio.
Figure 7.
Variation of element contents. a. Variation of Ca content. The Ca content gradually decreases with increasing weathering intensity. b. Variation of Mg content. c. Variation of Mg/Ca ratio. d.Variation of Mo content. e. Variation of Mn content. f. Variation of Ce/Ce* ratio.
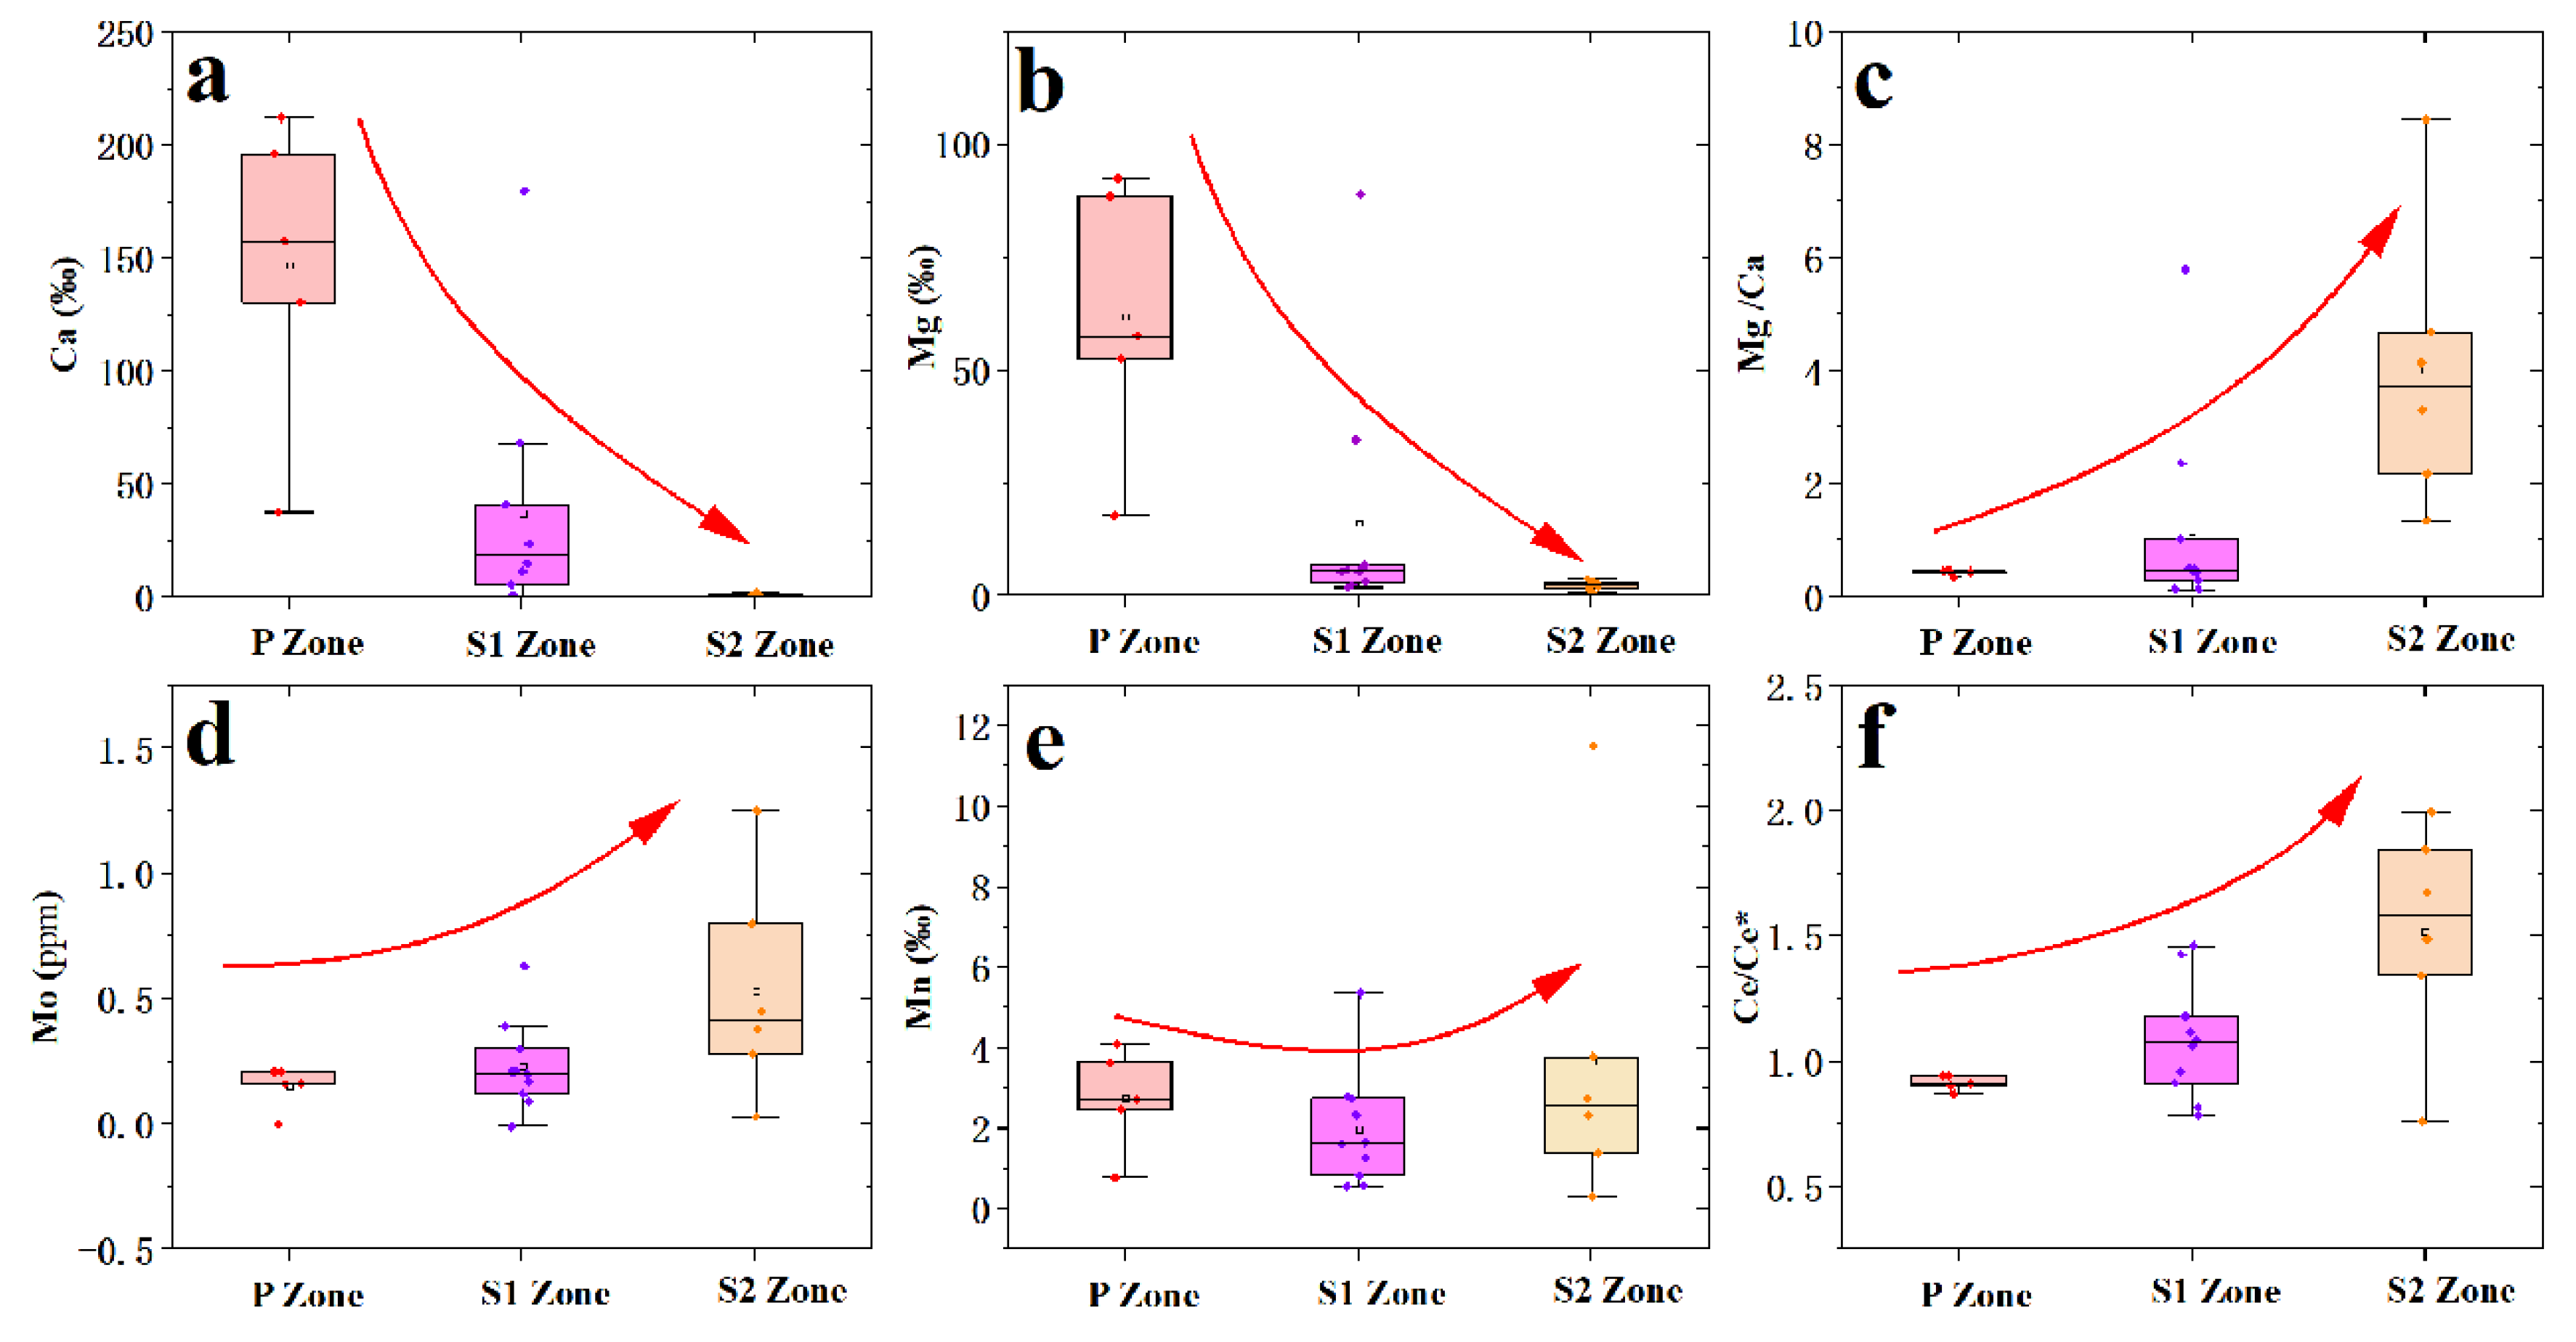
Figure 8.
REEs patterns in different spheroidal-weathered crust layers. a. REEs pattern of P zone. b. REEs pattern of S1 zone. c. REEs pattern of S2 zone. d. REEs patterns of biogenic apatite and iron-manganese micronodules. e. REEs patterns of deep-sea seawater and marine biogenic skeletons. f. REEs patterns of shallow and deep pore waters.
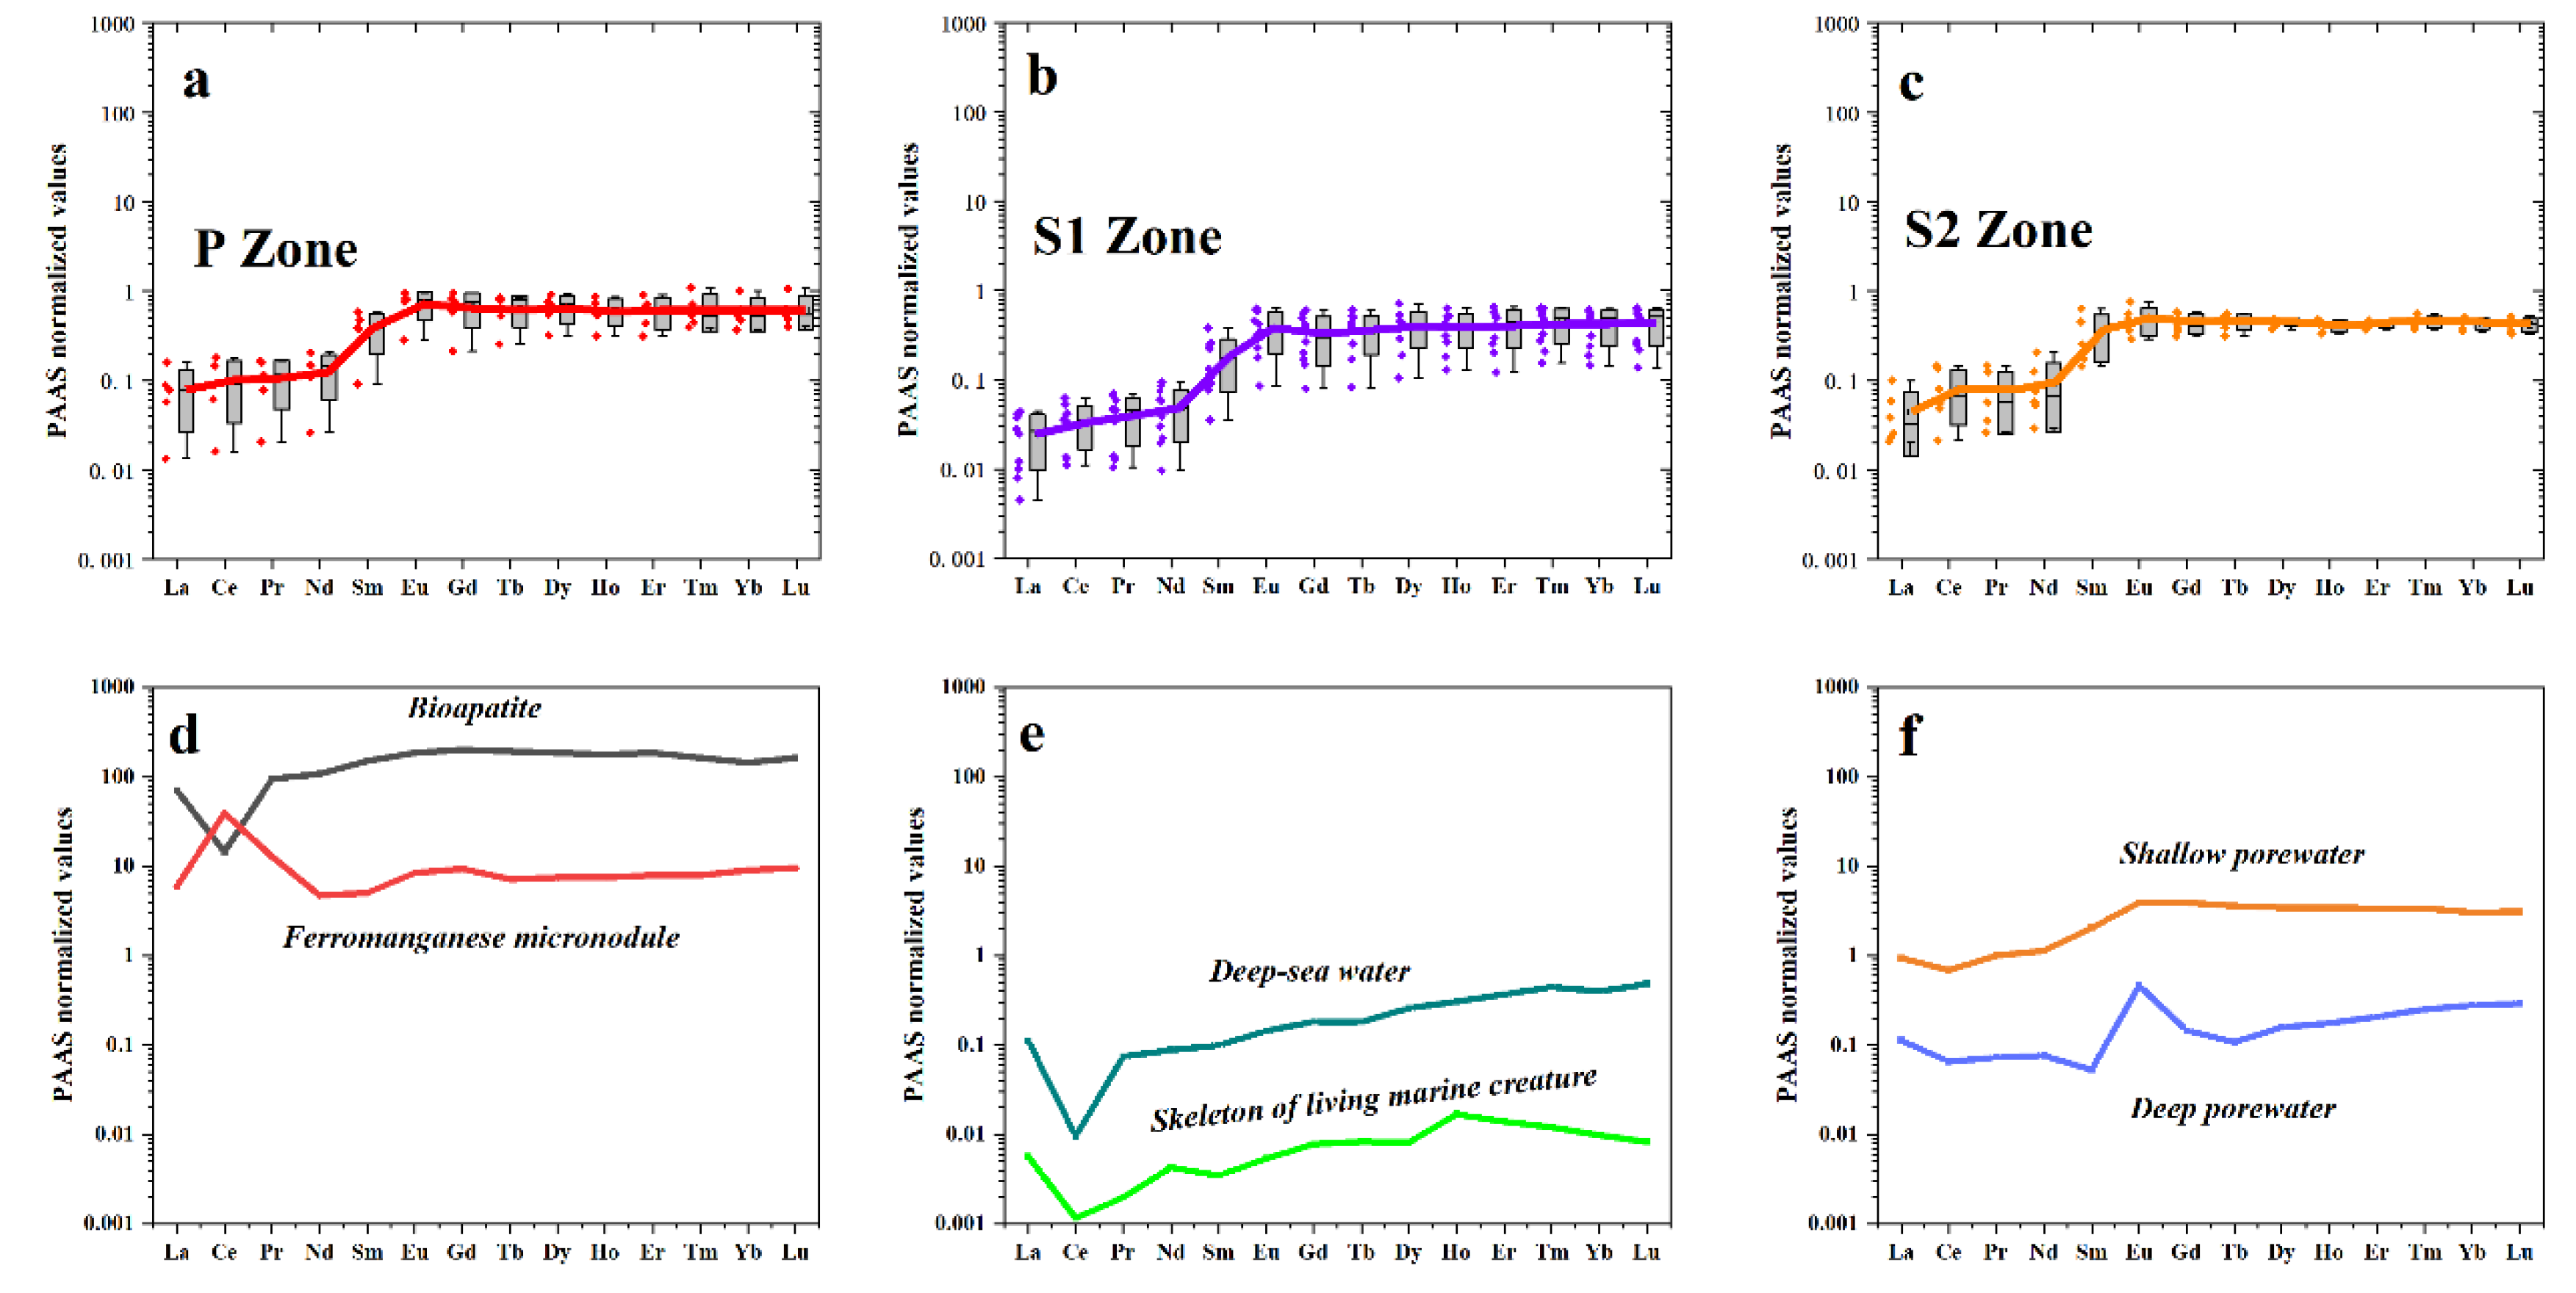
Figure 9.
Distribution of REEs in different spheroidal-weathered crust layers. a. Distribution of total REEs content. b. Distribution of LREE content. c. Distribution of HREE content.
Figure 9.
Distribution of REEs in different spheroidal-weathered crust layers. a. Distribution of total REEs content. b. Distribution of LREE content. c. Distribution of HREE content.
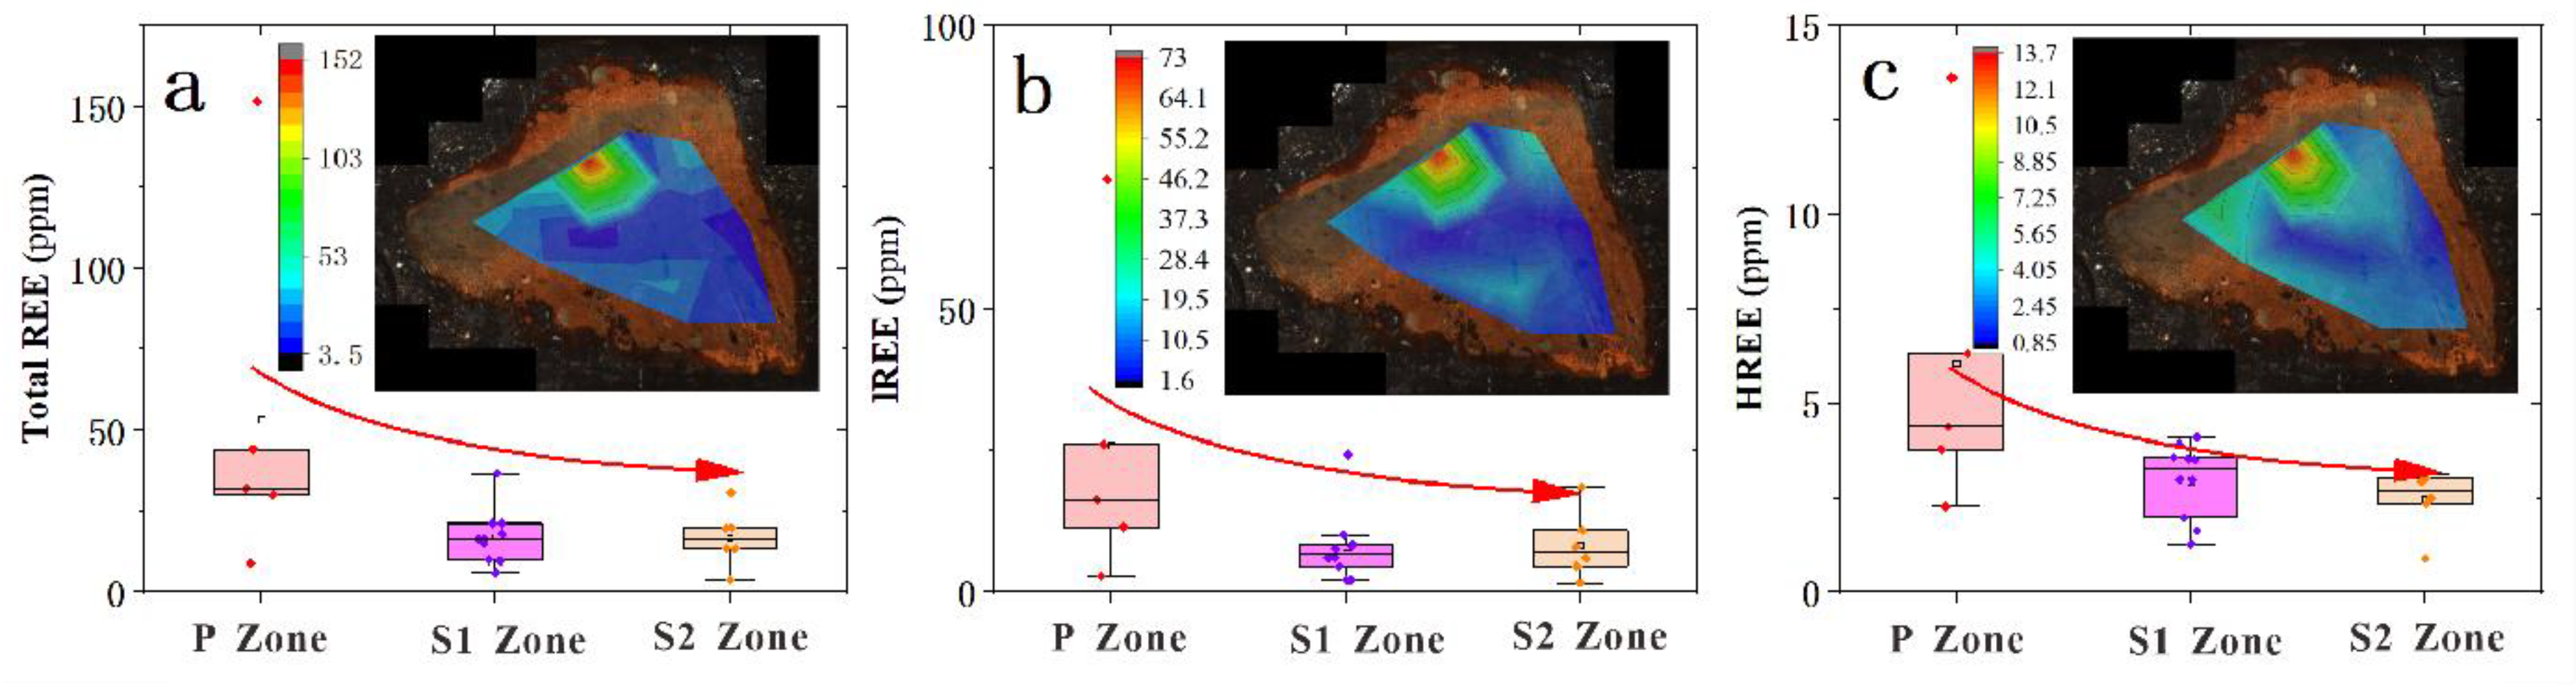
Figure 10.
Variations in carbon and oxygen isotopes in different spheroidal-weathered crust layers. a. In situ carbon and oxygen isotope of spheroidal-weathered dolostone. b-b’. The variation of carbon and oxygen isotopes from the interior to the exterior (Transect A). c-c’. The variation of carbon and oxygen isotopes in P zone (Transect B). d-d’. Distribution of carbon and oxygen isotopes in spheroidal-weathered dolostone. e-e’. Carbon isotope values become progressively lighter with ongoing weathering, while oxygen isotopes become progressively heavier.
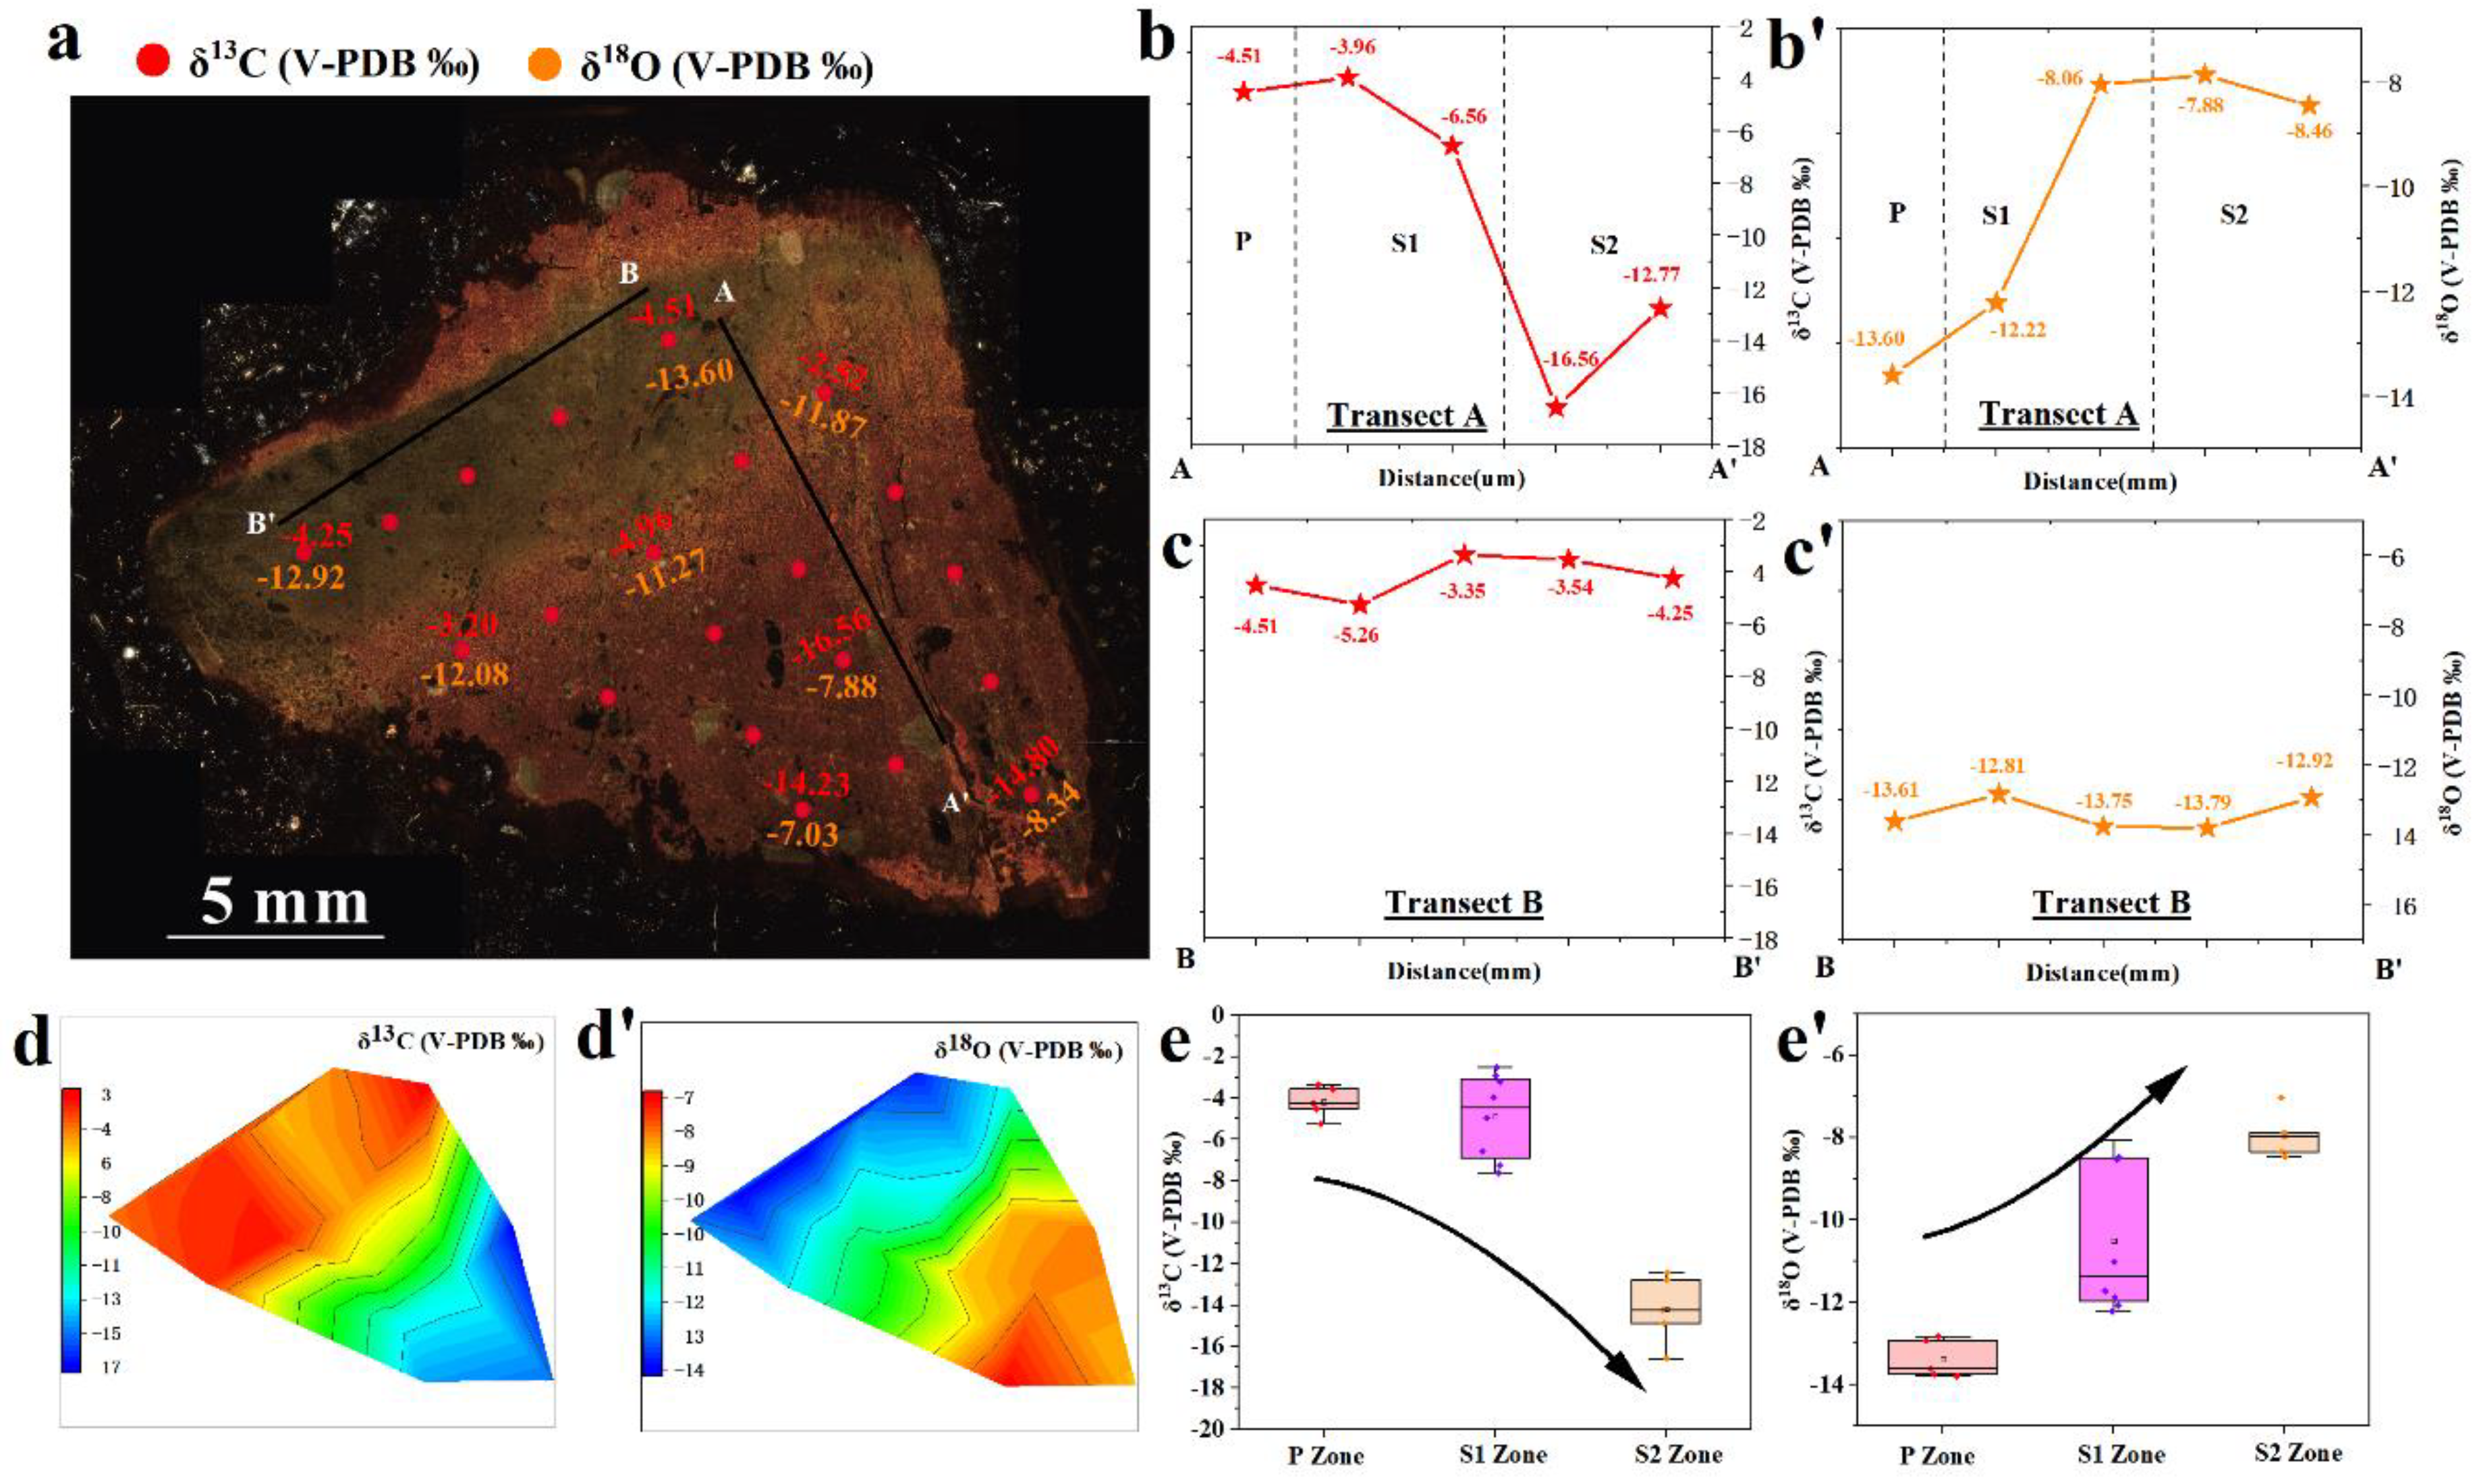
Figure 11.
Carbon and oxygen isotope plot. P zone exhibits similar carbon and oxygen isotope characteristics to the carbonaceous mudstone (TZYY); The carbon and oxygen isotopes of S1 zone fall between P zone and S2 zone; S2 zone displays lighter carbon isotopes and heavier oxygen isotopes compared to P zone.
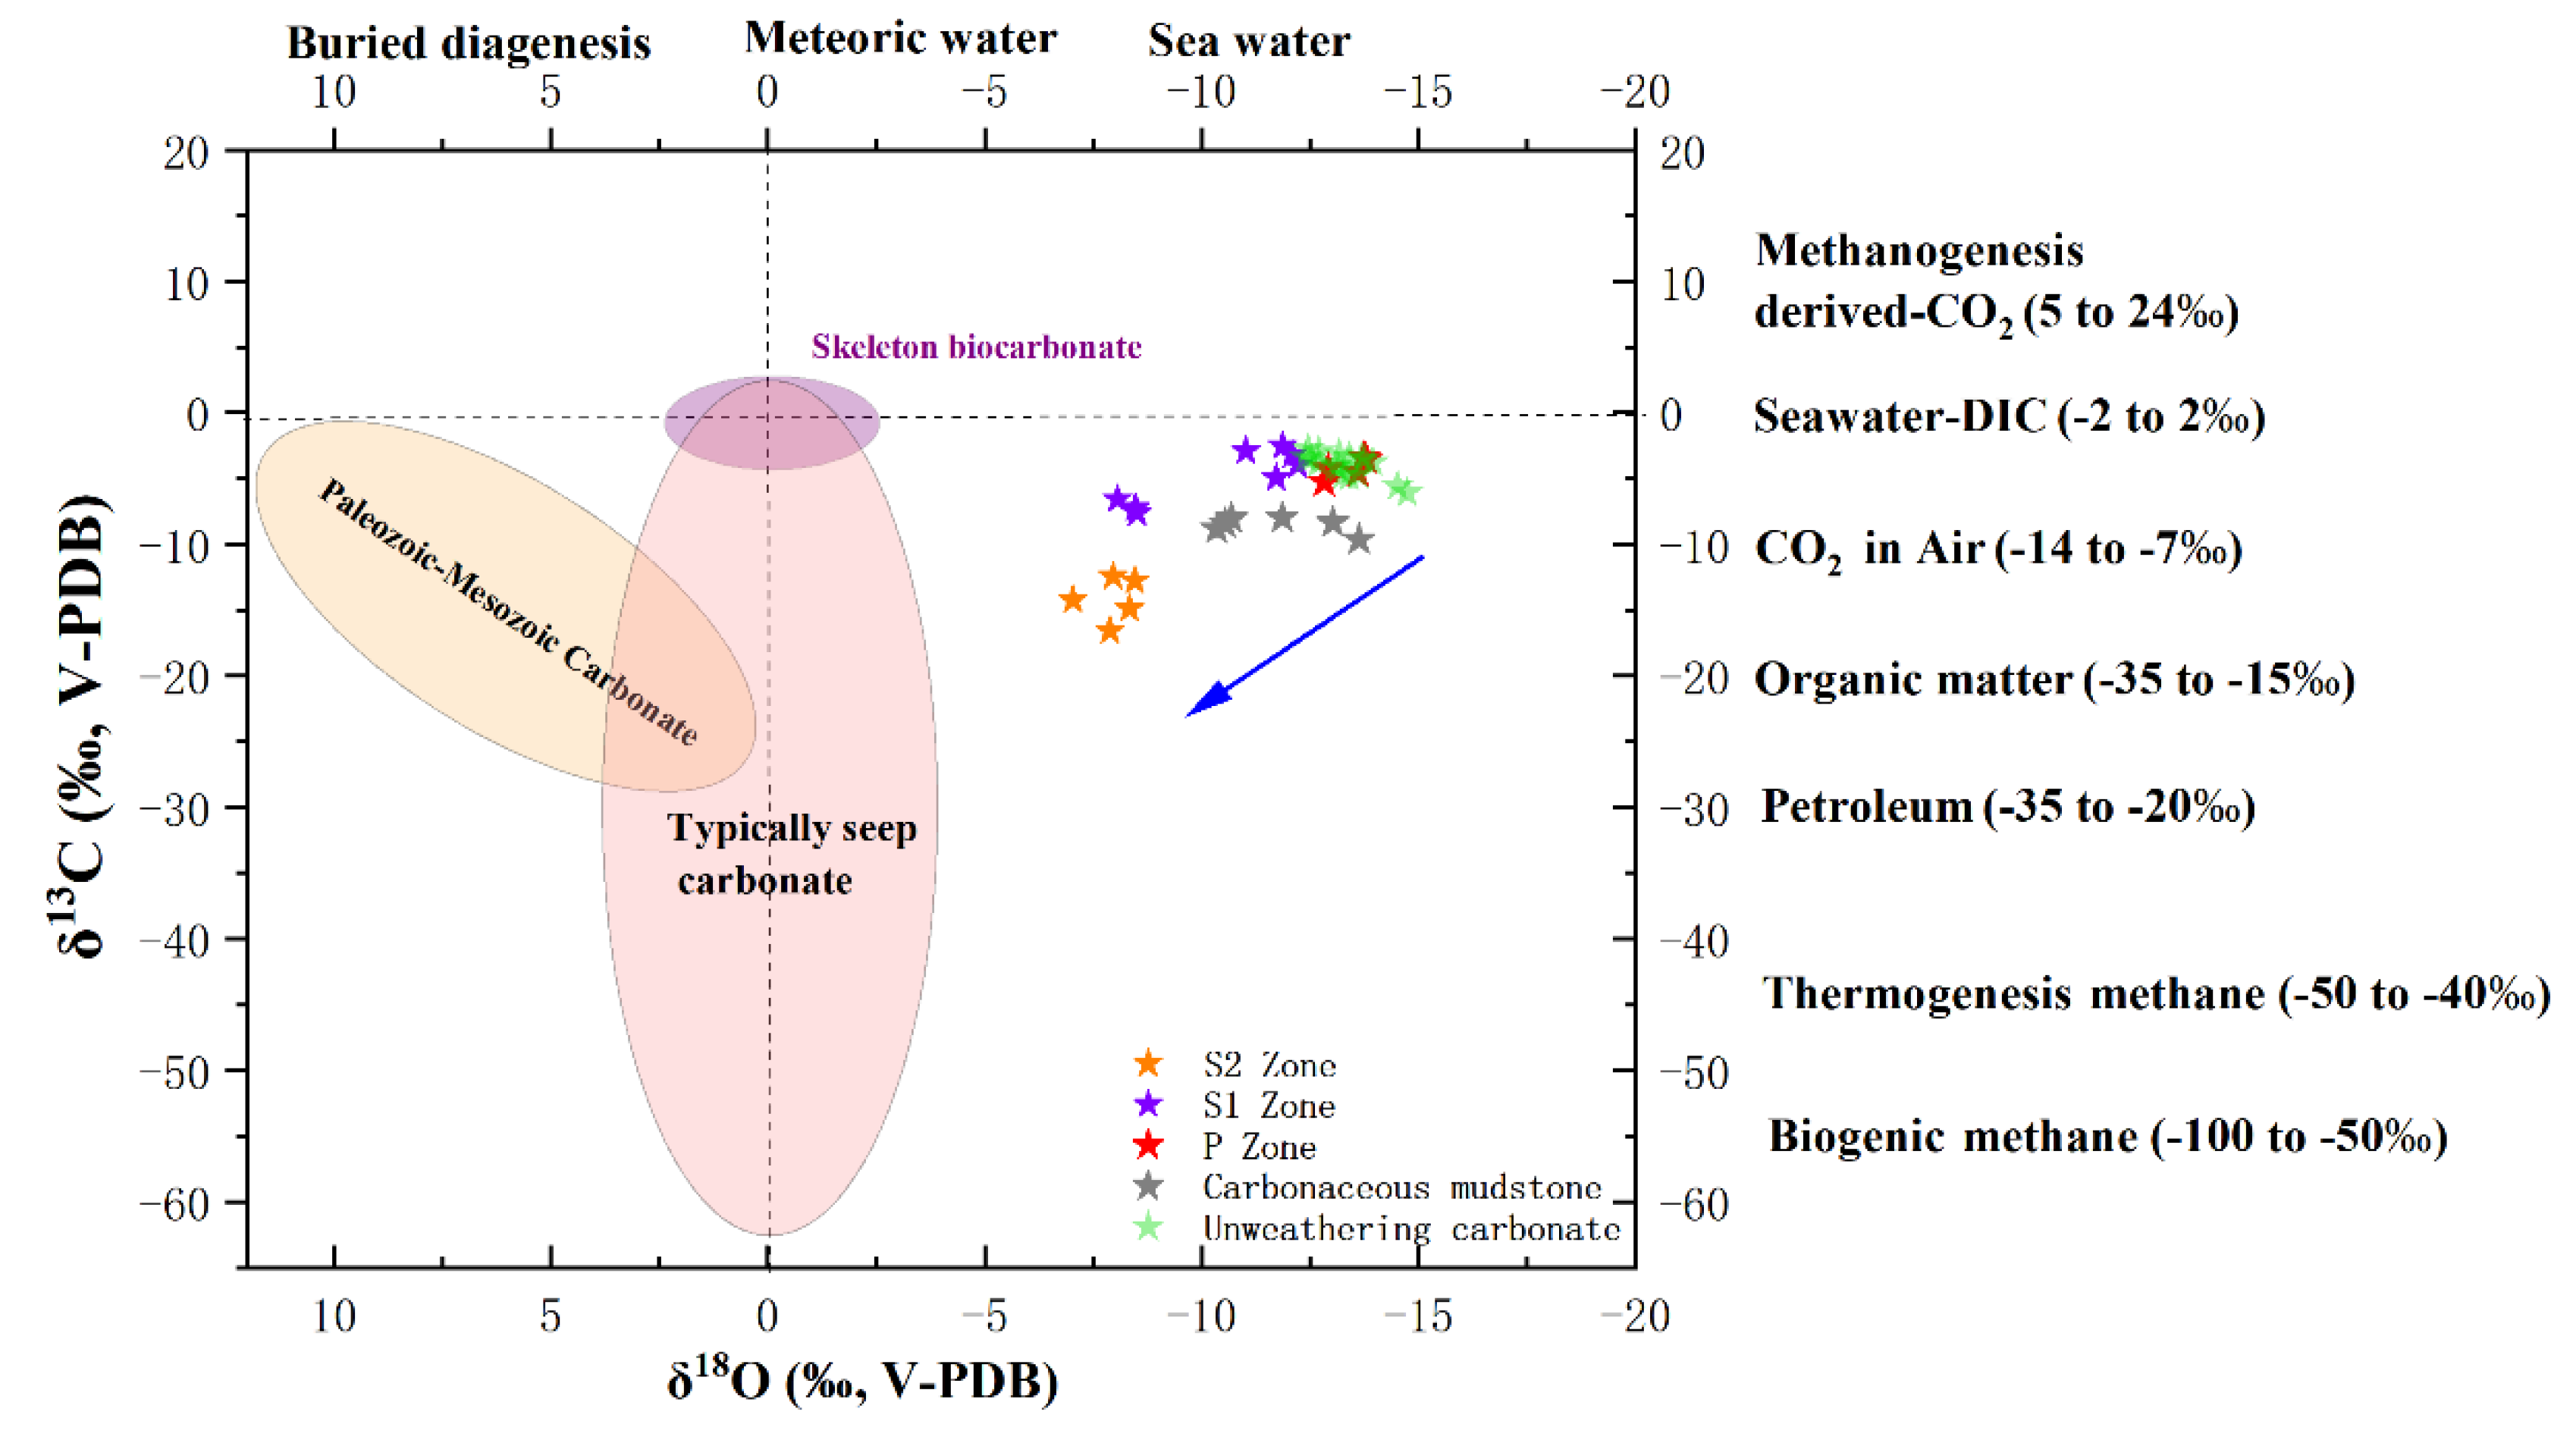

Table 1.
Elements content of spheroidal-weathered dolostone.
| Sample No.* | Mg | Al | Ca | Ti | Mn | Fe | Cr | Co | Ni | Cu | Zn | Mo | Th | U | Mn/Fe | Ni/Co | U/Th |
|---|---|---|---|---|---|---|---|---|---|---|---|---|---|---|---|---|---|
| Unit | ‰ | ‰ | ‰ | ‰ | ‰ | ‰ | ppm | ppm | ppm | ppm | ppm | ppm | ppm | ppm | |||
| P-1 | 17.77 | 45.76 | 37.79 | 1.66 | 0.78 | 8.51 | 24.78 | 1.61 | 2.56 | 1.25 | 34.94 | 0.00 | 2.05 | 0.51 | 0.09 | 1.59 | 0.25 |
| P-2 | 52.59 | 27.58 | 157.64 | 2.01 | 2.48 | 25.56 | 14.75 | 1.56 | 2.96 | 1.26 | 57.71 | 0.16 | 8.81 | 2.29 | 0.10 | 1.89 | 0.26 |
| P-3 | 92.45 | 9.44 | 212.06 | 0.91 | 4.1 | 33.40 | 9.27 | 2.38 | 3.22 | 1.18 | 77.48 | 0.21 | 2.44 | 0.44 | 0.12 | 1.35 | 0.18 |
| P-4 | 57.51 | 24.09 | 130.39 | 1.76 | 2.73 | 40.88 | 16.63 | 407.35 | 314.18 | 68.18 | 88.00 | 0.16 | 4.70 | 1.00 | 0.07 | 0.77 | 0.21 |
| P-5 | 88.57 | 13.25 | 196.03 | 0.40 | 3.65 | 33.10 | 10.21 | 1.70 | 3.21 | 1.63 | 102.24 | 0.21 | 1.80 | 0.25 | 0.11 | 1.89 | 0.14 |
| S1-1 | 89.06 | 9.9 | 179.80 | 0.51 | 5.36 | 54.65 | 23.52 | 21.48 | 10.75 | 7.76 | 249.17 | 0.63 | 2.12 | 0.96 | 0.10 | 0.50 | 0.45 |
| S1-2 | 34.48 | 16.14 | 68.05 | 0.85 | 2.35 | 27.91 | 14.98 | 2.37 | 5.01 | 13.01 | 101.97 | 0.30 | 2.47 | 0.75 | 0.08 | 2.12 | 0.31 |
| S1-3 | 5.78 | 41.96 | 5.67 | 1.94 | 0.56 | 12.60 | 16.61 | 1.02 | 3.77 | 1.61 | 31.13 | -0.01 | 4.07 | 0.90 | 0.04 | 3.68 | 0.22 |
| S1-4 | 5.44 | 108.74 | 11.59 | 2.73 | 0.84 | 9.10 | 61.11 | 1.18 | 3.70 | 1.71 | 57.14 | 0.12 | 1.14 | 0.29 | 0.09 | 3.13 | 0.25 |
| S1-5 | 6.74 | 41.5 | 23.80 | 1.12 | 1.66 | 18.69 | 15.92 | 2.39 | 6.45 | 2.65 | 75.03 | 0.09 | 2.69 | 0.53 | 0.09 | 2.70 | 0.20 |
| S1-6 | 1.89 | 12.54 | 0.80 | 0.56 | 2.79 | 22.80 | 10.57 | 2.97 | 7.36 | 5.19 | 62.84 | 0.21 | 2.08 | 0.66 | 0.12 | 2.48 | 0.32 |
| S1-7 | 5.32 | 20.14 | 41.11 | 1.47 | 1.61 | 23.09 | 13.13 | 2.72 | 8.64 | 15.31 | 150.29 | 0.39 | 2.85 | 0.70 | 0.07 | 3.17 | 0.25 |
| S1-8 | 6.65 | 46.18 | 15.06 | 1.94 | 0.58 | 11.73 | 33.33 | 2.72 | 6.40 | 2.46 | 79.07 | 0.20 | 3.29 | 0.95 | 0.05 | 2.35 | 0.29 |
| S1-9 | 3.04 | 17 | 23.39 | 0.31 | 1.26 | 12.52 | 4.88 | 1.12 | 3.65 | 2.81 | 44.89 | 0.17 | 1.04 | 0.19 | 0.10 | 3.26 | 0.18 |
| S2-1 | 2.32 | 32.36 | 0.40 | 0.93 | 2.75 | 17.04 | 16.74 | 7.41 | 10.11 | 20.91 | 93.10 | 0.21 | 1.87 | 0.64 | 0.16 | 1.36 | 0.34 |
| S2-2 | 0.76 | 11.53 | 0.09 | 0.59 | 0.3 | 3.33 | 5.42 | 0.44 | 0.88 | 0.85 | 21.90 | 0.03 | 0.95 | 0.33 | 0.09 | 2.01 | 0.35 |
| S2-3 | 2.96 | 33.06 | 1.36 | 1.61 | 3.78 | 26.55 | 22.90 | 5.17 | 11.79 | 11.98 | 199.42 | 0.38 | 1.87 | 0.86 | 0.14 | 2.28 | 0.46 |
| S2-4 | 2.91 | 8.96 | 2.17 | 0.48 | 11.51 | 51.73 | 52.54 | 5.70 | 15.82 | 16.49 | 256.20 | 1.25 | 1.28 | 0.41 | 0.22 | 2.78 | 0.32 |
| S2-5 | 2.25 | 31.26 | 0.48 | 1.25 | 1.39 | 19.47 | 31.65 | 3.08 | 8.71 | 7.50 | 172.93 | 0.45 | 1.70 | 0.73 | 0.07 | 2.83 | 0.43 |
| S2-6 | 3.69 | 32.6 | 0.89 | 1.35 | 2.76 | 37.79 | 31.98 | 3.65 | 10.70 | 10.55 | 254.11 | 0.80 | 2.84 | 1.72 | 0.07 | 2.93 | 0.61 |
| S2-7 | 1.49 | 20.79 | 0.45 | 1.04 | 2.32 | 17.69 | 9.52 | 1.09 | 3.53 | 4.49 | 103.79 | 0.28 | 2.33 | 0.62 | 0.13 | 3.24 | 0.26 |
Table 2.
REEs concentration of spheroidal-weathered dolostone.
| Sample No.* | La | Ce | Pr | Nd | Sm | Eu | Gd | Tb | Dy | Ho | Er | Tm | Yb | Lu | Ce/Ce* | Eu/Eu* |
|---|---|---|---|---|---|---|---|---|---|---|---|---|---|---|---|---|
| P-1 | 0.51 | 1.29 | 0.18 | 0.89 | 0.51 | 0.30 | 0.99 | 0.20 | 1.49 | 0.31 | 0.89 | 0.16 | 1.05 | 0.17 | 0.95 | 1.85 |
| P-2 | 9.01 | 27.43 | 4.90 | 31.47 | 19.54 | 5.51 | 21.89 | 2.64 | 13.34 | 2.20 | 5.92 | 0.82 | 5.98 | 0.90 | 0.87 | 1.24 |
| P-3 | 6.08 | 11.64 | 1.46 | 6.97 | 3.22 | 1.03 | 4.44 | 0.65 | 3.59 | 0.72 | 2.03 | 0.29 | 1.78 | 0.28 | 0.90 | 1.24 |
| P-4 | 2.21 | 4.92 | 0.69 | 3.68 | 2.11 | 0.82 | 3.58 | 0.61 | 4.30 | 0.86 | 2.58 | 0.44 | 2.83 | 0.46 | 0.91 | 1.33 |
| P-5 | 3.04 | 7.31 | 1.01 | 4.99 | 2.63 | 0.87 | 3.81 | 0.62 | 3.39 | 0.63 | 1.86 | 0.22 | 1.47 | 0.24 | 0.94 | 1.25 |
| S1-1 | 3.40 | 14.41 | 1.40 | 5.07 | 2.17 | 0.89 | 2.73 | 0.41 | 2.56 | 0.53 | 1.24 | 0.18 | 1.34 | 0.21 | 1.46 | 1.69 |
| S1-2 | 1.59 | 4.98 | 0.62 | 2.88 | 1.37 | 0.65 | 2.28 | 0.40 | 2.52 | 0.50 | 1.53 | 0.25 | 1.51 | 0.24 | 1.12 | 1.64 |
| S1-3 | 1.54 | 2.84 | 0.30 | 1.32 | 0.73 | 0.37 | 1.25 | 0.27 | 2.09 | 0.51 | 1.64 | 0.26 | 1.75 | 0.28 | 0.96 | 1.73 |
| S1-4 | 0.30 | 0.88 | 0.11 | 0.76 | 0.51 | 0.34 | 0.69 | 0.13 | 0.88 | 0.18 | 0.57 | 0.08 | 0.53 | 0.09 | 1.06 | 2.62 |
| S1-5 | 1.69 | 3.34 | 0.51 | 2.54 | 1.45 | 0.62 | 2.58 | 0.47 | 3.35 | 0.63 | 1.89 | 0.26 | 1.73 | 0.22 | 0.82 | 1.42 |
| S1-6 | 1.08 | 4.23 | 0.41 | 1.96 | 1.27 | 0.46 | 1.57 | 0.30 | 2.07 | 0.42 | 1.17 | 0.19 | 1.40 | 0.22 | 1.43 | 1.49 |
| S1-7 | 0.95 | 2.60 | 0.41 | 2.06 | 1.23 | 0.50 | 1.91 | 0.39 | 2.50 | 0.51 | 1.67 | 0.23 | 1.43 | 0.24 | 0.91 | 1.46 |
| S1-8 | 0.38 | 1.04 | 0.12 | 0.67 | 0.43 | 0.19 | 0.93 | 0.20 | 1.75 | 0.41 | 1.41 | 0.21 | 1.63 | 0.26 | 1.09 | 1.28 |
| S1-9 | 1.44 | 3.30 | 0.60 | 3.17 | 2.11 | 0.68 | 2.81 | 0.33 | 1.76 | 0.31 | 0.73 | 0.11 | 0.68 | 0.11 | 0.79 | 1.28 |
| S2-1 | 0.46 | 2.70 | 0.40 | 1.01 | 0.63 | 0.25 | 0.79 | 0.20 | 1.35 | 0.26 | 0.84 | 0.13 | 0.88 | 0.12 | 1.18 | 1.60 |
| S2-2 | 0.17 | 1.09 | 0.09 | 0.33 | 0.20 | 0.09 | 0.37 | 0.06 | 0.49 | 0.13 | 0.34 | 0.06 | 0.41 | 0.06 | 1.84 | 1.49 |
| S2-3 | 1.49 | 6.38 | 0.50 | 2.60 | 1.42 | 0.46 | 2.06 | 0.38 | 2.07 | 0.34 | 1.06 | 0.15 | 0.99 | 0.14 | 1.68 | 1.23 |
| S2-4 | 2.25 | 10.90 | 1.11 | 4.29 | 2.52 | 0.82 | 2.62 | 0.43 | 2.30 | 0.47 | 1.34 | 0.18 | 1.33 | 0.18 | 1.49 | 1.50 |
| S2-5 | 0.88 | 3.91 | 0.23 | 0.99 | 0.80 | 0.31 | 1.44 | 0.24 | 1.75 | 0.34 | 1.11 | 0.16 | 1.07 | 0.15 | 1.99 | 1.28 |
| S2-6 | 0.98 | 4.47 | 0.51 | 1.96 | 3.56 | 0.60 | 1.84 | 0.30 | 1.94 | 0.42 | 1.23 | 0.23 | 1.43 | 0.23 | 1.34 | 1.08 |
| S2-7 | 0.80 | 1.70 | 0.31 | 1.78 | 0.97 | 0.39 | 1.68 | 0.33 | 2.13 | 0.45 | 1.26 | 0.19 | 1.27 | 0.20 | 0.76 | 1.36 |
Table 3.
The carbon and oxygen isotope values of different rocks in the study area.
| Sample No. | δ13CV-PDB | δ18OV-PDB | Sample No* | δ13CV-PDB | δ18OV-PDB | |
|---|---|---|---|---|---|---|
| TJT1-1 | -6.07 | -14.73 | P-1 | -4.51 | -13.60 | |
| TJT1-2 | -5.58 | -14.52 | P-2 | -5.26 | -12.83 | |
| TJT1-3 | -4.83 | -13.40 | P-3 | -3.35 | -13.75 | |
| TJT1-4 | -4.68 | -13.61 | P-4 | -3.54 | -13.79 | |
| TJT1-5 | -3.45 | -13.68 | P-5 | -4.25 | -12.92 | |
| TJT1-6 | -3.78 | -13.94 | S1-1 | -2.52 | -11.87 | |
| TJT1-7 | -3.12 | -13.17 | S1-2 | -3.96 | -12.22 | |
| TJT1-8 | -3.47 | -12.51 | S1-3 | -4.96 | -11.72 | |
| TJT1-9 | -4.23 | -13.16 | S1-4 | -2.90 | -11.02 | |
| TJT1-10 | -4.73 | -13.27 | S1-5 | -3.20 | -12.08 | |
| TJT1-11 | -3.48 | -13.75 | S1-6 | - | - | |
| TJT1-12 | -3.36 | -13.40 | S1-7 | -6.56 | -8.06 | |
| TJT1-13 | -2.95 | -12.69 | S1-8 | -7.61 | -8.52 | |
| TJT1-14 | -2.76 | -12.45 | S1-9 | -7.23 | -8.47 | |
| TJT1-15 | -4.03 | -13.09 | S2-1 | - | - | |
| TJT1-16 | -3.83 | -12.69 | S2-2 | -16.56 | -7.88 | |
| TJT1-17 | -3.40 | -12.40 | S2-3 | -12.43 | -7.96 | |
| Average | -3.99 | -13.32 | S2-4 | -12.77 | -8.46 | |
| TZYY-1 | -8.03 | -10.68 | S2-5 | - | - | |
| TZYY-2 | -7.99 | -11.86 | S2-6 | -14.23 | -7.03 | |
| TZYY-3 | -8.44 | -10.55 | S2-7 | -14.8 | -8.34 | |
| TZYY-4 | -8.34 | -13.02 | Average | -7.26 | -10.58 | |
| TZYY-5 | -8.82 | -10.35 | ||||
| TZYY-6 | -9.65 | -13.63 | ||||
| Average | -8.55 | -11.68 |
Disclaimer/Publisher’s Note: The statements, opinions and data contained in all publications are solely those of the individual author(s) and contributor(s) and not of MDPI and/or the editor(s). MDPI and/or the editor(s) disclaim responsibility for any injury to people or property resulting from any ideas, methods, instructions or products referred to in the content. |
© 2025 by the authors. Licensee MDPI, Basel, Switzerland. This article is an open access article distributed under the terms and conditions of the Creative Commons Attribution (CC BY) license (http://creativecommons.org/licenses/by/4.0/).
Copyright: This open access article is published under a Creative Commons CC BY 4.0 license, which permit the free download, distribution, and reuse, provided that the author and preprint are cited in any reuse.


