Submitted:
03 April 2025
Posted:
03 April 2025
You are already at the latest version
Abstract
Uniformity in material coating is not only essential for ensuring durability and long-term reliability but also for reducing costs, optimizing resources, and maintaining high-quality standards in industrial applications. Zinc phosphate is notable for coating steel surfaces due to its excellent corrosion resistance and adhesion properties in various industries. This study investigates the optimal flow rate of a diaphragm pump for achieving effective and uniform coating of a steel cylinder. The coating uniformity was assessed using Scanning Electron Microscopy (SEM), focusing on layer thickness and elemental composition. A range of flow rates was analyzed to determine their influence on coating quality and regularity, with Energy Dispersive Spectroscopy (EDS) revealing the distribution and homogeneity of the applied layer. The results identified a flow rate of 30 L/min as optimal, as it minimized surface defects and ensured consistent thickness across the cylinder. This study provides valuable insights for optimizing industrial coating processes, contributing to improved efficiency and reduced resource waste.
Keywords:
scanning electron microscopy
; energy dispersive spectroscopy
; phosphating
; flow rate
; uniformity
; zinc phosphate
1. Introduction
In metal finishing, coating plays a crucial role in preventing environmental degradation, reducing wear, friction, and thermal degradation in high-stress environments, particularly in ferrous and non-ferrous metals. Ferrous metals, due to their high iron content, are highly susceptible to oxidation, leading to rust formation [1,2]. Although non-ferrous metals are not as susceptible to oxidation as ferrous metals, they can still undergo oxidation and chemical degradation [3,4]. Hence, material coatings are essential as they create barriers that inhibit the penetration of oxygen and moisture, thereby reducing corrosion. Among the most popular metal finishing techniques employed over time, phosphating is one of the most commonly used metal finishing techniques, not only because of its high corrosion resistance but also due to its improved structural abrasive resistance, good adhesion, and low manufacturing cost [5,6,7,8,9].
The phosphating process is fundamentally based on the electrochemical dissolution of the metal substrate and the simultaneous precipitation of metal phosphate layers. In its pure form, phosphating is referred to as iron phosphating, resulting in the formation of an iron phosphate (FePO) layer [10,11]. The process is summarized in Equations (1)–(4).
The phosphating process occurs through a combination of anodic and cathodic reactions. Iron in the substrate undergoes oxidation to release Fe ions, as shown in Equation (2). Concurrently, hydrogen ions from the phosphoric acid are reduced to form hydrogen gas, as illustrated in Equation (3). The Fe ions then react with phosphate ions, leading to the precipitation of iron phosphate, as shown in Equation (4). This phosphate layer provides basic corrosion resistance and enhances adhesion properties.
Though phosphating can generally be employed for corrosion resistance, surface preparation, and wear protection, specific types such as zinc phosphate, manganese phosphate, and nickel phosphate are utilized for tasks where they excel uniquely [12,13,14,15,16,17]. For instance, in studies and practical applications, zinc phosphate is best implemented for automotive parts and industrial equipment due to its high corrosion resistance and paint adhesion properties, low toxicity, and thermal stability [17,18,19,20,21]. Manganese phosphate, with its excellent wear resistance and friction reduction capabilities, is most suitable for coating engine components, firearms, gears, and heavy machinery [22,23,24,25]. Nickel phosphate, owing to its unique hardness and chemical resistance properties, is utilized in aerospace, electronics, and chemical processing equipment [26,27,28]. The general mechanism involved in these types of phosphate was summarized by Yan et al. in [29], and is presented in Equations (5)–(8):
Me stands for metal cations, Zn, Mn, and Ni.
Over time, phosphating techniques have been optimized to ensure efficiency and effectiveness in most applications. For instance, the composition of the phosphate bath has a significant impact on the properties of the resulting coatings. The authors in [30] stated that the addition of sodium molybdate to a phosphate bath positively affects the corrosion resistance of the coated layer. In their assessment, they discovered that an increase in sodium molybdate content in the bath decreases the corrosion current. In another study [31], Amadeh and Fouladi investigated the effect of temperature on the thickness and sludge weight of phosphate coatings. They utilized magnesium phosphate as the phosphate coating in their analysis. In their findings, they stated that an increased temperature improves coating thickness and bath efficiency, with an optimal temperature benchmarked at 80 C. The authors further emphasized that raising the temperature above 80 C increases the crystal size and reduces the coating density. Another key point highlighted was the influence of phosphating time on the coating thickness and sludge weight. In their analysis, nucleation first formed at around 5–10 minutes, and an optimized dense and uniform coating was achieved at 20 minutes. However, exceeding the 20-min mark resulted in a decrease in uniformity, density, and corrosion resistance during the phosphating process, highlighting the importance of both temperature and exposure time in phosphating. Similarly, Cheng et al. [32] emphasized in their study the crucial role of bath temperature and immersion time in phosphating. They reported that optimal corrosion resistance in their bath formation was achieved at 80 C with an immersion time of 10 min. Furthermore, they stressed that increasing the coating bath temperature above 80 C resulted in a decrease in immersion time, primarily because the activation energy of the phosphating process is lower at higher temperatures. In a related study [33], the importance of pH concentration was highlighted. The authors investigated the microstructure, composition, and influence of pH value on the formation of micro-cracks and the corrosion behavior of phosphate conversion coatings on AZ91D. In their findings, within the range of pH values from 2.5 to 4.0, they discovered that as the pH value of the solution increased, the thickness of the coatings also increased. However, the micro-crack width and its distribution area decreased. They concluded that at a pH value of 4.0, the obtained coating film exhibited the best quality, the highest corrosion resistance, and the smallest micro-crack width and distribution area.
In all these studies presented thus far, the importance and vital role of parameters such as temperature, pH, and immersion time in the efficiency of the phosphating process have been demonstrated. Nonetheless, it is important to note that these studies are based on empirical assessments and have not yet been anchored in any fundamental perspective, as summarized in this review study [34]. For instance, the studies presented in [31,32], both stated that the optimum bath temperature implemented in their studies was 80 C, while the study in [35] found that a coated sample at 55 C demonstrated the best corrosion resistance. This discrepancy suggests that either certain factors need to be standardized to establish a universally accepted fundamental value or that some parameters are interdependent, meaning that variations in one parameter may influence the optimal temperature required to achieve the best coating performance. Therefore, a more systematic approach, integrating both empirical observations and fundamental theoretical analysis, is necessary to fully understand and optimize the phosphating process.
On a brighter side, the key takeaway from most of these studies is that some observations appear to have been generally verified, though they might not necessarily establish a universal paradigm. For example, the studies emphasized that while high temperatures may be optimal for good corrosion resistance and uniform coating, excessively high temperatures can lead to the precipitation of phosphates in the bath and the formation of pores and cracks on the coated surfaces [34,36]. Nevertheless, further research is required to achieve a broader generalization of phosphating processes and parameter values. Among the various techniques for analyzing coating texture, uniformity, and corrosion resistance, scanning electron microscopy (SEM), X-ray diffraction (XRD), and energy-dispersive X-ray spectroscopy (EDS) are the most commonly used and have been reported in multiple studies [5,15,31].
The aim of this study is to determine the effects of flow rate on the uniformity of the phosphating process using zinc phosphates by employing different flow rates while maintaining constant concentration and temperature. A uniform phosphate coating layer provides an optimal environment for adhesion, as adhesive performance is enhanced when appropriate coating thickness and uniformity are achieved. A flow rate sensor was introduced to monitor and regulate the flow rate, enabling the determination of the pump’s flow rate at any given time during the coating of carbon-steel materials. For in-depth analysis of the content and uniformity of the phosphate layer on the carbon steel bar, SEM (Scanning Electron Microscopy) and EDS (Energy Dispersive Spectroscopy) were used to examine the morphology and geometric structure of the phosphate layer.
2. Materials and Methods
2.1. Material Description
The steel sample used in this study is SWRCH45K, a medium carbon steel with a carbon content of approximately 0.45%, specifically designed for cold heading and forging applications. The designation SWRCH45K refers to Steel Wire Rod for Cold Heading, where 45 indicates the carbon content, and K signifies that it is a killed steel. Killed steel is deoxidized during manufacturing using agents such as ferrosilicon, aluminum, or manganese, preventing gas emissions during solidification and resulting in a denser, more uniform microstructure with minimal segregation and defects. This process enhances the steel’s mechanical properties, including superior ductility, toughness, and high-temperature strength, making it ideal for demanding industrial applications. Additionally, the reduced oxygen content minimizes porosity formation during welding, improving workability and making it suitable for welding-critical components in industries such as automotive and aerospace. The chemical composition and mechanical properties of SWRCH45K is detailed in Table 1 and Table 2, respectively. This steel conforms to the JIS G 3507 standard (Japanese Industrial Standard) and is commonly produced by manufacturers such as POSCO, Nippon Steel, and JFE Steel.
The material used in this study is part of a component known as a coupler, which is used in the C-EPS (Column-type Electric Power Steering) system and manufactured by TSR (Taesung Rubber & Chemical). A diagrammatic presentation of the coupler is shown in Figure 1. The coupler, a critical component of the steering motor shaft, transmits power within the steering system while absorbing shocks generated during steering. It is composed of rubber and additional materials, produced through a vulcanization process that enhances the elasticity and durability of the rubber. The C-EPS system operates by directly rotating the steering column using a steering motor when the driver turns the wheel, thereby adjusting the vehicle’s direction.
The coupler is typically manufactured with a composite structure of steel (SWRCH45K) and rubber, requiring a phosphate coating treatment on the steel surface to ensure proper adhesion. The structural layers of the coupler generally consist of rubber, an adhesive, a primer, a phosphate coating layer, and steel (SWRCH45K). However, poor phosphate coating quality can lead to adhesion failures, as shown in Figure 2, where rubber detachment is observed. The phosphate coating forms a thin layer on the metal surface to prevent corrosion and enhance adhesive bonding. If the coating is uneven or too thin, the adhesive may not be uniformly applied, reducing adhesion strength and exposing the metal surface to corrosion.
Figure 2.
Adhesion Failure.
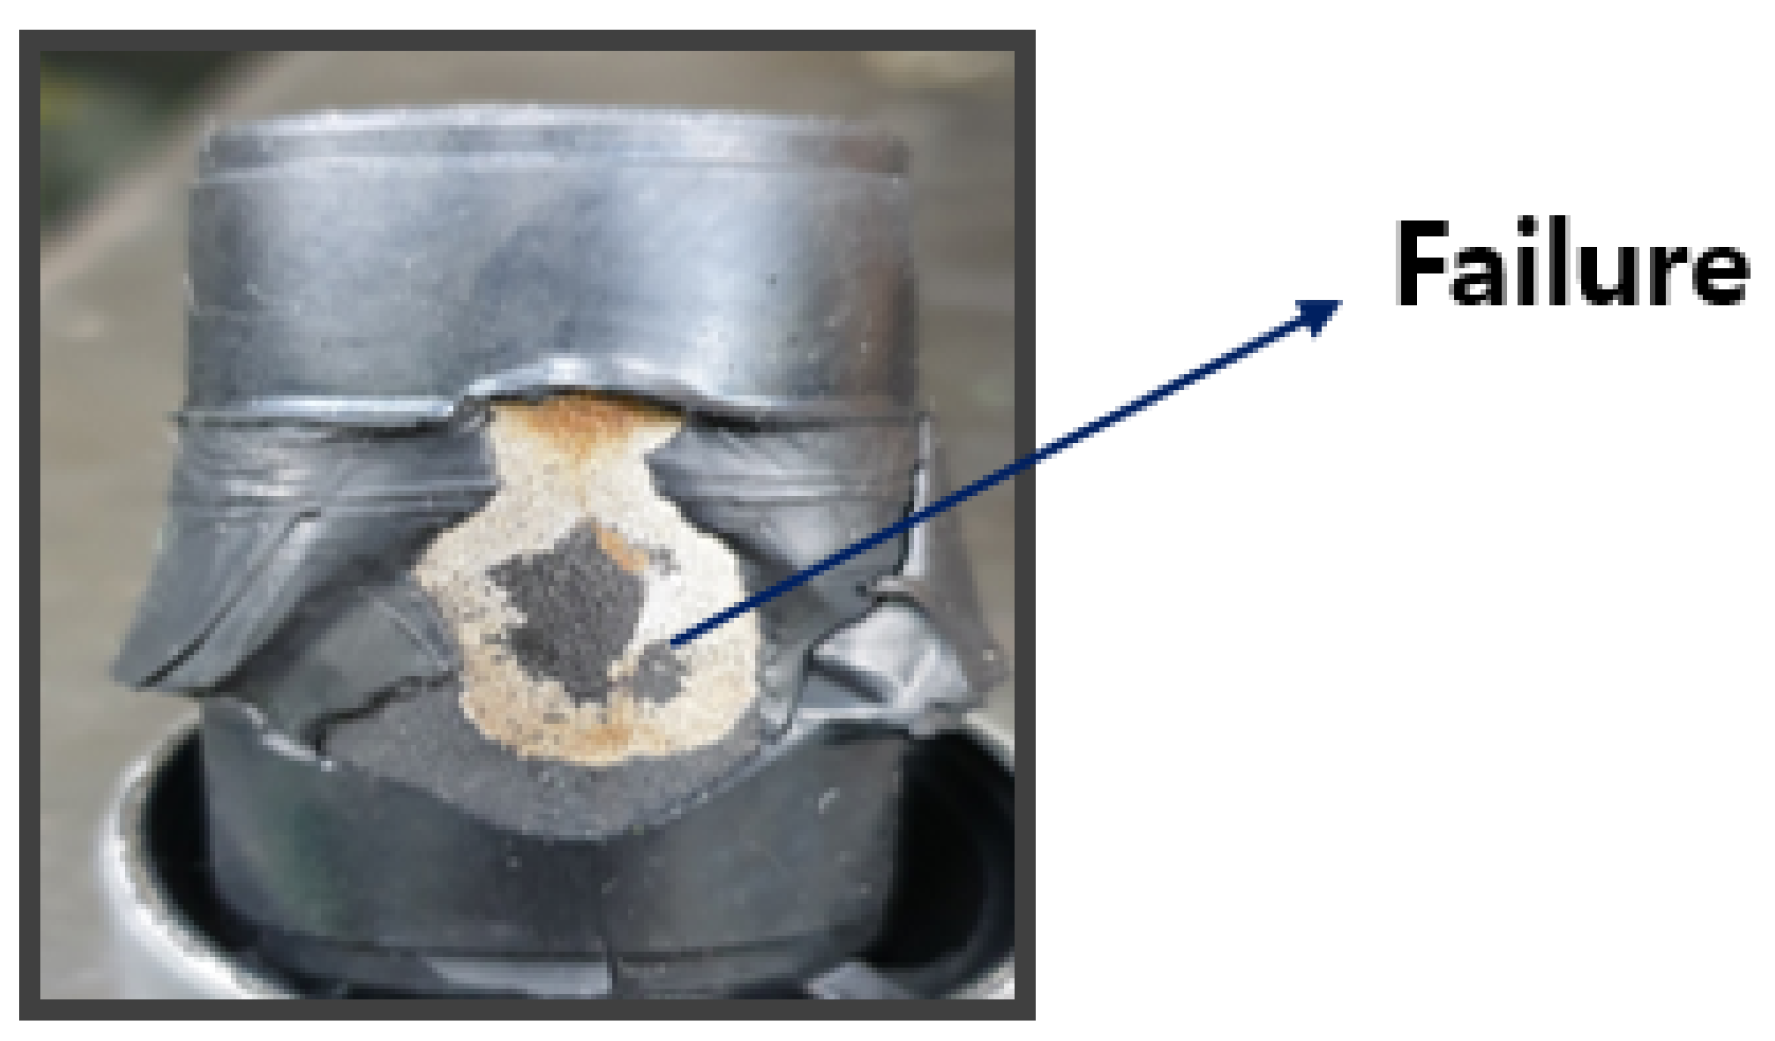
Figure 3.
Process Layout.
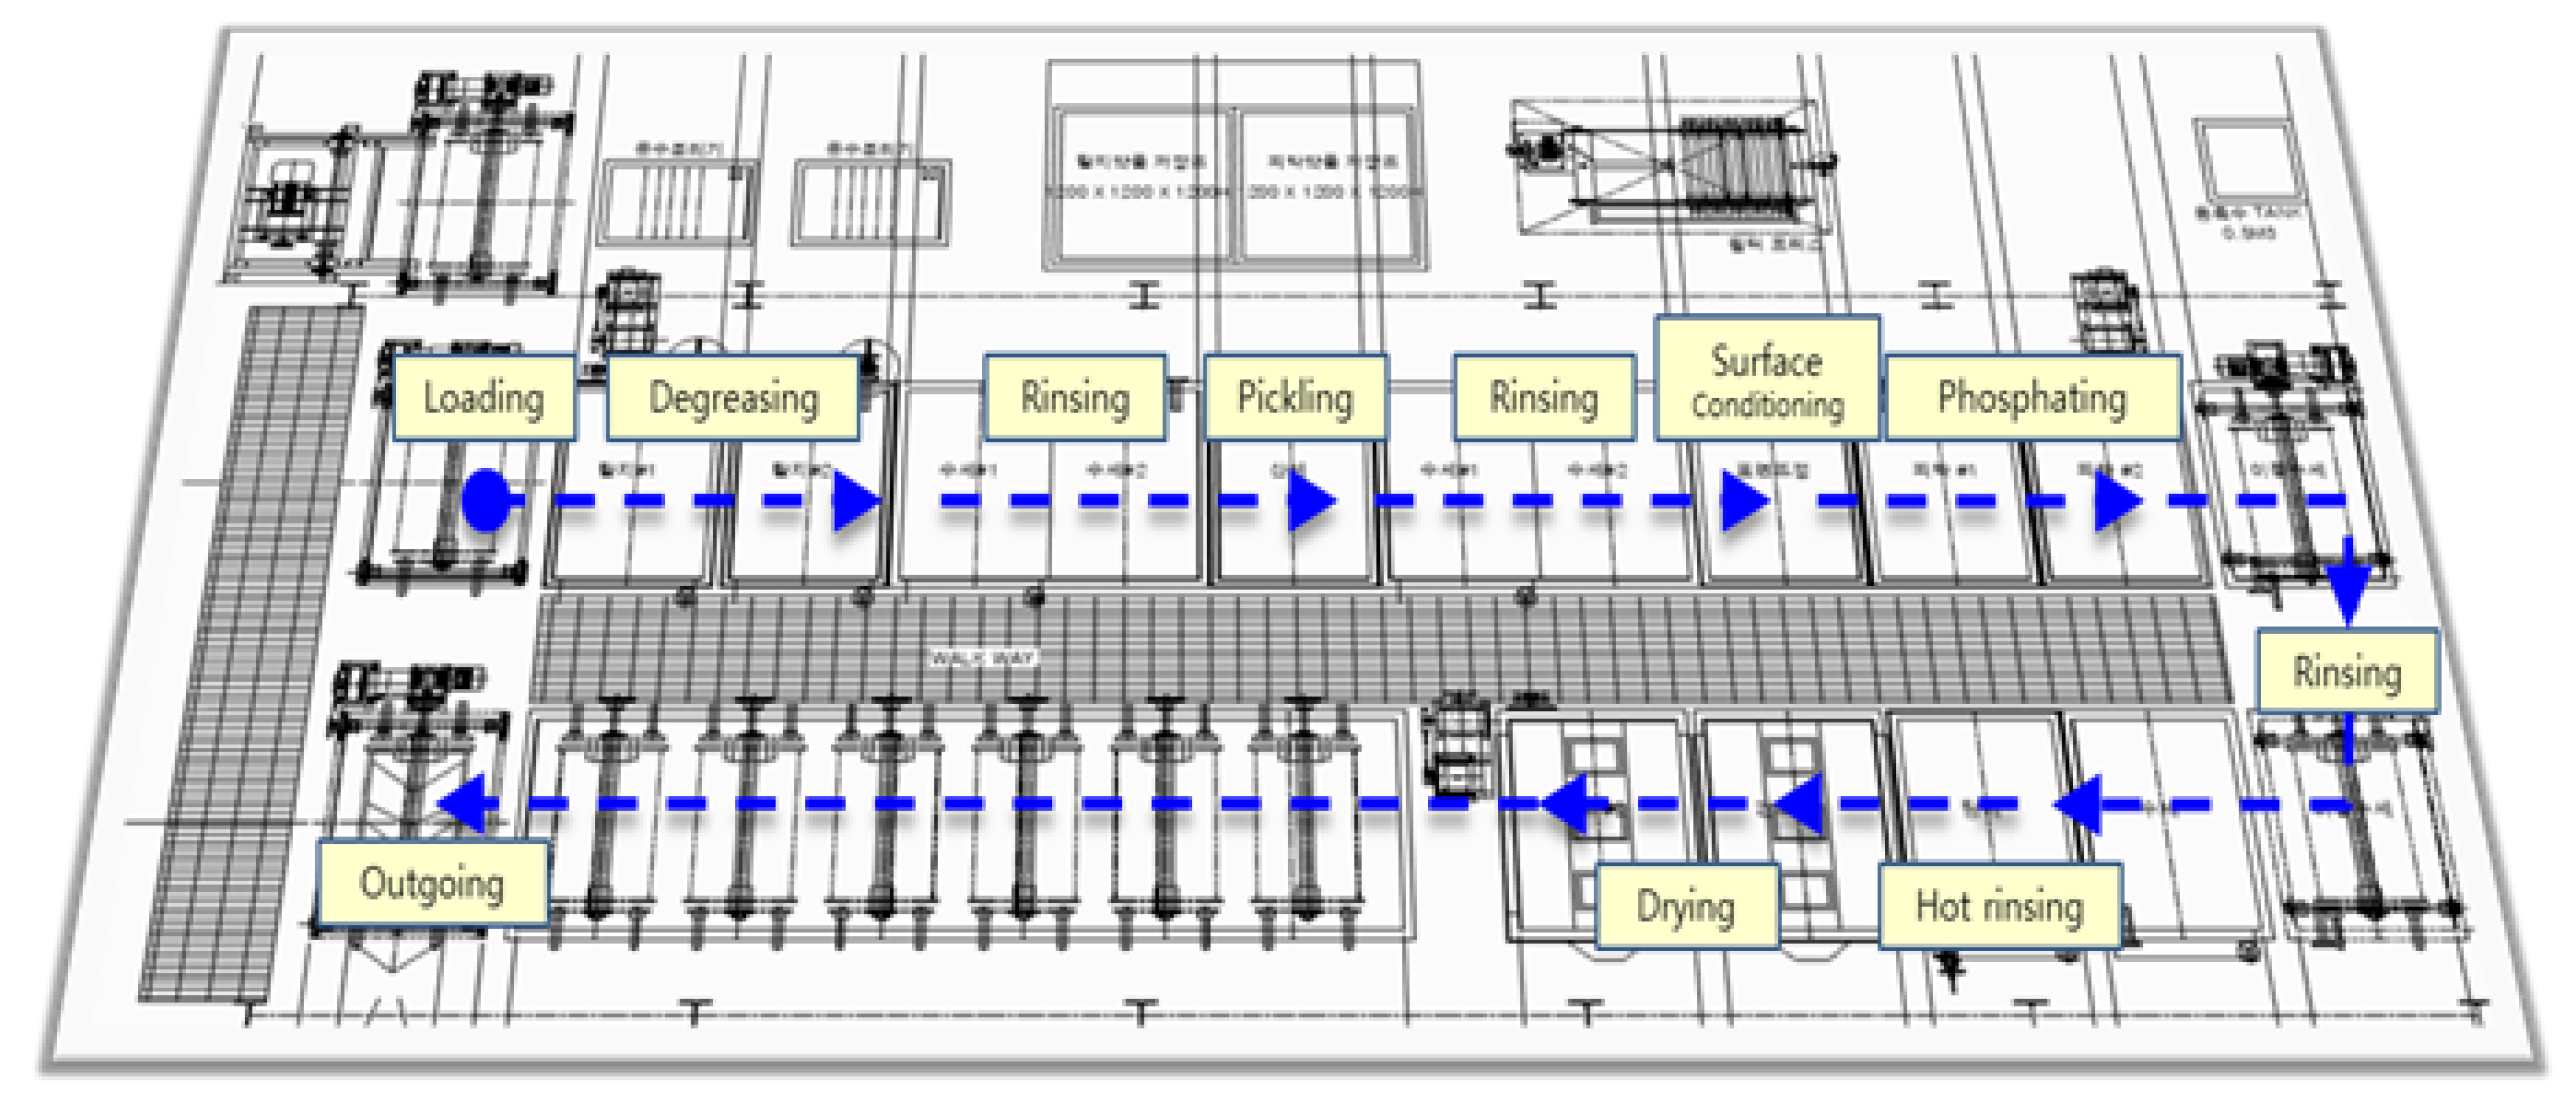
The SWCH45K steel undergoes a multi-stage pre-treatment and phosphating process to ensure optimal surface activation and coating formation. The process begins with degreasing, where two sequential steps are performed using Grapefruit Seed Extract (GSE) Ultra Cleaner, a powerful antimicrobial agent composed of grapefruit extract and glycerin. This step effectively removes oil, dust, and impurities from the steel surface, ensuring the quality of subsequent processes. The degreasing solution is maintained at an alkalinity of 45–50 mL, with a treatment temperature of 60–80 C and a total processing time of seconds. The concentration and condition of the degreasing solution are monitored using the neutralization titration method, checked three times per shift, and adjusted through chemical replenishment or dilution as needed. Temperature is monitored every four hours and regulated via a heating system to maintain the optimal range.
Following degreasing, rinsing is performed to remove residual chemicals. This step is critical to prevent coating defects, corrosion, or contamination in subsequent processes. Five rinsing steps (Rinse #1 to Rinse #5) are carried out, each lasting 30–80 seconds. The treatment time is automatically controlled by a timer to ensure consistency, and the rinse water is periodically replaced and continuously supplied to maintain quality. Filters are used to remove impurities, and the pH level of the rinse water is monitored every four hours to ensure it remains within the appropriate range.
Next, the pickling process is conducted using SK-LX#110, an acid-cleaning agent that removes rust, oxides, and impurities from the steel surface. This step activates the surface, ensuring uniform phosphate coating formation and enhancing corrosion resistance. The acid concentration is maintained at 20–25 mL, with a treatment time of seconds. The pH and acid concentration are measured periodically, and the neutralization titration method is applied three times per shift. Residual acid is thoroughly removed through Rinse #3 and Rinse #4 to prevent unwanted reactions during phosphating. The surface conditioning process is then performed using D-Z solution, which activates the surface and facilitates the formation of fine crystalline nuclei. This step ensures a uniform phosphate coating with improved adhesion and crystalline structure. The alkalinity of the solution is maintained at 1.5–3.0 mL, and the pH level is kept between 8.5–10.5. The treatment time is set to seconds, and the chemical concentration is monitored three times per shift to prevent coating defects.
The phosphating process is the core step, forming a phosphate film on the steel surface to enhance corrosion resistance and adhesion strength. The chemicals used include Phosphating Agent #153 (composed of zinc oxide, nitric acid, phosphoric acid, nickel carbonate, sodium chlorate, calcium nitrate, and citric acid monohydrate), Accelerator #138 (sodium nitrite, sodium carbonate, and purified water), and Neutralizer #405 (sodium hydroxide and sodium carbonate), thee respective concentration is summarized in Table 3. The total acidity is maintained at 34–38 mL, the free acidity at 2.5–4.5 mL, and the coating thickness at 1–5 m. The process temperature is controlled between 60–80 C, with a treatment time of seconds. XRF analysis is used to measure film thickness, and inspections are conducted three times per shift. After phosphating, hot rinsing is performed to remove residual chemicals and stabilize the surface. High-temperature water (80–100 C) is used for 120–150 seconds, and the cleanliness and temperature of the rinse water are continuously monitored to prevent impurities from remaining on the surface.
Finally, the drying process removes residual moisture, completing surface stabilization. This step is crucial for preventing corrosion and ensuring the quality of subsequent processes such as painting or assembly. The drying temperature is maintained at 155–195 C, with a treatment time of 200–230 seconds. The dryer’s temperature settings are checked every four hours to ensure optimal conditions. Through this comprehensive pre-treatment and phosphating process, surface activation is achieved, ensuring the formation of a uniform and high-quality phosphate coating that enhances adhesion, corrosion resistance, and overall performance.
2.2. Zinc Phosphate Coating Process Details
The phosphate coating process is a critical step in ensuring the formation of a uniform and high-quality coating on subcomponents. In this study, the process involves transferring subcomponents placed in a barrel system into a phosphate solution bath, where the coating is formed. To achieve consistent solution concentration and uniform coating formation, the phosphate solution is continuously circulated throughout the system. This circulation process is illustrated in Figure 4. The process begins with the phosphate solution being transferred from the bath using an air diaphragm pump, which ensures a steady flow of the solution. The solution then passes through a filter press, where any sludge or impurities are separated and removed. The filtered solution is subsequently recirculated back into the phosphate bath, maintaining the solution’s quality and consistency.
The sludge separated by the filter press is collected and discarded into a lower waste container, as depicted in Figure 5. This step is essential to prevent the accumulation of impurities in the phosphate bath, which could otherwise compromise the quality of the coating. The quality of the phosphate coating is highly dependent on the flow and circulation of the solution. If the solution flow rate is inconsistent, it can lead to variations in coating thickness and composition, resulting in uneven or defective coatings. Such inconsistencies can adversely affect the performance and durability of the coated components.
In this study, particular attention was given to analyzing flow rate variability, as it is a key factor influencing the uniformity of the phosphate coating. To address this, flow sensors were installed at the inlet and outlet of the air diaphragm pump. These sensors enable real-time monitoring and control of the flow rate, ensuring that the solution circulates at a consistent and optimal rate. By maintaining a stable flow rate, the study aims to achieve a uniform phosphate coating with consistent thickness and composition, ultimately enhancing the quality and performance of the coated components. This approach not only improves the reliability of the coating process but also contributes to the overall efficiency and effectiveness of the phosphating treatment.
The air diaphragm pump used in this process, manufactured by ARO, is illustrated in Figure 6. This pump utilizes compressed air to transport fluids and operates with two diaphragms and an air valve system. As shown in Figure 7a, the left diaphragm pushes into the fluid chamber, forcing liquid through the discharge port while the right diaphragm draws liquid into the right chamber. Upon stroke completion (Figure 7(b)), the diaphragms reverse positions, and the cycle repeats in the opposite direction. This alternating mechanism ensures a continuous and efficient flow of the phosphate solution, enhancing the stability and consistency of the coating process.
2.2.1. Flow-Rate Sensor Functionality and Setup
The air diaphragm pump plays a critical role in transporting the phosphate solution from the phosphate bath to the filter press. However, excessive sludge accumulation can reduce the pump’s suction power, leading to a decrease in flow rate, which negatively impacts the speed and uniformity of coating formation. To address this, real-time flow monitoring using flow sensors is essential to detect flow rate reductions caused by sludge accumulation in advance. By analyzing flow data from the air diaphragm pump, this study aims to optimize process conditions, ensuring consistent coating quality and process efficiency.
To measure and analyze flow rate changes in real-time, a Keyence clamp-on flow sensor (FD-H series) was installed at the inlet and outlet of the air diaphragm pump, as shown in Figure 8. This non-contact sensor measures flow within the pipe and offers advantages such as ease of installation and low maintenance costs. The flow sensor data was collected and analyzed using a Keyence KV-8000 series programmable logic controller (PLC), as shown in Fig. 20. The PLC enables real-time data logging, continuously monitoring the set flow range. Additionally, the data was displayed on a Keyence VT5 series touch panel, as seen in Figure 9, allowing operators to visually monitor flow rate variations and make timely adjustments to maintain optimal process conditions.
The flow rates used in the study (30 L/min, 20 L/min, and 10 L/min) were achieved by adjusting the float through the flow valve and monitored using a flow-rate sensor. As shown in Figure 10, the monitored flow rates during the process were maintained at 20 L/min and 30 L/min, with an additional 10 L/min condition included for experimental purposes. The 30 L/min and 20 L/min conditions were set as normal process conditions, ensuring uniform coating formation and smooth solution circulation. The 10 L/min condition was introduced as an extreme scenario, simulating significant sludge accumulation, to analyze its impact on coating thickness and uniformity. Based on these flow rate conditions, the study compared coating thickness and uniformity across the different rates to determine the optimal flow rate for improving phosphate coating quality and process efficiency.
2.3. Specimen Preparation Process
Specimen preparation began at the start of the phosphate coating process, with concentration and temperature held constant while flow rate was varied. Four specimens were prepared at 30 L/min, with each specimen processed at 15-minute intervals. The same procedure was repeated for 20 L/min and 10 L/min, producing four specimens for each flow rate, resulting in a total of 12 phosphate-coated specimens. Additionally, untreated control specimens were prepared for comparison. the specimens employed in the study are shown in Figure 11.
For specimen cutting, the AMC-254 DUAL precision specimen cutter from KoreaTech Co., Ltd. was used as shown in Figure 12. This equipment features a screw-driven vise system for forward and backward movement, with a cam-type Quick Vice (left/right) to securely hold the specimen and minimize vibrations during cutting. The feeding mechanism can be operated automatically or manually, allowing flexibility based on the material. The coupler, made of SWCH45K steel with an outer diameter of 20 mm, inner diameter of 15 mm, and height of approximately 15 mm, was cut using a 254 mm × 31.75 mm × 1.2 t cutting wheel to achieve a precise cross-section and prevent deformation. To avoid excessive heat generation and surface damage, an erosion-based cooling system was employed, circulating 60 liters of cooling water and maintaining a constant temperature. The cutter, equipped with two 100W motors, enabled stable cutting within a 450 × 580 × 430 mm range, as specified by the manufacturer. The cutting process can be seen in Figure 12.
Mounting, the process of fixing the specimen to facilitate handling, was performed to stabilize the specimen and prevent deformation during grinding and analysis, particularly for small or irregularly shaped specimens. This process ensures even surface processing, maintains consistent shape, and enhances reproducibility. The hot compression mounting method was employed using a Mounting Press M/C machine, set to an initial temperature of 17 C, a target temperature of 149 C, a holding time of 10 minutes, and a cooling time of 16 minutes. The process rate was set at 74.1% to ensure uniform resin distribution. Transparent Thermoplastic Powder from Allied High Tech Products Inc. was used as the mounting resin due to its transparency, durability, and resistance to friction, making it suitable for microscale observation using SEM. Before mounting, the specimen was thoroughly cleaned to remove contaminants, placed in the mounting chamber, and encased in resin under heat and pressure. After cooling, the mounted specimen was prepared for grinding.
Grinding and polishing were conducted to flatten the specimen surface, remove irregularities, and achieve a smooth, reflective finish for SEM analysis. The Metkon DIGIPREP 251 machine as shown in Figure 13 was used for both processes. Grinding involved stepwise use of silicon carbide (SiC) abrasive paper: coarse grinding with SiC #320 → #600 to remove mounting irregularities, followed by fine grinding with SiC #800 → #1200. The rotation speed was adjusted from 110 r/min (620 seconds) to 80 r/min, with a grinding force of 35N. Polishing utilized diamond suspension (6m → 3m) on a diamond polishing pad and colloidal silica (0.05m) on a nap cloth or velvet pad to achieve a smooth surface. The platen rotation direction (CCW) and polishing speed (80 r/min) were maintained, with a pressure of 35N applied throughout.
Each donut-shaped specimen was analyzed via EDS and SEM on both left and right sides (Figure 14) to quantify coating uniformity and composition changes across flow variations. For each flow rate (10, 20, and 30 L/min), measurements were taken at four immersion intervals (0 min, 20 min, 40 min, and 60 min), yielding eight data points per flow rate (2 sides × 4 time points).
2.4. SEM and EDS Analysis Setup
Sample preparation involved addressing the poor conductivity of the specimen to prevent charging effects during electron beam exposure. The specimen was attached to a holder using conductive carbon tape, which provided a conductive path along the surface, minimizing charging artifacts. The surface charge density () can be described as:
where Q is the total charge and A is the surface area. The use of conductive materials helps dissipate charge, which can be further explained using Ohm’s Law:
where J is the current density, is the electrical conductivity, and E is the electric field.
To further enhance conductivity, platinum coating was performed using the MC1000 Ion Sputter Coater (Hitachi, Japan). The coating process involved creating a vacuum environment, placing the specimen 33 mm above the platinum target, setting the sputtering current to 15 mA, and coating for 60 seconds. After coating, the specimen was mounted onto the SEM holder for analysis.
SEM analysis was conducted using the FE-SEM 700HR (Hitachi, Japan). The specimen was mounted on the SEM holder and inserted into the loading chamber. After vacuum formation, the sample was moved into the SEM chamber, and parameters such as acceleration voltage (15 kV), working distance (10 mm), and imaging mode (Secondary Electron and Backscattered Electron) were set. The interaction of the electron beam with the specimen can be described using the electron penetration depth , approximated by the Kanaya-Okayama range equation:
where A is the atomic weight of the specimen, is the atomic number. The electron beam was activated, and contrast, brightness, and focus were adjusted to optimize the image.
EDS analysis was performed using the AZtec Energy Advanced Package (Oxford Instruments, UK). The EDS detector was inserted, and line scan analysis was conducted along the coating layer to measure elemental distribution. The energy-dispersive X-ray spectroscopy (EDS) process involves the emission of characteristic X-rays, which can be described using Moseley’s Law:
where is the frequency of the emitted X-ray, K is a proportionality constant, K is the atomic number of the element, and is a shielding constant. This equation forms the basis for elemental identification in EDS. The electron beam voltage was set to 15 kV for optimal signal detection, and (Platinum/Zirconium) coating elements were excluded from the final dataset.
3. Results and Discussion
To address the study objectives, the samples were analyzed using scanning electron microscopy (SEM) and energy-dispersive X-ray spectroscopy (EDS) to characterize their microstructure and chemical composition. Figure 15 presents SEM micrograph sample of the coated specimens, demonstrating the presence of phosphate coating layer.
To characterize the phosphate coating composition, EDS analysis was conducted. Prior to coated sample evaluation, the uncoated steel substrate was analyzed by EDS to establish a baseline reference. For each sample, five measurement points per side (Figure 16a) were assessed to account for potential surface irregularities introduced during mechanical preparation (e.g., abrasive paper polishing). The most representative spectrum, excluding regions with evident preparation artifacts, was selected for quantitative comparison.
The general EDS result of the uncoated steel for both the right and left sides of the sample is shown in Figure 16b,c. This cross-sectional analysis specifically focuses on the interface between the steel sample and the mounting platform (visible as distinct light gray and dark gray regions in Figure 16a), where the coating material is clearly observable. For a better understanding of the coating analysis, the Fe concentration drops because the steel containing iron is either suppressed by the zinc phosphate coating or because the platform on which the sample is placed has no iron content. Hence, the sharp decline in Fe concentration can be attributed to the fact that the platform has no Fe content, as the steel is yet to undergo phosphating, as shown in the EDS images in Figure 16f,i.
Since the phosphating agent was zinc phosphate, we specifically monitored the phosphorus (P) and zinc (Zn) concentrations to evaluate the coating degree. Figure 16d,e,gh demonstrate that both the left and right sides of the uncoated sample showed similar P and Zn levels, establishing a reliable baseline for subsequent coated sample analysis. Notably, the uncoated steel exhibited higher trace phosphorus content than zinc content, as seen in Figure 16d,g, which is expected since SWRCH45K typically contains minor phosphorus impurities, as specified in the JIS G3507 standards.
As highlighted in the previous section, three flow rates were analyzed: 10 L/min, 20 L/min, and 30 L/min, with the aim of determining the optimal flow rate for uniformity. These flow rates were monitored at immersion intervals of 0 minutes, 20 minutes, 40 minutes, and 60 minutes. Figure 17 presents the EDS results for 10 L/min across these four immersion time intervals. In addition to the core elements being monitored, Fe was also included in the plots to assess how effectively the coating suppressed Fe content on the surface. The plots reveal a notable difference across the immersion intervals. For instance, in Figure 17a,b, Fe content on the coating surface was efficiently suppressed compared to the other immersion time intervals. Additionally, the P and Zn coating at 0 minutes of immersion, as seen in Figure 17a,b, appears lighter than at other immersion times, indicating that immersion time has a significant effect on coating thickness at a flow rate of 10 L/min. Furthermore, Fe content on the surface increased as immersion time increased, suggesting that prolonged immersion may influence Fe deposition within the coating layer. This implies that extended immersion times could lead to Fe contamination, affecting the overall coating quality.
Figure 18 shows the EDS analysis for the 20 L/min flow rate across different immersion time intervals. Unlike the results from the 10 L/min analysis, the coating at 0 min immersion did not suppress the Fe content in the coating layer. However, the coating substrate effectively suppressed the Fe content at 40 minutes of immersion, though it increased slightly at 60 minutes.This suggests that the optimal immersion time for 20 L/min in this study is either 40 minutes or falls between 40 and 60 minutes.In addition, it can be observed that immersion time affects the coating thickness, as the coating at 0 minutes is noticeably thinner than the others, as seen in Figure 18a,b.
Figure 19 shows the EDS analysis for the 20 L/min flow rate across different immersion time intervals. Similar to the 10 L/min flow rate, the 0-minute immersion time suppressed the Fe content in the coating, as seen in Figs. Figure 19a,b. However, Fe slightly appeared on the coating at 40 minutes of immersion and became more visible at 60 minutes of immersion. Again, the coating thickness at 0 minutes of immersion was the thinnest across all immersion times.
3.1. Result Discussion
In the context of this study’s objective, which is to determine the effect of flow rate on coating uniformity, three core factors are considered in selecting the optimal flow rate for zinc phosphating with respect to our bath composition: the concentration of P and Zn, the presence of Fe in the coating, and the thickness of the coating. One common observation thus far across all monitored flow rates is the thinner coating at 0-minute immersion time, which can be observed from the m-sized spikes of P and Zn along the x-axis.
The EDS analysis indicates that immersion time and flow rate significantly affect coating thickness. To determine the optimal flow rate, we will analyze the EDS results for each flow rate and compare them to establish a benchmark. At 10 L/min, Fe was suppressed at 0-minute immersion but least suppressed at 60-minute immersion. However, only the 60-minute immersion at 10 L/min produced a uniform coating on both the left and right sides of the sample. As shown in Figure 17g,h, the P concentration reached 270 CPS and 255 CPS, with a coating thickness of approximately 6m on both sides. Similarly, the Zn concentration was 300 CPS and 290 CPS, also corresponding to a thickness of approximately 6 6m. Despite the uniformity, Fe contamination was observed in the EDS plots (Figure 17g,h), which is not ideal.
For the 20 L/min flow rate EDS analysis, unlike the 10 L/min result, Fe was present at 0-minute immersion but declined and was suppressed at 40-minute immersion. However, Fe reappeared slightly at 60-minute immersion, as seen in the Fe EDS plot in Figure 18h. Although the results for 20 L/min show some improvement, the coating uniformity is inconsistent. For instance, the phosphorus (P) concentration on the left and right sides of the sample is 215 CPS and 185 CPS, with coating thicknesses of 3 m and 1.5 m, respectively. Similarly, the zinc (Zn) concentration is 110 CPS and 160 CPS, with corresponding thicknesses of 3 m and 1.5 m, as shown in Figure 18e,f.
In the case of the 30 L/min flow rate EDS analysis, Fe was suppressed at 0-minute immersion, similar to the 10 L/min flow rate. However, Fe presence on the coating appeared at 40-minute immersion and became more evident at 60-minute immersion. Interestingly, the results indicate that at most immersion periods, a 30 L/min flow rate provided good coating quality and uniformity, except at 0-minute immersion, where the Zn CPS on the left side was lower than on the right side, as seen in Figure 19a,b.
Since Fe presence in the coating is a crucial factor in selecting an optimal flow rate, the 20-minute immersion time appears to be the most effective, as it is devoid of Fe contamination, and the P and Zn concentrations are nearly identical. The P concentration on the left and right sides of the sample was 290 and 320 CPS, respectively, with a coating thickness of 4m. Similarly, the Zn concentration was 220 and 240 CPS, with a thickness of 4m on both sides, as shown in Figure 19a,b. This makes it the most uniform coating instance, establishing the 30 L/min flow rate at 20-minute immersion as the optimal flow rate in this study.
Furthermore, our findings suggest that flow rate and immersion time are inversely related—the higher the flow rate, the lower the required immersion time. This trend was evident across all flow rates, especially with the 30 L/min flow rate, which proved to be the optimal flow rate in this study. Conversely, a lower flow rate requires a longer immersion time to achieve the desired coating quality; however, prolonged immersion increases the risk of Fe contamination, which is detrimental to the coating as it exposes the steel to rust. Therefore, the best approach is to increase the flow rate to achieve the desired coating quality within a shorter immersion time.
4. Conclusions
This study examined the effect of flow rate on the uniformity of zinc phosphate coatings on steel cylinders, utilizing a Scanning Electron Microscope (SEM) equipped with Energy Dispersive Spectroscopy (EDS) for coating thickness and elemental composition analysis. The results demonstrated that flow rate and immersion time significantly influence coating quality, with an inverse relationship observed between the two parameters. Among the tested flow rates (10 L/min, 20 L/min, and 30 L/min), the 30 L/min flow rate at a 20-minute immersion time was identified as optimal, yielding a uniform coating thickness of 4m while minimizing Fe contamination. The study highlights that while higher flow rates reduce immersion time and improve uniformity, lower flow rates require longer immersion times, increasing the risk of Fe incorporation, which can compromise corrosion resistance.
Despite these findings, some limitations exist, including surface roughness variations that were not extensively analyzed, potential microstructural defects within the coating that could affect long-term performance, and industrial scaling considerations, as laboratory conditions may not fully replicate real-world applications where factors like fluid dynamics, temperature variations, and bath composition fluctuations play a role. Future studies should focus on optimizing bath composition to enhance coating uniformity, conducting durability tests under accelerated aging conditions, and investigating the influence of surface roughness on coating adhesion and corrosion resistance to ensure practical industrial application.
Author Contributions
Conceptualization, Y.J. and C.N.O.; methodology, Y.J. and C.N.O.; software, Y.J. and C.N.O.; formal analysis, C.N.O.; investigation, Y.J., C.N.O., and J.-W.H.; resources, Y.J., C.N.O., J.-W.H., and J.-W.H.; data curation, Y.J.; writing–original draft, Y.J, and C.N.O.; writing—review and editing, C.N.O.; visualization, C.N.O., and Y.J; supervision, J.-W.H.; project administration, J.-W.H.; funding acquisition, J.-W.H. All authors have read and agreed to the published version of the manuscript.
Funding
This work was partly supported by the Institute of Information & Communications Technology Planning & Evaluation(IITP)-Innovative Human Resource Development for Local Intellectualization program grant funded by the Korea government(MSIT)(IITP-2025-RS-2020-II201612, 50%) and grant funded by the MSIT (Ministry of Science and ICT), Korea, under the ITRC(Information Technology Research Center) support program (IITP-2024-RS-2024-00438430, 50%) supervised by the IITP (Institute for Information & Communications Technology Planning & Evaluation.
Data Availability Statement
The data presented in this study are available upon request from the corresponding author. The data are not publicly available due to laboratory regulations.
Conflicts of Interest
All authors declare no conflicts of interest.
References
- Gareev, K.G. Diversity of Iron Oxides: Mechanisms of Formation, Physical Properties, and Applications. Magnetochemistry 2023, 9, 119. [Google Scholar] [CrossRef]
- Reale, R.; Andreozzi, G.B.; Sammartino, M.P.; Salvi, A.M. Analytical Investigation of Iron-Based Stains on Carbonate Stones: Rust Formation, Diffusion Mechanisms, and Speciation. Molecules 2023, 28, 1582. [Google Scholar] [CrossRef]
- Singh, R.; Venkataraman, M.B. High Temperature Corrosion and Oxidation of Metals. Metals 2019, 9, 942. [Google Scholar] [CrossRef]
- Rodriguez, L.; Paris, J.-Y.; Denape, J.; Delbé, K. Micro-Arcs Oxidation Layer Formation on Aluminium and Coatings Tribological Properties—A Review. Coatings 2023, 13, 373. [Google Scholar] [CrossRef]
- Gwoździk, M.; Bramowicz, M.; Kulesza, S. Analysis on the Morphology and Interface of the Phosphate Coating Prepared on X39Cr13 and S355J2 Steels. Materials 2024, 17, 2805. [Google Scholar] [CrossRef] [PubMed]
- Konovalova, V.S.; Rumyantseva, V.E. Obtaining Red Phosphate Coatings on Steel at Room Temperature. Eng. Proc. 2023, 56, 54. [Google Scholar] [CrossRef]
- Pastorek, F.; Borko, K.; Fintová, S.; Kajánek, D.; Hadzima, B. Effect of Surface Pretreatment on Quality and Electrochemical Corrosion Properties of Manganese Phosphate on S355J2 HSLA Steel. Coatings 2016, 6, 46. [Google Scholar] [CrossRef]
- Liu, D.; Huang, J.; Zhou, Y.; Ding, Y. Enhanced Corrosion Resistance and Photocatalytic Properties of Bi2O3/Phosphate Composite Film Prepared on AZ91D Magnesium Alloy by Phosphating. Int. J. Electrochem. Sci. 2019, 14, 1434–1450. [Google Scholar] [CrossRef]
- Zaludin, M.A.F.; Jamal, Z.A.Z.; Derman, M.N.; Kasmuin, M.Z. Fabrication of Calcium Phosphate Coating on Pure Magnesium Substrate via Simple Chemical Conversion Coating: Surface Properties and Corrosion Performance Evaluations. J. Mater. Res. Technol. 2019, 8, 981–987. [Google Scholar] [CrossRef]
- Zhang, W.; Zhang, T.-A.; Cai, L.; Lv, G.; Cao, X. Preparation of Doped Iron Phosphate by Selective Precipitation of Iron from Titanium Dioxide Waste Acid. Metals 2020, 10, 789. [Google Scholar] [CrossRef]
- Mandal, S.; Singh, J.K.; Lee, D.-E.; Park, T. Ammonium Phosphate as Inhibitor to Mitigate the Corrosion of Steel Rebar in Chloride Contaminated Concrete Pore Solution. Molecules 2020, 25, 3785. [Google Scholar] [CrossRef] [PubMed]
- Burduhos-Nergis, D.-P.; Vizureanu, P.; Sandu, A.V.; Bejinariu, C. Evaluation of the Corrosion Resistance of Phosphate Coatings Deposited on the Surface of the Carbon Steel Used for Carabiners Manufacturing. Appl. Sci. 2020, 10, 2753. [Google Scholar] [CrossRef]
- Nguyen, V.P.; Moon, S. Comparative Corrosion Study of Zinc Phosphate and Magnesium Phosphate Conversion Coatings on AZ31 Mg Alloy. Mater. Lett. 2014, 122, 341–344. [Google Scholar] [CrossRef]
- Pastorek, F.; Borko, K.; Fintová, S.; Kajánek, D.; Hadzima, B. Effect of Surface Pretreatment on Quality and Electrochemical Corrosion Properties of Manganese Phosphate on S355J2 HSLA Steel. Coatings 2016, 6, 46. [Google Scholar] [CrossRef]
- Duszczyk, J.; Siuzdak, K.; Klimczuk, T.; Strychalska-Nowak, J.; Zaleska-Medynska, A. Modified Manganese Phosphate Conversion Coating on Low-Carbon Steel. Materials 2020, 13, 1416. [Google Scholar] [CrossRef] [PubMed]
- Samardžija, M.; Alar, V.; Špada, V.; Kapor, F. Phosphating Modification with Metal Ions of Carbon Steel Surface to Improve the Influence of Anticorrosion Properties. Technologies 2022, 10, 3. [Google Scholar] [CrossRef]
- Herbáth, B.; Kovács, K.; Jakab, M.; Makó, É. Crystal Structure and Properties of Zinc Phosphate Layers on Aluminum and Steel Alloy Surfaces. Crystals 2023, 13, 369. [Google Scholar] [CrossRef]
- Doerre, M.; Hibbitts, L.; Patrick, G.; Akafuah, N.K. Advances in Automotive Conversion Coatings during Pretreatment of the Body Structure: A Review. Coatings 2018, 8, 405. [Google Scholar] [CrossRef]
- Wan, H.; Song, D.; Li, X.; Zhang, D.; Gao, J.; Du, C. Effect of Zinc Phosphate on the Corrosion Behavior of Waterborne Acrylic Coating/Metal Interface. Materials 2017, 10, 654. [Google Scholar] [CrossRef]
- Amini, R.; Sarabi, A.A. The Corrosion Properties of Phosphate Coating on AZ31 Magnesium Alloy: The Effect of Sodium Dodecyl Sulfate (SDS) as an Eco-Friendly Accelerating Agent. Appl. Surf. Sci. 2011, 257, 7134–7139. [Google Scholar] [CrossRef]
- Niu, L.-Y.; Lin, J.-X.; Li, Y.; Shi, Z.-M.; Xu, L.-C. Improvement of Anticorrosion and Adhesion to Magnesium Alloy by Phosphate Coating Formed at Room Temperature. Trans. Nonferrous Met. Soc. China 2010, 20, 1356–1360. [Google Scholar] [CrossRef]
- Broitman, E.; Ruellan, A.; Meeuwenoord, R.; Nijboer, D.; Brizmer, V. Comparison of Various Conversion Layers for Improved Friction Performance of Railway Wheel-End Bearings. Coatings 2023, 13, 1980. [Google Scholar] [CrossRef]
- Hao, L.; Chen, Y.; Li, G.; Zhang, M.; Wu, Y.; Liu, R.; Chen, G. Study on the Friction Characteristics and Fatigue Life of Manganese Phosphate Coating Bearings. Lubricants 2023, 11, 99. [Google Scholar] [CrossRef]
- Li, G.; Chen, Y.; Zang, L.; Liu, R.; Ju, D.; Wu, Y.; Tan, Y. Comparative Study on Transmission Performance of Manganese Phosphate Coated Gears. Coatings 2021, 11, 1026. [Google Scholar] [CrossRef]
- Duszczyk, J.; Siuzdak, K.; Klimczuk, T.; Strychalska-Nowak, J.; Zaleska-Medynska, A. Manganese Phosphatizing Coatings: The Effects of Preparation Conditions on Surface Properties. Materials 2018, 11, 2585. [Google Scholar] [CrossRef]
- Chintada, V.B.; Gurugubelli, T.R.; Tamtam, M.R.; Koutavarapu, R. Advancements in Nickel-Phosphate/Boron Based Electroless Composite Coatings: A Comprehensive Review of Mechanical Properties and Recent Developments. Materials 2023, 16, 6116. [Google Scholar] [CrossRef]
- Genova, V.; Paglia, L.; Pulci, G.; Pedrizzetti, G.; Pranzetti, A.; Romanelli, M.; Marra, F. Medium and High Phosphorous Ni-P Coatings Obtained via an Electroless Approach: Optimization of Solution Formulation and Characterization of Coatings. Coatings 2023, 13, 1490. [Google Scholar] [CrossRef]
- Rudnik, E. Black Nickel Coatings: From Plating Techniques to Applications. Coatings 2024, 14, 1588. [Google Scholar] [CrossRef]
- Yan, S.; Zhao, Y.; Dai, Y.; Li, J.; Shi, J.; Gao, X.; Xu, H.; Yu, K.; Luo, W. The Influence of Silicon on the Formation of Phosphate Coatings for Low-Carbon IF Steels. Surf. Coat. Technol. 2022, 441, 128599. [Google Scholar] [CrossRef]
- Li, G.-Y.; Lian, J.-S.; Niu, L.-Y.; Jiang, Z.-H. A Zinc and Manganese Phosphate Coating on Automobile Iron Castings. ISIJ Int. 2005, 45, 1326–1330. [Google Scholar] [CrossRef]
- Fouladi, M.; Amadeh, A. Effect of Phosphating Time and Temperature on Microstructure and Corrosion Behavior of Magnesium Phosphate Coating. Electrochim. Acta 2013, 106, 1–12. [Google Scholar] [CrossRef]
- Cheng, Y.-L.; Wu, H.-L.; Chen, Z.-H.; Wang, H.-M.; Li, L.-L. Phosphating Process of AZ31 Magnesium Alloy and Corrosion Resistance of Coatings. Trans. Nonferrous Met. Soc. China 2006, 16, 1086–1091. [Google Scholar] [CrossRef]
- Du, H.; Ren, X.; Pan, D.; et al. Effect of Phosphating Solution pH Value on the Formation of Phosphate Conversion Coatings for Corrosion Behaviors on AZ91D. Adv. Compos. Hybrid Mater. 2021, 4, 401–414. [Google Scholar] [CrossRef]
- Saran, D.; Kumar, A.; Bathula, S.; et al. Review on the Phosphate-Based Conversion Coatings of Magnesium and Its Alloys. Int. J. Miner. Metall. Mater. 2022, 29, 1435–1452. [Google Scholar] [CrossRef]
- Zeng, R.-C.; Sun, X.-X.; Song, Y.-W.; Zhang, F.; Li, S.-Q.; Cui, H.-Z.; Han, E.-H. Influence of Solution Temperature on Corrosion Resistance of Zn-Ca Phosphate Conversion Coating on Biomedical Mg-Li-Ca Alloys. Trans. Nonferrous Met. Soc. China 2013, 23, 3293–3299. [Google Scholar] [CrossRef]
- Li, T.; Wang, S.; Liu, H.; et al. Improved corrosion resistance of Mg alloy by a green phosphating: insights into pre-activation, temperature, and growth mechanism. J. Mater. Sci. 2021, 56, 828–843. [Google Scholar] [CrossRef]
Figure 1.
Coupler.
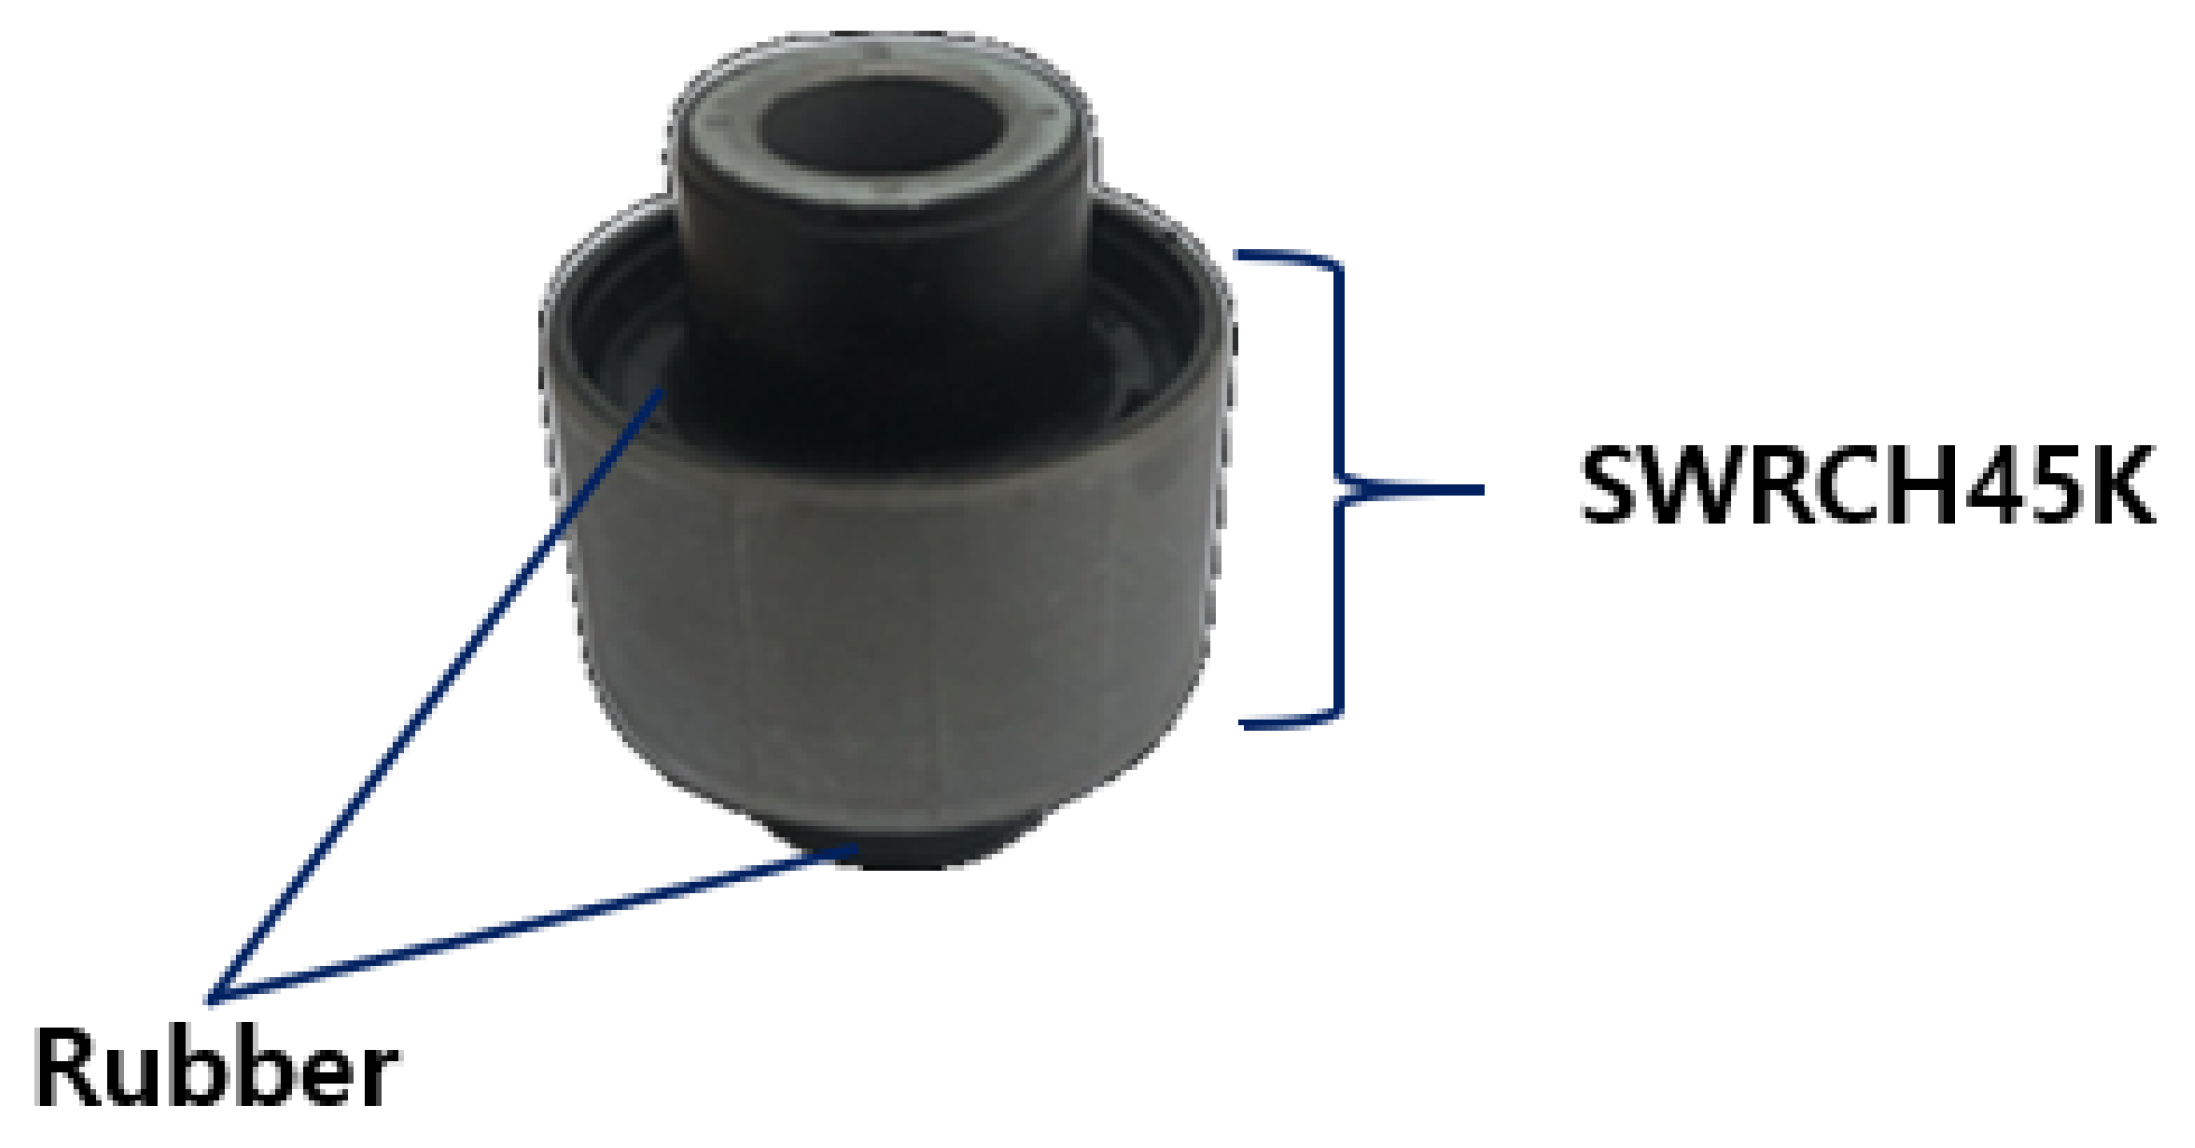
Figure 4.
Phosphate film processing.
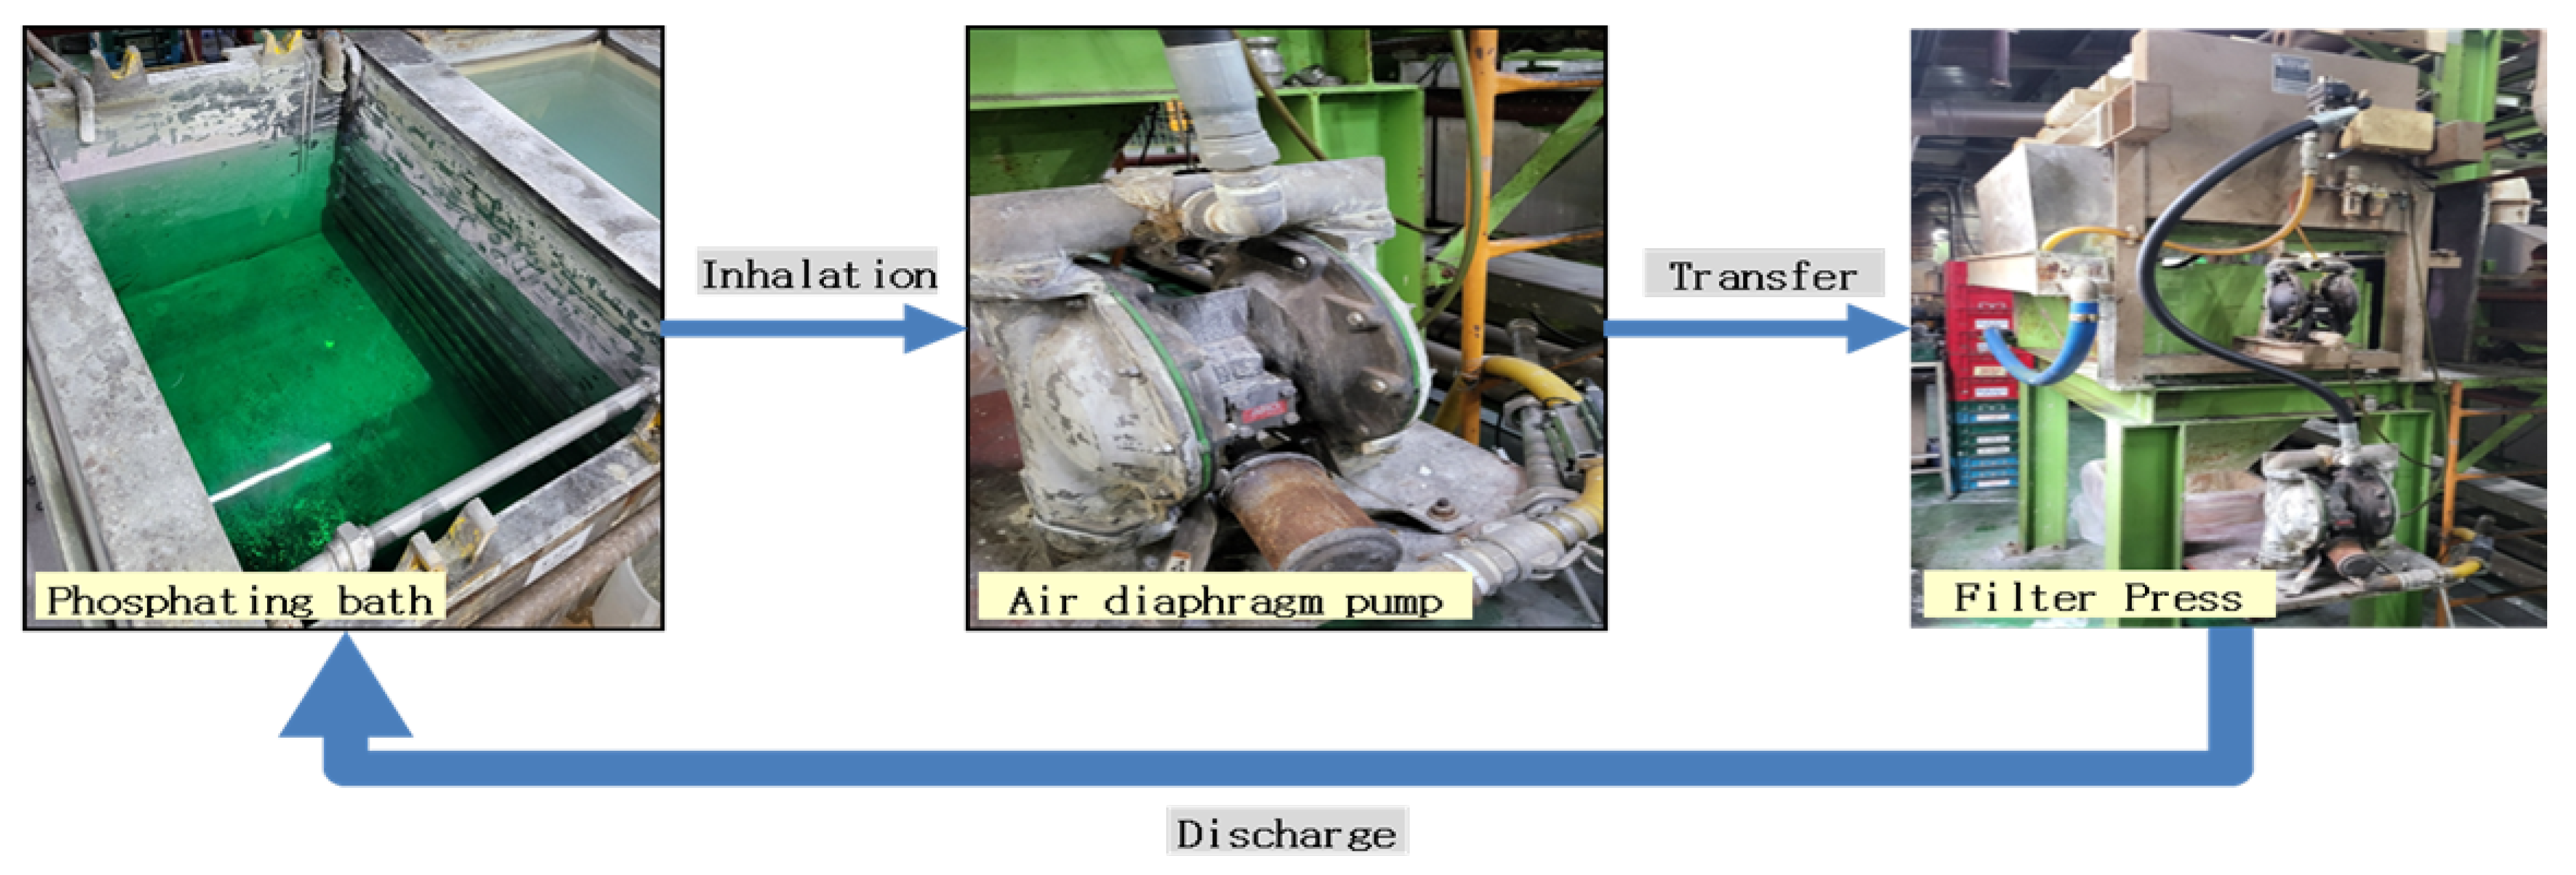
Figure 5.
Sludge Collection.
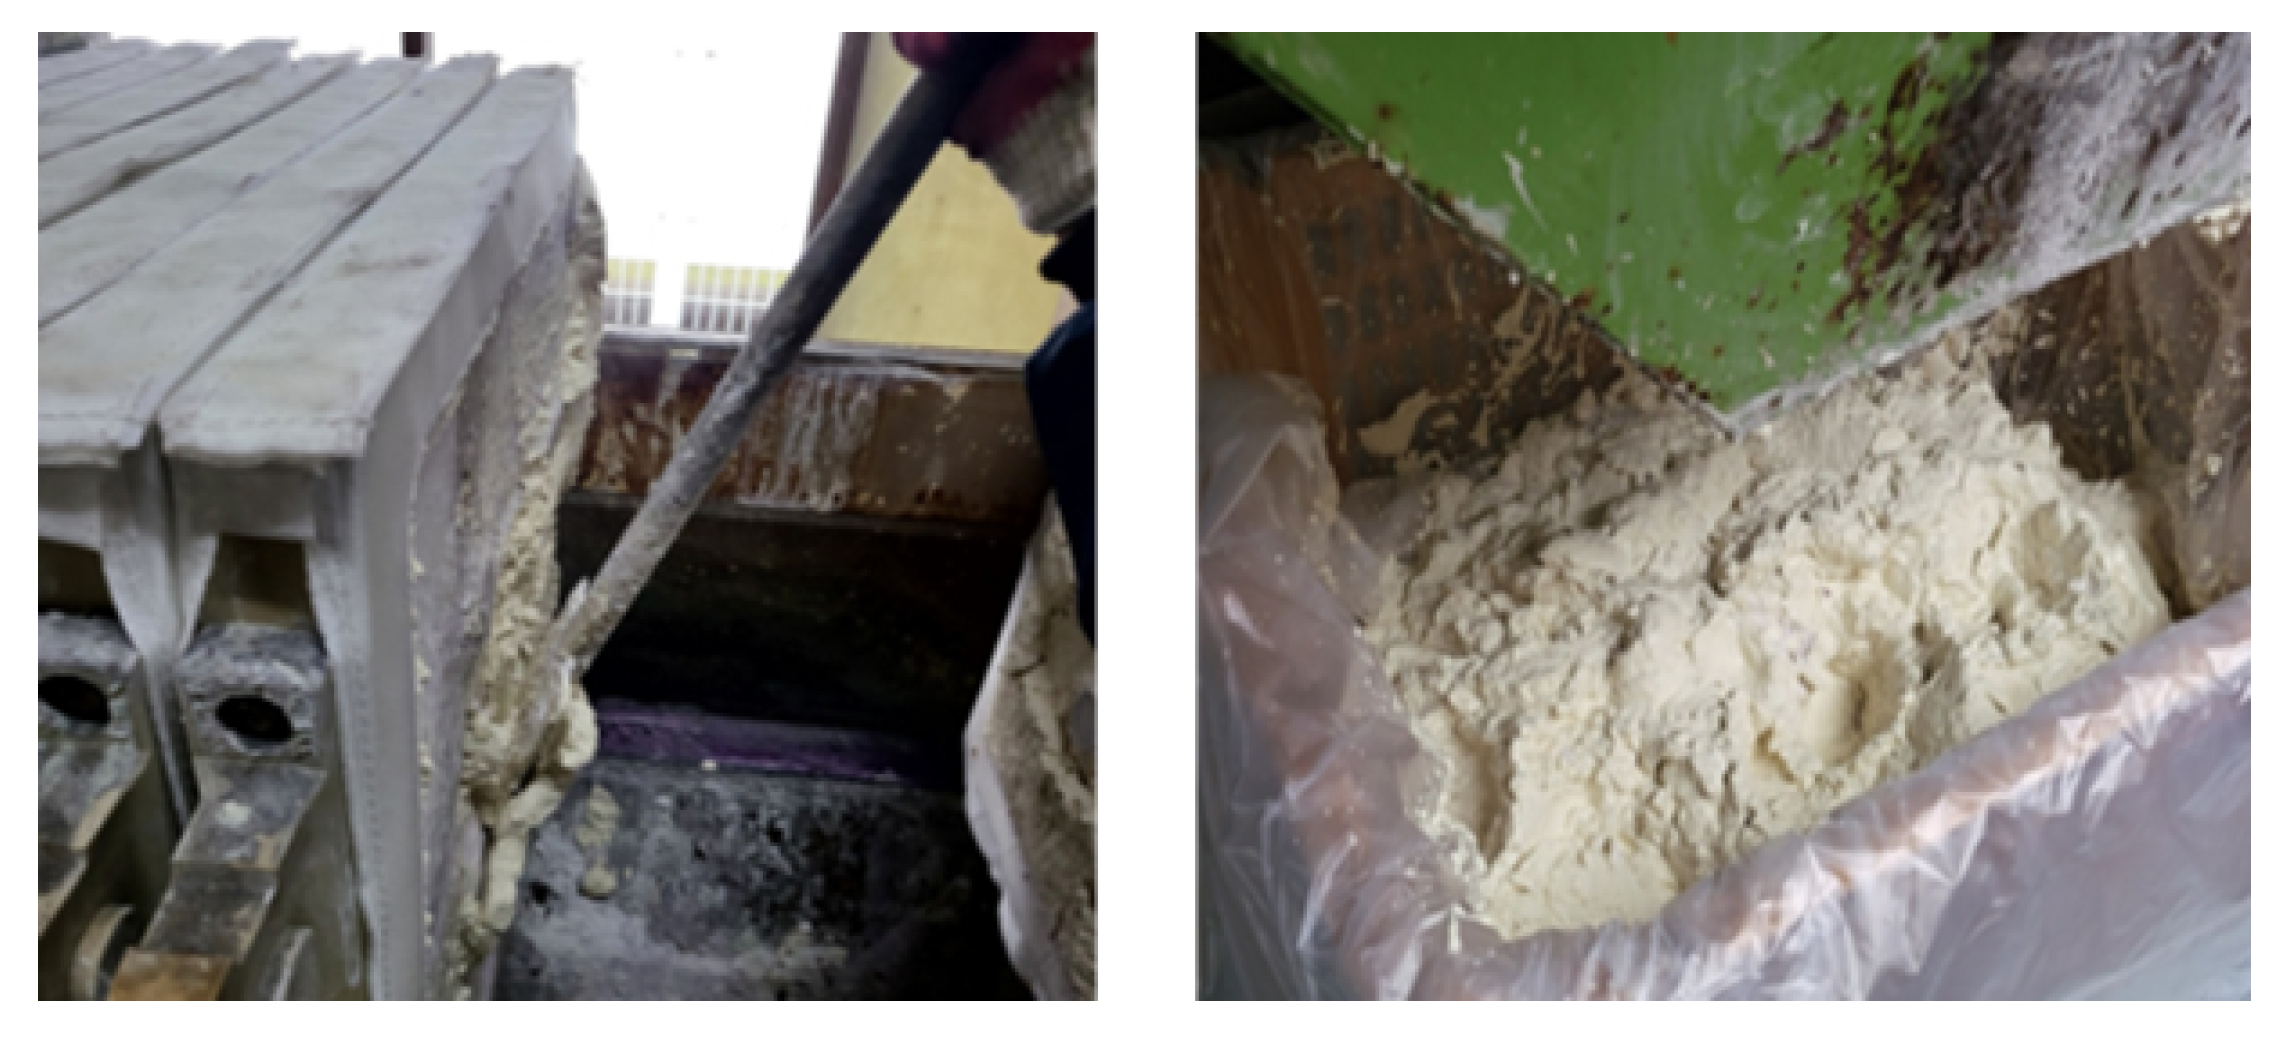
Figure 6.
Air diaphragm pump.

Figure 7.
Movement of the diaphragm: (a) To the left; (b) to the right.
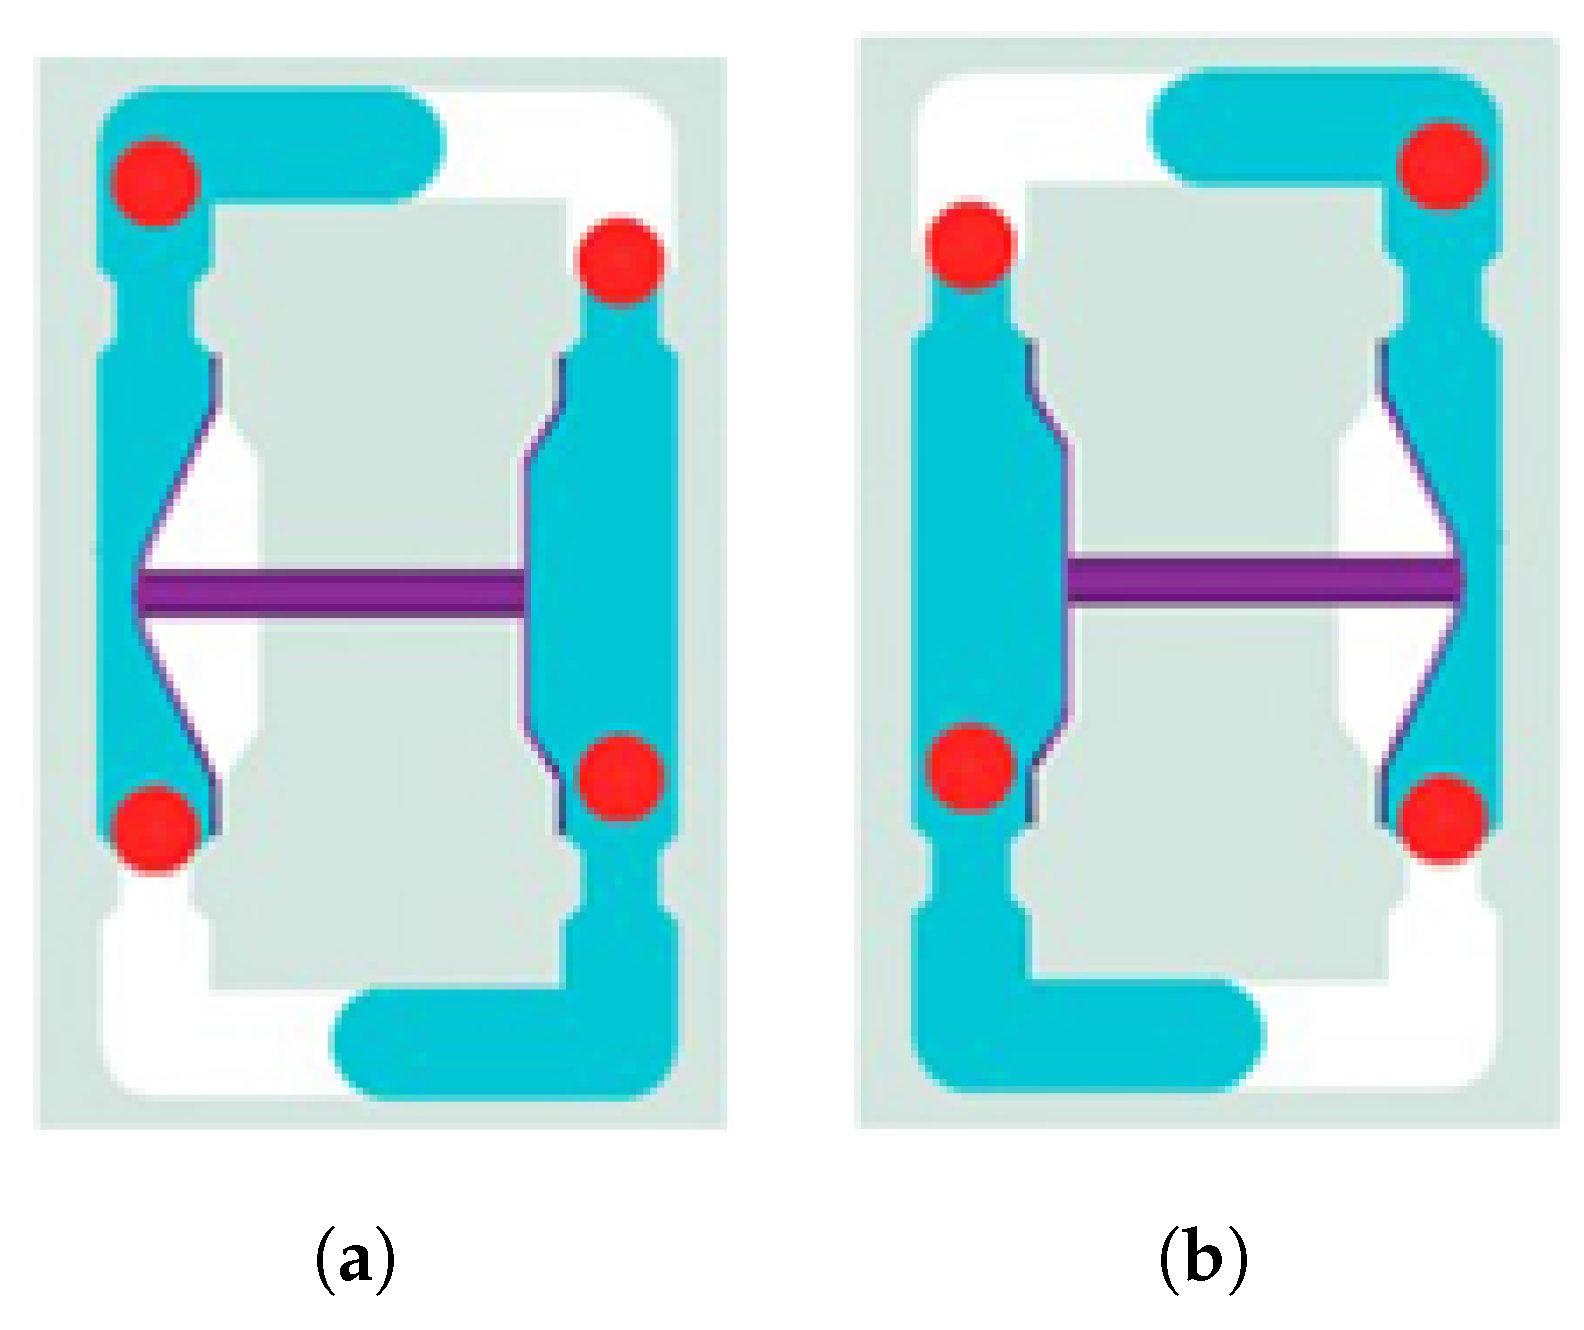
Figure 8.
Flow-rate sensor attached to a pump.
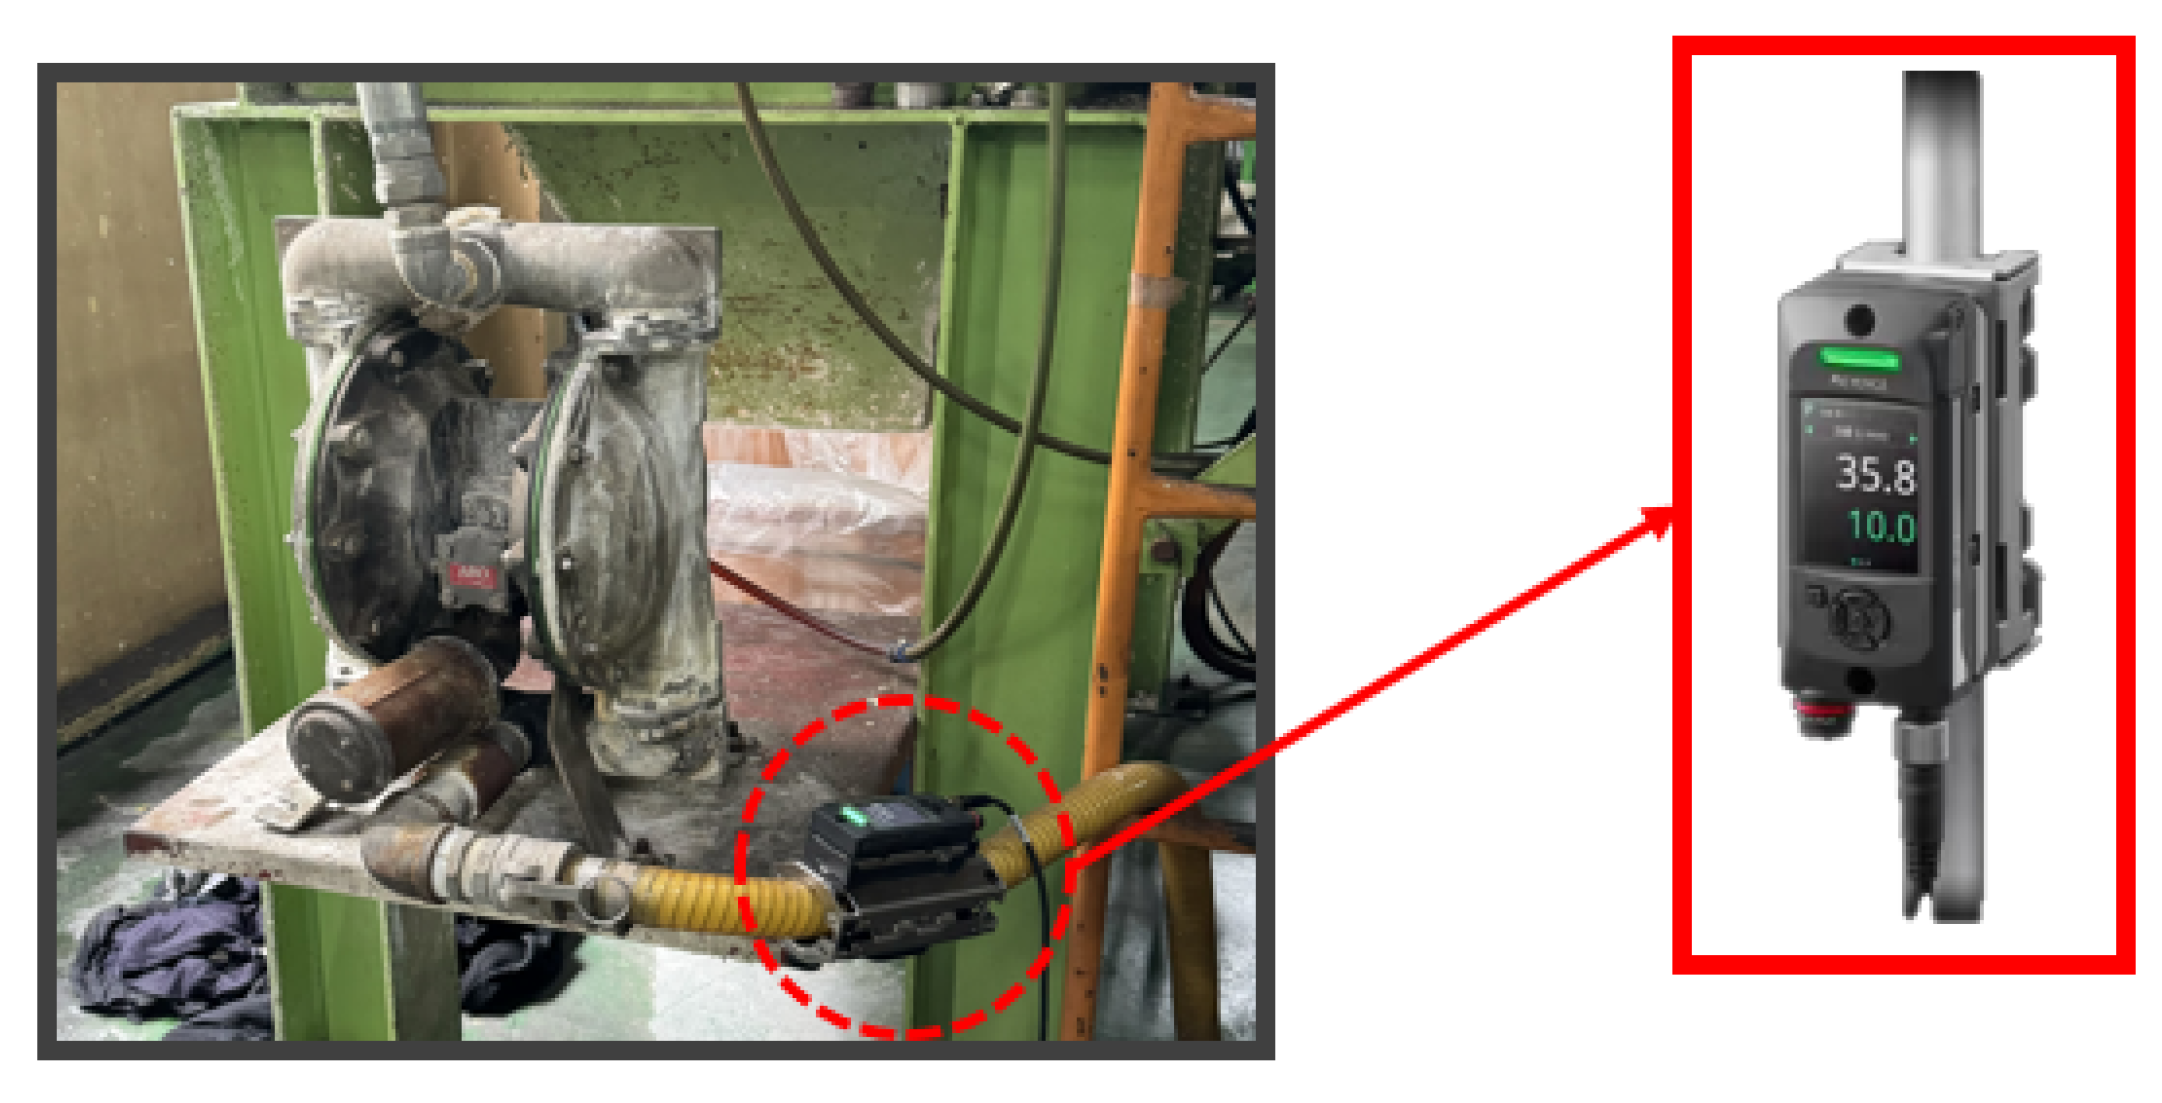
Figure 9.
Flow rate monitor and display.
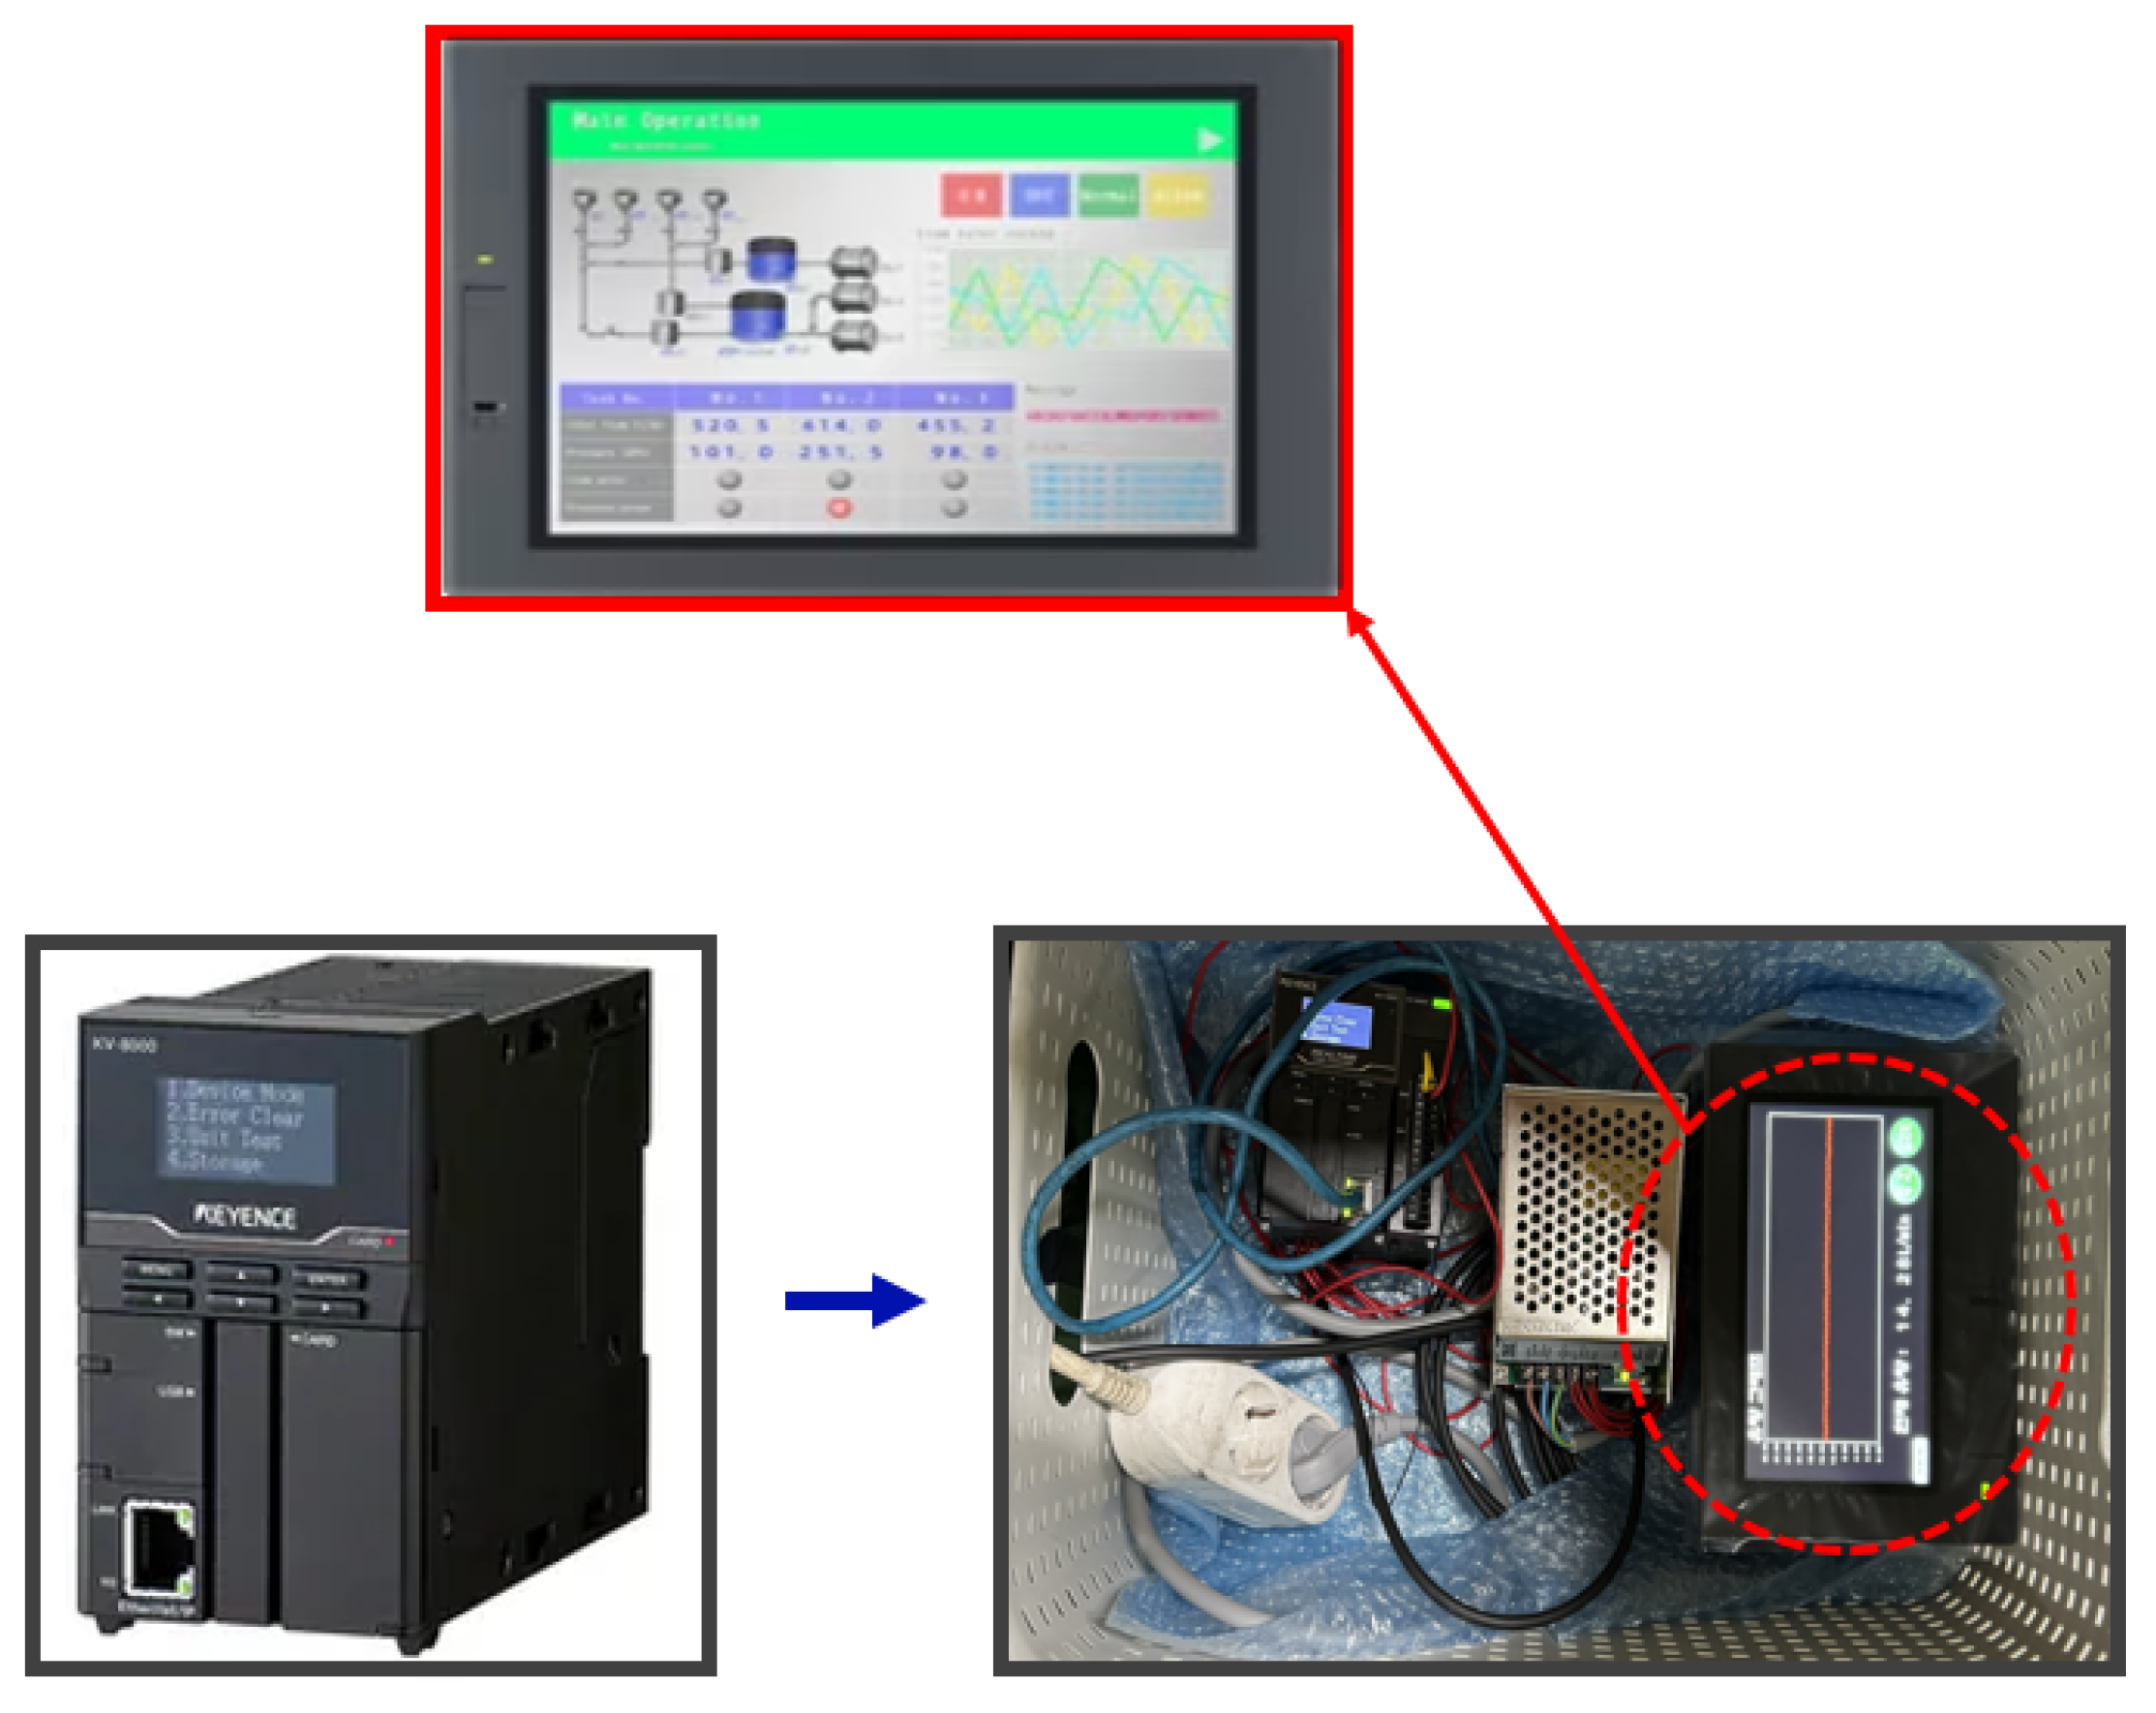
Figure 10.
Flow rate during process.
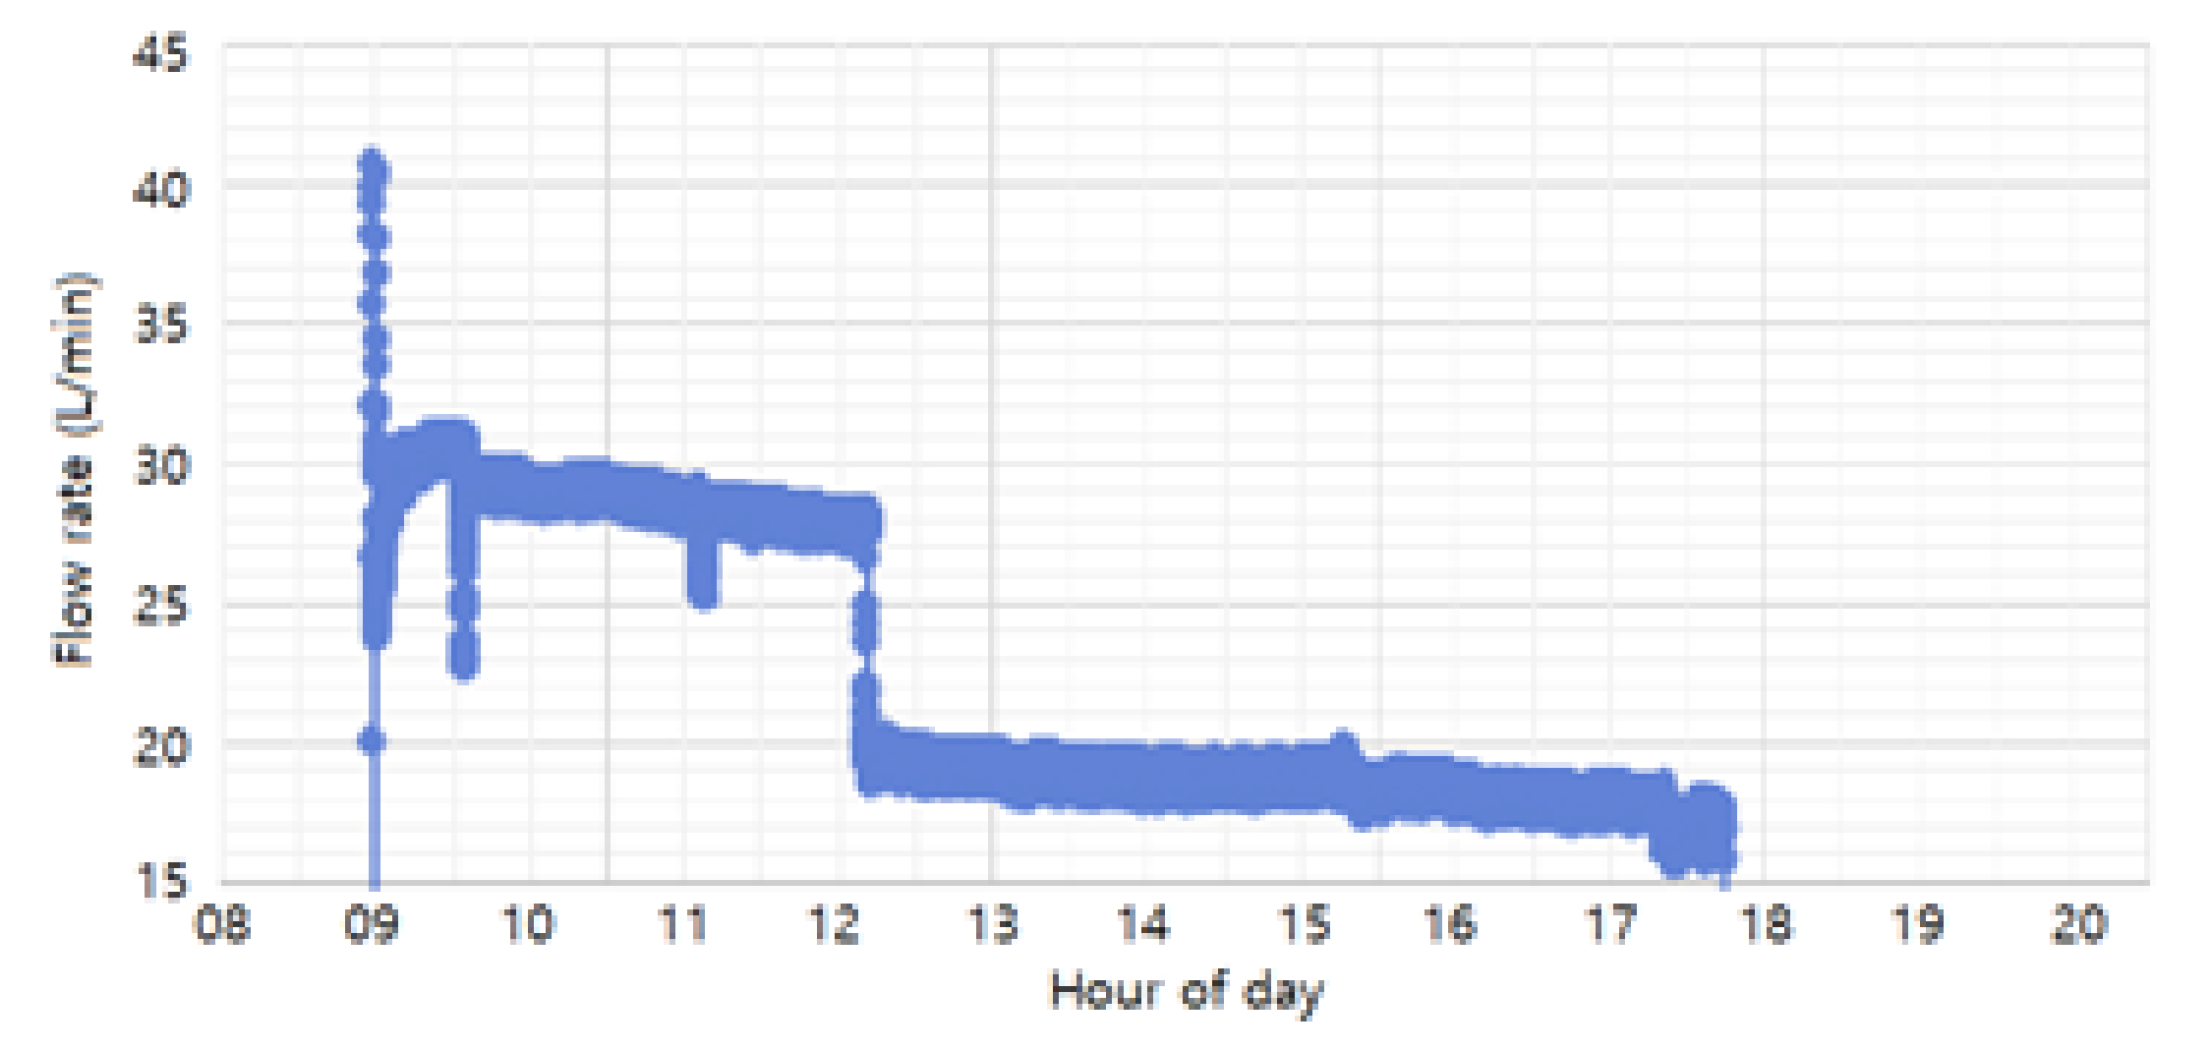
Figure 11.
Specimen: (a) At flow rate 10 L/min; (b) flow rate 20 L/min; (c) flow rate 30 L/min; (d) uncoated.
Figure 11.
Specimen: (a) At flow rate 10 L/min; (b) flow rate 20 L/min; (c) flow rate 30 L/min; (d) uncoated.
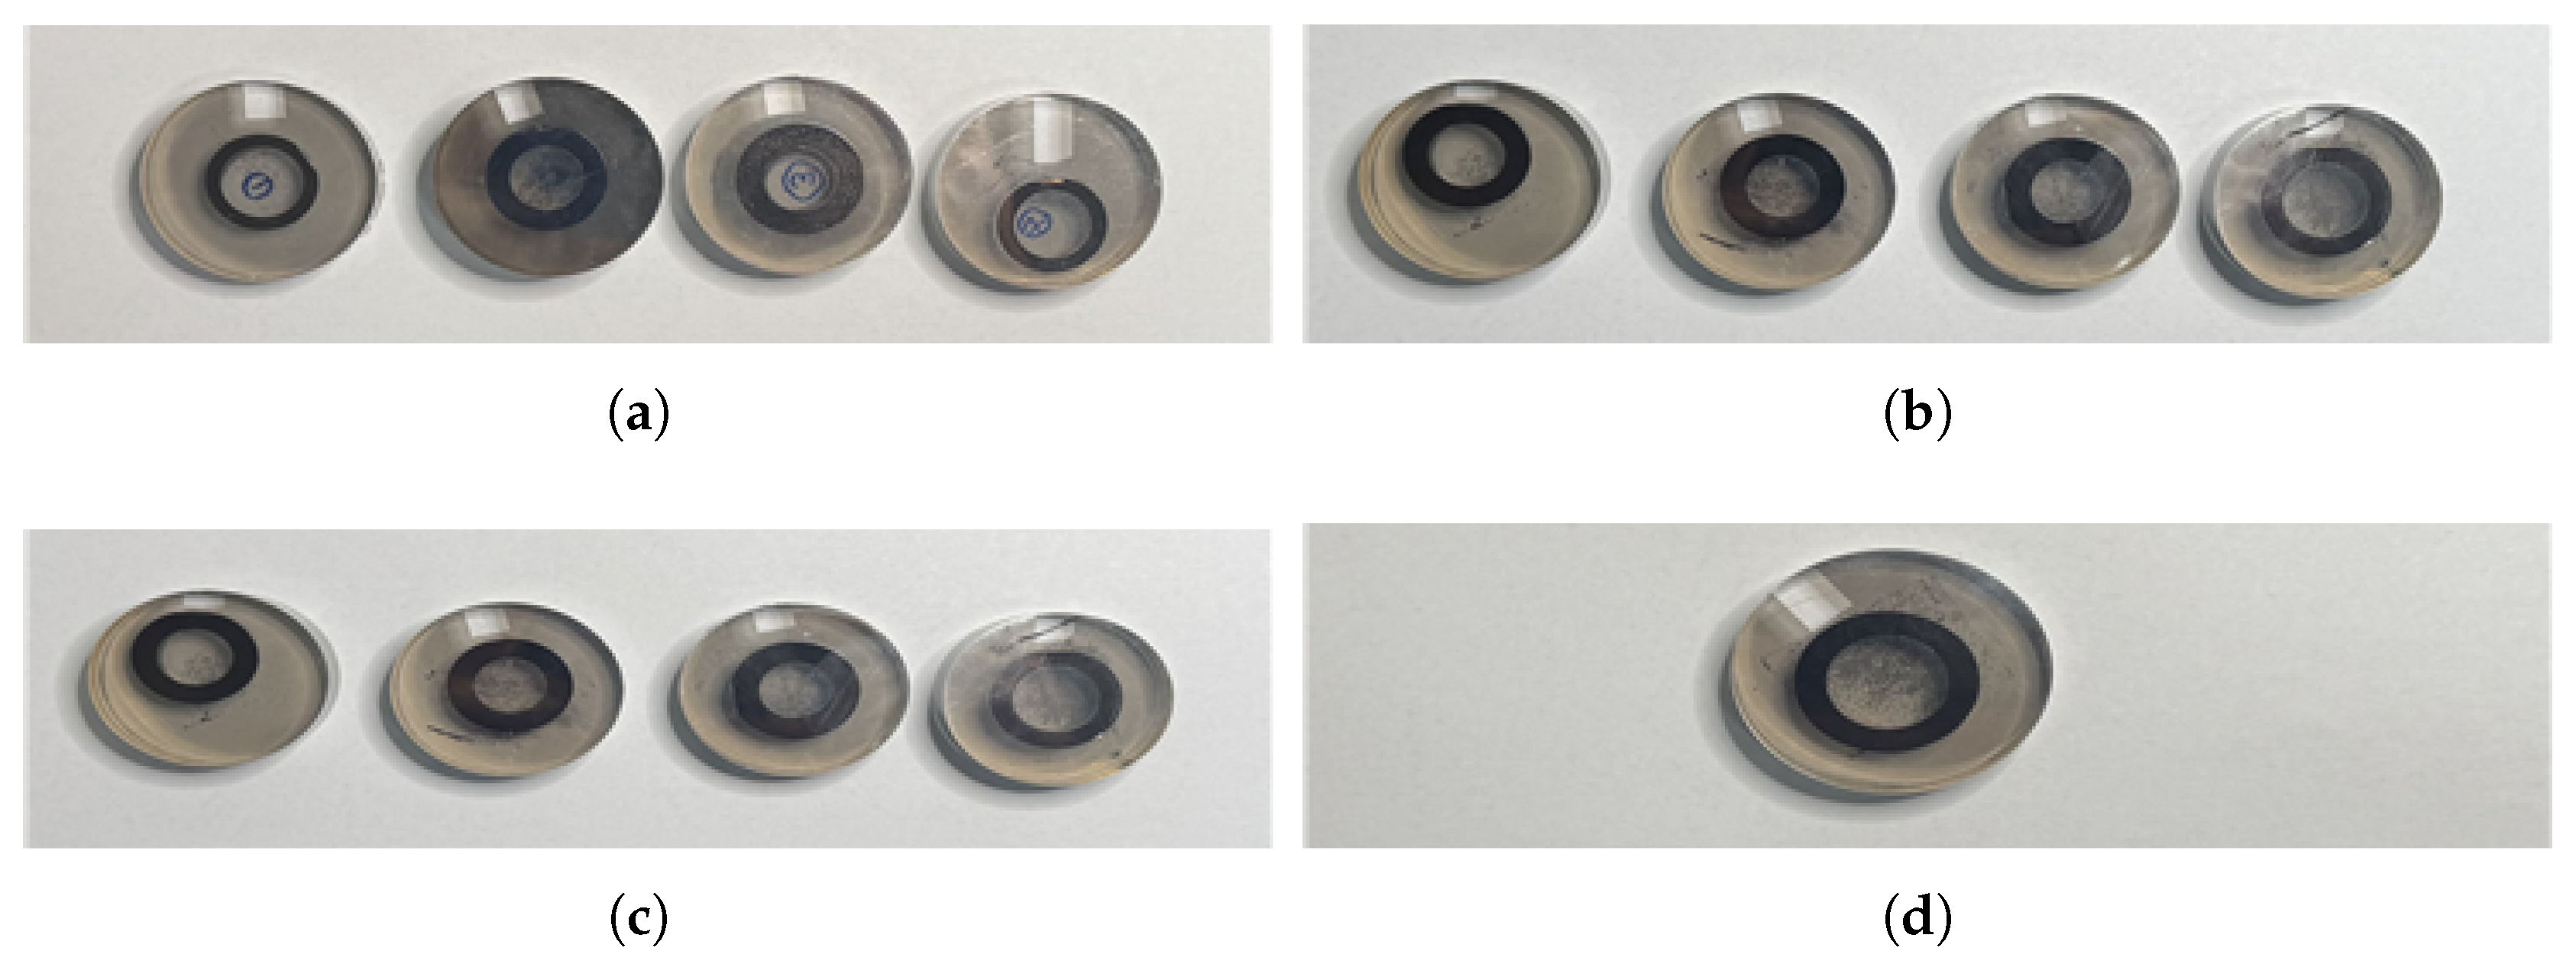
Figure 12.
AMC-254 DUAL.
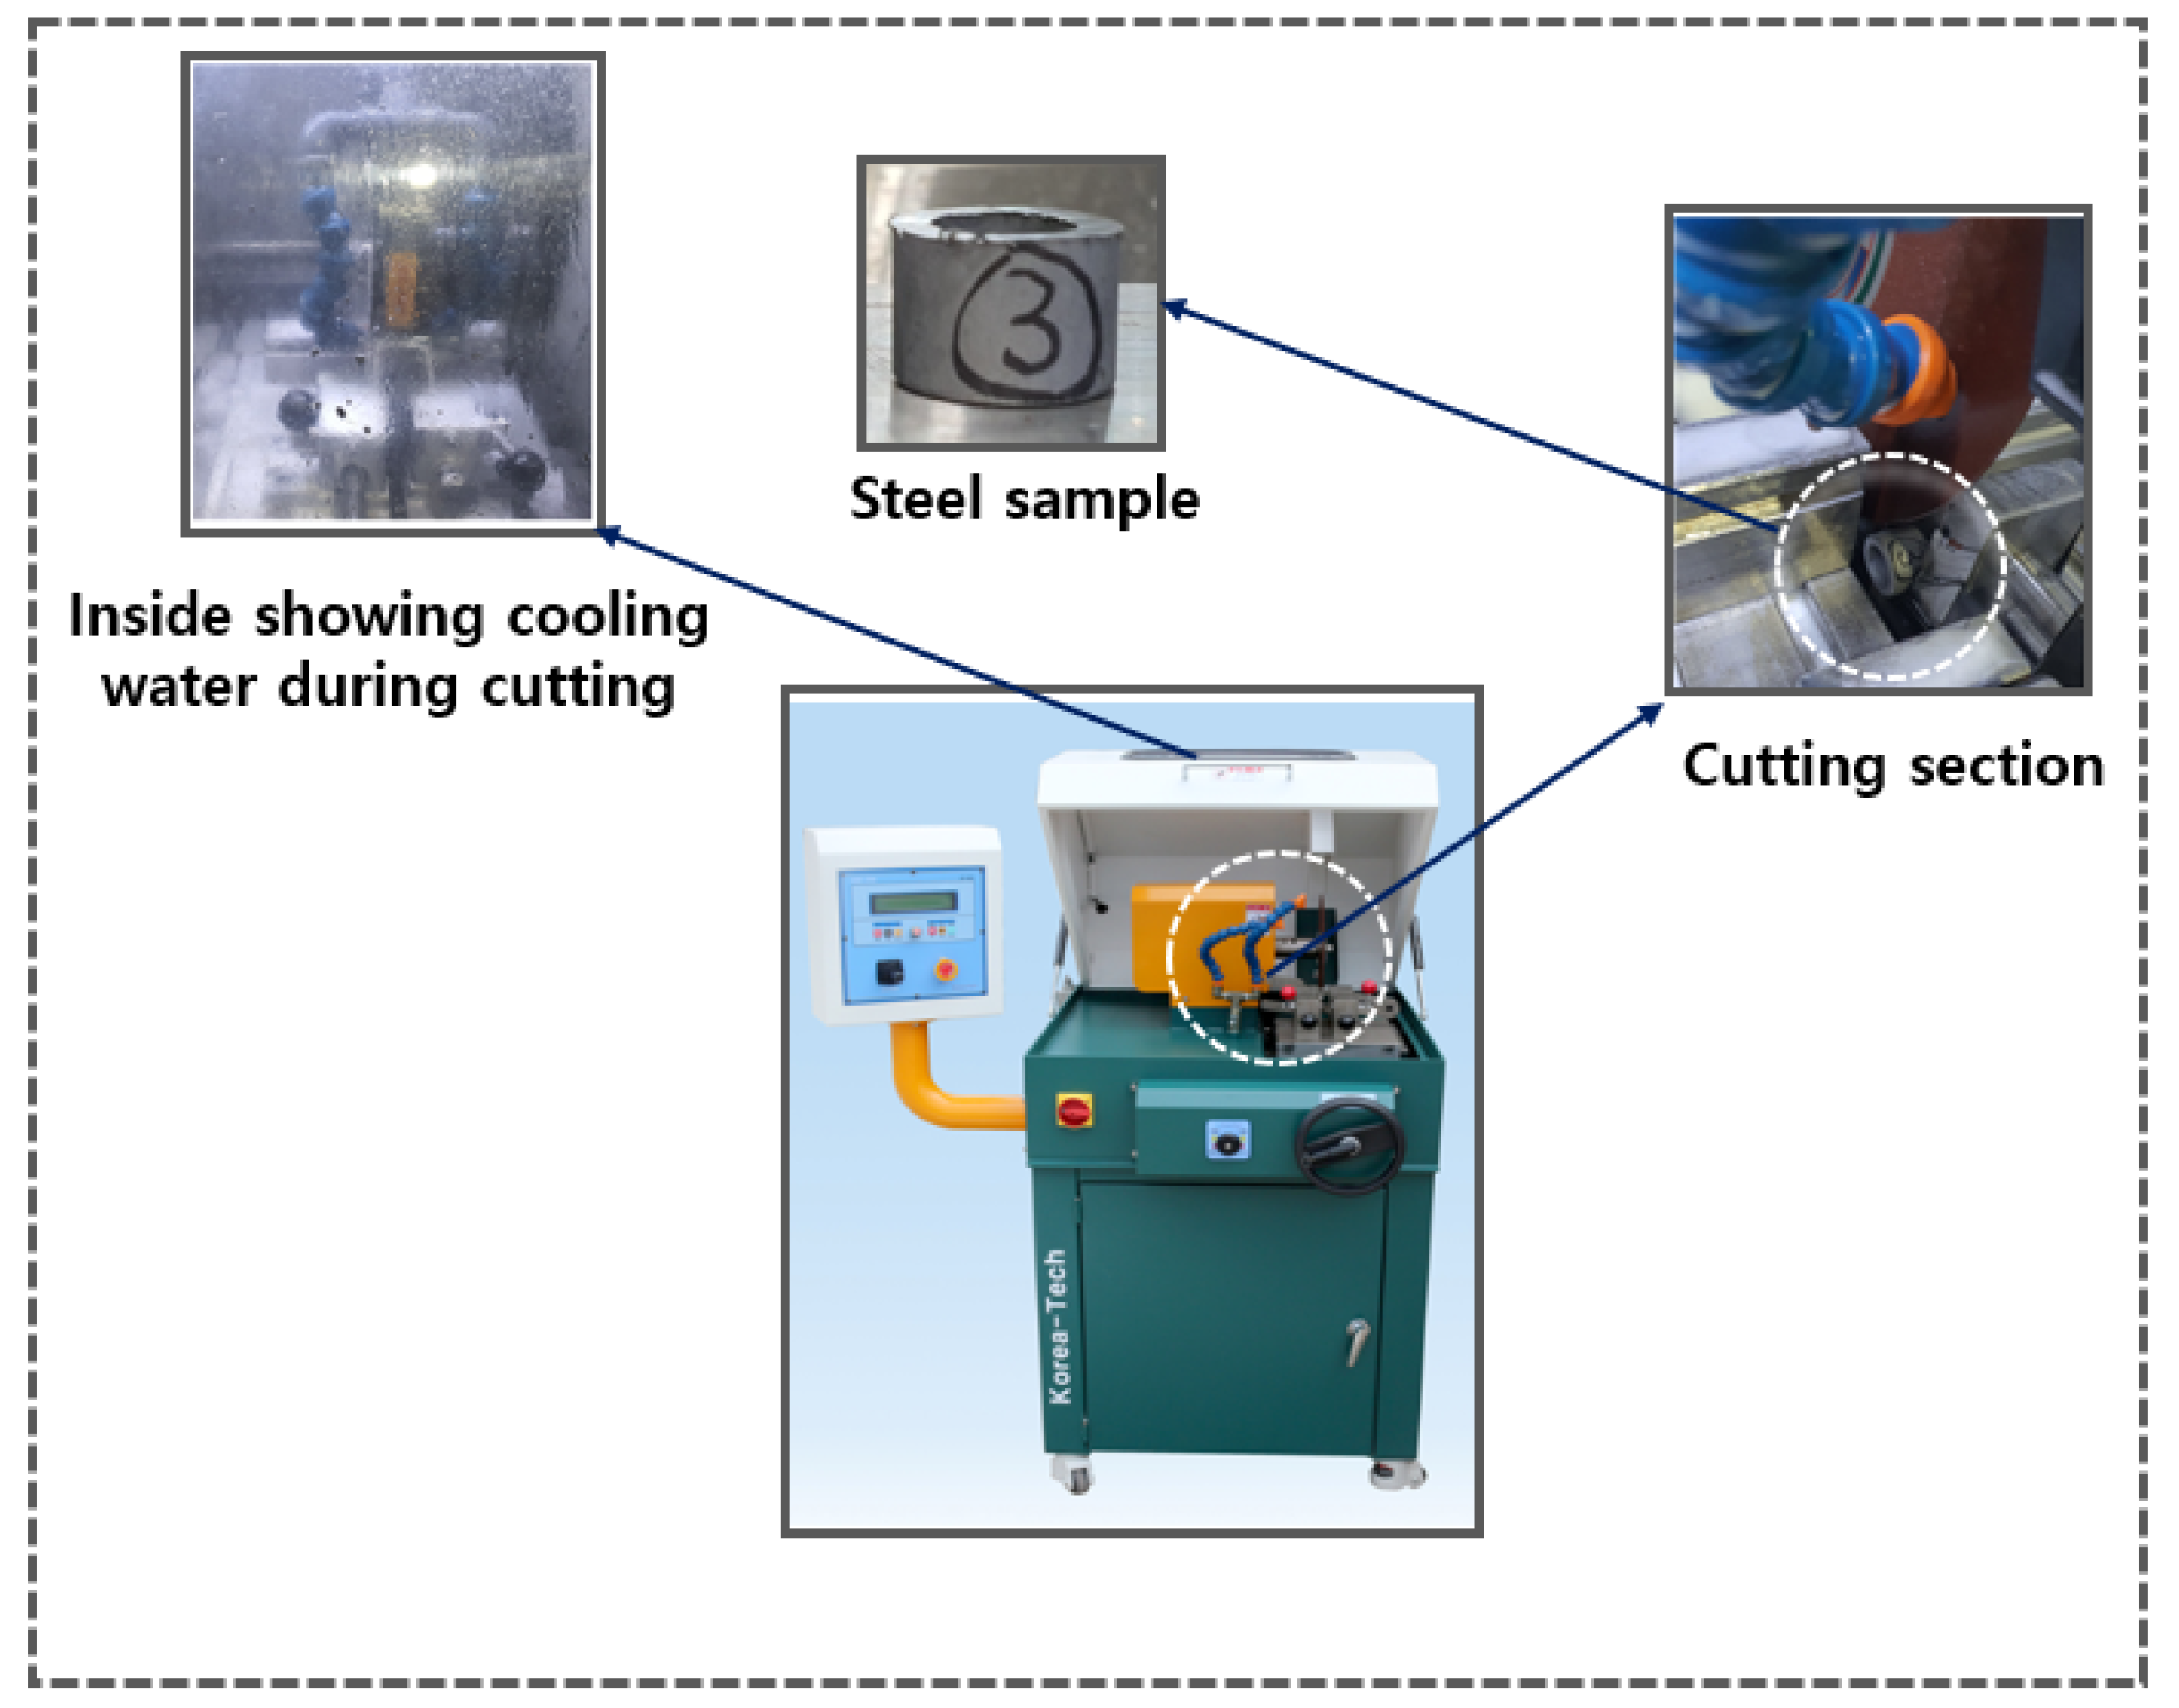
Figure 13.
Metkon Digirep 251.
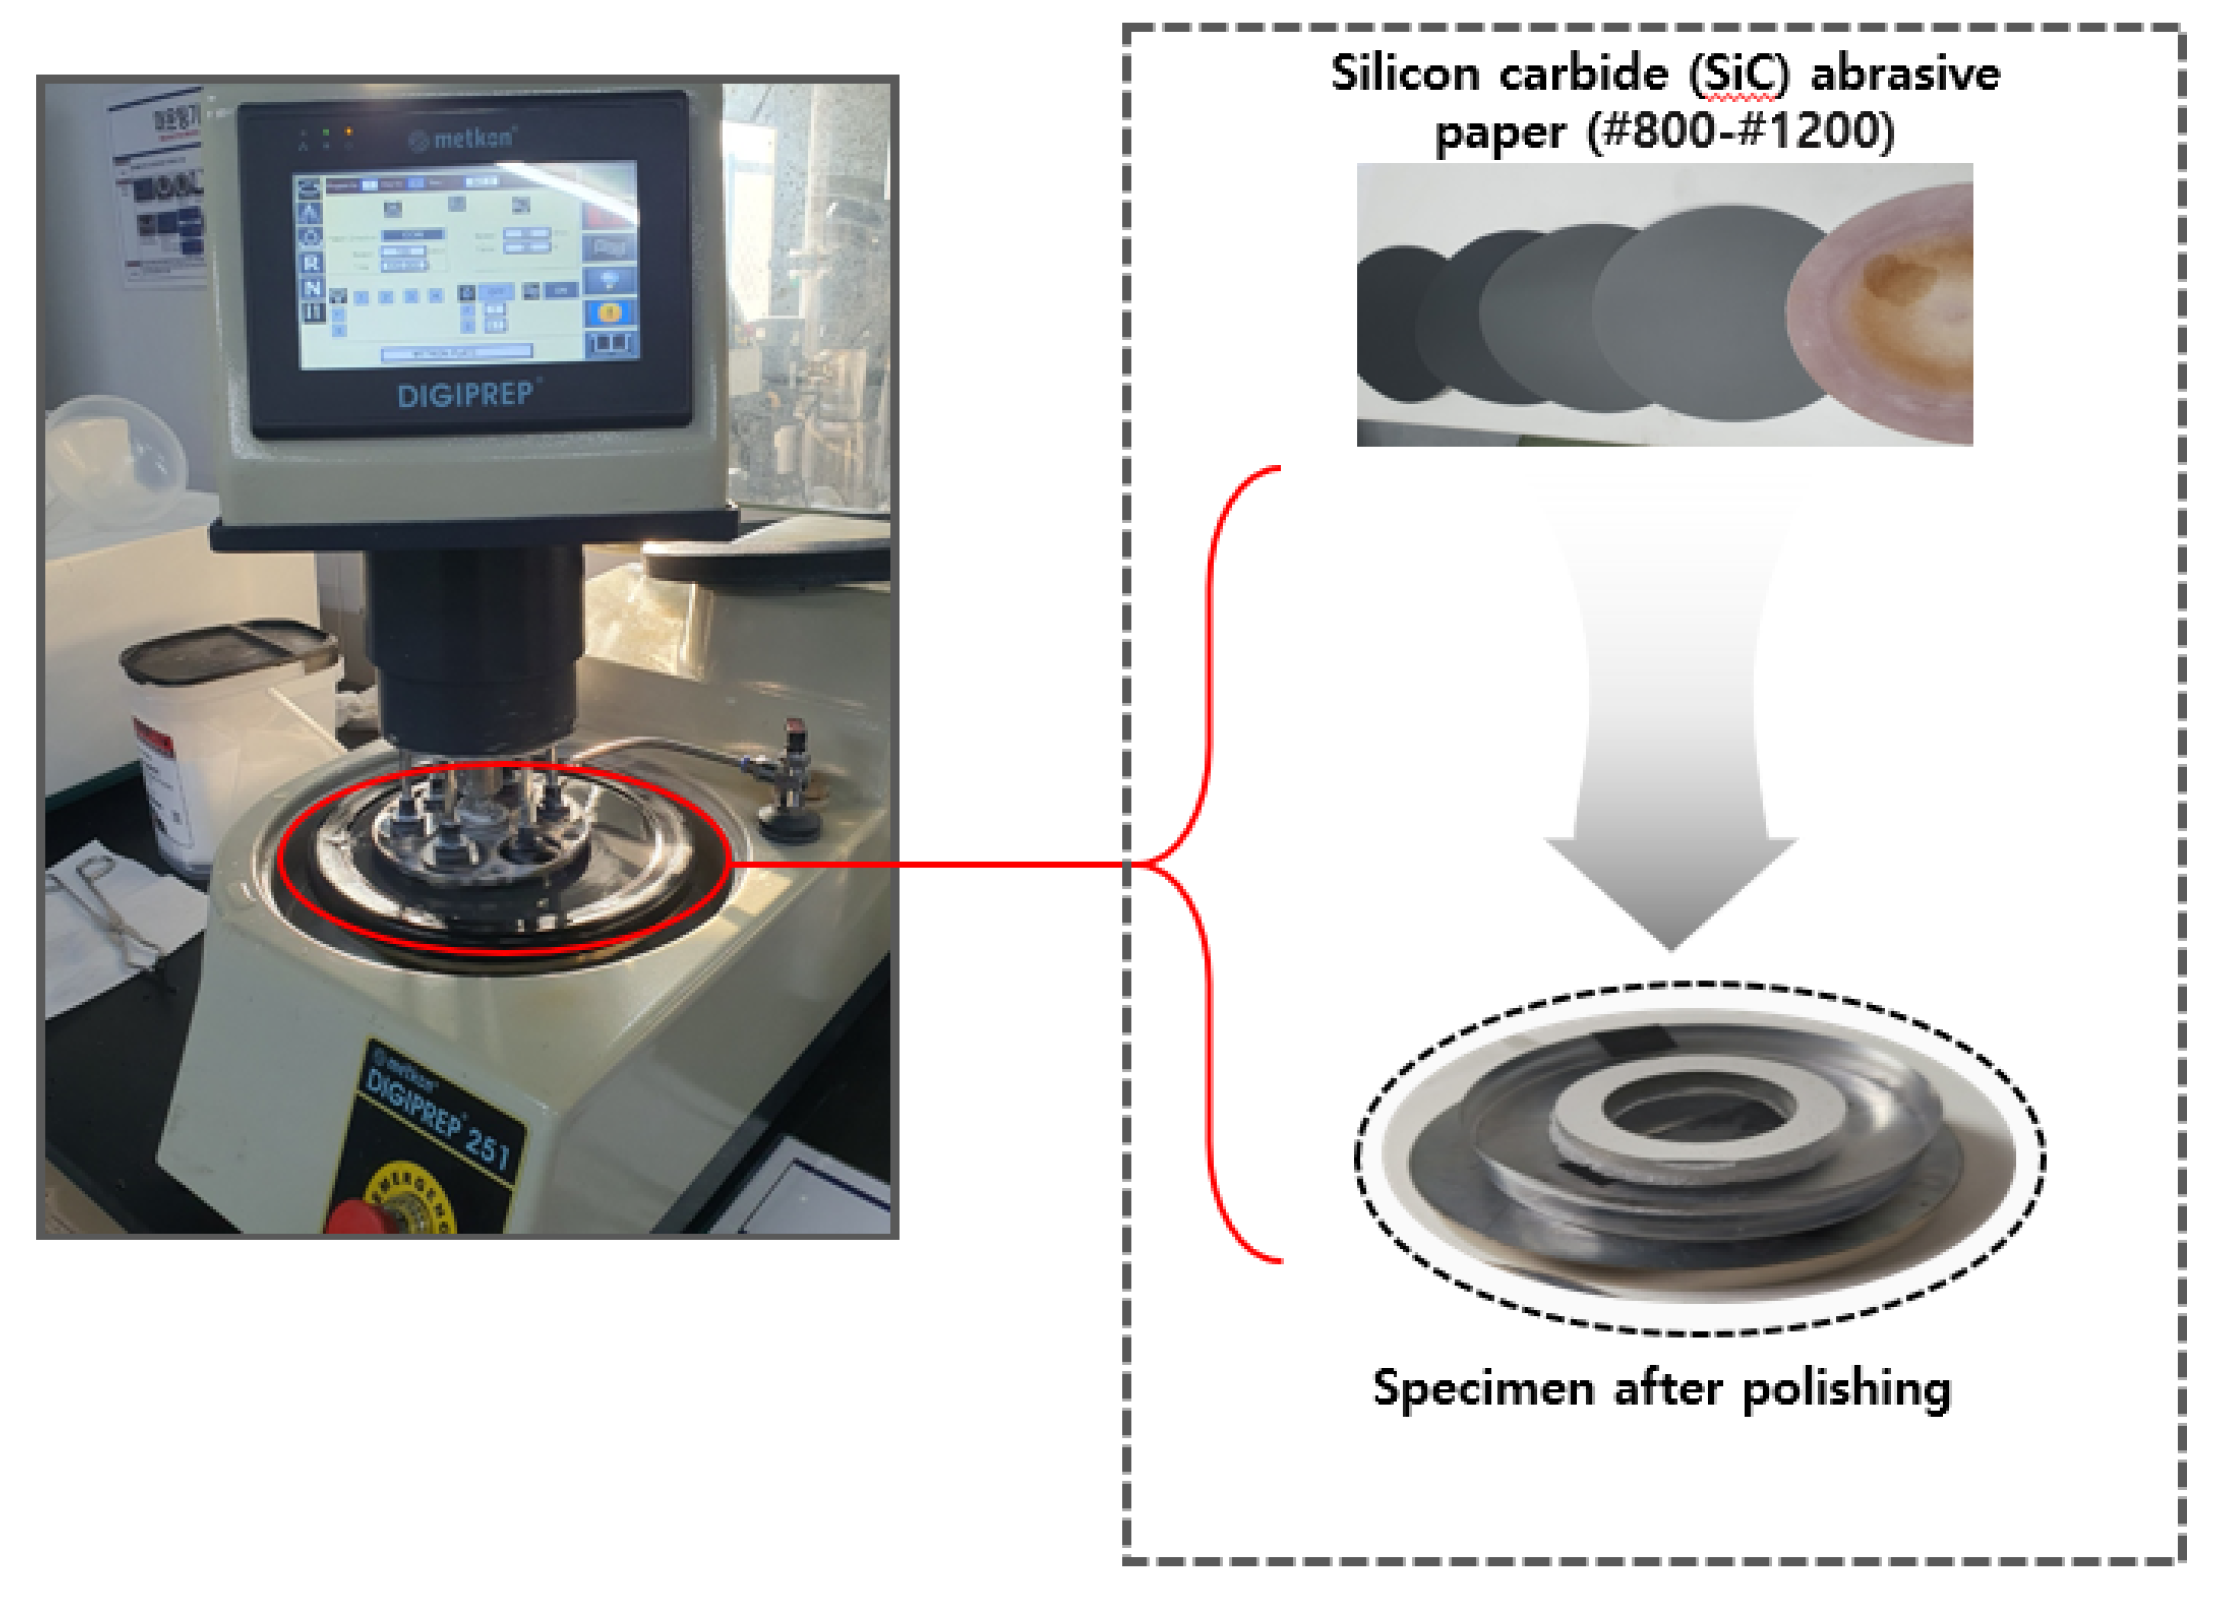
Figure 14.
SEM and EDS measurement location.
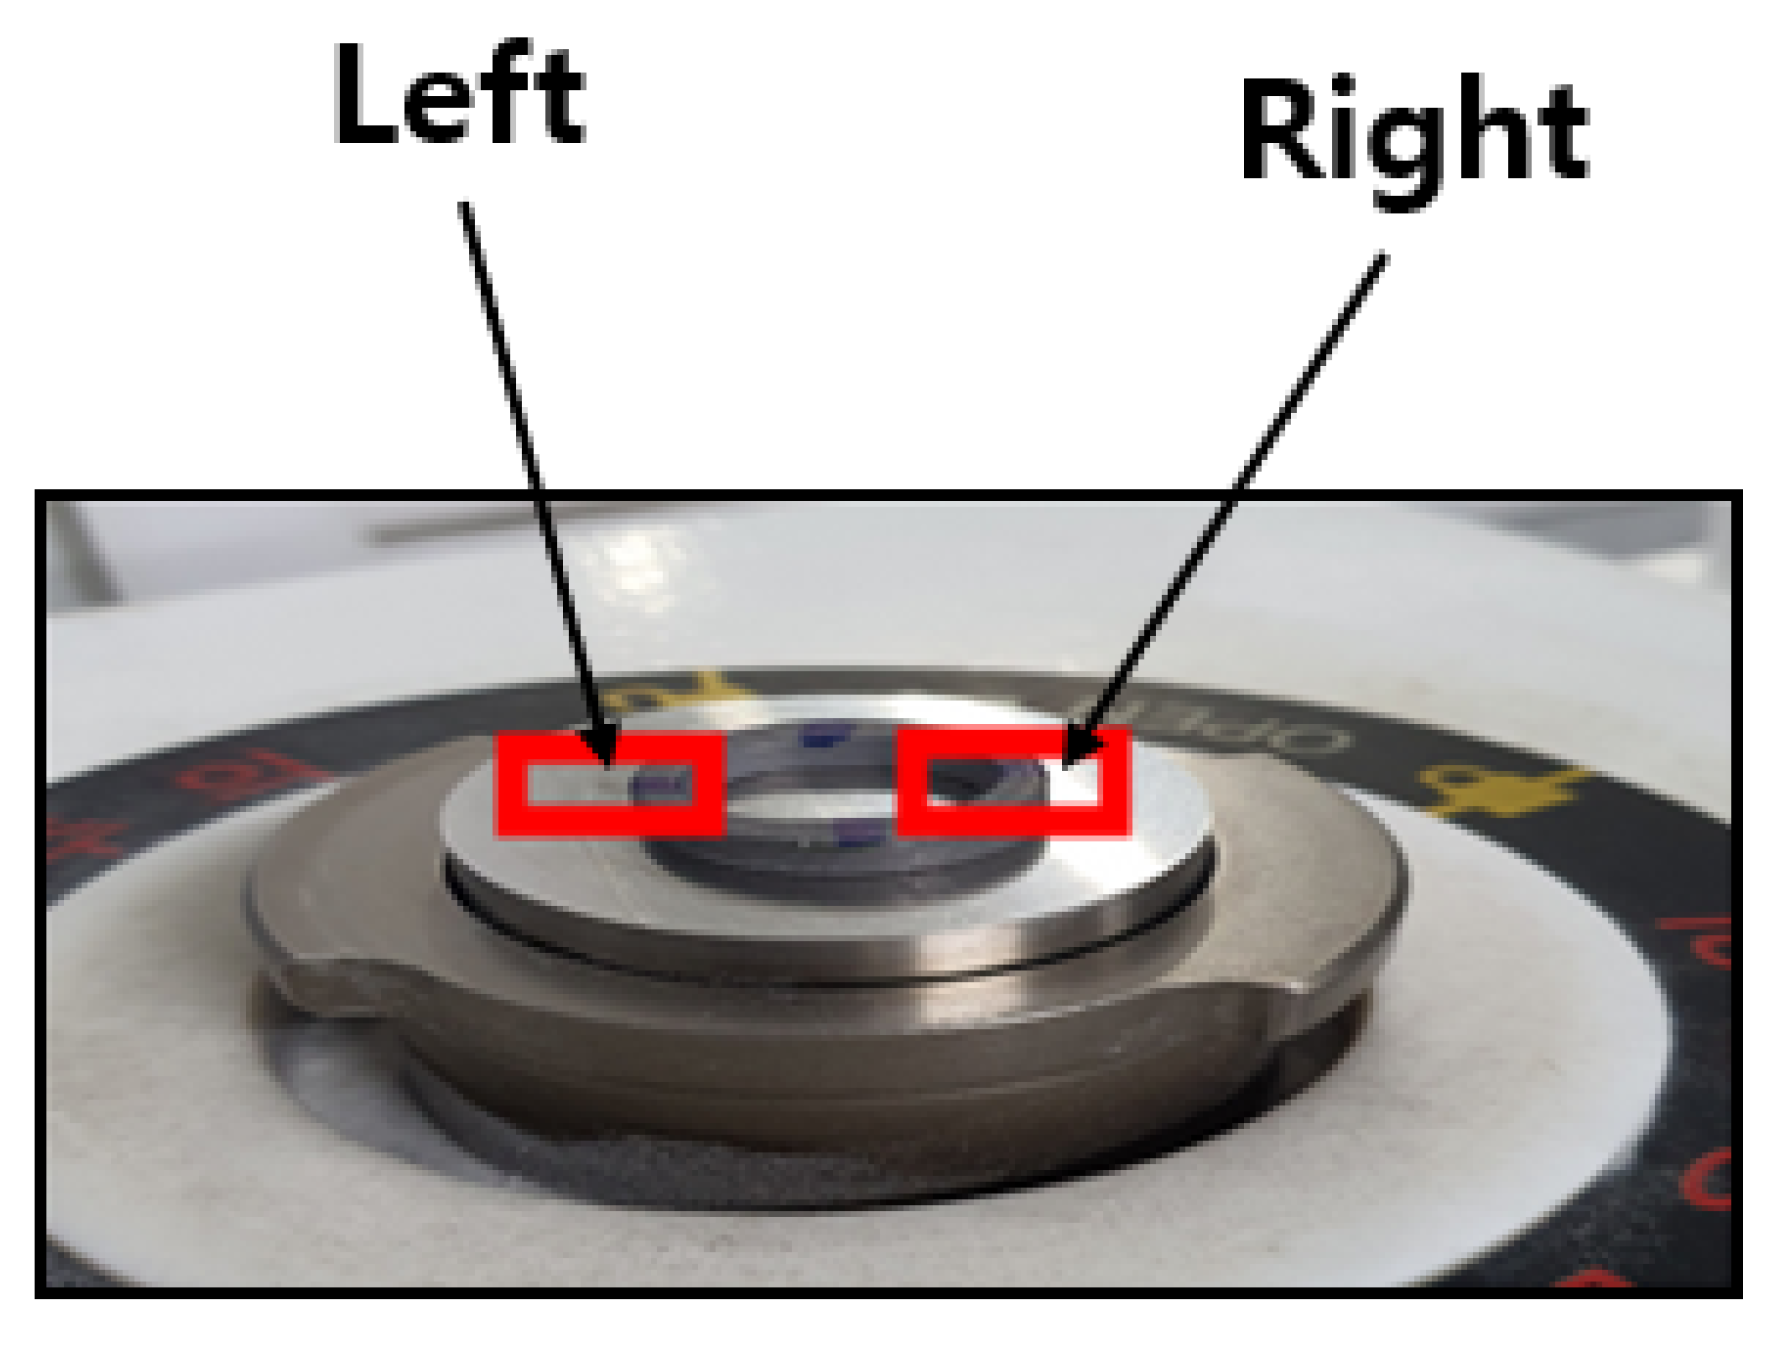
Figure 15.
SEM images: (a) Before phosphating; (b) after phosphating.
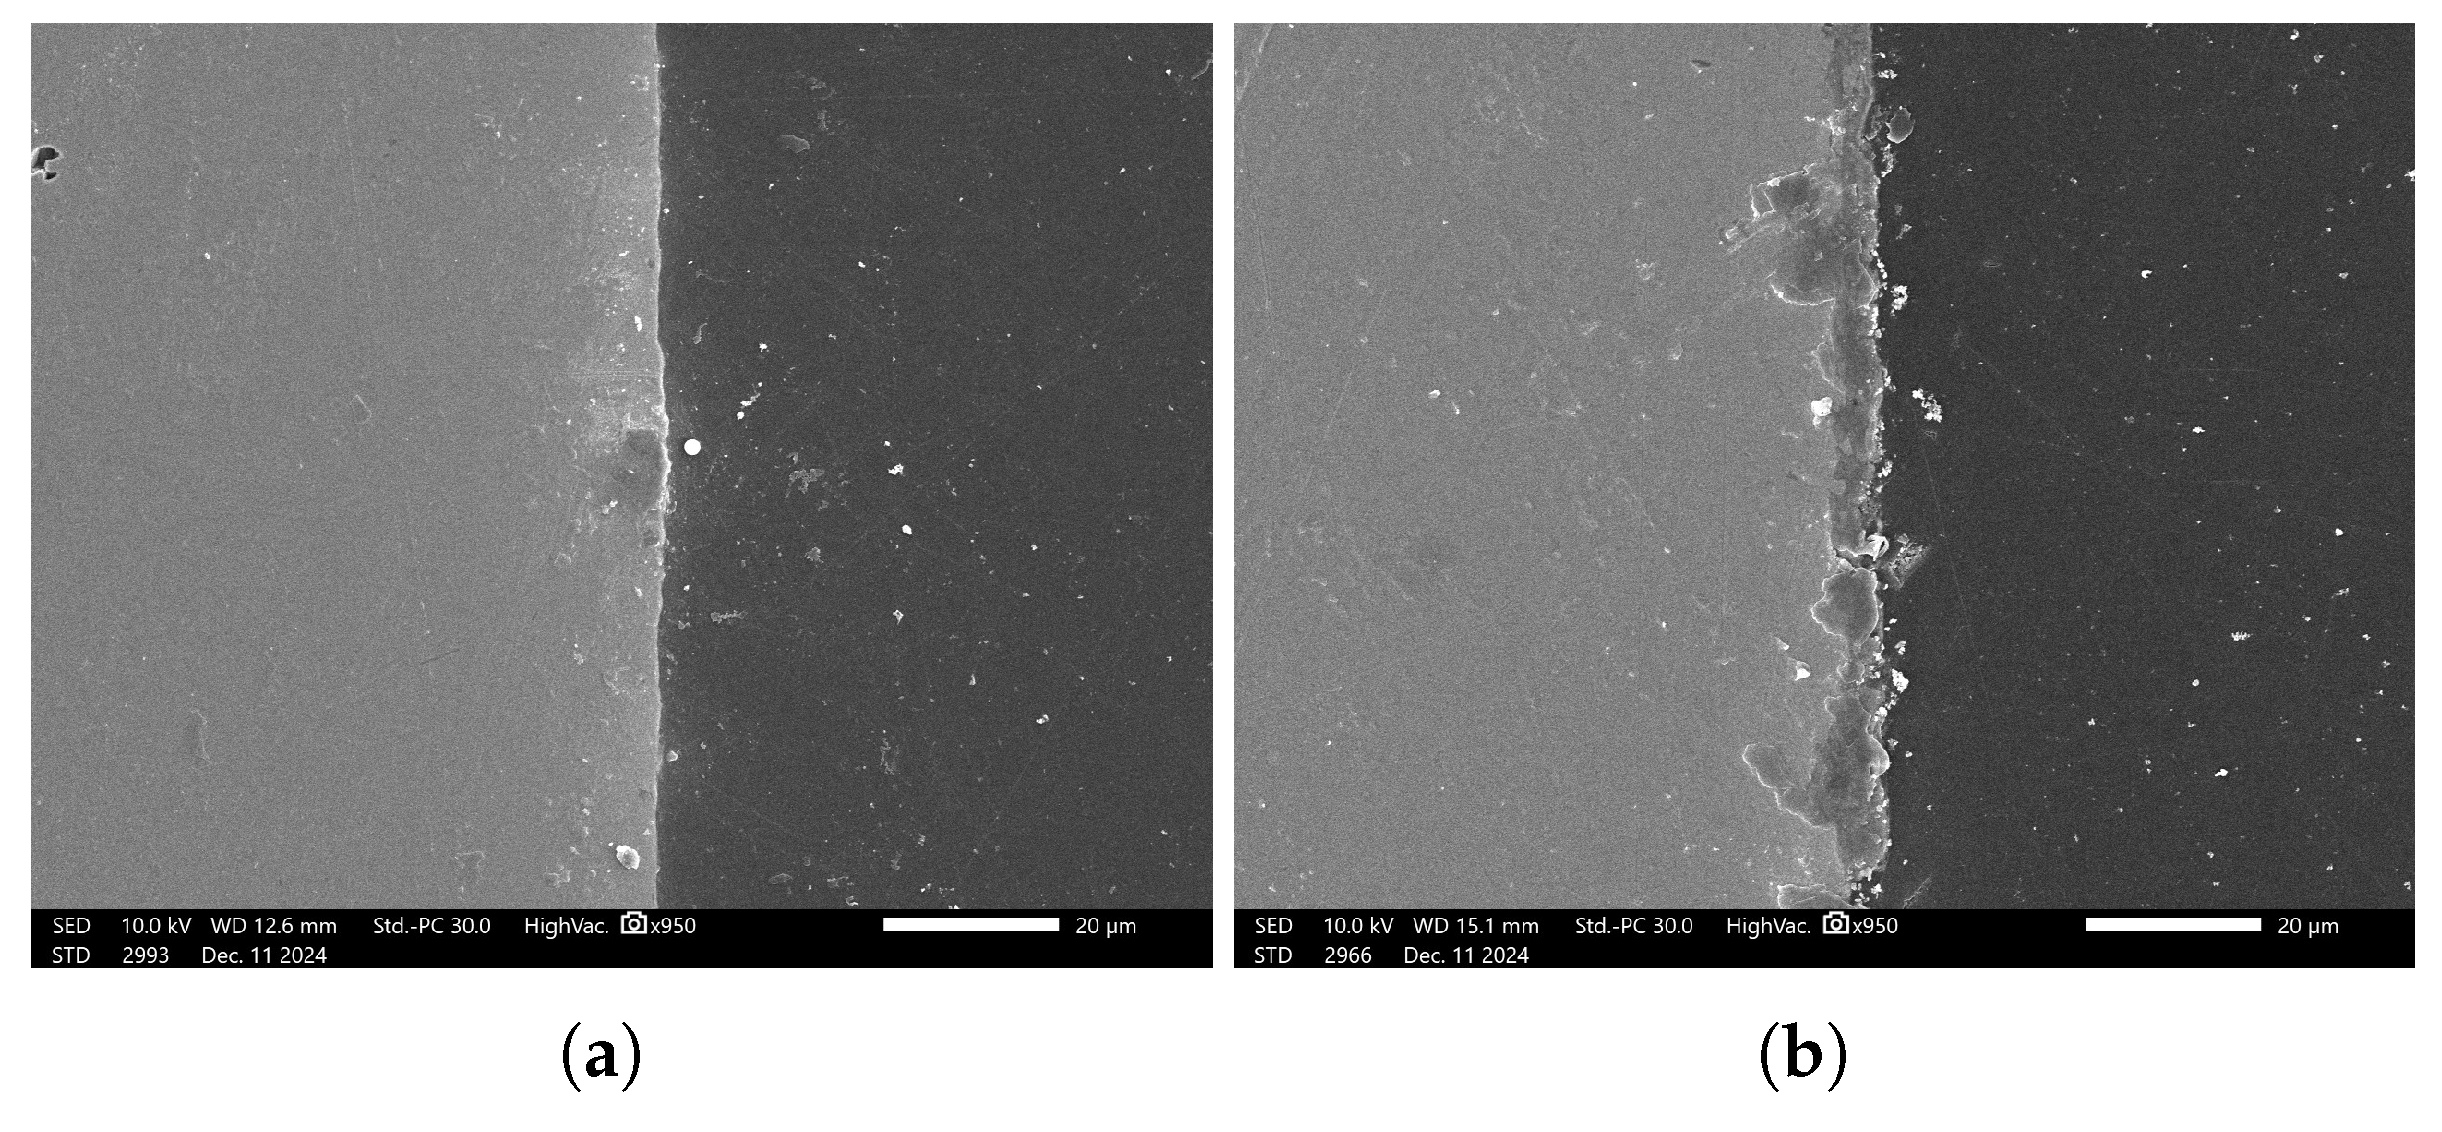
Figure 16.
SEM images: (a) Before phosphating; (b) after phosphating.
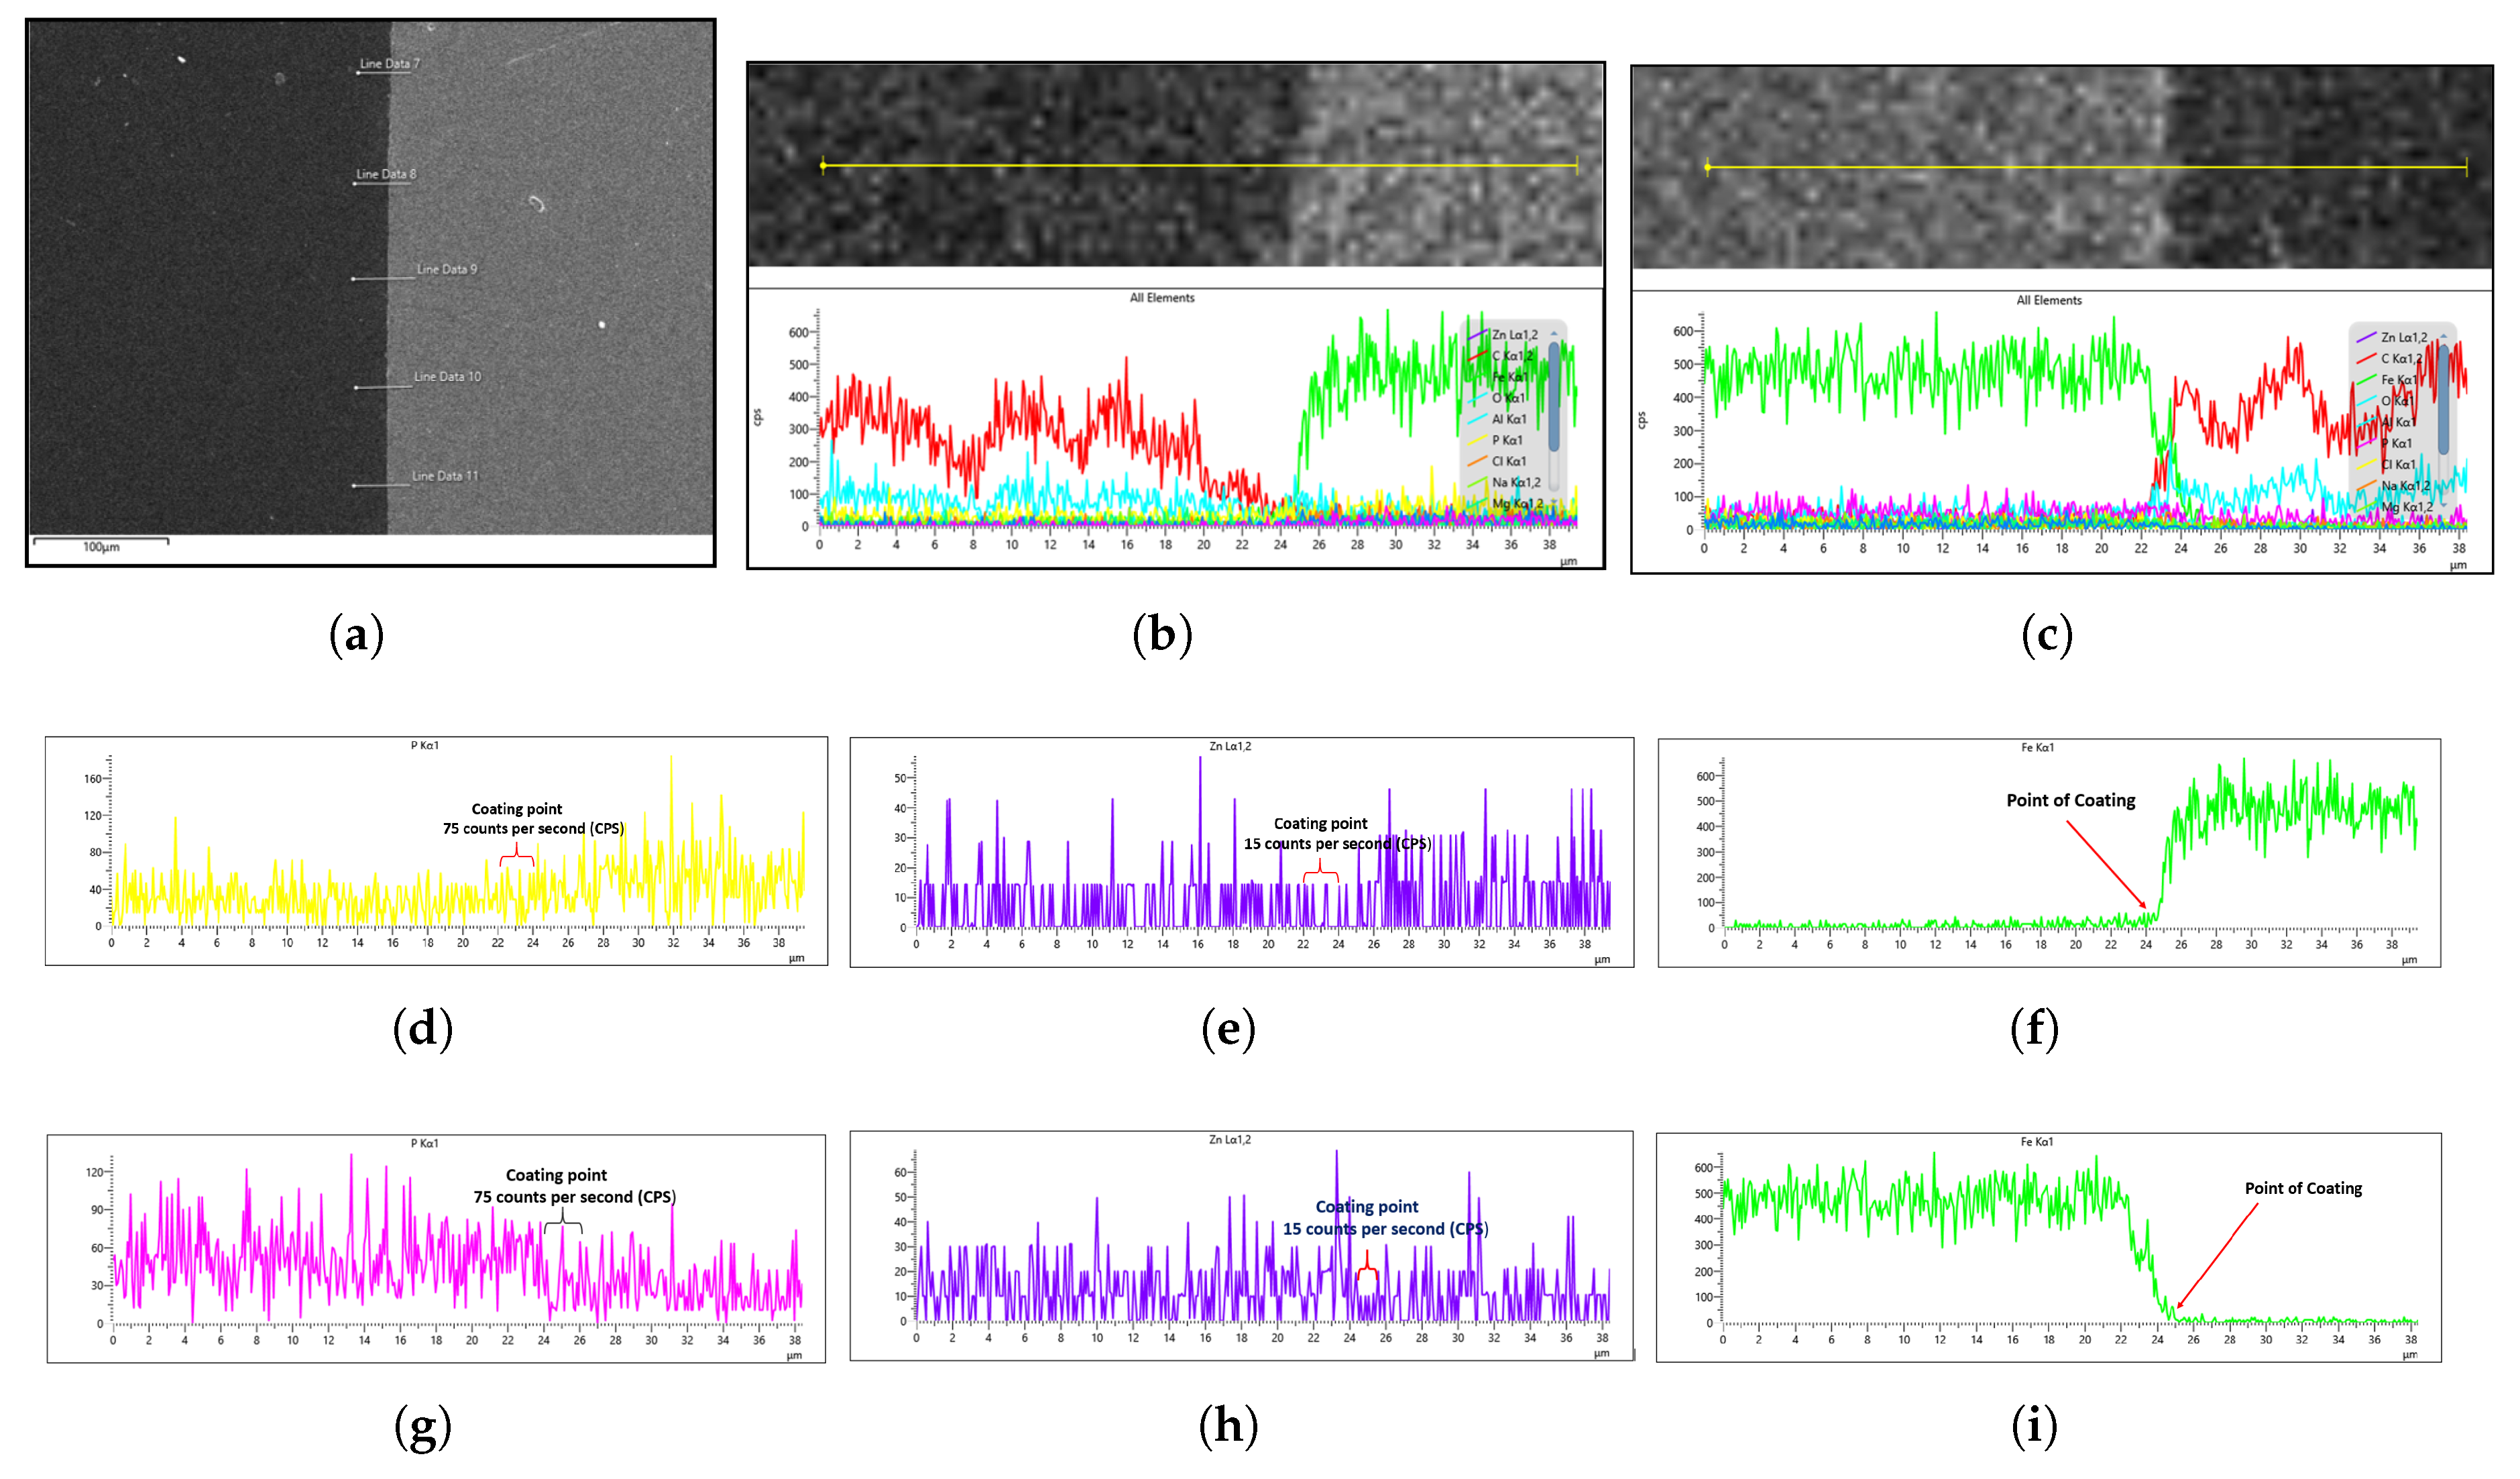
Figure 17.
Eds plot for 10 L/min: (a) At 0-min left; (b) 0-min right; (c) At 20-min left; (d) At 20-min right; (e) At 40-min left; (a) At 40-min right; (a) At 60-min left; (a) At 60-min right.
Figure 17.
Eds plot for 10 L/min: (a) At 0-min left; (b) 0-min right; (c) At 20-min left; (d) At 20-min right; (e) At 40-min left; (a) At 40-min right; (a) At 60-min left; (a) At 60-min right.
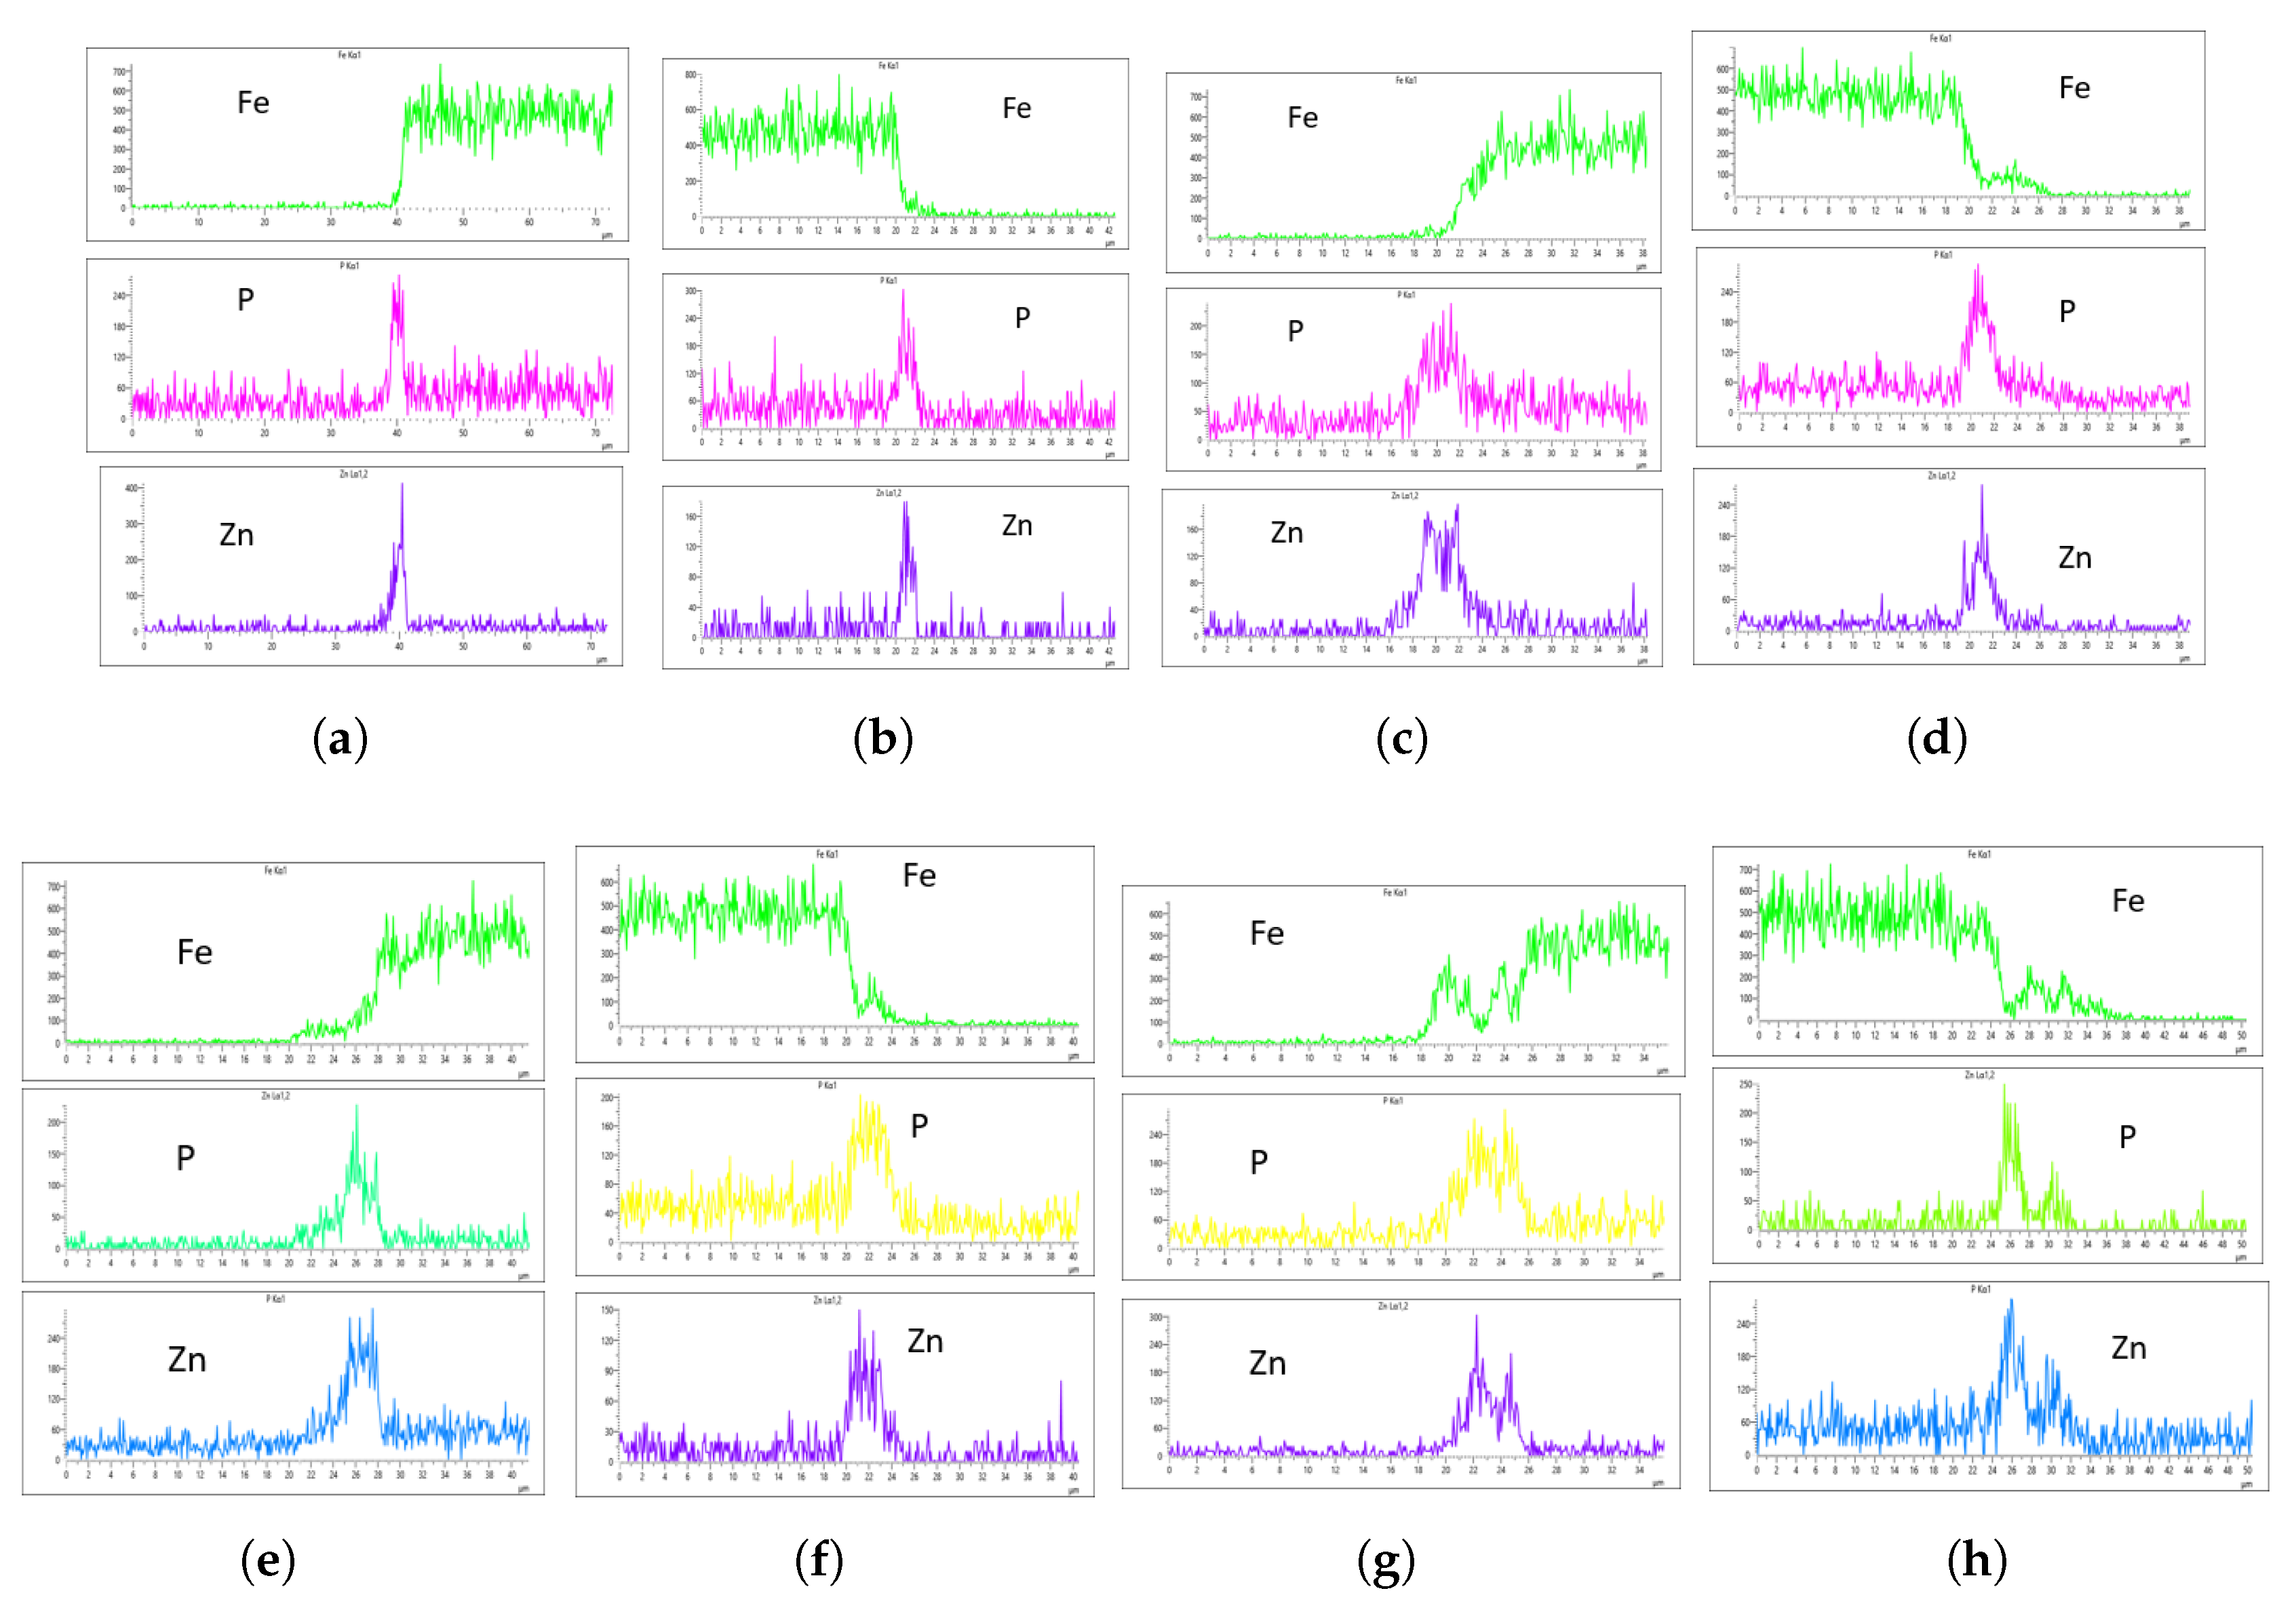
Figure 18.
Eds plot for 20 L/min: (a) At 0-min left; (b) 0-min right; (c) At 20-min left; (d) At 20-min right; (e) At 40-min left; (a) At 40-min right; (a) At 60-min left; (a) At 60-min right.
Figure 18.
Eds plot for 20 L/min: (a) At 0-min left; (b) 0-min right; (c) At 20-min left; (d) At 20-min right; (e) At 40-min left; (a) At 40-min right; (a) At 60-min left; (a) At 60-min right.
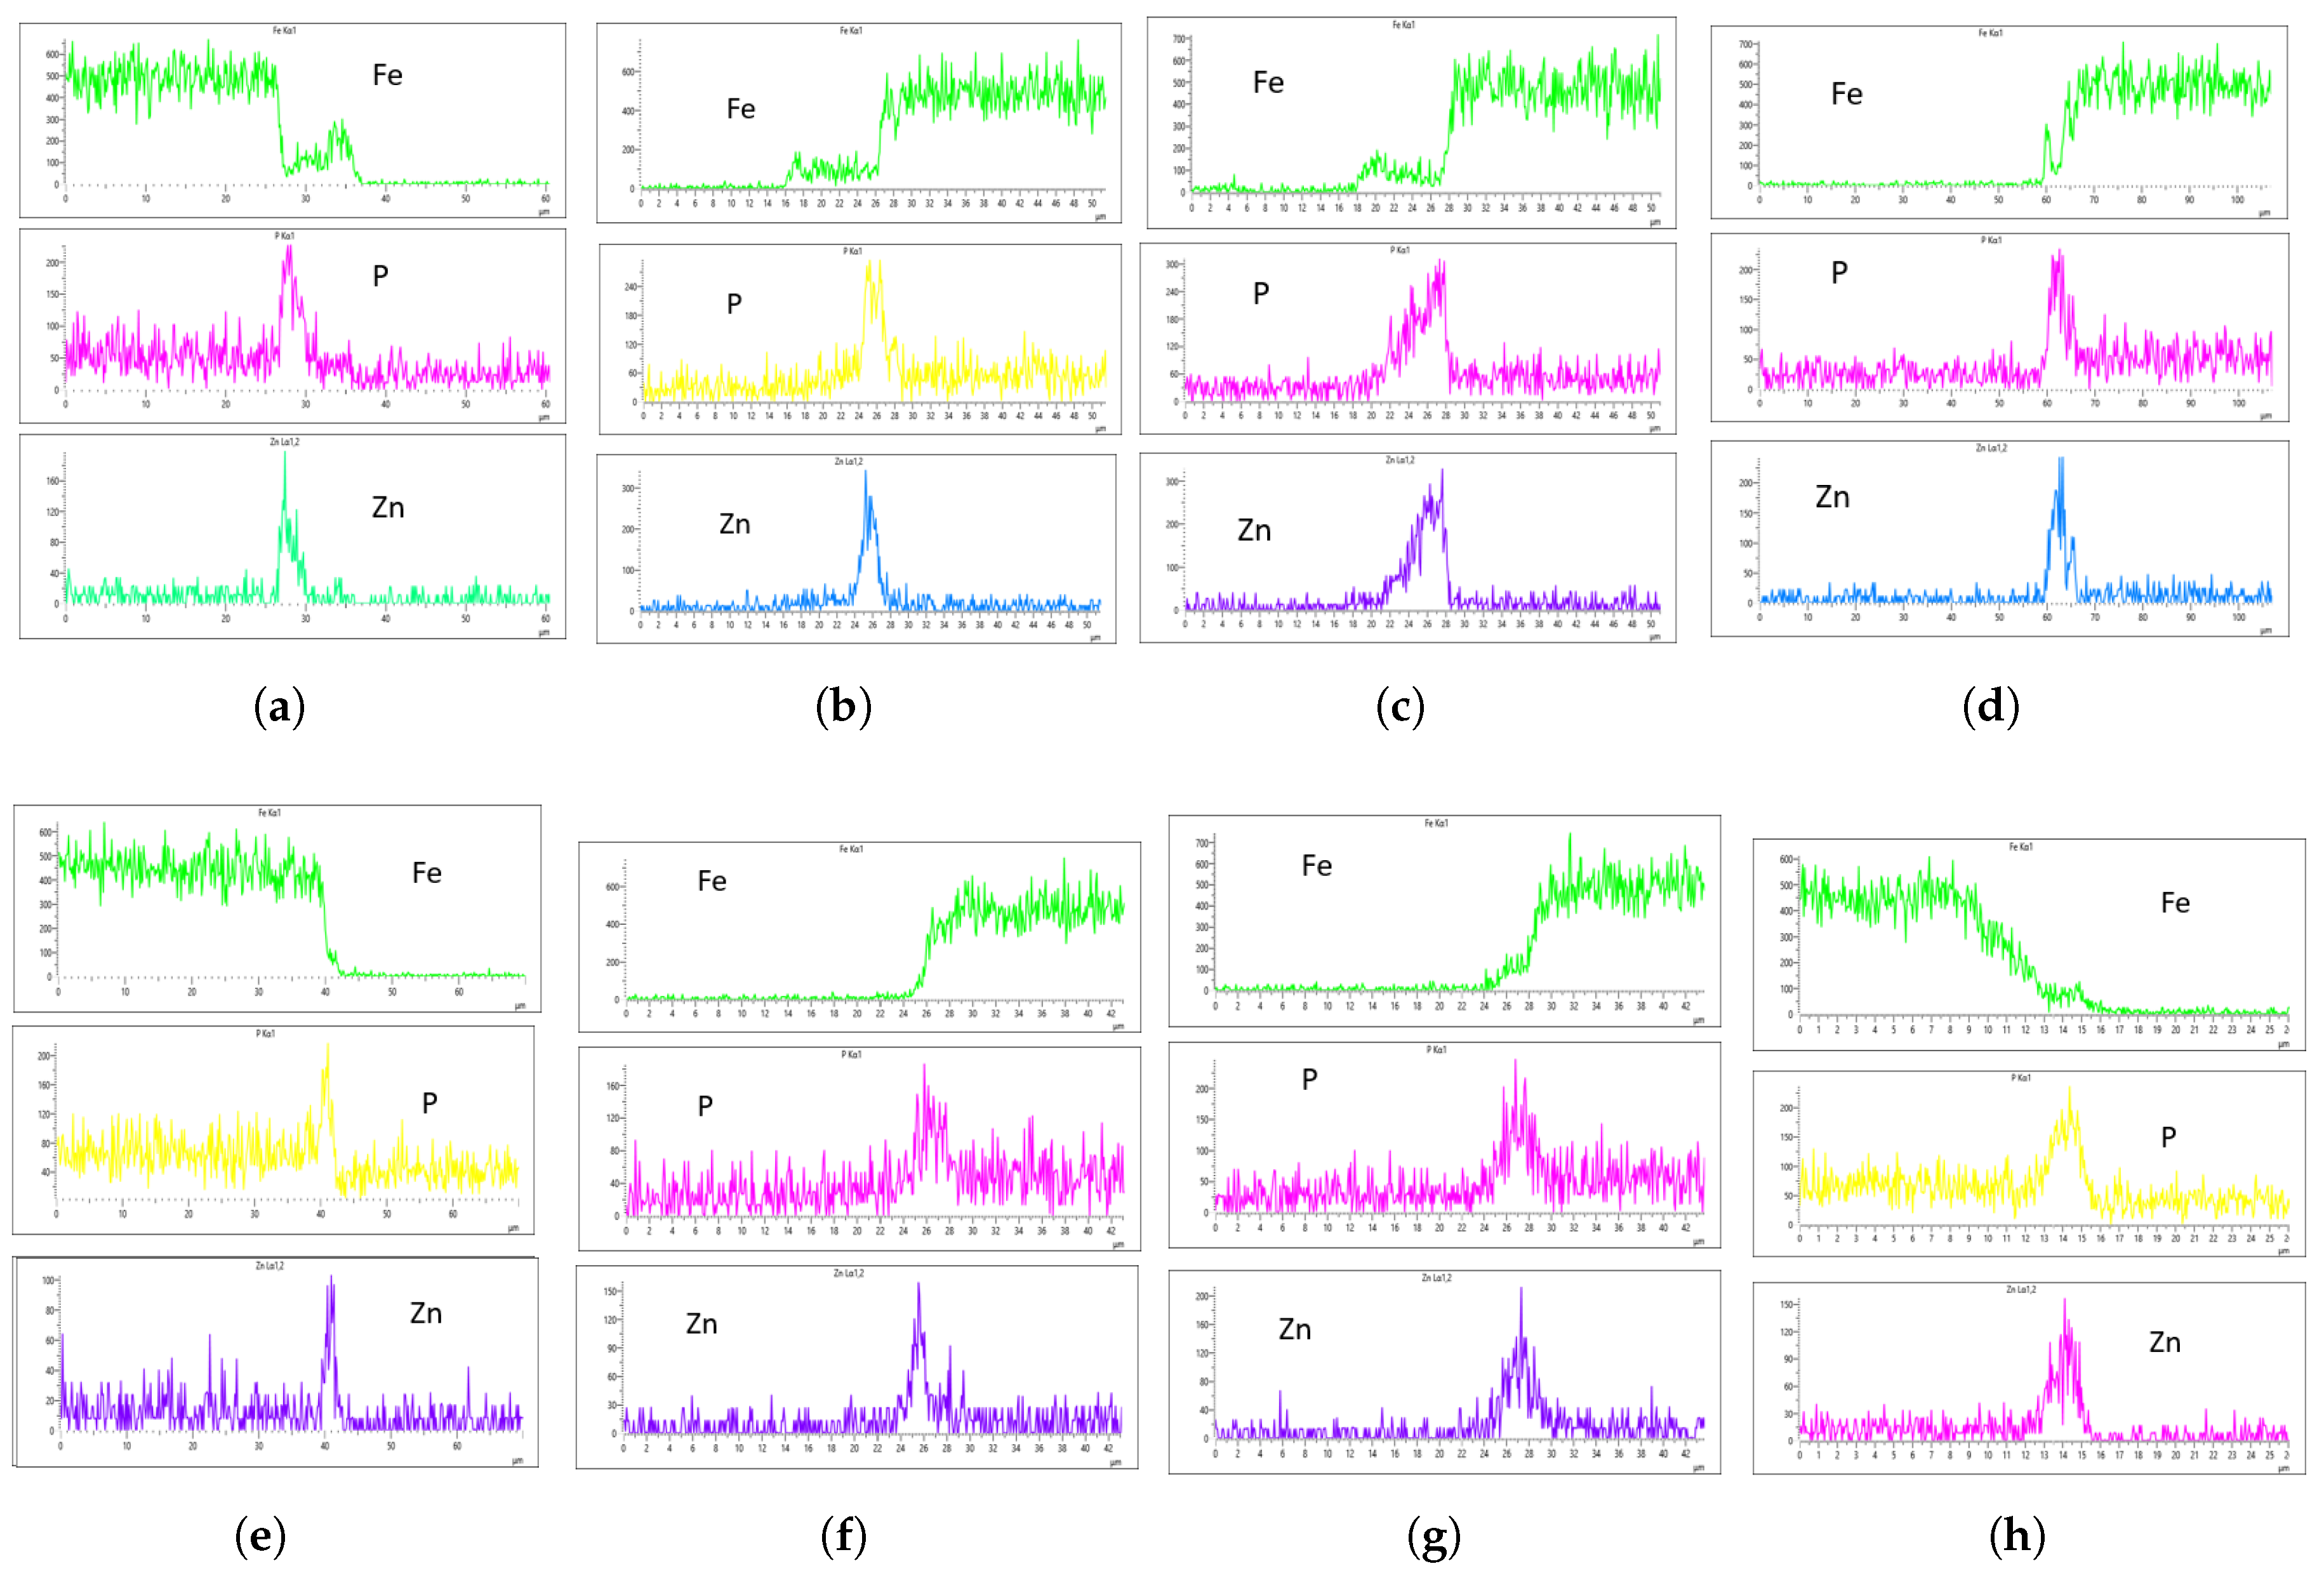
Figure 19.
Eds plot for 30 L/min: (a) At 0-min left; (b) 0-min right; (c) At 20-min left; (d) At 20-min right; (e) At 40-min left; (a) At 40-min right; (a) At 60-min left; (a) At 60-min right.
Figure 19.
Eds plot for 30 L/min: (a) At 0-min left; (b) 0-min right; (c) At 20-min left; (d) At 20-min right; (e) At 40-min left; (a) At 40-min right; (a) At 60-min left; (a) At 60-min right.
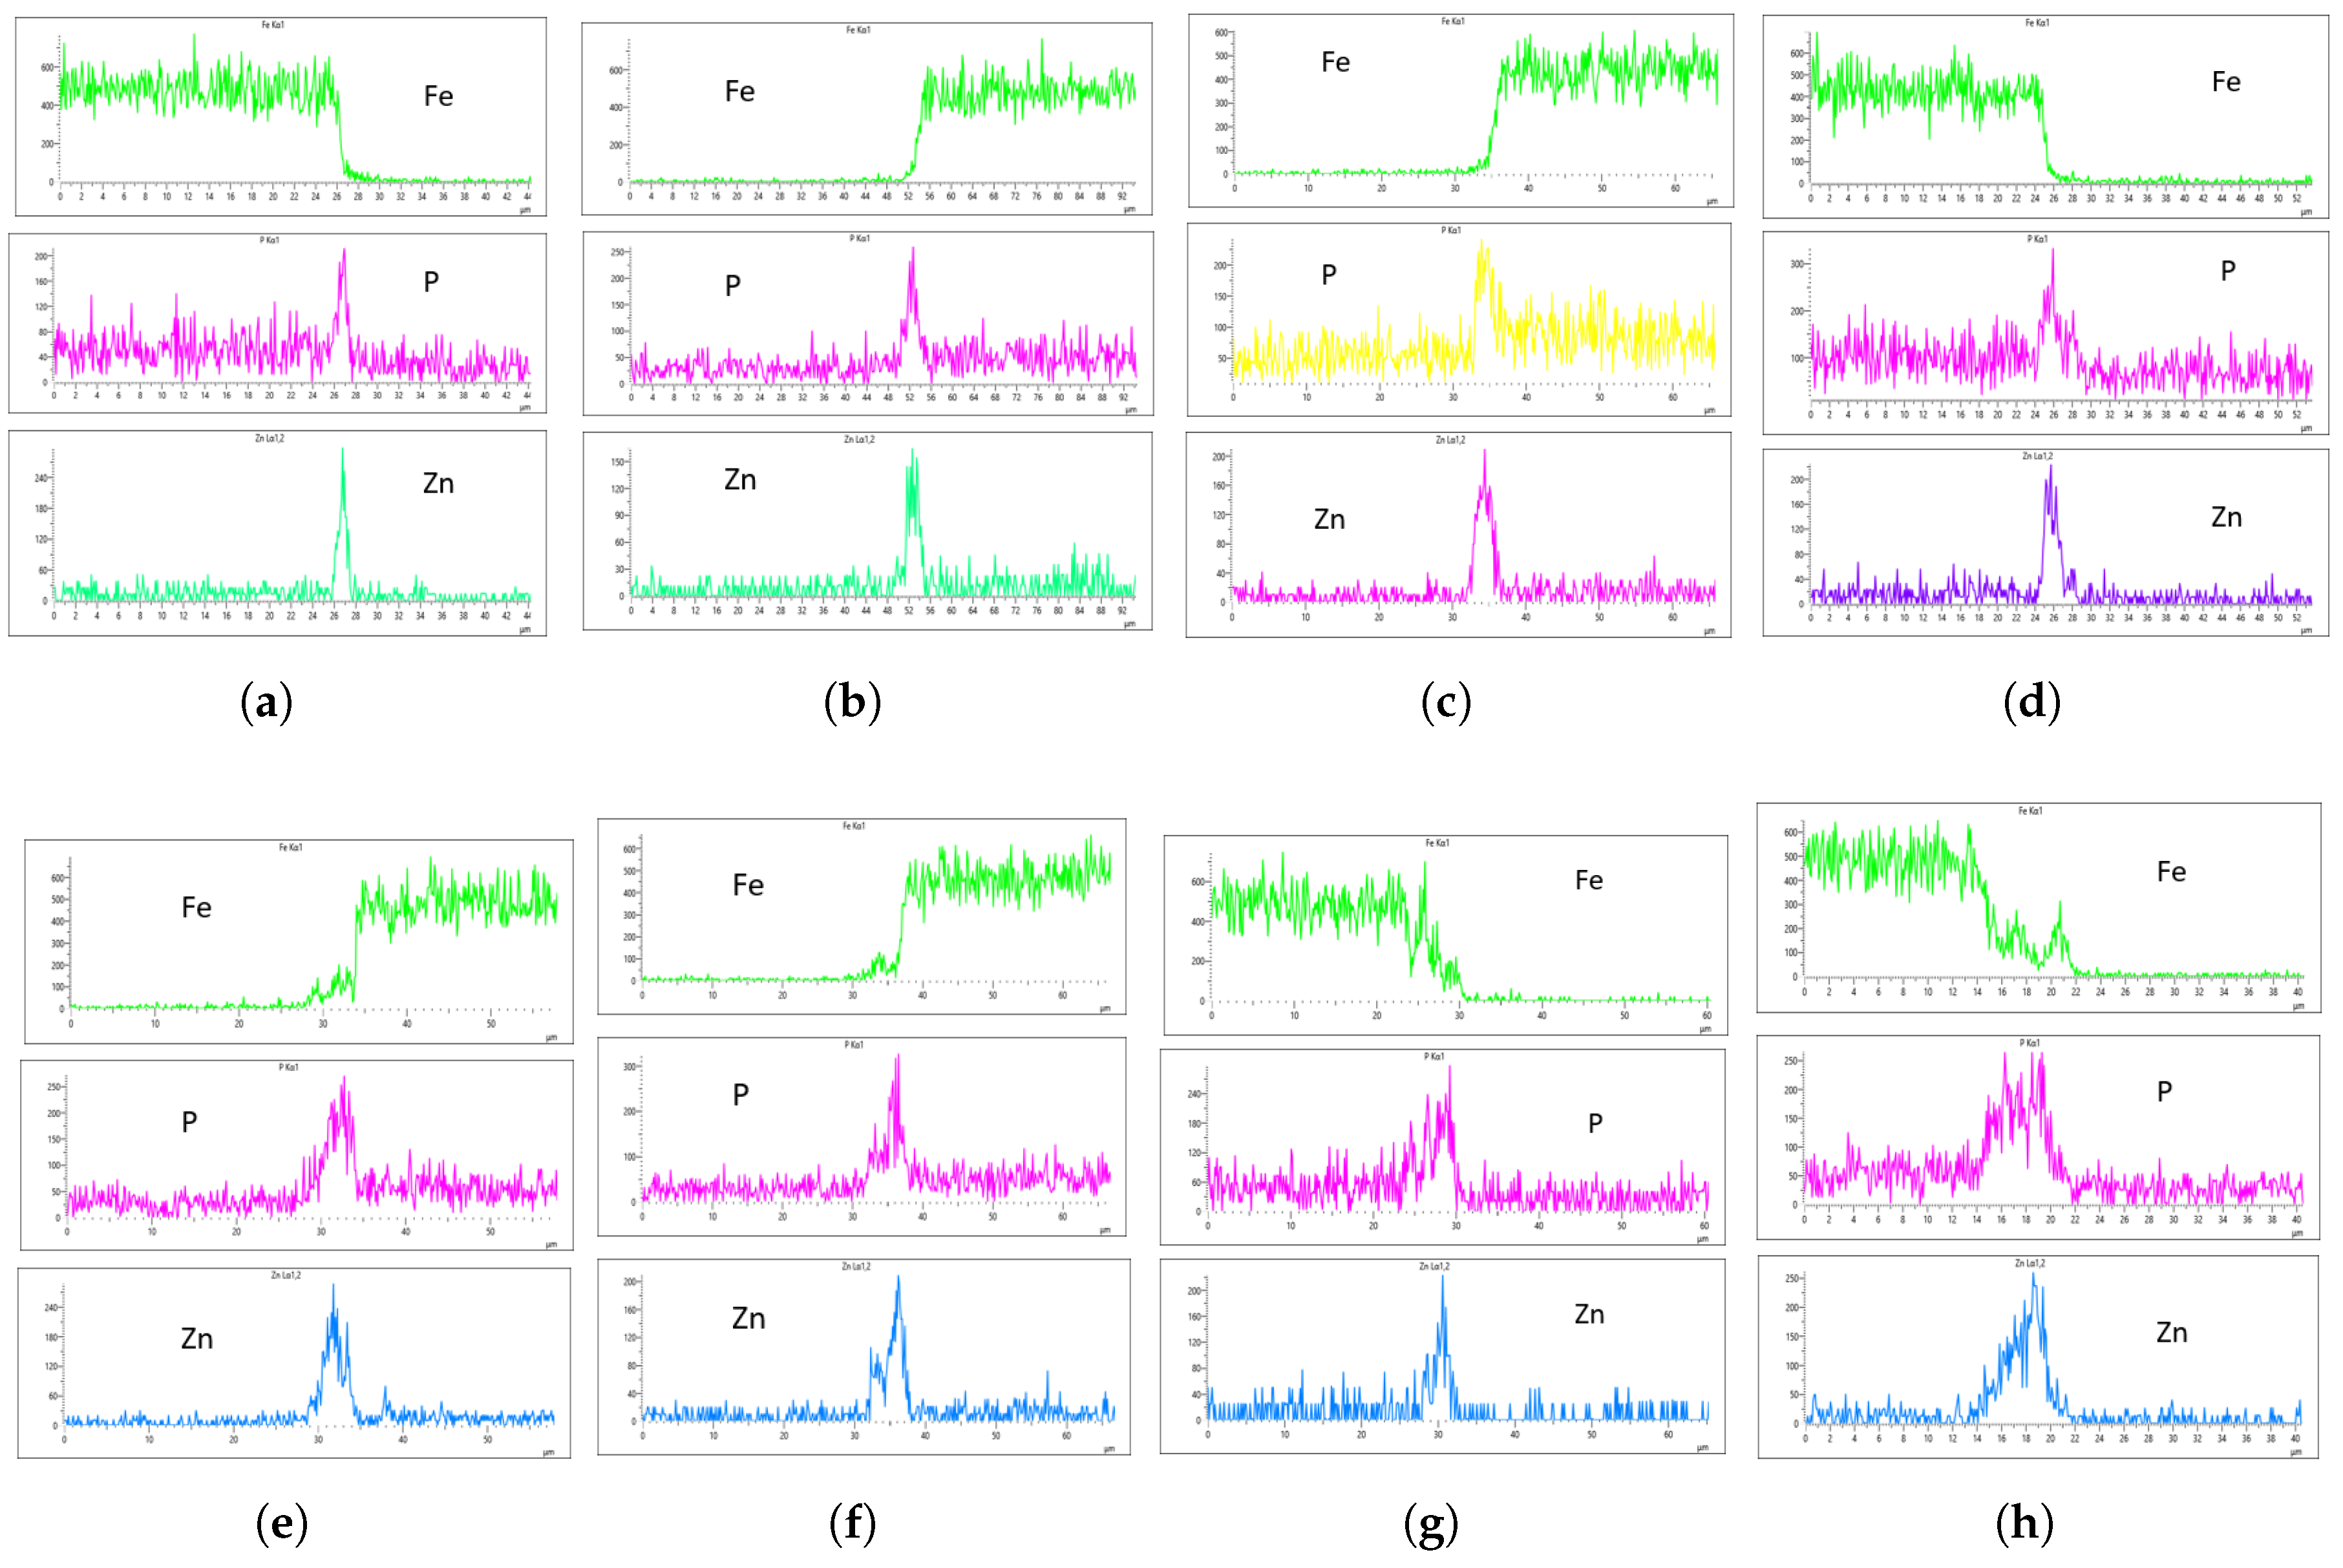

Table 1.
The chemical composition of SWRCH45K material.
| Carbon | Silicon | Manganese | Phosphorus | Sulphur | Nickel | Chromium | Copper |
|---|---|---|---|---|---|---|---|
| 0.42 - 0.48 | 0.1 - 0.35 | 0.6 - 0.9 | max 0.03 | max 0.035 | max 0.2 | max 0.2 | max 0.3 |
Table 2.
The mechanical properties of SWRCH45K material.
| Property | Value |
|---|---|
| Tensile Strength (MPa) | 780 max |
| Yield Strength (MPa) | 590 max |
| Elongation (%) | 10 max |
| Hardness (HBW) | 180~230 |
Table 3.
Bath Composition.
| Parameter | Chemical Used | Composition | Concentration |
|---|---|---|---|
| Total Acidity | Phosphating Agent #153 | HPO | 11 g/L |
| HNO | 4.32 g/L | ||
| ZnO | 8.1 g/L | ||
| Free Acidity | Neutralizer #405 | NaOH | 0.75 g/L |
| NaCO | 0.06 g/L | ||
| Acceleration | Accelerator #138 | NaNO | 0.26 g/L |
| NaCO | 0.12 g/L |
Disclaimer/Publisher’s Note: The statements, opinions and data contained in all publications are solely those of the individual author(s) and contributor(s) and not of MDPI and/or the editor(s). MDPI and/or the editor(s) disclaim responsibility for any injury to people or property resulting from any ideas, methods, instructions or products referred to in the content. |
© 2025 by the authors. Licensee MDPI, Basel, Switzerland. This article is an open access article distributed under the terms and conditions of the Creative Commons Attribution (CC BY) license (http://creativecommons.org/licenses/by/4.0/).
Copyright: This open access article is published under a Creative Commons CC BY 4.0 license, which permit the free download, distribution, and reuse, provided that the author and preprint are cited in any reuse.


