Submitted:
01 April 2025
Posted:
02 April 2025
You are already at the latest version
Abstract
Alzheimer’s Disease (AD) is a progressive neurodegenerative disorder that often begins decades before clinical symptoms manifest. Early detection remains critical for effective intervention, particularly in younger adults where biomarker deviations may signal pre-symptomatic risk. This research presents a computational modeling framework to predict cognitive impairment progression and stratify individuals into risk zones based on age-specific biomarker thresholds. The model integrates sigmoid-based data generation to simulate non-linear biomarker trajectories reflective of real-world disease progression. Core biomarkers—including CSF Aβ42, Amyloid PET, CSF Tau, and MRI FDG-PET—were analyzed simultaneously to compute a Cognitive Impairment (CI) score, dynamically adjusted for age. Higher CSF Aβ42 levels consistently demonstrated a protective effect, while elevated Amyloid PET and Tau levels increased cognitive risk. Age-specific CI thresholds prevented the overestimation of risk in younger individuals and the underestimation in older cohorts. The study highlights the model’s potential to identify individuals in risk zones, enabling targeted early interventions. Furthermore, the framework supports retrospective disease trajectory analysis, offering clinicians insights into optimal intervention windows even after symptom onset. Future work aims to validate the model using longitudinal real-world datasets and expand its predictive capacity through machine learning techniques and the integration of genetic and lifestyle factors. Ultimately, this research contributes to advancing precision medicine approaches in Alzheimer’s Disease by providing a scalable computational tool for early risk assessment and intervention planning.
Keywords:
Alzheimer’s disease
; cognitive impairment
; biomarkers
; machine learning
; computational modeling
; age-specific risk
; precision medicine
; sigmoid simulation
1. Introduction
Alzheimer’s disease (AD) is a progressive neurodegenerative disorder that impairs memory, cognitive function, and the ability to perform daily activities. It remains the leading cause of dementia among aging individuals. According to the Alzheimer’s Association’s 2024 Facts and Figures report [1], nearly 7 million Americans are currently living with AD, with one in nine people aged 65 and older affected. By 2050, this number is projected to rise to 12.7 million, barring any medical breakthroughs in prevention or cure.
Currently, there is no cure for Alzheimer’s disease. Available treatments are limited in their ability to halt disease progression; instead, they offer temporary relief by slowing the worsening of dementia-related symptoms. Research has identified several primary risk factors associated with AD, including advanced age, genetics, lifestyle factors, head trauma, cardiovascular conditions, cognitive engagement, and chronic neuronal inflammation [2,3,4]. Notably, studies indicate that brain atrophy and pathological changes begin decades before clinical symptoms emerge [5,6], emphasizing the importance of early interventions in delaying or mitigating disease progression [7,8,9].
Given the complexity of the human body and the multifactorial nature of Alzheimer’s pathology, no single biomarker is sufficient to conclusively predict cognitive risk or disease progression. Relying solely on one marker risks misclassification, as each biomarker captures only a subset of the disease mechanism. For instance, while low CSF A levels suggest amyloid plaque formation, similar reductions can occur in cognitively normal aging individuals [10,11,15]. Similarly, Amyloid PET imaging quantifies plaque burden but does not always correlate with current cognitive impairment [12,14]. CSF Tau and phosphorylated Tau (p-Tau) levels reflect neurodegeneration or neuronal injury but are less reliable as early-stage indicators [12,13]. Moreover, FDG-PET imaging captures brain hypometabolism downstream of amyloid and tau pathology, but its changes often lag behind other biomarkers, making it less sensitive to early-stage detection [12,16].
This study focuses on two hallmark pathological features of AD:
- Amyloid Beta (A) Plaques
- Neurofibrillary Tangles (NFTs)
From a computational perspective, this research explores the Time Factor Hypothesis, which posits that the early identification, detection, and quantification of neuronal biomarker changes—potentially decades before symptom onset—could enable timely diagnosis and intervention. This hypothesis suggests that targeting younger adults for early screening and preventative measures may offer a promising strategy to combat AD Onset/progression.
Ultimately, understanding the age-related progression of AD can inform the development of more effective diagnostic tools and therapeutic interventions aimed at significantly inhibiting or preventing disease advancement. Our findings highlight that early detection and intervention—beginning as early as ages 30 to 40—could substantially reduce both the incidence and severity of Alzheimer’s disease.
2. Computational Framework
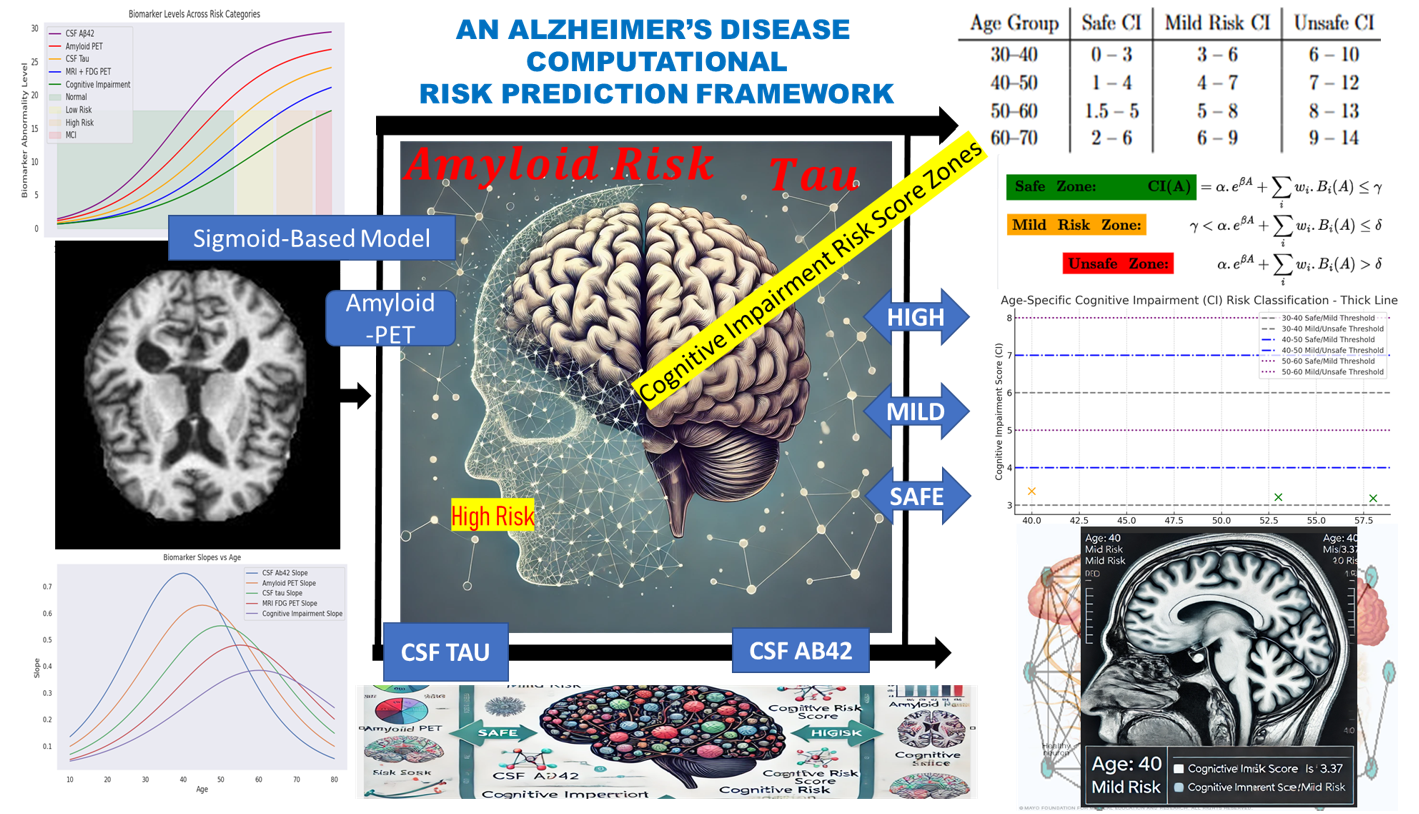
This section presents the computational framework developed to model cognitive impairment progression and assess Alzheimer’s Disease (AD) risk in younger adults. Grounded in the Time Factor Hypothesis, the model is designed to capture the non-linear trajectory of biomarker changes leading to cognitive decline, potentially decades before clinical symptoms manifest. The conceptual diagram for this fit is represented in Figure 1 starting from Biomarker Data → Simulation → Risk Zones → Correlative Risk Scoring → Risk Classification.
Axiom: The framework is based on gradual pathological changes in the brain’
The gradual pathological accumulations follow a non-linear progression — starting subtly, accelerating over time, and eventually plateauing. This biological behavior is best represented by a sigmoid function, which allows the model to simulate early-stage deviations in biomarkers before cognitive impairment becomes clinically apparent.
The model incorporates the following key biomarkers, each weighted based on its relative contribution to cognitive risk:
- Cerebrospinal Fluid (CSF) A
- Amyloid PET imaging
- CSF Tau and phosphorylated Tau (p-Tau)
- MRI FDG-PET (brain metabolism)
The computational framework is structured into three main components:
Descriptive Analysis – Under this cadre, we performed a descriptive analysis to establish the expected physiological ranges for the cognitive risk associated with each biomarker. These baseline values were modeled using a sigmoid function to generate a synthetic dataset that captures the biomarker’s variability over time and across age groups.
Parameter Accumulation – This component tracks the progression and accumulation of biomarkers over time. By modeling these trajectories, we assessed deviations from normal levels, providing insights into the temporal dynamics of each biomarker in relation to AD risk.
Correlation and Classification – We analyzed the correlation between biomarker accumulation and neuronal changes associated with Alzheimer’s disease. This enabled us to classify cognitive risk into distinct categories — normal, mild risk, or high risk — based on biomarker fluctuations and their combined effect on Cognitive Impairment (CI) scoring.
2.1. Descriptive Analysis
Previous studies [16,17,18,19,20] have evaluated the expected average levels of key cerebrospinal fluid (CSF) biomarkers across different age groups and populations, including individuals living with HIV infection. Based on these findings, CSF A levels below 480 pg/mL or above 800 pg/mL are considered clinically significant indicators of cognitive health status. Specifically, reduced A levels suggest amyloid plaque accumulation, while elevated levels are typically associated with normal cognitive function.
For CSF Tau, age-specific thresholds have been proposed: levels should remain below 300 pg/mL for individuals aged 21 to 50, below 450 pg/mL for those aged 51 to 70, and under a critical threshold in individuals aged 70 to 90. Similarly, in Amyloid PET imaging, a Centiloid score of 0 is typical in younger adults, while scores approaching 100 are indicative of mild neurodegenerative changes.
Further research shows that individuals with CSF A levels between 600–800 pg/mL generally maintain normal cognitive function, whereas levels falling below 480 pg/mL are linked to progressive cognitive decline [10]. Additionally, [11,24] observed that Amyloid PET values less than 7 and CSF Tau levels below 7 are commonly found in cognitively normal individuals. In contrast, Amyloid PET values exceeding 7–10 correlate with amyloid positivity and an increased risk of Mild Cognitive Impairment (MCI) and Alzheimer’s disease. Tau levels above the 7–10 range are also associated with early neurodegenerative processes.
Cognitive impairment scores further contextualize these biomarkers, with scores below 3 associated with normal cognitive aging and scores above 6 indicating early-stage cognitive impairment [24]. Integrating these biomarker thresholds with cognitive impairment scoring provides a structured and quantifiable framework for classifying individuals into cognitive risk zones relevant to Alzheimer’s disease onset and related neurodegenerative disorders.
2.2. Sigmoid Simulation & Parameter Accumulation
To standardize the accumulation of biomarker values and imaging results relative to age, we modeled the biomarker measurements using a sigmoid function, defined in Equation 1. In this formulation, L represents the maximum potential value of a given parameter, while k serves as a scaling factor to adjust for variability in the input data. The term denotes the individual biomarker measurement, and represents the mean of the respective biomarker column, acting as a reference point for standardization. The sigmoid function is mathematically expressed as:
This function effectively constrains the output between 0 and L, making it well-suited for classification tasks where the goal is to assess the likelihood of an individual belonging to a specific cognitive risk category. Within the context of this research, the sigmoid function enables the stratification of individuals into normal, mild-risk, and high-risk groups based on their biomarker profiles associated with Alzheimer’s Disease (AD).
To further analyze biomarker progression, we computed the derivative of the sigmoid function, , to identify critical points and ensure smooth curve behavior. By leveraging regression analysis alongside the derivative , we reverse-engineered feature distributions, allowing for the controlled generation of synthetic instances representing individuals aged 10 years and older. This approach enriched the dataset, supporting the modeling of early biomarker changes potentially preceding clinical symptoms (see Figure Table 1 for reference).
Henceforth, the term donor may be written as donor to reflect the enrichment and synthetic extension of the original dataset.
2.3. The Dataset
Most existing datasets in Alzheimer’s research predominantly comprise data from older individuals, typically aged 50 years and above. However, due to the scarcity of available data for younger individuals, particularly those aged 30–50, and the defined nature of available biomarker data —often either MRI imaging or numerical with categorical values, but rarely both— this study adopts a hybrid dataset approach to enrich the dataset and broaden age representation.
The dataset construction involved aggregating data from Kaggle, ANDI, and OASIS, followed by rigorous cleaning and filtering to retain relevant features. When duplicate or similar entries were identified, data were grouped and averaged, with Age serving as the primary instance identifier. To address missing data, particularly for individuals under the age of 50, synthetic instances were generated using the sigmoid simulation described in Equation (1).
Table 1 presents a snapshot of the resulting biomarker dataset designed for Alzheimer’s Disease (AD) risk assessment. Notably, the dataset starts from age 10, reflecting an intentional focus on early-stage biomarker progression rather than traditional cohorts limited to older populations.
Initial observations suggest that CSF A levels increase with age during early development, potentially reflecting normal physiological changes before the expected decline associated with AD. Similarly, Amyloid PET and CSF Tau levels demonstrate gradual increases, indicating progressive biomarker changes that may begin well before clinical symptoms emerge.
The dataset includes the following key attributes:
- Age: The individual’s age (beginning at 10 years).
- CSF A: Cerebrospinal Fluid Amyloid Beta 42 levels, a biomarker indicating amyloid plaque accumulation, a hallmark of AD.
- Amyloid PET: Positron Emission Tomography measurements of amyloid deposition in the brain, where higher values denote greater amyloid accumulation.
- CSF Tau: Levels of tau protein in cerebrospinal fluid, serving as an indicator of neurodegeneration associated with AD.
- MRI FDG-PET: A neuroimaging metric capturing structural and metabolic brain changes.
This enriched dataset enables the investigation of biomarker dynamics across a broader age range, offering valuable insights into early-stage Alzheimer’s risk assessment.
2.4. Correlation Analysis and Cognitive Risk Categories
It is critical to identify correlations between biomarkers and establish classification regions that stratify donors into normal (no_risk), mild_risk, and high_risk cognitive categories associated with AD. For instance, the significance of CSF A is that its reduction signals amyloid plaque accumulation in the brain, a hallmark of Alzheimer’s disease (AD) [17].
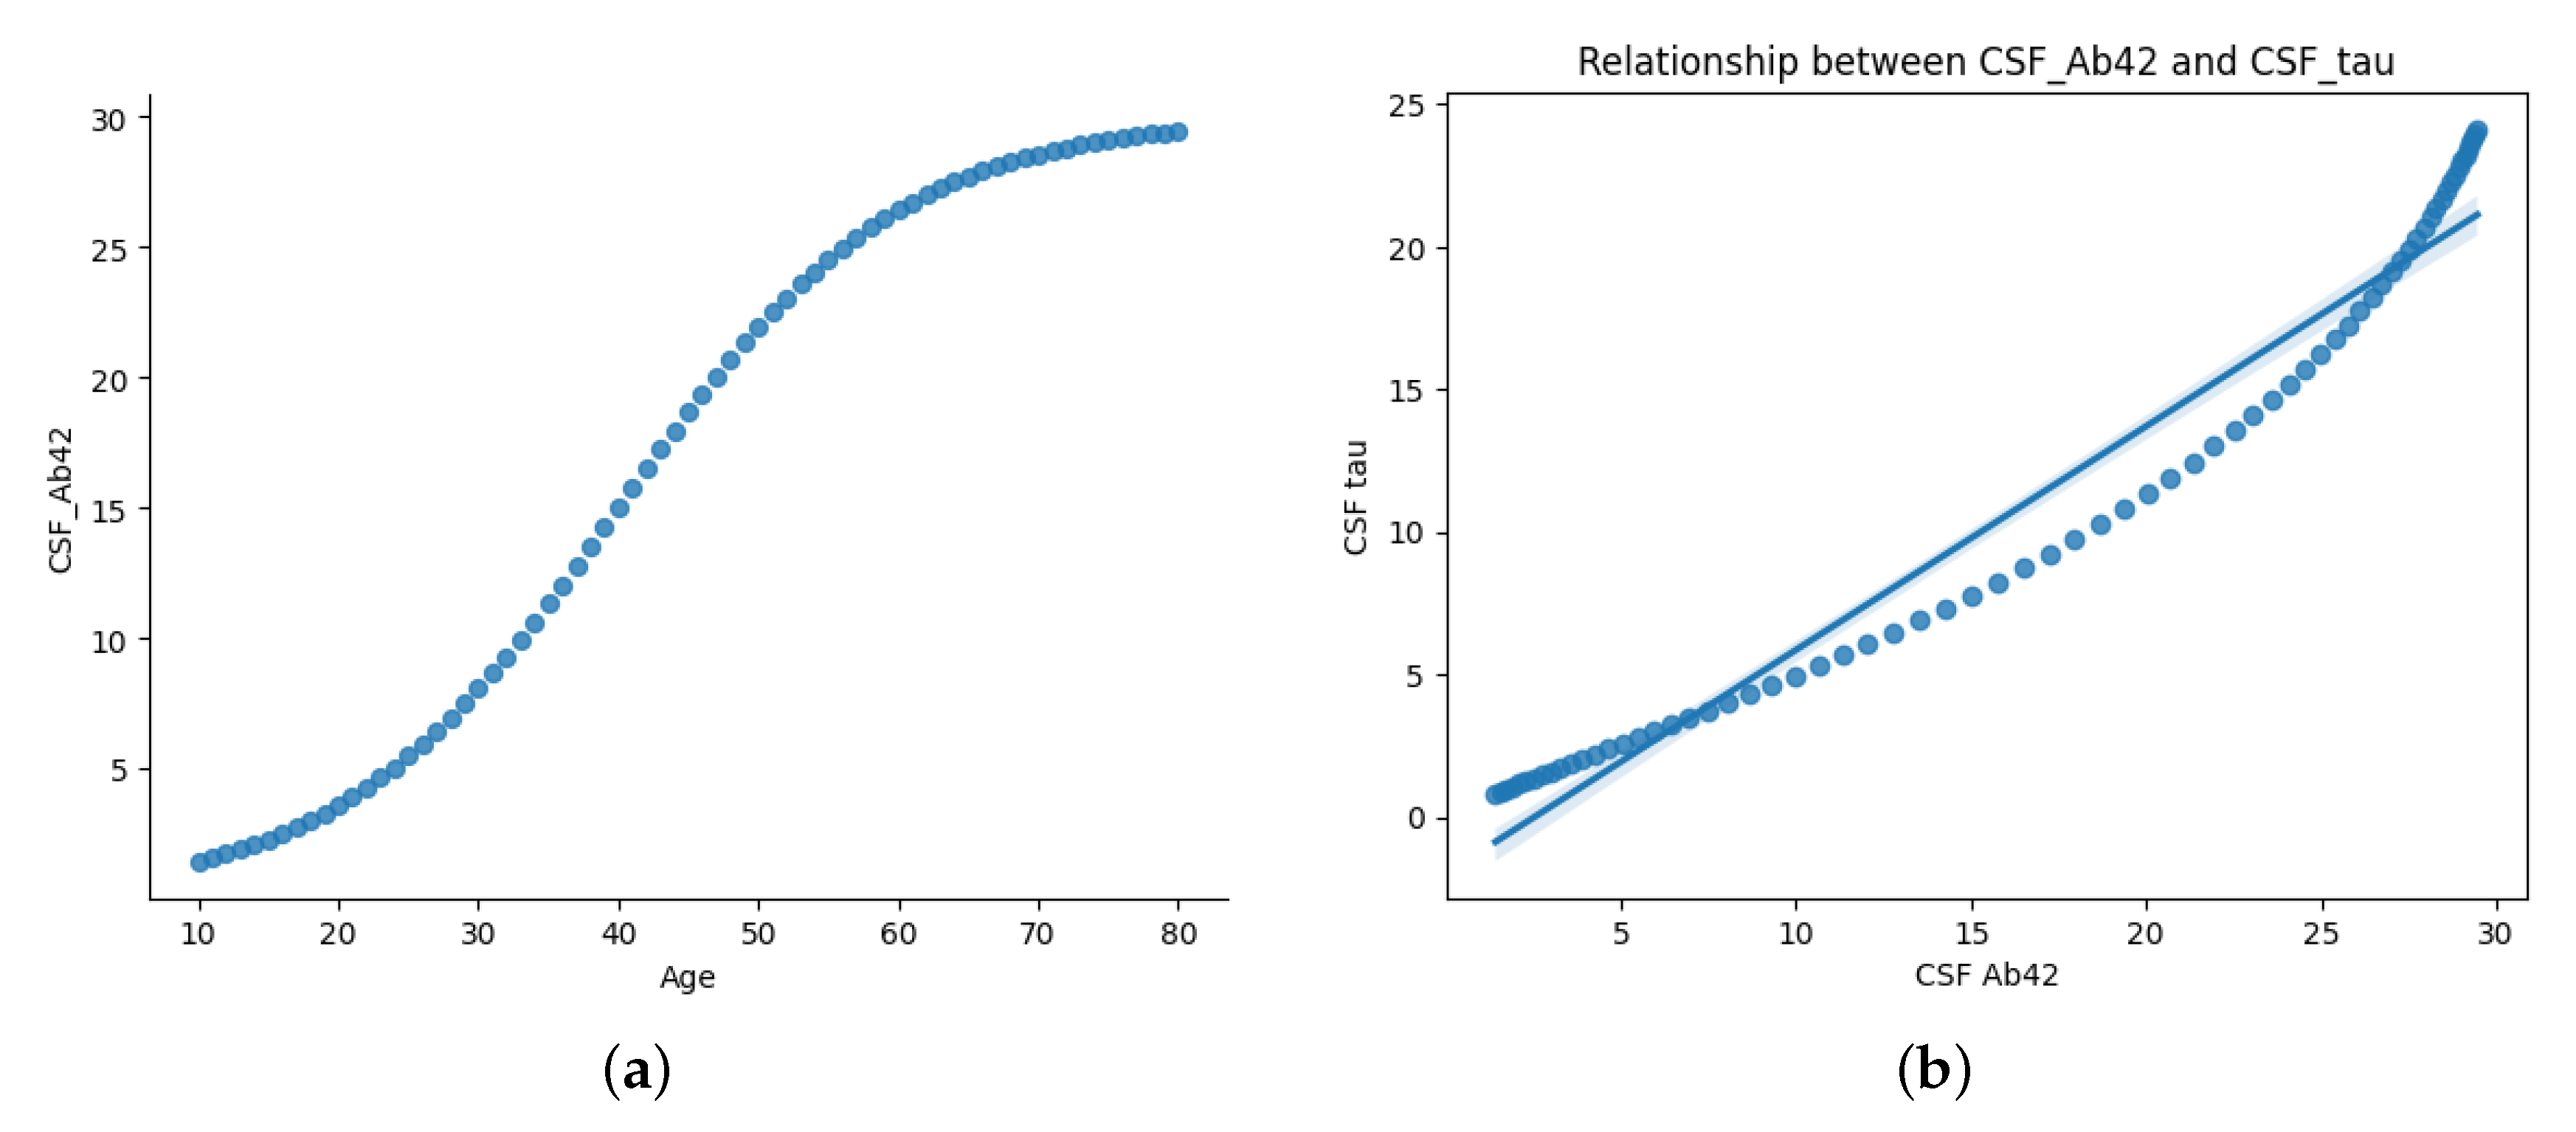
Furthermore, Figure 2 illustrate two key relationships in the dataset. Figure 2a presents the age-dependent trajectory of CSF A levels, displaying a sigmoidal trend. CSF A levels rise gradually during early life (ages 10–30), possibly reflecting normal amyloid metabolism. From midlife (ages 30–60), A levels increase more rapidly, potentially indicating changes in amyloid clearance efficiency. Levels plateau in later years (60+), likely due to reduced clearance or plaque accumulation in brain tissues.
This trajectory aligns with established AD biomarker models, where CSF A concentrations decline in individuals with amyloid pathology [5,16,21].
Figure 2b highlights the correlation between CSF A and CSF Tau levels. The scatter plot and regression line reveal an inverse relationship: as CSF A decreases, CSF Tau increases sharply. This supports the hypothesis that amyloid deposition (low A) is linked to neurodegeneration (elevated Tau), both of which are critical to AD progression.
Applying predefined medical thresholds, Section 2.1 provides clear cutoffs for biomarker levels, enabling the classification of cognitive states (Figure 3). This visualization traces biomarker trajectories across the lifespan, highlighting cognitive risk zones. The shaded backgrounds (green, yellow, orange, and red) indicate transitions from normal cognitive function to mild cognitive impairment (MCI). With increasing age, deviations in biomarker levels become more pronounced, particularly in individuals transitioning into high-risk or MCI categories.
These cognitive risk zones are defined as:
- (1)
- Normal: Biomarker levels within safe physiological ranges
- (2)
- mild Risk: Slightly elevated biomarker levels indicating potential early changes
- (3)
- High Risk: Significant biomarker abnormalities but without formal clinical diagnosis
- (4)
- MCI (Mild Cognitive Impairment): Biomarker levels exceed critical thresholds indicating cognitive deterioration
As illustrated, CSF A (purple) declines sharply with age, while Amyloid PET (red), CSF Tau (yellow), and MRI + FDG PET (blue) show progressive increases. The green cognitive impairment curve mirrors this upward trend, reinforcing the relationship between biomarker deviations and cognitive decline.
Figure 4 models the progression of cognitive impairment as a function of age, segmented into cognitive risk categories. Data points, color-coded by risk level, reveal a nonlinear increase in cognitive impairment over time. Initially, most individuals remain in the normal range (blue). As age advances, the probability of transitioning into mild-risk (orange), high-risk (green), and MCI (red) increases significantly.
The trajectory indicates a critical period around midlife (50–60 years), where cognitive risk accelerates sharply. This observation aligns with neurodegenerative models suggesting that biological and cognitive reserves initially buffer against decline until cumulative damage leads to rapid deterioration.
These findings emphasize the importance of early detection and monitoring. Individuals classified as mild-risk still represent a key intervention window where preventive strategies could delay or mitigate progression. Integrating machine learning techniques could further enhance this model by identifying subtle early indicators of cognitive impairment.
Considering Figure 3 and Figure 4, the central research question emerges: What biomarker values can individuals aged 30–40 (and 40-50) maintain to remain within the safe (green) zone for healthy AD-free old age? Or put it in another way, what thresholds signal progression toward mild or high risk of developing Alzheimer’s disease at an older age?
3. Computational Summation
To answer the final question in the previous section, it is essential to recall/reaffirm the objective of this paper. To achieve this, we restrict and define the potential symptoms of brain atrophy based on cognitive impairment observed in donors.
3.1. Cognitive Impairment
Cognitive impairment was modeled as a weighted sum of biomarker values (CSF , Amyloid PET, CSF Tau, MRI FDG PET), incorporating an exponential scaling factor to account for the accelerated impairment. Since biomarkers contribute linearly to cognitive impairment, an increase in Amyloid PET and CSF Tau elevates the risk, while a decrease in CSF also contributes to increased risk. The terms can be modeled as,
where is the CSF value, which decreases exponentially with age. corresponds to the Amyloid PET value, which increases exponentially with age. represents (CSF Tau), and denotes MRI FDG PET, both of which increase at different rates over time. Such that cognitive impairment can be rewritten as:
Thus, we define the risk zones —Safe, Mild Risk, and Unsafe— using Equation 2, based on the values of the underlying biomarker parameters. Specifically, this equation determines the range of biomarker values an instance aged 30–40, (30-50) must possess to remain safe, be at mild risk, or become unsafe from the disease at an older age. Specifically, the following system of exponential equations explains it succinctly;
where: A represents Age, denotes the cognitive impairment score at age A, and corresponds to the biomarker level at age A. The parameter is the weight coefficient that determines the contribution of each biomarker value to cognitive impairment. The parameters and are scaling factors of [22], where cognitive decline is modeled by the exponential function , capturing the accelerated progression of impairment with aging.
Safe zone holds when CSF dominates over other biomarkers and remains high, and Amyloid PET, CSF Tau, and MRI FDG PET remain below mild risk levels. A mild Zone occurs if CSF declines slightly, but Amyloid PET and CSF Tau rise moderately (perhaps accounting for the early onset of AD). The evidence for an Unsafe Zone is given by a significant drop of CSF and Amyloid PET, CSF Tau, and MRI FDG PET reach high threshold levels. Referencing Section 2.1, we conclude that , and within 30-40 age bracket and respectively 4, and 7 for 40-50 years age bracket.
4. Model Output and Cognitive Risk Zone Classification
We leveraged ChatGPT [25] to generate a synthetic dataset containing 150 instances for testing (Due to the challenge of acquiring heterogeneous real-world datasets) and computed the Cognitive Impairment (CI) score for each instance using Equation 2. Each instance was then classified into its respective cognitive risk zone based on the thresholds defined in Equations (3)–(), with an example of the classification summarized in Table 2.
The model output produced age-specific CI risk bands (Table 3), guided by strict threshold templates; Table 4, Table 5 and Table 6. Notably, risk classification dynamically references the age-specific intervals during CI analysis — failure to do so would result in overestimating risk in younger individuals and underestimating it in older ones. This age-specific risk distribution is further visualized in Figure 5.
The 30–40 age group applies the strictest thresholds, reflecting the expectation of relatively healthy biomarkers. In contrast, the 40–50 age group tolerates mild biomarker deviations, shifting the "Safe" range upward. The 50–60 age group follows a similar trend, reflecting normal biomarker drift with aging.
Key observations from the model analysis include:
- (1)
- Higher CSF levels are protective, reducing the cognitive risk score.
- (2)
- Elevated Amyloid PET and Tau levels increase the CI score, indicating greater neurodegenerative risk.
- (3)
- Age contributes exponentially, but moderately, due to the model’s exponential scaling component.
Notably, MRI scan results can reveal structural brain changes, including mild parietal or temporal lobe atrophy, cortical thinning, white matter lesions, or hippocampal volume loss. The model identified 17 instances classified within the mild-risk zone. Next, we examine six representative mild-risk cases to gain deeper simultaneous insights into biomarker patterns and cognitive risk profiles in the next section.
Our model further supports retrospective analysis of disease trajectories, providing estimates of the optimal intervention window. This is particularly valuable for aged donors already exhibiting Alzheimer’s Disease (AD) symptoms, helping to infer when earlier intervention might have slowed disease progression. In such cases, perhaps serving as evidence in support of further aggressive medical attention.
4.1. Discussion of Table 2: Sample Classification Results of Selected Instances with CI Scores and Risk Zones
Table 2 presents the classification of eight sampled instances based on their biomarker values, computed Cognitive Impairment (CI) scores, and assigned cognitive risk zones according to the model’s age-specific thresholds.
Key Observations:
- (1)
- Higher CSF values are associated with lower Cognitive Impairment (CI) scores and safer classifications. For instance, the 53-year-old individual exhibits the highest CSF level (516.39 pg/mL), which corresponds to a low CI score of 3.21 and a Safe classification, despite moderate Tau levels. This observation highlights the protective role of CSF , where higher levels reduce cognitive risk, while lower CSF levels are indicative of amyloid plaque formation and increased risk of Alzheimer’s Disease.
- (2)
- The 40-year-old instance exhibits high Amyloid PET (19.13) and elevated MRI FDG-PET (14.58) values. Despite being relatively young, this drives its CI to 3.37, placing it in the Mild Risk zone due to age-specific stricter thresholds for younger adults. Similarly, higher CSF Tau levels (e.g., 411.34 in Age 47) contribute to Mild Risk classification. Reiterating that Elevated Amyloid PET and Tau Drive Risk Upward.
- (3)
- Notice the Age-Specific Sensitivityto biomarker deviations. For example, the 34 and 39-year-old instances fall into the Mild Risk zone even with moderate biomarker levels. This reflects the model’s stricter criteria for younger adults, where any abnormal biomarker deviation is penalized more heavily. Older individuals (47–58) tolerate similar or higher biomarker values but remain classified as Safe or Mild Risk due to relaxed thresholds.
- (4)
- Elevated MRI FDG-PET (metabolic changes) values are seen in Mild Risk cases, especially in the 40-year-old (14.58), suggesting early structural/metabolic brain changes contributing to increased cognitive risk.
- (5)
- Overall, safe cases maintain CI below 4 (Ages 58 and 53). Mild Risk cases occupy the CI range of 3.37 to 5.35, with no instances classified as Unsafe in this sample.
5. Conclusions
This research presents a computational modeling framework designed to explore and predict the early onset of Alzheimer’s Disease (AD) in younger adults, decades before the manifestation of clinical symptoms. By leveraging sigmoid-based data generation and cognitive impairment modeling, the study simulates non-linear biomarker trajectories that align with known patterns of disease progression.
Through the development of age-adjusted cognitive risk zones, the model provides a quantifiable system for classifying individuals based on biomarker deviations and their impact on cognitive decline. Notably, higher CSF levels consistently demonstrated a protective effect, while elevated Amyloid PET and Tau levels correlated with increased cognitive impairment scores. These findings underscore the importance of integrating age-specific thresholds to prevent over- or under-estimation of cognitive risk across different age groups.
A key contribution of this work is its focus on pre-symptomatic risk detection using computational methods. The framework enables researchers to model early disease trajectories and offers clinicians a tool for identifying individuals who may benefit from timely preventive interventions. Importantly, the model’s flexibility allows for future expansion to incorporate genetic factors, neuroimaging metrics, and lifestyle variables, enhancing its applicability in clinical settings.
Future directions include validating the framework with longitudinal real-world datasets, enhancing predictive accuracy using machine learning architectures such as recurrent neural networks, and applying explainability tools to interpret feature contributions. Additionally, integrating digital twin simulations could further personalize risk assessments and support precision treatment planning.
Overall, this research demonstrates the potential of computational modeling to bridge the gap between complex biomarker dynamics and early diagnostic opportunities in Alzheimer’s Disease. By establishing a robust mathematical and statistical foundation, this work contributes to advancing precision medicine approaches in neurodegenerative disease research and clinical care.
References
- Alzheimer’s Association. (Accessed March 2025) 2024 Alzheimer’s Disease Facts and Figures. Retrieved from. Available online: https://www.alz.org/alzheimers-dementia/facts-figures.
- Zhang, X. X., Tian, Y., Wang, Z. T., Ma, Y. H., Tan, L., & Yu, J. T. (2021). The epidemiology of Alzheimer’s disease modifiable risk factors and prevention. The journal of prevention of Alzheimer’s disease, 8(3), 313-321.
- Nianogo, R. A., Rosenwohl-Mack, A., Yaffe, K., Carrasco, A., Hoffmann, C. M., & Barnes, D. E. (2022). Risk factors associated with Alzheimer disease and related dementias by sex and race and ethnicity in the US. JAMA neurology, 79(6), 584-591.
- Scheltens, P., De Strooper, B., Kivipelto, M., Holstege, H., Chételat, G., Teunissen, C. E., ... & van der Flier, W. M. (2021). Alzheimer’s disease. The Lancet, 397(10284), 1577-1590.
- Malpetti, M., La Joie, R., & Rabinovici, G. D. (2022). Tau beats amyloid in predicting brain atrophy in Alzheimer disease: implications for prognosis and clinical trials. Journal of Nuclear Medicine, 63(6), 830.
- Lerch, O., Ferreira, D., Stomrud, E., van Westen, D., Tideman, P., Palmqvist, S., ... & Westman, E. (2024). Predicting progression from subjective cognitive decline to mild cognitive impairment or dementia based on brain atrophy patterns. Alzheimer’s Research & Therapy, 16(1), 153.
- Liss, J. L., Seleri Assunção, S., Cummings, J., Atri, A., Geldmacher, D. S., Candela, S. F., ... & Sabbagh, M. N. (2021). Practical recommendations for timely, accurate diagnosis of symptomatic Alzheimer’s disease (MCI and dementia) in primary care: a review and synthesis. Journal of Internal Medicine, 290(2), 310-334.
- Kale, M. B., Wankhede, N. L., Pawar, R. S., Ballal, S., Kumawat, R., Goswami, M., ... & Koppula, S. (2024). AI-driven innovations in Alzheimer’s disease: Integrating early diagnosis, personalized treatment, and prognostic modeling. Ageing Research Reviews, 102497.
- Galvin, J. E., Aisen, P., Langbaum, J. B., Rodriguez, E., Sabbagh, M., Stefanacci, R., ... & Rubino, I. (2021). Early stages of Alzheimer’s disease: evolving the care team for optimal patient management. Frontiers in neurology, 11, 592302.
- Blennow K, Zetterberg H. Biomarkers for Alzheimer’s disease: current status and prospects for the future. J Intern Med. 2018 Dec;284(6):643-663. Epub 2018 Aug 19. [CrossRef] [PubMed]
- Jack CR Jr, Bennett DA, Blennow K, Carrillo MC, Dunn B, Haeberlein SB, Holtzman DM, Jagust W, Jessen F, Karlawish J, Liu E, Molinuevo JL, Montine T, Phelps C, Rankin KP, Rowe CC, Scheltens P, Siemers E, Snyder HM, Sperling R; Contributors. NIA-AA Research Framework: Toward a biological definition of Alzheimer’s disease. Alzheimers Dement. 2018 Apr;14(4):535-562. [CrossRef] [PubMed] [PubMed Central]
- Jack CR Jr, Knopman DS, Jagust WJ, Petersen RC, Weiner MW, Aisen PS, Shaw LM, Vemuri P, Wiste HJ, Weigand SD, Lesnick TG, Pankratz VS, Donohue MC, Trojanowski JQ. (2010). Tracking pathophysiological processes in Alzheimer’s disease: an updated hypothetical model of dynamic changes in biomarkers. The Lancet Neurology, 9(10), 1146-1157.
- Blennow K, Zetterberg H, Fagan AM. Fluid biomarkers in Alzheimer disease. Cold Spring Harb Perspect Med. 2012 Sep 1;2(9):a006221. [CrossRef] [PubMed] [PubMed Central]
- Palmqvist S, Schöll M, Strandberg O, Mattsson N, Stomrud E, Zetterberg H, Blennow K, Landau S, Jagust W, Hansson O. Earliest accumulation of β-amyloid occurs within the default-mode network and concurrently affects brain connectivity. Nat Commun. 2017 Oct 31;8(1):1214. [CrossRef] [PubMed] [PubMed Central]
- Palmqvist S, Zetterberg H, Mattsson N, Johansson P; Alzheimer’s Disease Neuroimaging Initiative; Minthon L, Blennow K, Olsson M, Hansson O; Swedish BioFINDER Study Group. Detailed comparison of amyloid PET and CSF biomarkers for identifying early Alzheimer disease. Neurology. 2015 Oct 6;85(14):1240-9. Epub 2015 Sep 9. [CrossRef] [PubMed] [PubMed Central]
- Holtzman, D. M. (2011). CSF biomarkers for Alzheimer’s disease: Current utility and potential future use. Neurobiology of Aging, 32(Suppl 1), S4-S9. [CrossRef]
- Strozyk D, Blennow K, White LR, Launer LJ. CSF Abeta 42 levels correlate with amyloid-neuropathology in a population-based autopsy study. Neurology 2003; 60: 652–56.
- Visser, P. J., Reus, L. M., Gobom, J., et al. (2022). Cerebrospinal fluid tau levels are associated with abnormal neuronal plasticity markers in Alzheimer’s disease. Molecular Neurodegeneration, 17(27). [CrossRef]
- Hajjar, I., Yang, Z., Okafor, M., Liu, C., Waligorska, T., Goldstein, F. C., & Shaw, L. M. (2022). Association of plasma and cerebrospinal fluid Alzheimer disease biomarkers with race and the role of genetic ancestry, vascular comorbidities, and neighborhood factors. JAMA Network Open, 5(10), e2235068-e2235068.
- Calcagno, A., Cusato, J., Cinque, P., Marchetti, G., Bernasconi, D., Trunfio, M., ... & Nozza, S. (2024). Serum and CSF biomarkers in asymptomatic patients during primary HIV infection: a randomized study. Brain, 147(11), 3742-3750.
- Vosoughi, Armin et al. Mathematical Models to Shed Light on Amyloid-Beta and Tau Protein Dependent Pathologies in Alzheimer’s Disease Neuroscience, Volume 424, 45 - 57.
- Gong, H.; Li, Y.; Zhang, J.; Zhang, B.; Wang, X. (2024). A new filter feature selection algorithm for classification task by ensembling pearson correlation coefficient and mutual information. Engineering Applications of Artificial Intelligence, 131, 107865.
- Gustafson DR, Skoog I, Rosengren L, Zetterberg H, Blennow K. Cerebrospinal fluid beta-amyloid 1-42 concentration may predict cognitive decline in older women. J Neurol Neurosurg Psychiatry. 2007 May;78(5):461-4. Epub 2006 Nov 10. [CrossRef] [PubMed] [PubMed Central]
- Dubois B, Villain N, Frisoni GB, Rabinovici GD, Sabbagh M, Cappa S, Bejanin A, Bombois S, Epelbaum S, Teichmann M, Habert MO, Nordberg A, Blennow K, Galasko D, Stern Y, Rowe CC, Salloway S, Schneider LS, Cummings JL, Feldman HH. Clinical diagnosis of Alzheimer’s disease: recommendations of the International Working Group. Lancet Neurol. 2021 Jun;20(6):484-496. Epub 2021 Apr 29. [CrossRef] [PubMed] [PubMed Central]
- OpenAI. (2025). ChatGPT 4o [Large language model]. Available online: https://chat.openai.
Figure 1.
Conceptual diagram illustrating computational framework for Alzheimer’s Disease risk prediction. It captures Biomarker Data → Simulation → Risk Zones → Correlative Risk Scoring → Risk Classification.
Figure 1.
Conceptual diagram illustrating computational framework for Alzheimer’s Disease risk prediction. It captures Biomarker Data → Simulation → Risk Zones → Correlative Risk Scoring → Risk Classification.
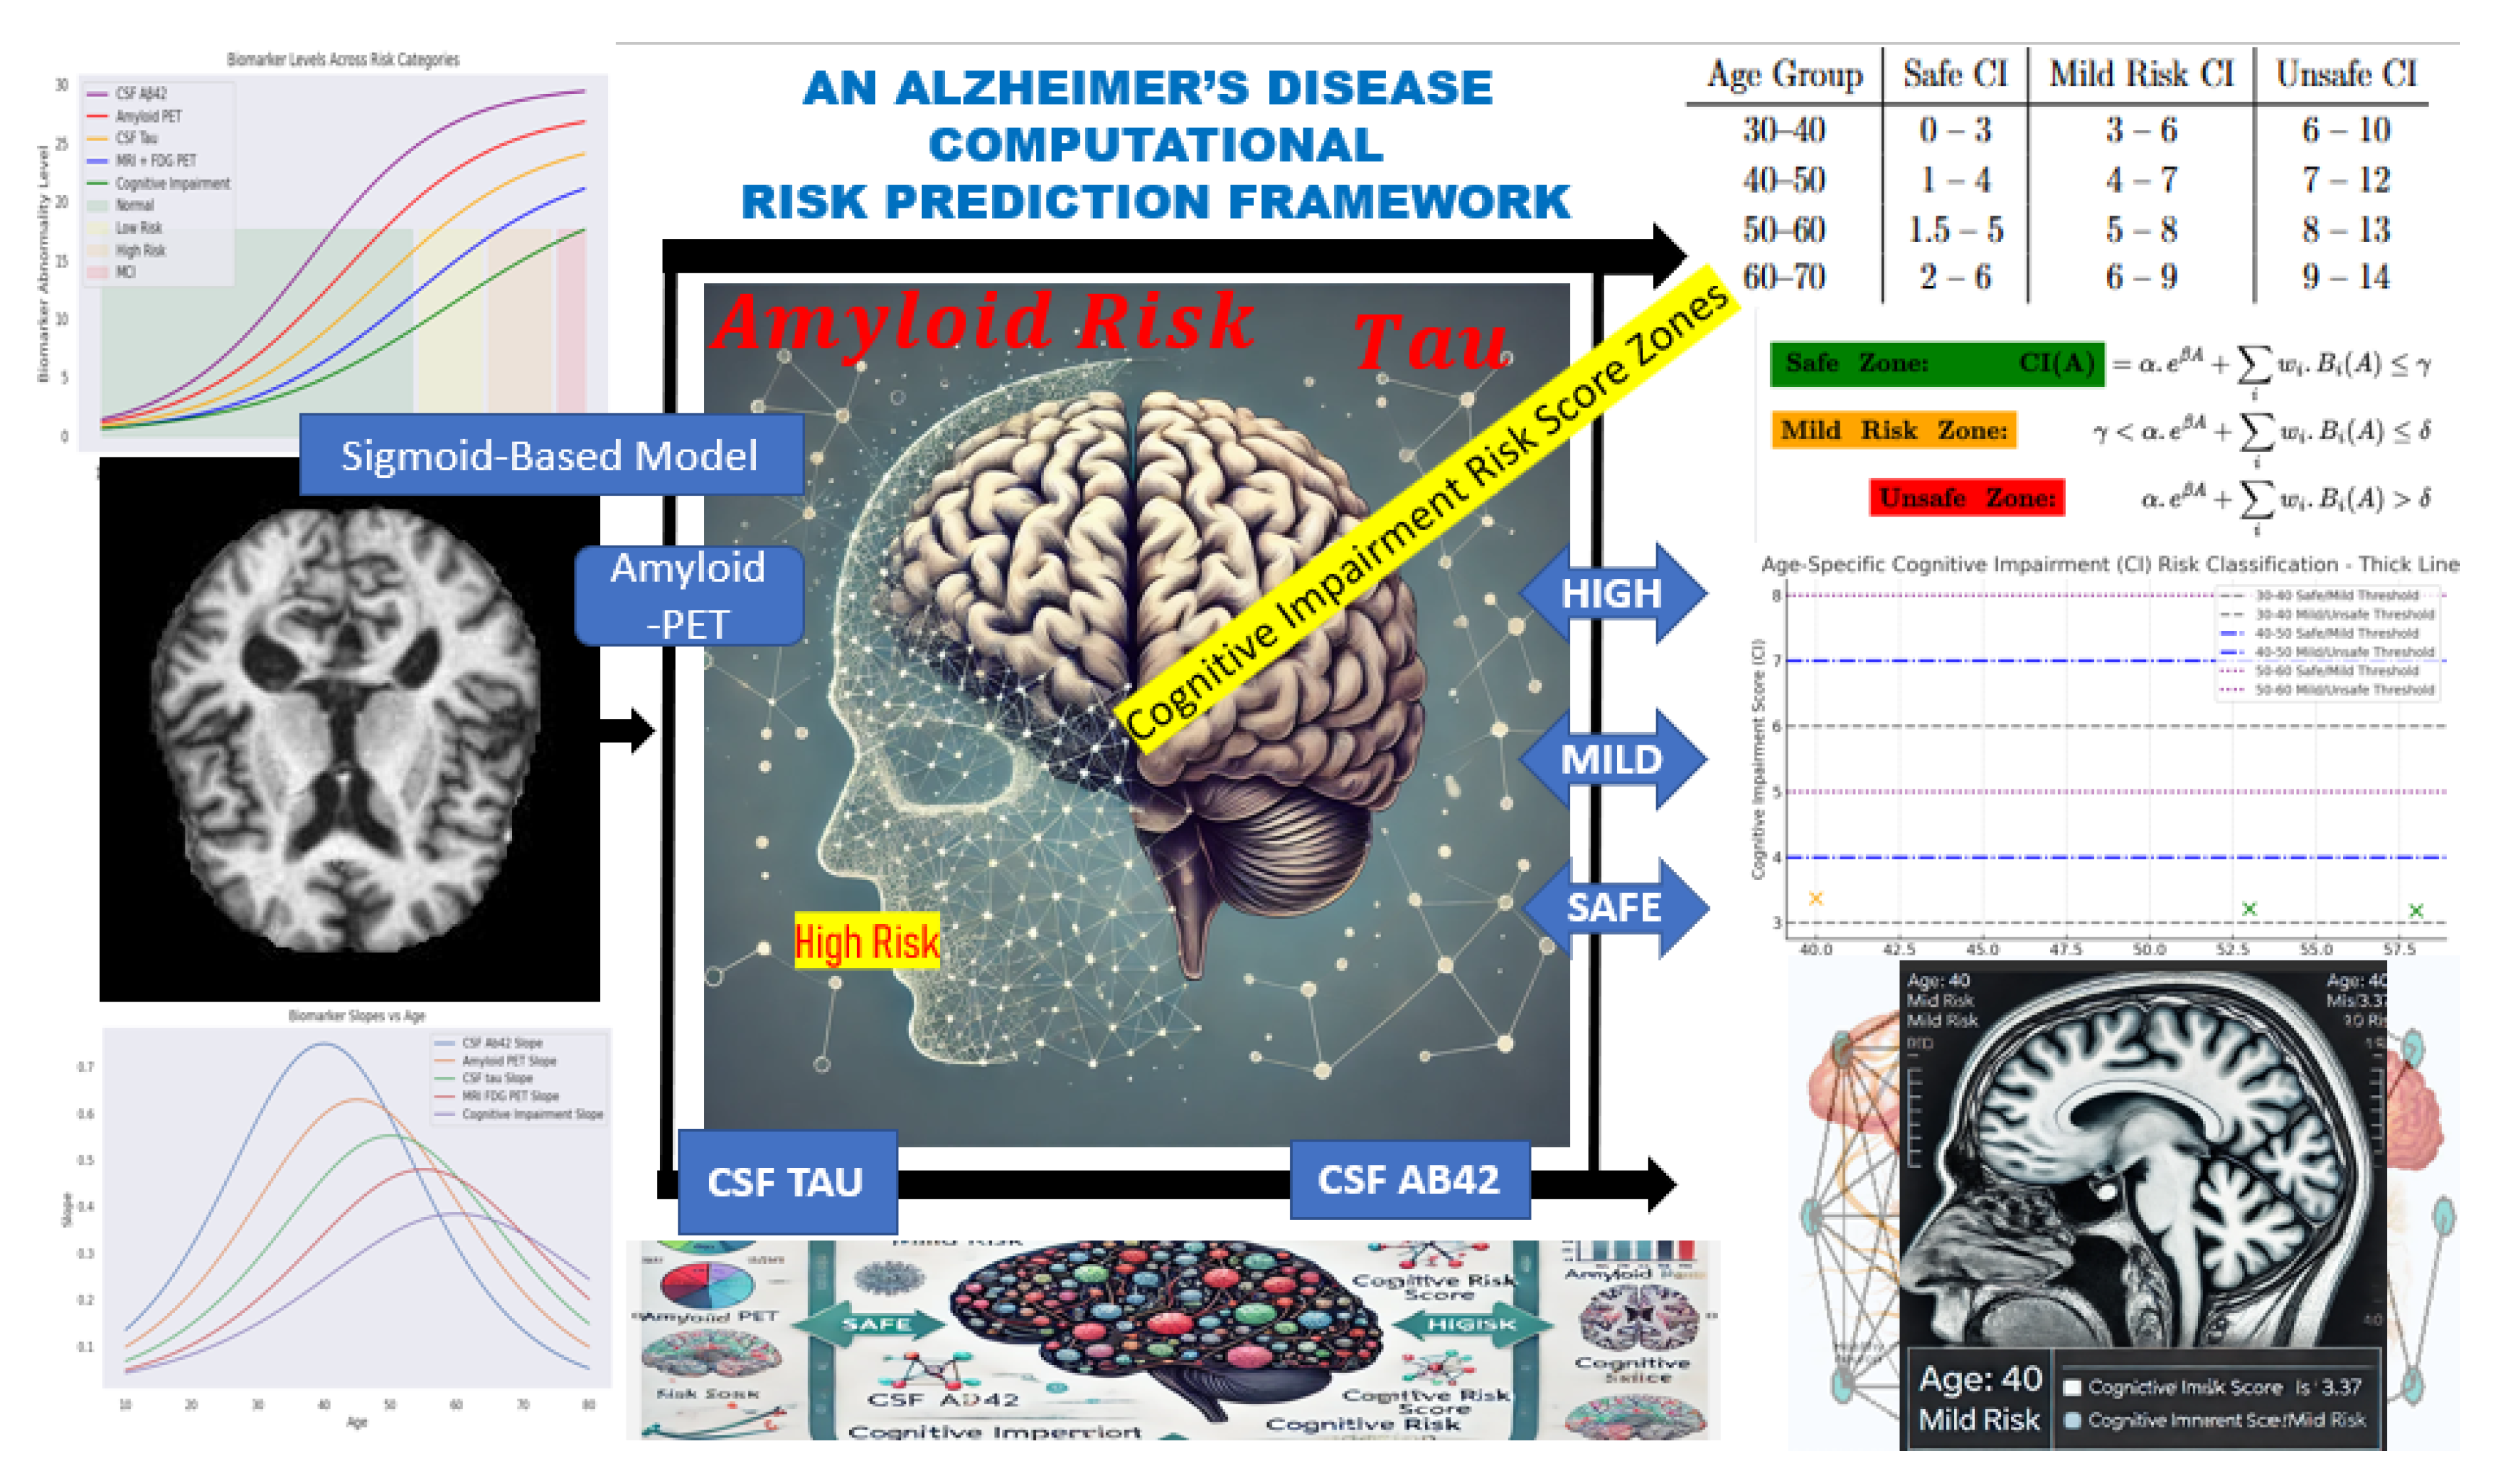
Figure 2.
Age-dependent relationship between CSF A and CSF Tau. (a) Sigmoidal increase in CSF A with age, reflecting key transitions in amyloid metabolism. (b) Correlation plot showing that elevated Tau levels are associated with reduced A, supporting amyloid-driven neurodegeneration in AD.
Figure 2.
Age-dependent relationship between CSF A and CSF Tau. (a) Sigmoidal increase in CSF A with age, reflecting key transitions in amyloid metabolism. (b) Correlation plot showing that elevated Tau levels are associated with reduced A, supporting amyloid-driven neurodegeneration in AD.
| (a) | (b) |
Figure 3.
Age-related biomarker trajectories transformed by sigmoid scaling. CSF A (purple) declines with age, while Amyloid PET, CSF Tau, and MRI + FDG PET levels rise, reflecting the progressive risk of cognitive impairment. Shaded areas indicate transitions between cognitive risk categories.
Figure 3.
Age-related biomarker trajectories transformed by sigmoid scaling. CSF A (purple) declines with age, while Amyloid PET, CSF Tau, and MRI + FDG PET levels rise, reflecting the progressive risk of cognitive impairment. Shaded areas indicate transitions between cognitive risk categories.
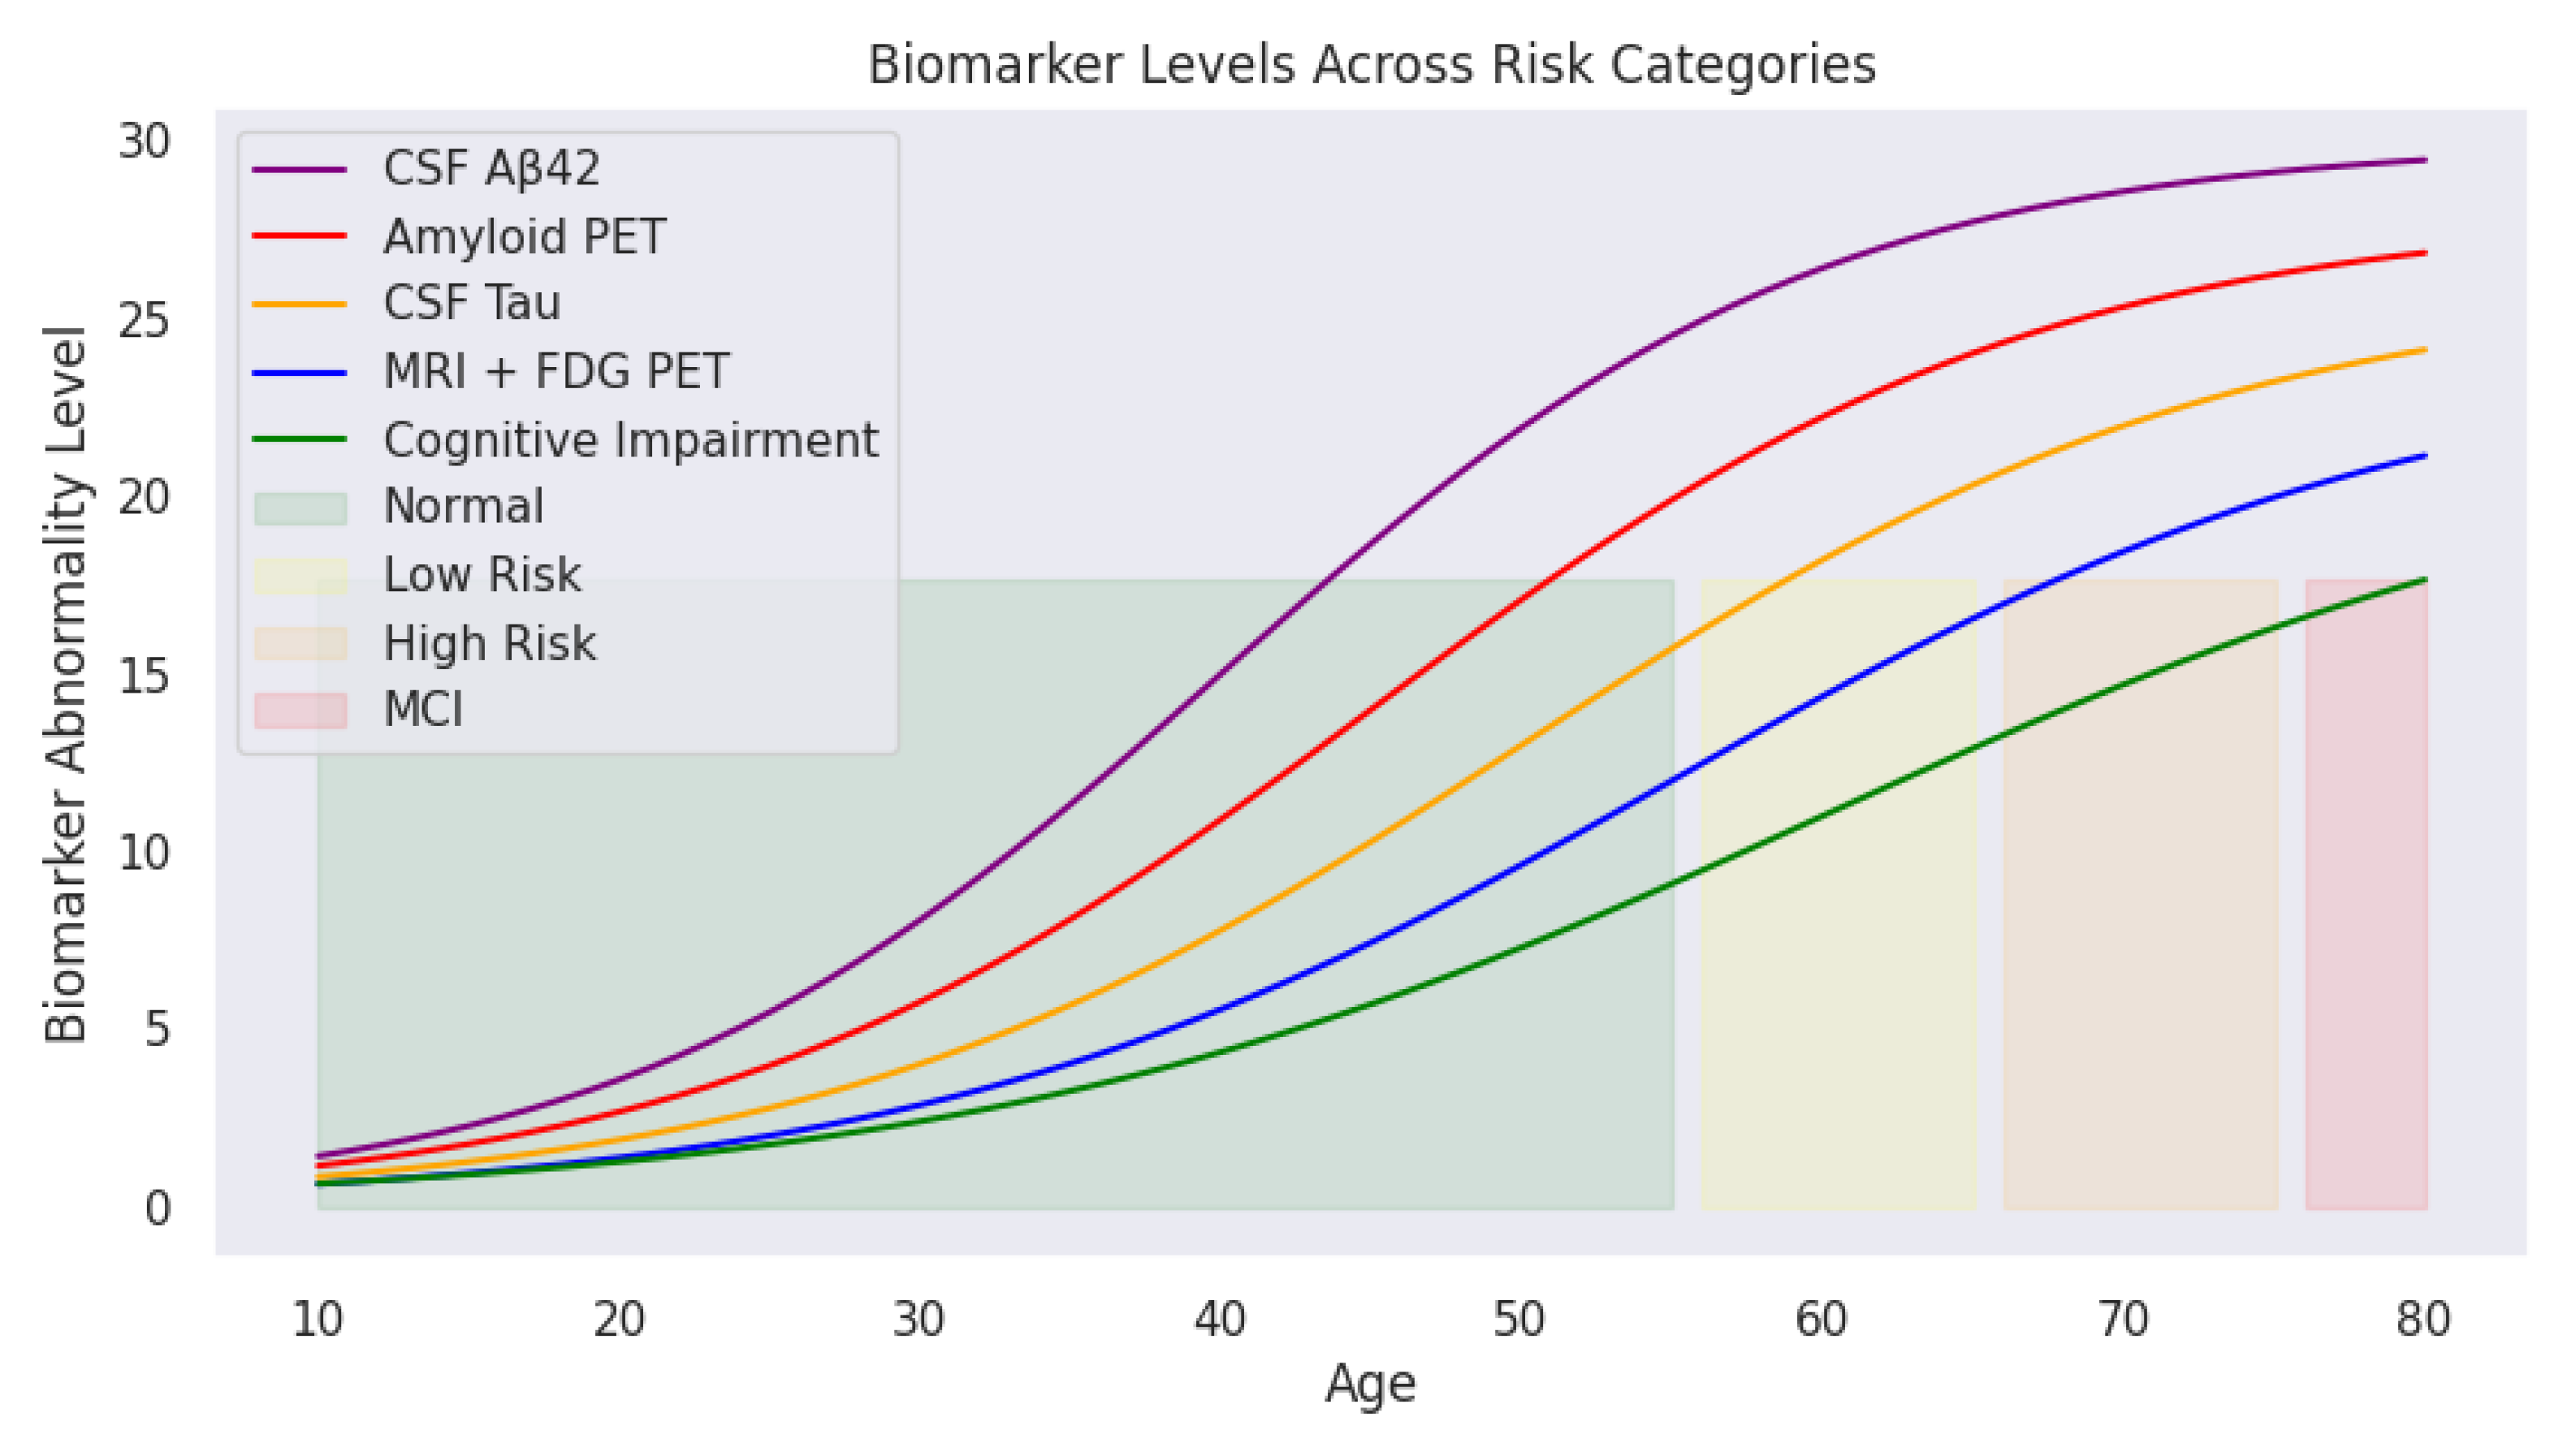
Figure 4.
Cognitive impairment progression over age, color-coded by risk levels. The model shows an initial period of cognitive stability, followed by gradual and then accelerated increases in risk, particularly after age 50.
Figure 4.
Cognitive impairment progression over age, color-coded by risk levels. The model shows an initial period of cognitive stability, followed by gradual and then accelerated increases in risk, particularly after age 50.
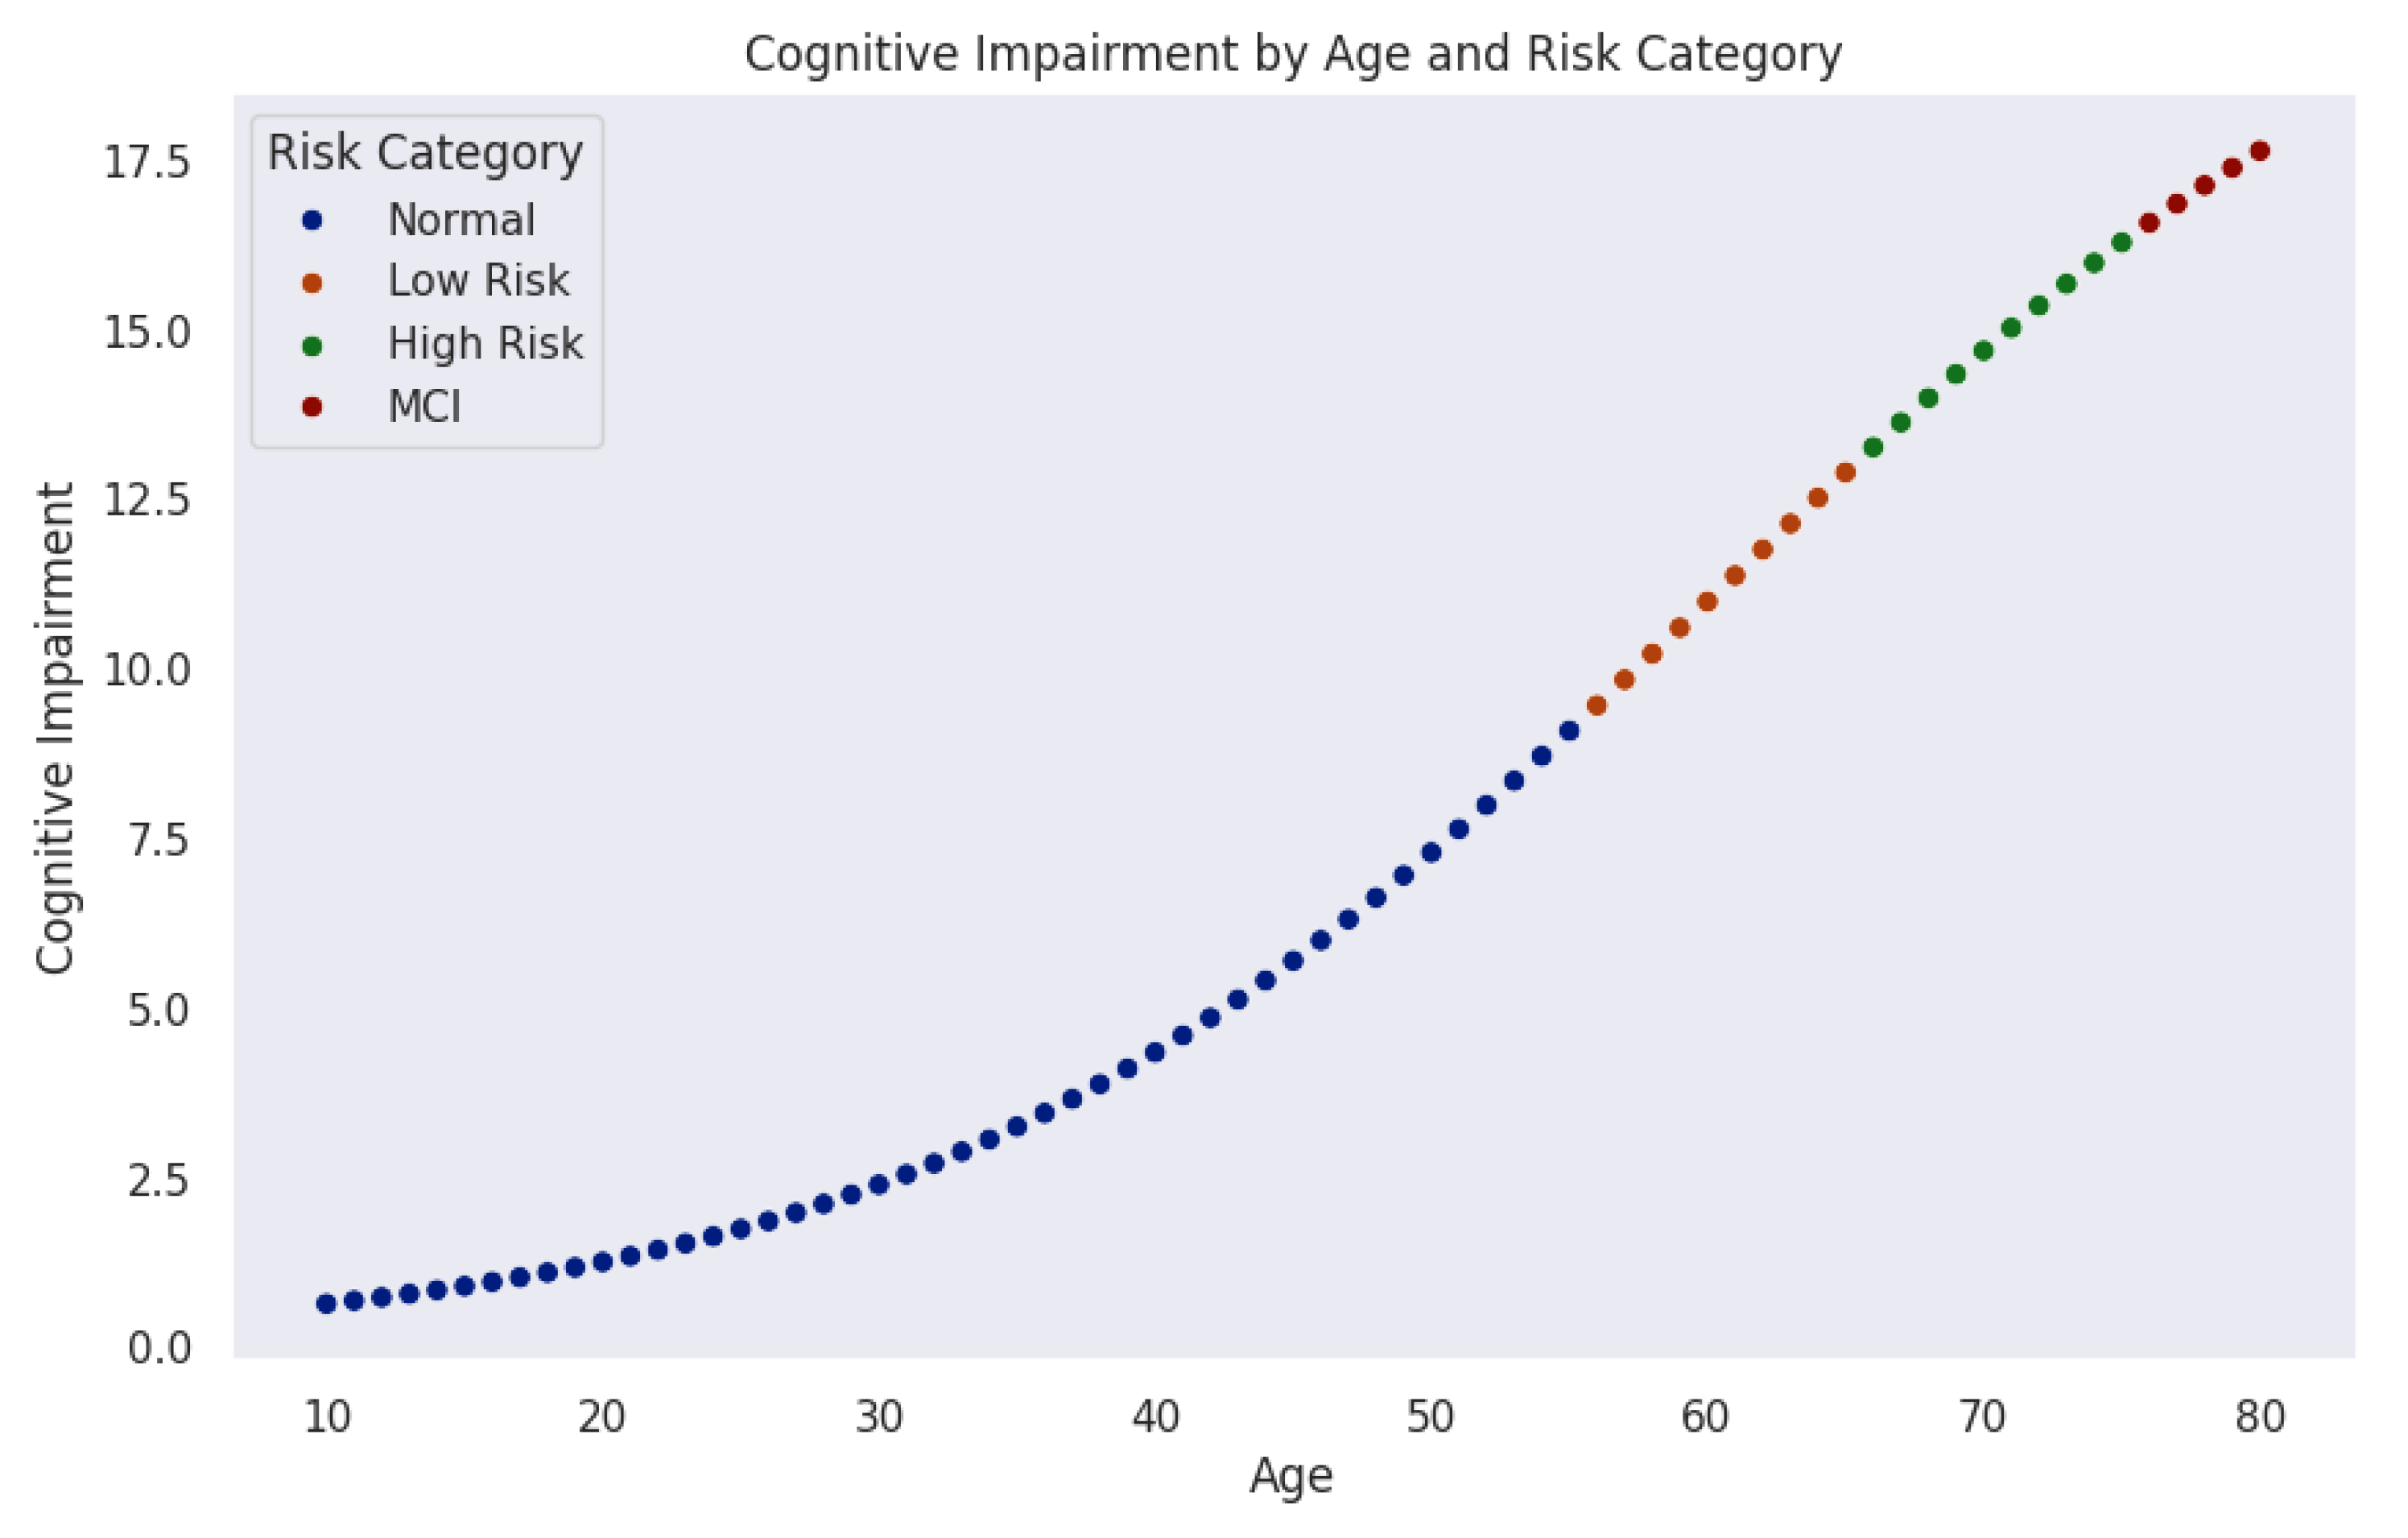
Figure 5.
Visual representation of Cognitive Impairment (CI) scores and age-specific risk thresholds.
Figure 5.
Visual representation of Cognitive Impairment (CI) scores and age-specific risk thresholds.
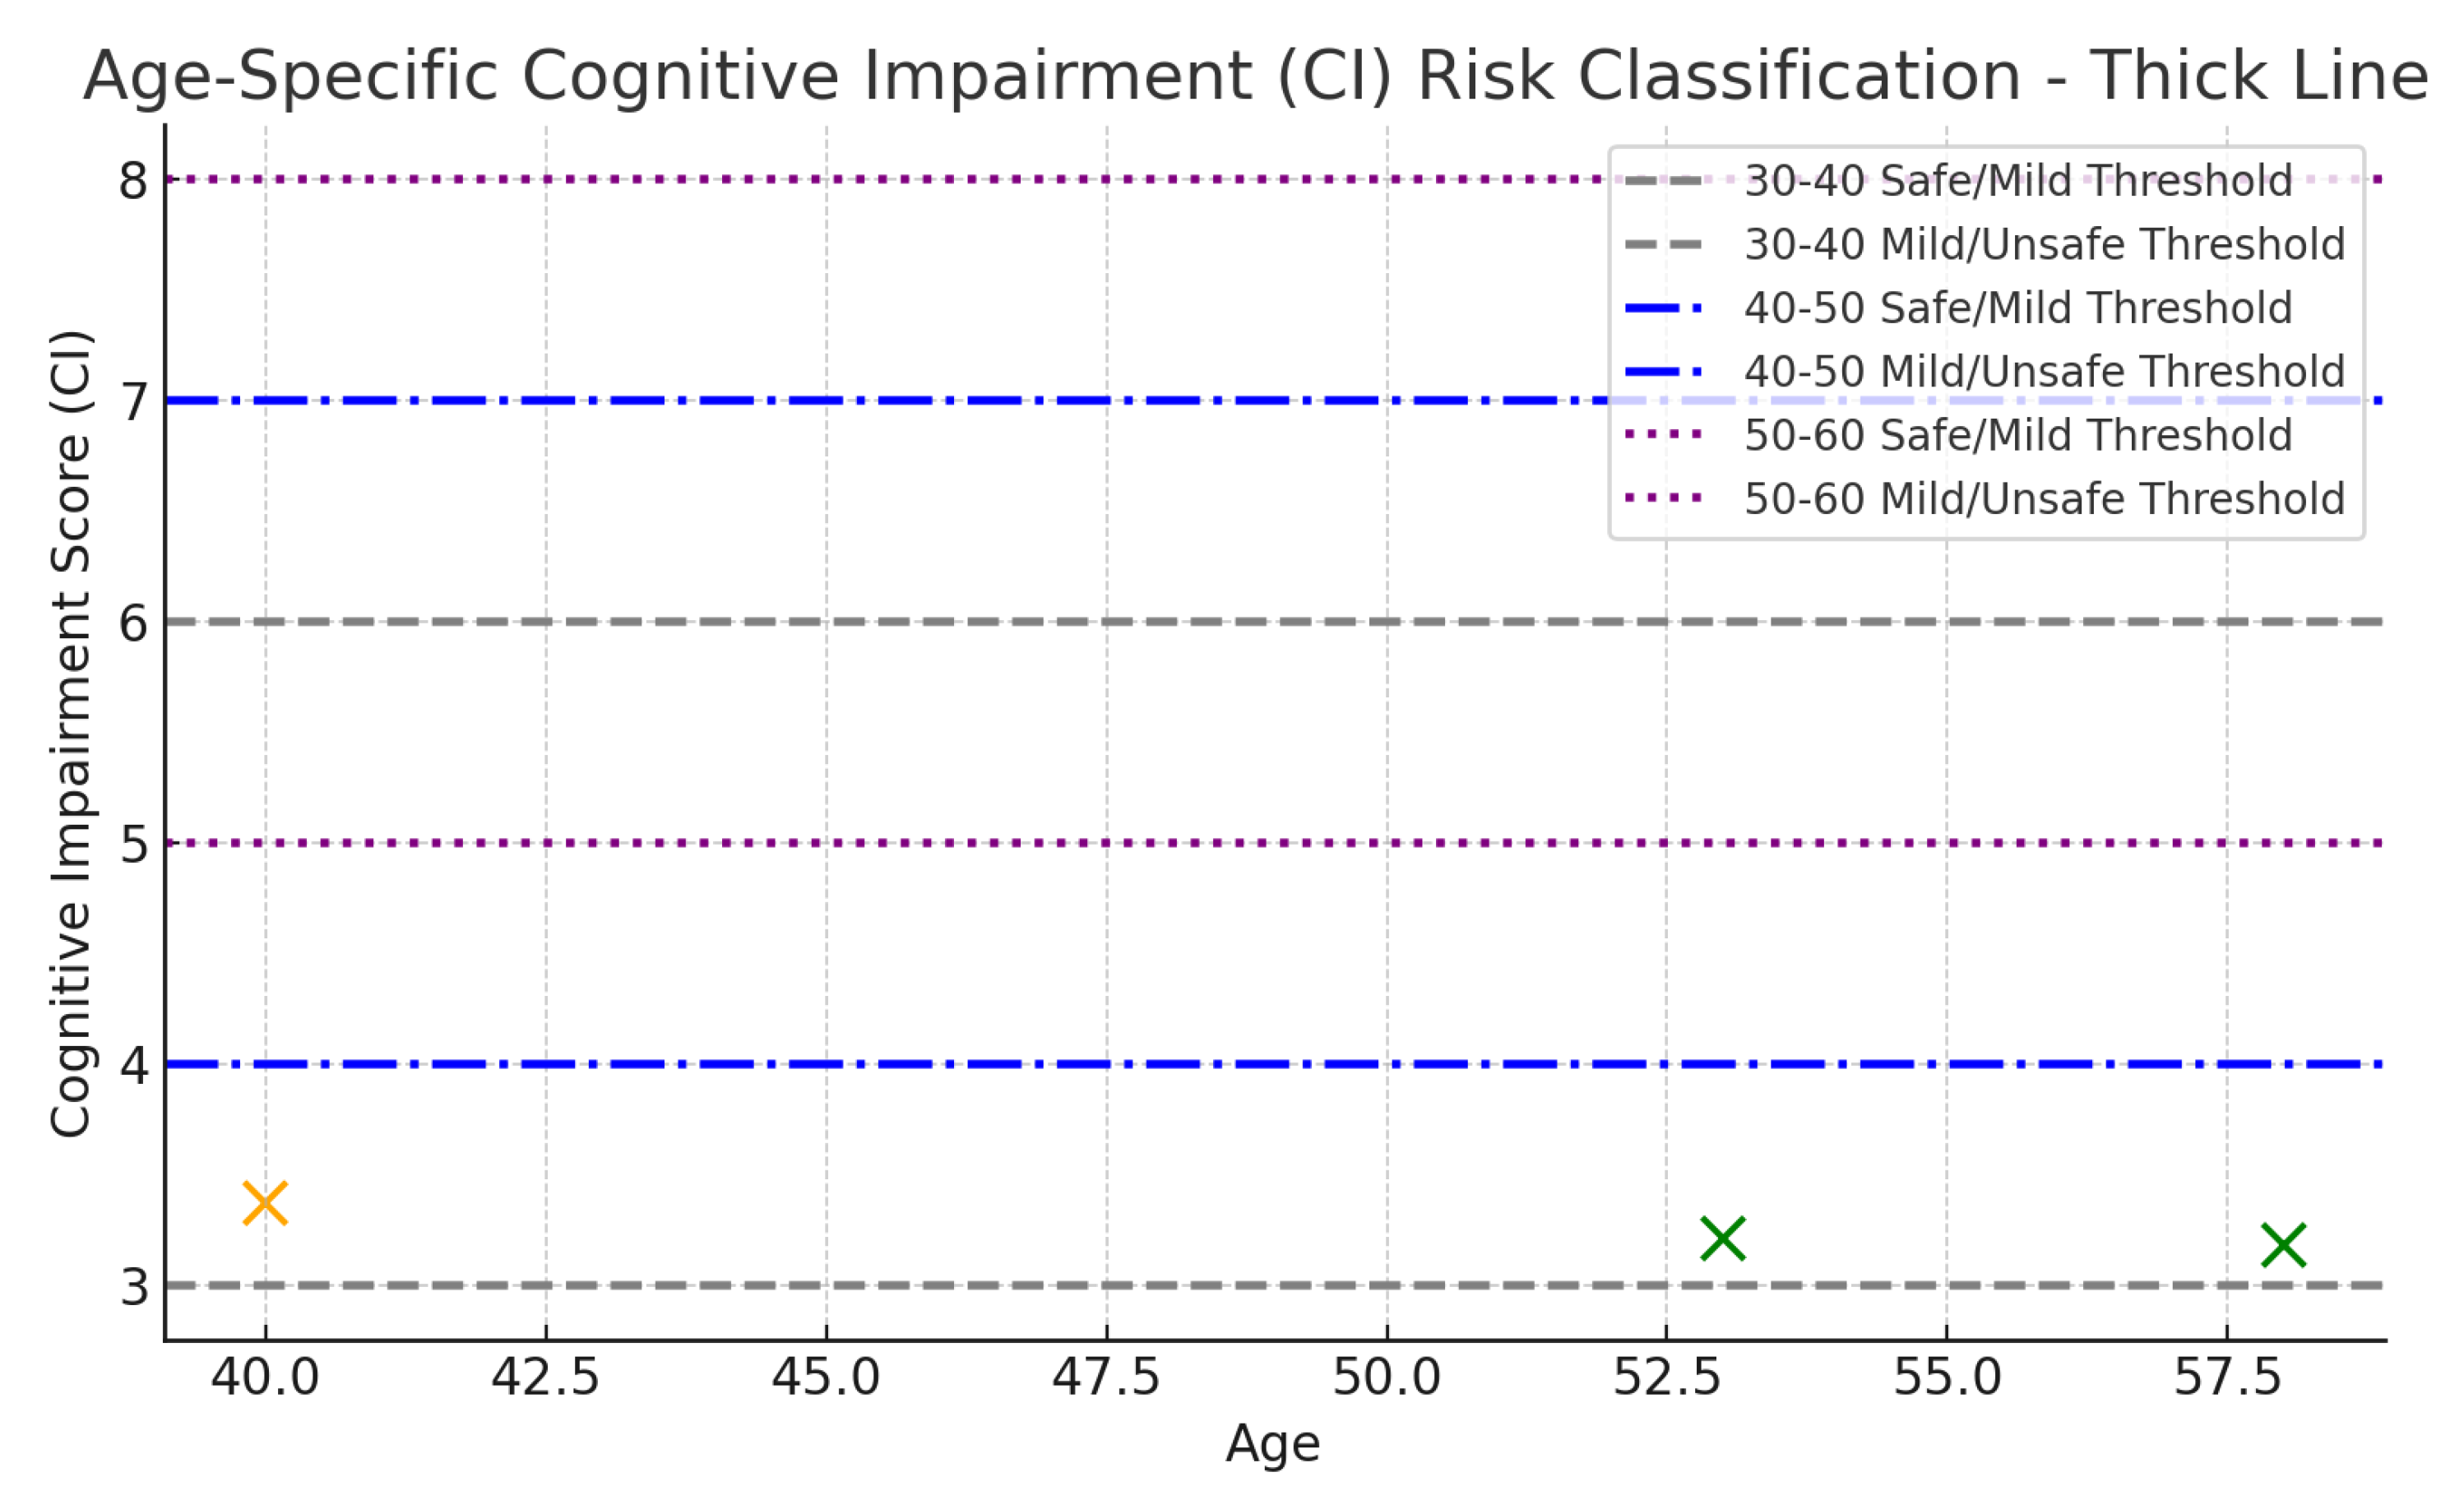

Table 1.
Early Biomarker Progression and Cognitive Assessment in Young Individuals. This table presents a biomarker levels snapshot for individuals. Ages 10 to 110 years were considered, focusing on early-stage Alzheimer’s Disease (AD) risk factors. The dataset includes key cerebrospinal fluid (CSF), neuroimaging biomarkers such as CSF , Amyloid PET, CSF Tau, and MRI FOG PET.
| Age | CSF_Ab42 | Amyloid PET | CSF tau | MRI FOG PET |
|---|---|---|---|---|
| 10 | 1.422776195 | 1.15055579 | 0.839682182 | 0.63837886 |
| 11 | 1.546666892 | 1.251055685 | 0.91156436 | 0.689563902 |
| 12 | 1.719772277 | 1.36639224 | 0.989358424 | 0.74564352 |
| 13 | 1.88920682 | 1.488831819 | 1.073507365 | 0.805661359 |
| 14 | 2.0745661 | 1.60277478 | 1.164480779 | 0.878329193 |
| 15 | 2.225745401 | 1.76235397 | 1.262772013 | 0.033977347 |
| 16 | 2.45188095 | 1.197938204 | 1.368893079 | 1.014954524 |
| 17 | 2.73368883 | 2.085104465 | 1.483419148 | 1.055688099 |
| 18 | 2.995514674 | 2.265577082 | 1.606890123 | 1.188384416 |
| 19 | 3.272046536 | 2.400189615 | 1.739908743 | 1.275627274 |
| 20 | 3.576887651 | 2.666988017 | 1.883888619 | 1.375780022 |
| 21 | 3.003254331 | 2.885211264 | 2.037061649 | 1.48328319 |
| 22 | 4.255311947 | 3.13731708 | 2.202474709 | 1.598592854 |
| 23 | 4.633957953 | 3.396927461 | 2.379885564 | 1.722181014 |
| 24 | 5.03344846 | 3.6748514 | 2.570257903 | 1.885453881 |
| 25 | 5.72765714 | 3.771898817 | 2.773955443 | 1.996147716 |
| 26 | 5.934483343 | 4.288584041 | 2.991735033 | 2.147521424 |
| 27 | 6.4249505099 | 4.625735365 | 3.224238726 | 2.309173001 |
Table 2.
Sample Classification Results of Selected Instances with CI Scores and Risk Zones.
| Age | CSF | Amyloid_PET | CSF_Tau | MRI_FDG_PET | CI | Risk Level |
|---|---|---|---|---|---|---|
| 58 | 428.21 | 14.28 | 382.99 | 6.92 | 3.18 | Safe |
| 40 | 411.53 | 19.13 | 370.31 | 14.58 | 3.37 | Mild Risk |
| 53 | 516.39 | 8.62 | 478.00 | 3.19 | 3.21 | Safe |
| 39 | 413.08 | 14.25 | 403.98 | 6.57 | 4.41 | Mild Risk |
| 34 | 422.18 | 15.37 | 393.98 | 6.55 | 3.62 | Mild Risk |
| 47 | 427.23 | 14.69 | 411.34 | 6.29 | 5.30 | Mild Risk |
| 48 | 419.70 | 14.01 | 414.07 | 6.95 | 4.21 | Mild Risk |
| 50 | 418.06 | 15.26 | 399.28 | 7.18 | 5.35 | Mild Risk |
Table 3.
Age-specific Cognitive Impairment (CI) Risk Bands used for model classification.
| Age Group | Safe CI | Mild Risk CI | Unsafe CI |
|---|---|---|---|
| 30–40 | 0–3 | 3–6 | 6–10 |
| 40–50 | 1–4 | 4–7 | 7–12 |
| 50–60 | 1.5–5 | 5–8 | 8–13 |
| 60–70 | 2–6 | 6–9 | 9–14 |
Table 4.
Estimated Biomarker Thresholds for Ages 30–40.
| Biomarker | Safe (Green) | Mild Risk (Yellow) | Unsafe (Orange) |
|---|---|---|---|
| CSF_ | (15, 22) | (10, 15) | (5, 10) |
| Amyloid_PET | (4, 7) | (7, 10) | (10, 15) |
| CSF_Tau | (3, 6) | (6, 9) | (9, 12) |
| MRI_FDG_PET | (2, 5) | (5, 8) | (8, 12) |
| Cognitive_Impairment | (0, 3) | (3, 6) | (6, 10) |
Table 5.
Estimated Biomarker Thresholds for Ages 40–50.
| Biomarker | Safe (Green) | Mild Risk (Yellow) | Unsafe (Orange) |
|---|---|---|---|
| CSF_ | (12, 18) | (8, 12) | (5, 8) |
| Amyloid_PET | (5, 9) | (9, 12) | (12, 18) |
| CSF_Tau | (4, 7) | (7, 10) | (10, 14) |
| MRI_FDG_PET | (3, 6) | (6, 9) | (9, 13) |
| Cognitive_Impairment | (1, 4) | (4, 7) | (7, 12) |
Table 6.
Estimated Biomarker Thresholds for Ages 55–65.
| Biomarker | Safe (Green) | Mild Risk (Yellow) | Unsafe (Orange) |
|---|---|---|---|
| CSF_ | (10, 15) | (6, 10) | (3, 6) |
| Amyloid_PET | (7, 12) | (12, 16) | (16, 22) |
| CSF_Tau | (5, 8) | (8, 12) | (12, 16) |
| MRI_FDG_PET | (4, 7) | (7, 10) | (10, 15) |
| Cognitive_Impairment | (2, 5) | (5, 9) | (9, 14) |
Disclaimer/Publisher’s Note: The statements, opinions and data contained in all publications are solely those of the individual author(s) and contributor(s) and not of MDPI and/or the editor(s). MDPI and/or the editor(s) disclaim responsibility for any injury to people or property resulting from any ideas, methods, instructions or products referred to in the content. |
© 2025 by the authors. Licensee MDPI, Basel, Switzerland. This article is an open access article distributed under the terms and conditions of the Creative Commons Attribution (CC BY) license (http://creativecommons.org/licenses/by/4.0/).
Copyright: This open access article is published under a Creative Commons CC BY 4.0 license, which permit the free download, distribution, and reuse, provided that the author and preprint are cited in any reuse.


