Submitted:
31 March 2025
Posted:
01 April 2025
You are already at the latest version
Abstract
Climate change and human activities are profoundly reshaping species distributions, yet their combined impacts on plants with dual ecological-economic roles remain poorly understood. This study investigates Xanthium strumarium, a medicinal-invasive plant, across China using an integrated framework of species distribution modeling (Biomod2), niche dynamics (Ecospat), and rhizosphere microbiome analysis (Tax4Fun). Results reveal that human footprint (66.6% contribution), elevation, and slope dominate its distribution, with suitable habitats projected to expand by 8.9–28.6% under future scenarios (SSP1-2.6 to SSP5-8.5), particularly in Yunnan, Guangdong, and Inner Mongolia. Despite high niche conservatism (Schoener’s D = 0.8986–0.9338), ecological adaptability slightly declines under high emissions. Rhizosphere microbial communities, dominated by Proteobacteria and enriched in nitrogen-cycling taxa (Nitrospira, Verrucomicrobia), enhance adaptability through metabolic and environmental response functions, enabling colonization of disturbed soils. These findings highlight the synergistic roles of climate-driven habitat shifts and microbiome-mediated resilience in shaping X. strumarium’s invasion success. The study provides critical insights for managing its dual roles, advocating for strategies that address both anthropogenic drivers and microbial ecology in biodiversity conservation under global change.
Keywords:
Xanthium strumarium
; climate change
; species distribution modeling
; Biomod2
; rhizosphere microbiome
; 16S rRNA sequencing
; habitat suitability
; microbial communities
1. Introduction
Climate change has emerged as one of the most significant environmental challenges facing humanity in the 21st century, affecting ecosystems, biodiversity, and species distribution across the globe [1,2,3,4]. This phenomenon is no longer a distant concern but a current reality with profound implications for both natural and human systems. Rising temperatures, altered precipitation patterns, and more frequent extreme weather events are increasingly reshaping ecosystems and altering the habitats of numerous species [5,6,7]. These changes are especially impactful on species distributions, as many plants and animals are forced to migrate, adapt, or face local extinction. The ability of species to respond to these shifts is not only dependent on the changes in temperature and precipitation, but also on the broader interactions within the ecosystem, such as plant-microbe relationships, and human-driven landscape transformations [8,9,10].
Xanthium strumarium, a plant species native to parts of Asia with concentrations in China and India that has spread globally to North and South America, Africa, and Europe, embodies a paradoxical nature—it is both valued in traditional medicine for its anti-inflammatory and analgesic properties and recognized as an aggressive invasive species threatening ecosystems in many regions [11,12,13,14,15,16]. As a ruderal species, X. strumarium thrives in disturbed environments, outcompeting native vegetation and altering ecosystem dynamics [17,18,19]. It is well known for its rapid spread, especially in disturbed habitats such as agricultural fields and urban landscapes, where it competes for resources with native flora [20,21]. In China, the effects of climate change are particularly pronounced due to the country’s vast geographical expanse and diverse ecological zones, ranging from arid deserts in the northwest to subtropical forests in the south [22]. Home to over 30,000 plant species and a critical hub of global biodiversity, China faces unique challenges as shifting climates threaten its rich ecosystems and agricultural systems [23,24]. As a result, species distributions in China are undergoing significant transformations, with invasive species like Xanthium strumarium exploiting these changes to expand their range, particularly in disturbed environments such as farmlands and urban fringes. Understanding these dynamics within the Chinese context is essential for predicting ecological shifts and informing conservation and management strategies.
Climate change has far-reaching consequences on species distributions, not only because of direct changes in climate parameters such as temperature and precipitation, but also because of the indirect effects resulting from the interactions between plants and their environments. For example, soil microbial communities, recognized as key drivers of plant growth, nutrient uptake, and stress tolerance, are highly sensitive to climatic changes [25,26]. Recent research has increasingly recognized the role of microbes in shaping plant species’ ecological success [27,28,29,30,31]. Climate-induced changes in temperature and precipitation can alter microbial community composition and functions, affecting how plants respond to abiotic stressors and how they interact with other species. In turn, these changes can modify plant competition dynamics, nutrient cycling, and ecosystem processes, all of which are critical to understanding the future distribution of species like X. strumarium.
The relationship between plants and their microbial symbionts is a pivotal, yet often overlooked, aspect of understanding plant distribution under climate change. Microbes in the soil and rhizosphere play essential roles in facilitating nutrient uptake, enhancing plant tolerance to stressors such as drought and soil salinity, and even protecting plants from pathogens [32,33,34,35,36]. These microbial communities are not static; they evolve and adapt to changing environmental conditions, and their composition can influence how plants cope with the challenges posed by a warming world. For example, some plant species may benefit from symbiotic relationships with beneficial microbes that help them thrive in conditions of water scarcity or higher temperatures [37,38]. Conversely, other species may struggle as their microbial partners are unable to adapt quickly enough to rapid environmental shifts [39,40]. Understanding these complex interactions is vital for predicting how plant species like X. strumarium will fare in future climate scenarios, especially considering its status as both a medicinal plant and an invasive species.
Moreover, climate change is intricately intertwined with human activities that are fundamentally altering the landscape and ecosystem dynamics [41,42]. Agricultural expansion, urbanization, deforestation, and the intensification of land-use practices all contribute to habitat destruction, fragmentation, and the creation of novel ecological niches [43,44,45]. These anthropogenic activities not only alter the physical landscape but also influence the ecological processes that govern species distributions. X. strumarium has shown a remarkable ability to colonize disturbed habitats, which are often the result of human activities [46]. The spread of X. strumarium has been closely linked to agricultural intensification, where the plant benefits from disturbed soil conditions and the increased availability of resources in disturbed landscapes [47]. Additionally, urbanization has facilitated its expansion by providing fragmented, disturbed environments that allow for its persistence and spread [48,49].
Human-driven habitat fragmentation and alteration can exacerbate the effects of climate change on species [50,51,52]. Fragmented habitats may reduce the overall fitness of species by isolating populations, thereby limiting gene flow and reducing genetic diversity [53,54]. This can make species more vulnerable to climate-induced stresses, such as changes in temperature, precipitation, or the availability of resources [55]. Furthermore, human activities have introduced new challenges for species like X. strumarium, which are already adapting to shifting climates. For instance, land-use changes can disrupt natural plant-microbe interactions, alter nutrient availability, and reduce the resilience of ecosystems [56]. In this sense, human activities act as both direct and indirect drivers of species distribution shifts, further compounding the challenges posed by climate change.
To better understand how X. strumarium will respond to climate change, one of the most powerful tools at our disposal is species distribution modeling (SDM). SDMs are computational tools used to predict the potential distribution of species based on environmental variables, such as temperature, precipitation, and soil characteristics [57,58,59]. These models can simulate current and future species distributions under different climate scenarios, providing valuable insights into how species may fare under future climate conditions. Among the various modeling approaches, Biomod2 has emerged as a robust and flexible framework for SDM [60,61,62,63,64]. Biomod2 integrates multiple modeling algorithms, including Generalized Linear Models (GLMs), Random Forests (RF), Artificial Neural Networks (ANNs), and Support Vector Machines (SVMs), to create an ensemble model that combines the strengths of each algorithm [65,66]. This ensemble approach reduces the uncertainty inherent in individual models, making Biomod2 particularly valuable for predicting species distributions under complex environmental scenarios [67,68].
To complement the predictive power of SDMs, tools like Ecospat are invaluable for analyzing niche dynamics and species-environment interactions [69]. Ecospat provides a framework for assessing niche overlap and shifts, offering insights into how X. strumarium might adapt to future climate scenarios [70]. By evaluating the ecological niche of X. strumarium under current and projected climates, Ecospat helps identify potential areas of habitat suitability and the degree of niche conservatism or shift.
The role of soil microorganisms in influencing plant distribution and adaptation is increasingly acknowledged [71,72,73]. The rhizosphere, enriched by root exudates and microbial interactions, is crucial for plant health and resilience [74]. To gain a deeper understanding of the microbial community's role, Tax4Fun serves as an invaluable resource [75]. Tax4Fun is a bioinformatics tool that predicts the functional capabilities of microbial communities by translating 16S rRNA gene sequence-based taxonomic data into functional profiles, allowing researchers to infer the communities' metabolic potential [76,77].
This study aims to investigate the potential impacts of climate change on the distribution of Xanthium strumarium across China by utilizing Species Distribution Modeling (SDM) tools, including Biomod2. The research will evaluate how shifts in environmental variables—such as temperature and precipitation—influence the plant’s distribution patterns within Chinese ecoregions. To elucidate the species’ adaptive capacity under projected climate scenarios, niche dynamics and species-environment interactions will be analyzed using Ecospat. Concurrently, Tax4Fun will be employed to characterize the functional profiles of soil microbial communities and their role in shaping plant-microbe symbiosis critical for the plant’s ecological success in China’s diverse landscapes. By integrating these multidimensional analyses, this work seeks to deliver a holistic understanding of the plant’s future ecological and economic implications, particularly considering its dual role as a medicinal resource and an aggressive invasive species within the Chinese context.
2. Materials and Methods
2.1. Data Sources and Processing
Distribution data for X. strumarium were compiled from the Global Biodiversity Information Facility (GBIF) and complemented by field surveys conducted in Inner Mongolia Autonomous Region, China, between 2022 and 2024 [78]. To mitigate spatial sampling bias and enhance model reliability, we implemented a 5 km² spatial filtering protocol on the initial 2,288 occurrence records using the "Spatially Rarefy Occurrence Data" tool within ArcGIS 10.8 (Environmental Systems Research Institute, Redlands, CA, USA). This preprocessing step effectively reduced spatial autocorrelation while preserving ecological representativeness, yielding 1,689 spatially independent occurrence points suitable for subsequent distribution modeling analyses.
Figure 1.
The distribution map of Xanthium strumarium (Color gradient indicates elevation from -153 m blue to 7412 m red; elevation data sourced from WorldClim v2.1 at 30 arc-second resolution, with a maximum of 7412 m underestimating peaks like Everest at 8848.86 m, though this does not affect the lowland distribution of the species).
For the present research, 23 environmental variables were selected, comprising 19 climatic variables, three topographic variables, and one human activity variable. Climatic and elevation data were obtained from WorldClim at a 5-km resolution [79]. Topographic variables, including slope and aspect, were derived from elevation data using the Surface Analysis tool in ArcGIS 10.8. Human activity data were sourced from the third version of the Global Human Modification dataset at a 1-km resolution [80].
Future climate projections were sourced from the BCC-CSM2-MR model, developed by the Beijing Climate Center and widely recognized for its strong performance in studies exploring vegetation distribution across China [81,82]. This model provided data for three climate scenarios, SSP1-2.6, SSP2-4.5, and SSP5-8.5, which correspond to progressively higher carbon emission levels. For each scenario, data were retrieved for two time periods, spanning 2041 to 2060 and 2061 to 2080, at a spatial resolution of 5 km.
The twenty-three environmental variables obtained above were imported into ArcGIS 10.8. The "Extract by Mask" tool was used to crop the data to the geographical extent of China, and bilinear interpolation was applied to resample the resolution of the environmental variables to a standardized 5 km. This process ensures the necessary data consistency for subsequent spatial analysis and model construction.
Multiple factors may exhibit collinearity, potentially influencing the outcomes of the model [83]. To mitigate the problem of collinearity among variables, a stepwise variable reduction approach was employed. All environmental variables were imported into R, and the Pearson correlation coefficients between them were calculated using the "terra" package. These variables were then loaded into "biomod2" to filter out those with a contribution greater than zero. For pairs of filtered variables with a correlation coefficient exceeding 0.8, the variable with the higher contribution was retained [49,50]. This process culminated in the selection of 13 variables (Figure 2, Table 1).
2.2. Models Construction and Changes in Ecological Niches
The modeling framework incorporated 12 algorithms, such as Random Forest (RF), MaxEnt, and XGBoost, each run 10 times for robustness [64]. Community occurrence data were combined with an equal number of randomly generated pseudo-absences, split into 75% training and 25% test sets via random sampling. Pseudo-absences were generated using the ‘BIOMOD_FormatingData’ function, a method proven effective for capturing potential distributions compared to real absence data [84]. Individual model outputs were integrated into an ensemble model (EM) via a weighted average algorithm, enhancing predictive precision [85]. Habitat suitability was classified into four categories: Unsuitable area (0–0.25), Low suitable area (0.25–0.50), Moderately suitable area (0.50–0.75), and Highly suitable area (0.75–1.0), based on model probability outputs.
Model accuracy was assessed using three metrics: the Area Under the Receiver Operating Characteristic curve (ROC), True Skill Statistic (TSS), and Kappa coefficient, with thresholds of ROC > 0.9, TSS > 0.85, and Kappa > 0.85 indicating high performance [65,86,87].
Under current climate conditions, the distribution points of X. strumarium were identified, and a 1-degree buffer zone surrounding these points was established as the background for analysis. For predicted future climate scenarios, background points were determined based on suitable habitat areas projected by an ensemble model. By integrating these distribution points with diverse climate datasets, the "ecospat" R package was employed to evaluate and quantify the niche overlap of Xanthium strumarium under both current and future climate conditions [69]. This package facilitated the visualization of niche dynamics and the computation of the Schoener’s D niche overlap parameter (observed value), which ranges from 0 (no overlap) to 1 (complete overlap) [88]. This methodology enables a comprehensive analysis and assessment of the potential effects of climate change on the ecological niche of X. strumarium.
2.3. 16S rRNA Gene Sequencing of Rhizosphere Microbial Communities
Soil samples were collected from the rhizosphere of X. strumarium across five distinct habitat types in Inner Mongolia, China (Table 2).
Sampling was conducted in July 2024, targeting five replicate X. strumarium plants per site. Rhizosphere soil (0–5 cm depth, ~500 g) was collected within 2 mm of roots using a sterile corer, with bulk soil con-trols sampled 1 m away. Samples were stored at 4°C, transported to the laboratory within 24 h, and subsampled for DNA extraction (stored at -80°C) and physicochemical analysis (air-dried, sieved <2 mm). Genomic DNA was extracted from 0.5 g soil using the DNeasy PowerSoil Kit (Qiagen, Germany), with quality verified by NanoDrop 2000 and gel electrophoresis [89,90,91].
The 16S rRNA V3–V4 region was amplified (primers 338F/806R), sequenced on an Illu-mina MiSeq (PE300), and processed in QIIME2 (v2022.8) with DADA2 for ASV identifica-tion. Taxonomy was assigned using SILVA (v138), and datasets were rarefied to 10,000 reads/sample. Microbial diversity (Shannon, Chao1, Bray-Curtis NMDS) was analyzed, and functional profiles were predicted with Tax4Fun (v1.0) against KEGG pathways, val-idated by shotgun metagenomics (Spearman’s ρ > 0.85).
Tax4Fun is an R package designed for functional prediction of environmental samples, such as gut microbiota and soil, based on the 16S Silva database [77]. It offers high prediction accuracy and outperforms the PICRUSt functional prediction, particularly for complex environmental samples like soil. The functional prediction in Tax4Fun is achieved through a nearest-neighbor approach based on minimal 16S rRNA sequence similarity. Specifically, it extracts prokaryotic whole-genome 16S rRNA gene sequences from the KEGG database and uses the BLASTN algorithm to align them to the SILVA SSU Ref NR database (with a BLAST bit score >1500), constructing a relevant matrix. The KEGG database’s prokaryotic functional annotations, identified by UProC and PAUDA methods, are then mapped to the SILVA database for functional annotation. Sequenced samples are clustered into OTUs using SILVA database sequences as reference, allowing for functional annotation retrieval.
3. Results
3.1. Model Precision Assessment
In this study, we conducted a comprehensive evaluation of various machine learning models, focusing on their performance in terms of ROC values and Kappa values (Figure 3).
Regarding the ROC value, which measures the classification ability of a model, a value closer to 1 indicates superior predictive performance. Our analysis reveals that the Random Forest (RF) model stands out with an exceptional ROC value of 0.97, demonstrating its outstanding classification capability with virtually no misclassification. Other models, such as GBM (Gradient Boosting Machine), MARS, MAXNET, FDA, and XGBOOST, also performed well, with ROC values near 0.95, indicating their high predictive accuracy in handling complex datasets. Although ANN (Artificial Neural Network) and GLM (Generalized Linear Model) also yielded favorable results, with ROC values close to 0.95, they were slightly inferior to Random Forest and Gradient Boosting Machine, suggesting that their applicability may be somewhat limited for specific tasks. In contrast, the SRE model exhibited a significantly lower ROC value of 0.74, far below that of other models, indicating poor classification performance and limiting its practical usability in real-world applications.
Next, the Kappa value, which assesses the consistency of the model’s predictions, reflects the degree of deviation from random guessing. A value closer to 1 indicates stronger consistency. Among all the models, RF demonstrated the highest Kappa value of 0.981, indicating excellent classification consistency, nearly approaching the ideal state, and reflecting the stability of this model across multiple experiments. Both GBM and MARS showed impressive Kappa values of 0.825 and 0.767, respectively, signifying their strong predictive consistency, making them suitable for tasks that require high classification precision. In contrast, ANN and GLM yielded Kappa values of 0.756 and 0.759, which, although strong in terms of ROC value, were relatively weaker in terms of consistency, suggesting potential biases in specific application scenarios. The SRE model, with a Kappa value of only 0.452, was significantly lower than the other models, indicating poor classification consistency and making it less suitable for high-precision classification tasks.
In conclusion, RF (Random Forest) and GBM (Gradient Boosting Machine) emerged as the most outstanding models, exhibiting the highest ROC and Kappa values, making them well-suited for tasks requiring high classification accuracy, stability, and consistency. While all models demonstrated ROC values greater than 0.7, the SRE model was excluded from further consideration due to its low Kappa value.
For the ensemble modeling approach, we employed the EMmean method, which yielded an ROC value of 0.971 and a Kappa value of 0.888. This method demonstrated high accuracy and is well-suited for predictive modeling tasks.
3.2. Bioclimatic Variable Contribution
The modeling results demonstrate the relative contributions of different environmental variables to X. strumarium (Figure 4), with human activity having the most significant impact, accounting for 66.6% of the contribution. This indicates that in areas with intensive human activity, its influence on the ecosystem or species distribution far exceeds other Variables such as topography and climatic variables. Elevation and slope contribute 4.7% and 3.7%, respectively, indicating that topographic Variables have a certain degree of influence on ecological processes. Additionally, vegetation cover (NDVI) and a series of bioclimatic variables have relatively smaller contributions but still provide necessary insights into environmental complexity. Overall, these results emphasize the importance of prioritizing the impact of human activity in ecological conservation and management strategies to effectively address its potential threats to ecosystems.
3.3. Present Potential Geographic Spread
The integrated modeling results indicate that the current primary potential suitable habitats for X. strumarium are predominantly distributed across southern, central, eastern, northeastern, and southeastern China, encompassing a total suitable area of 329.816×10⁴ km² (Figure 5). Specifically, high-suitability areas (36.871528×10⁴ km²) are principally concentrated in the following administrative regions: Inner Mongolia, Hebei, Tianjin, Beijing, Shandong, Henan, Shanxi, Hainan, Hunan, Hubei, Guangdong, and Taiwan, while scattered occurrences are observed in Xinjiang, Tibet, and Yunnan provinces.
This Table 3 and Figure 6 shows the changes in the suitable growth areas of X. strumarium under different climate scenarios over the next few decades. In the coming decades, regardless of whether it is a low, medium, or high emission scenario (SSP1-2.6, SSP2-4.5, SSP5-8.5), the areas of low and moderately suitable zones for X. strumarium are showing an increasing trend, especially under high emission scenarios, where the growth is more significant. However, the area of highly suitable zones changes little and even decreases in some scenarios, indicating that the optimal growing conditions for X. strumarium remain limited. Overall, climate change has a positive impact on the growth environment of X. strumarium, particularly under high emission scenarios, where its suitable growth area has significantly expanded.
3.4. Niche Dynamics
The niche comparison analysis for X. strumarium across current and projected future climate scenarios reveals a substantial degree of ecological niche overlap, as quantified by Schoener’s D metric (Figure 7). Specifically, the overlap ranges from a minimum of 89.86% (Schoener’s D = 0.8986) between the current climate and the 2061–2080 period under the SSP5-8.5 scenario, characterized by high levels of greenhouse gas emissions, to a maximum of 93.38% (Schoener’s D = 0.9338) for the same timeframe under the more sustainable SSP1-2.6 pathway. Intermediate values include 93.20% (Schoener’s D = 0.9320) for the 2041–2060 period under SSP1-2.6, 93.17% (Schoener’s D = 0.9317) under SSP2-4.5, and 91.20% (Schoener’s D = 0.9120) under SSP5-8.5, while the overlap for 2061–2080 under SSP2-4.5 stands at 90.38% (Schoener’s D = 0.9038). These results suggest a high degree of niche conservatism across diverse climate trajectories, with variations reflecting the influence of differing emission scenarios on X. strumarium's ecological adaptability. Notably, the overlap is slightly higher under the SSP1-2.6 and SSP2-4.5 scenarios, which represent more sustainable emissions pathways, while the SSP5-8.5 scenario, associated with high emissions, shows slightly lower overlap, indicating a reduced ecological adaptability under more extreme climate conditions.
3.5. Rhizosphere Microbial Abundance in Xanthium strumarium Habitats
The structure of the rhizosphere microbial community exhibits significant differences across various samples and groups, which are effectively illustrated by the species relative abundance bar chart and species abundance clustering chart at the phylum level (Figure 8 and Figure 9). Proteobacteria dominates in several samples, particularly in ZD1 and ZD2, where its abundance often exceeds 50%, indicating its strong metabolic and adaptive capacity in the soil, potentially promoting organic matter decomposition and nutrient cycling. Firmicutes and Bacteroidetes are more evenly distributed in other samples, suggesting these phyla have a good adaptability to soil environments, while Acidobacteria shows higher abundance in ZD2 and ZD4, possibly related to the adaptation to acidic or nutrient-poor soil environments. The composition of these microbes may assist X. strumarium in surviving in variable soil conditions, especially in acidic or nutrient-deficient environments.
Among different groups, ZD5 and ZD6 samples show higher microbial diversity, particularly with an increased proportion of Others categories, reflecting the complexity of rhizosphere microbial interactions, which may enhance the plant's adaptability to environmental stresses. Additionally, the increase of Nitrospira and Verrucomicrobia in ZD6 suggests active nitrogen cycling in these samples, potentially improving nitrogen availability and supporting X. strumarium's growth in nitrogen-limited areas. Furthermore, the higher abundance of Pseudomonas and Streptomyces in ZD5 may aid in organic matter degradation and pathogen suppression, further promoting the plant's survival in polluted or highly competitive environments. Overall, these characteristics of the rhizosphere microbial community suggest that X. strumarium can expand its distribution across different soil conditions through its microbiome, particularly in disturbed or marginal soils.
3.6. Functional Prediction of Soil Microorganisms
The functional diversity of the rhizosphere microbial community of X. strumarium is revealed through the Tax4Fun relative abundance bar chart and clustering analysis, highlighting differences in microbial genome functions across different samples and groups (Figure 10, Figure 11 and Figure 12). At the sample level, Metabolism consistently dominates the microbial genomes, with most samples showing relative abundances exceeding 0.5, indicating the central role of metabolic processes, possibly linked to environments rich in organic matter. Genetic Information Processing also maintains a high relative abundance, highlighting the importance of processes such as DNA replication and transcription in microbial survival and reproduction across different habitats. While Environmental Information Processing is generally lower, it exhibits some increase in specific groups like ZD6, reflecting the microbial community's ability to sense and respond to environmental fluctuations. In contrast, categories such as Human Diseases and Organismal Systems show minimal presence, reinforcing that these microbial communities are primarily from natural ecosystems rather than environments closely linked to human health or diseases.
At the group level, differences in functional distributions are observed. The ZD1, ZD2, ZD4, ZD5, and ZD6 groups all show Metabolism as the dominant functional category, yet subtle variations in other functions emerge. For example, ZD4 and ZD5 exhibit a slight increase in Environmental Information Processing, suggesting a heightened need for environmental adaptation. Notably, the ZD6 group stands out, exhibiting a significantly higher relative abundance of Metabolism and lower abundance in Genetic Information Processing and Environmental Information Processing. This could indicate a microbial community highly active in metabolic processes, possibly due to environmental conditions that favor energy and nutrient conversion over genetic adaptation or environmental sensing. Overall, the microbial functional composition reflects the ecological conditions of each group, with implications for how Xanthium strumarium adapts to various soil environments, particularly in terms of resource utilization and environmental adaptability.
4. Discussion
4.1. Impact of Climate Change on Habitat Distribution of Xanthium strumarium
This study applied the widely used Biomod2 model to explore the impact of global climate change on the suitable habitats of X. strumarium in China. Our results indicate that climate change is expected to significantly alter the distribution of suitable habitats for this species, with varying impacts depending on emission scenarios. Under current climate conditions, the primary suitable habitats for X. strumarium are concentrated in southern, central, eastern, northeastern, and southeastern China, representing regions with optimal climatic conditions for plant growth.
Given the substantial influence of global warming on the projected changes in precipitation and climate patterns, the expansion and contraction of plant species are expected to have strong ecological impacts across China. Under future climate scenarios, particularly those associated with high emissions (SSP5-8.5), the distribution of suitable habitats is predicted to expand, driven by rising temperatures and changing precipitation patterns. These changes are expected to create favorable conditions for the species in areas where competition was previously less intense. The predicted expansion primarily includes regions such as Yunnan, Guizhou, Guangdong, Hainan, and parts of Inner Mongolia, with coastal areas also becoming increasingly susceptible to invasion.
Climate change can promote plant invasions by increasing disturbances through extreme climatic events and changing environmental conditions. Previous studies have identified different key environmental variables for X. strumarium in various regions. For example, Kekeç and Kadıoğlu [92] identified Bio4, Bio10, Bio11, and Bio12 as the dominant environmental variables in Turkey; Waheed et al. [14] highlighted Bio4, Bio8, and nitrogen content (soil nitrogen) as influential in Pakistan; and Chikuruwo et al. [93] found NDVI to be the most significant factor in southeastern Zimbabwe. The variation in these influential environmental variables across studies may be due to differences in study areas, selected variables, and distribution points [94]. In this study, we identified human activity (human footprint) as the dominant environmental variable affecting X. strumarium distribution, followed by topography, and then NDVI along with a series of bioclimatic variables. These findings suggest that human activity and topography are key drivers of X. strumarium's spread. Human activity exacerbates the spread of invasive species, while factors such as elevation, slope, and aspect are among the limiting factors for plant distribution. Therefore, it is not surprising to find that human activity and topographic changes significantly influence the species' spread. Meanwhile, the changes in the dynamic ecological niche reflect a decrease in the ecological adaptability of X. strumarium with the increase in fossil fuel emissions.
In conclusion, the predicted expansion of suitable habitats under climate change, particularly in regions with increased human activity and altered topography, highlights the ongoing shifts in the potential distribution of X. strumarium across China.
4.2. Role of Rhizosphere Microbial Communities in Adaptation
The rhizosphere microbial communities play a pivotal role in the adaptation of X. strumarium to diverse environmental conditions. The microbial community structure varies significantly across different samples and groups, with Proteobacteria being the dominant phylum in most samples, suggesting its strong role in soil metabolism and nutrient cycling [95,96]. Other microbial phyla like Firmicutes and Bacteroidetes contribute to the adaptability of X. strumarium in various soil conditions, including nutrient-deficient and acidic environments [97,98]. Additionally, the higher microbial diversity observed in samples such as ZD5 and ZD6, coupled with the increased proportion of Nitrospira and Verrucomicrobia, points to active nitrogen cycling in these habitats, which could help improve nutrient availability for the plant. The interactions between the plant and its rhizosphere microbiome support its growth in disturbed or marginal soils, allowing X. strumarium to thrive in diverse and challenging environments.
4.3. Uncertainties of the Present Study
In this study, we first employed an integrated modeling approach to simulate the potential distribution of X. strumarium in China under current and future climate scenarios, thereby reducing uncertainties arising from differences in model algorithms. Although the distribution points were carefully selected, the spatial dispersion of these points and the lack of field surveys in some regions may have influenced the prediction of the species' potential suitable areas. The selection of environmental variables plays a crucial role in species distribution prediction and model accuracy. This study did not account for various factors such as soil characteristics and land use, which could significantly impact the species' distribution. Future research should consider incorporating additional environmental variables and conduct field surveys in other provinces to supplement the data. Furthermore, dispersal dynamics can notably influence a species' response to global changes, potentially affecting the study's outcomes [99,100]. Future investigations could integrate different dispersal scenarios to further explore the potential changes in hotspots under climate and land use variations.
5. Conclusions
This study analyzes the potential suitable distribution changes of X. strumarium in China under climate change, dynamic ecological niche shifts, and the composition, abundance, and functional validation of its rhizosphere microbiota. The results indicate that human footprint, slope, and elevation are the dominant environmental variables influencing the distribution of X. strumarium. With the intensification of climate change, the potential suitable distribution of X. strumarium gradually expands. Moreover, the dynamic ecological niche analysis reveals a reduction in the ecological adaptability of X. strumarium with the increasing fossil fuel emissions. The validation of rhizosphere microbiota abundance and function confirms its role in the distribution and environmental adaptation of X. strumarium. This study provides insights into the potential distribution changes, dynamic ecological niche shifts, and the composition and function of soil rhizosphere microbiota of X. strumarium under climate change, offering theoretical support for the future utilization and management of X. strumarium.
Author Contributions
Conceptualization, J.D., L.Z., and H.J.; methodology, J.D. and L.Z.; software, Y.Z. and M.Z.; validation, J.D., L.Z., X.W., and Y.Z.; formal analysis, L.Z. and Y.Z.; investigation, X.W. and M.Z.; resources, J.D. and H.J.; data curation, Y.Z. and M.Z.; writing—original draft preparation, J.D. and L.Z.; writing—review and editing, Y.Z., X.W., M.Z., and H.J.; visualization, M.Z. and X.W.; supervision, H.J.; project administration, J.D.; funding acquisition, H.J. All authors have read and agreed to the published version of the manuscript.
Funding
This research was funded by the Inner Mongolia Autonomous Region Natural Science Foundation Project: "The Role and Application of Small Secretory Proteins in Pathogen-Symbiosis Transition Interactions," grant number 2023LHMS03007, and "The APC was funded by the Green Pest Control Team of the College of Forestry, Inner Mongolia Agricultural University".
Data Availability Statement
We encourage all authors of articles published in MDPI journals to share their research data. In this section, please provide details regarding where data supporting reported results can be found, including links to publicly archived datasets analyzed or generated during the study. Where no new data were created, or where data is unavailable due to privacy or ethical restrictions, a statement is still required. Suggested Data Availability Statements are available in section “MDPI Research Data Policies” at https://www.mdpi.com/ethics.
Acknowledgments
In this section, you can acknowledge any support given which is not covered by the author contribution or funding sections. This may include administrative and technical support, or donations in kind (e.g., materials used for experiments).
Conflicts of Interest
Declare conflicts of interest or state “The authors declare no conflicts of interest.” Authors must identify and declare any personal circumstances or interest that may be perceived as inappropriately influencing the representation or interpretation of reported research results. Any role of the funders in the design of the study; in the collection, analyses or interpretation of data; in the writing of the manuscript; or in the decision to publish the results must be declared in this section. If there is no role, please state “The funders had no role in the design of the study; in the collection, analyses, or interpretation of data; in the writing of the manuscript; or in the decision to publish the results”.
References
- Bandh, S.A.; Shafi, S.; Peerzada, M.; Rehman, T.; Bashir, S.; Wani, S.A.; Dar, R. Multidimensional analysis of global climate change: a review. Environmental Science and Pollution Research 2021, 28, 24872–24888. [Google Scholar] [CrossRef] [PubMed]
- Hoegh-Guldberg, O.; Bruno, J.F. The impact of climate change on the world’s marine ecosystems. Science 2010, 328, 1523–1528. [Google Scholar] [CrossRef] [PubMed]
- Pecl, G.T.; Araújo, M.B.; Bell, J.D.; Blanchard, J.; Bonebrake, T.C.; Chen, I.-C.; Clark, T.D.; Colwell, R.K.; Danielsen, F.; Evengård, B. Biodiversity redistribution under climate change: Impacts on ecosystems and human well-being. Science 2017, 355, eaai9214. [Google Scholar] [CrossRef] [PubMed]
- Sarwar, N. Enviornmental Challenges in the 21 St Century. Strategic Studies 2008, 28, 118–143. [Google Scholar]
- Maxwell, S.L.; Butt, N.; Maron, M.; McAlpine, C.A.; Chapman, S.; Ullmann, A.; Segan, D.B.; Watson, J.E. Conservation implications of ecological responses to extreme weather and climate events. Diversity and Distributions 2019, 25, 613–625. [Google Scholar] [CrossRef]
- Parmesan, C.; Root, T.L.; Willig, M.R. Impacts of extreme weather and climate on terrestrial biota. Bulletin of the American Meteorological Society 2000, 81, 443–450. [Google Scholar] [CrossRef]
- Turner, M.G.; Calder, W.J.; Cumming, G.S.; Hughes, T.P.; Jentsch, A.; LaDeau, S.L.; Lenton, T.M.; Shuman, B.N.; Turetsky, M.R.; Ratajczak, Z. Climate change, ecosystems and abrupt change: science priorities. Philosophical Transactions of the Royal Society B 2020, 375, 20190105. [Google Scholar] [CrossRef]
- Anand, S.; Hallsworth, J.E.; Timmis, J.; Verstraete, W.; Casadevall, A.; Ramos, J.L.; Sood, U.; Kumar, R.; Hira, P.; Dogra Rawat, C. Weaponising microbes for peace. Microb. Biotechnol. 2023, 16, 1091–1111. [Google Scholar] [CrossRef]
- Díaz, S.; Settele, J.; Brondízio, E.S.; Ngo, H.T.; Agard, J.; Arneth, A.; Balvanera, P.; Brauman, K.A.; Butchart, S.H.; Chan, K.M. Pervasive human-driven decline of life on Earth points to the need for transformative change. Science 2019, 366, eaax3100. [Google Scholar] [CrossRef]
- Soudzilovskaia, N.A.; van Bodegom, P.M.; Terrer, C.; Zelfde, M.v.t.; McCallum, I.; Luke McCormack, M.; Fisher, J.B.; Brundrett, M.C.; de Sá, N.C.; Tedersoo, L. Global mycorrhizal plant distribution linked to terrestrial carbon stocks. Nature communications 2019, 10, 5077. [Google Scholar] [CrossRef]
- Fan, W.; Fan, L.; Peng, C.; Zhang, Q.; Wang, L.; Li, L.; Wang, J.; Zhang, D.; Peng, W.; Wu, C. Traditional uses, botany, phytochemistry, pharmacology, pharmacokinetics and toxicology of Xanthium strumarium L.: A review. Molecules 2019, 24, 359. [Google Scholar] [CrossRef] [PubMed]
- McMillan, C. Photoperiodic adaptation of Xanthium strumarium in Europe, Asia Minor, and northern Africa. Canadian Journal of Botany 1974, 52, 1779–1791. [Google Scholar] [CrossRef]
- Ullah, R.; Khan, N.; Hewitt, N.; Ali, K.; Jones, D.A.; Khan, M.E.H. Invasive Species as Rivals: Invasive Potential and Distribution Pattern of Xanthium strumarium L. Sustainability 2022, 14, 7141. [Google Scholar] [CrossRef]
- Waheed, M.; Haq, S.M.; Arshad, F.; Vitasović-Kosić, I.; Bussmann, R.W.; Hashem, A.; Abd-Allah, E.F. Xanthium strumarium L., an invasive species in the subtropics: prediction of potential distribution areas and climate adaptability in Pakistan. BMC ecology and evolution 2024, 24, 124. [Google Scholar] [CrossRef]
- Wang, J.; Wang, D.; Wu, B.; Han, J.; Tan, N. Phytochemical and pharmacological properties of Xanthium species: a review. Phytochemistry Reviews 2025, 24, 773–844. [Google Scholar] [CrossRef]
- Weaver, S.E.; Lechowicz, M.J. THE BIOLOGY OF CANADIAN WEEDS.: 56. Xanthium strumarium L. Canadian Journal of Plant Science 1983, 63, 211–225. [Google Scholar] [CrossRef]
- Abdiyeva, R.T.; Litvinskaya, S.A. Phytocenotic, bioecological and invasive activity of the invasive species Xanthium strumarium L. in some districts of Azerbaijan. Plant & Fungal Research 2020, 3, 38–45. [Google Scholar]
- Iqbal, M.; Iram, A.; Liu, M.C.; Feng, Y.L. Competitive approach of invasive cocklebur (Xanthium strumarium) with native weed species diversity in Northeast China. BioRxiv 2001. BioRxiv:2020.2001. 2017.910208. [Google Scholar]
- Rojas-Sandoval, J. Xanthium strumarium (common cocklebur). Forest 2007. [Google Scholar]
- Qureshi, H.; Anwar, T.; Arshad, M.; Osunkoya, O.O.; Adkins, S. Impacts of Xanthium strumarium L. invasion on vascular plant diversity in Pothwar Region (Pakistan). Annali di Botanica 2019, 9, 73–82. [Google Scholar]
- Wapshere, A. An ecological study of an attempt at biological control of Noogoora burr (Xanthium strumarium). Australian Journal of Agricultural Research 1974, 25, 275–292. [Google Scholar] [CrossRef]
- Qiu, Y.-X.; Fu, C.-X.; Comes, H.P. Plant molecular phylogeography in China and adjacent regions: tracing the genetic imprints of Quaternary climate and environmental change in the world’s most diverse temperate flora. Molecular phylogenetics and evolution 2011, 59, 225–244. [Google Scholar] [CrossRef]
- Huang, H. Plant diversity and conservation in China: planning a strategic bioresource for a sustainable future. Botanical Journal of the Linnean Society 2011, 166, 282–300. [Google Scholar] [CrossRef] [PubMed]
- Mi, X.; Feng, G.; Hu, Y.; Zhang, J.; Chen, L.; Corlett, R.T.; Hughes, A.C.; Pimm, S.; Schmid, B.; Shi, S. The global significance of biodiversity science in China: An overview. National Science Review 2021, 8, nwab032. [Google Scholar] [CrossRef] [PubMed]
- Bardgett, R.D.; Caruso, T. Soil microbial community responses to climate extremes: resistance, resilience and transitions to alternative states. Philosophical Transactions of the Royal Society B 2020, 375, 20190112. [Google Scholar] [CrossRef]
- Jansson, J.K.; Hofmockel, K.S. Soil microbiomes and climate change. Nature Reviews Microbiology 2020, 18, 35–46. [Google Scholar] [CrossRef]
- Evidente, A. Specialized metabolites produced by phytotopatogen fungi to control weeds and parasite plants. Microorganisms 2023, 11, 843. [Google Scholar] [CrossRef]
- Gao, W.-T.; Su, W.-H. Weed management methods for herbaceous field crops: A review. Agronomy 2024, 14, 486. [Google Scholar] [CrossRef]
- J Gundale, M.; Kardol, P. Multi-dimensionality as a path forward in plant-soil feedback research. Journal of Ecology 2021, 109, 3446–3465. [Google Scholar] [CrossRef]
- Mueller, C.W.; Baumert, V.; Carminati, A.; Germon, A.; Holz, M.; Kögel-Knabner, I.; Peth, S.; Schlüter, S.; Uteau, D.; Vetterlein, D. From rhizosphere to detritusphere–Soil structure formation driven by plant roots and the interactions with soil biota. Soil Biology and Biochemistry 2024, 109396. [Google Scholar] [CrossRef]
- Singh Rawat, V.; Kaur, J.; Bhagwat, S.; Arora Pandit, M.; Dogra Rawat, C. Deploying microbes as drivers and indicators in ecological restoration. Restoration Ecology 2023, 31, e13688. [Google Scholar] [CrossRef]
- Gupta, A.; Mishra, R.; Rai, S.; Bano, A.; Pathak, N.; Fujita, M.; Kumar, M.; Hasanuzzaman, M. Mechanistic insights of plant growth promoting bacteria mediated drought and salt stress tolerance in plants for sustainable agriculture. International Journal of Molecular Sciences 2022, 23, 3741. [Google Scholar] [CrossRef]
- Kaushal, M.; Wani, S.P. Rhizobacterial-plant interactions: strategies ensuring plant growth promotion under drought and salinity stress. Agriculture, Ecosystems & Environment 2016, 231, 68–78. [Google Scholar]
- Kumar, A.; Verma, J.P. Does plant—microbe interaction confer stress tolerance in plants: a review? Microbiological research 2018, 207, 41–52. [Google Scholar] [CrossRef] [PubMed]
- Ma, Y.; Dias, M.C.; Freitas, H. Drought and salinity stress responses and microbe-induced tolerance in plants. Frontiers in plant science 2020, 11, 591911. [Google Scholar] [CrossRef]
- Soni, R.; Prakash, G.; Sharma, S.; Sinha, D.; Mishra, R. Role of microbes in alleviating abiotic stress in plants. Plant Sci. Today 2023, 10, 160–187. [Google Scholar] [CrossRef]
- Barrow, J.R.; Lucero, M.E.; Reyes-Vera, I.; Havstad, K.M. Do symbiotic microbes have a role in regulating plant performance and response to stress? Communicative & Integrative Biology 2008, 1, 69–73. [Google Scholar]
- Harman, G.; Khadka, R.; Doni, F.; Uphoff, N. Benefits to plant health and productivity from enhancing plant microbial symbionts. Frontiers in plant science 2021, 11, 610065. [Google Scholar] [CrossRef]
- Cheng, Y.T.; Zhang, L.; He, S.Y. Plant-microbe interactions facing environmental challenge. Cell host & microbe 2019, 26, 183–192. [Google Scholar]
- Soen, Y. Environmental disruption of host–microbe co-adaptation as a potential driving force in evolution. Frontiers in genetics 2014, 5, 168. [Google Scholar] [CrossRef]
- McFadden, I.R.; Sendek, A.; Brosse, M.; Bach, P.M.; Baity-Jesi, M.; Bolliger, J.; Bollmann, K.; Brockerhoff, E.G.; Donati, G.; Gebert, F. Linking human impacts to community processes in terrestrial and freshwater ecosystems. Ecology Letters 2023, 26, 203–218. [Google Scholar] [CrossRef]
- Storch, D.; Šímová, I.; Smyčka, J.; Bohdalková, E.; Toszogyova, A.; Okie, J.G. Biodiversity dynamics in the Anthropocene: how human activities change equilibria of species richness. Ecography 2022, 2022. [Google Scholar] [CrossRef]
- Hua, F.; Wang, W.; Nakagawa, S.; Liu, S.; Miao, X.; Yu, L.; Du, Z.; Abrahamczyk, S.; Arias-Sosa, L.A.; Buda, K. Ecological filtering shapes the impacts of agricultural deforestation on biodiversity. Nature Ecology & Evolution 2024, 8, 251–266. [Google Scholar]
- Montero, A.; Marull, J.; Tello, E.; Cattaneo, C.; Coll, F.; Pons, M.; Infante-Amate, J.; Urrego-Mesa, A.; Fernández-Landa, A.; Vargas, M. The impacts of agricultural and urban land-use changes on plant and bird biodiversity in Costa Rica (1986–2014). Regional Environmental Change 2021, 21, 48. [Google Scholar] [CrossRef]
- Roy, P.S.; Ramachandran, R.M.; Paul, O.; Thakur, P.K.; Ravan, S.; Behera, M.D.; Sarangi, C.; Kanawade, V.P. Anthropogenic land use and land cover changes—A review on its environmental consequences and climate change. Journal of the Indian Society of Remote Sensing 2022, 50, 1615–1640. [Google Scholar] [CrossRef]
- Waheed, M.; Arshad, F. Adaptive convergence and divergence underpin the diversity of Asteraceae in a semi-arid lowland region. Flora 2024, 317, 152554. [Google Scholar] [CrossRef]
- Chipomho, J.; Tatsvarei, S.; Parwada, C.; Mashingaidze, A.B.; Rugare, J.T.; Mabasa, S.; Chikowo, R. Weed Types and Dynamics Associations with Catena Landscape Positions: Smallholder Farmers’ Knowledge and Perception in Zimbabwe. International Journal of Agronomy 2022, 2022, 2743090. [Google Scholar] [CrossRef]
- de Barros Ruas, R.; Costa, L.M.S.; Bered, F. Urbanization driving changes in plant species and communities–A global view. Global Ecology and Conservation 2022, 38, e02243. [Google Scholar] [CrossRef]
- Dubey, R.S.; Kalyan, S.; Pathak, B. Impacts of urbanization and climate change on habitat destruction and emergence of zoonotic species. In Climate change and urban environment sustainability; Springer: Berlin/Heidelberg, Germany, 2023; pp. 303–322. [Google Scholar]
- Cooke, S.J.; Piczak, M.L.; Singh, N.J.; Åkesson, S.; Ford, A.T.; Chowdhury, S.; Mitchell, G.W.; Norris, D.R.; Hardesty-Moore, M.; McCauley, D. Animal migration in the Anthropocene: threats and mitigation options. Biological Reviews 2024, 99, 1242–1260. [Google Scholar] [CrossRef]
- Fordham, D.A. Identifying species traits that predict vulnerability to climate change. Cambridge Prisms: Extinction 2024, 2, e21. [Google Scholar] [CrossRef]
- Hald-Mortensen, C. The Climate-Biodiversity Nexus Reviewed: Navigating Tipping Points, Science-Based Targets & Nature-Based Solutions. J of Agri Earth & Environmental Sciences 3 (6), 01 2024, 11. [Google Scholar]
- Clarke, J.G.; Smith, A.C.; Cullingham, C.I. Genetic rescue often leads to higher fitness as a result of increased heterozygosity across animal taxa. Molecular Ecology 2024, 33, e17532. [Google Scholar] [CrossRef] [PubMed]
- Delnevo, N.; Piotti, A.; Carbognani, M.; van Etten, E.J.; Stock, W.D.; Field, D.L.; Byrne, M. Genetic and ecological consequences of recent habitat fragmentation in a narrow endemic plant species within an urban context. Biodiversity and Conservation 2021, 30, 3457–3478. [Google Scholar] [CrossRef]
- Mehta, P. The Impact of Climate Change on the Environment, Water Resources, and Agriculture: A Comprehensive Review. Clim. Environ. Agric. Dev. : A Sustain. Approach Towards Soc. 2024, 189–201. [Google Scholar] [CrossRef]
- Patra, A.K.; Coumar, M.V. Sustainable soil resource management for food and nutritional security under changing climate scenario. Indian Journal of Agronomy 2023, 68, 78–97. [Google Scholar]
- Beery, S.; Cole, E.; Parker, J.; Perona, P.; Winner, K. Species distribution modeling for machine learning practitioners: A review. In Proceedings of the Proceedings of the 4th ACM SIGCAS Conference on Computing and Sustainable Societies, 2021; pp. 329–348.
- Elith, J.; Leathwick, J.R. Species distribution models: ecological explanation and prediction across space and time. Annual review of ecology, evolution, and systematics 2009, 40, 677–697. [Google Scholar] [CrossRef]
- Kumari, G.; Kotiyal, P.B.; Singh, H.; Kumar, M.; Kumar, N.; Malik, A.; Sojitra, A.; Singh, S. Predicting future climate change effects on biotic communities: A species distribution modeling approach. In Forests and Climate Change: Biological Perspectives on Impact, Adaptation, and Mitigation Strategies; Springer: Berlin/Heidelberg, Germany, 2024; pp. 137–168. [Google Scholar]
- Barewar, H.; Buragohain, M.K.; Lama, S. Mapping the impact of Climate Change on eco-sensitive hotspots using species distribution modelling (SDM): gaps, challenges, and future perspectives. In Ecosystem and species habitat modeling for conservation and restoration; Springer: Berlin/Heidelberg, Germany, 2023; pp. 59–86. [Google Scholar]
- Cheng, R.; Wang, X.; Zhang, J.; Zhao, J.; Ge, Z.; Zhang, Z. Predicting the potential suitable distribution of Larix principis-rupprechtii Mayr under climate change scenarios. Forests 2022, 13, 1428. [Google Scholar] [CrossRef]
- Petrosyan, V.; Dinets, V.; Osipov, F.; Dergunova, N.; Khlyap, L. Range dynamics of striped field mouse (Apodemus agrarius) in Northern Eurasia under global climate change based on ensemble species distribution models. Biology 2023, 12, 1034. [Google Scholar] [CrossRef]
- Rather, Z.A.; Ahmad, R.; Khuroo, A.A. Ensemble modelling enables identification of suitable sites for habitat restoration of threatened biodiversity under climate change: A case study of Himalayan Trillium. Ecological Engineering 2022, 176, 106534. [Google Scholar] [CrossRef]
- Valavi, R.; Guillera-Arroita, G.; Lahoz-Monfort, J.J.; Elith, J. Predictive performance of presence-only species distribution models: a benchmark study with reproducible code. Ecological monographs 2022, 92, e01486. [Google Scholar] [CrossRef]
- Gu, R.; Wei, S.; Li, J.; Zheng, S.; Li, Z.; Liu, G.; Fan, S. Predicting the impacts of climate change on the geographic distribution of moso bamboo in China based on biomod2 model. European Journal of Forest Research 2024, 143, 1499–1512. [Google Scholar] [CrossRef]
- Huang, Y.; Li, T.; Chen, W.; Zhang, Y.; Xu, Y.; Guo, T.; Wang, S.; Liu, J.; Qin, Y. Analysis of the Distribution Pattern of Phenacoccus manihoti in China under Climate Change Based on the Biomod2 Model. Biology 2024, 13, 538. [Google Scholar] [CrossRef]
- Guisan, A.; Thuiller, W.; Zimmermann, N.E. Habitat suitability and distribution models: with applications in R; Cambridge University Press: Cambridge, UK, 2017. [Google Scholar]
- Westbrook, A.S.; Nikkel, E.; Clements, D.R.; DiTommaso, A. Modeling and managing invasive weeds in a changing climate. In Invasive species and global climate change; CABI GB: Wallingford, UK, 2022; pp. 282–306. [Google Scholar]
- Di Cola, V.; Broennimann, O.; Petitpierre, B.; Breiner, F.T.; d'Amen, M.; Randin, C.; Engler, R.; Pottier, J.; Pio, D.; Dubuis, A. ecospat: an R package to support spatial analyses and modeling of species niches and distributions. Ecography 2017, 40, 774–787. [Google Scholar] [CrossRef]
- Zhang, Y.; Wang, C.; Shi, X.; Wan, Y.; Qin, S.; Ma, F. Assessing the Potential Distribution and Ecological Niche Dynamics of Invasive African Giant Snails (Lissachatina Fulica) Using a Structural Portfolio Approach.
- Grover, M.; Ali, S.Z.; Sandhya, V.; Rasul, A.; Venkateswarlu, B. Role of microorganisms in adaptation of agriculture crops to abiotic stresses. World Journal of Microbiology and Biotechnology 2011, 27, 1231–1240. [Google Scholar] [CrossRef]
- Jacoby, R.; Peukert, M.; Succurro, A.; Koprivova, A.; Kopriva, S. The role of soil microorganisms in plant mineral nutrition—current knowledge and future directions. Frontiers in plant science 2017, 8, 1617. [Google Scholar] [CrossRef]
- Lau, J.A.; Lennon, J.T. Rapid responses of soil microorganisms improve plant fitness in novel environments. Proceedings of the National Academy of Sciences 2012, 109, 14058–14062. [Google Scholar] [CrossRef]
- Pantigoso, H.A.; Newberger, D.; Vivanco, J.M. The rhizosphere microbiome: Plant–microbial interactions for resource acquisition. Journal of Applied Microbiology 2022, 133, 2864–2876. [Google Scholar] [CrossRef]
- Djemiel, C.; Maron, P.-A.; Terrat, S.; Dequiedt, S.; Cottin, A.; Ranjard, L. Inferring microbiota functions from taxonomic genes: a review. GigaScience 2022, 11, giab090. [Google Scholar] [CrossRef]
- Wemheuer, F.; Taylor, J.A.; Daniel, R.; Johnston, E.; Meinicke, P.; Thomas, T.; Wemheuer, B. Tax4Fun2: prediction of habitat-specific functional profiles and functional redundancy based on 16S rRNA gene sequences. Environmental Microbiome 2020, 15, 1–12. [Google Scholar] [CrossRef]
- Aßhauer, K.P.; Wemheuer, B.; Daniel, R.; Meinicke, P. Tax4Fun: predicting functional profiles from metagenomic 16S rRNA data. Bioinformatics 2015, 31, 2882–2884. [Google Scholar] [CrossRef]
- GBIF.org. GBIF Occurrence Download. Available online: https://www.gbif.org/occurrence/download/0008537-241126133413365 (accessed on 30 November 2024).
- Fick, S.E.; Hijmans, R.J. WorldClim 2: new 1-km spatial resolution climate surfaces for global land areas. International journal of climatology 2017, 37, 4302–4315. [Google Scholar] [CrossRef]
- Wildlife Conservation Society-WCS; Center For International Earth Science Information Network-CIESIN-Columbia University. Last of the wild project, version 2, 2005 (LWP-2): Global human footprint dataset (Geographic); NASA Socioeconomic Data and Applications Center (SEDAC): Palisades, NY, USA, 2005. [Google Scholar]
- Wu, T.; Lu, Y.; Fang, Y.; Xin, X.; Li, L.; Li, W.; Jie, W.; Zhang, J.; Liu, Y.; Zhang, L. The Beijing climate center climate system model (BCC-CSM): The main progress from CMIP5 to CMIP6. Geoscientific Model Development 2019, 12, 1573–1600. [Google Scholar] [CrossRef]
- Xiao-Ge, X.; Tong-Wen, W.; Jie ZHANG, F.Z.; Wei-Ping, L.; Yan-Wu ZHANG, Y.-X.L.; Yong-Jie, F.; Wei-Hua, J.; Li ZHANG, M.D.; Xue-Li, S.; Jiang-Long, L. Introduction of BCC models and its participation in CMIP6. Advances in Climate Change Research 2019, 15, 533. [Google Scholar]
- Feng, X.; Park, D.S.; Liang, Y.; Pandey, R.; Papeş, M. Collinearity in ecological niche modeling: Confusions and challenges. Ecology and evolution 2019, 9, 10365–10376. [Google Scholar] [CrossRef] [PubMed]
- Menchions, E.; Francis, I.; Knoblauch, V.; Weinhagen, C. Can species distribution modelling improve the climate threat assessment of at-risk mosses in Canada? The University of British Columbia: Vancouver, BC, Canada, 2021. [Google Scholar]
- Hao, T.; Elith, J.; Lahoz-Monfort, J.J.; Guillera-Arroita, G. Testing whether ensemble modelling is advantageous for maximising predictive performance of species distribution models. Ecography 2020, 43, 549–558. [Google Scholar] [CrossRef]
- Jia, T.; Qi, Y.; Zhao, H.; Xian, X.; Li, J.; Huang, H.; Yu, W.; Liu, W.-x. Estimation of climate-induced increased risk of Centaurea solstitialis L. invasion in China: An integrated study based on biomod2. Frontiers in Ecology and Evolution 2023, 11, 1113474. [Google Scholar] [CrossRef]
- Yang, L.; Jia, H.; Hua, Q. Predicting suitable habitats of parasitic desert species based on Biomod2 ensemble model: Cynomorium songaricum rupr and its host plants as an example. BMC Plant Biology 2025, 25, 351. [Google Scholar] [CrossRef]
- Sillero, N.; Ribeiro-Silva, J.; Arenas-Castro, S. Shifts in climatic realised niches of Iberian species. Oikos 2022, 2022, e08505. [Google Scholar] [CrossRef]
- Gutiérrez-Lucas, L.R.; Montor-Antonio, J.J.; Cortés-López, N.G.; del Moral, S. Strategies for the extraction, purification and amplification of metagenomic DNA from soil growing sugarcane. Advances in Biological Chemistry 2014, 4, 281–289. [Google Scholar] [CrossRef]
- Iturbe-Espinoza, P.; Brandt, B.W.; Braster, M.; Bonte, M.; Brown, D.M.; van Spanning, R.J. Effects of DNA preservation solution and DNA extraction methods on microbial community profiling of soil. Folia Microbiologica 2021, 66, 597–606. [Google Scholar] [CrossRef]
- Macnaughton, S.; Stephen, J.R.; Chang, Y.-J.; Peacock, A.; Flemming, C.A.; Leung, K.; White, D.C. Characterization of metal-resistant soil eubacteria by polymerase chain reaction-denaturing gradient gel electrophoresis with isolation of resistant strains. Canadian journal of microbiology 1999, 45, 116–124. [Google Scholar] [CrossRef]
- Kekeç, M.; Kadıoğlu, İ. İklim Değişikliğine Bağlı Olarak Xanthium strumarium L.’un Türkiye'de Gelecekte Dağılım Alanlarının Belirlenmesi. Turkish Journal of Weed Science 2020, 23, 1–14. [Google Scholar]
- Chikuruwo, C.; Masocha, M.; Murwira, A.; Ndaimani, H. Predicting the suitable habitat of the invasive Xanthium strumarium L. In southeastern Zimbabwe. Applied ecology and environmental research 2017, 15, 17–32. [Google Scholar] [CrossRef]
- Lecours, V.; Brown, C.J.; Devillers, R.; Lucieer, V.L.; Edinger, E.N. Comparing selections of environmental variables for ecological studies: A focus on terrain attributes. PLoS One 2016, 11, e0167128. [Google Scholar] [CrossRef] [PubMed]
- Kim, H.-S.; Lee, S.-H.; Jo, H.Y.; Finneran, K.T.; Kwon, M.J. Diversity and composition of soil Acidobacteria and Proteobacteria communities as a bacterial indicator of past land-use change from forest to farmland. Science of the Total Environment 2021, 797, 148944. [Google Scholar] [CrossRef] [PubMed]
- Li, S.; Li, X.; Ye, Y.; Chen, M.; Chen, H.; Yang, D.; Li, M.; Jiang, F.; Zhang, X.; Zhang, C. The rhizosphere microbiome and its influence on the accumulation of metabolites in Bletilla striata (Thunb.) Reichb. f. BMC Plant Biology 2024, 24, 409. [Google Scholar] [CrossRef]
- Berg, G.; Smalla, K. Plant species and soil type cooperatively shape the structure and function of microbial communities in the rhizosphere. FEMS microbiology ecology 2009, 68, 1–13. [Google Scholar] [CrossRef]
- Xia, Y.; Dong, M.; Yu, L.; Kong, L.; Seviour, R.; Kong, Y. Compositional and functional profiling of the rhizosphere microbiomes of the invasive weed Ageratina adenophora and native plants. PeerJ 2021, 9, e10844. [Google Scholar] [CrossRef]
- Berg, M.P.; Kiers, E.T.; Driessen, G.; Van Der HEIJDEN, M.; Kooi, B.W.; Kuenen, F.; Liefting, M.; Verhoef, H.A.; Ellers, J. Adapt or disperse: understanding species persistence in a changing world. Global Change Biology 2010, 16, 587–598. [Google Scholar] [CrossRef]
- Thuiller, W.; Albert, C.; Araújo, M.B.; Berry, P.M.; Cabeza, M.; Guisan, A.; Hickler, T.; Midgley, G.F.; Paterson, J.; Schurr, F.M. Predicting global change impacts on plant species’ distributions: future challenges. Perspectives in plant ecology, evolution and systematics 2008, 9, 137–152. [Google Scholar] [CrossRef]
Figure 2.
The Pearson correlation coefficients of 23 environmental variables.
Figure 3.
Evaluation indices of individual predictive models (AUC: area under the receiver operating characteristic, ANN: artificial neural network, CTA: classification tree analysis, FDA: flexible discriminant analysis, GAM: generalised additive model, GBM: generalised boosting model, GLM: generalised linear model, MARS: multivariate adaptive regression spline, MAXENT: maximum entropy, MAXNET: Maxent’s network equivalent, RF: random forest, XGBOOST: eXtreme gradient boosting, SRE: surface range envelope).
Figure 4.
Contribution rates of bioclimatic variables to the habitat distribution.
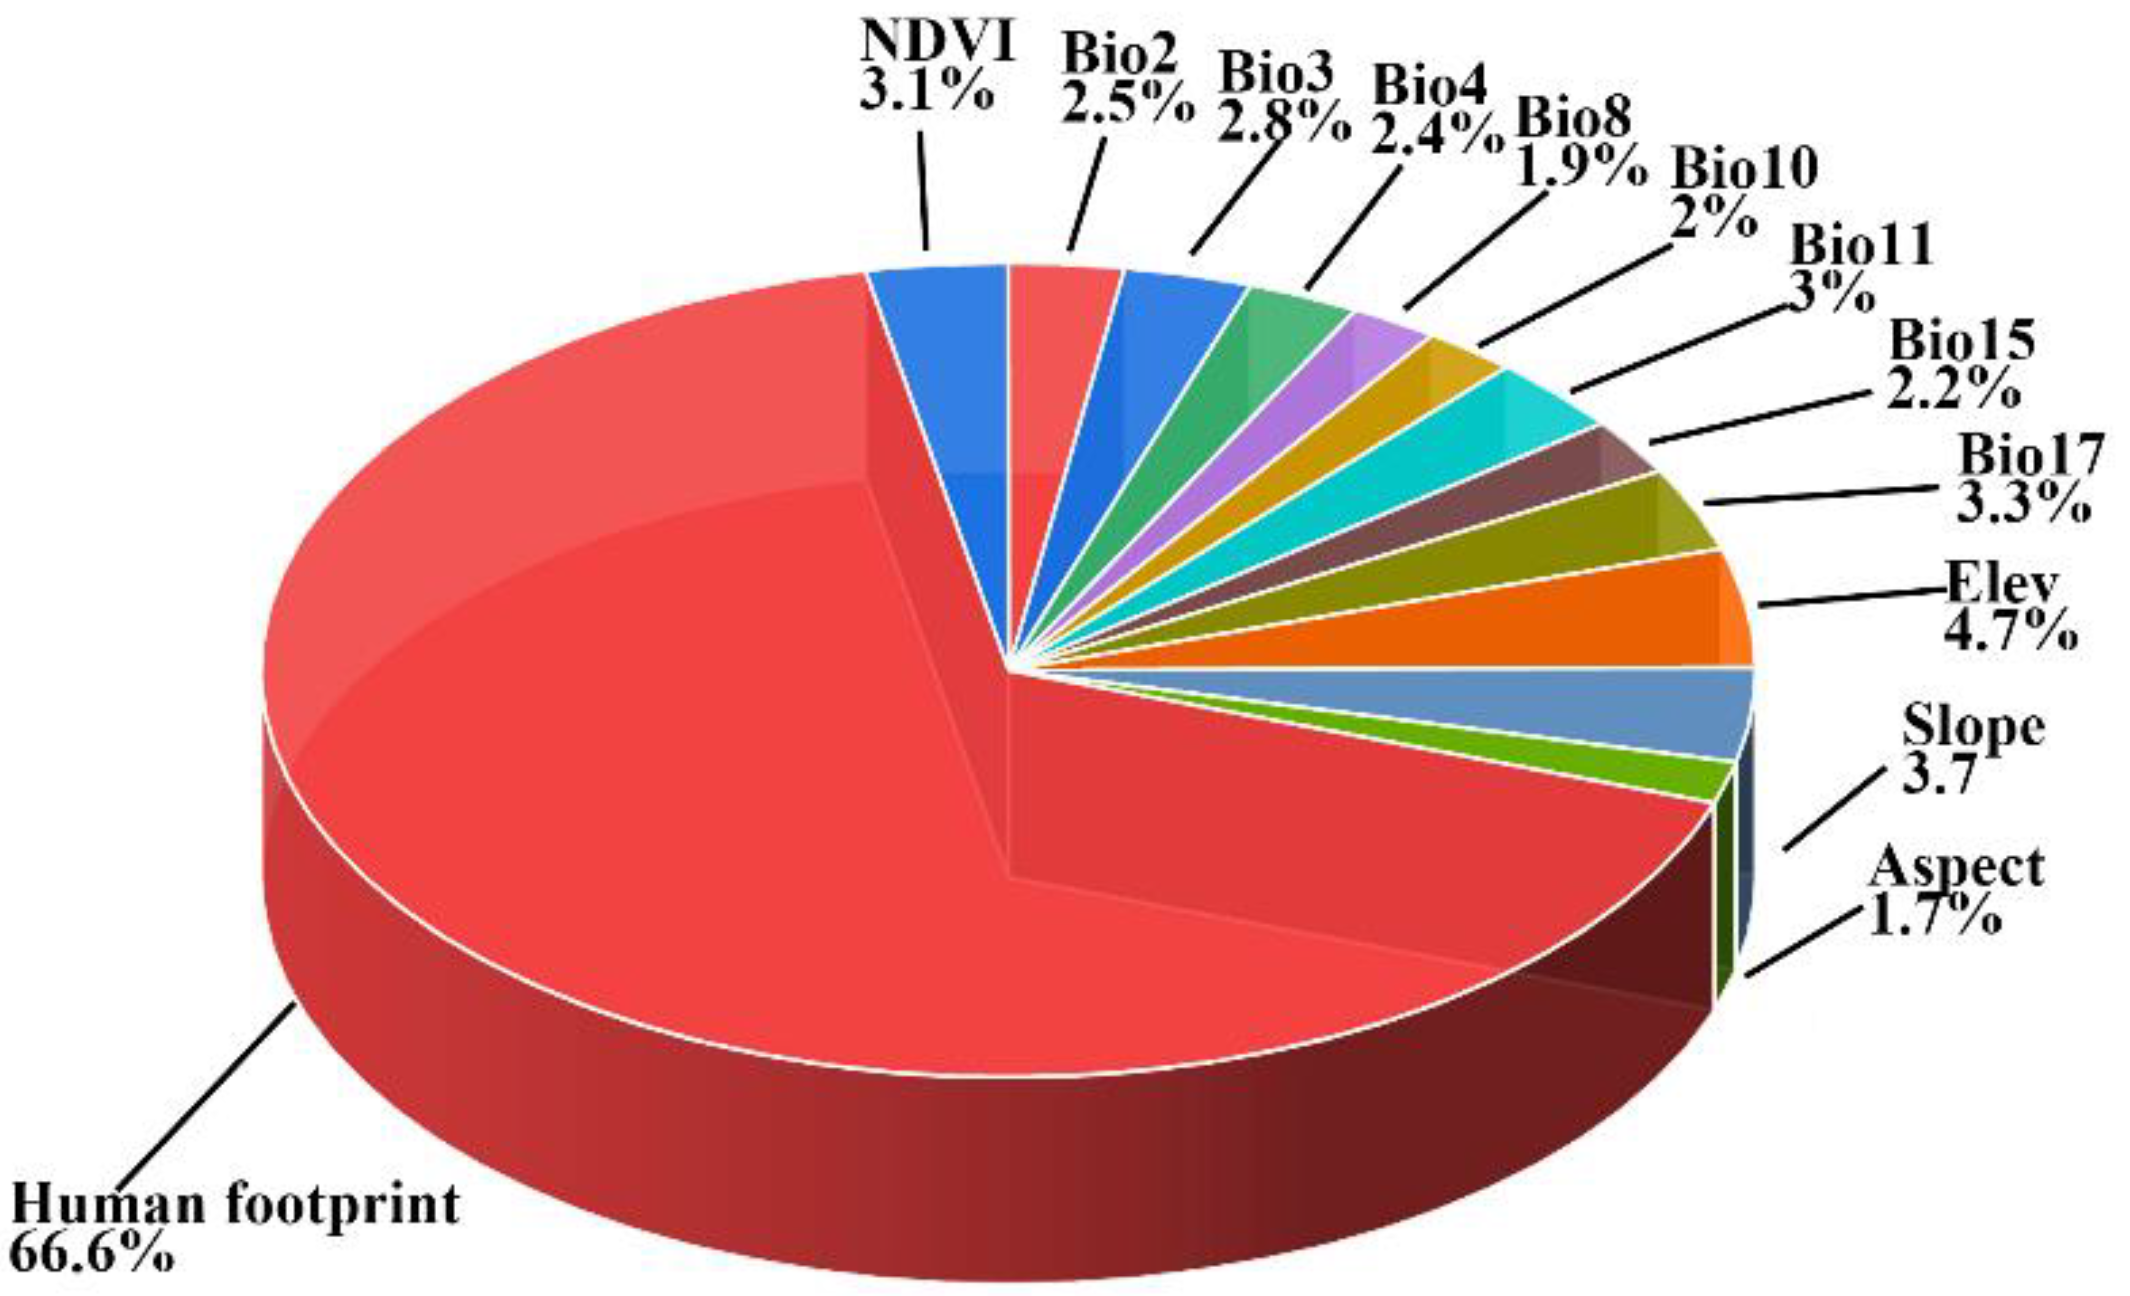
Figure 5.
Potential geographical distribution under current climate conditions.
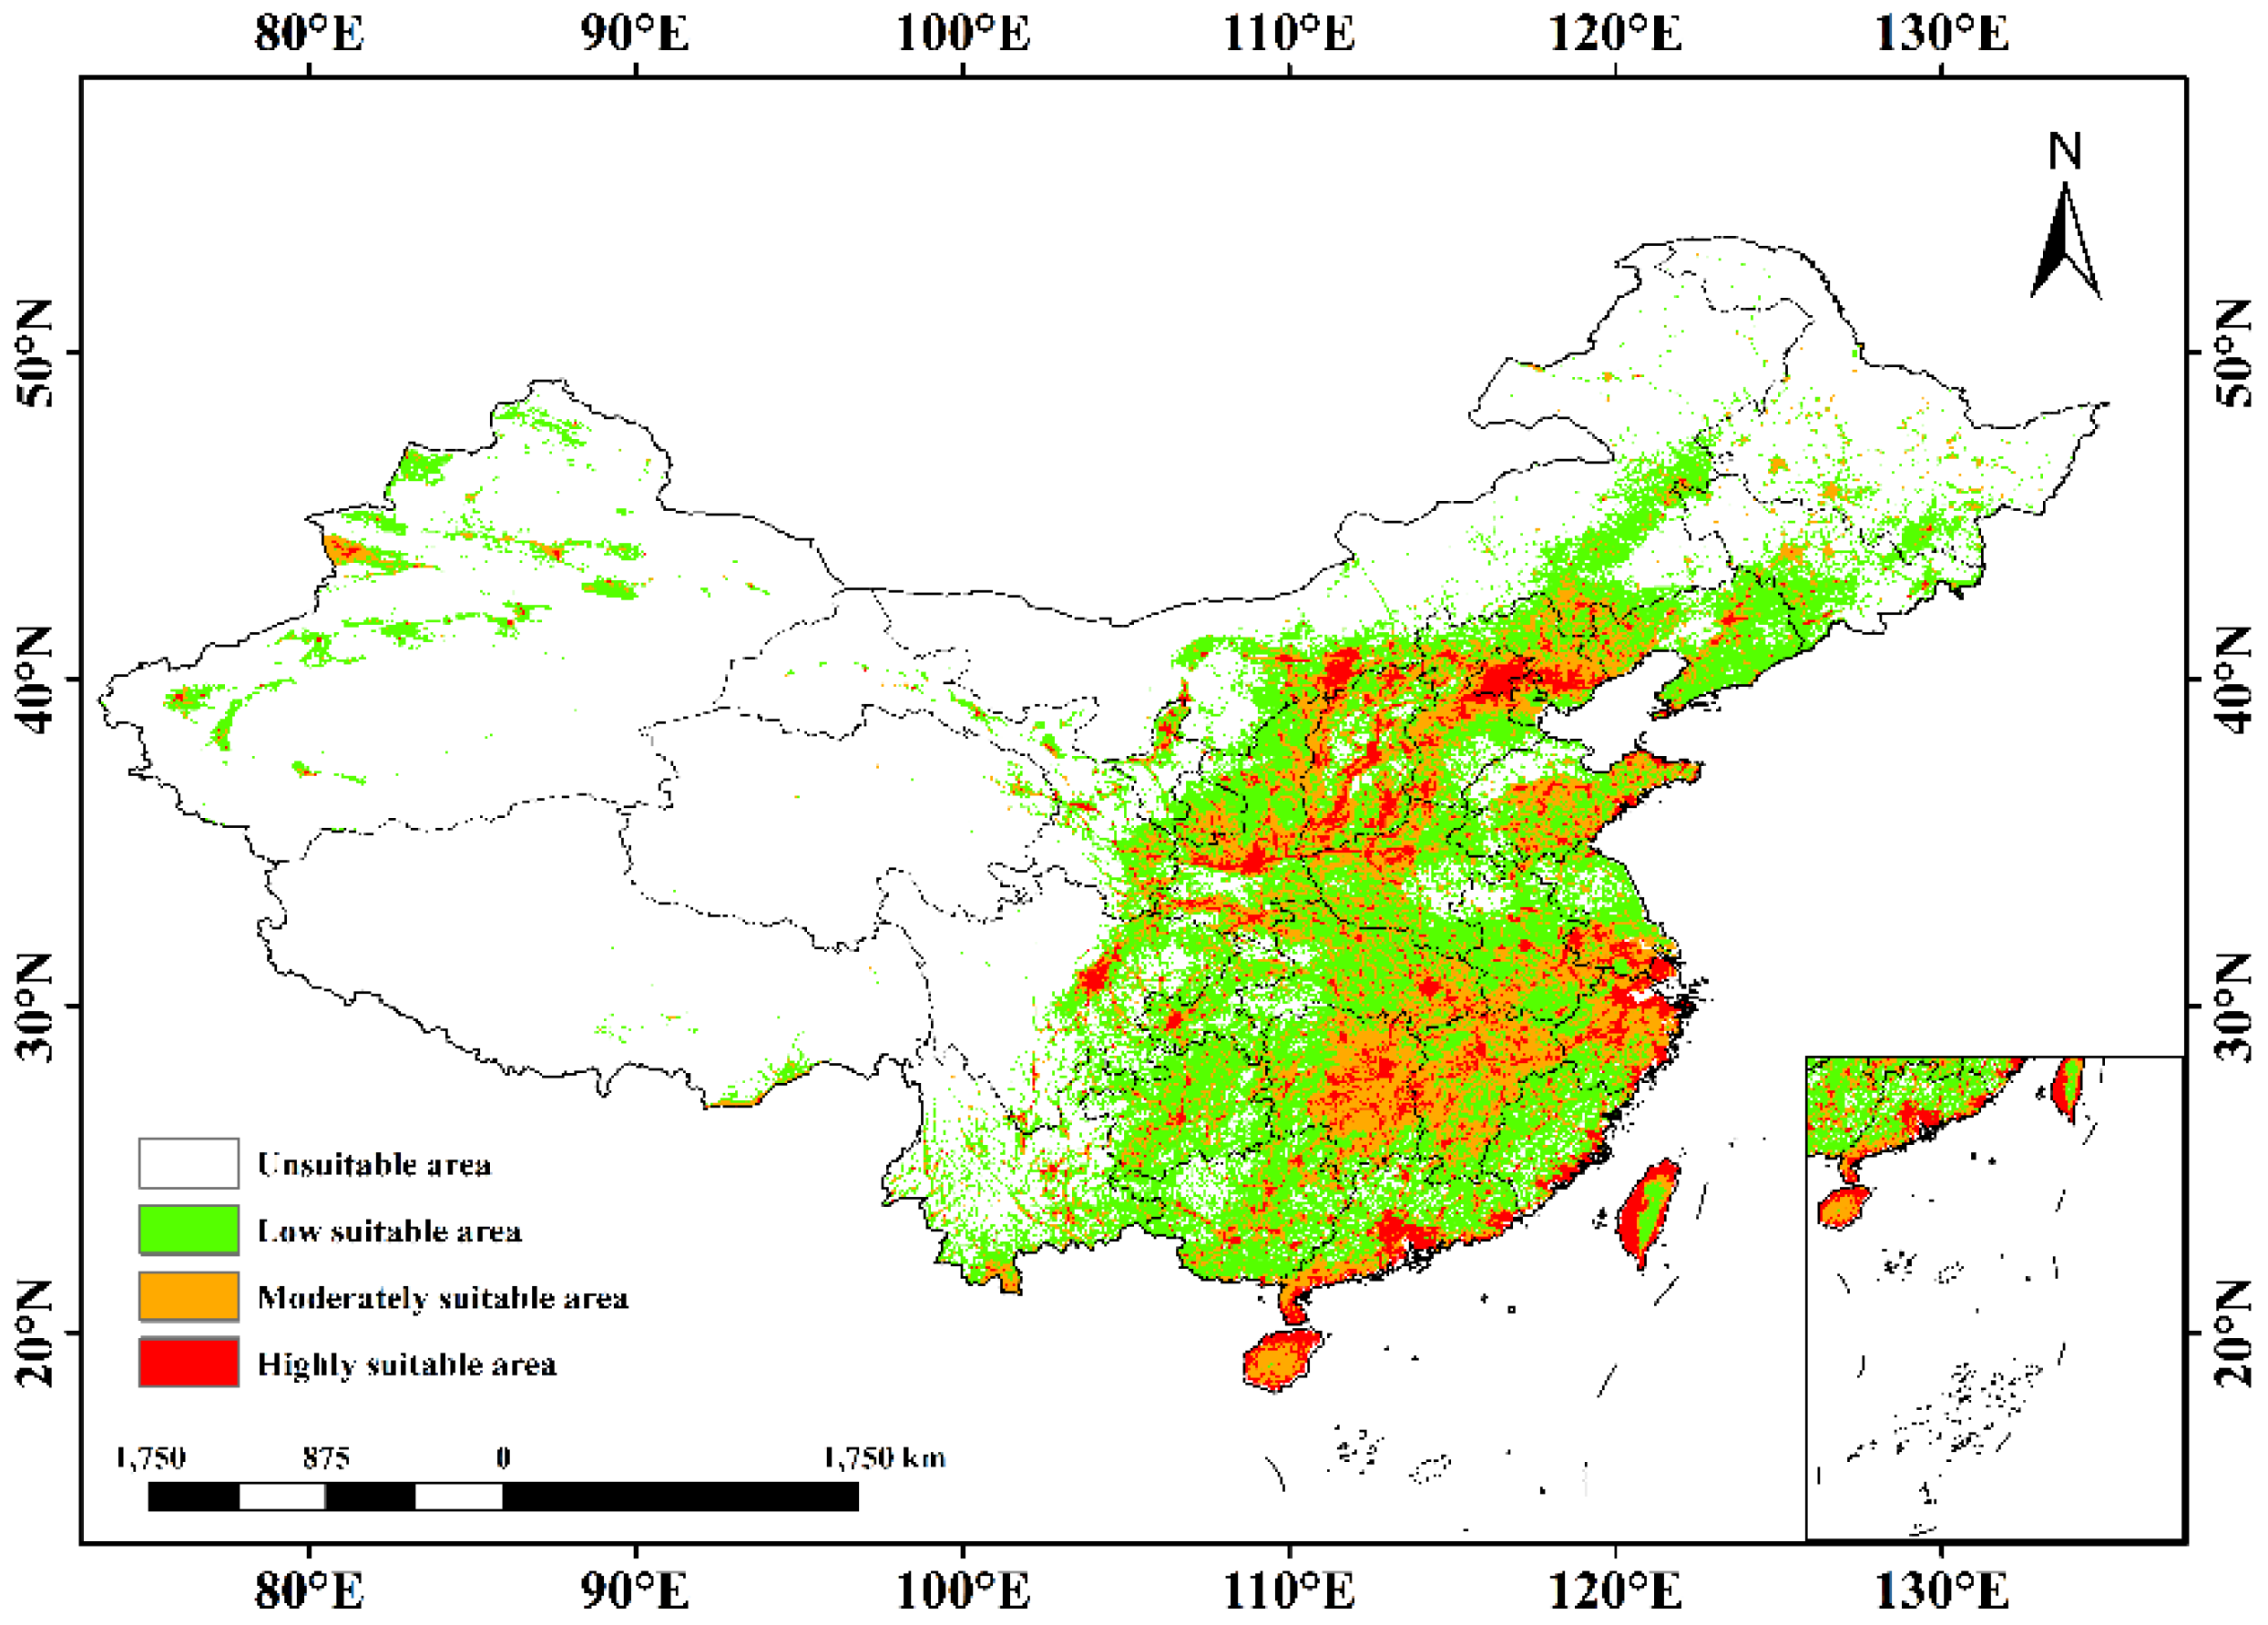
Figure 6.
Potential distributions of X. strumarium in different future periods.
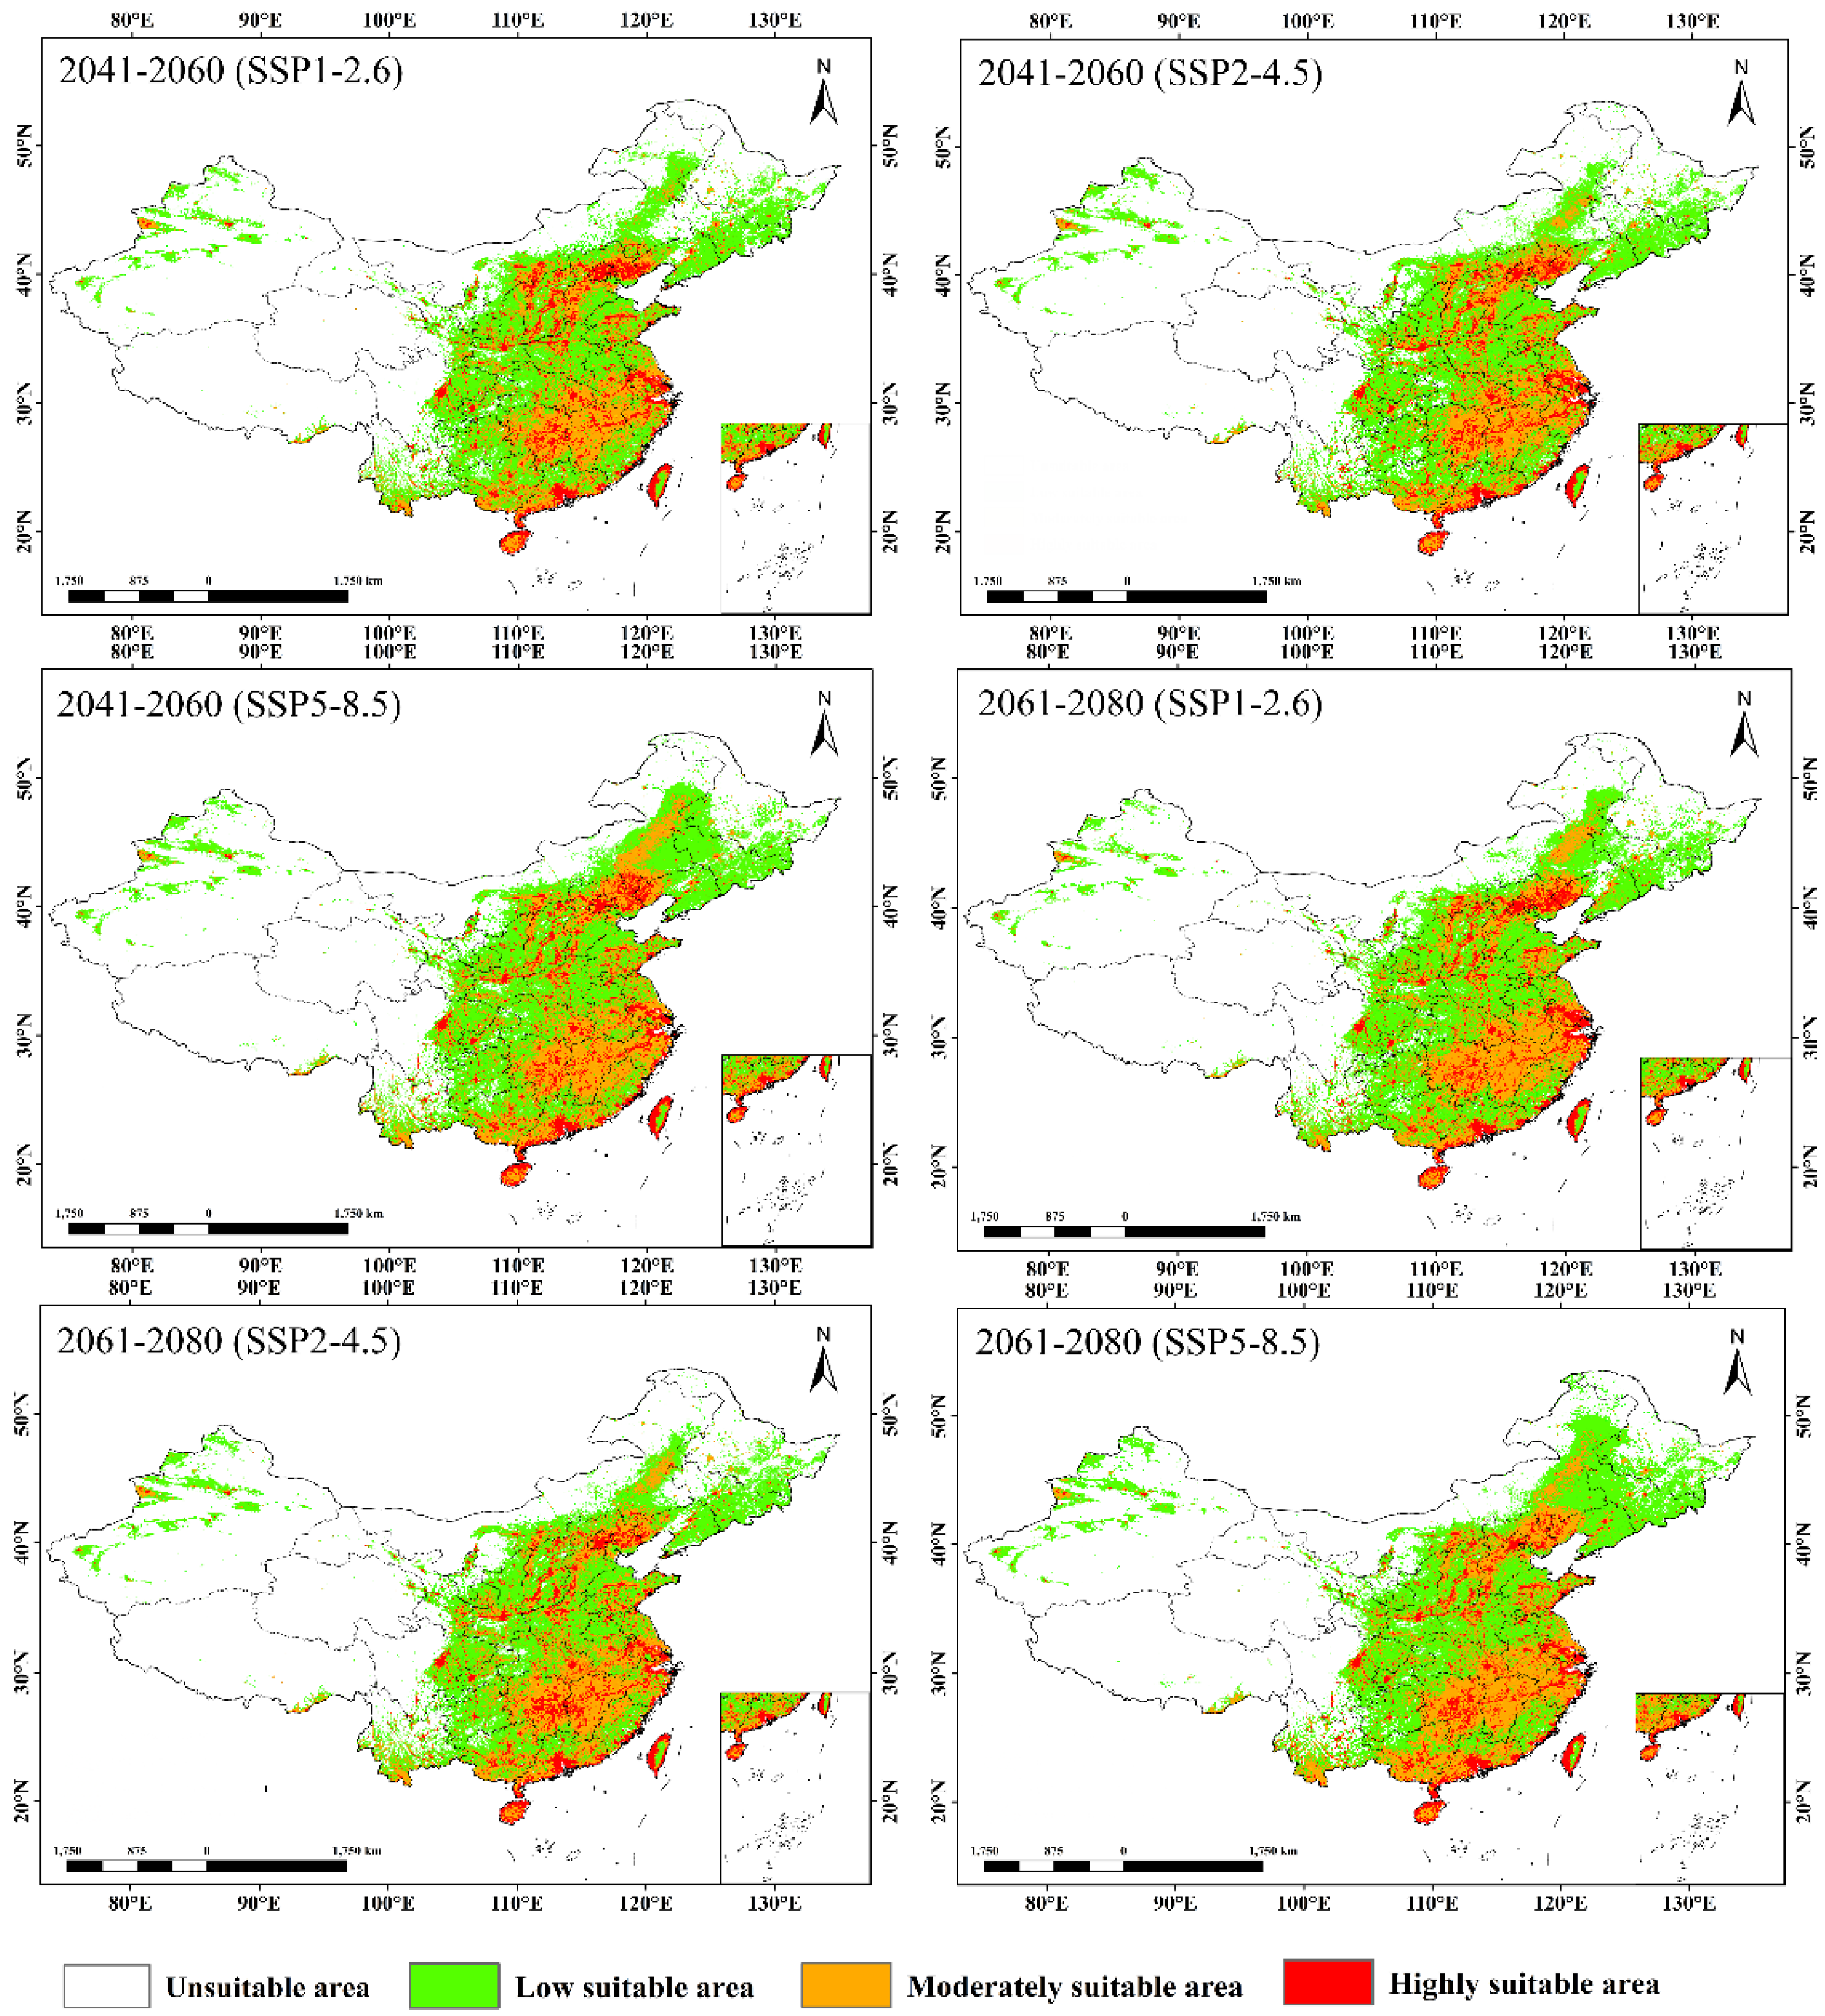
Figure 8.
The species relative abundance bar chart at the phylum level (the x-axis represents the sample name; the y-axis represents relative abundance; "Others" represents the sum of the relative abundance of all phyla other than the top 10 phyla in the chart).
Figure 8.
The species relative abundance bar chart at the phylum level (the x-axis represents the sample name; the y-axis represents relative abundance; "Others" represents the sum of the relative abundance of all phyla other than the top 10 phyla in the chart).
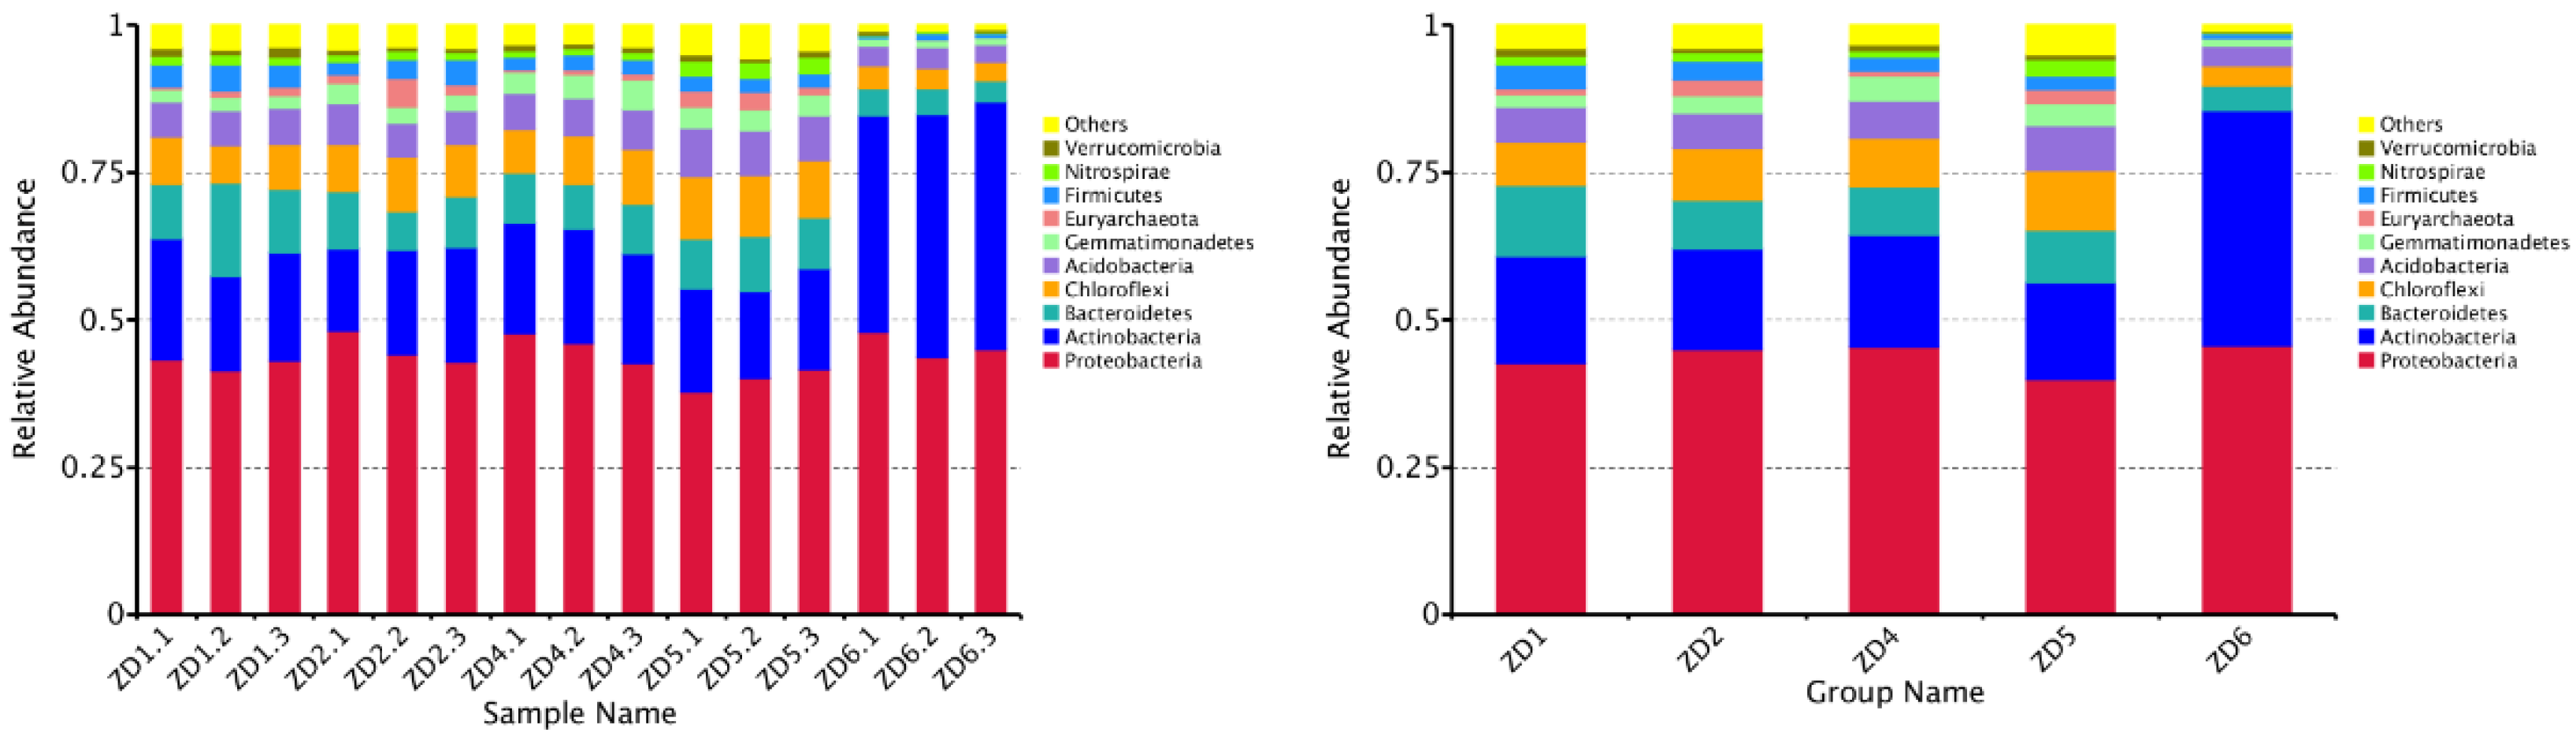
Figure 9.
The species abundance clustering chart (the vertical axis represents sample information, and the horizontal axis represents species annotation information. The clustering tree on the left side of the chart is the species clustering tree. The values in the heatmap correspond to the Z-scores of the relative abundance of each species in each row after standardization. That is, the Z-score for a sample in a specific classification is the difference between the relative abundance of the sample in that classification and the average relative abundance of all samples in that classification, divided by the standard deviation of the relative abundance of all samples in that classification).
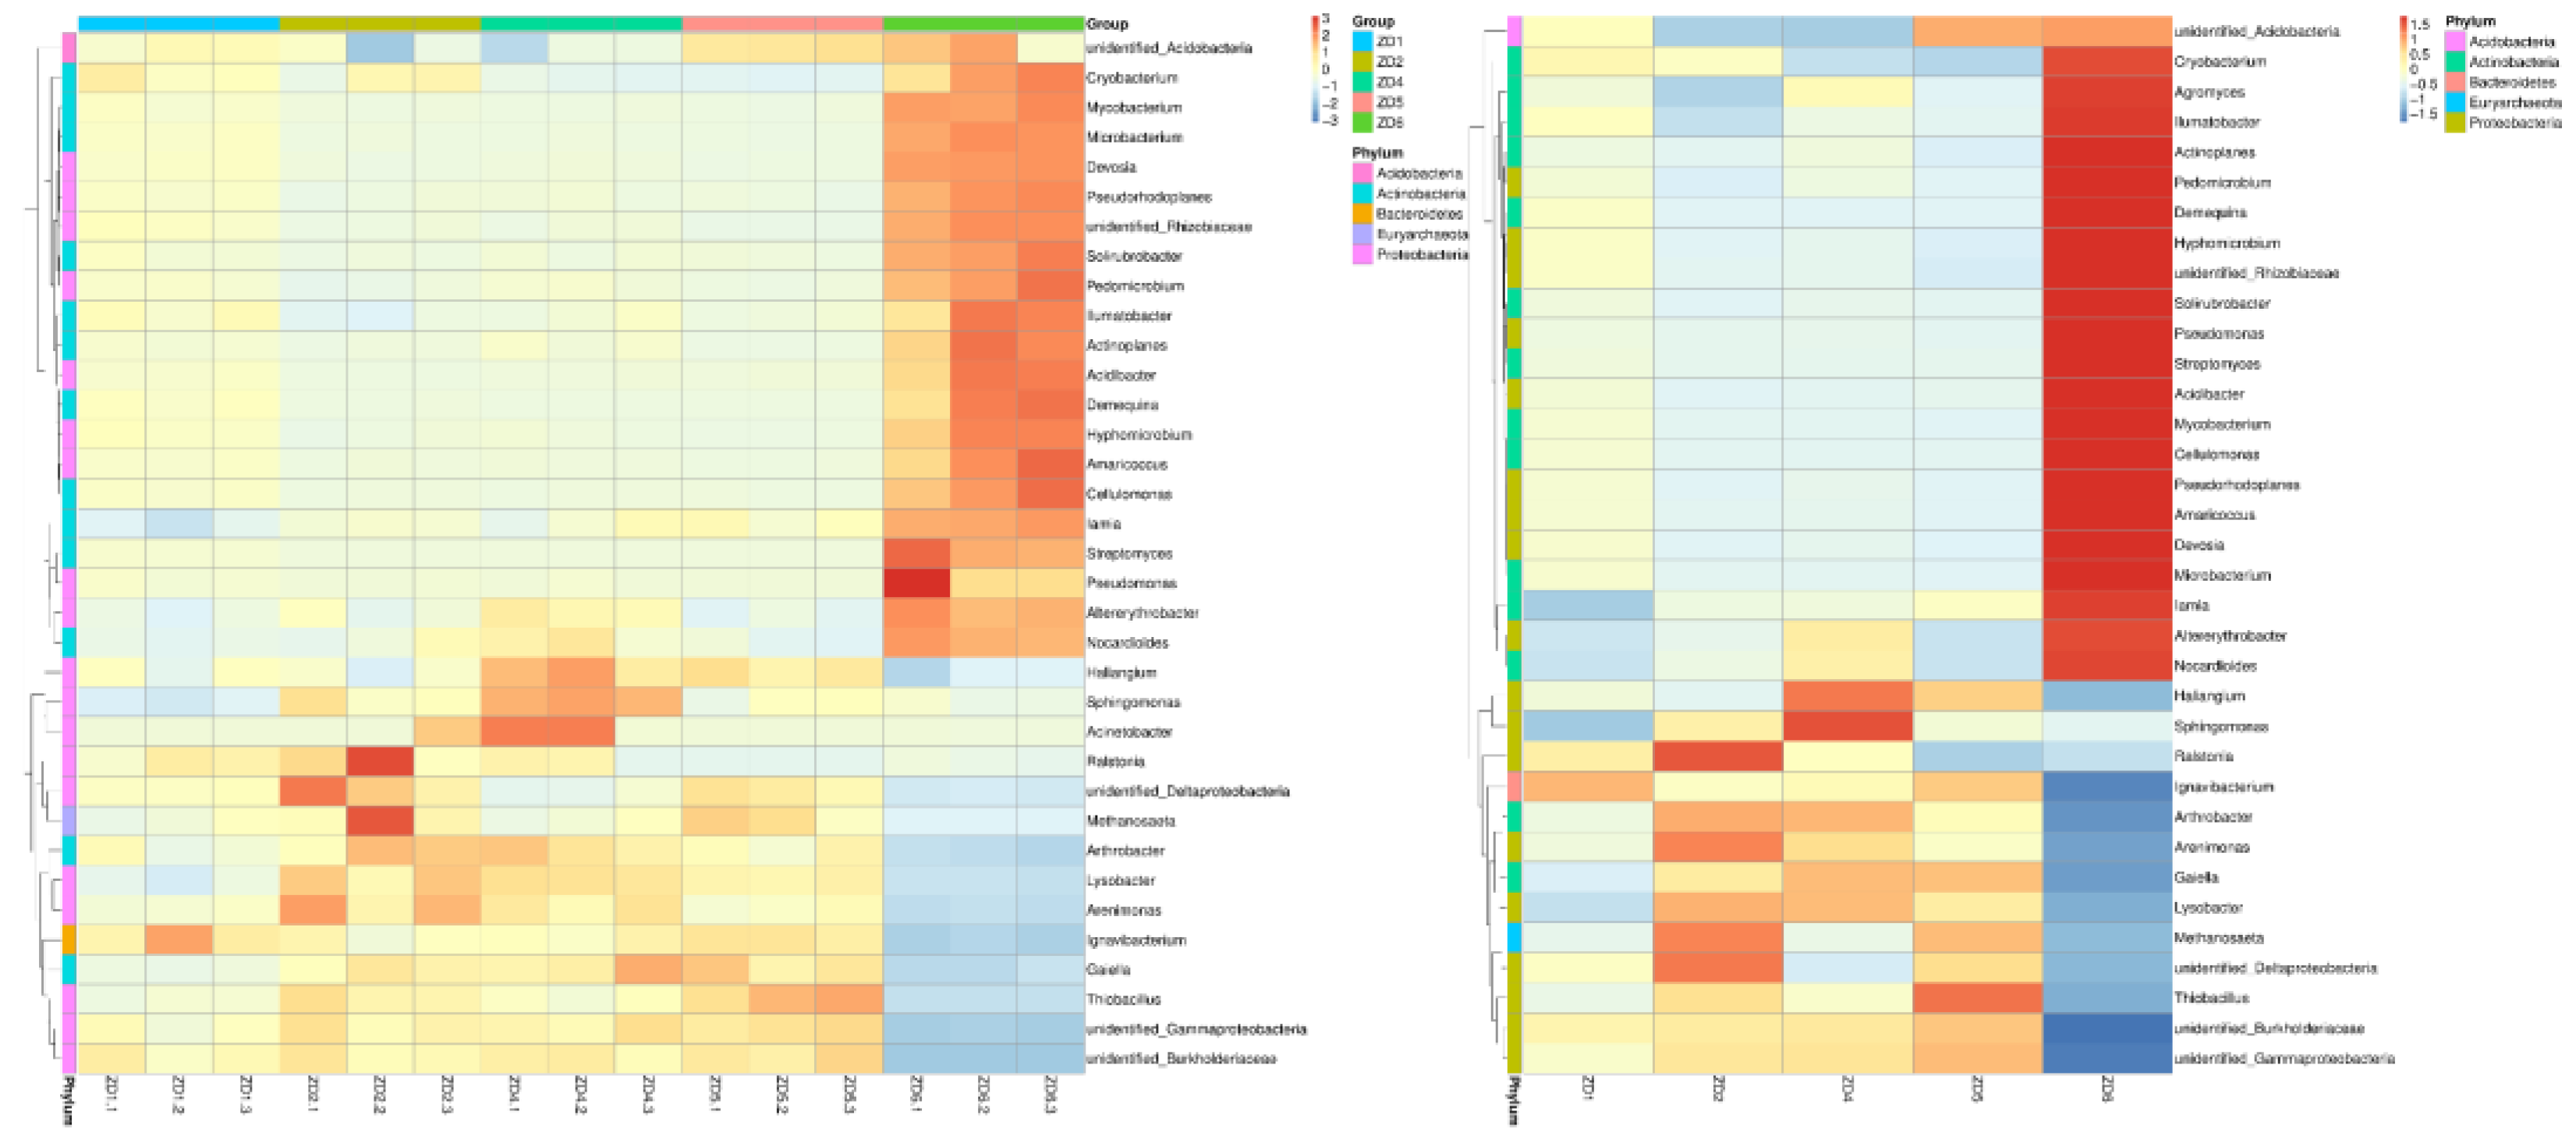
Figure 10.
The Tax4Fun functional annotation relative abundance bar chart (the x-axis represents the sample name; the y-axis represents relative abundance; "Others" represents the sum of the relative abundance of all categories beyond the top 10 categories in the chart).
Figure 10.
The Tax4Fun functional annotation relative abundance bar chart (the x-axis represents the sample name; the y-axis represents relative abundance; "Others" represents the sum of the relative abundance of all categories beyond the top 10 categories in the chart).
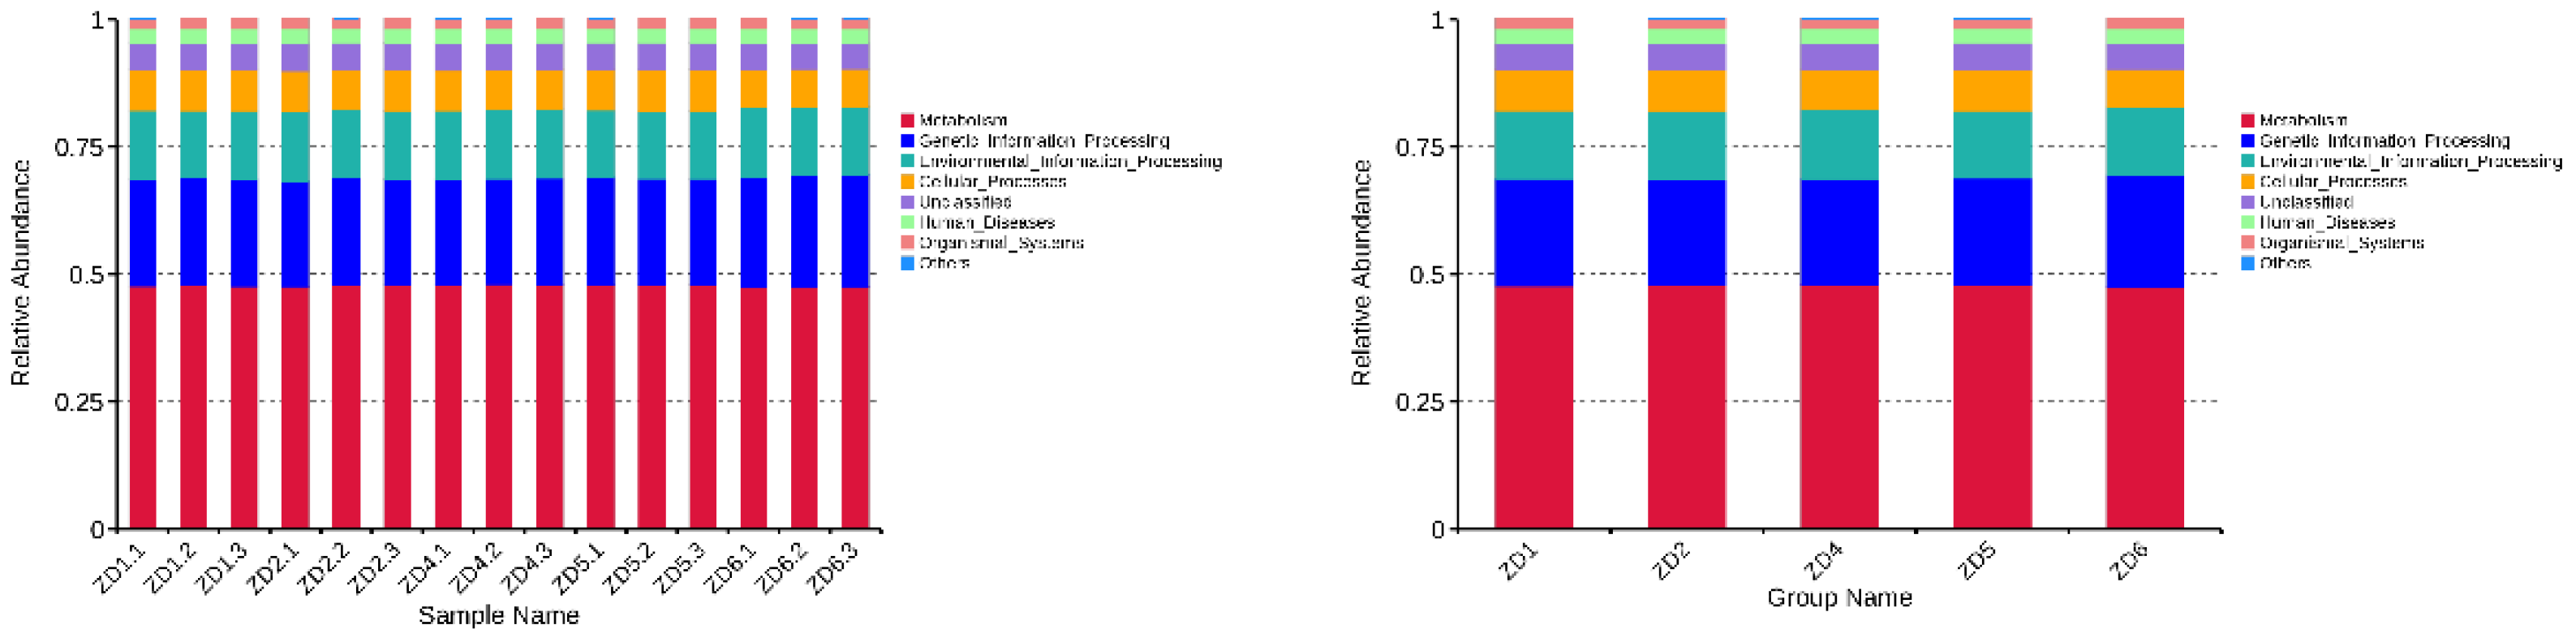
Figure 11.
The Tax4Fun functional annotation clustering heatmap (the vertical axis represents sample information, and the horizontal axis represents species annotation information. The clustering tree on the left side of the chart is the species clustering tree. The values in the heatmap correspond to the Z-scores of the relative abundance of each species in each row after standardization. That is, the Z-score for a sample in a specific classification is the difference between the relative abundance of the sample in that classification and the average relative abundance of all samples in that classification, divided by the standard deviation of the relative abundance of all samples in that classification).
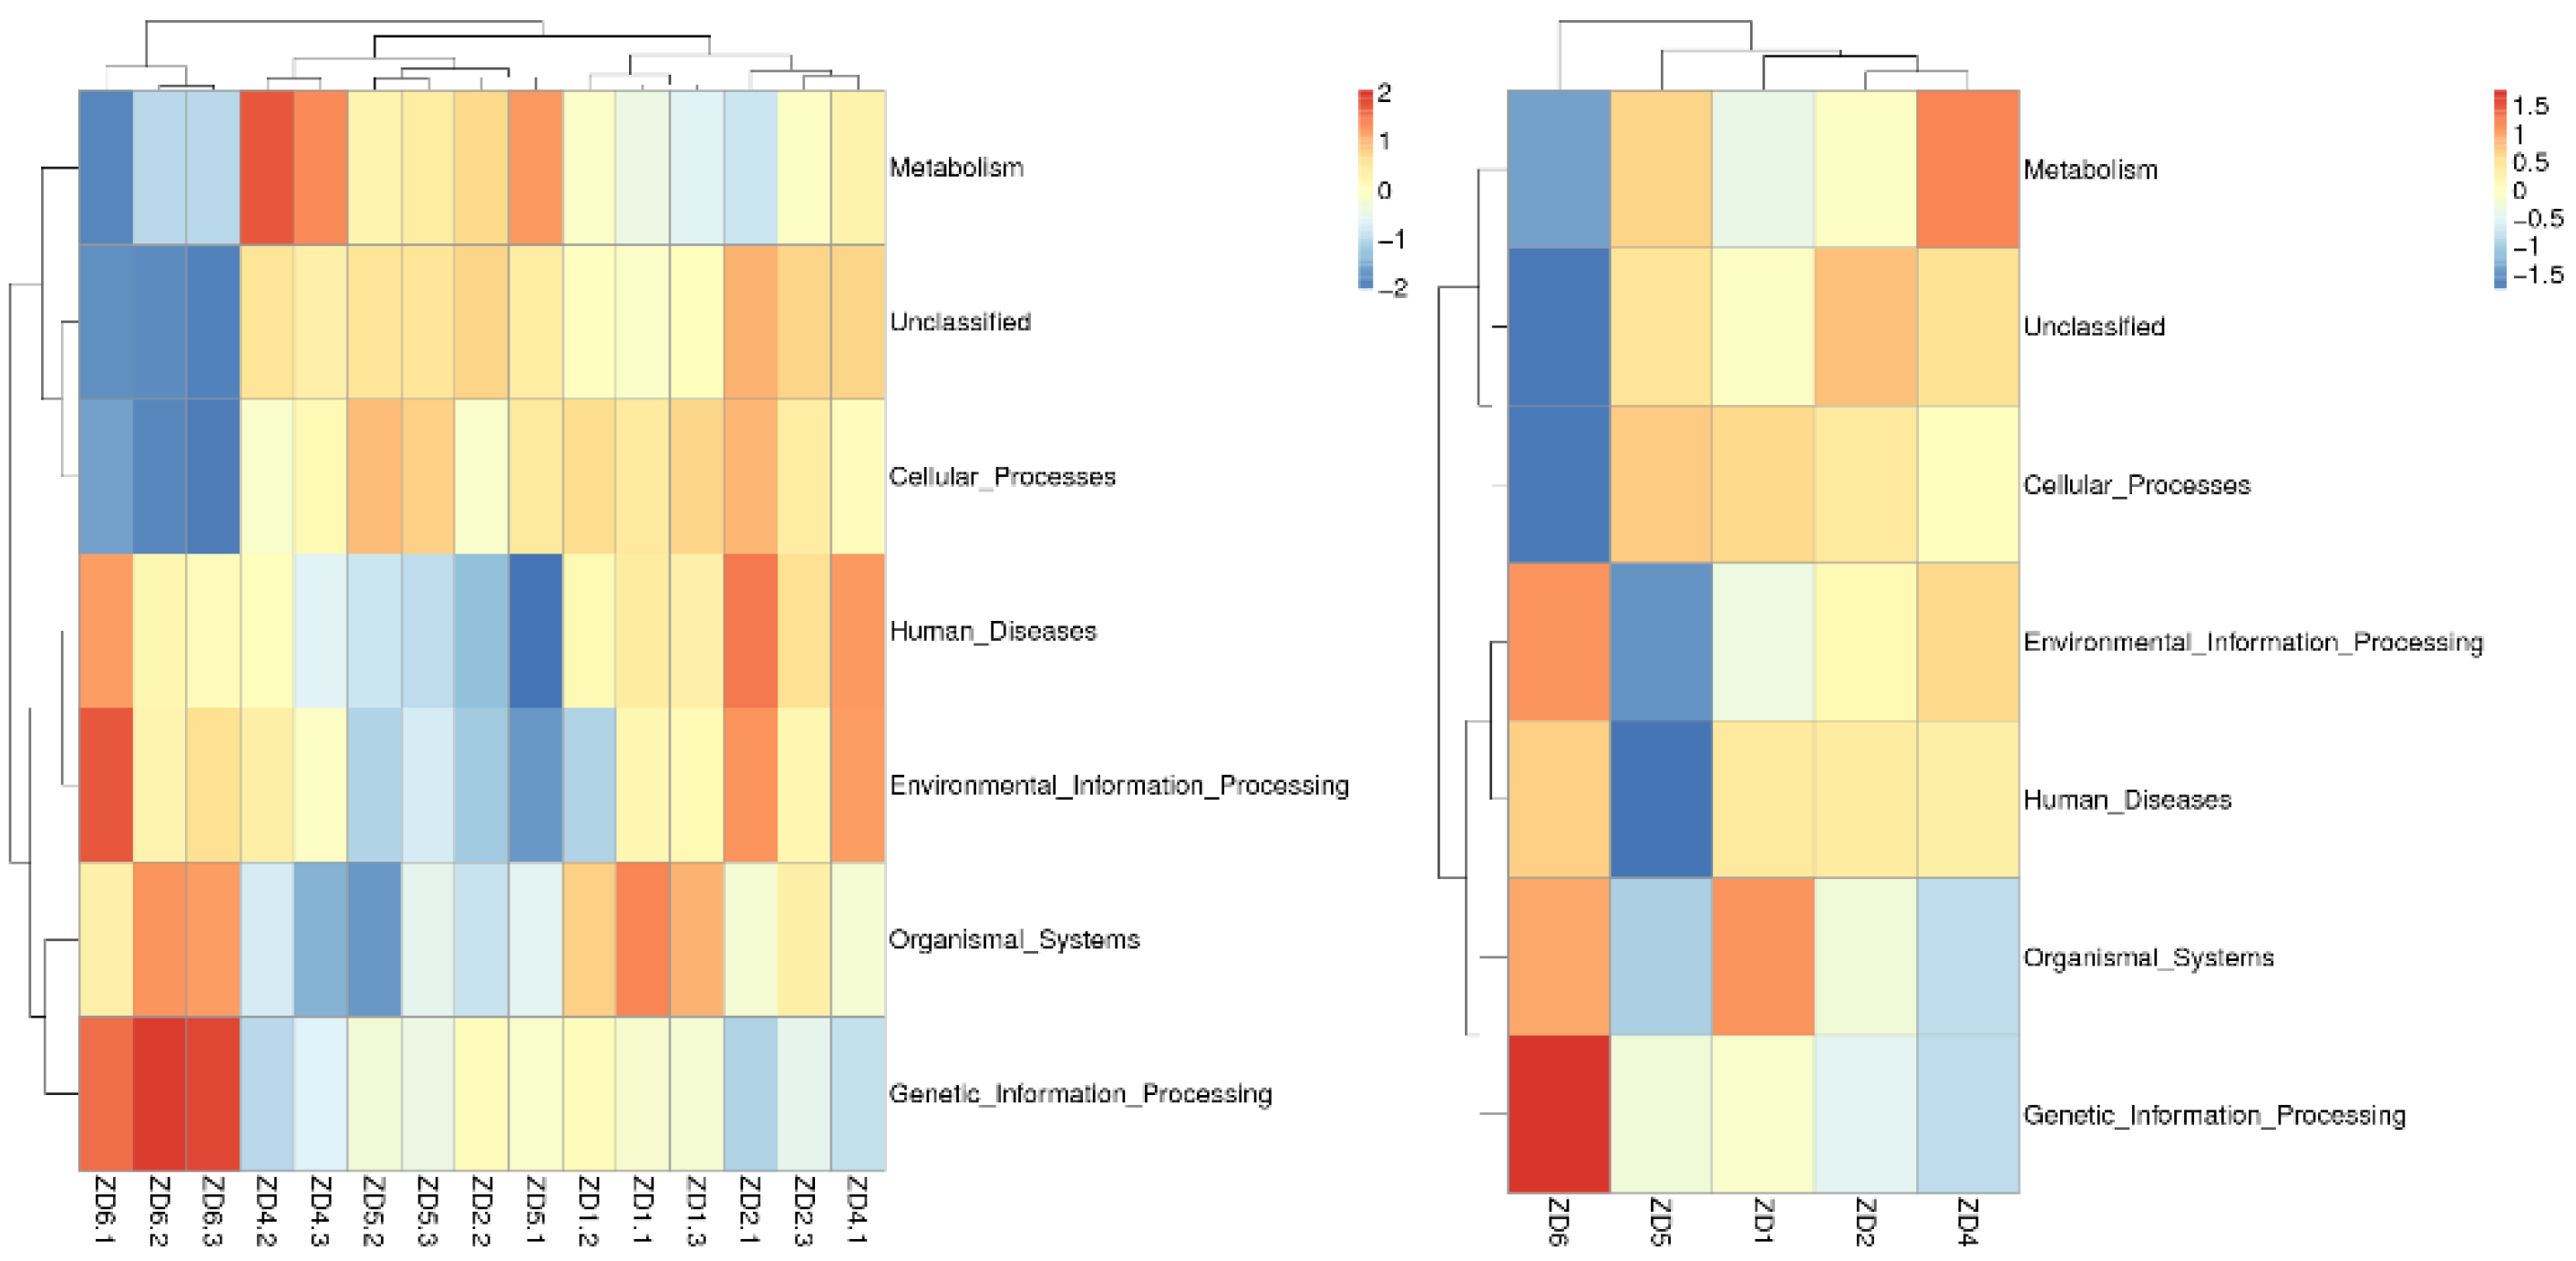
Figure 12.
Display of Tax4Fun functional annotation PCA results (samples with more similar functional compositions are closer to each other in the dimensionality reduction plot).
Figure 12.
Display of Tax4Fun functional annotation PCA results (samples with more similar functional compositions are closer to each other in the dimensionality reduction plot).
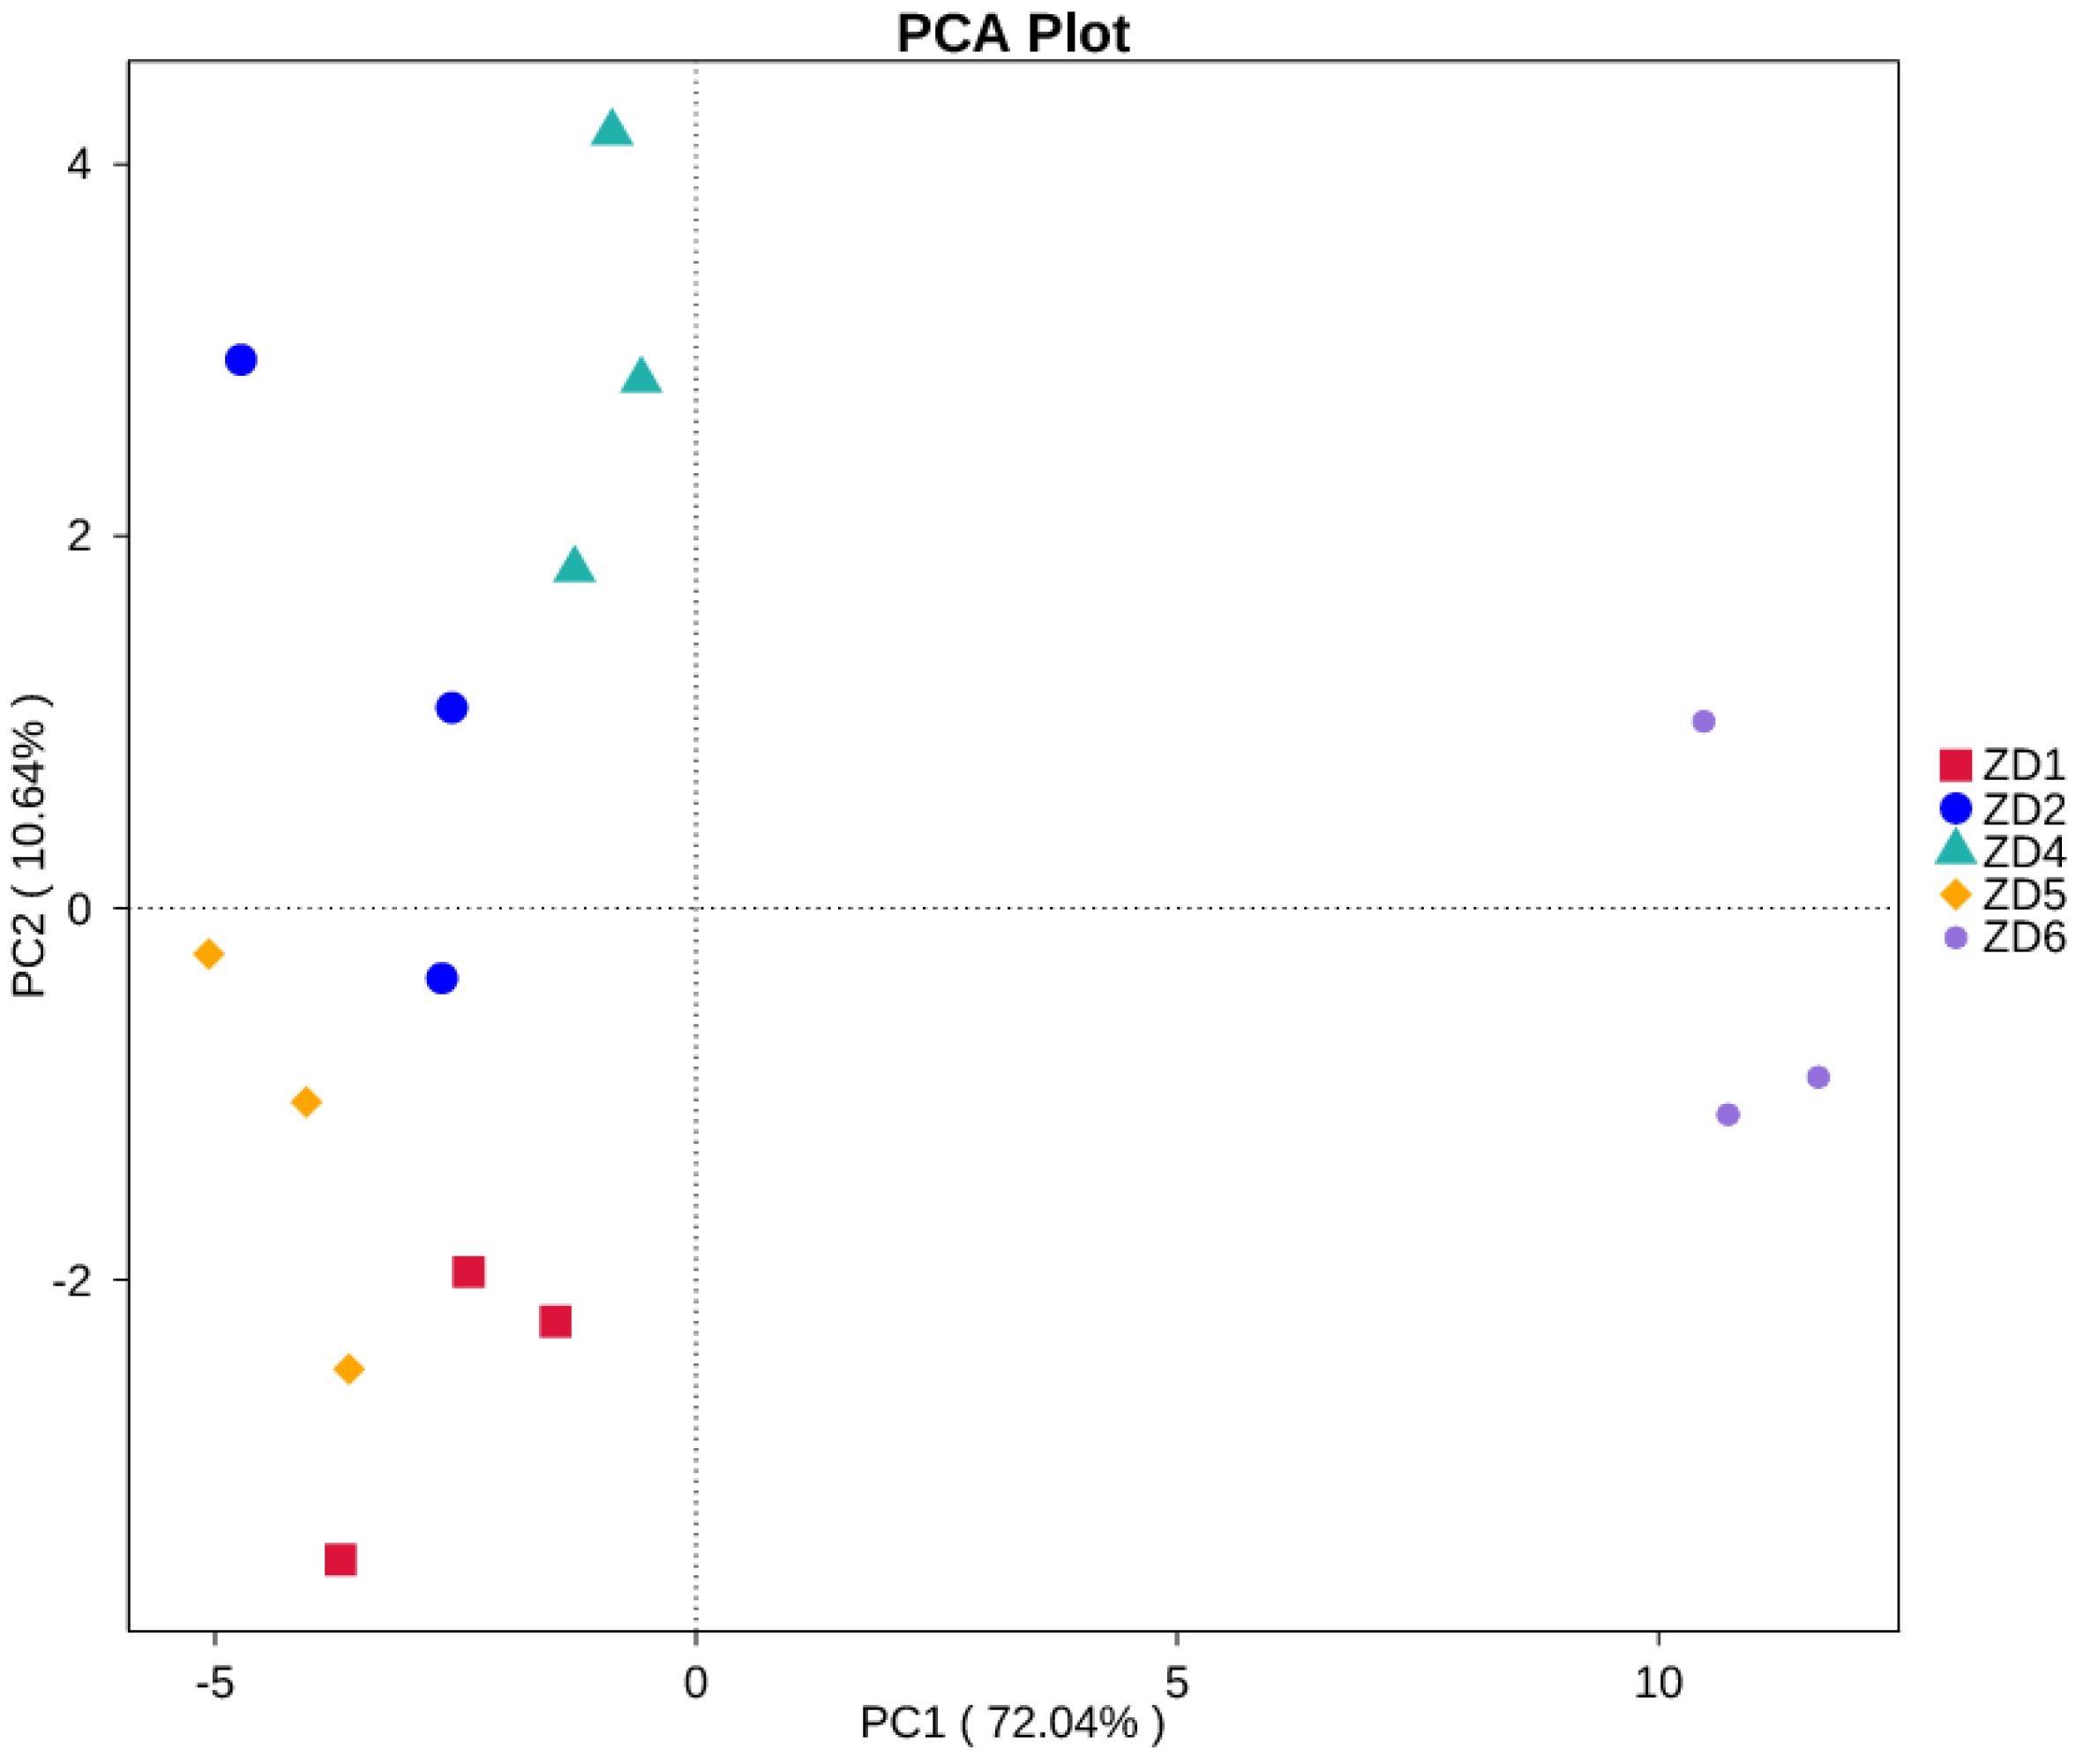

Table 1.
Environmental variables for the models.
| Category | Variable | Description | Unit |
|---|---|---|---|
| Climate | Bio2 | Mean diurnal range | °C |
| Bio3 | Isothermality | \ | |
| Bio4 | Temperature seasonality | \ | |
| Bio8 | Mean temperature of wettest quarter | °C | |
| Bio10 | Mean temperature of warmest quarter | °C | |
| Bio11 | Mean temperature of coldest quarter | °C | |
| Bio15 | Precipitation seasonality | \ | |
| Bio17 | Precipitation of driest quarter | mm | |
| Topography | Elev | Elev | m |
| Aspect | Aspect | ° | |
| Slope | Slope | ° | |
| Human | Human footprint | Human footprint | \ |
| Vegetation | NDVI | Normalized difference vegetation index | \ |
Table 2.
Rhizosphere soil sampling sites of Xanthium strumarium.
| Site | Location | Coordinates | Habitat Type |
|---|---|---|---|
| ZD1 | Yematu Village, Xincheng District, Hohhot | 111°51′48.194″E, 40°55′52.378″N | Farmland Edge |
| ZD2 | Hadamen National Forest Park | 111°35′18.977″E, 41°01′04.115″N | Montane Forest |
| ZD4 | Saihanwula National Nature Reserve | 118°39′40.185″E, 44°15′41.225″N | Temperate Steppe |
| ZD5 | East Campus, Inner Mongolia Agricultural University | 111°43′00.034″E, 40°49′03.373″N | Urban Green Space |
| ZD6 | Huanghuagou Grassland Cultural Resort | 112°32′06.128″E, 41°08′28.420″N | Grassland |
Table 3.
Changes in the distribution area of X. strumarium during different periods under different scenarios (104 km2).
Table 3.
Changes in the distribution area of X. strumarium during different periods under different scenarios (104 km2).
| Period | Climate Scenario | Low suitable area | Moderately suitable area | High suitable area |
|---|---|---|---|---|
| current | 198.70486 | 94.239585 | 36.871528 | |
| 2041-2060 | SSP1-2.6 | 214.12327 | 121.80209 | 47.453126 |
| SSP2-4.5 | 214.8698 | 122.04167 | 46.569445 | |
| SSP5-8.5 | 225.38889 | 134.07813 | 46.918404 | |
| 2061-2080 | SSP1-2.6 | 210.57292 | 127.92188 | 46.440973 |
| SSP2-4.5 | 209.90973 | 127.00695 | 46.953126 | |
| SSP5-8.5 | 228.59375 | 141.42361 | 46.119792 |
Disclaimer/Publisher’s Note: The statements, opinions and data contained in all publications are solely those of the individual author(s) and contributor(s) and not of MDPI and/or the editor(s). MDPI and/or the editor(s) disclaim responsibility for any injury to people or property resulting from any ideas, methods, instructions or products referred to in the content. |
© 2025 by the authors. Licensee MDPI, Basel, Switzerland. This article is an open access article distributed under the terms and conditions of the Creative Commons Attribution (CC BY) license (http://creativecommons.org/licenses/by/4.0/).
Copyright: This open access article is published under a Creative Commons CC BY 4.0 license, which permit the free download, distribution, and reuse, provided that the author and preprint are cited in any reuse.


