Submitted:
31 March 2025
Posted:
31 March 2025
You are already at the latest version
Abstract
The application of digital inclusive finance in various industries, particularly in rural areas, is gaining significant attention. The traditional agricultural sector, which focuses on rural labor economics, is more sensitive to financial innovations due to geographical and other constraints. This paper investigates how digital inclusive finance affects rural labor economics by integrating the Improved Gravitational Search Algorithm Random Forest (IGSA-RF) with the Gini coefficient, Out-of-Bag (OOB) coefficient, and the Gini-OOB coupling coefficient. For empirical analysis, Jiangsu Province, China, is selected as the research subject. The findings suggest that: (1) Digital inclusive finance has a long-term positive impact on consumption, gross regional product, and the average wage index of rural workers; (2) There is a growing trend in agricultural machinery power over time. However, the study found that gender, age, and the development of labor-intensive industries did not show significant improvement. To further enhance rural labor economics, the study builds a framework based on the comprehensive application of digital finance, focusing on those in rural areas who are vulnerable to fluctuations in financial markets.
Keywords:
IGSA-RF
; Digital inclusive finance
; Rural labor economics
; Gini-OOB
; Impact mechanism
1. Introduction
In the context of the 5G trend spreading globally, a series of digital technologies represented by blockchain, cloud computing, mobile internet, artificial intelligence, and large language models are gradually infiltrating the field of financial technology. Digital technology and inclusive finance open a new mode of accelerating deep integration, and the concept of digital inclusive finance is widely mentioned in various countries [1]. Nowadays, many countries are deeply exploring the possibilities of digital inclusive finance to be widely used in various fields: China fully exploits the natural digital gene of Internet banks [2] and uses blockchain's de-trusting and smart contract mechanism to break the vertical development barriers of inclusive finance [3] to create a digital inclusive finance value chain. Nigeria has leveraged its massive emerging market to join forces with Mobile Money Operators (MMOs) to actively promote the path to digital inclusive finance [4]. France looks at the relationship between inclusive finance and the poor to explore a sustainable and inclusive economic model [5].
In their studies, scholars in various countries have found that weak economic performance, persistently high invisible and cyclical unemployment rates [6], and constraints in economic policies implemented in some regions [7] keep emerging due to the low utilization of labor resources in rural areas. In addition, there is a low degree of openness in the rural financial system with a dysfunctional economy, a single source of financing, and a high degree of financial exclusion. The emergence of financial activities with a digital modern trend has led to significant structural changes in the agricultural economy, and the marginal contribution of digital inclusive finance to the development of rural labor economics is relatively greater. At the same time, rural labor economics is the most widespread individual beneficiary based on the social significance of its inclusive concept of "inclusion" and its ability to provide more services to vulnerable groups [8]. The development of labor economics not only affects rural economic development and farmers' income growth but also has a significant impact on human and social development in rural areas [9]. Therefore, studying the intrinsic impact of digital inclusive finance on rural labor economics has an important theoretical contribution and application value. It is from an inclusive perspective that this paper discusses the inclusive value of digital finance and its role in the economic development of rural areas. It also provides a deeper understanding of the behavioral logic of rural residents, who are a vulnerable group in the financial market, to use the inclusive value of digital financial innovation to seek their development and rural economic development.
In recent years, along with the gradual penetration of digital technologies represented by 5G and the Internet of things into traditional rural economics and the continuous innovation and integration development, digital inclusive finance is establishing a multi-level and wide coverage service system in rural areas. At the same time, rural labor economics also shows an increasingly diversified development trend [10]. To further explore the depth and convenience of its use in the development process, scholars from various countries have explored the multidimensional impacts of the technologies and services covered by digital inclusive finance from different perspectives concerning their widespread application in rural labor economics. From a macroscopic perspective, the introduction of the overall concept of digital inclusive finance and the use of a series of digital technologies included in it have effectively contributed to the innovative development and systemic improvement of rural labor economics. In terms of its innovation to develop rural labor economics, Luo & Wang [11] conducted an empirical study on the China Household Tracking Survey (CFPS) data. It is found that increasing investment in digital infrastructure while integrating digital technologies represented by blockchain, cloud computing, artificial intelligence, and the Internet of Things with traditional rural industries, can give rise to a series of innovative business models and modes such as distance education, online healthcare, and platform economy. This will reshape the competitive advantage of rural labor economics. Du et al. [12] analyzed inter-provincial panel data in China for the last decade using a panel threshold effect and a mediating effect model. It is found that there is a double threshold effect of the breadth of digital inclusive financial coverage and the degree of digitalization on the upgrading of the consumption structure of rural residents, which mainly shows a "marginal increasing" and "inverted S-shaped" nonlinear pattern. The construction of digital inclusive finance infrastructure in rural areas can effectively promote the structural upgrading of rural labor economics. By studying the impact of digitalization on agribusiness activity, Davydchuk [13] found that digitalization has become the essence of modern mechanisms for managing enterprises' financial and economic activities in rural areas. It effectively increases the level of technological development of production and management activities, as well as the competitiveness of rural enterprises. As for the improvement and optimization of the rural labor economics system, Murendo et al. [14] used Poisson and negative binomial regression to assess the relationship between inclusive finance and the nutrition of rural households in the Zimbabwean region. Using digital finance as a factor of socioeconomic stability in rural areas, it was found that the promotion of digital inclusive financial services among rural and poor households was effective in reducing information inequality and transaction costs among urban and rural residents. Sup et al. [15] discuss the methodology of regional agribusiness development strategies, using digital economy elements to establish priority principles of development management in the field of regional agribusiness, and implementing management systems in the digital economy information space. This contributes to the process of modernization of management systems for the development of the labor economy in subsectors and rural areas.
At the micro level, the core competencies that specific technologies can bring to rural labor economics are analyzed from a range of digital technologies that make up digital inclusive finance. Thakur & Prasad [16] compare the differences between communication infrastructure and population ratios in developed and developing countries while examining successful implementation cases in the state of Jharkhand. They found that the wide coverage of 5G technology in rural areas can bridge the huge digital divide between rural and urban areas, allowing for efficient and flexible information technology transmission and communication. Qinya et al. [17] discuss the development opportunities of the agricultural economy and rural tourism under big data, based on the important position of the agricultural economy in China's national economy and the connotation and characteristics of big data, and conclude that combining rural economic reform with big data technology can improve the overall quality of rural economic development. The conclusion is that combining rural economic reform with big data technology can improve the overall quality of rural economic development. Nyika [18] compares the extent of ICTS adoption in different areas and explores the factors that impede ICTS-driven socioeconomic development in developing countries and rural areas, finding that maximizing the potential benefits of marginalized communities can enable rural areas to benefit from limited ICTS for transformative development in a variety of areas, including agriculture, education, medicine, tourism, and business. Dai & Min [19] introduced blockchain technology into the overall scenario of rural labor economics to decipher order-based agricultural financing. They focus on introducing guarantee functions such as comprehensive financing credit and risk retransfers into the specific aspects of order signing and pledge loans, thus building a financing mechanism for rural economies with the synergy of multiple entities. Guneo [20] looks at the savings effects of mobile money in rural Kenya. A cross-sectional household survey and net effect analysis revealed that technological innovations in mobile money and rotating savings, and the development of formal financial service institutions such as rotating savings and credit cooperatives were effective in alleviating the constraints on the development of rural labor economics due to the inadequacy of the local financial system. Zhang [21] fully explored the diverse financial management models of collective economic organizations in rural areas. It is found that artificial intelligence technology can build an integrated financial and business management platform by strengthening the initiative of managers and expanding the management accounting business. This brings deep changes to the financial management of rural labor economics. Ma et al. [22] used Endogenous Treatment Regression (ETR) and Unconditional Quantile Regression (UQR) techniques to identify the effects of homogeneity and heterogeneity in Internet use. The widespread use of Internet technology in rural areas was found to have a profound impact on the higher distribution of household income and expenditure. Briglauer [23] used a matched difference-in-difference estimation strategy to analyze the impact of a speedup in broadband Internet availability applied to rural areas in Bavaria, Germany, in a European state aid program. He found that increased broadband coverage by local governments through state aid had a positive effect on the economic development and employment rates of residents in rural areas.
The majority of previous studies have examined the benefits of digital inclusive finance in terms of its impact on rural labor economics development from the perspectives of macroeconomic conditions and micro market structures. Among them, methods as panel threshold, mesomeric effect, and negative binomial regression have been applied to empirical studies of the impact mechanisms of digital inclusive finance to assess the overall impact that digital inclusive finance has on the economy of rural areas; Simultaneously, some studies tapped into the economic benefits generated in rural areas from the perspective of specific digital technologies such as communication infrastructure, Integrated commodity trading system, blockchain and mobile money. However, theoretically speaking, the majority of previous research has only explored a particular aspect of the content of rural labor economics development in the context of digital finance. They lack a comprehensive framework integrating the multidimensional impact mechanisms between digital inclusive finance and rural labor economics. On the empirical side, further supplementation is needed for scientific and standardized quantitative verification and empirical data analysis.
As the application of machine learning in the financial market continues to expand [24], the use of machine learning, deep learning, and data mining algorithms in risk management and portfolio optimization has achieved remarkable success [25]. However, limited research has been conducted on leveraging machine learning algorithms, such as the Improved Gravitational Search Algorithm-Random Forest (IGSA-RF), to analyze the connection between digital inclusive finance and rural labor economics. Therefore, this paper aims to construct a rural labor economics indicator system using IGSA-RF and assess the impact of digital inclusive finance on each indicator based on the Gini-OOB coupling perspective.
Firstly, we review relevant literature and establish a multi-dimensional rural labor economics indicator system. To enhance feature selection and improve model accuracy, we propose an Improved Gravitational Search Algorithm (IGSA), which optimizes the conventional Gravitational Search Algorithm (GSA) from three dimensions. This optimized algorithm is integrated into Random Forest (RF) to refine parameter selection and feature importance evaluation. To highlight the key indicators and further quantify their impact, we employ the minimum relative information entropy principle to construct the Gini-OOB coupling coefficient. Additionally, we utilize the Lagrange multiplier method to optimize the calculation formula for combination weights. IGSA-RF ensures strong adaptability and self-learning capability, making the model construction process more robust and scientifically sound. Finally, we validate the rationality and effectiveness of the model through empirical analysis.
The paper is organized as follows, Section 2 reviews rural labor economics and digital inclusive finance in the context of the literature, and Section 3 presents the methodology and indicator tests used to construct the rural labor economics index model; Section 4 performs data processing and specific empirical analysis; Section 5 presents the experimental results and evaluates the validity of the model, giving a sound opinion; followed by the conclusion in Section 6.
2. Literature review
3.1. Digital Inclusive Finance
Digital inclusive finance refers to the application of a series of related technologies derived from the development of the Internet as the core of traditional and new financial fields. At the same time, with the advantage of the network, it provides social groups with safe, convenient, low-cost, low-threshold formal financial services on an equal footing.
Digital inclusive finance can be understood in three dimensions [26]: Digital, inclusive, and financial. Firstly, using "digital" as a service tool. By combining modern Internet technologies such as cloud computing, big data, the Internet of Things, and artificial intelligence with traditional offline service methods, we can reduce transaction costs. This will further expand the coverage, promote information sharing, enhance innovation and risk control capabilities, and optimize the industrial structure. Secondly, "Inclusive" emphasizes the accessibility of services to all social strata and the content of services. It provides convenient, safe, low-threshold, and low-cost financial products and services to all groups, thus realizing equal opportunities [27], narrowing the gap between the rich and the poor, optimizing the resource distribution pattern, and enhancing the degree of social sharing. The third is "finance" as a service content. The essence is still a commercial activity for capital financing, not social assistance. It provides services for financing and investment, savings, credit, securities trading, business insurance, and financial information consulting. The concept of digital inclusion, which explains the original intention and direction of FinTech and financial development [28], is a digital way to make formal services equally accessible to groups that have long been neglected by the modern financial services system.
2.2. Rural Labor Economics
Labor economics is the study of serving labor factors as the main object, from the macro and micro dimensions, to explore the relationship between them and economic efficiency. This labor relationship includes the combination mode of the labor force and means of production, the main elements of the division of labor and forms of collaboration, as well as the forms of distribution of individual consumer goods to the workers. The core of the research is to create the most economic benefits with the least amount of labor [29]. Research areas of labor economics include labor supply and demand, employment, wages, human capital investment, unemployment, and income distribution [30]. Rural labor economics, on the other hand, focuses on farmers as the main body of labor and takes as the object of study the production activities and economic activities they provide as labor factors. It is an economic activity that transforms rural labor resources into capital resources, optimizes the allocation of rural economic development factors, and thus realizes the growth of local social wealth [31]. At the same time, the study of rural labor economics has an important practical value and strategic significance for integrating urban and rural development, promoting the construction of social equity, and adjusting the structure of the rural economy [32].
Today's internationally focused research on rural labor economics mainly includes the following aspects [33]: labor reproduction; Labor supply and demand; farmers' employment issues; Macro-management of the labor force, including the rational flow of the labor factors, labor market management and labor force management system; Micro-management of the labor force, including labor division and collaboration, capital mobilization and staffing, labor quota and measurement, labor environment and human protection; Labor security issues, including remuneration packages, unemployment, discrimination, and economic issues in social insurance for sickness, work injuries, old age retirement, etc; Labor efficiency, including its influencing factors, ways to improve it, micro and macro labor efficiency and their interrelationships. The relationship between the main objects of study of rural labor economics is shown in Figure 1.
In this paper, on the theoretical basis of fully integrating the research results in this field and considering the possible error situation of data and practical operability, the system of rural labor economic indicators is constructed as shown in Table 1.
2.3. Influence Mechanism
Combining with the rural labor indicator system constructed in this paper, we examine the relationship between the role of digital inclusive finance on rural labor economics and unearth the following five mechanisms:
- Financial inclusion in the digital context can improve rural employment levels [53]. Digital inclusive finance makes it possible to diversify and match jobs. In addition, higher wages and lower financial constraints play an important role in easing the economic burden and increasing the level of consumption of farm households [54]. Digital inclusive finance can improve work efficiency and adaptability by increasing the training of complex talents. Meanwhile, digital inclusive finance can also enhance farmers' willingness to start their businesses by strengthening their access to credit, alleviating financing constraints [55], and spreading business risks.
- Digital inclusive finance provides an important channel for promoting rural out-migration and non-farm labor transfer [56]. Modern technology stimulates the emergence of new potential enterprises and the reform of existing enterprises [57], effectively increasing the types and numbers of non-farm jobs in society and broadening the scope of employment of rural laborers. At the same time, as digital inclusive finance eases the financial constraints of the labor force, it provides technical and financial resources to support the accumulation and transfer costs of their human capital and increases employment opportunities [58].
- Digital inclusive finance has a significant impact on the optimization of rural labor structure. On the one hand, the full flow of information and the rapid development of logistics brought about by digital inclusive finance have improved labor mobility constraints arising from policies such as the household registration system and employment age [59]. The allocation dividend of the workforce of different ages can be fully exploited. On the other hand, digital inclusive finance effectively promotes the integration of secondary and tertiary industries and accelerates the upgrading of industrial structures [60]. Rural laborers can fully enjoy the dividends of the sharing economy and enhance financial sector inclusion [61]. In addition, it can significantly improve the education level of the rural population and enhance their ability to access financial resources with modern technology.
- Digital inclusive finance is conducive to the enrichment of rural economic labor methods. With its new business model using the Internet, digital inclusive finance is transforming rural industries from labor-intensive to capital-intensive. This transformation promotes the efficient matching of factors [62], accelerates the development of township enterprises and the penetration of industrial chains, reduces the income gap between urban and rural areas [63], and "agriculture + e-commerce" is gradually becoming a new way of labor [64]. At the same time, digital inclusive finance reduces the cost of non-farm transfer of rural labor, facilitates the diversification of labor patterns, and increases the probability of success and the sharing of results.
- The synergistic effect of digital inclusive finance in the economic development of rural areas is significant, and the marginal benefits show an increasing trend. On the one hand, it affects agricultural output by influencing farmers' financing behavior [65], alleviating information asymmetry in agricultural markets, changing payment methods and transaction channels for selling agricultural products, and increasing the level of agricultural innovation. On the other hand, the use of fiscal policy to guide the role of inclusive finance [66], the establishment of a sound long-term mechanism for the supply of financial resources related to agriculture. By improving the rural logistics system and promoting the construction of a rural circulation network, it can meet the needs of rural residents to upgrade consumption and optimize the level of financial expenditure [67]. The key points of the impact of digital inclusive finance on rural labor economics mentioned in the above five-point mechanism are shown in Table 2 and Figure 2.
3. Methodology
This paper proposes a robust IGSA-RF algorithm-based method for identifying feature importance in rural labor economic indicators from a Gini-OOB dual perspective. To measure the impact of digital inclusive finance on each indicator, the Gini-OOB coupling coefficient is constructed. Firstly, we introduce the GSA and optimize it from three dimensions, leading to the development of IGSA for enhanced parameter tuning of RF. Next, the IGSA-RF algorithm is applied to select the most relevant features during splitting [68] , traversing all tree nodes and calculating the split impurity for all variables. Then, we use RF samples to autonomously train and generate a self-help sample set [69], perturb the out-of-bag data of the features, and use the quantified error rate to measure the replacement importance of the variables. Finally, we employ the minimum relative information entropy principle and apply the Lagrange multiplier method to integrate and , constructing the Gini-OOB coupling coefficient to assess the degree of influence of digital inclusive finance on various indicators of rural labor economics. The methodology framework is illustrated in Figure 3.
3.1. The IGSA Method
Although various algorithms, such as Particle Swarm Optimization (PSO) and Genetic Algorithm (GA), are available for model parameter optimization, many suffer from premature convergence and inefficient acceleration. The Gravitational Search Algorithm (GSA), inspired by gravitational principles, introduces a chaotic perturbation operator to overcome these limitations, making it effective for parameter optimization in machine learning [70,71]. This study enhances GSA from three dimensions, developing an IGSA to optimize key parameters in the RF model. Specifically, IGSA is used to fine-tune the number of decision trees, the maximum number of features selected at each split, and the minimum sample split, ensuring optimal parameter selection and improving model robustness.
In IGSA, agents represent mass-bearing objects exerting attractive forces on one another, with greater masses generating stronger attraction. The agent with the highest mass is assumed to hold the optimal position. Given N agents in a d-dimensional space, the position of the i-th agent is defined as follows:
At the t-th iteration, the force on the i-th agent from the j-th agent is given by:
Where, and are the masses of agents i-th and j-th agent. G(t) is the gravitational constant at time, is a small constant, and is the Euclidean distance between agents i-th agent and the j-th agent. The total force on the i-th agent is:
where rand is a uniform random variable between [0, 1]. The acceleration of the agent at time t is:
The velocity and position of the i-th agent are updated as:
where and are the current position and velocity of the agent. While the conventional GSA works well for parameter optimization in RF, its updates of gravitational coefficients and iteration speeds are relatively slow[70]. To overcome these limitations, we propose IGSA, which enhances the gravitational coefficient, update speed formula, and position update formula.
- Gravitational Coefficient Update: The gravitational coefficient is enhanced using a linear function, with the calculation given in Equations (7) and (8).
- Velocity update. The velocity update is improved by incorporating the memory function and population information. This strategy maintains the laws of motion while enhancing memory and communication within the population. The new velocity update is defined in in Equation (9):where randi, randj, and randk are random variables in the interval [0,1]; and c1, c2 are constants in [0,1]; is the best position of particle i; and is the best position of all particles. By adjusting c1 and c2, the balance between gravity, memory, and population information can be controlled.
- Position update. The differential evolution algorithm uses a greedy selection mode, as shown in Equation (10). If the fitness value of the new individual surpasses the target individual, it is accepted; otherwise, the previous generation's individual remains in the population. The new position's fitness is lower than the target’s.
3.2. The RF Method
Random forest, a supervised learning algorithm based on Bagging as a logical basis, is a combination of multiple decision tree classifiers {h(X, ), k=1,...}. The sets of attributes represent the growth process of a single decision tree, which are only weakly dependent or even unrelated to each other. They are assigned the same weight and parallelized at the same time. Assuming that the independent variable X is known, each decision tree is entitled to jointly select the final classification result. RF algorithm is well-adapted and tolerant to noise and outliers in the sample. Besides, it shows high prediction accuracy in both classification and regression models [72]. The basic principle of RF is as follows:
Step 1: The Bootstrap resampling method is used. Setting the original training data set , i∈[1, N], m∈[1, M], xi represents N sample data, m represents the number of features of each sample, and k training sub-samples are randomly selected.
Step 2: Construct decision trees. A k-decision tree model is constructed using the k-group set, while k out-of-band data are generated.
Step 3: Select the optimal splitting feature. At the splitting node of each decision tree, m features are randomly drawn from M features, and the best feature is selected as the splitting feature, with m being constant. Record the complete splitting process using classifier hj(x) to form a random forest [73]. The calculation formula of the classifier is shown in Equation (1):
H(x)={h1(M), h2(M), ..., hj(M),yi=Y}, j∈[1, K]
Where Y is the output variable, j denotes the jth classifier. the Gini coefficient is generally used as a measure to determine the left and right features.
Step 4: Making decisions. Training T times, the combined model formula is shown in Equation (2):
Where is the schematic function. The model processing flow is shown in Figure 4.
RF has demonstrated exceptional prediction performance on numerous datasets [68], while possessing strong noise resistance capabilities that enable it to provide feature importance rankings even when there are errors in the training data. However, RF still has some shortcomings when it comes to handling feature selection. RF algorithm currently uses Gini Importance, Information Gain, OOB Error, Mean Decrease Impurity (MDI), Mean Decrease Accuracy (MDA), and Node Degree as the main metrics to evaluate the relative importance of the features [74]. However, among the indicators such as Information Gain, MDI, etc. there is a tendency to characterize preferences for more values. The remaining node degree and cumulative node degree are susceptible to data dimensions, making them incompatible with high-dimensional data or requiring high saturation of the dataset. Therefore, most scholars choose to use coupled metrics associated with the Gini coefficient for training to improve model performance and interpretability of feature importance while being compatible with data dimensions and reducing the risk of overfitting [75].
3.3. IGSA-RF Prediction Model
In the learning process of the RF algorithm, key parameters need to be determined, such as the number of decision trees, the number of randomly selected features at each node, and the splitting criteria [76,77]. In the optimized prediction model of RF, these key parameters are encoded as particles in the IGSA algorithm. The optimization is performed based on the gravitational interaction between individuals until the optimal solution is found. The optimal parameters obtained from the IGSA algorithm are then used to set the number of trees, the number of features, and the splitting criteria in the RF model, resulting in the IGSA-RF prediction model [78]. The flowchart is shown in Figure 5.
3.4. The GINI-OOB Coefficient
3.4.1. The GINI Coefficient
The Gini coefficient, also known as the Gini impurity, is the expected error rate of randomly applying some outcome in the set to a particular data item and is used to measure set purity or uncertainty. The larger the Gini coefficient, the lower the purity of the sample set and the greater the uncertainty. In the training of RF, using the Gini coefficient as a measure of feature importance can intuitively and accurately capture the contribution of features in the decision tree model [79], while being less susceptible to missing values. But it has a preference for features with more values and lacks consideration for the correlation between features [75].
Define a random variable VIDGini, and denote the split impurity of the jth variable in all tree nodes in RF. In this paper, the average gini coefficient descent method is used to traverse all the tree nodes, using the principle that RF picks the features with the strongest classification ability in each split during the construction process. The contribution of each characteristic to the reduction of the Gini index was calculated by summing the statistics of the Gini coefficient corresponding to the characteristic variables for all variables [68]. Its calculation formula is shown in Equation (13):
Where K represents the number of target classes of autonomous training samples, is the probability estimate that the sample attribute in node m is the kth class. The Gini index variable for the variable Xj before and after the node m split is given in Equation (14):
Where the Gini coefficients of the two new nodes split at node m are denoted by GNi and GNr, respectively [79]. Suppose the variable Xj appears in the ith tree a total of M times, and the number of classification trees in RF is n in total. Define the Gini importance of Xj exhibited on the ith tree with the Gini importance of Xj in RF as shown in Equations (15) and (16):
3.4.2. The OOB Coefficient
Definition VIDOOB indicator: In each tree of RF, the self-help sample set Dt is generated by autonomous training using samples of random samples, thus realizing the requirement of self-help tree building [80]. On this basis, the basic definition of VIDOOB indexs based on OOB data replacement is introduced: The out-of-bag data of the features were perturbed, and the OOB error rate was calculated twice after the perturbation classification and before the perturbation classification, and normalized. In this case, the average value of the weighted tree is the importance of the feature, which can quantify the replacement importance of the variable Xj. If the replacement process has a greater impact on accuracy, the replacement is more important [81]. The substitution importance of variable Xj in the ith tree is calculated in Equation (17):
Where denotes the number of out-of-bag data observations for the ith tree; denotes the Pth observation of the data outside the ith tree pocket before the random permutation; denotes the Pth observation of the out-of-bag data for the ith tree after random permutation; I(g) is an exponential function, its value takes 1 if Yp is equal to , and 0 if not equal; If the variable j does not appear in the ith tree, 0. Based on this, the significance of the substitution of the variable Xj in RF is defined in Equation (18):
When utilizing the OOB coefficient for integrated learning, there is no need for additional validation sets or test sets, greatly saving computational resources [81]; Meanwhile, it can objectively reflect the generalization performance of untrained data, avoiding overfitting of the model to the training data. However, based on its random sampling characteristics, OOB error estimation has a certain degree of randomness, which may lead to inaccurate estimation of certain samples [80].
Considering that both the Gini coefficient and the OOB coefficient have certain shortcomings, this paper will analyze the importance of independent variables in a multidimensional manner by combining VIDGini and VIDOOB measures.
3.5. Evaluation Metrics
In the RF algorithm, two key parameters that influence model accuracy are the number of decision trees and the number of randomly selected features at each node, typically set to the square root of the total features. As the number of trees increases, computational cost rises while improvements decrease. An accuracy test is used to select the optimal parameter. Irrelevant features can degrade classification/regression performance, especially with noisy datasets, and can lead to overfitting. To address this, an accuracy test is essential for determining optimal feature subset sizes [83]. To evaluate model performance, we use four metrics: Mean Squared Error (MSE), Mean Absolute Error (MAE), Mean Absolute Percentage Error (MAPE), and R². MSE measures the average squared error, with lower values indicating higher accuracy. MAE provides the absolute error magnitude, while MAPE expresses error as a percentage. R² assesses goodness-of-fit, with values closer to 1 indicating better model performance. These metrics ensure optimal feature selection and prevent overfitting. The formula is as follows:
Where yi is the target value, is
the predicted value, and n is the number of data sets.
4. Case Study
4.1. Study Area
Jiangsu Province (30°45'~35°08'N,116°21'~121°56'E), located in the Yangtze River Economic Zone, has a total area of 107,200 square kilometers. Its regional development level, per capita GDP, and Development and Life Index (DLI) all rank first in China's provinces, and its overall provincial economic competitiveness is among the highest in the country. It is one of the provinces with the highest level of comprehensive development in China [84]. Jiangsu Province spans two major water systems, the Yangtze River and the Huai River, the specific location of which is shown in Figure 6. With its connection between the north and the south, its location on the coast, its well-developed water system, and its rich natural resource endowment, it has become the highland of modern agricultural development. As the frontline deployment area of China's exploration of modern urban-rural development and construction, it is also a typical representative of the significant reduction of the regional urban-rural dichotomy. By 2023, the per capita disposable income of urban residents reached CNY 63,200, while that of rural residents was CNY 30,500, reflecting increases of 5% and 7%, respectively. Consequently, the urban-rural income ratio narrowed to 2.07:1. However, due to factors such as geographical location, natural conditions, and historical and cultural contexts, regional disparities in rural development persist within the province. The rural-led geographical functions of the southern, central, and northern regions of Suzhou and their financial development and transformation patterns are significantly different [85]. By studying the coupling relationship between digital inclusive finance and rural labor economics in Jiangsu Province, it is important to explore the direction of sustainable economic development in rural areas with distinctive differences, to explore the economic potential in the process of rural modernization, and to enhance the comprehensive competitiveness of villages [86].
4.2. Empirical Data Collection
In this paper, the annual data of Jiangsu province with the interval from 2018 to 2024 are selected. The data are obtained from the EPS Global Statistics/Analysis Platform, the China Economic and Social Development Statistics Database, the National Bureau of Statistics[87], the Jiangsu Provincial Bureau of Statistics, and other platforms. The data dimension contains municipal data and county data. Among them, the panel data of prefecture-level cities are also annual. The data of each city/county are obtained from the China Population and Employment Statistical Yearbook, China Rural Statistical Yearbook, China Agricultural Products Processing Industry Yearbook, China Rural Household Survey Yearbook, Jiangsu Statistical Yearbook, Jiangsu Rural Yearbook and statistical data collected by the relevant government departments of each city. Given the availability of statistical data and the consistency of statistical caliber, some data were compounded to construct relevant indicators [87,88].
62 county and city-level areas were picked as data sources, taking into account the geographical characteristics of rural areas in Jiangsu Province, after meticulously examining the current status of the rural labor economy in 13 prefecture-level cities in Jiangsu Province. This paper measures and evaluates the level of rural labor and economic development in Jiangsu Province by selecting 15 specific indicators from 5 major dimensions: rural employment, rural labor migration, rural labor structure, rural labor patterns, and rural economic development. Descriptive statistics of the indicators were obtained as shown in Table 3.
4.3. RF Result and Performance Evaluation
In this paper, based on Python software, we use the code to implement RF supervised learning algorithm model and construct the Gini-OOB coupling coefficient of each indicator. Based on the data from 2018 to 2024 in Jiangsu Province, China, the indicators in the rural labor economics system were used as independent variables and the digital inclusive finance index was substituted as the dependent variable for the calculation.
Fifteen decision tree models were constructed using Python software, and 15 out-of-band data were generated. The number of splits of the IGSA-RF algorithm tree was adjusted from 0 to 10000 with a step size of 100 for iteration. The most appropriate set of results from all iterations, based on combined error deviation and overall fit to the data, was selected as the optimal split feature to generate the Gini coefficients for each index (Table 4) and the OOB coefficients (Table 5). To comprehensively evaluate model performance, R2, MSE, MAE and MAPE were calculated for both Gini and OOB coefficients of each indicator using Python, ensuring the accuracy of the algorithm for different indicator datasets. Furthermore, the optimal accuracy of the model, determined by these evaluation metrics, is visually presented in Figure 7, demonstrating the effectiveness of the selected parameters. Additionally, the derived Gini coefficients and OOB coefficients were processed using Excel software. Under the principle of minimum information entropy, the Gini-OOB coupling coefficients were computed using the Lagrange multiplier method to serve as parameters for measuring the degree of influence of each index, as illustrated in Figure 8.
Table 3 considers only the Gini coefficients for each index from a single perspective and analyzes the code generation results. Similarly, Table 4 considers the results of the calculations only from the perspective of the OOB coefficients. It can be seen that the goodness of fit when regressing the single coefficient of each indicator is good and all of them are greater than 0.9; the MSE is small, and the MSE is almost below 3 in both Gini and OOB, and the prediction accuracy is very high. This indicates that RF can adequately measure the importance of indicators, which provides a strong theoretical basis and data accuracy support for the construction of the Gini-OOB coefficient. However, the Gini coefficient and the OOB coefficient consider different emphases when measuring the importance of indicators, and therefore they are somewhat different. The importance of each index was studied by combining the two coefficients to construct a coupling coefficient, and the analysis from a single coefficient could not meet the requirements of the comprehensive evaluation index system.
In this paper, we measure the degree of coupling influence of each indicator in two dimensions: the Gini coefficient and the OOB coefficient. The model accuracy is optimized by removing unnecessary details and highlighting key indicators while preserving the ensemble purity and autonomous learning capability.
Combining Table 4 and Table 5 with Figure 8, a comprehensive comparison of the two cases reveals that there are one-sidedness and limitations in considering only a single dimension of the coefficients. The coupled results after constructing two-dimensional indicators can effectively reduce the prediction error, emphasize the key information, and improve the model’s superiority. The analysis of the results is also more generalizable and research-worthy.
As can be seen in Figure 8, there is a clear discontinuity in the degree of influence of the indicators. The number and proportion of coefficients of indicators located in high-impact areas are small, while the remaining indicators are evenly distributed in low-impact areas and their proportion is small. Among the data collated for all years, the coupling coefficients of the indicators Ce and GDP have been in the top three for a long time, and the indicator Ieamw is at a high level in most cases, according to which the analysis is carried out:
- (a)
- There is a significant positive correlation between the development of rural digital inclusive finance and the promotion of consumption expansion and consumption upgrading in labor economics.
Combining Figure 8, we can see that in the last seven years of data analysis, the coupling coefficients of five of the indicators Ce are in the first place. In the remaining years, it has been stable in the top three, in a high-impact area. The coefficient range is from 0.3 to 0.7 and reaches 0.665 in 2024, see Figure 8(g), which is much higher than the sum of coefficients of other indicators. The promotion of digital inclusive finance in rural areas improves the quality of household income and deposit size at the micro level and improves the quality of regional economic development and multi-channel development at the macro level. Thus, it provides technical support and service guarantees for rural families to pursue personalized and quality consumption. This shows that the development of digital inclusive finance for rural areas and the financially disadvantaged is an important endogenous force to activate the consumption market of rural labor economics and stimulate the consumption vitality of rural residents.
- (b)
- The introduction of digital inclusive finance in rural areas helps promote high-quality regional GDP.
The coupling coefficient of the indicator GDP can be obtained by combining Figure 8, except for 2024 when the unnatural influence factor is taken into account, see Figure 8(g), which is in the top three in the long term and the medium-high influence region. The coefficients range from 0.1 to 0.5, with the highest value of 0.409 in 2018, as shown in Figure 8(a). Overall, the influence is high. Digital inclusive finance has greatly enhanced the breadth of coverage and depth of use of inclusive finance, while significantly reducing financial transaction and service costs and providing rural residents with greater access to financial services. It further contributes to the high quality and sustainable development of rural labor economics at a lower cost, resulting in a significant increase in local GDP.
- (c)
- Digital inclusive finance can raise the average monetary wage index of employed people through various mechanisms of action. Combined with Figure 8, we can see that the indicator Ieamw has been maintained at the top level in recent years and is in the medium-high impact area. The coefficients range from 0 to 0.5 and are at the highest value of 0.487 in 2021, as shown in Figure 8(d). Overall, it has a strong influence and a growing trend. With the widespread use of the new generation of digital technology in the financial sector, digital inclusive finance is reducing the cost of services while providing more jobs for rural residents. It can optimize the structure of rural employment and guarantee the quality of employment so that rural residents can make better use of financial resources to increase their income. At the same time, the average monetary wage index of employed persons is raised to reduce the income gap between urban and rural areas.
In contrast, a comparison of the indicators in the low-impact area, with relatively small impact factors, reveals that the indicators Rf, Vlio, and Reb have been in the last few positions for a long time. According to this analysis, the following conclusions can be drawn:
- (d)
- Digital inclusive finance has no significant effect on gender differences and age differences in the structure of the rural labor force. Combined with Figure 8, it can be seen that the indicators Rf and Reb remain in the last three places for a long time and are in the low-impact area. The coefficient was always below 0.01 and Rf was at the lowest value of 0.0031 in 2019, see Figure 8(b). Reb was at the lowest value of 0.00299 in 2018, see Figure 8(a). Overall the impact is in a low posture. Gender and age differences in the use of digital inclusive finance persist due to differences in risk aversion, negative consumer experiences, lack of financial and digital literacy, and declining knowledge, skills, and behaviors over the years due to aging trends. Older people and women are more financially vulnerable than other groups, and the effect of digital inclusive finance on specific groups is relatively weak.
- (e)
- Compared with capital-intensive industries, digital inclusive finance shows strong limitations for purely labor-intensive industries. Combined with Figure 8, it can be seen that the indicator Vlio is also in the low-impact area for a long time. The coefficient stabilized below 0.01 and Vlio reached its lowest value of 0.0035 in 2018, as shown in Figure 8(a). There was no significant performance in terms of impact across the years. Since labor-intensive industries as a whole are relatively low-skilled and less digitally influenced, the majority of the workforce still has only a relatively low level of financial literacy and modern knowledge. Therefore, the degree of influence of digital inclusive finance is limited, and there is relatively little room for development.
In addition, analyzing the overall trend of each indicator, it is found that the indicator Ptam continues to show a significant upward trend, according to which:
- (f)
- The development of inclusive digital finance has a certain long-term tendency toward the substitution of capital for labor in agricultural output. The combined Figure 8 shows that the indicator Ptam has a clear upward trend. From the last position in 2018 (coefficient 0.0026), see Figure 8(a), it rises steadily from year to year until the second position in 2024 (coefficient 0.134), see Figure8(g). Overall its influence has increased significantly. The development of digital inclusive finance has significantly improved agricultural output by increasing the utilization of agricultural machinery, promoting the impact of capital substitution for labor in agricultural production by farmers and the underlying mechanisms. And because the breadth of coverage and depth of use of digital inclusive finance has been further strengthened in recent years, the process of agricultural mechanization has accelerated.
Based on the results of the above analysis, the data of each indicator for all years in each city and county region are aggregated in this paper, and the overall Gini coefficient, the OOB coefficient, and the coupling coefficient are calculated respectively. A longer time horizon is used to look at the long-term trends in the impact of digital inclusive finance on various indicators in rural labor economics from a macro perspective. The coefficients of each indicator are compared with those of each year to explore the differences and similarities between the short-term and long-term effects of each indicator, and to explore the deep-seated influence mechanism. The results are shown in Figure 9.
Figure 9 compares and analyzes the Gini coefficient, the OOB coefficient, and the coupling coefficient of each indicator from the perspective of the overall data. From the histogram, it can be seen that both single indicator coefficients and coupling coefficients show a relatively similar distribution pattern. The indicators located in the high-impact area are Vlio, Ptam, and Rurdi, while the indicators Ieamw, Reb, Nrle. and Rf are located in the medium-impact area, while the low-impact areas are all indicators Nntrl, Nre, Ul, Ce, GDP, Cf, Plfis, and Pniti. Comparing them with the individual indicator coefficients for each year, significant differences were found. In general, the indicators with a high degree of impact are focused on the change in rural labor patterns. This suggests that as digital inclusive finance becomes more widespread in the agricultural production sector, it has a strong intrinsic influence on the trend of capital substitution for human labor in the transformation of labor patterns; At the same time, the position of the indicators of demographic structure, rural employment, and labor migration is relatively moderate, which shows that digital inclusive finance also has a certain contribution to it; The performance of the indicators related to rural economic development is relatively weak, which reveals that at this stage, digital inclusive finance hopes to expand the domestic demand of rural economy to drive the internal cycle of high-quality development of its labor economics is not yet smooth; The role of enhancing the quality of economic development has entered a bottleneck, and more effective impact mechanisms still need to be explored. The incentive is more effective when it crosses technical barriers, institutional gaps, and demand thresholds.
5. Discussion
5.1. Policy Recommendations
In recent years, countries have been making efforts to promote urban-rural synergistic development and actively explore new models of economic integration. Based on this international economic context, this paper focuses on the impact mechanism of the development of digital inclusive finance on rural labor economics. By constructing an IGSA-RF algorithm based on the system of rural labor economic indicators, the intrinsic mechanism of digital inclusive finance on each indicator is proposed. Gini-OOB coupling coefficients were constructed to measure the impact factors of each indicator using the China Family Panel Studies (CFPS), the Digital Inclusive Finance Index of Peking University, and the statistical yearbooks of each province, with the Lagrange multiplier method employed for enhanced precision. On this basis, we further explore the possible influence mechanisms and mediating effects. By digging deeper into the influence relationship of indicators over years, the study showed that: (1) There is a significant positive correlation between the development of digital inclusive finance in rural areas and the expansion and upgrading of consumption in working economies, the high-quality improvement of regional GDP and the optimization of the average monetary wage index of employed persons; (2) No significant impact of digital inclusive finance on gender and age differences in the structure of the rural labor force and the development of labor-intensive industries; (3) The development of digital inclusive finance has a clear time-growing trend on the substitution of capital for labor in agricultural production. According to a comprehensive study of all the data, the indicators that have the greatest influence on digital inclusive finance are those that focus on the transformation of the rural labor force, while those that relate to rural economic development exhibit some degree of a bottleneck.
Based on the aforementioned conclusions, this article proposes policy suggestions from a multi-dimensional perspective, considering bottom-up, vertical, and horizontal strategies:
- (a)
- To consolidate the construction of the bottom of digital inclusive finance in rural labor economics and further strengthen the rural digital infrastructure services. Due to the relatively backward level of development in rural areas, the emergence of modern digital trends in financial activities has led to significant structural changes in the agricultural economy, which coincides with mechanism ii proposed in Section 2.3. According to mechanism v, the full extent of the marginal contribution needs to rely on a strong, open, and efficient digital infrastructure. Considering the geographical differences, the breakthrough in rural areas focuses on establishing a sound Internet coverage and penetration rate and narrowing the "digital divide" arising from the difference between urban and rural infrastructure. The government can engage with traditional network service providers to offer specific subsidies and preferential services for rural areas to reduce costs and guarantee smooth network access. At the same time, the government optimizes the platform for providing digital financial services and vigorously promotes online banking, Customer Relationship Management (CRM), and other mobile financial products to ensure that rural residents can enjoy convenient and efficient financial services. It is also important to raise the level of financial literacy and digital skills of the rural population to guarantee that the mainstays of rural labor economics have full access to the benefits of digital financial inclusion.
- (b)
- To promote the horizontal and deep development of digital inclusive finance in rural areas, thus providing a guarantee for the comprehensive and high-quality development of rural labor economics. Firstly, focus on the breadth of coverage of digital inclusive finance in rural areas and improve infrastructure construction. Secondly, the use of modern information technology to expand the depth of digital inclusive finance. Especially for the majority of poor groups, according to mechanism i, financial service institutions, under the premise of controlling costs and risks, broaden innovative financial products and services to meet the diversified needs of farmers. At the same time, modern technology is used to improve the credit assessment system and reduce the credit constraints of vulnerable groups. It can also alleviate the imbalance between the supply and demand of financial resources caused by insufficient information, optimize the entrepreneurial environment, and tap the entrepreneurial potential. By strengthening the breadth of coverage and depth of use of digital inclusive finance, we can deeply integrate digital inclusive finance with the real economy and achieve the sustainable development of the economy and environment in rural areas.
- (c)
- Strengthen the top-level design of digital inclusive financial development and realize the long-term mechanism of high-quality development of rural labor economics. According to mechanism iv, with the penetration of digital inclusive finance, rural industries are gradually becoming dependent on the Internet and electronic information to a certain extent. However, the flow and control of online data are still highly risky. The legal regulation and rules of the relevant digital technology laws should be accelerated and improved. In addition to improving the service capability, the company also manages the potential internal and external risks to provide a stable and safe institutional environment for its long-term development. At the same time, relying on mechanism v, the government needs to set up a perfect financial management system and coordination mechanism. While safeguarding the development of the traditional financial industry, it should provide a basis for the development of digital inclusive finance and an incentive system. As a result, the value of business sustainability of digital inclusive finance, together with the complementary functions of traditional finance and digital inclusive finance, can be maximized.
- (d)
- To develop a differentiated development model of digital inclusive finance in different regions, and to implement precise policies according to local conditions. Heterogeneity still exists due to the different stages of infrastructure construction, economic and social development, financial service level, and policy system in each region. There is also a threshold effect in the development of digital inclusive finance in each region. In conjunction with mechanism iii, a differentiated and personalized digital inclusive financial system should be constructed in accordance with the characteristics of rural areas. Regions should also be encouraged to combine their characteristics and resource endowments to explore unique development paths for digital inclusive finance and improve their resource allocation and utilization efficiency. Concerning mechanism v, for the development of relatively backward rural areas, through the implementation of tax incentives, the introduction of talent, collaborative development of innovation issues, and other policies to attract industrial structure optimization and high-quality investment. The "vicious circle" of a widespread migration of talent and money can be avoided, and the promotion effect and balanced growth of digital inclusive finance can be further increased.
- (e)
- Unblocking the transmission channels between the various segments of rural labor economics to promote high-quality development and use digital inclusive finance to expand rural domestic demand. There is still a widespread internal circulation blockage and disconnect between production and demand in rural areas, while consumption-driven domestic demand is an intrinsic driver for rural labor economics development. According to mechanism i, digital inclusive finance can effectively drive demand related to production in rural areas in all urban and rural areas and international trade channels. Therefore, we should focus on developing more digitally inclusive financial products that can expand domestic demand and stimulate consumption. Combined with mechanism iv, with the help of network sales platform and multi-channel sales channels, continue to broaden the online consumption mode and consumption scene, pulling the post-epidemic era of consumption back to compensate and consumption augmentation. At the same time, each region should accelerate the construction of big data management and monitoring institutions. By improving the process of collecting, integrating, analyzing, and reporting relevant data, the information of rural residents is desensitized and incorporated into the local information-sharing platform. It will alleviate the information gap and inequality among various links, and build a closed-loop ecology of digital inclusive finance.
5.2. Algorithm Comparison
To better illustrate the robustness and generalization performance of IGSA-RF algorithm in studying the impact mechanism of digital inclusive finance on rural labor economics, conventional algorithms such as GSA-RF, RF, Light Gradient Boosting Machine (LightGBM), Support Vector Machine (SVM), and Artificial Neural Network (ANN) are selected for algorithmic comparison in this paper [89,90]. The collected data were input into these algorithms for training, and MSE, R², MAPE, and MAE were utilized for parametric accuracy testing. The accuracy comparison results of each algorithm are shown in Figure 10.
By substituting the collected data into the different algorithms mentioned above for training, we tested the accuracy of the algorithms' computational results for the impact mechanism between digital inclusive finance and rural labor economics. According to Figure 10, it can be observed that the MSE of the IGSA-RF algorithm is 0.0002 and R² is 0.9750, indicating the best predictive performance among all tested models. The MSE results obtained from the GSA-RF, RF, LightGBM, and SVM algorithms range from 0.0008 to 0.0015, while their R² values range from 0.9506 to 0.9663, showing relatively high accuracy but slightly worse than IGSA-RF. The ANN algorithm, however, has a significantly higher MSE (0.0130) and a lower R² (0.8891), indicating weaker predictive accuracy.
A comparison of the accuracy test results for each algorithm shows that the IGSA-RF algorithm outperforms the others in terms of MSE and R², demonstrating superior robustness and predictive capability. The LightGBM, GSA-RF, and SVM algorithms exhibit comparable but slightly inferior performance. The ANN algorithm, in contrast, performs significantly worse than the other models. This suggests that the IGSA-RF algorithm has better generalization ability, predictive accuracy, and resistance to overfitting when analyzing the impact mechanism between digital inclusive finance and rural labor economics.
6. Conclusion and Prospect
6.1. Conclusions
In light of the progressive emergence of digital inclusive finance in various domains, we are fully exploring its potential for multidimensional applications with extensive impact. The findings demonstrate the significant and diverse contribution of digital inclusive finance to the growth of the labor economy in rural areas. Specifically, in terms of the expansion and upgrading of consumption in the labor economy, the high-quality improvement of regional GDP, and the optimization of the average monetary wage index of employed persons, digital inclusive finance exhibits a strong positive correlation. Additionally, there is a clear time-increasing trend in capital substituting labor in agricultural output as a consequence of the expansion of digital inclusive finance. However, evidence remains limited regarding positive feedback on gender and age differences, as well as its impact on labor-intensive sectors in rural areas. Indicators related to shifting rural labor patterns have a substantial long-term impact, while the positive influence on indicators linked to rural economic growth faces certain bottlenecks. Given the varied impacts of digital inclusive finance on different indicators, we will focus on leveraging its strengths to fully exploit the development potential of high-impact indicators. Simultaneously, we will address time constraints and other challenges to actively explore ways to enhance less influential indicators. The government should strengthen digital financial infrastructure, optimize financial product design, and utilize key indicators to support rural areas through digital inclusive finance. To align with the Sustainable Development Goals (SDGs), a strategic framework is needed to balance spatial and temporal disparities, ensuring equitable financial inclusion.
Compared to previous studies, we present an innovative perspective by introducing the concept of rural labor economics and comprehensively analyzing its impact mechanisms from a theoretical standpoint. To rigorously examine the relationship between digital inclusive finance and rural labor economics, we also developed relevant indicators using the RF algorithm and further refined them. Secondly, the research method integrates advanced machine learning techniques to explore the intrinsic mechanism between them, promoting agricultural production and enhancing inclusivity in digital finance. This highlights the inclusive role of financial services in supporting socially vulnerable groups, aiming to mitigate poverty, promote social stability, and facilitate sustainable rural development. Thirdly, the Gini-OOB coupling coefficient is constructed using the principle of minimum relative information entropy to measure the impact of digital inclusive finance on various rural labor economic indicators. By testing each index with R² and MSE, we achieved a high R² accuracy of 0.9750 and a low MSE of only 0.0002, indicating the superior performance, adaptability, and autonomous learning ability of the IGSA-RF model.
6.2. Limitations and Future Work
This article aims to develop a comprehensive set of indicators for rural labor economics using IGSA-RF and assess the impact of digital inclusive finance on each indicator through Gini-OOB coupling, which plays a pivotal role in promoting the widespread adoption of digital inclusive finance in rural areas. However, it is imperative to address certain limitations in future research endeavors.
- (1)
- The selected indicator dimensions in the model have certain shortcomings, such as incomplete consideration of social security and social insurance due to a significant amount of missing data. To achieve a comprehensive indicator dimension, improvements can be made by diversifying data collection channels or implementing indirect indicator measurement methods. Additionally, the direction can be dynamically adjusted based on the latest feedback results regarding changes in indicators to ensure the rationality and completeness of the model framework.
- (2)
- The impact of changes in the international environment and the occurrence of force majeure factors, such as COVID-19, is not taken into account in the calculation and analysis of the importance of the indicators. To excavate the dynamic relationship between digital inclusive finance and rural labor economics under the contingency scenario, the model parameters need to be further modified for the years including outliers.
- (3)
- Machine learning models, despite their high predictive accuracy, may exhibit instability and limited interpretability. To gain deeper insights into the underlying mechanisms governing the relationship between digital inclusive finance and rural labor economics, future research could integrate econometric models and systems engineering approaches to enhance theoretical rigor and explanatory power.
Author Contributions
Z.L.: conceptualization; funding acquisition; project administration; writing review and editing. Y.T.: investigation; writing review and editing; resources. All authors have read and agreed to the published version of the manuscript.
Funding
This work is supported by National Natural Science Foundation of China (Grant Nos. 72274034).
Institutional Review Board Statement
Not applicable.
Informed Consent Statement
Not applicable
Data Availability Statement
On behalf of all the authors, the corresponding author states that our data are available upon reasonable request.
Conflicts of Interest
The authors declare no conflicts of interest.
References
- Elisa; Annalisa; Armin; Massimo; Alexander. Digital technologies and the changing entrepreneurial finance landscape: Status quo and perspectives for future research. Technol Forecast Soc 2021, 1.
- Wu Yanjun. Internet banking drives the high-quality development of digital inclusive finance. Modern Commercial Bank 2022, 48-51.
- Wang Yu. Realistic thinking on blockchain empowering the high-quality development of digital inclusive finance. Changbai Journal 2022, 113-122. [CrossRef]
- David-West, O.Y.L.E. The path to digital financial inclusion in Nigeria: Experiences of Firstmonie. Journal of Payments Strategy & Systems 2015, 256-273.
- Pinos, F. Inclusion financière et populations précarisées : effets des business models des services financiers en France. Type, Economies et finances. Université de Bordeaux, 2015.
- Li, C.; Zhang, Z.; Jin, Y. Economic Effect of Rural Labor Transfer in China. Journal of Financial Research 2021, 46-52.
- Tanimoto, M. PEASANT SOCIETY IN JAPAN'S ECONOMIC DEVELOPMENT: WITH SPECIAL FOCUS ON RURAL LABOUR AND FINANCE MARKETS. International Journal of Asian Studies 2018, 229-253.
- Lal, T.S.S.T. Measuring impact of financial inclusion on rural development through cooperatives. International Journal of Social Economics 2019, 352-376.
- Li Fengling. A brief discussion on the growth and development of labor economy under the new situation. Science and Technology Economic Market 2020, 96-98.
- Teng Lei; Zhang Heng; Tang Sisi. Digital financial innovation and rural economic development from the perspective of inclusiveness. Research World 2021, 34-42. [CrossRef]
- Luo Xiaofang; Wang Susu. Digital economy, employment and labor income growth: An empirical analysis based on the data of China Family Panel Studies (CFPS). Jianghan Forum 2021, 5-14.
- Du Jiating; He Yong; Gu Qiannong. The nonlinear impact of digital inclusive finance on the upgrading of rural residents' consumption structure. Statistics and Information Forum 2022, 37, 63-74.
- M., D.S. Digitalization as a Modern Mechanism for Managing the Financial-Economic Activities of Enterprises in Rural Territories. Bìznes Inform 2021, 56-62.
- Murendo, C.S.S.; Murenje, G.S.S.; Chivenge, P.P.S.S.; Mtetwa, R.S.S. Financial Inclusion, Nutrition and Socio-Economic Status Among Rural Households in Guruve and Mount Darwin Districts, Zimbabwe. J Int Dev 2021, 86-108.
- Sup, A.S.S.; Sup, A.A.S.; Sup, E.V.S.; Sup, K.B.S. Areas of development strategy for the regional agribusiness management system. IOP Conference Series: Earth and Environmental Science 2019, 12122.
- Thakur, K.K.S.A.; Prasad, R.S.B.S. Wi-Fi for affordable broadband & 5G in rural areas. Journal of Mobile Multimedia 2021, 225-244.
- Qinya, T.; Yuqing, L.; Kelin, C. Coordinated development of agricultural economy and rural tourism based on big data. E3S Web of Conferences 2021, 2001.
- Nyika, G.T. Use of ICTS for socio-economic development of marginalised communities in rural areas: Proposals for establishment of sectoral Rural Entrepreneurial Networks. Journal of Development and Communication Studies 2020, 71-91.
- Dai Xin; Min Yuqing. Research on the innovative development path of "blockchain + order-based agriculture" - Based on the financing development of rural economies in Xuzhou. Business Accounting 2020, 73-76.
- Cuneo, A.G. The Economics of Rural Populations in Sub-Saharan Africa: Financial Inclusion and Agriculture. Type, Georgetown University, 2019.
- Zhang Nan. Research on the innovative financial management model of rural collective economy in the era of artificial intelligence. Agricultural Economy 2021, 48-50.
- Ma, W.; Nie, P.; Zhang, P.; Renwick, A. Impact of Internet use on economic well-being of rural households: Evidence from China. Rev Dev Econ 2020.
- Briglauer, W.S.C.S.; Dürr, N.S.S.C.; Falck, O.S.C.S.; Hüschelrath, K.S.C.S. Does state aid for broadband deployment in rural areas close the digital and economic divide? Inf Econ Policy 2019, 68.
- Hoepner, A.G.F.; McMillan, D.; Vivian, A.; Simen, C.W. Significance, relevance and explainability in the machine learning age: an econometrics and financial data science perspective. The European Journal of Finance 2021, 1-7.
- Gogas, P.; Papadimitriou, T. Machine Learning in Economics and Finance. Comput Econ 2021, 1-4.
- Xu Peiwen; Yao Li. Research on the innovation risks and regulation of digital inclusive finance. Development 2022, 79-81.
- Kirana, M.Y.; Havidz, S.A.H. in Financial Literacy and Mobile Payment Usage as Financial Inclusion Determinants, 2020 International Conference on Information Management and Technology (ICIMTech), Bandung, Indonesia, 2020; Bandung, Indonesia, 2020.
- Sup, C.L.S.A.; Sup, C.W.S.B.; Sup, S.H.S.C. Financial inclusion, financial innovation, and firms’ sales growth. Int Rev Econ Financ 2020, 189-205.
- Chen Xiali. Human resource development path under labor economics theory. Human Resources 2020, 140-141.
- Luo Rundong; Shen Jun; Xu Dandan. Analysis of cutting-edge literature on labor economics theory research - based on the perspective of bibliometric analysis. Economic Dynamics 2014, 89-97.
- Die, H.; Menghan, H.; Yuxue, C.; Fang, Y. Research on the Main Body of Rural Economic Innovation Based on the Perspective of Public Policy. E3S Web of Conferences 2021, 3066.
- Svetlana, P. Methodological aspects of rural economy diversification in the context of modern civilizational transformations. E3S Web of Conferences 2021, 8041.
- Guo Yidi. Analysis of cutting-edge literature on labor economics theory research - bibliometric analysis of the WOS database in the last decade. Labor Economic Review 2019, 12, 22-34.
- Zou Jinhui. Empirical analysis of the factors affecting rural economic development in Zhejiang. Management and Technology of Small and Medium Enterprises (First Half) 2021, 51-52.
- Emran, M.S.; Shilpi, F. Land Market Restrictions, Women's Labour Force Participation and Wages in a Rural Economy. Oxford B Econ Stat 2017, 747-768.
- Li, Y.; Gan, J. The Impact of Income Gap between Urban and Rural on Chinese Economic Growth: Based on the Perspective of Fiscal Expenditure Structure. In 2018.
- Yin Zhaohui. Research on the impact of digital inclusive finance on urban-rural income gap. Type, Jilin University, 2022.
- Han, L. in Analysis of Rural Surplus Labor Migration under Institutional Economics Perspective, Tianjin, PEOPLES R CHINA, 2015; Tianjin, PEOPLES R CHINA, 2015.
- Behera, M.; Mishra, S.; Behera, A.R. The COVID-19-Led Reverse Migration on Labour Supply in Rural Economy: Challenges, Opportunities and Road Ahead in Odisha. The Indian Economic Journal 2021, 392-409.
- Zou, X.; Xie, M.; Li, Z.; Duan, K. Spatial Spillover Effect of Rural Labor Transfer on the Eco-Efficiency of Cultivated Land Use: Evidence from China. Int J Env Res Pub He 2022, 9660.
- Kiyoto, K. A Comparative Study on The Rural Economic Policy under The Aging Society between Northeast Thailand and Shiga Prefecture, Japan = The Ritsumeikan economic review : the bi-monthly journal of Ritsumeikan University 2017, 838-847.
- Li Xu; Li Yanyu. The Impact of Rural Population Aging on Rural Economy in Jilin Province. Modern Marketing 2022, 139-141. [CrossRef]
- Zhang, Z.; Li, Z. Development and Utilization of Female Labor Force in Rural Areas in Guizhou During Economic Transformation Period—— A Survey of 10 Villages in Guizhou in 2016. American Journal of Agriculture and Forestry 2018, 103-110.
- Li Fanghua; Ji Chenyang. Estimation of the elasticity of rural labor return from the perspective of rural revitalization - a study based on spatial discontinuity regression. China Rural Economy 2022, 36-55.
- Fang Guanfu; Cai Li. How does digital inclusive finance affect agricultural output: facts, mechanisms and policy implications. Agricultural Economic Issues 2022, 97-112. [CrossRef]
- Liao Qiqi. Research on the transformation of rural economic development under the new situation. Rural Economy and Science and Technology 2022, 33, 21-24.
- Zhang Helin; Wu Tiankai. Structural decomposition and dynamic analysis of China's rural economic growth. Statistics and Decision 2021, 37, 108-111. [CrossRef]
- Shen Yang; You Yuhan; Zhou Pengfei. The impact of digital inclusive finance on new urbanization. Finance and Economy 2021, 46-53. [CrossRef]
- Asibey, M.O.; Ocloo, K.A.; Amponsah, O. Gender differences and productive use of energy fuel in Ghana’s rural non-farm economy. Energy 2021, 119068.
- Williams, S.L. Closing the Financial Inclusion Gap by Understanding What Factors Drive Consumer Selection of Financial Service Providers. Type, Temple University, 2019.
- Wang Gengnan; Zhang Guojun; Zhou Chunshan. Temporal and spatial evolution characteristics and influencing factors of digital inclusive finance in the Pearl River Delta. Regional Research and Development 2022, 41, 25-31.
- Ahmad, N.; Reinsdorf, J.R.A.M. Can potential mismeasurement of the digital economy explain the post-crisis slowdown in GDP and productivity growth? OECD Publishing 2017.
- Xie, W.A.; Wang, T.A.Q.C.; Zhao, X.A. Does Digital Inclusive Finance Promote Coastal Rural Entrepreneurship? J Coastal Res 2020, 240-245.
- Mauritzen, J. Will the locals benefit? The effect of wind power investments on rural wages. Energ Policy 2020, 111489.
- Aisaiti, G.; Liu, L.; Xie, J. An empirical analysis of rural farmers’ financing intention of inclusive finance in China. Ind Manage Data Syst 2019, 1535-1563.
- Zhang Bing; Li Na. Research on the impact of digital inclusive finance on non-agricultural transfer of rural labor force: an empirical analysis based on Mlogit and threshold models. World Agriculture 2022, 65-75. [CrossRef]
- Balci, G. Digitalization in container shipping: Do perception and satisfaction regarding digital products in a non-technology industry affect overall customer loyalty? Technol Forecast Soc 2021, 1.
- Cirillo, V.; Evangelista, R.; Guarascio, D.; Sostero, M. Digitalization, routineness and employment: An exploration on Italian task-based data. Res Policy 2020, 104079.
- Beg, S. Digitization and Development: Property Rights Security, and Land and Labor Markets. J Eur Econ Assoc 2022, 395-429.
- Tian Lin; Zhang Yuanyuan; Zhang Shijie. Research on the dynamic impact of digital inclusive finance on rural revitalization - based on system GMM and threshold effect test. Journal of Chongqing University 2022, 28, 25-38.
- Ren, B.R.B.; Li, L.L.L.; Zhao, H.Z.H.; Zhou, Y.Z.Y. THE FINANCIAL EXCLUSION IN THE DEVELOPMENT OF DIGITAL FINANCE - A STUDY BASED ON SURVEY DATA IN THE JINGJINJI RURAL AREA(Article). Singap Econ Rev 2018, 65-82.
- Mora-Rivera, J.; García-Mora, F. Internet access and poverty reduction: Evidence from rural and urban Mexico. Telecommun Policy 2021, 1.
- Qiu, L.; Zhong, S.; Sun, B. Blessing or curse? The effect of broadband Internet on China’s inter-city income inequality. Economic Analysis and Policy 2021, 626-650.
- Chen Linlin. Research on the impact of digital inclusive finance on rural residents’ consumption potential-based on the intermediary effect of rural e-commerce. Reform and Opening 2022, 26-33. [CrossRef]
- Huang, F. in Rural E-commerce Investment and Financing Model Based on Blockchain and Data Mining, 2021 5th International Conference on Computing Methodologies and Communication (ICCMC), Erode, India, 2021; Erode, India, 2021.
- Nguyen-Hoang, P. The Fiscal Effects of Tax Increment Financing on Rural School Districts: The Case of Iowa. AERA Open 2021.
- Yue Xiyou; Chen Guisheng. Fiscal support for agriculture, digital inclusive finance and rural residents' consumption upgrade. China Circulation Economy 2022, 36, 60-70. [CrossRef]
- Han, H.; Guo, X.; Yu, H. in Variable Selection Using Mean Decrease Accuracy And Mean Decrease Gini Based on Random Forest, 2016 IEEE 7th International Conference on Software Engineering and Service Science, supported by the National Natural Science Foundation of China Grant Numbers 70971128 and 71450009, 2016; supported by the National Natural Science Foundation of China Grant Numbers 70971128 and 71450009, 2016.
- Mawonou, K.S.R.; Eddahech, A.; Dumur, D.; Scopus Preview Beauvois, D.; Godoy, E. State-of-health estimators coupled to a random forest approach for lithium-ion battery aging factor ranking(Article). J Power Sources 2020, 229154.
- Koc, K.; Budayan, C.; Ekmekcioglu, O.; Tokdemir, O.B. Predicting Cost Impacts of Nonconformances in Construction Projects Using Interpretable Machine Learning. J Constr Eng M 2024, 150. [CrossRef]
- Zhai, Z.; Liu, S.; Li, Z.; Ma, R.; Ge, X.; Feng, H.; Shi, Y.; Gu, C. The spatiotemporal distribution patterns and impact factors of bird species richness: A case study of urban built-up areas in Beijing, China. Ecol Indic 2024, 169. [CrossRef]
- Dipankar Mandal, A.C.B.T. A deep neural network and random forests driven computer vision framework for identification and prediction of metanil yellow adulteration in turmeric powder. Concurrency and Computation: Practice and Experience 2022, e6500.
- Hu Hui; Song Chuanzhou; Gao Yu; Wang Min; Zhao Xiaofeng; Wan Renwei. Research on aviation material consumption prediction based on random forest algorithm. Environmental Technology 2021, 39, 210-214.
- Kumar, G.V.; Avdhesh, G.; Dinesh, K.; Anjali, S. Prediction of COVID-19 Confirmed, Death, and Cured Cases in India Using Random Forest Model. Big Data Mining and Analytics 2018, 116-123.
- Gwetu, M.V.; Tapamo, J.; Viriri, S. Random Forests with a Steepend Gini-Index Split Function and Feature Coherence Injection. Machine Learning for Networking 2020, 255-272.
- Wu, C.; Su, X.; Xu, C.; Jian, G.; Li, J. Seafloor topography refinement from multisource data using genetic algorithm-backpropagation neural network. Geophys J Int 2024, 238, 1417-1428. [CrossRef]
- Qian, Z.; Xie, Y.; Xie, S. MAR-GSA: Mixed attraction and repulsion based gravitational search algorithm. Inform Sciences 2024, 662. [CrossRef]
- Zhou, X.; Zheng, W.; Li, Z.; Wu, P.; Sun, Y. Improving path planning efficiency for underwater gravity-aided navigation based on a new depth sorting fast search algorithm. DEFENCE TECHNOLOGY 2024, 32, 285-296. [CrossRef]
- Menze, B.H.; Kelm, B.M.; Masuch, R.; Himmelreich, U.; Bachert, P.; Petrich, W.; Hamprecht, F.A. A comparison of random forest and its Gini importance with standard chemometric methods for the feature selection and classification of spectral data. Bmc Bioinformatics 2009, 1.
- Yao Rui; Hui Meng; Li Jun; Bai Lin; Wu Qisheng. Research on partial discharge feature extraction and optimization based on random forest. Journal of North China Electric Power University (Natural Science Edition) 2021, 48, 63-72.
- Mitchell, M.W. Bias of the Random Forest Out-of-Bag(OOB) Error for Certain Input Parameters. Open Journal of Statistics 2011, 205-211.
- Chen, M.S.S.; Wang, Y.S.S.; Wu, B.S.S.; Huang, D.S.S. Dynamic Analyses of Contagion Risk and Module Evolution on the SSE A-Shares Market Based on Minimum Information Entropy. Entropy-Switz 2021, 434.
- Mariia V Guryleva, D.D.P.D. Investigation of the Role of PUFA Metabolism in Breast Cancer Using a Rank-Based Random Forest Algorithm. Cancers 2022, 4663.
- Yi, X.; Jue, W.; Huan, H. Does economic development bring more livability? Evidence from Jiangsu Province, China. J Clean Prod 2021, 126187.
- Wei Luyao; Lu Yuqi; Chen Yu. Spatial-temporal analysis of the coupling and coordination between the transformation of rural regional functions and economic development in counties of Jiangsu Province. World Geography Research, 1-14.
- Lyu, H.; Dong, Z.; Roobavannan, M.; Kandasamy, J.; Pande, S. Prospects of interventions to alleviate rural–urban migration in Jiangsu Province, China based on sensitivity and scenario analysis. Hydrological Sciences Journal 2020, 2175-2184.
- Liu, K.; Cao, Y.; Xu, E.; Chong, Z.; Chai, L.; Wang, Y.; Xu, Y.; Wang, Y.; Zhang, J.; Mueller, O., et al. Predicting the risk of malaria importation into Jiangsu Province, China: a modeling study. Globalization Health 2024, 20. [CrossRef]
- Luo, K.; Chen, C.; Liu, Y.; Liu, F.; Shen, Q. Study on the Comprehensive Assessment and its Application of Environmental Pollution Governance Effect of Low-carbon Tourism Emissions from Energy Consumption in Jiangsu Province. Rocz Ochr Sr 2024, 26, 465-478. [CrossRef]
- Chen, H.; Sun, Q.; Xuan, L.; Lin, Z.; Yang, Z.; Huang, X.; Li, Z.; Gao, W.; Ren, J.; Shi, J., et al. Ultrasonic technology for predicting beef thawing degree and endpoint. J Food Eng 2024, 383. [CrossRef]
- Nabil, N.; Najib, N.; Abdellah, J. Leveraging Artificial Neural Networks and LightGBM for Enhanced Intrusion Detection in Automotive Systems. Arab J Sci Eng 2024, 49, 12579-12587. [CrossRef]
Figure 1.
Schematic diagram of rural labor economics.
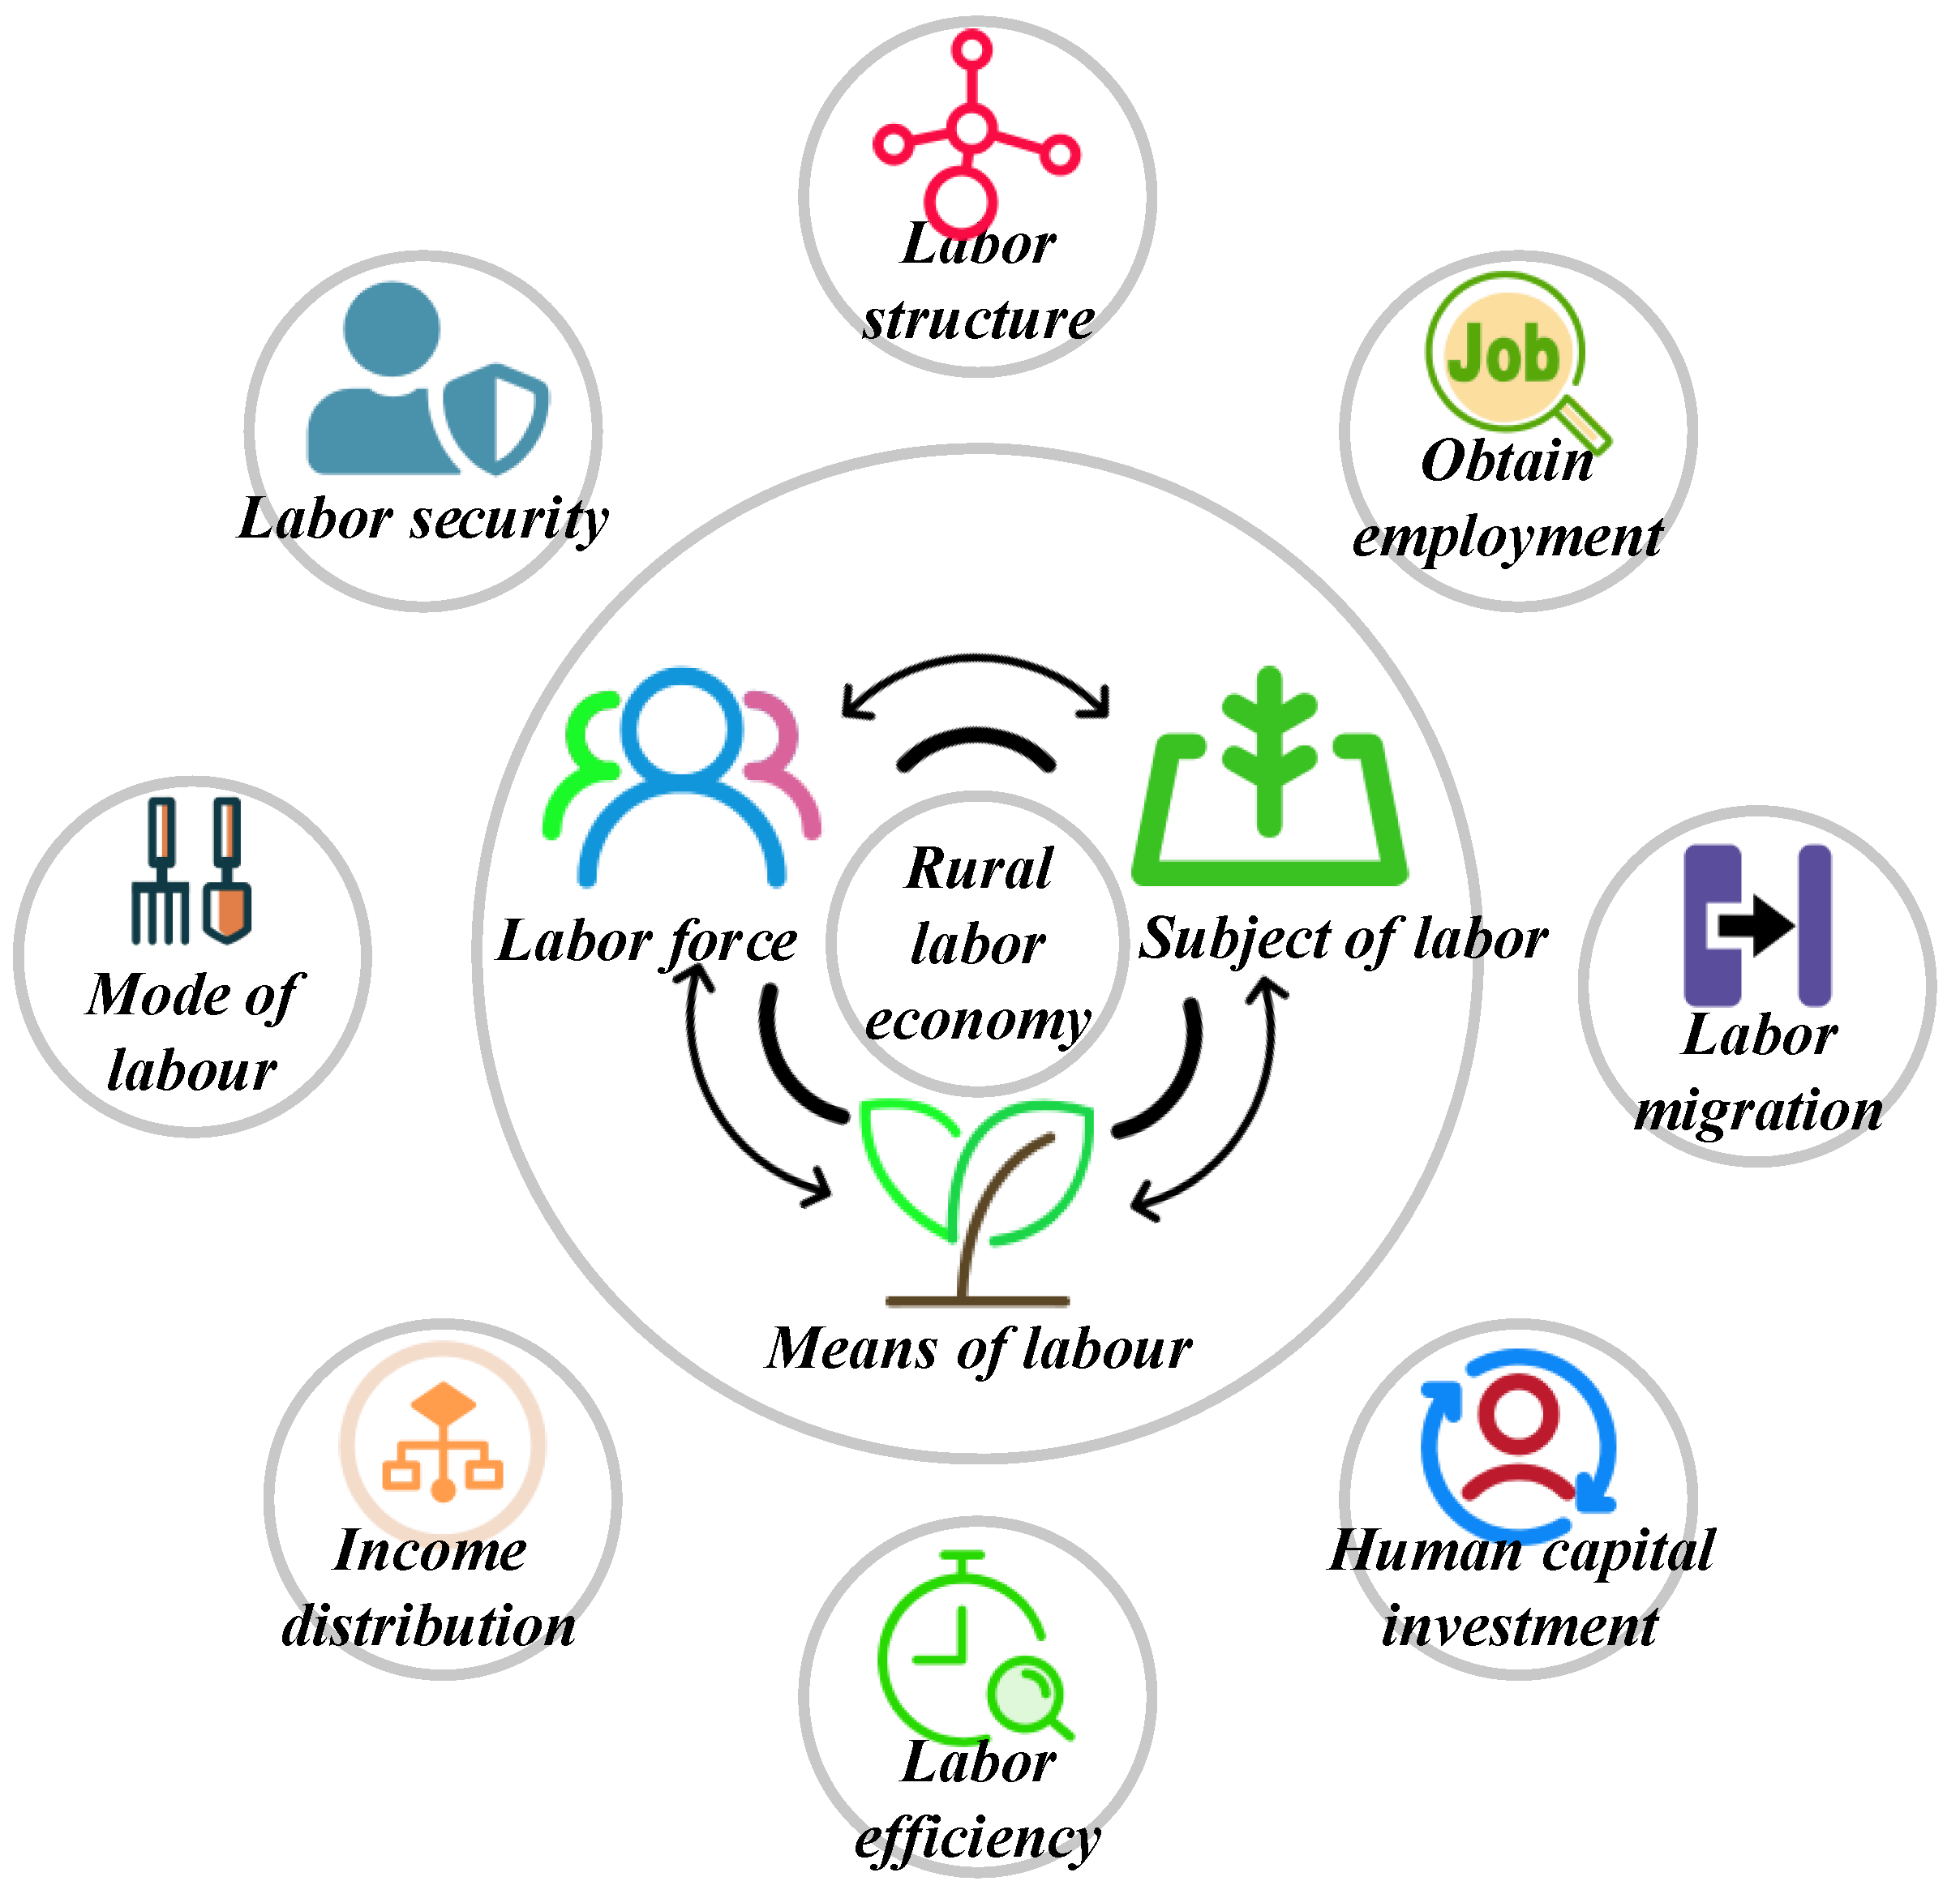
Figure 2.
Influence mechanism of digital inclusive finance on rural labor economics.
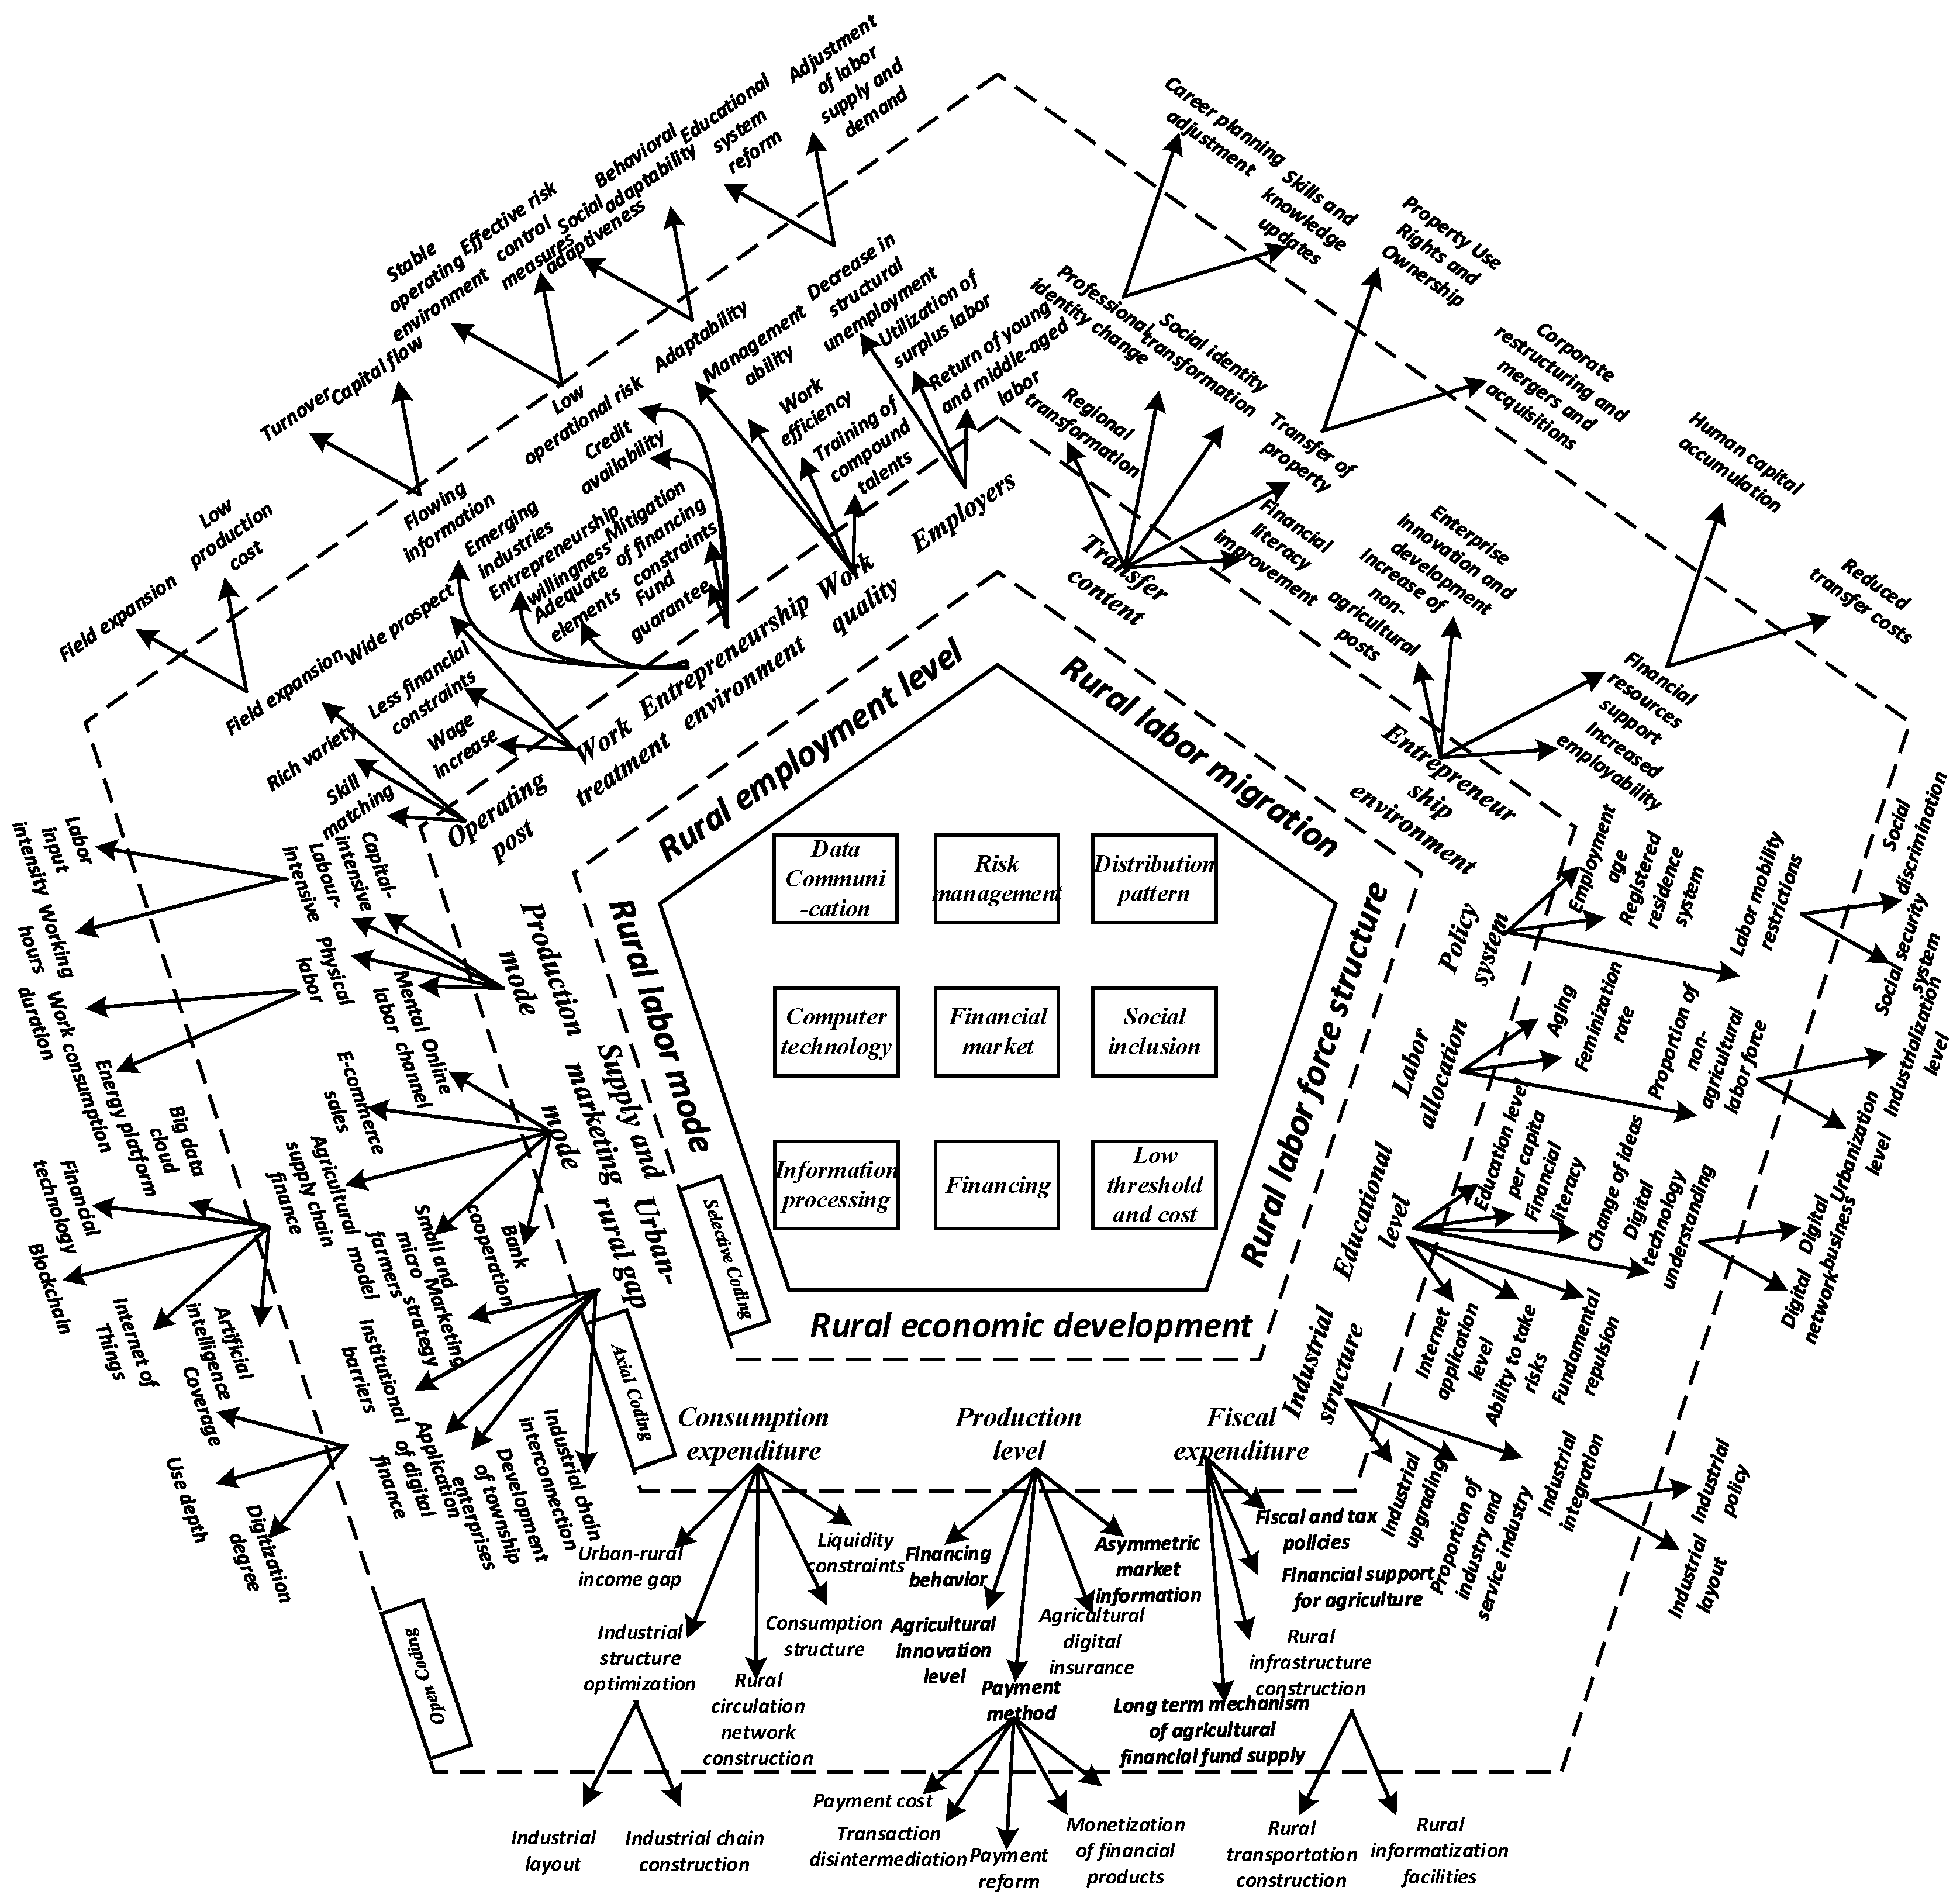
Figure 3.
Methodology framework.
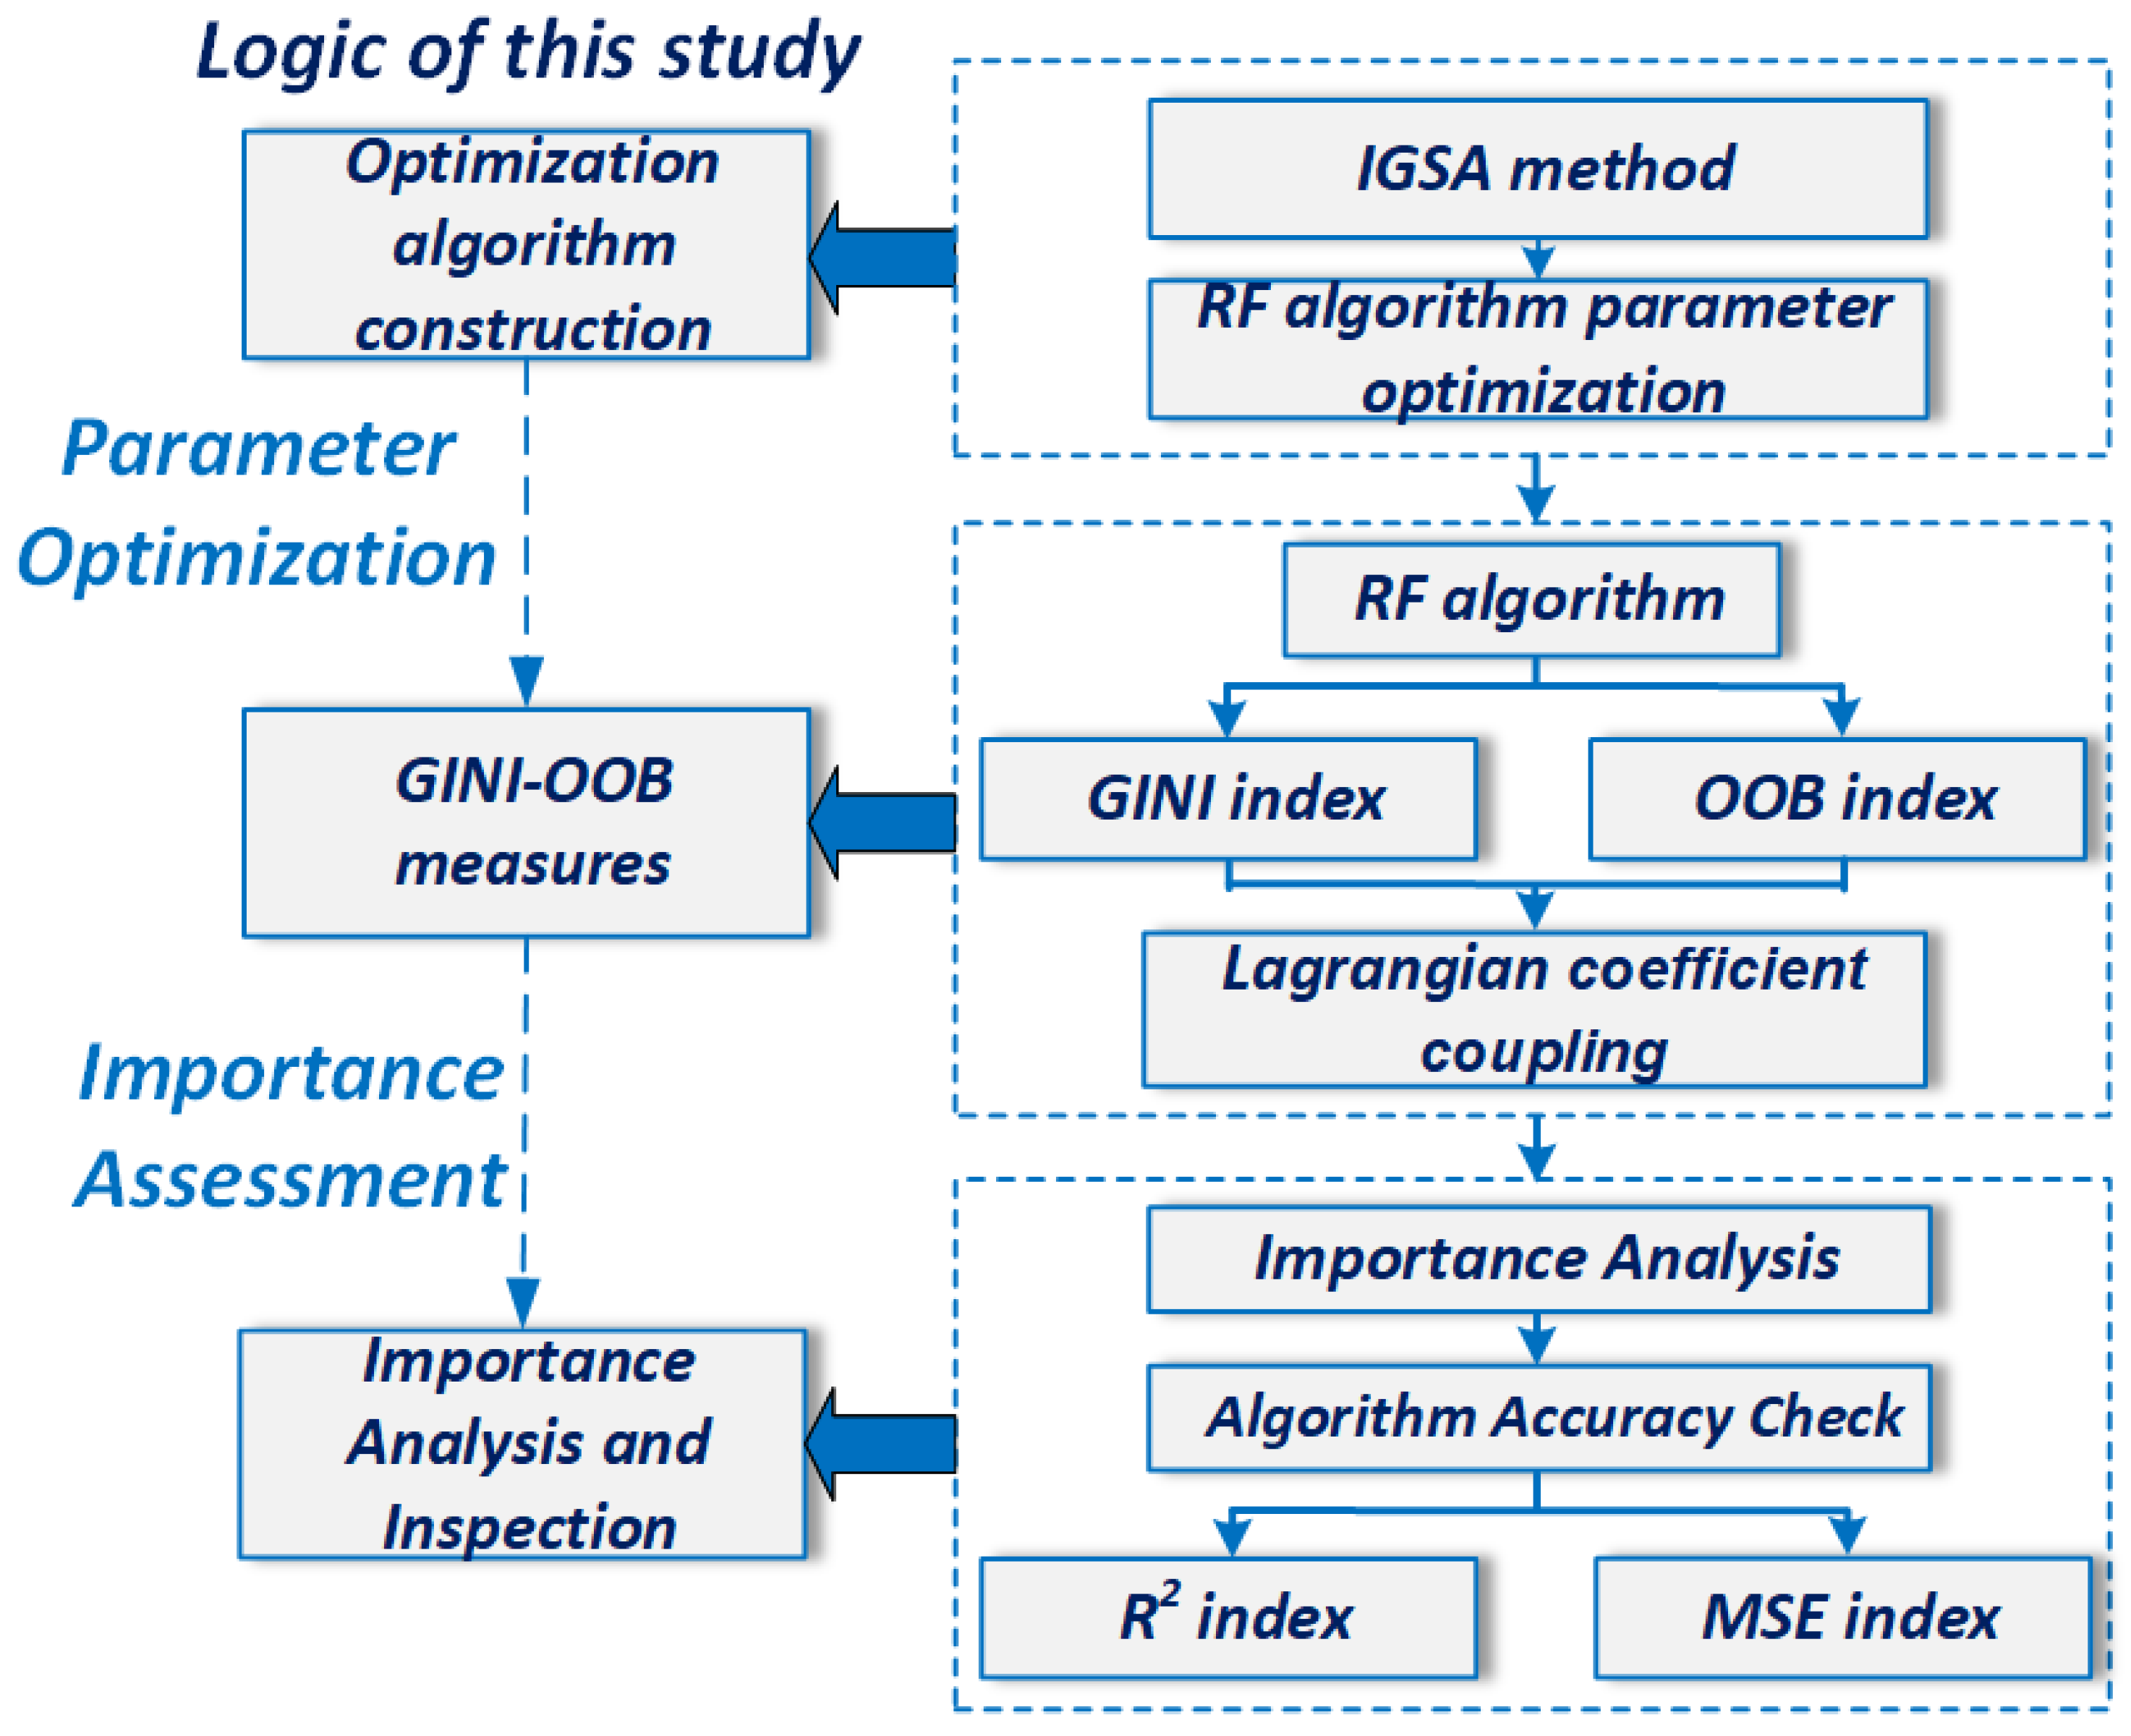
Figure 4.
Schematic diagram of random forest execution.
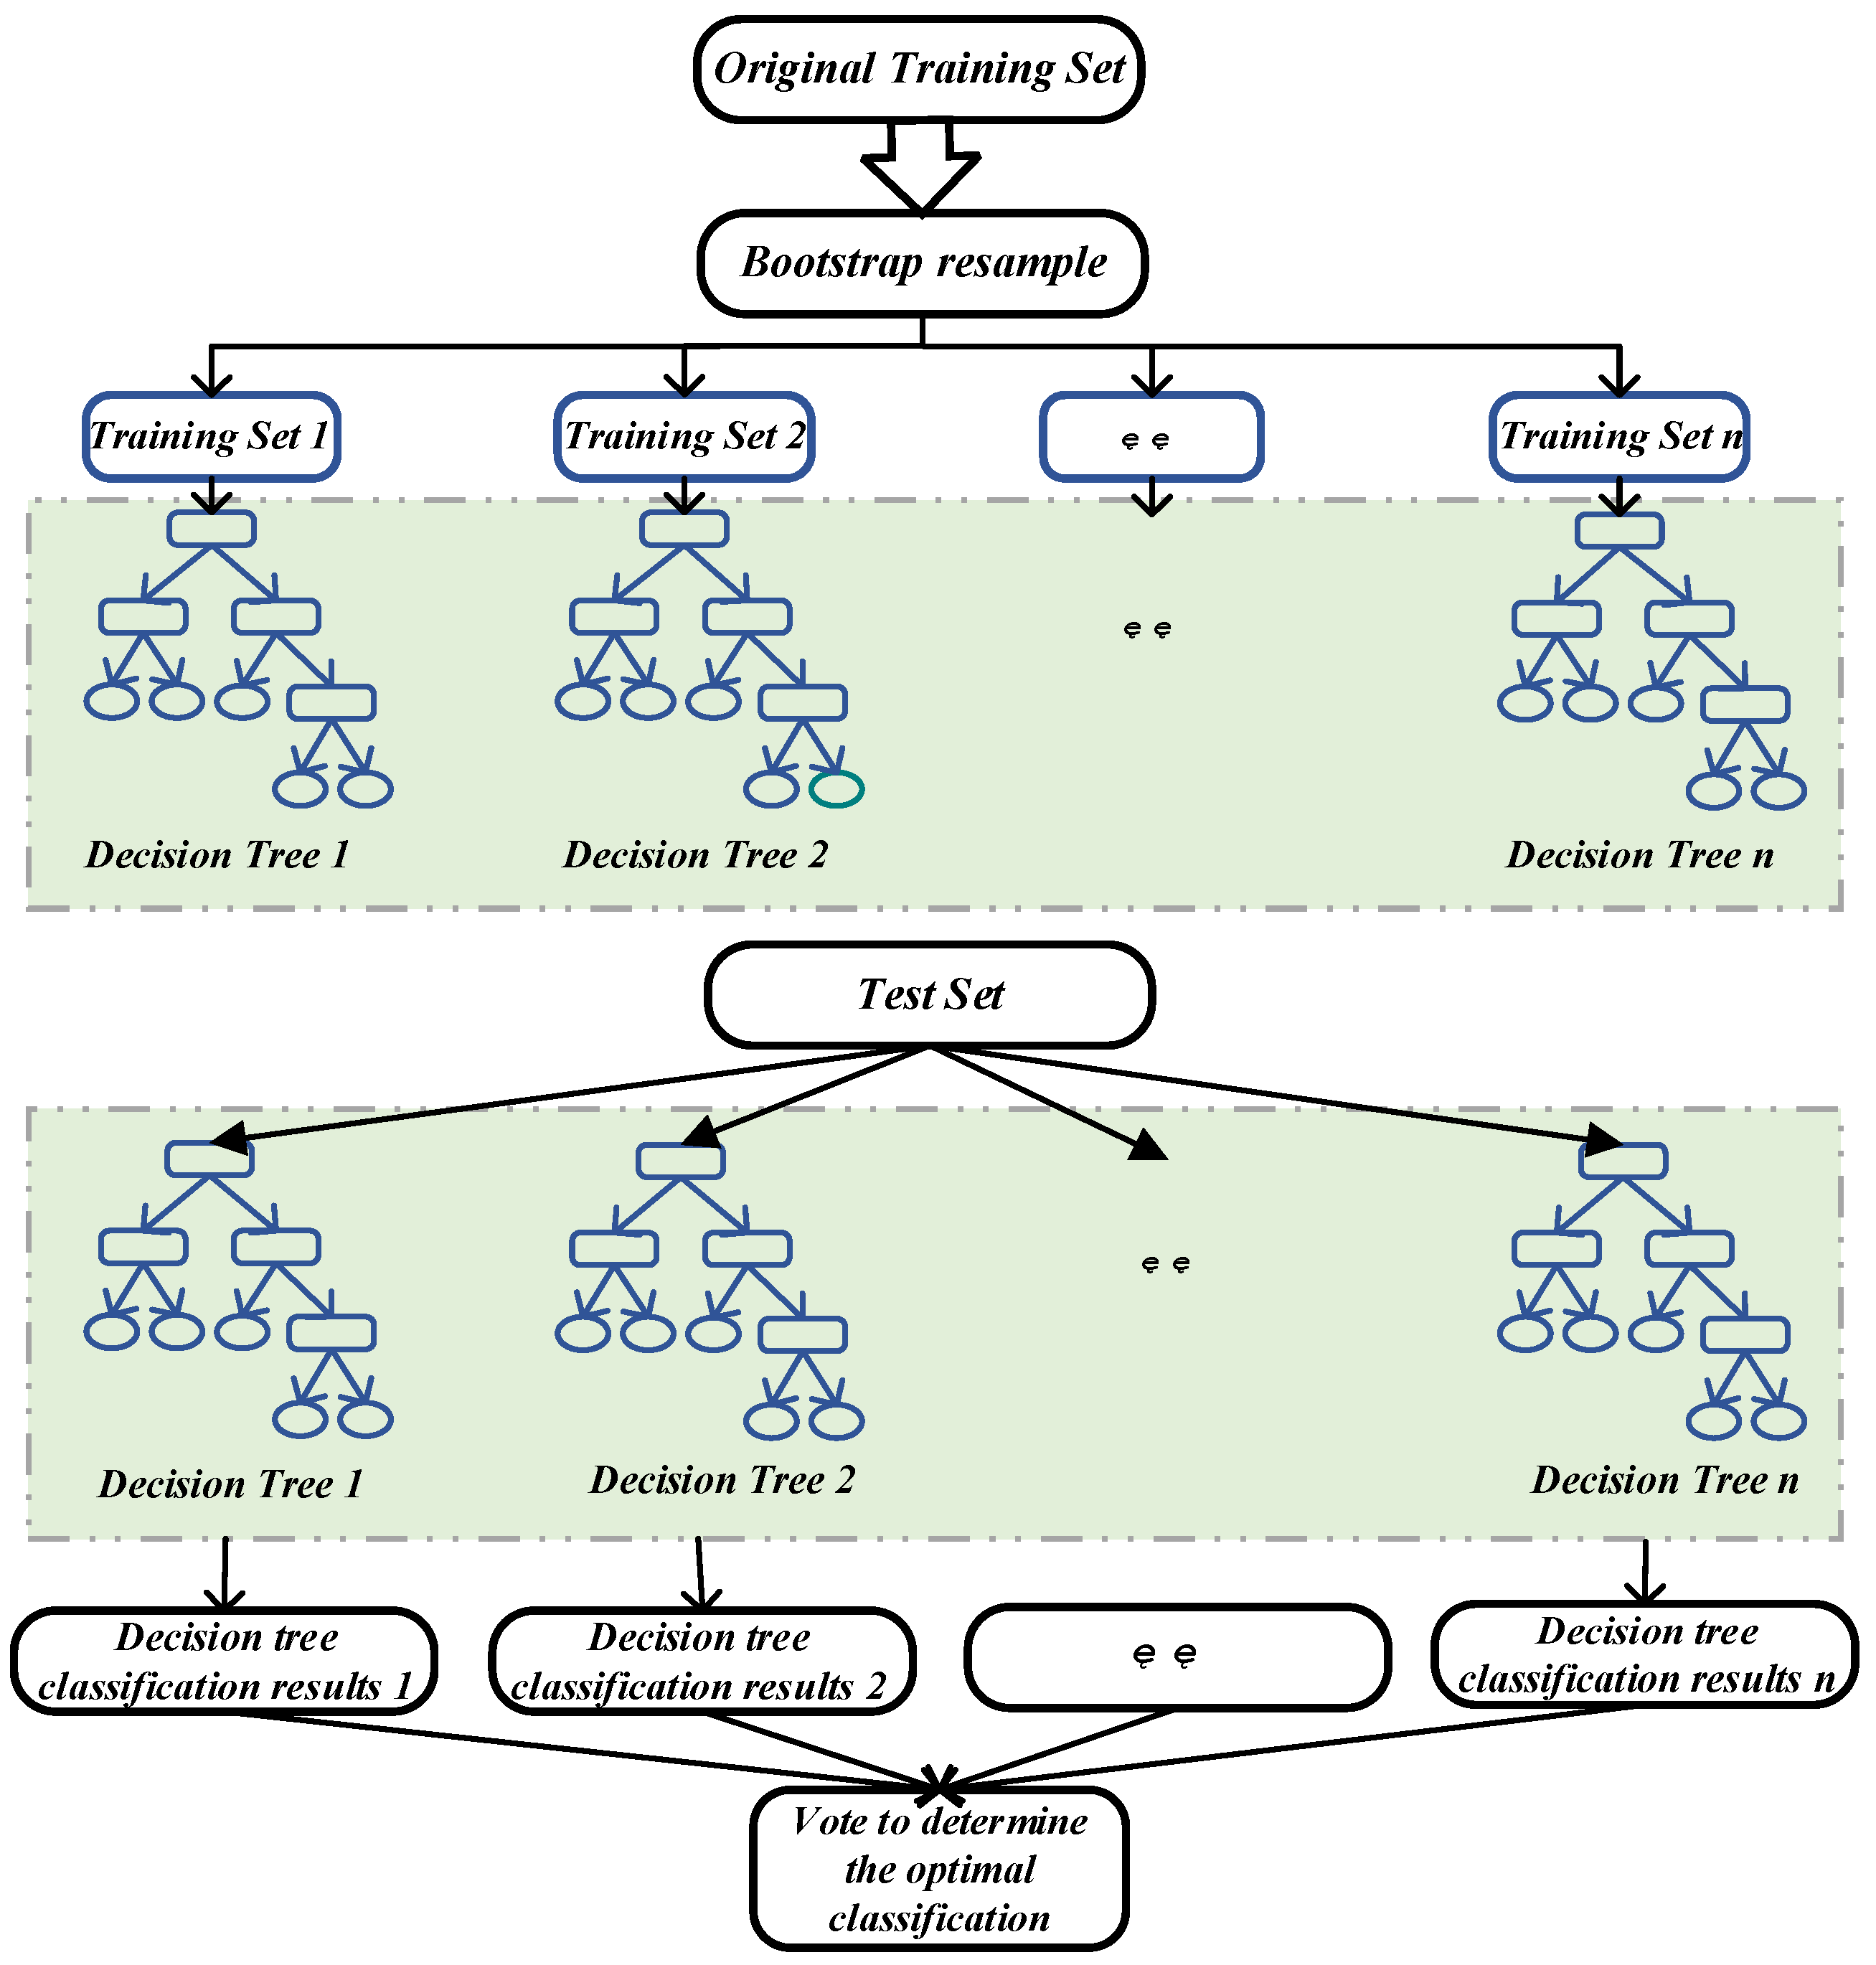
Figure 5.
IGSA-RF structural.
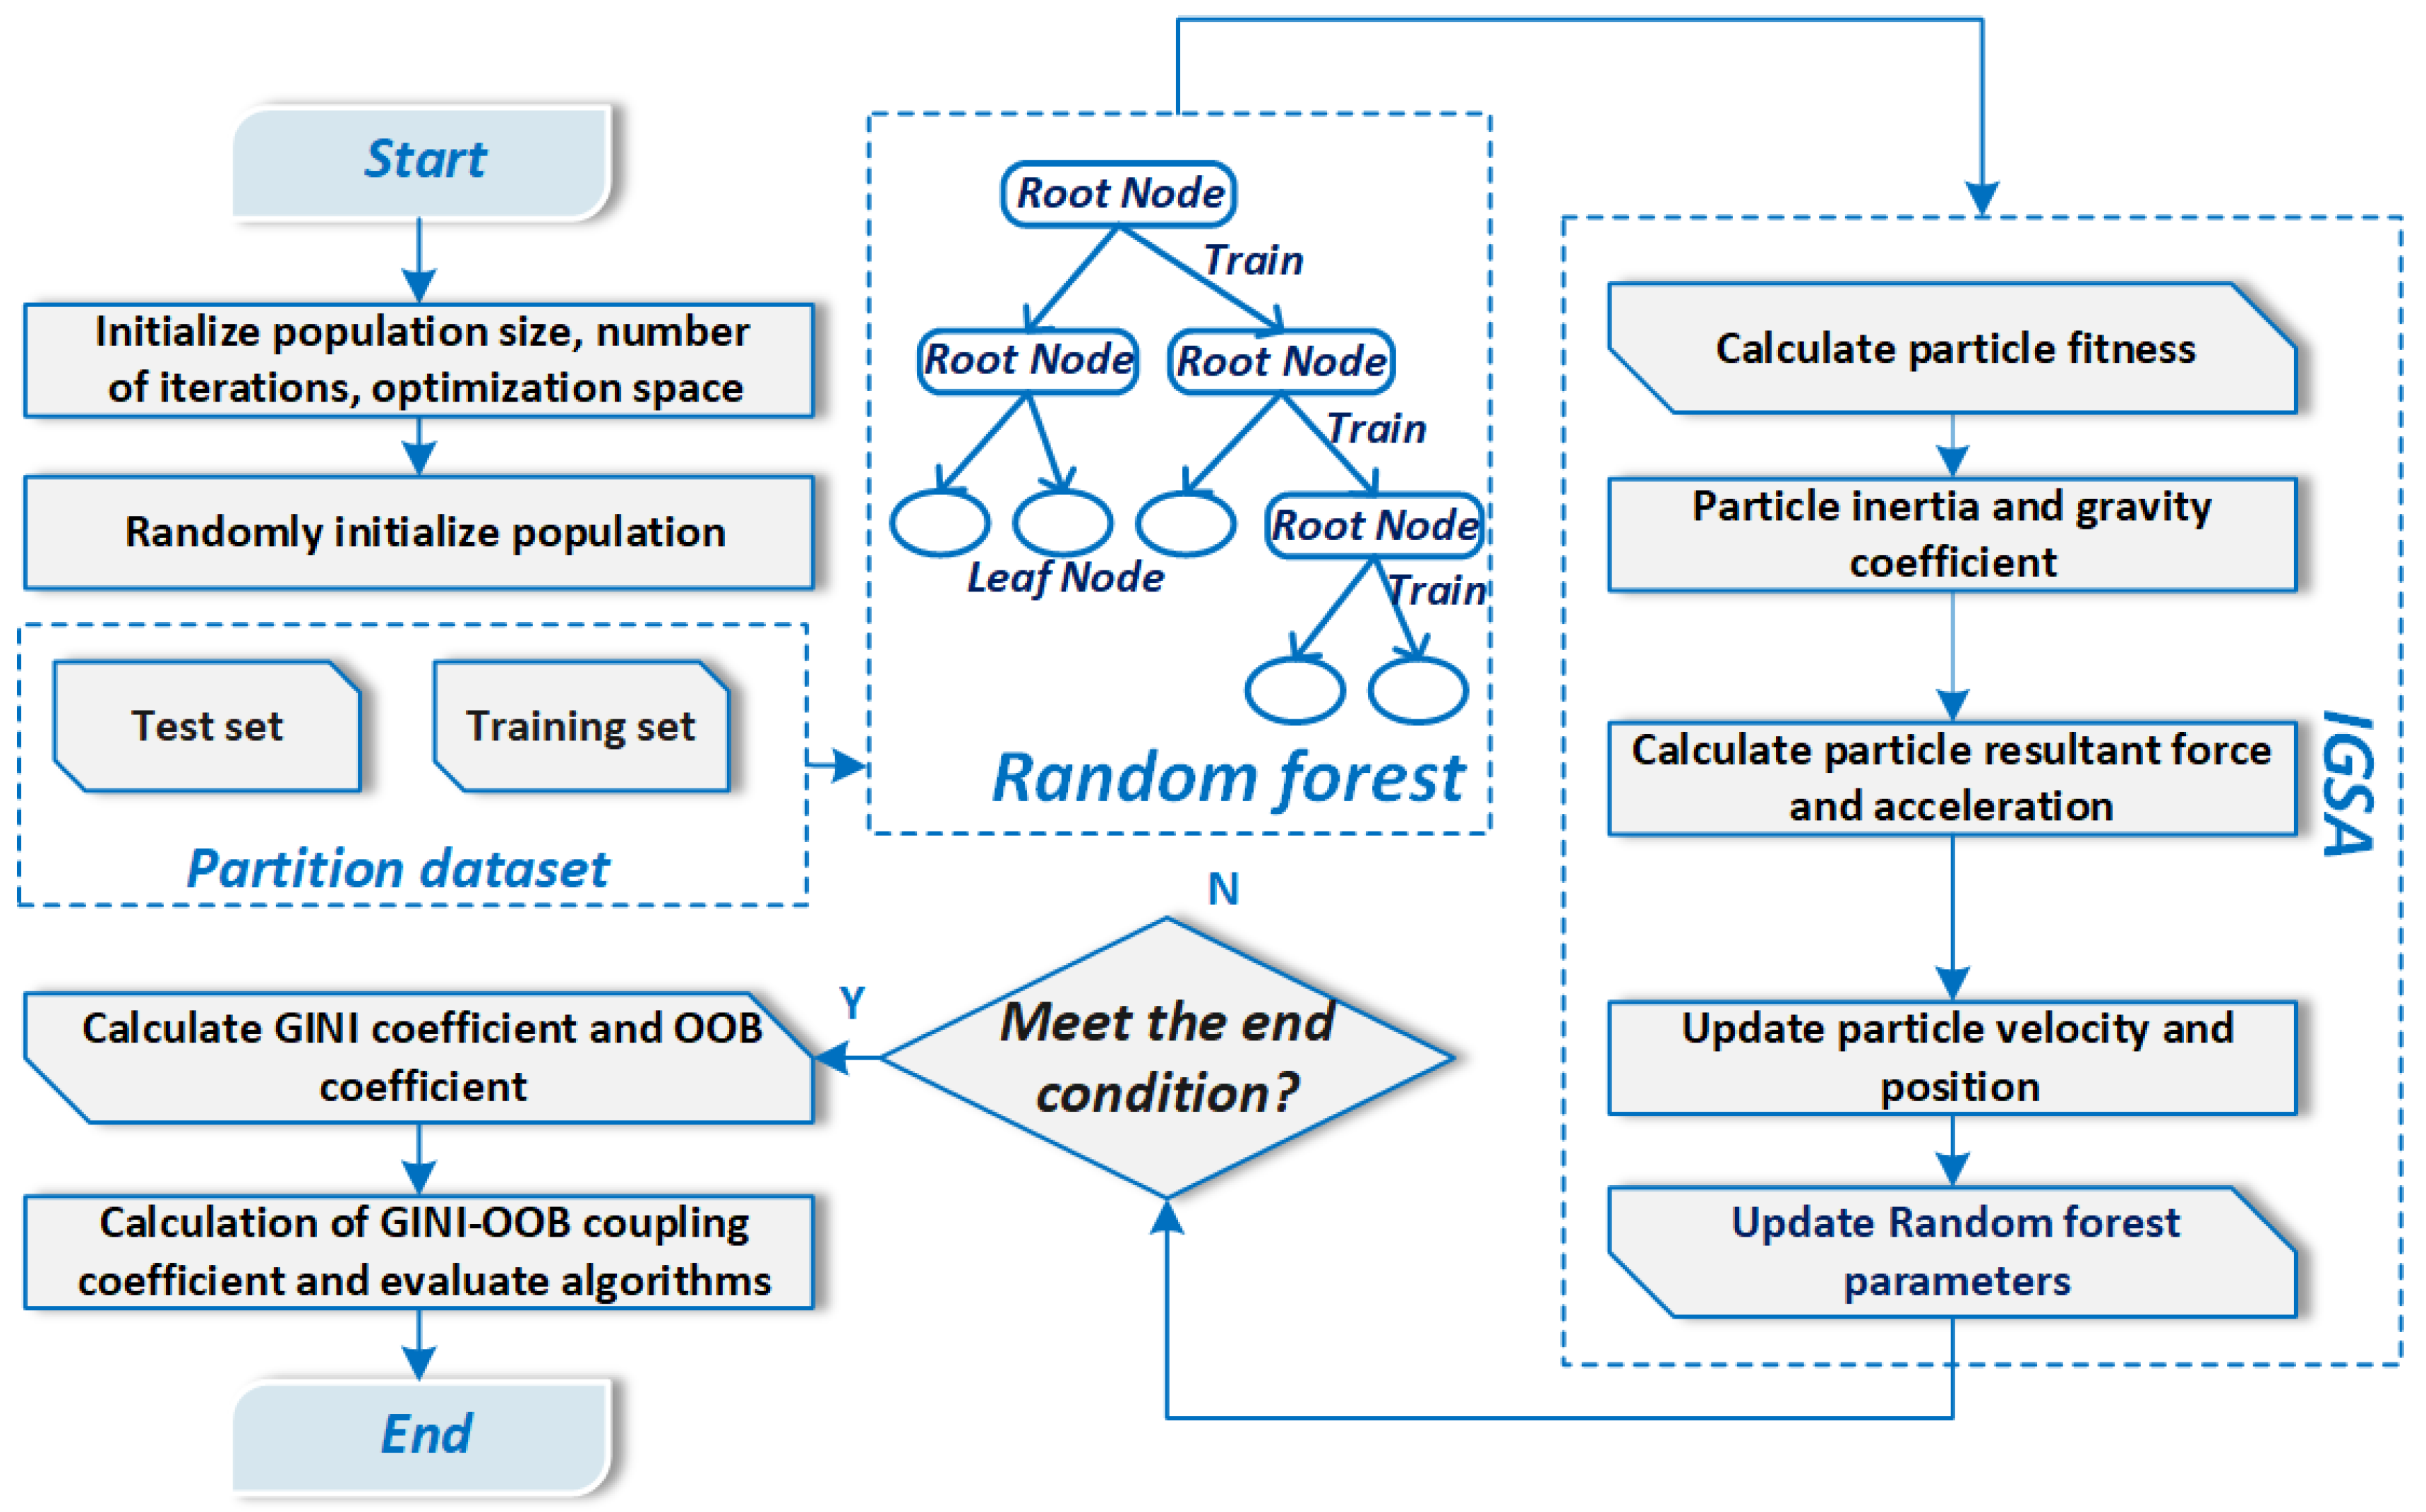
Figure 6.
Spatial location of Jiangsu Province.
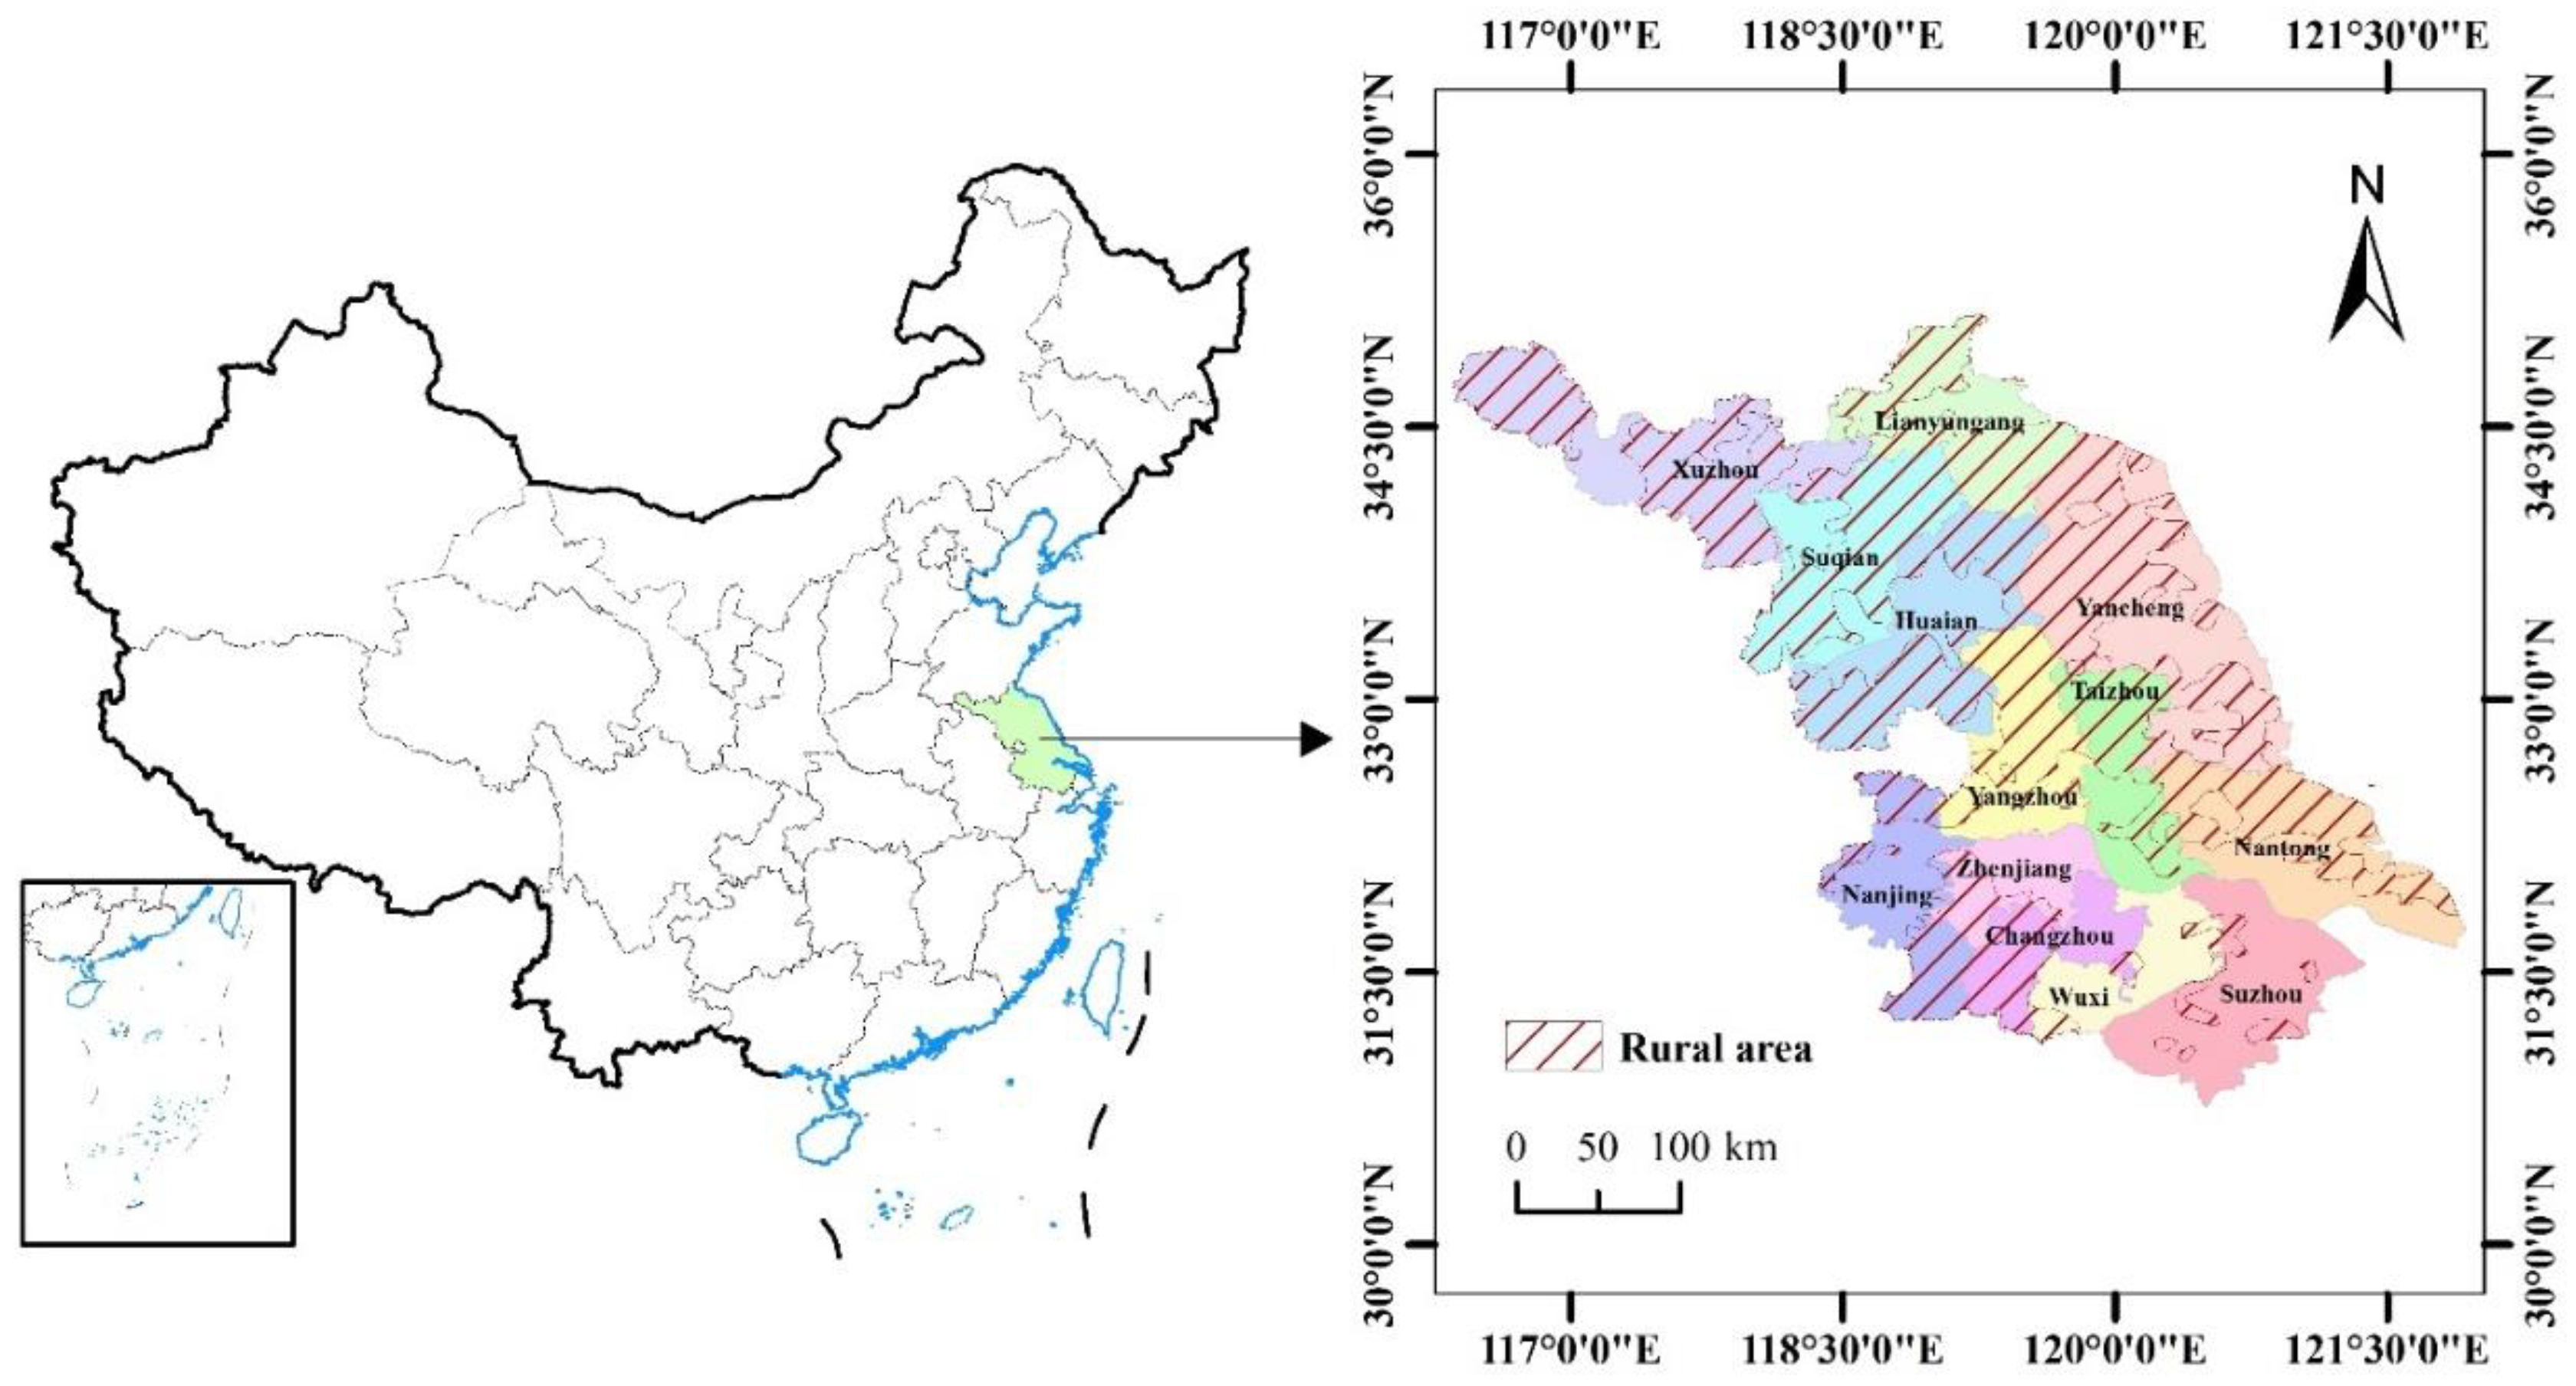
Figure 7.
Error metrics chart.

Figure 8.
Point graph of Gini-OOB coupling coefficient.
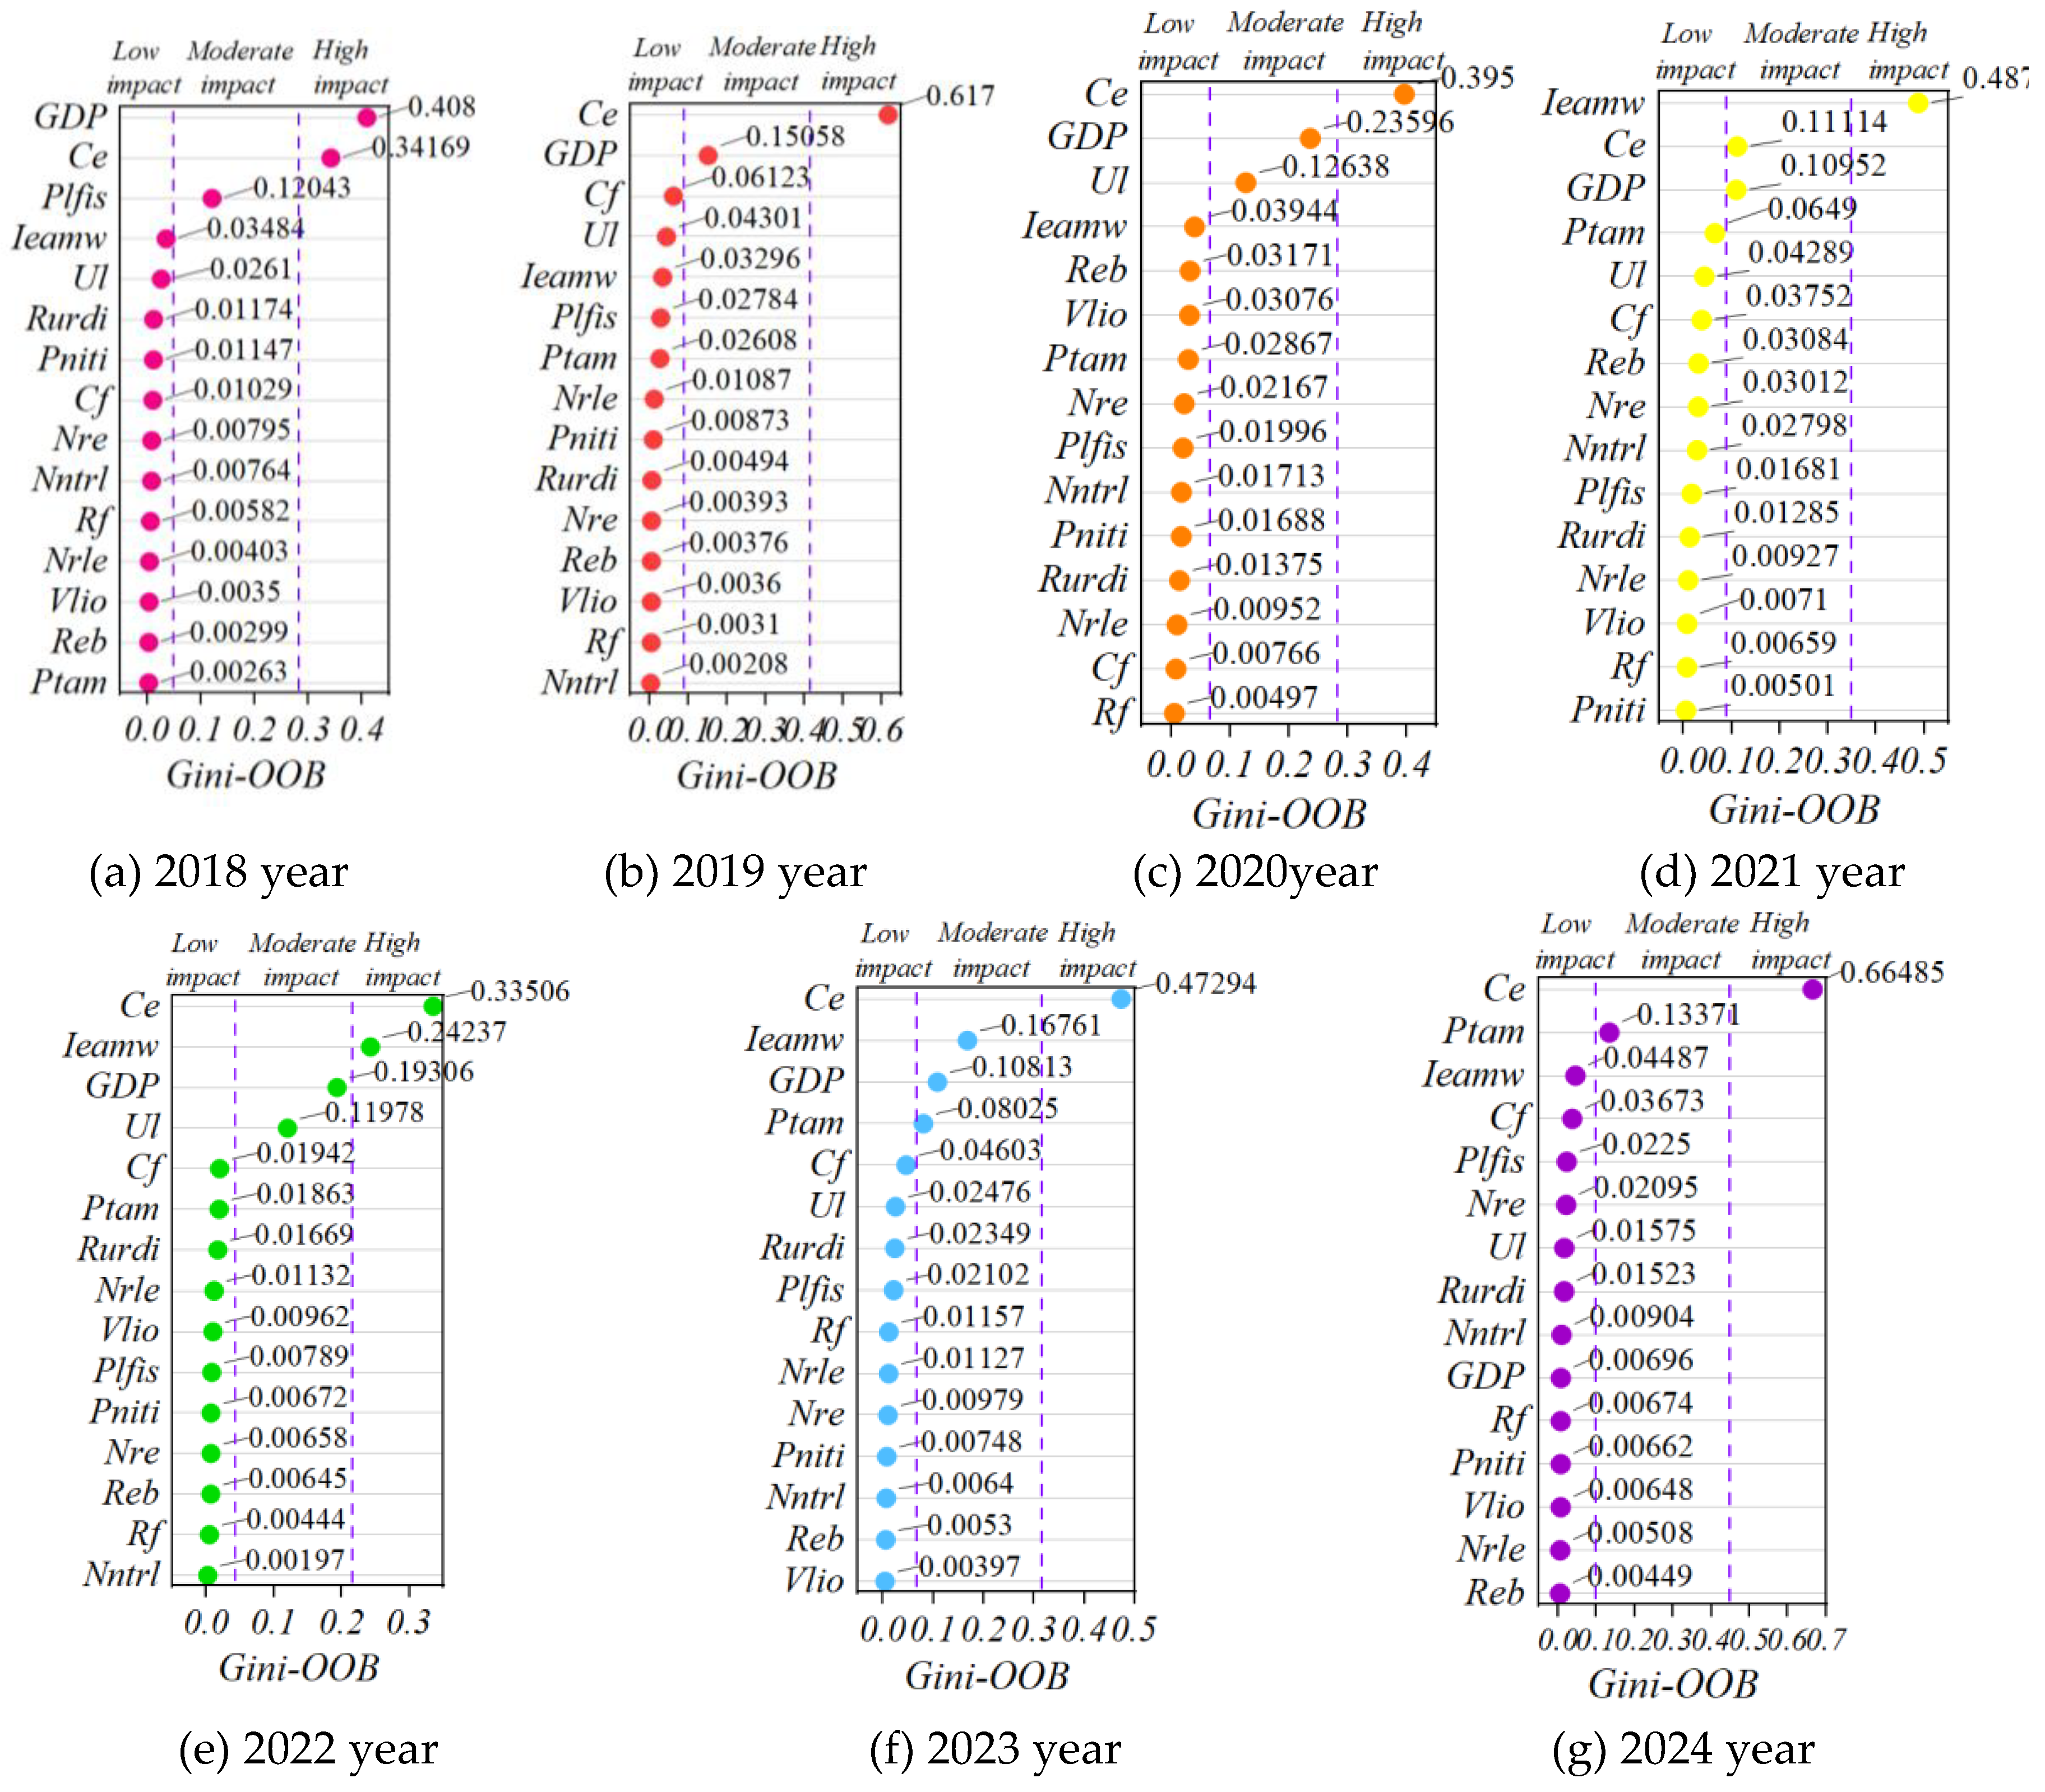
Figure 9.
Summary of coefficients.
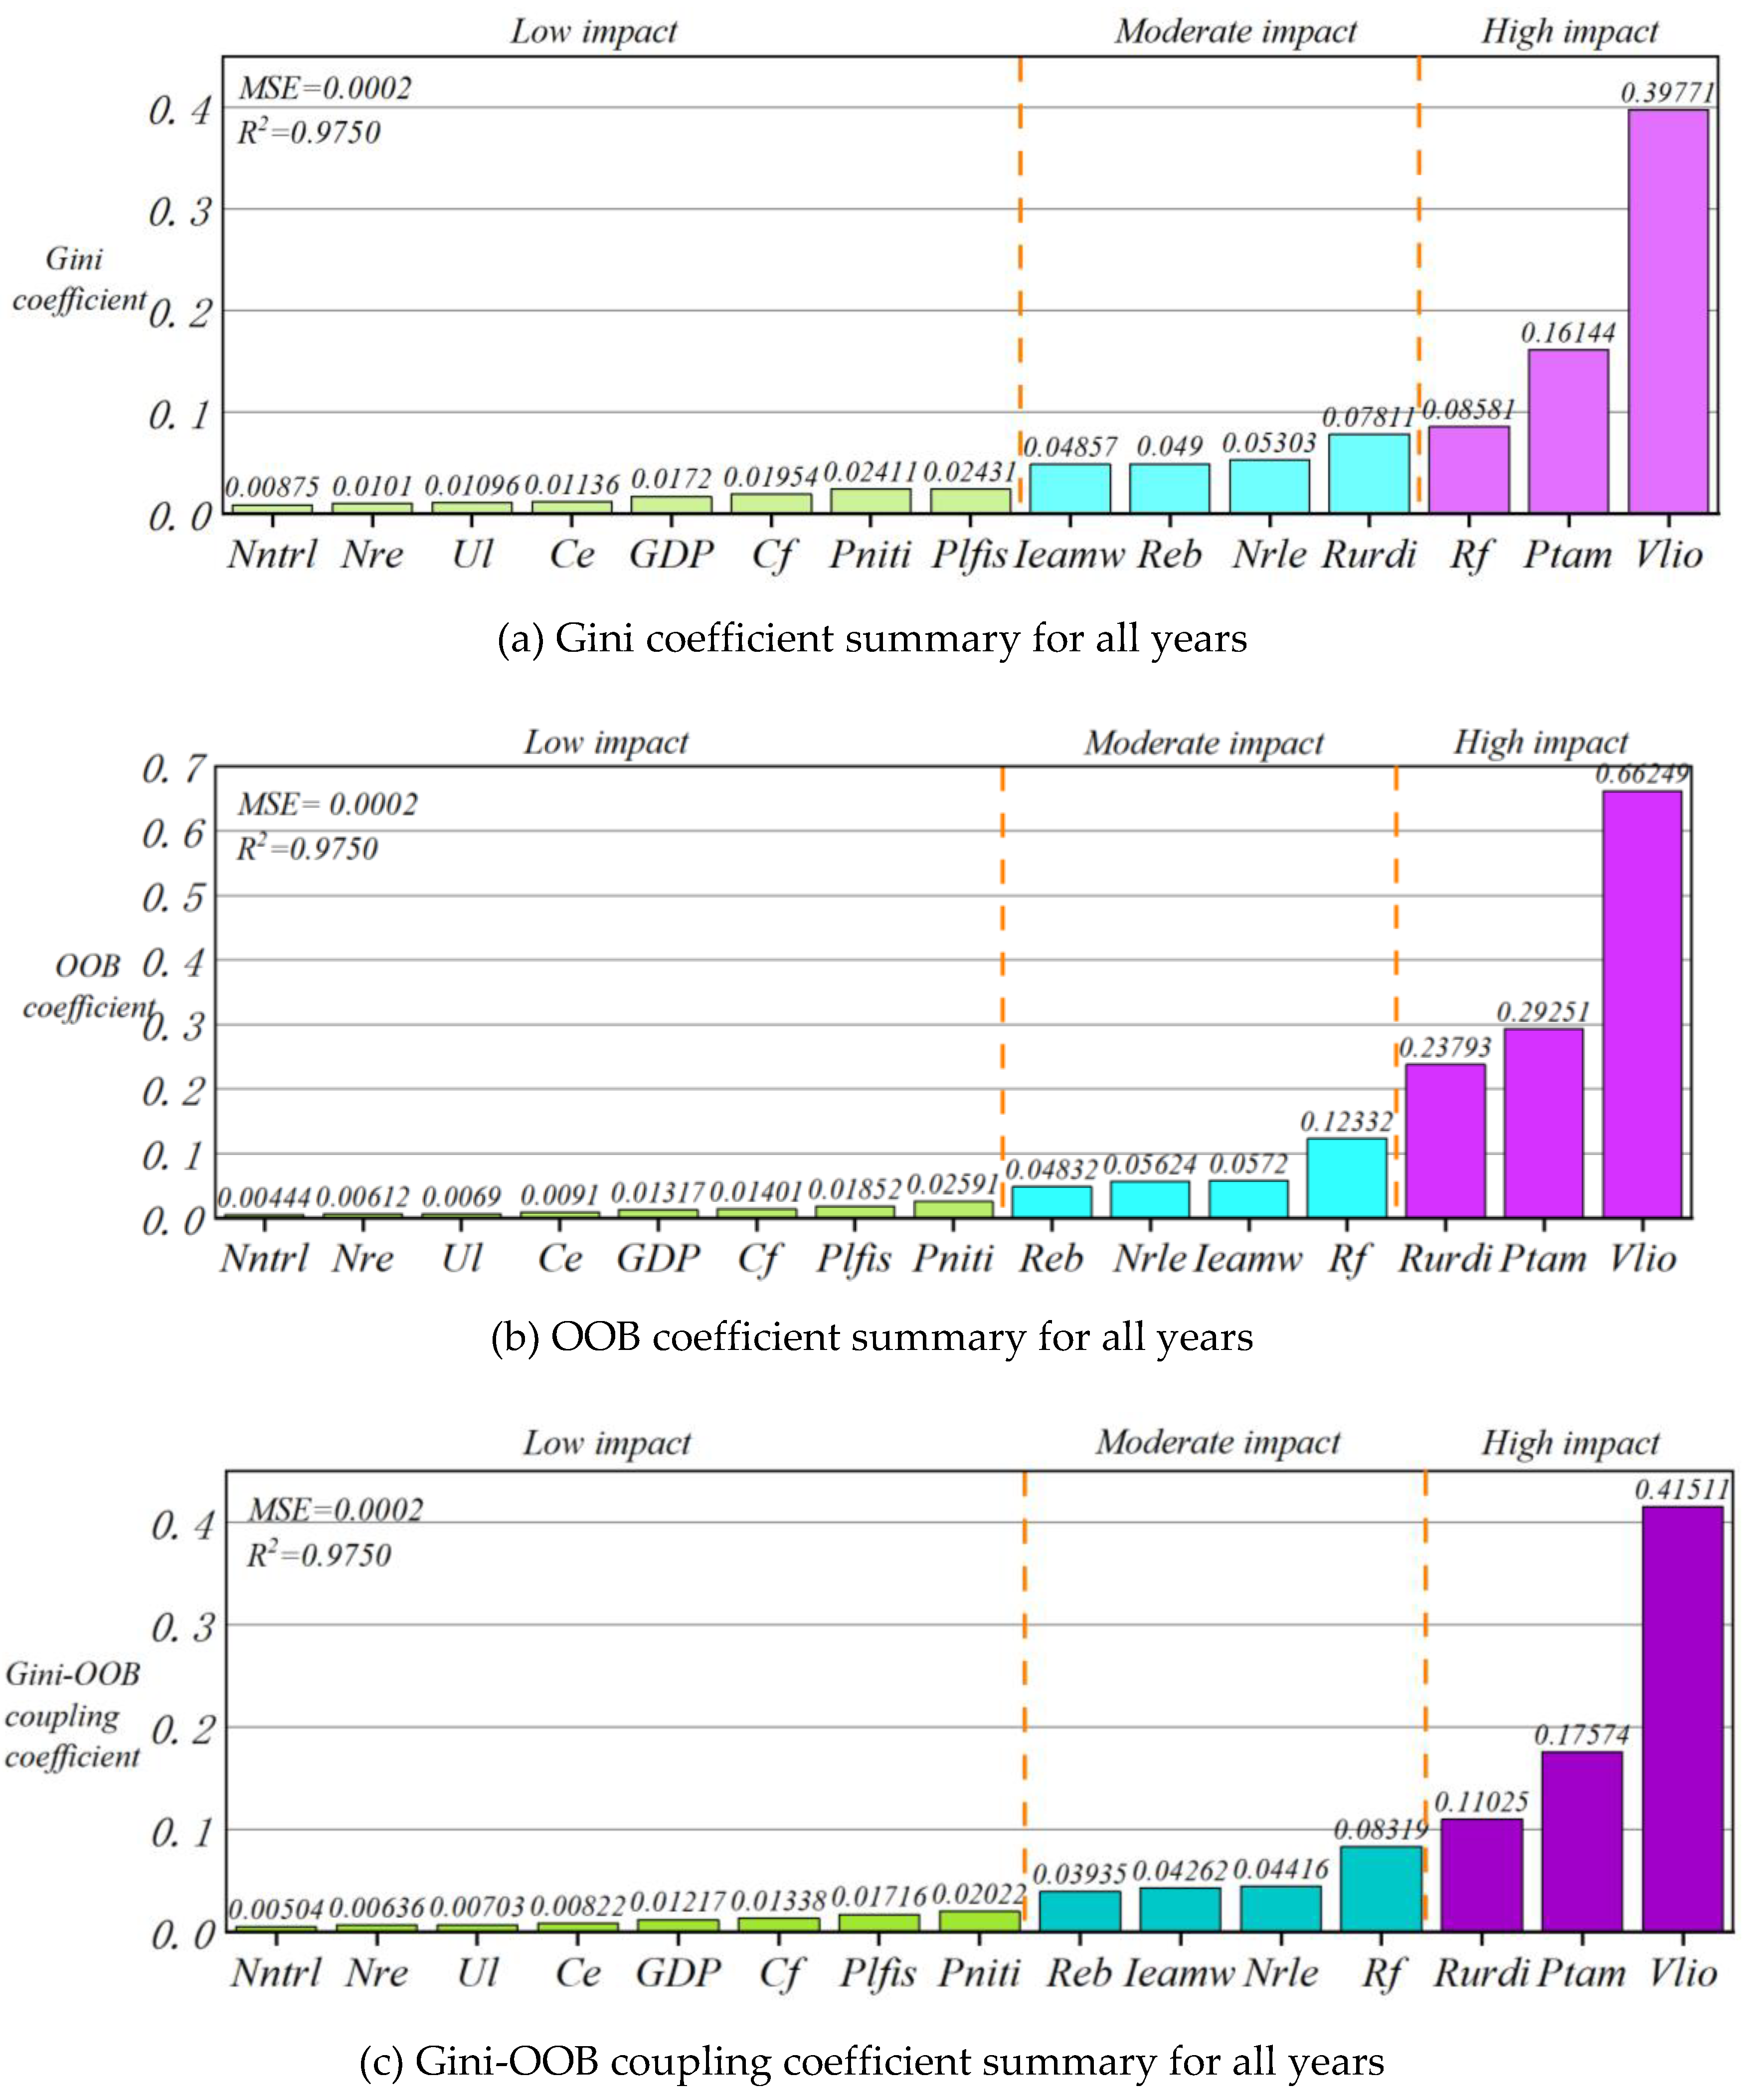
Figure 10.
Accuracy comparison results.
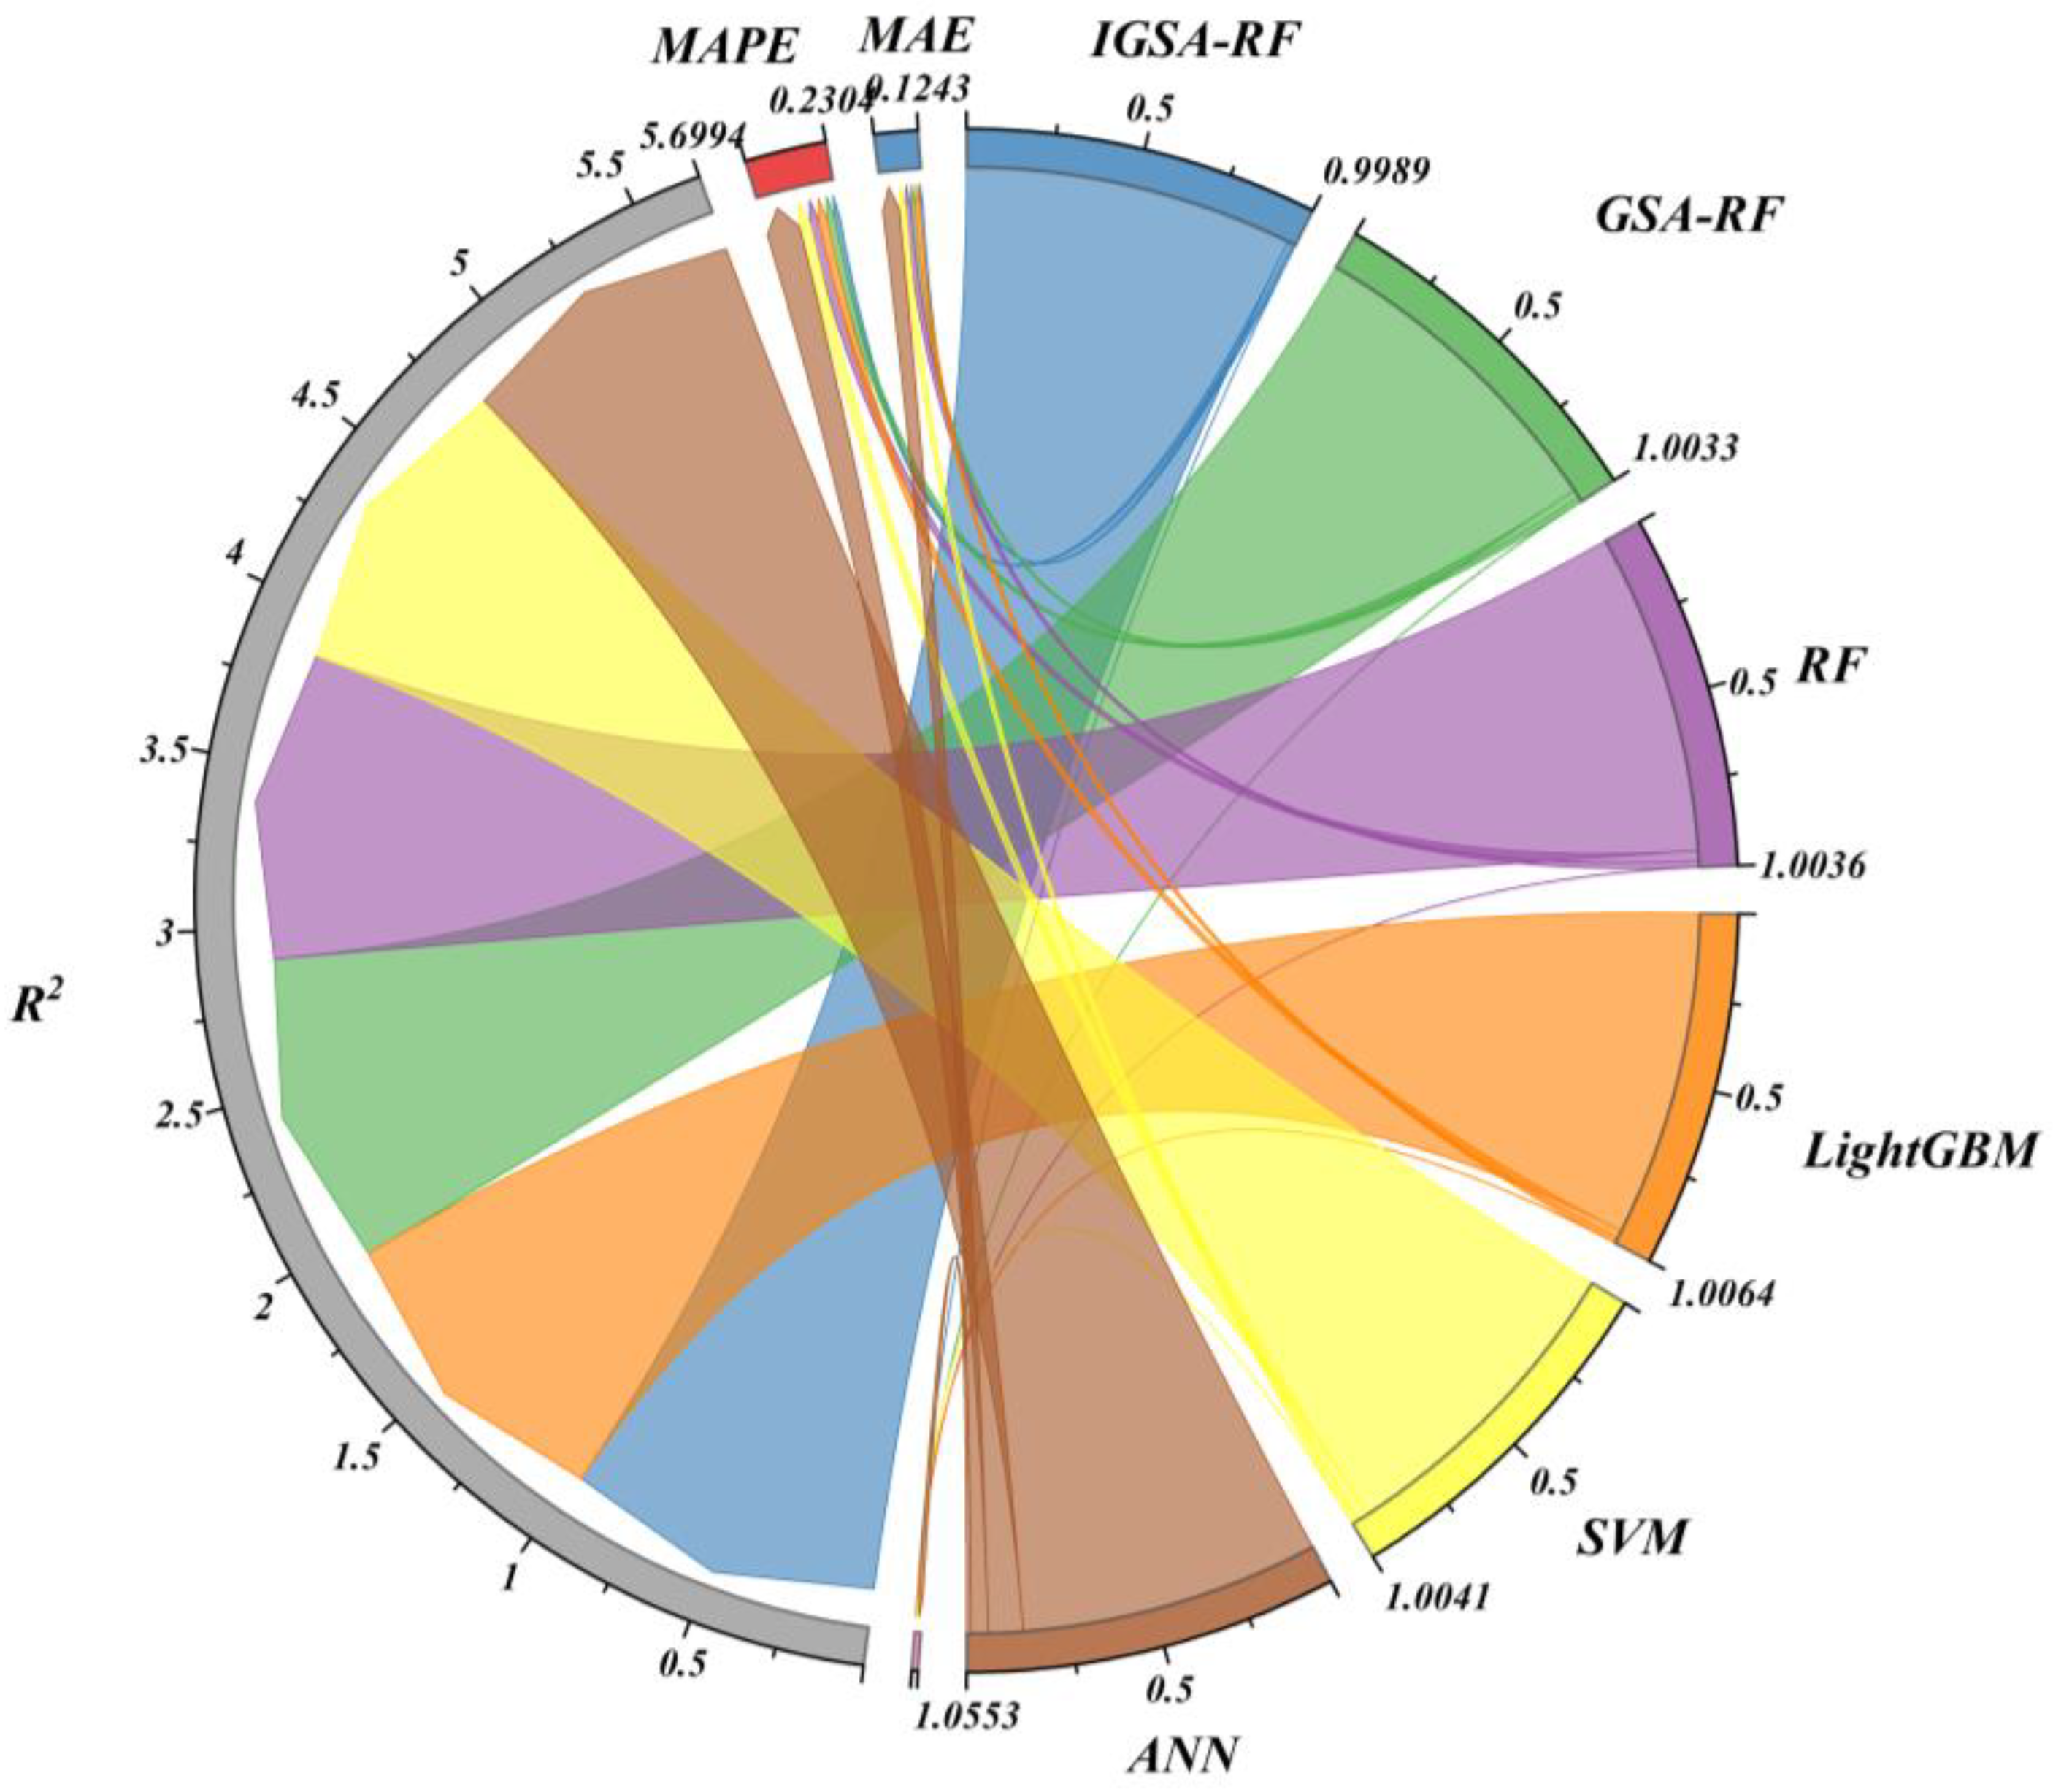

Table 1.
Table of rural labor economic indicators.
| First Indicators | Secondary Indicators | Data Dimension | Reference |
| Rural Labor Economics Indicators | Rural employment | Number of rural employees (Nre) | [34] |
| Average monetary wage index of employees (Ieamw) | [35] | ||
| The ratio of urban and rural disposable income (Rurdi) | [36,37] | ||
| Rural labor migration | Number of rural labor emigration (Nrle) | [38,39] | |
| Number of non-agricultural transfers of rural labor (Nntrl) | [40] | ||
| Rural labor force structure | Burden ratio of the elderly population (Reb) | [41,42] | |
| Feminization rate (Rf) | [43,44] | ||
| Total power of rural machinery (Ptam) | [45] | ||
| The proportion of labor force in industry and service industry (Plfis) | [46] | ||
| Rural labor mode | The output value of labor-intensive industries (Vlio) | [47] | |
| Urbanization level (Ul) | [48] | ||
| The proportion of non-agricultural income in total income (Pniti) | [49] | ||
| Rural economic development | Consumption expenditure (Ce) | [50] | |
| Fiscal expenditure (Cf) | [51] | ||
| Regional GDP (GDP) | [52] |
Table 2.
Adoption of mechanism.
| Sr.No | Model | Algorithm | Conclusion | Data | Year | Reference |
| 1. | PM | TR, EA | Digital inclusive finance can boost coastal rural entrepreneurial activity. | 10524 | 2022 | [53] |
| 2. | BM | MCMC | Investing in wind farms can raise local wages. | 32807 | 2024 | [54] |
| 3. | MRA | BOO | There is a correlation between financing willingness and knowledge mastery in inclusive finance. | 160 | 2019 | [55] |
| 4. | MNL, TR | EA | Digital inclusive finance has a positive effect on the off-farm transfer of rural laborers. | 19287 | 2023 | [56] |
| 5. | PLS-SEM | TAM | Digital services and operations have a positive effect on non-technical industries. | 418 | 2021 | [57] |
| 6. | WLS | DI | The impact of digitalization on employment is mediated by the level of routineness in each occupation. | 400 | 2020 | [58] |
| 7. | DID, C-D | TFP, MPL | Digitization leads to increased productivity in rural areas. | 6600 | 2024 | [59] |
| 8. | GMM | TOPSIS, EEM | Digital inclusive finance has a positive impact on the development of rural industries. | 31 Province | 2024 | [60] |
| 9. | CPM | RPM | Accurately targeting excluded groups in rural areas can help formulate policies to enhance the inclusiveness of the financial industry. | 940 | 2018 | [61] |
| 10. | PSM | EA | Internet access helps reduce poverty levels in rural areas. | 244911 | 2021 | [62] |
| 11. | FE | RF | Broadband internet provides digital dividends for low-income groups. | 1292010 | 2021 | [63] |
| 12. | GMM | BOO | Digital inclusive finance, using rural e-commerce as an intermediary effect, contributes to unleash the rural consumption potential. | 240 | 2022 | [64] |
| 13. | LM | GA | Rural smart e-commerce investment and financing models contribute to local development. | 1258 | 2021 | [65] |
| 14. | DID | ESE | Tax Increment Financing has a positive effect on the property tax base in rural areas. | 267 | 2021 | [66] |
| 15. | PVAR | EA | There is a lagging positive relationship between fiscal support for agriculture and digital inclusive finance. | 31 Province | 2023 | [67] |
Model: PM: Probit Model, BM: Bayesian Multilevel Model, MRA: Multiple Regression Analysis Model, MNL: Multinomial Logit Model, TR: Threshold Regressive Model, PLS-SEM: Partial Least Squares Structural Equation Modeling, WLS: Weighted Least Squares, DID: Difference-in-Difference Model, C-D: Cobb-Douglas Utility Function, GMM: Gaussian Mixture Model, CPM: Censored Probit Model, PSM: Propensity Score Matching, FE: Fixed Effect Model, LM: Layered Model, PVAR: Panel Vector Autoregression. Algorithms: TR: Theoretical Research, EA: Empirical Analysis, MCMC: Markov Chain Monte Carlo, TAM: Technology Acceptance Model, DI: Digitalization Indice, TFP: Total Factor Productivity, MPL: Marginal Product of Land, BOO: Bootstrap (Kermit protocol binary file), TOPSIS: Technique for Order Preference by Similarity to Ideal Solution, EEM: Entropy Evaluation Method, RPM: Review Probability Model, RF: Random Forest Algorithm, GA: Genetic Algorithm, ESE: Event-Study Estimation.
Table 3.
Descriptive statistics of indicators.
| Indicator code/Unit | Count | Max | Min | Mean | Median | Std. dev. |
| /CNY per person | 424 | 25675.00 | 6362.00 | 14672.06 | 14596.00 | 4318.22 |
| /CNY per person | 424 | 3656687.00 | 48.90 | 909622.90 | 743152.50 | 591408.44 |
| GDP/CNY per person | 424 | 242576.00 | 337.03 | 98763.82 | 89937.00 | 51126.84 |
| 424 | 99.41 | 43.09 | 60.99 | 59.46 | 8.99 | |
| /10000 person unit | 424 | 82.32 | 0.51 | 34.26 | 35.72 | 14.43 |
| 424 | 23776.00 | 4212.00 | 11839.66 | 11098.50 | 4525.42 | |
| /% | 424 | 2.24 | 1.31 | 1.91 | 1.93 | 0.17 |
| /person unit | 424 | 29674.00 | 777.00 | 5584.79 | 4189.50 | 4252.63 |
| /10000 person unit | 424 | 53.75 | 0.47 | 24.61 | 23.86 | 10.56 |
| /% | 424 | 1.09 | 0.45 | 0.76 | 0.76 | 0.13 |
| /% | 424 | 54.90 | 0.42 | 3.06 | 0.48 | 11.12 |
| /% | 424 | 1.59 | 0.20 | 0.50 | 0.48 | 0.18 |
| /10000 CNY unit | 424 | 2321069.00 | 12521.00 | 916171.59 | 844549.50 | 448327.45 |
| /kW | 424 | 223.50 | 2.48 | 68.29 | 59.30 | 43.27 |
| /% | 424 | 0.93 | 0.38 | 0.74 | 0.75 | 0.09 |
Table 4.
Gini coefficient table.
| Index classification | Index definition | 2018 | 2019 | 2020 | 2021 | 2022 | 2023 | 2024 |
| Labor economic indicator system | Ce | 0.3244 | 0.5104 | 0.3739 | 0.1349 | 0.3236 | 0.4025 | 0.5328 |
| Cf | 0.0107 | 0.0494 | 0.0075 | 0.0320 | 0.0255 | 0.0433 | 0.0506 | |
| GDP | 0.3840 | 0.1691 | 0.2352 | 0.1247 | 0.2028 | 0.1529 | 0.0081 | |
| Ul | 0.0295 | 0.0724 | 0.1158 | 0.0490 | 0.0905 | 0.0360 | 0.0193 | |
| Nre | 0.0105 | 0.0057 | 0.0236 | 0.0287 | 0.0097 | 0.0119 | 0.0182 | |
| Ieamw | 0.0598 | 0.0416 | 0.0569 | 0.4490 | 0.2509 | 0.2079 | 0.0829 | |
| Rurdi | 0.0120 | 0.0062 | 0.0151 | 0.0129 | 0.0174 | 0.0190 | 0.0204 | |
| Nrle | 0.0046 | 0.0120 | 0.0084 | 0.0096 | 0.0115 | 0.0143 | 0.0061 | |
| Nntrl | 0.0102 | 0.0030 | 0.0174 | 0.0241 | 0.0044 | 0.0058 | 0.0137 | |
| Reb | 0.0038 | 0.0071 | 0.0316 | 0.0302 | 0.0060 | 0.0043 | 0.0056 | |
| Rf | 0.0083 | 0.0054 | 0.0085 | 0.0092 | 0.0051 | 0.0121 | 0.0077 | |
| Plfis | 0.1182 | 0.0480 | 0.0284 | 0.0260 | 0.0093 | 0.0159 | 0.0197 | |
| Vlio | 0.0047 | 0.0045 | 0.0260 | 0.0075 | 0.0102 | 0.0069 | 0.0057 | |
| Ptam | 0.0041 | 0.0528 | 0.0291 | 0.0538 | 0.0250 | 0.0594 | 0.2003 | |
| Pniti | 0.0153 | 0.0126 | 0.0228 | 0.0085 | 0.0082 | 0.0077 | 0.0090 |
Table 5.
OOB coefficient table.
| Index classification | Index definition | 2018 | 2019 | 2020 | 2021 | 2022 | 2023 | 2024 |
| Labor economic indicator system | Ce | 0.3379 | 0.5927 | 0.3083 | 0.3414 | 0.242 | 0.3594 | 0.6154 |
| Cf | 0.2793 | 0.1064 | 0.1745 | 0.062 | 0.1633 | 0.0874 | 0.0662 | |
| GDP | 0.0952 | 0.0603 | 0.1016 | 0.0591 | 0.1282 | 0.0701 | 0.0198 | |
| Ul | 0.0179 | 0.0207 | 0.0268 | 0.0505 | 0.1106 | 0.0495 | 0.0191 | |
| Nre | 0.0158 | 0.0203 | 0.0234 | 0.0284 | 0.0112 | 0.0316 | 0.018 | |
| Ieamw | 0.0089 | 0.0128 | 0.0208 | 0.0242 | 0.0103 | 0.0187 | 0.0179 | |
| Rurdi | 0.0077 | 0.0102 | 0.0202 | 0.021 | 0.0097 | 0.018 | 0.0095 | |
| Nrle | 0.0067 | 0.0078 | 0.0147 | 0.0204 | 0.0078 | 0.011 | 0.0084 | |
| Nntrl | 0.0047 | 0.0048 | 0.0124 | 0.0203 | 0.0063 | 0.0071 | 0.0055 | |
| Reb | 0.0044 | 0.0031 | 0.0103 | 0.0083 | 0.0048 | 0.0058 | 0.0044 | |
| Rf | 0.0032 | 0.0023 | 0.0092 | 0.007 | 0.0047 | 0.0052 | 0.0044 | |
| Plfis | 0.0028 | 0.0022 | 0.0092 | 0.0058 | 0.0039 | 0.0047 | 0.0044 | |
| Vlio | 0.002 | 0.0016 | 0.0079 | 0.0043 | 0.0031 | 0.0046 | 0.0036 | |
| Ptam | 0.0018 | 0.0014 | 0.0058 | 0.003 | 0.0027 | 0.0042 | 0.0032 | |
| Pniti | 0.0013 | 0.0011 | 0.0022 | 0.0019 | 0.0006 | 0.0015 | 0.0027 |
Disclaimer/Publisher’s Note: The statements, opinions and data contained in all publications are solely those of the individual author(s) and contributor(s) and not of MDPI and/or the editor(s). MDPI and/or the editor(s) disclaim responsibility for any injury to people or property resulting from any ideas, methods, instructions or products referred to in the content. |
© 2025 by the authors. Licensee MDPI, Basel, Switzerland. This article is an open access article distributed under the terms and conditions of the Creative Commons Attribution (CC BY) license (http://creativecommons.org/licenses/by/4.0/).
Copyright: This open access article is published under a Creative Commons CC BY 4.0 license, which permit the free download, distribution, and reuse, provided that the author and preprint are cited in any reuse.


