
Submitted:
27 March 2025
Posted:
27 March 2025
You are already at the latest version
Abstract
YouTube has emerged as a powerful platform for digital content distribution, particularly in niche sectors such as fisheries and environmental sustainability. This study examines the impact of specific keywords on video visibility and engagement, focusing on fisheries-related YouTube channels within the broader supply chain context. Using a statistical analysis with R software, the study isolates the influence of keywords while controlling for macro-characteristics such as video duration, title length, and description length. The findings reveal that while most structural video attributes do not significantly impact views, keyword optimization in video titles plays a crucial role in improving discoverability. Additionally, a positive correlation between views and user engagement (likes) is confirmed, highlighting the role of interaction in content promotion. These insights provide actionable recommendations for content creators seeking to enhance their digital outreach while offering theoretical contributions to search engine optimization (SEO) and social media marketing strategies.
Keywords:
supply chain
; fisheries
; digital marketing
; SEO
; YouTube marketing
; keyword analysis
; applied statistics
; R
1. Introduction
1.1. Information of Search Engine Optimization (SEO)
Search engine optimization (SEO) is the art and science of improving pages in search engines such as Google. Since search engines are the primary way in which internet users discover content that interests them, a higher ranking in the resulting index pages is very likely to lead to an increase in traffic to a particular website and, consequently, to more sales that translate into profits and revenue [1].
Site traffic derived through SEO is often referred to as organic search traffic, distinguishing it from traffic based on paid searches. Paid search is also often referred to as search engine marketing (SEM) or pay-per-click (PPC). The ability to optimize search engine performance represents perhaps the most fundamental area of online marketing, as search, as mentioned above, is the main way in which internet users navigate the web [2].
To understand this, it is worth mentioning that for a simple search query that a user may enter, the website or file with the number one ranking result receives about 40-60% of the total user traffic for that query. As a result, sites ranked second and third receive significantly less traffic. Of all users who conduct searches, only 2-3% click beyond the first page of search results [3]. Links from other websites play a dominant role in determining a website's ranking on Google and other search engines. In simple terms, a link can be seen as a vote of quality from one website to another, as website owners are unlikely to associate with low-quality sites [1].
Furthermore, search engines can evolve on their own by collecting and learning from users' search behaviors, allowing them to display search results even before keyword typing is completed [2]. Essentially, the importance of a website increases as it receives more links from other websites [1].
It is reasonable to conclude that even the slightest improvement in search engine ranking will potentially lead a website, such as that of a company, to receive more user traffic and, consequently, more business and profits. Because of this, many companies and website owners actively manage their search result listings to ensure their website appears higher on the search engine results page (SERP) than their competitors [4]. By definition, the search engine optimization process involves optimizing each of the three key features of search engine algorithms to improve a website’s ranking in search results [2].
The growing reliance on YouTube as a digital marketing and content distribution platform necessitates a deeper understanding of the factors that drive video engagement and visibility. While previous research has examined aspects such as video duration, keyword relevance, and audience interaction, most studies have analyzed these factors in isolation rather than as an interconnected framework [5,6]. Furthermore, YouTube’s evolving algorithmic recommendations require continuous adaptation from content creators and marketers, making it imperative to identify the most statistically significant factors influencing video rankings and user engagement [7].
Despite increasing research in SEO-driven video optimization, there remains a lack of empirical evidence on how video-specific attributes—such as metadata, keyword density, and audience engagement—work together to influence content visibility [8]. Current literature has yet to comprehensively model the simultaneous effects of these factors, particularly in the context of machine-learning-driven content curation [9].
RQ:
How do video attributes—including duration, keyword optimization, metadata length, and engagement metrics—interact to shape video viewership and algorithmic ranking on fishing companies’ YouTube channels?
This research question aims to bridge the gap between content optimization strategies and algorithm-driven audience engagement, offering a holistic approach to understanding YouTube's recommendation system [10]. By addressing this gap, the study will provide practical insights for digital marketers, content creators, and platform strategists seeking to maximize visibility and audience engagement in a competitive video-sharing ecosystem [11].
The structure of this paper follows a systematic approach to analyzing the impact of YouTube marketing strategies on fisheries’ product campaigns within the supply chain. The Introduction presents the study’s background, emphasizing the role of influencer engagement, online shopping behavior, and keyword optimization in video marketing. The Materials and Methods section details the questionnaire design, including the development of targeted survey questions and the data collection process using stratified random sampling and YouTube analytics tools. The Results and Discussion section focuses on statistical analysis, where regression models and correlation tests evaluate the relationships between video attributes and audience engagement. Finally, the Conclusions section sums up the main practical and theoretical findings of the paper.
1.2. Importance of YouTube Platforms’ Marketing
YouTube has evolved into one of the most influential digital platforms, significantly shaping online marketing and consumer engagement. Initially founded in 2005, YouTube was acquired by Google in 2006, enabling rapid expansion and integration into the digital advertising ecosystem. As a globally accessible platform, YouTube allows users to upload, watch, comment on, and share video content for free, distinguishing it from other video-hosting services due to its user-friendly accessibility and extensive reach [12]. The democratization of content creation has led to the rise of professional bloggers and YouTubers who have transformed video sharing into a lucrative career. Many YouTubers have amassed millions of subscribers, leveraging their influence for brand collaborations and monetization [13,14].
In recent years, YouTube has become a central component of digital marketing, especially with the increased adoption of influencer-based advertising. The platform’s diverse advertising formats include bumper ads, TrueView discovery ads, and TrueView in-stream ads, each tailored to different consumer engagement strategies [15]. Bumper ads are short, non-skippable advertisements appearing before a video, maximizing brand exposure in a concise format. TrueView discovery ads appear in search results when users look for videos, aligning ad content with user intent. Meanwhile, TrueView in-stream ads are longer advertisements played before, during, or after videos, allowing users the option to skip after a few seconds [16].
Beyond these conventional advertising methods, YouTube's role in influencer marketing has grown significantly. Many companies now prefer to market their brands and products through collaborations with YouTube content creators, leveraging their established audience trust and engagement [17]. Influencer partnerships have been particularly effective in reaching younger demographics, as Gen Z and Millennials tend to perceive influencer recommendations as more credible compared to traditional advertising [18]. Furthermore, AI-driven algorithms now optimize ad placements, ensuring brands reach the most relevant audiences based on user behavior and preferences [19].
Given these developments, YouTube marketing continues to evolve, integrating data analytics, AI-powered recommendations, and influencer-driven branding strategies to enhance consumer engagement and conversion rates. Future research should explore how emerging trends such as short-form content (e.g., YouTube Shorts), AI-enhanced video personalization, and live-stream commerce will shape the next phase of YouTube’s marketing landscape [20].
1.3. Fisheries’ Product Campaigns in the Supply Chain Context
Equally consumable and industrialized fishery products are exchanged, although in slightly distinct manners. For instance, the United States brings in more consumable goods than it exports (i.e., a negative commerce equilibrium), whereas the reverse is true for manufacturing products—the United States exports three times the amount of manufacturing products than it purchases, emphasizing the significance of fisheries operations in the supply chain sector [21]. If ships in the industrial group might utilize their gather for humans to consume, the resulting quantity may be large enough to make consumption by human manufacturing profitable. To draw in additional customers besides those who now purchase preserved, fresh, and refrigerated product types, as well as novel more practical packaging methods (i.e., dried, chopped), are required. Such concerns could involve social, ecological, and economic compromises [22] and necessitate unwinding and substituting present fisheries regulations that support the current system [23].
According to Love et al. [21], executing food production improvements necessitates alterations not solely in strategy, but additionally across the supply chain alongside customers. So, more information should be shed on efficient campaigns for fisheries’ products, through the supply chain, based on sustainable features. Sustainable seafood intake could be increased provided the authorities supported the sustainable fisheries industry and supply chain partners effectively educated themselves, chose sustainable goods from fishers, and passed on sustainability information to customers [24]. When participants recognize that encouraging sustainability preserves their revenue and the long run, they may expand their information in the fisheries supply chain product promotions. Obtaining original information on customer understanding and conduct is also critical [25].
The basis of the sustainable source of fishery goods might be monitored and identified more readily throughout the supply chain, providing an extra financial benefit owing to marketing opportunities normally unavailable to demanding clientele [26]. Organizations at various stages of the seafood supply chain see benefits unevenly. Market expansion, recall decrease, accountability complaint and litigation decrease, personnel reductions, and procedure enhancement are all projected to provide advantages [27]. Fish supply chains should seek to classify their customer base, based on various factors, to ensure their profitability and sustainability [28]. Promoting their products through their YouTube channels could aid in this target set by fisheries, while also expand their information over the efficiency of their campaigns.
Information about global market-oriented attempts to promote sustainable fishing via ecolabel initiatives is limited to fisheries officials and seafood suppliers, and few fisheries are currently verified under the Marine Stewardship Council (MSC) criteria. Because of the absence of centralized oversight in the small-scale fishery industry, in addition to a shortage of information and uncertainty about shares standing, accessibility to these strategies - as well as possibly markets for exported goods that promote sustainable fishing procedures - stays out of accomplish for this industry [29]. Digitalization is being identified as a primary source of adaptability, resulting from developments in domains like communication technology, enterprise analytics, and advanced manufacturing technologies [30]. As a result, IoT is likely to have a significant influence in facilitating supply chain digitization [31]. This means that, fisheries in the supply chain context should capitalize on digitalized means for promoting their products in a sustainable and profitable manner.
1.4. Research Hypotheses Development
With the increasing influence of digital platforms, understanding the factors that drive video engagement and visibility on YouTube is crucial for content creators, marketers, and businesses. Video performance is determined by several attributes, including video age, duration, title and description structure, keyword relevance, and audience interaction metrics [14,32]. The hypotheses formulated in this study aim to examine these relationships, identifying the key quantitative factors that contribute to the success of YouTube videos. By analyzing the statistical significance of these attributes, this research provides valuable insights into content optimization strategies and algorithm-driven user engagement. The findings will contribute to a better understanding of how YouTube’s algorithm prioritizes content, how viewers interact with different video elements, and how creators can optimize their videos to increase reach and engagement [6,32].
The formulated hypotheses explore the interplay between video characteristics, keyword relevance, and user engagement metrics in driving viewership.
H1:
The length of time a video remains active (AGE) has a statistically significant, linear, and positive effect on the number of views (VIEWS).
This hypothesis aligns with studies highlighting that older videos tend to accumulate higher views over time due to sustained audience discovery, recommendations, and search engine indexing [8,32]. YouTube’s algorithm often promotes evergreen content, making video longevity an important determinant of visibility
H2:
The duration of a video (DURATION_SEC) has a statistically significant, linear, and negative effect on the number of views (VIEWS).
Prior research indicates that longer videos may experience higher dropout rates, reducing total watch time and audience retention [14]. Viewers tend to engage more with shorter, concise videos, particularly in competitive digital environments where attention spans are limited [12].
H3:
The number of words in the title (TITLE_COUNT) has a statistically significant, linear, and negative effect on the number of views (VIEWS).
H4:
The number of words in the description (DESC_COUNT) has a statistically significant, linear, and negative effect on the number of views (VIEWS).
Overly long titles and descriptions can reduce click-through rates (CTR), as viewers are less likely to engage with cluttered or overly detailed content [9]. Studies indicate that succinct, keyword-optimized titles and descriptions improve discoverability and enhance viewer engagement [10].
H5:
There is (overall) a statistically significant relationship between keywords and video views.
H6:
There are specific keywords that statistically determine video views.
Keywords play a vital role in YouTube’s search engine optimization (SEO) by affecting content discoverability, categorization, and ranking in search results [11]. Research highlights that videos optimized with trending and high-search-volume keywords tend to attract higher engagement and visibility [33].
H7:
There is a statistically significant positive linear relationship between video views and the interaction they receive from users (“likes”).
2. Materials and Methods
This study employs a structured methodology to assess the impact of keyword usage on the efficiency of fisheries product campaigns through YouTube, emphasizing supply chain marketing strategies [35]. The research follows a three-stage process: sample selection, data gathering, and statistical analysis, incorporating both descriptive statistics and linear regression modeling using the R software. This approach ensures a comprehensive understanding of the relationship between YouTube video characteristics and audience engagement.
- Sample Selection
The sample selection focuses on identifying YouTube channels that provide reliable fisheries-related content, ensuring that the data accurately represents the seafood supply chain marketing landscape. The selection process involved targeting channels associated with sustainable fisheries, particularly those endorsed by recognized non-profit organizations such as FoodTank [36], which highlights organizations contributing to sustainable fisheries and responsible seafood marketing. To achieve a representative dataset, sixteen fisheries-related organizations with an active YouTube presence and significant engagement in seafood supply chain awareness campaigns were selected [37]. These organizations have Marine Stewardship Council (MSC) certifications or actively promote sustainable fishing practices, aligning with global seafood sustainability efforts.
- Data Gathering
Data collection was conducted using VIDIQ [38] software, a widely used YouTube analytics tool that evaluates content performance by extracting video metadata, audience interaction metrics, and keyword effectiveness. The dataset included all videos published by the selected YouTube channels, ensuring that the analysis captures longitudinal trends in seafood marketing [6]. The primary dependent variable in this study is total video views (VIEWS), serving as a key performance indicator (KPI) of audience engagement. Additional independent variables include video duration, title word count, description word count, and interaction metrics (e.g., likes and shares). These metrics allow for an in-depth assessment of YouTube marketing strategies and their effectiveness in promoting sustainable fisheries.
- Statistical Analysis
The final stage of the methodology involves statistical analysis using R software, focusing on descriptive statistics and linear regression models. Descriptive statistics summarize the dataset's characteristics, such as the distribution of video attributes, engagement metrics, and keyword frequency. Linear regression models examine the relationship between independent variables (e.g., keyword usage, video duration, engagement metrics) and dependent variables (e.g., video views, likes). This approach identifies the statistical significance of specific video characteristics in influencing audience engagement, providing insights into how keyword optimization affects YouTube’s algorithmic ranking and content visibility. The analysis also accounts for multicollinearity and model validation, ensuring the robustness of the results.
By integrating sample selection, data gathering, and statistical modeling, this study contributes to the broader discussion on digital marketing in the seafood supply chain, offering empirical insights for content creators, marketers, and policymakers in sustainable fisheries and responsible seafood consumption campaigns.
2.1. Sample Selection
The aim of selecting the sample is to use YouTube channels that are considered equally reliable in providing fisheries-related content. For this purpose, primary data were obtained from the globally recognized, non-profit food sustainability organization FoodTank [39], specifically focusing on sixteen (16) groups and organizations that have been highlighted for their notable contributions to sustainable fisheries and their active involvement across the entire fisheries value chain [36]. It is important to note that all sixteen (16) groups maintain an active presence on YouTube.
2.2. Data Collection
Given the above context, the data collection was carried out using specific software of VIDIQ [38], which is specifically designed to provide metrics for the evaluation and exploitation of the videos by the producers of each channel, or - in general- by the platform.
- Video selection:
No restrictions were used for the selection of videos; all videos published by each channel up to the reporting date were included in the sample.
- Dependent variables:
Dependent variables are those variables for which the hypothesis of their change is made by changing the independent variables. In other words, these are the variables that describe the phenomenon the researcher is interested in studying.
In this paper, the focus of interest is on understanding the pattern of total views of a YouTube video; therefore, the primary dependent variable of the research is the views of each of the specific videos in the population as it (the population) was summarized in the previous Section. For easy reference and also for inclusion in the relevant algebraic relationships below, we call this dependent variable VIEWS. We note that this variable is not accompanied by a unit of measurement, it is a pure number. In parallel with the dependent variable VIEWS, we create for the survey the variable LOG(VIEWS), which is obtained as the natural logarithm of the VIEWS variable for each particular video in the population. That is:
The transformation of the specific dependent variable is necessary as it allows - as will be shown below; the transformation of the quantitative regression model from a multiplicative to an additive one, which not only facilitates the analysis but also the reading/explanation of the resulting conclusions.
In addition to the views of each video in the population, this paper also considers the prediction of potential user interaction with these videos. To this end, the number of users who have expressed a positive attitude towards each video ("Likes") is included in the survey as a second primary independent variable. Accordingly, for easy reference and inclusion in the relevant algebraic relationships below, we call this dependent variable YTLIKES. Like the VIEWS variable, the YTLIKES variable is not accompanied by a unit of measurement, being a pure number.
It should be noted that the definition of the above variables as independent variables relates to the specific context of the present study and describes their use in the context of the relevant models. Within a different methodological/research framework, these variables could be independent, potentially facilitating the investigation of 'downstream' phenomena, such as the wider acceptance/interaction of these channels in social media, a question that is outside the current research framework.
However, remaining within the present research framework, it is easy to see that the number of users expressing a positive attitude towards each video (YTLIKES) presupposes the existence of users to whom each specific video has been shown (VIEWS). Consequently, and within the present research framework, the variable VIEWS will also be used as an independent variable, in terms of the approach to the variable YTLIKES.
In conclusion, in the context of the present study two primary independent variables, VIEWS and YTLIKES, are used, and the (independent) transformation variable of VIEWS via the natural logarithm (LOG(VIEWS)) is additionally created.
- Independent variables
In contrast to dependent variables, independent variables are used as (potential) determinants of the phenomenon under study or, more practically, of the dependent variables. In other words, the concept of research is to examine whether changes in the independent variables (including the presence or absence of an item) lead to or explain (or at least correlate with) changes in the dependent variables.
Given the information that can be efficiently collected from YouTube, the independent variables in this survey are as follows:
(a) DATE_PUBLISHED: refers to the date of publication of each video. In practice, this variable will be used to calculate the time interval during which each video remains active (next meta-variable)
(b) AGE: refers to the time interval during which each video remains active and is calculated as the difference (in days) between the value of DATE_PUBLISHED and the reference date (3 May 2021).
(c) TITLE: refers to the title of each video (in characters/words) as given by the producer. This variable will be used to identify the language of the title, but also through the isolation of individual (and non-trivial/non-trivial) words, as will be described in Section 0 below.
d) TITLE_WORD_COUNT: refers to the number of words (including non-trivial words) in the title of each video. This variable counter-counts the "length" of the title in words.
e) DESCRIPTION: refers to the description of the video (as characters/words), as given by the producer. This variable is used to identify the language of the video.
(f) DESC_WORD_COUNT: refers to the number of words in the description of each video. This variable reflects the "length" of the description in words.
g) DURATION: refers to the duration of the video in hours, minutes, and seconds. In practice, its conversion to seconds will be used, as below.
(h) DURATION_SEC: refers to the duration of the video in seconds, and is derived from the DURATION variable as:
In conclusion, eight (8) primary independent variables are created in the context of this research, as outlined above.
- Other (auxiliary) variables
In addition to the above variables, the variable VIDEO_ID, which includes the unique identity (identifier) of the video for YouTube, is used as an auxiliary variable in this research. The use of this variable relates to the correctness of the data extracted since, as will be described below, cases of videos that did not include a unique identifier have been excluded from the analysis.
2.3. Methodological Analysis
Having described the independent, dependent, and auxiliary variables used in the analysis, this section outlines the steps involved in conducting the survey. The survey process can be categorized into two distinct stages. In Stage A, the effects of macro-characteristics, such as the age of each video or the number of words in the title or description, are evaluated. In Stage B, if statistically and managerially significant effects are identified, the analysis then focuses on evaluating the impact of specific keywords.
2.3.1. Macro-Factors’ Impact
As described in the relevant literature, the existence (or individual parameters/values) of brand attributes may be related to (or even determine) dependent variables such as the number of views of a YouTube video. For example, the length of time a particular video has been active can be seen as a potential determinant of its views: a video that (ceteris paribus) was activated very recently may not have had the opportunity to be "shown" via the YouTube search engine to a sufficient audience to record corresponding views.
The examination of the research hypotheses around the relationship between macro-characteristics and projections requires in parallel the definition of the (sub-positive) function which is likely to link the independent and dependent variables. Since these are continuous variables, this research initially used a linear function through the simple linear regression (SLR) methodology using the ordinary least squares (OLS) method:
The use of an SLR model is considered a satisfactory approach, but it is not the only (hypothetical) function that is likely to link the independent variables to the dependent variables. With this in mind, it was considered appropriate, using a review of the relevant scatterplots of the independent/dependent variable, to consider alternative functions, where appropriate (e.g., 2nd or 3rd-degree polynomials) or alternative forms of transformation of the variables to maintain the criterion of linearity and - consequently - to facilitate understanding of the potential relationship.
2.3.2. Keywords’ Impact
Having examined the relationship between macro-features and projections, in Stage B we move on to examine the relationship between the existence (or not) of specific keywords and projections. Specifically, the inclusion of keywords in the model is done as follows:
Isolation of the words included in the titles (tokenization) - for example, the (hypothetical) titles "Great fishing today!" and "What a great day for fishing on the lake" are decomposed into their constituent words and recombined into unique word vector as follows:
"Great, fishing, today, what, a day, for, on, the, lake".
At the same time, the frequencies of occurrence of each word are recorded, forming the above vector as follows:
"Great (2), fishing (2), today (1), what (1), a (1), day (1), for (1), on (1), the (1), lake (1)".
The resulting vector is filtered for (a) unimportant words and (b) words that appear only a few times. Trivial words are those words that do not add 'meaning' to the sentence but are used as conjunctions, articles, etc. For example, in the vector above, the words 'a, 'on', and 'the' clearly do not add meaning to the reader, although they occur very frequently in speech. The full list of meaningless words used [33] is provided in Table A1. Similarly, words that appear less than ten (10) times in the entire population of videos examined were excluded - although these words may describe a very specific video that enjoys particularly high (or low) levels of views, the use of a word that appears very infrequently creates theoretical and practical problems in creating a reliable (robust) and - most importantly - useful business model. Continuing the example of the vector above, this would be formulated as follows:
"Great (2), fishing (2), today (1), day (1), lake (1)".
It now becomes obvious that the above words can now be used as categorical variables in a multiple linear regression model.
In this particular case, the model used has the form:
- VIEWS is the number of views of a video,
- a is the constant term of the model for the case where all xi equal zero (0),
- bi is the marginal effect coefficient from the existence of the keyword xi, and,
- xi is the auxiliary variable (dummy variable) that takes the value one (1) when the specific keyword is present in the video title and zero (0) when it is not present (boolean).
- e the statistical error.
Some observations are important for the completeness of the analysis at this point. Although technically the analysis is not limited by the language of the text/title, in this research only videos whose title is in English are investigated. This happens on the one hand so that there is a better understanding of the trivial words, on the other hand, so that the conclusions can be processed. Since there are many English titles in the videos included on YouTube, we consider that this does not limit the analysis and – above all – the applicability of any conclusions in different contexts.
The model proposed above uses residual views as the dependent variable, but the logarithm of views (LOG(VIEWS)) could also be used. In this case, the model is not differentiated (the general assumptions of multiple linear regression apply), but the numerical value of the coefficients (a and β) is differentiated, as well as the way they are explained. Specifically, the modification of the terms for explanatory purposes is as follows:
For the case where all xi is equal to zero (0), the remaining views will be described by the relationship ea, while:
The effect of each keyword on the remaining views will be determined by the marginal coefficient of the model as eβ.
The standard significance tests of a multiple linear regression model (F-test) as well as the adjusted coefficient of determination (adjusted R2) are valid and can be tested normally.
Additional analysis: The relationship between views and interaction
As mentioned above, this paper also examines the relationship between views and interaction with users – specifically, the relationship between views and expressed positive mood (“likes”) towards each video. This relationship is first examined through a simple linear regression (SLR) model of the form
It is noted that the above analysis treats the relationship between views and interaction ("likes") uniformly throughout the range of data. However, there may be different "groups" within this data where the relationship between views and interaction differs (for example, in Group A an increase in views is related to a given increase in "likes", while in Group B the same increase in views is associated with twice the above increase).
To investigate this possibility, two additional linear regression (SLR) models are constructed, one on items that have a positive residual (thus above the line of best fit) and one on items that have a negative residual (thus below the line of best fit), setting the constant parameter (a) equal to zero in both models. By then comparing the linear projection coefficients (ba - bb) it can be safely investigated whether these are statistically different samples.
3. Results
Building on the methodology described in the previous chapter, this chapter presents the results obtained during the implementation process. The next section outlines the basic characteristics of the sample, using key descriptive statistical indicators to provide an overview. Subsequent sections present the findings derived from the application of inferential statistical methods. While the research results are discussed in detail in the following chapter, an effort is made in the subsequent sections to interpret and connect numerical and statistical indicators with the studied phenomena. This approach ensures a coherent integration of analysis and explanation, aligning with the objectives of this research.
3.1. Descriptive Statistics
Starting from the total activity within the sample, it is observed that this consists of a total of 2,882 videos which have been published through nine (9) channels. Table 1 shows the distribution of videos by channel.
From the table above, it becomes immediately apparent that the various channels do not participate equally in the totality of the sample videos. The chart below (Figure 1) highlights exactly this disparity, comparing each channel's video "production" to the average of all channels (~320 videos).
Accordingly, the number of subscribers varies significantly between the channels, with two channels exceeding one hundred thousand subscribers, three channels moving into the thousands, and four channels not managing to exceed one thousand subscribers (Table 2).
Although the above unequal distribution is likely to lead to different views per video for each channel, it is noted that the direction of this relationship cannot be established a priori, nor the reverse (i.e., the different views of each channel's videos may lead to a different number of subscribers for each channel) could equally apply. Documenting the direction of the above relationship requires data from different moments in time (longitudinal data) for both variables (views, subscribers) and, consequently, is not included in the research hypotheses of the present research. In any case, this fact is recognized as one of the limitations of the present research and cited as an opportunity for additional future actions.
Then, the following table (Table 3) lists for consideration the time intervals during which the videos are produced (by channel).
It becomes clear that while most channels are active until 2021, the “Oceana” channel is practically inactive after the 3rd quarter of 2012, while the “Monterey Bay Aquarium”, “NOAA (National Oceanic and Atmospheric Administration)” and “NRDC (Natural Resources Defense Council)” have not become active in 2021. In addition, it is observed that all channels have a relatively long history (and thus experience) of publishing on YouTube since the start of their activity is from 2010 and earlier (except the channel "N.A.M.A.", which started its activity in 2013, but we do not consider this fact to limit it about the experience gained against the other channels).
The above characteristics refer to the analyzed channels, as the primary mechanisms of video production. The main conclusions drawn are that the channels included in this research have (almost) the same "live" time (video production experience), although they differ significantly - within this period - in terms of their activity. Accordingly, we observe a significant variation in the number of subscribers per channel, but unfortunately, we cannot document the direction of influence of this variable from/toward individual video views. Next, we focus on features that pertain to the videos themselves, starting with views.
The following figure (Figure 2) shows the views of the videos, from the least (= 1) to the most (= 36,209,288).
From Graph 2 it becomes clear that the distribution of videos about their a-number of views includes a particularly large number of those with (relatively) limited views (of the order of a few thousand) and a relatively limited number of videos with particularly high views (of the order of hundreds of thousands of views). As can be seen in the summary table below (Table 4), 75% of videos (~2,150) have been viewed less than 6,500 times, while 1 in 4 videos have been viewed less than 460 times.
Given the above observations and focusing on the highly asymmetric distribution of the data (asymmetry index = 44.1), the use of a logarithmic transformation on the views of each video becomes imperative [38]. The following diagram (Figure 3) shows the histogram of the distribution of the (natural) logarithm of the views, where the more "normalized" behavior of the new variable can be seen - characteristically, the skewness index of the new variable amounts to 0.17.
As a second dependent variable, user interaction with the videos is examined, specifically, the YTLIKES variable. The table below (Table 5) lists its distribution, where it becomes apparent that one in four videos has less than three interactions, while three in four videos have less than 82 interactions.
It is also important to note that the asymmetry coefficient is very high (= 42) while the average is above the 3rd quantile (= 236.4).
Since the present research examines the correlation between projections and interactions (as defined) the transformation of this variable through a natural logarithm is not deemed necessary. Focusing then on the independent variables, the first of these is the duration of the videos, in seconds. The figure below (Figure 4) lists the distribution of videos by duration (videos > 300 seconds are not shown), and by channel.
It becomes apparent that the median for most channels lies between 100 and 200 seconds (2-3 minutes), while there is generally a high concentration of up to 300 seconds (5 minutes). Table 6 lists the most important descriptive statistics metrics by channel.
As a next feature, the distribution of the amount of time a video remains active (AGE) is shown in Figure 5 below.
Figure 5 shows the generally increasing trend of video production mainly from the International Seafood Sustainability Foundation, Marine Conservation Alliance, and Marine Stewardship Council channels, while the Aquaculture Stewardship Council, Natural Resources Defense Council, and National Oceanic and Atmospheric Administration channels are gradually decreasing the production of new videos. This fact may affect the analysis results of the variable in question (AGE) as there seems to be a relationship between the variables AGE and CHANNEL (in essence, while the a-analysis targets the relationship AGE and VIEWS, it is redirected to the relationship CHANNEL and VIEWS (multicollinearity [37]. Regarding the number of words in the title (TITLE_COUNT), the following Figure 6 shows the relative distributions per channel and overall.
It becomes clear that most titles range between three (3) and thirteen (13) words, with an average of around eight (8) words. Even more important is that, unlike the previous variable for this variable, the distribution of the number of title words per channel does not seem to vary significantly. Finally, the following Figure 7 shows the distribution of the number of words in the description (DESC_COUNT) of each video.
The median number of words in the description of the videos is fifty (50) (about 3-4 lines), but there is also a significant number of videos with more than one hundred (100) words in their description, mainly from the channels that operate more recently (International Seafood Sustainability Foundation, Marine Conservation Alliance and Marine Stewardship Council).
3.2. Inductive Statistics
Having described the characteristics of the variables in the previous section, in the present section, we proceed to investigate the relative effects. As mentioned above, the analysis focuses first on the impact of macro-factors and then on the impact of keywords. Finally, the relationship between projections and interaction is examined.
3.2.1. Macro-Factors’ Impact
For the research hypothesis (H1) the length of time a video remains active (AGE) has a statistically significant, linear, and positive effect on the number of views (VIEWS). To examine the above relationship under the H1 research hypothesis, we configure the simple linear model as before, even setting the constant term equal to zero (0) as for zero active days it is obvious that the number of views will be exactly equal with zero (0).
From the above results of the Table 7, it is clear that the estimated average value of the coefficient of the time interval during which a video remains active (AGE) is positive, demonstrating that for each active day, the views are expected to increase (positive effect) by fifteen (15). The overall pattern can be considered statistically significant (Significance F = 0.006 < 0.05). The value that this coefficient can take varies (within a 95% confidence interval) from 4.2 to 25.7, which means that on 95% of the days when a video is active, an increase in views is expected within the - space bar. Hence, H1 is confirmed.
According to the previous analysis, we construct the simple linear model between views and duration of the videos, the results of which are shown in the table below. It is noted that in this case, it makes no sense to impose a constant term equal to zero (0), as such a thing is not logically supported (even a "video" with a duration of less than one second could have views).
Contrary to the previous model, this one does (Table 8) not document a (linear) relationship between the duration of the videos and their views (Significance F = 0.66 > 0.05). More specifically, the independent variable of the model appears with a slight negative trend (coefficient = -1) as was initially assumed, but since it varies between -6.5 and 4.1, we cannot safely conclude that its real value is not zero (0). Consequently, H2 is not confirmed.
The following table (Table 9) presents the results of the relevant simple linear regression model, as in the previous research hypotheses.
Here it seems that it cannot be established that the number of words in the title of each video affects the views of these, although the coefficient of the variable is indeed negative (-472). More specifically, the p-value (Significance F) of the model is 0.90 > 0.05, while as we can see from the 95% confidence interval of the coefficient, the effect can range from -7.849 (that is, each additional one word reduces views by -7,849) to 6,904 (i.e., each additional word in the title increases views accordingly). Therefore, H3 cannot be confirmed.
At this point, a review of the structure of the model is appropriate. In particular, the construction of the model in question can lead (under certain conditions) to a "paradoxical" interpretation: either the constant term will be "low" and there will be a positive slope of the line (case 1), or the constant term will be "high" and a negative slope of the line will appear (case 2). In case 1, the interpretation of the example would be that more words in the title increase views, which would be too much to claim to be the case in practice. Accordingly, under case 2, the interpretation of the pattern would be that most views are made with few words in the title (if not "no title"), which would also be too much to support in practice.
For this reason, the method of piece-wise regression was additionally used, where the data are examined for the existence of breakpoints of different models (that is, it is examined whether the data are better adapted to the use of two distinct models, in this case, two different linear models, due to "change of behavior" at given points of the independent variable) [40]. The use of said technique did not reveal any statistically significant pattern or coefficients, but it does show as the most likely (but not statistically significant) "intersection" point of the six (6) words in the title.
Finally (regarding the effects of macro-attributes), the following table (Table 10) summarizes the statistical model of the simple linear regression between the number of words in the video description and its views.
From the above Table, it follows that there is no statistically significant relationship between the number of description words and views of the videos: although each additional word seems to "remove" seventy (70) views, the coefficient can vary between -390 and 250 (with a 95% confidence interval), which does not exclude the existence of a zero (0) coefficient. Accordingly, the p-value of the sample (Significance F) is 0.67 > 0.05. Therefore, H4 cannot be confirmed.
3.2.2. Keywords’ Impact
Having examined the effect of macro-characteristics on views, in this section, we move on to the (independent) examination of the effect of keywords. From the total of 2,882 videos, those whose language in the description (DESCRIPTION) is English (= 2,344) were initially selected. The vector of keywords to be examined is then created: the titles of each video are analyzed into unique words (tokenization) together with their frequency of occurrence and, subsequently, the words considered "unimportant" (stop words – Table A1 in the Appendix section) are excluded, but also those that appear less than ten (10) times. Also, single "numbers" (such as "2010", "14", etc.) are excluded.
Finally, to facilitate the regression analysis, each record is multiplied according to the conserved words that appear in the title: for example, a video that has three conserved words in its title (e.g., "white", "time", "action") will appear three times by adding each of the above words to the corresponding field ("word"). From this process a new dataset is created with 7,066 records (now using video-words as "key"). Two (2) subsamples are created, using (alternatively) the VIEWS variable and its natural logarithm, LOG(VIEWS). The following table (Table 11) presents the results.
As can be seen from the Table above, the use of the natural logarithm forms a very different model, correspondingly with very significant differences in terms of its statistical properties. Specifically, the model that uses simple views (VIEWS) cannot be considered statistically significant (Significance F = 0.96 > 0.05), while, on the contrary, the model that uses the logarithm of views turns out to be statistically significant (Significance F < 0.00 < 0.05). Consequently, in the continuation of the analysis we focus on the model that uses the logarithm of projections as a dependent variable.
In this model, it is important to note the R2 coefficient as well as the Adjusted R2 coefficient: these coefficients refer to the percentage of the variability in the dependent variable that is explained by the independent variables, with the Adjusted R2 coefficient adjusting the result for the number (number) of independent variables. It can therefore be seen that the keyword model explains 30% of the variability in the (log) views, a percentage which can be considered from a practical point of view, significant. Therefore, it is documented that H5 can be confirmed, as there is a statistically significant relationship between keywords and views. Continuing the analysis, we analyze the impact of specific keywords, according to H6.
To carry out the specific analysis, we focus on the coefficients of the logarithmic model, looking for statistically significant ones (p-value < 0.05). Table 12 below lists the statistically significant coefficients based on the kept words for the analysis (Table A2).
Reading the above Table is as follows: for each video, its expected views equation will be:
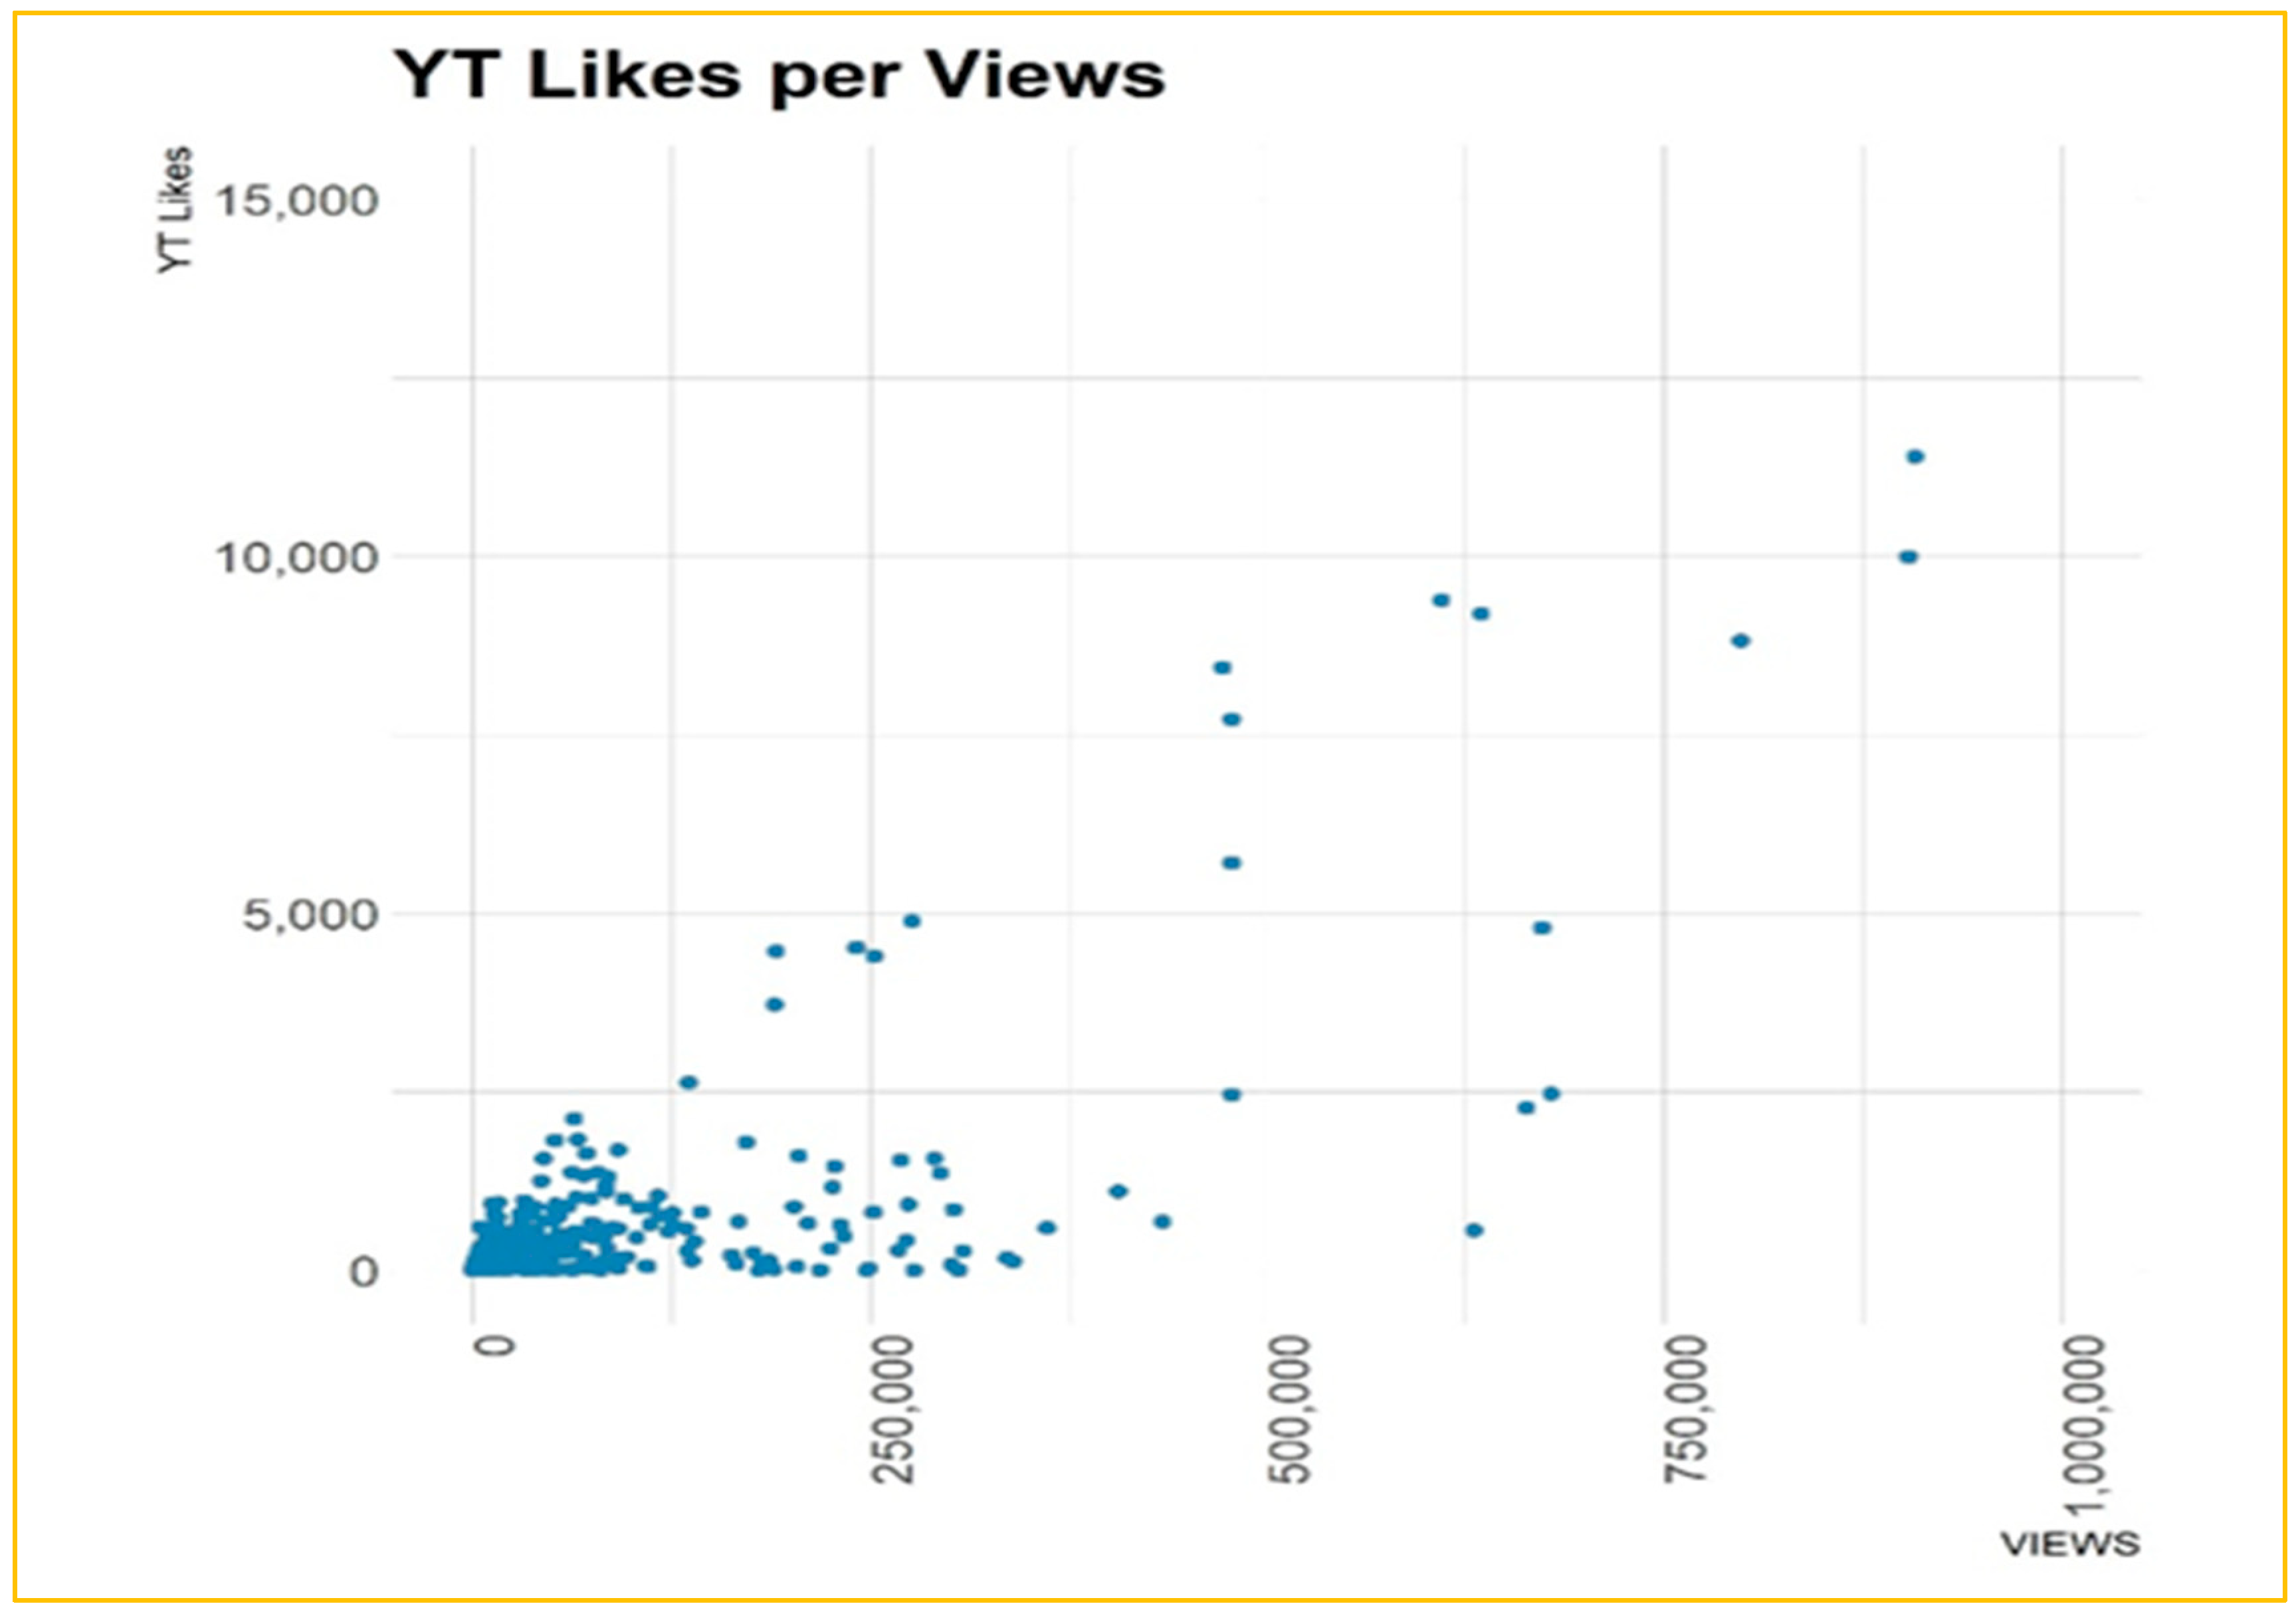
According to the above analysis, H6 is confirmed, while Table 13 lists the relevant keywords. The relationship between views and interaction (YTLIKES) is then examined. In this direction, the following Figure 6 is presented, which shows a proportionally positive relationship between the two variables.
Figure 6.
Relationship between views of the videos and the interaction they receive from users (“likes”).
Figure 6.
Relationship between views of the videos and the interaction they receive from users (“likes”).
Accordingly, by creating the relevant statistical model of simple linear regression, we obtain the following results from Table 13.
From the above results, it follows that the model in question is statistically significant (Significance F < 0.00 < 0.05), while through the analysis of the relative coefficient, it appears that for every approximately 1,000 views approximately 2.3 interactions arise (between 2.1 and 2.4 with a confidence level of 95%). At this point, it is important to note that, although the effect of views on positive interactions is fractional (2.3/1,000), this does not prevent it from being statistically significant. Accordingly, H7 is confirmed.
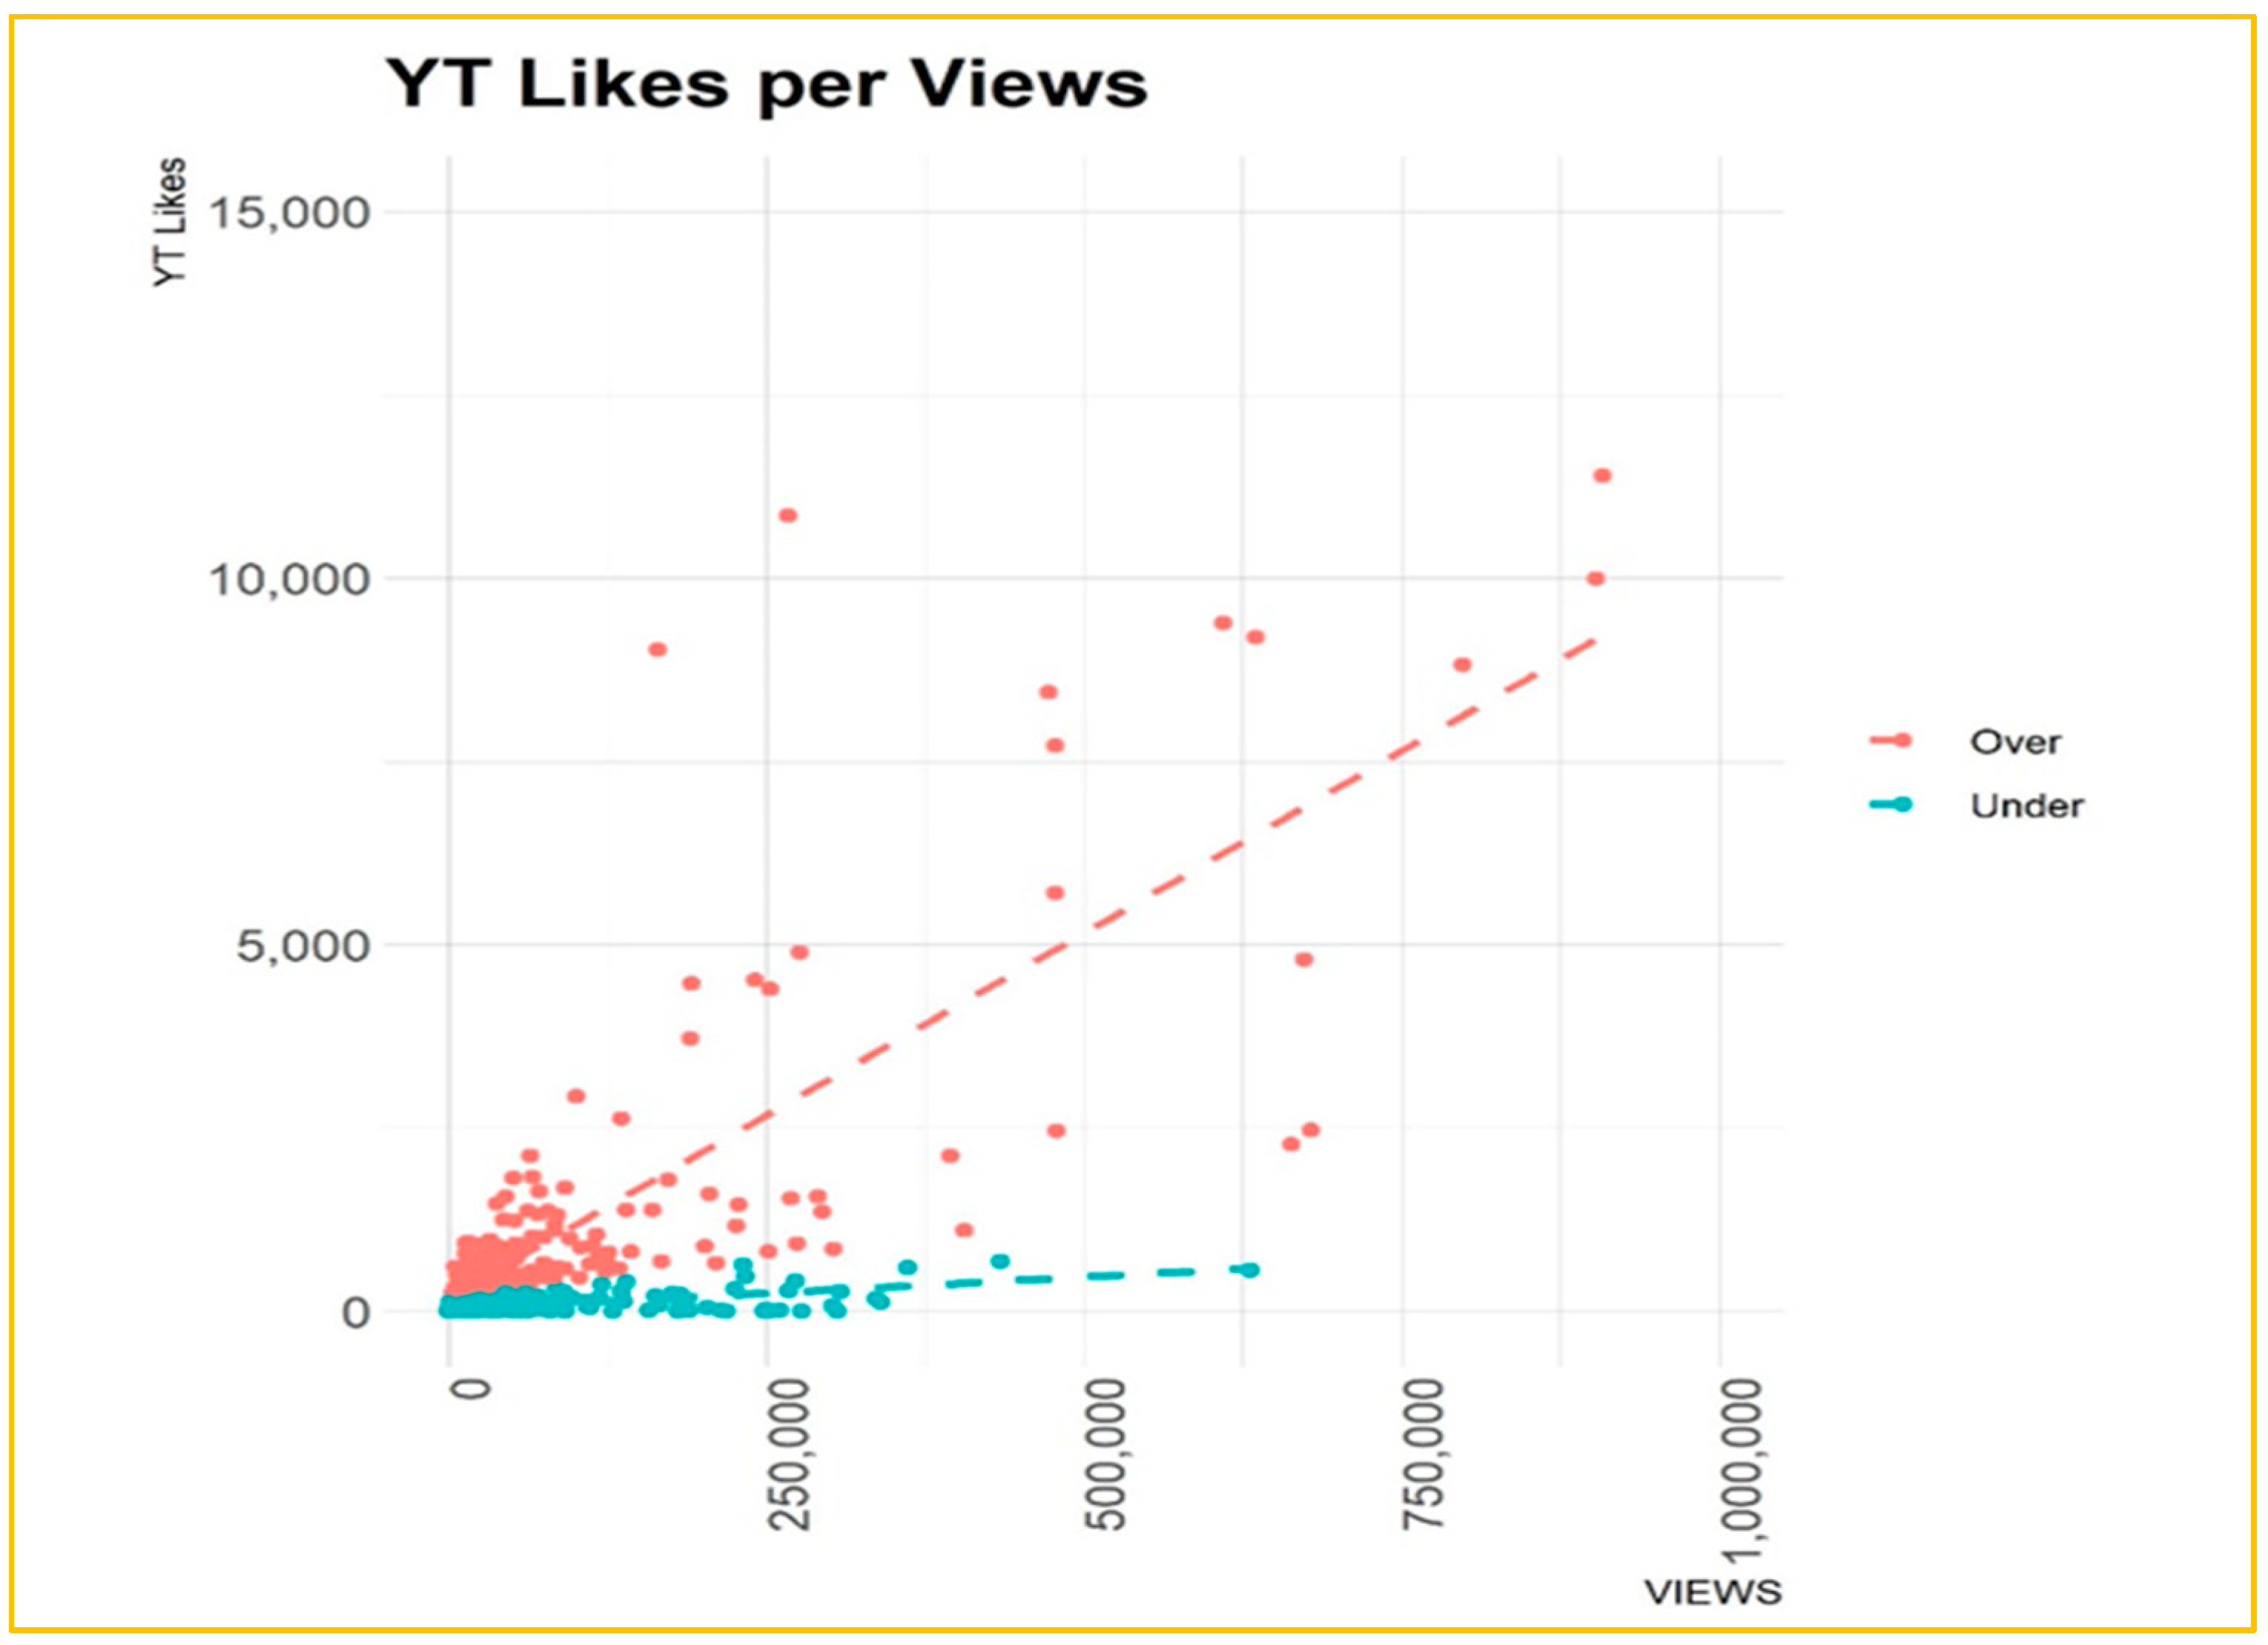
Then, given the above figure (Figure 7), it is examined whether there are two different groups of videos about the rate of interaction/views. For this purpose, the data are divided into two groups, according to whether they are "above" or "below" the line of best fit in the overall model. Figure 8 below, shows the two groups.
Figure 7.
Relationship between views of the videos and the interaction they receive from users (“likes”).
Figure 7.
Relationship between views of the videos and the interaction they receive from users (“likes”).

Figure 8.
Grouping of videos based on their views and the interaction they receive from users (“likes”).
Figure 8.
Grouping of videos based on their views and the interaction they receive from users (“likes”).
Then we compare the models created by the two groups (Table 14).
As can be seen in Table 15, the prospect of two different interaction/projection models seems highly likely – each model increases the explanatory coefficient (R2) to over 90%, while both models are statistically significant. In this direction, we compare the two resulting coefficients (β).
For the comparison between the coefficients, we use the following equation.
This means that the above coefficients are significantly different and the result is much greater than the two-tailed test statistic z = 1.96. Although the above analysis does not solve the problem of a priori ranking a video between the two samples, from a practical point of view it becomes clear that, due to the significant difference between the two coefficients, it becomes very easy for the business user/analyst to rank any videos in the said groups from the very first results (VIEWS): in the first group, videos that generate about 11 Likes / 1,000 Views can be classified, while in the second group, videos that generate about 1 Like / 1,000 Views can be classified.
4. Discussion
The findings of this study provide valuable insights into the factors influencing YouTube video performance, particularly in relation to video characteristics, keyword optimization, and user engagement. By analyzing a dataset of 2,882 videos across multiple channels, the study examined how video age, duration, metadata structure, and keyword selection impact viewership and interaction. The discussion section interprets these results in light of existing literature, assessing their alignment with prior research while highlighting potential implications for content creators and digital marketers. The confirmed hypotheses reinforce established theories on search engine optimization and audience engagement, whereas the rejected hypotheses suggest the need for a more nuanced understanding of video consumption behaviors.
The results confirm H1, demonstrating that video age positively correlates with accumulated views, aligning with prior research emphasizing that older videos benefit from sustained exposure and algorithmic recommendations over time [41,42]. The statistical analysis reveals that for every additional active day, the number of views increases, reinforcing the premise that evergreen content gains traction through continuous engagement and search engine indexing. YouTube’s algorithm prioritizes videos with proven engagement, often resurfacing older, high-performing content in recommendations [43]. However, this effect may be influenced by initial engagement metrics—videos that perform well early tend to continue gaining traction.
Contrary to expectations, H2 was not statistically confirmed, indicating that video duration alone does not significantly impact viewership. While prior studies suggested that shorter videos might yield higher retention rates due to declining attention spans [44], the current findings suggest that factors such as content quality, engagement triggers, and audience intent may moderate this relationship [45]. YouTube’s recommendation algorithm increasingly favors longer videos with high watch time and retention, as they contribute more to overall session duration, a key ranking factor [46]. Therefore, while shorter videos may attract initial clicks, longer content that retains viewers for extended periods can perform equally well or better in terms of engagement.
The statistical results do not confirm H3 or H4, implying that title and description length do not directly influence video viewership in a linear fashion. While prior research suggests that concise and keyword-rich titles improve click-through rates (CTR) [47], the current study finds no strong evidence that longer titles negatively impact views. Similarly, despite the expectation that lengthy descriptions might dilute keyword effectiveness, reducing discoverability [48], the data does not support this hypothesis. These findings suggest that optimizing video metadata requires a balance—titles should be engaging and relevant, but not necessarily short, while descriptions should be informative without overwhelming the viewer.
The study confirms H5 and H6, emphasizing the critical role of keywords in determining video visibility and engagement. The analysis demonstrates that keyword-optimized content significantly affects view counts, corroborating research on YouTube SEO and search behavior [49]. Specific keywords such as “sustainability,” “fisheries,” and “conservation” yielded higher engagement, aligning with previous findings that niche-specific, high-relevance keywords enhance discoverability [50]. Conversely, generic or highly competitive keywords may dilute a video’s ranking potential due to oversaturation. These results underscore the need for content creators to employ targeted keyword strategies, integrating trending terms while maintaining relevance to their audience.
The results confirm H7, highlighting a strong correlation between views and user interactions, particularly likes. This finding aligns with studies emphasizing engagement as a primary driver of YouTube’s recommendation algorithm [51]. The analysis shows that highly viewed videos tend to receive more likes, reinforcing prior research on social proof and engagement metrics [52]. Videos that actively encourage audience interaction—through calls to action, community engagement, and high-quality content—often outperform those that rely solely on organic discovery [53]. These results highlight the necessity of fostering viewer interaction to sustain visibility and maximize reach.
5. Conclusions
The findings of this research offer significant theoretical contributions to digital marketing, search engine optimization (SEO), and consumer engagement on social media platforms. The study confirms that video longevity plays a critical role in increasing views over time, aligning with previous research on algorithmic ranking factors [54]. However, the absence of a statistically significant impact of video duration, title length, and description length on viewership challenges existing literature that emphasizes content length as a determinant of audience retention [55]. This suggests that YouTube’s recommendation system may prioritize other engagement-driven factors, such as keyword relevance and user interaction. The research also highlights the importance of keyword selection in improving video visibility, reinforcing prior studies on SEO optimization and digital content strategies [56]. These insights expand theoretical models on content discoverability, emphasizing that keyword optimization may serve as a stronger predictor of video success than structural video attributes.
From a practical perspective, this study provides actionable insights for content creators, marketers, and organizations using YouTube as a promotional platform. The confirmation of H5 and H6 suggests that strategic keyword use in video titles significantly influences viewership, supporting best practices in digital marketing that advocate for SEO-driven content strategies [57]. Organizations in the fisheries and sustainability sector can leverage this finding to optimize their video campaigns by incorporating high-impact keywords aligned with audience search behaviors. Furthermore, the confirmed relationship between views and user interactions (H7) underscores the need for engagement-driven content strategies. Given that videos with higher likes receive increased visibility and organic reach, marketers should prioritize community engagement through compelling storytelling and interactive features [58]. This aligns with broader digital marketing research emphasizing the role of engagement metrics in social media algorithm rankings [59].
Despite its valuable contributions, this research has several limitations that provide opportunities for future investigation. First, the sample consists of videos from a specific thematic domain—fisheries and environmental sustainability—raising concerns about the generalizability of findings to other industries. The effects of keywords and engagement metrics may vary across different content genres, such as entertainment, education, or product marketing. Future research should extend the analysis to diverse thematic categories to examine whether similar keyword-driven patterns hold across industries [60]. Additionally, the study is based on panel data collected at a single point in time, limiting insights into longitudinal trends. A time-series analysis of video performance over extended periods would offer a deeper understanding of the evolution of keyword effectiveness and engagement patterns [61].
Another key limitation is the exclusion of qualitative video characteristics, such as production quality, storytelling techniques, and audience demographics. While the study confirms the statistical significance of keyword selection and engagement metrics, it does not account for content quality factors that may drive user interest [62]. For instance, videos with compelling narratives and high production value may experience higher engagement regardless of keyword optimization. Future studies should incorporate qualitative content analysis methods to explore the impact of storytelling, visual aesthetics, and brand positioning on video success. Additionally, research could examine the role of psychographic segmentation in understanding how different audience personas interact with various types of video content [63].
Looking ahead, future research should also explore the causal relationship between subscriber count and video views in the context of fisheries. While this study acknowledges that a channel’s subscriber base may influence video reach, the direction of causality remains unclear. A larger-scale, longitudinal dataset would help establish whether an increase in video views leads to higher subscriber growth or vice versa [64]. Moreover, further investigation into the early-life performance of videos is warranted. Since video longevity is a confirmed predictor of views, researchers should examine factors that accelerate early video traction, such as promotional strategies, cross-platform marketing, and influencer collaborations [65]. Understanding how videos gain momentum in their initial stages would be particularly beneficial for marketers seeking to optimize content distribution strategies.
In conclusion, this study provides critical insights into the role of keyword optimization, engagement metrics, and video longevity in determining YouTube video success. While it confirms the importance of strategic keyword selection and user interactions, it also challenges traditional assumptions regarding video duration and metadata structure. These findings offer both theoretical contributions to digital marketing literature and practical implications for content creators aiming to enhance video discoverability of fisheries. However, the study’s limitations highlight the need for broader, cross-industry research incorporating qualitative and demographic factors. Future investigations should explore longitudinal video performance trends, audience segmentation, and the interplay between content quality and algorithmic visibility. By addressing these research gaps, scholars and practitioners can further refine content marketing strategies and improve the effectiveness of digital campaigns across diverse platforms.
Author Contributions
Conceptualization, E.G., N.T.G., and D.P.S.; methodology, E.G., N.T.G., and D.P.S.; software, E.G., N.T.G., and D.P.S.; validation, E.G., N.T.G., and D.P.S.; formal analysis, E.G., N.T.G., and D.P.S.; investigation, E.G., N.T.G., and D.P.S.; resources, E.G., N.T.G., and D.P.S.; data curation, E.G., N.T.G., and D.P.S.; writing—original draft preparation, E.G., N.T.G., and D.P.S.; writing—review and editing, E.G., N.T.G., and D.P.S.; visualization, E.G., N.T.G., and D.P.S.; supervision, E.G., N.T.G., and D.P.S.; project administration, E.G., N.T.G., and D.P.S.; funding acquisition, E.G., N.T.G., and D.P.S. All authors have read and agreed to the published version of the manuscript.
Funding
This research received no external funding.
Informed Consent Statement
Not applicable.
Data Availability Statement
Dataset available upon request from the authors.
Conflicts of Interest
The authors declare no conflict of interest.
Appendix A

Table A1.
Stop Words.
| a; a's; able; about; above; according; accordingly; across; actually; after; afterwards; again; against; ain't; all; allow; allows; almost; alone; along; already; also; although; always; am; among; amongst; an; and; another; any; anybody; anyhow; anyone; anything; anyway; anyways; anywhere; apart; appear; appreciate; appropriate; are; aren't; around; as; aside; ask; asking; associated; at; available; away; awfully; b; be; became; because; become; becomes; becoming; been; before; beforehand; behind; being; believe; below; beside; besides; best; better; between; beyond; both; brief; but; by; c; c'mon; c's; came; can; can't; cannot; cant; cause; causes; certain; certainly; changes; clearly; co; com; come; comes; concerning; consequently; consider; considering; contain; containing; contains; corresponding; could; couldn't; course; currently; d; definitely; described; despite; did; didn't; different; do; does; doesn't; doing; don't; done; down; downwards; during; e; each; edu; eg; eight; either; else; elsewhere; enough; entirely; especially; et; etc; even; ever; every; everybody; everyone; everything; everywhere; ex; exactly; example; except; f; far; few; fifth; first; five; followed; following; follows; for; former; formerly; forth; four; from; further; furthermore; g; get; gets; getting; given; gives; go; goes; going; gone; got; gotten; greetings; h; had; hadn't; happens; hardly; has; hasn't; have; haven't; having; he; he's; hello; help; hence; her; here; here's; hereafter; hereby; herein; hereupon; hers; herself; hi; him; himself; his; hither; hopefully; how; howbeit; however; i; i'd; i'll; i'm; i've; ie; if; ignored; immediate; in; inasmuch; inc; indeed; indicate; indicated; indicates; inner; insofar; instead; into; inward; is; isn't; it; it'd; it'll; it's; its; itself; j; just; k; keep; keeps; kept; know; knows; known; l; last; lately; later; latter; latterly; least; less; lest; let; let's; like; liked; likely; little; look; looking; looks; ltd; m; mainly; many; may; maybe; me; mean; meanwhile; merely; might; more; moreover; most; mostly; much; must; my; myself; n; name; namely; nd; near; nearly; necessary; need; needs; neither; never; nevertheless; new; next; nine; no; nobody; non; none; noone; nor; normally; not; nothing; novel; now; nowhere; o; obviously; of; off; often; oh; ok; okay; old; on; once; one; ones; only; onto; or; other; others; otherwise; ought; our; ours; ourselves; out; outside; over; overall; own; p; particular; particularly; per; perhaps; placed; please; plus; possible; presumably; probably; provides; q; que; quite; qv; r; rather; rd; re; really; reasonably; regarding; regardless; regards; relatively; respectively; right; s; said; same; saw; say; saying; says; second; secondly; see; seeing; seem; seemed; seeming; seems; seen; self; selves; sensible; sent; serious; seriously; seven; several; shall; she; should; shouldn't; since; six; so; some; somebody; somehow; someone; something; sometime; sometimes; somewhat; somewhere; soon; sorry; specified; specify; specifying; still; sub; such; sup; sure; t; t's; take; taken; tell; tends; th; than; thank; thanks; thanx; that; that's; thats; the; their; theirs; them; themselves; then; thence; there; there's; thereafter; thereby; therefore; therein; theres; thereupon; these; they; they'd; they'll; they're; they've; think; third; this; thorough; thoroughly; those; though; three; through; throughout; thru; thus; to; together; too; took; toward; towards; tried; tries; truly; try; trying; twice; two; u; un; under; unfortunately; unless; unlikely; until; unto; up; upon; us; use; used; useful; uses; using; usually; uucp; v; value; various; very; via; viz; vs; w; want; wants; was; wasn't; way; we; we'd; we'll; we're; we've; welcome; well; went; were; weren't; what; what's; whatever; when; whence; whenever; where; where's; whereafter; whereas; whereby; wherein; whereupon; wherever; whether; which; while; whither; who; who's; whoever; whole; whom; whose; why; will; willing; wish; with; within; without; won't; wonder; would; would; wouldn't; x; y; yes; yet; you; you'd; you'll; you're; you've; your; yours; yourself; yourselves; z; zero; i; me; my; myself; we; our; ours; ourselves; you; your; yours; yourself; yourselves; he; him; his; himself; she; her; hers; herself; it; its; itself; they; them; their; theirs; themselves; what; which; who; whom; this; that; these; those; am; is; are; was; were; be; been; being; have; has; had; having; do; does; did; doing; would; should; could; ought; i'm; you're; he's; she's; it's; we're; they're; i've; you've; we've; they've; i'd; you'd; he'd; she'd; we'd; they'd; i'll; you'll; he'll; she'll; we'll; they'll; isn't; aren't; wasn't; weren't; hasn't; haven't; hadn't; doesn't; don't; didn't; won't; wouldn't; shan't; shouldn't; can't; cannot; couldn't; mustn't; let's; that's; who's; what's; here's; there's; when's; where's; why's; how's; a; an; the; and; but; if; or; because; as; until; while; of; at; by; for; with; about; against; between; into; through; during; before; after; above; below; to; from; up; down; in; out; on; off; over; under; again; further; then; once; here; there; when; where; why; how; all; any; both; each; few; more; most; other; some; such; no; nor; not; only; own; same; so; than; too; very; a; about; above; across; after; again; against; all; almost; alone; along; already; also; although; always; among; an; and; another; any; anybody; anyone; anything; anywhere; are; area; areas; around; as; ask; asked; asking; asks; at; away; back; backed; backing; backs; be; became; because; become; becomes; been; before; began; behind; being; beings; best; better; between; big; both; but; by; came; can; cannot; case; cases; certain; certainly; clear; clearly; come; could; did; differ; different; differently; do; does; done; down; down; downed; downing; downs; during; each; early; either; end; ended; ending; ends; enough; even; evenly; ever; every; everybody; everyone; everything; everywhere; face; faces; fact; facts; far; felt; few; find; finds; first; for; four; from; full; fully; further; furthered; furthering; furthers; gave; general; generally; get; gets; give; given; gives; go; going; good; goods; got; great; greater; greatest; group; grouped; grouping; groups; had; has; have; having; he; her; here; herself; high; high; high; higher; highest; him; himself; his; how; however; i; if; important; in; interest; interested; interesting; interests; into; is; it; its; itself; just; keep; keeps; kind; knew; know; known; knows; large; largely; last; later; latest; least; less; let; lets; like; likely; long; longer; longest; made; make; making; man; many; may; me; member; members; men; might; more; most; mostly; mr; mrs; much; must; my; myself; necessary; need; needed; needing; needs; never; new; new; newer; newest; next; no; nobody; non; noone; not; nothing; now; nowhere; number; numbers; of; off; often; old; older; oldest; on; once; one; only; open; opened; opening; opens; or; order; ordered; ordering; orders; other; others; our; out; over; part; parted; parting; parts; per; perhaps; place; places; point; pointed; pointing; points; possible; present; presented; presenting; presents; problem; problems; put; puts; quite; rather; really; right; right; room; rooms; said; same; saw; say; says; second; seconds; see; seem; seemed; seeming; seems; sees; several; shall; she; should; show; showed; showing; shows; side; sides; since; small; smaller; smallest; some; somebody; someone; something; somewhere; state; states; still; still; such; sure; take; taken; than; that; the; their; them; then; there; therefore; these; they; thing; things; think; thinks; this; those; though; thought; thoughts; three; through; thus; to; today; together; too; took; toward; turn; turned; turning; turns; two; under; until; up; upon; us; use; used; uses; very; want; wanted; wanting; wants; was; way; ways; we; well; wells; went; were; what; when; where; whether; which; while; who; whole; whose; why; will; with; within; without; work; worked; working; works; would; year; years; yet; you; young; younger; youngest; your; yours |
Table A2.
Kept Words.
| sea; oceana; bay; nrdc; monterey; ocean; aquarium; seafood; cam; sustainable; otter; live; fish; marine; climate; msc; clean; water; change; oceans; green; oil; food; list; action; deans; meet; shark; day; fishing; save; tuna; sharks; gulf; fisheries; nrdc's; life; octopus; sands; tar; deep; stewardship; world; future; pollution; wild; whales; asc; protect; feeding; council; energy; watch; dr; exhibit; global; kelp; species; time; turtles; growing; health; penguin; power; stop; voices; president; spill; stories; blue; california; fast; fund; wfm; white; fishery; conservation; forest; issf; protecting; saving; home; matters; plastic; pup; salmon; atlantic; carbon; chick; jellies; keystone; obama; pipeline; redford; robert; video; whale; brewers; conference; earth; support; 3; bycatch; campaign; cuttlefish; diving; fishes; message; north; otters; pacific; psa; recipe; tide; xl; animal; aquaculture; biogems; coast; dolphins; drilling; mediterranean; river; talks; tour; york; alaska; de; defender; environmental; insights; offshore; penguins; science; south; squid; corner; critter; crossing; feed; festival; habitat; research; turtle; warming; acid; awards; chain; chef; fight; jelly; noaa; plan; seals; test; week; act; air; baby; certified; comb; custody; director; jobs; planet; plant; resident; scenes; sen; sustainability; america; endangered; fisherman; happy; indian; king; morning; party; purse; reef; reel; rule; seine; trailer; training; water |
References
- Busche, L. Powering Content: Building a Nonstop Content Marketing Machine; O'Reilly Media: Sebastopol, CA, 2017. [Google Scholar]
- Pateil, N. 11 Reasons You Need to Focus on Long-Tail Keywords for SEO. 2018. Available online: https://neilpatel.com/blog/long-tail-keywords-seo/ (accessed on 27 June 2023).
- Alderson, J. How to use headings on your site. 2021. Available online: https://yoast.com/how-to-use-headings-on-your-site/ (accessed on 27 June 2023).
- Ahola, A. The SEO Battlefield; O'Reilly Media, Inc., 2017. [Google Scholar]
- Yang, J.; Zhang, J.; Zhang, Y. Engagement that sells: Influencer video advertising on TikTok. Marketing Science 2024. [Google Scholar] [CrossRef]
- Hoiles, W.; Aprem, A.; Krishnamurthy, V. Engagement dynamics and sensitivity analysis of YouTube videos. arXiv 2016, 1611, 00687. [Google Scholar] [CrossRef]
- Nguyen, K.; Nguyen, N.; Cao, P.; Vo, L.; Kieu, T. Understanding AI-Based Content Recommendation Experience Perceptions on Short-Video Platforms and Enhancing Customer Engagement: The Mediation of Empathy and Self-Congruence. International Journal of Human–Computer Interaction 2024, 1–17. [Google Scholar] [CrossRef]
- Tafesse, W. YouTube marketing: how marketers' video optimization practices influence video views. Internet Research 2020, 30(6), 1689–1707. [Google Scholar] [CrossRef]
- Park, J.; Park, J.; Park, J. The effects of user engagements for user and company generated videos on music sales: Empirical evidence from YouTube. Frontiers in Psychology 2018, 9, 1880. [Google Scholar] [CrossRef]
- Roy, M.; Kar, P.; Datta, S. Recommender Systems: A Multi-Disciplinary Approach; CRC Press, 2023. [Google Scholar]
- Moriuchi, E. English accent variations in YouTube voice-over ads and the role of perceptions on attitude and purchase intentions. Journal of Interactive Advertising 2021, 21(3), 191–208. [Google Scholar] [CrossRef]
- Harmeling, C.M.; Moffett, J.W.; Arnold, M.J.; Carlson, B.D. Toward a theory of customer engagement marketing. Journal of the Academy of Marketing Science 2017, 3, 312–335. [Google Scholar] [CrossRef]
- Khan, A.; Khan, Z.; Nabi, M.K.; Saleem, I. Unveiling the role of social media and females’ intention to buy online cosmetics. Global Knowledge, Memory and Communication 2024. [Google Scholar] [CrossRef]
- Lou, C.; Jin, S.V. Charting new waters in influencer advertising: Summary of recent inquiries. Journal of Interactive Advertising 2024, 24(2), 103–106. [Google Scholar] [CrossRef]
- Ladhari, R.; Massa, E.; Skandrani, H. YouTube vloggers’ popularity and influence: The roles of homophily, emotional attachment, and expertise. Journal of Retailing and Consumer Services 2020, 54, 102027. [Google Scholar] [CrossRef]
- De Veirman, M.; Hudders, L.; Nelson, M.R. What is influencer marketing and how does it target children? A review and direction for future research. Frontiers in Psychology 2019, 10, 498106. [Google Scholar] [CrossRef] [PubMed]
- Huang, Z.; Benyoucef, M. The effects of social commerce design on consumer purchase decision-making: An empirical study. Electronic Commerce Research and Applications 2017, 25, 40–58. [Google Scholar] [CrossRef]
- Lee, J.K. The effects of team identification on consumer purchase intention in sports influencer marketing: The mediation effect of ad content value moderated by sports influencer credibility. Cogent Business & Management 2021, 8(1), 1957073. [Google Scholar] [CrossRef]
- Dwivedi, Y.K.; Hughes, L.; Ismagilova, E.; Aarts, G.; Coombs, C.; Crick, T.; Duan, Y.; Dwivedi, R.; Edwards, J.; Eirug, A.; et al. Artificial Intelligence (AI): Multidisciplinary perspectives on emerging challenges, opportunities, and agenda for research, practice and policy. International Journal of Information Management 2021, 57, 101994. [Google Scholar] [CrossRef]
- Alalwan, A.A. Investigating the impact of social media advertising features on customer purchase intention. International Journal of Information Management 2018, 42, 65–77. [Google Scholar] [CrossRef]
- Love, D.C.; da Silva, P.P.; Olson, J.; Fry, J.P.; Clay, P.M. Fisheries, food, and health in the USA: the importance of aligning fisheries and health policies. Agric & Food Secur 2017, 6, 1–15. [Google Scholar] [CrossRef]
- Mai, N.; Bogason, S.G.; Arason, S.; Arason, S.V.; Matthiasson, T.G. Benefits of traceability in fish supply chains – case studies. British Food Journal 2010, 112, 976–1002. [Google Scholar] [CrossRef]
- Abedi, A.; Zhu, W. An optimisation model for purchase, production and distribution in fish supply chain – a case study. International Journal of Production Research 2017, 12, 3451–3464. [Google Scholar] [CrossRef]
- Gardner, C.J.; Rocliffe, S.; Gough, C.; Levrel, A.; Singleton, R.L.; Vincke, X.; Harris, A. Value Chain Challenges in Two Community-Managed Fisheries in Western Madagascar: Insights for the Small-Scale Fisheries Guidelines. Jentoft, S., Ed.; The Small-Scale Fisheries Guidelines, MARE Publication Series, 2017. [Google Scholar] [CrossRef]
- Ivanov, D.; Das, A.; Choi, T.M. New flexibility drivers for manufacturing, supply chain and service operations. International Journal of Production Research 2018, 10, 3359–3368. [Google Scholar] [CrossRef]
- Mondragon, A.E.C.; Mondragon, C.E.C.; Coronado, E.S. Managing the food supply chain in the age of digitalisation: a conceptual approach in the fisheries sector. Production Planning & Control 2021, 32, 242–255. [Google Scholar] [CrossRef]
- Fowler, F. Survey research methods; Sage Publication: London, 2014. [Google Scholar]
- McNeill, P.; Chapman, S. Research methods; Routledge: London, 2005. [Google Scholar]
- Avadí, A.; Fréon, P.; Tam, J. Coupled ecosystem/supply chain modelling of fish products from sea to shelf: the Peruvian anchoveta case. PLoS ONE 2014, 7, 1–15. [Google Scholar] [CrossRef] [PubMed]
- Kumar, K.; Zindani, D.; Davim, J.P. Industry 4.0: developments towards the fourth industrial revolution; Springer, 2019. [Google Scholar]
- Akhtar, P.; Ghouri, A.M.; Saha, M.; Khan, M.R.; Shamim, S.; Nallaluthan, K. Industrial digitization, the use of real-time information, and operational agility: Digital and information perspectives for supply chain resilience. IEEE Transactions on Engineering Management 2022, 71, 10387–10397. [Google Scholar] [CrossRef]
- Khan, S.W.; Shahwar, D.; Khalid, S. Unlocking the Potential of YouTube Marketing Communication: The Effects of YouTube Influencer Attributes on Millennials’ Purchase Intention in Pakistan. Annals of Social Sciences and Perspective 2023, 4(1), 65–76. [Google Scholar] [CrossRef]
- Verma, S.; Kapoor, D.; Gupta, R. Role of influencer–follower congruence in influencing followers’ food choices and brand advocacy: mediating role of perceived trust. British Food Journal 2024, 126(12), 4055–4071. [Google Scholar] [CrossRef]
- Aw, E.C.X.; Agnihotri, R. Influencer marketing research: review and future research agenda. Journal of Marketing Theory and Practice 2024, 32(4), 435–448. [Google Scholar] [CrossRef]
- Christensen, V.; de la Puente, S.; Sueiro, J.C.; Steenbeek, J.; Majluf, P. Valuing seafood: the Peruvian fisheries sector. Mar Policy 2014, 44, 302–311. [Google Scholar] [CrossRef]
- FoodΤank. 16 Organizations Promoting Sustainable Fishing Practices. 2023. Available online: https://foodtank.com/news/2017/10/sustainable-fisheries-list/ (accessed on 10 July 2023).
- Iue, M.; Makino, M.; Asari, M. Seafood Sustainability Supply Chain Trends and Challenges in Japan: Marine Stewardship Council Fisheries and Chain of Custody Certificates. Sustainability 2022, 14, 13523. [Google Scholar] [CrossRef]
- VIDIQ. 2023. Available online: https://vidiq.com/ (accessed on 10 July 2023).
- FoodΤank. 2023. Available online: https://foodtank.com/ (accessed on 10 July 2023).
- Hair, J.F.; Anderson, R.E.; Black, W.C. Multivariate data analysis; Pearson: Harlow, 2014. [Google Scholar]
- Cha, M.; Kwak, H.; Rodriguez, P.; Ahn, Y.Y.; Moon, S. Analyzing the video popularity characteristics of large-scale user generated content systems. IEEE/ACM Transactions on Networking 2009, 17, 1357–1370. [Google Scholar] [CrossRef]
- Covington, P.; Adams, J.; Sargin, E. Deep neural networks for YouTube recommendations. In Proceedings of the 10th ACM Conference on Recommender Systems 2016; 2016; pp. 191–198. [Google Scholar] [CrossRef]
- Brodie, R.J.; Ilic, A.; Juric, B.; Hollebeek, L. Consumer engagement in a virtual brand community: An exploratory analysis. Journal of Business Research 2013, 66, 105–114. [Google Scholar] [CrossRef]
- Guo, P.J.; Kim, J.; Rubin, R. How video production affects student engagement: An empirical study of MOOC videos. In Proceedings of the First ACM Conference on Learning@ Scale Conference 2014; 2014; pp. 41–50. [Google Scholar] [CrossRef]
- Munaro, A.C.; Hübner Barcelos, R.; Francisco Maffezzolli, E.C.; Santos Rodrigues, J.P.; Cabrera Paraiso, E. To engage or not engage? The features of video content on YouTube affecting digital consumer engagement. Journal of Consumer Behaviour 2021, 20(5), 1336–1352. [Google Scholar] [CrossRef]
- Bishop, S. Algorithmic experts: Selling algorithmic lore on YouTube. Social Media+ Society 2020, 6, 2056305119897323. [Google Scholar] [CrossRef]
- Gothankar, R.; Troia, F.D.; Stamp, M. Clickbait detection for YouTube videos. In Artificial Intelligence for Cybersecurity. Advances in Information Security; Stamp, M., Aaron Visaggio, C., Mercaldo, F., Di Troia, F., Eds.; Springer: Cham, 2022; Volume 54, pp. 261–284. [Google Scholar] [CrossRef]
- Manawathilake, C.; Ganegoda, G.U. Optimizing YouTube Video Discoverability Through Trend Analysis and Hashtag Generation. 2024 9th International Conference on Information Technology Research (ICITR), Colombo, Sri Lanka; 2024; pp. 1–6. [Google Scholar] [CrossRef]
- Smith, A.N.; Fischer, E.; Yongjian, C. How does brand-related user-generated content differ across YouTube, Facebook, and Twitter? Journal of Interactive Marketing 2012, 26(2), 102–113. [Google Scholar] [CrossRef]
- Peiris, P.; Herath, T.; Dissanayaka, R.; Saranga, K.; Thelijjagoda, S.; Weerathunge, I. Comprehensive Browser Extension for Analysing YouTube User Engagement, Controversy, User Requirements, and Trending Keywords. 2023 33rd International Telecommunication Networks and Applications Conference, Melbourne, Australia; 2023; pp. 134–139. [Google Scholar] [CrossRef]
- Naeem, M. The role of social media to generate social proof as engaged society for stockpiling behaviour of customers during Covid-19 pandemic. Qualitative Market Research: An International Journal 2021, 24, 281–301. [Google Scholar] [CrossRef]
- Berger, J.; Milkman, K.L. What makes online content viral? Journal of Marketing Research 2012, 49(2), 192–205. [Google Scholar] [CrossRef]
- Kapoor, K.K.; Tamilmani, K.; Rana, N.P.; Patil, P.; Dwivedi, Y.K.; Nerur, S. Advances in social media research: Past, present and future. Information Systems Frontiers 2018, 20, 531–558. [Google Scholar] [CrossRef]
- Zhang, S.; Cabage, N. Does SEO Matter? Increasing Classroom Blog Visibility Through Search Engine Optimization. In Proceedings of the 46th Hawaii International Conference on System Sciences (HICSS), Maui, Hawaii, USA, 7-10 Jan. 2013. [Google Scholar]
- Wang, F.; Li, Y.; Zhang, Y. An empirical study on the search engine optimization technique and its outcomes. AIMSEC Chongqing University, China 2011, 2767–2770. [Google Scholar]
- Benoit, K.; Muhr, K.; Watanabe, K. Stopwords: Multilingual Stopword Lists. R package version 2.2. 2023. Available online: https://CRAN.R-project.org/package=stopwords (accessed on 16 July 2023).
- Meyers, L.S.; Gamst, G.; Guarino, A.J. Applied multivariate research: Design and interpretation; Sage Publications: Thousand Oaks, 2006. [Google Scholar]
- Dessart, L.; Pitardi, V. How stories generate consumer engagement: an exploratory Study. Journal of Business Research 2019, 104, 183–195. [Google Scholar] [CrossRef]
- Sakas, D.P.; Giannakopoulos, N.T.; Terzi, M.C.; Kamperos, I.D.G.; Kanellos, N. What is the connection between Fintechs’ video marketing and their vulnerable customers’ brand engagement during crises? International Journal of Bank Marketing 2024, 42(6), 1313–1347. [Google Scholar] [CrossRef]
- Giannakopoulos, N.T.; Reklitis, D.P.; Terzi, M.C.; Sakas, D.P.; Kanellos, N. Video marketing for decentralized finance platforms’ services. J Financ Serv Mark 2024, 29, 1225–1259. [Google Scholar] [CrossRef]
- Roetzel, P.G. Information overload in the information age: a review of the literature from business administration, business psychology, and related disciplines with a bibliometric approach and framework development. Business Research 2018, 12, 479–522. [Google Scholar] [CrossRef]
- Oosterbaan, R.J. Statistical significance of segmented linear regression with break-point using variance analysis (anova) and f-tests. 2017. Available online: https://www.waterlog.info/pdf/anova.pdf (accessed on 19 July 2023).
- Paternoster, R.; Brame, R.; Mazerolle, P.; Piquero, A. Using the correct statistical test for equality of regression coefficients. Criminology 1998, 36, 859–866. [Google Scholar] [CrossRef]
- Field, A. Discovering statistics using SPSS; Sage Publications: London, 2009. [Google Scholar]
- Hinson, R.E.; Mhlanga, D.; Osei-Frimpong, K.; Doe, J. Social Media Marketing Management: How to Penetrate Emerging Markets and Expand Your Customer Base; CRC Press, 2024. [Google Scholar]
Figure 1.
Uneven distribution of video output of the sample channels.
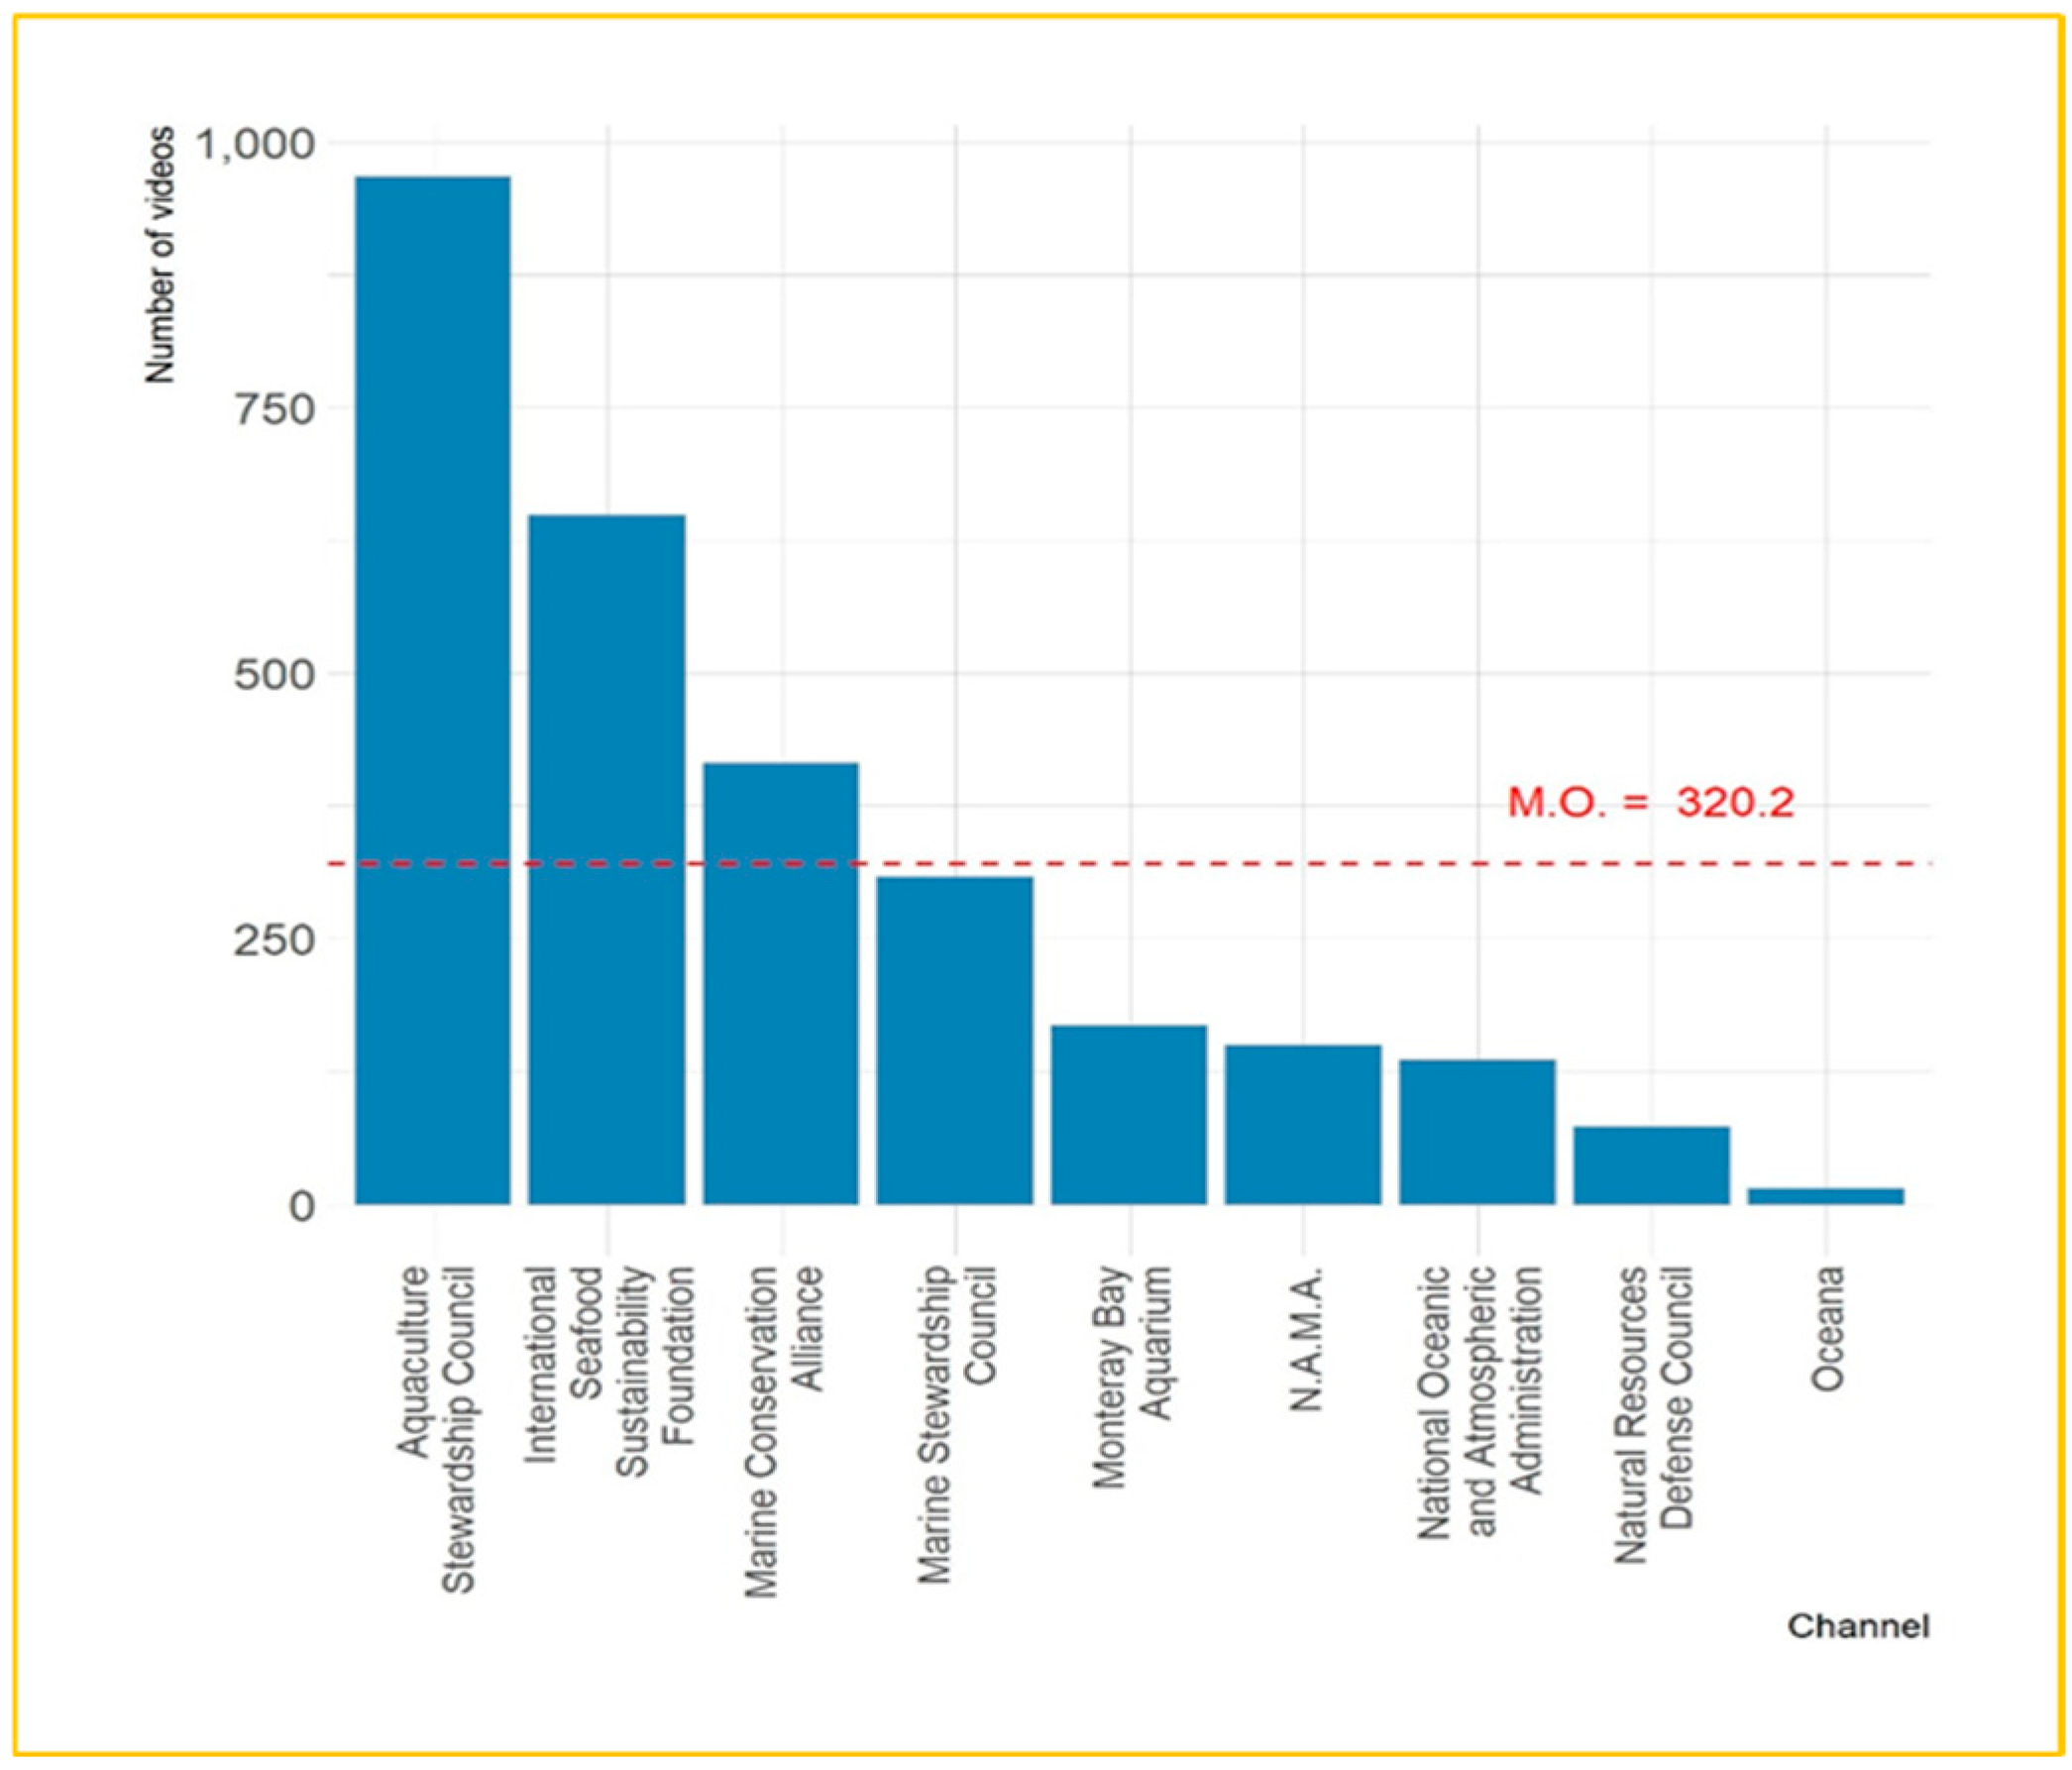
Figure 2.
Uneven distribution of sample video views.
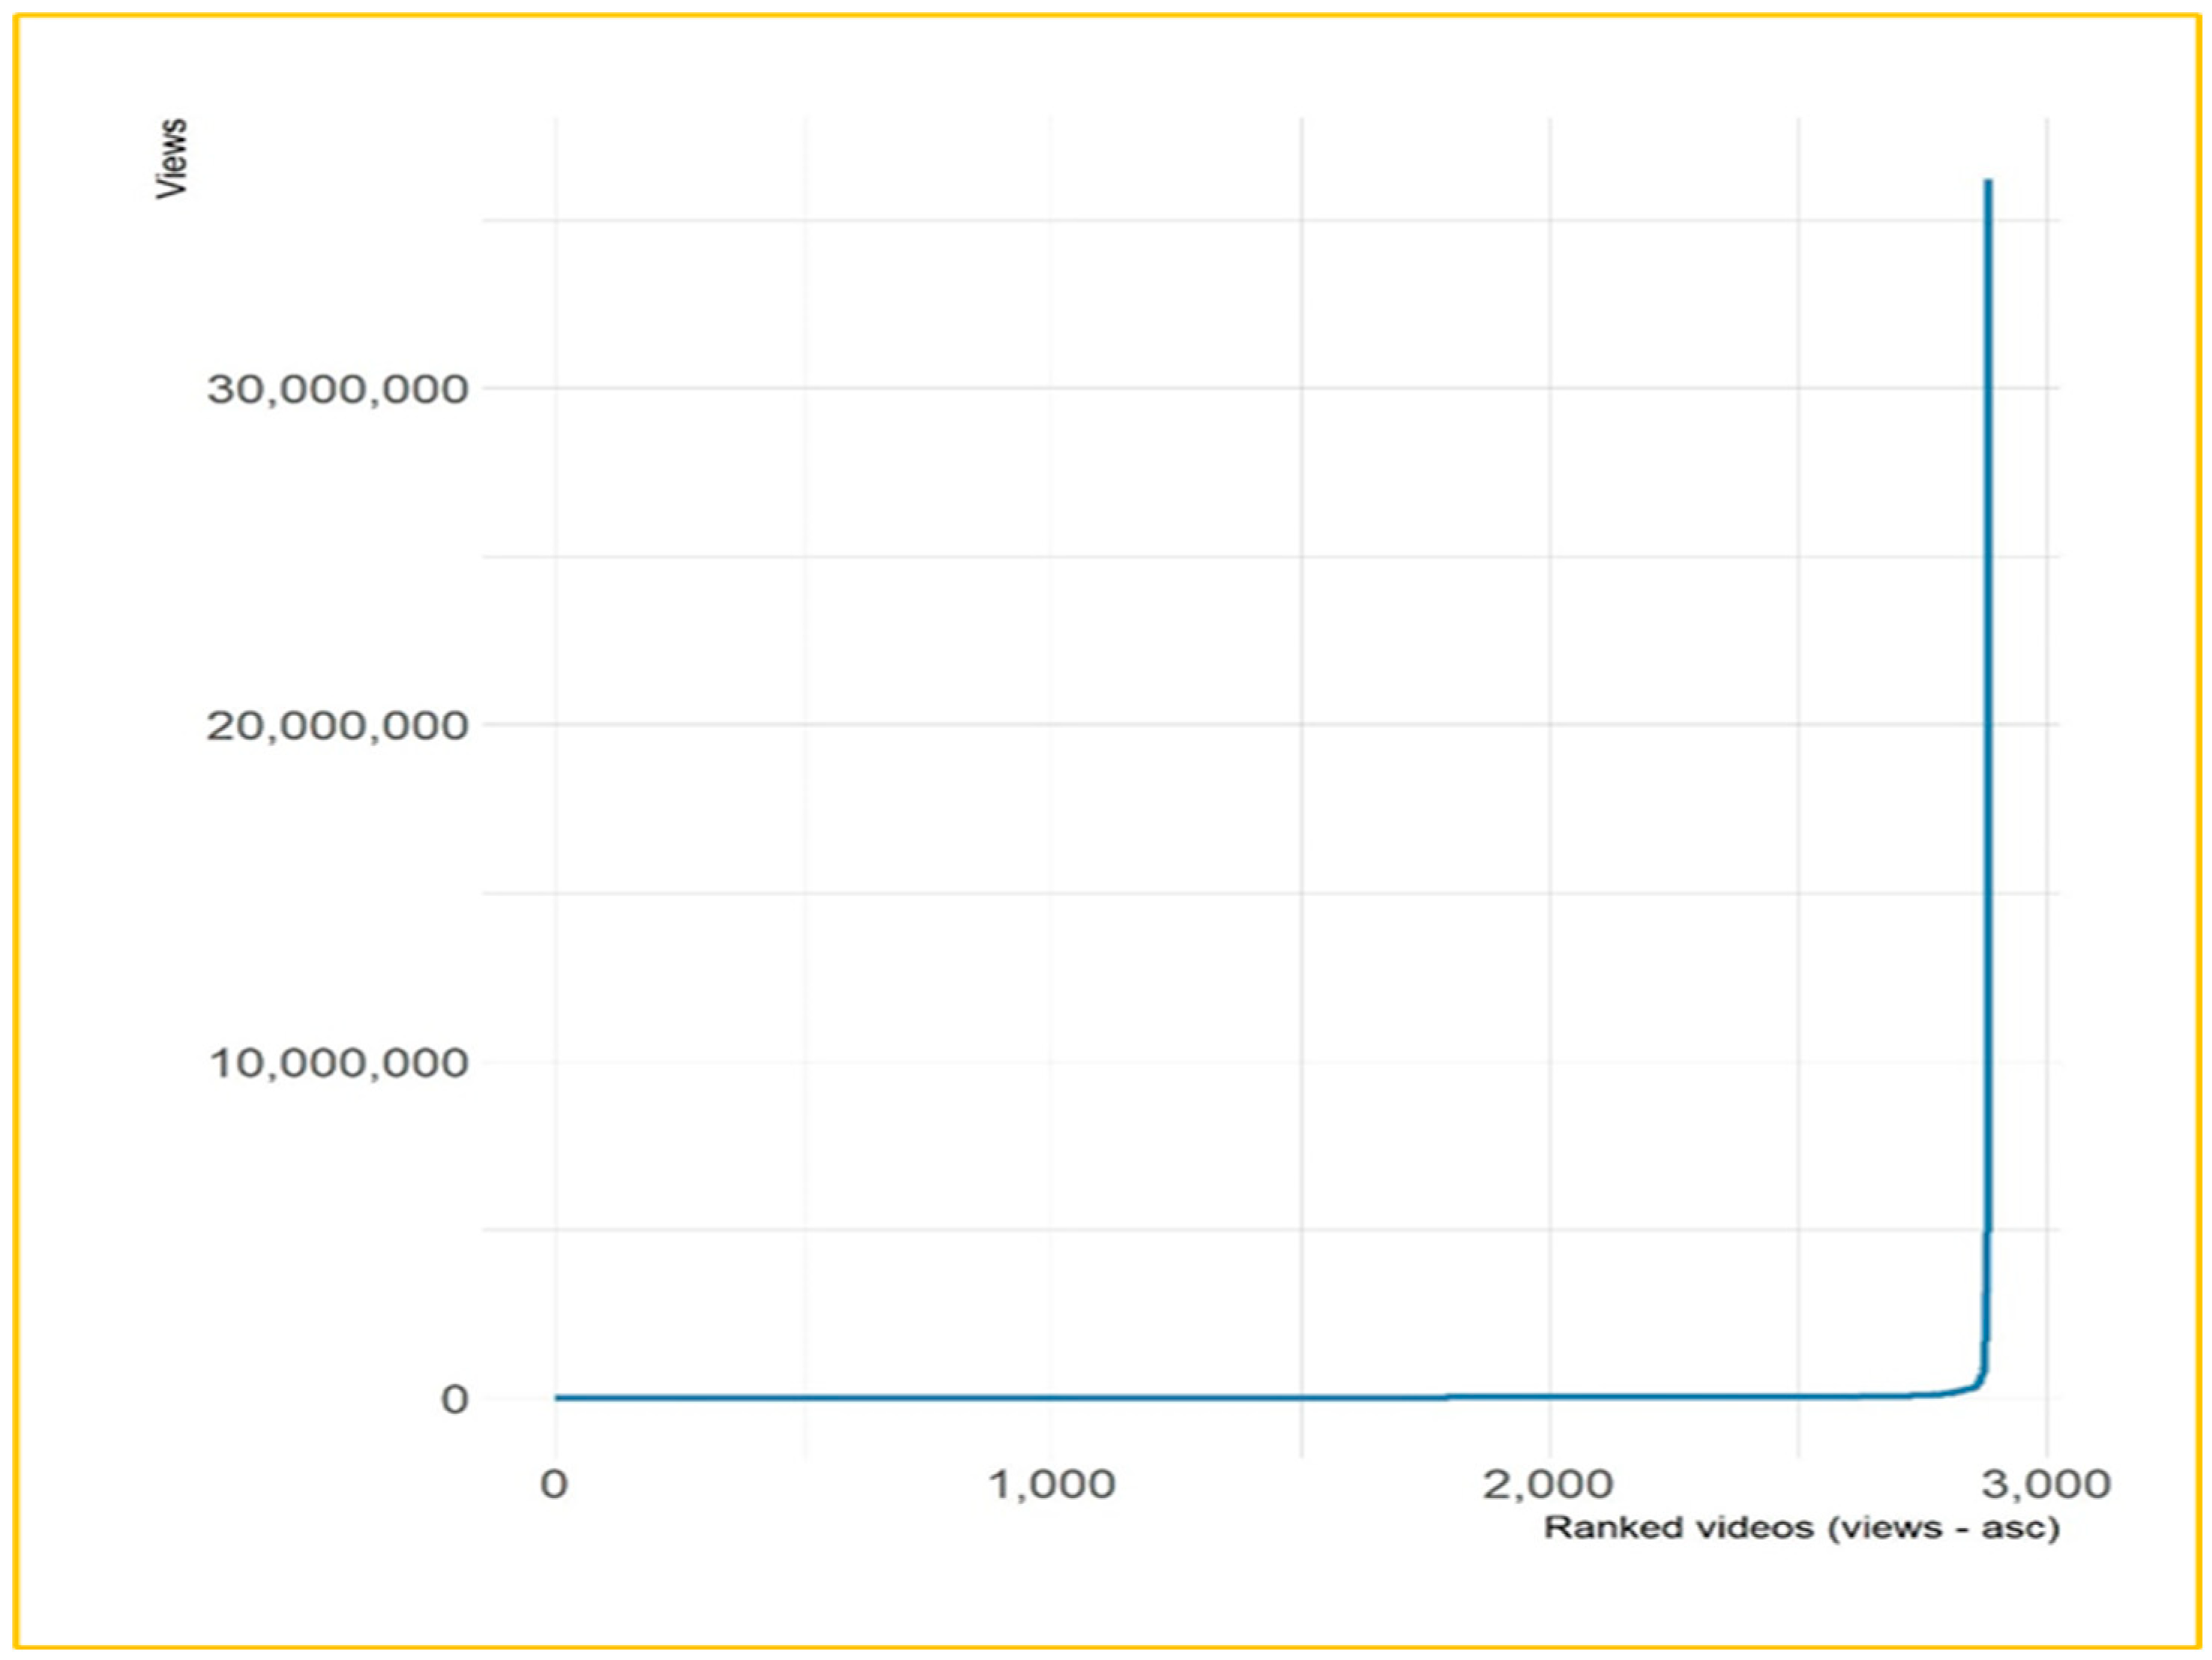
Figure 3.
Distribution histogram of the (natural) logarithm of views of the sample videos.
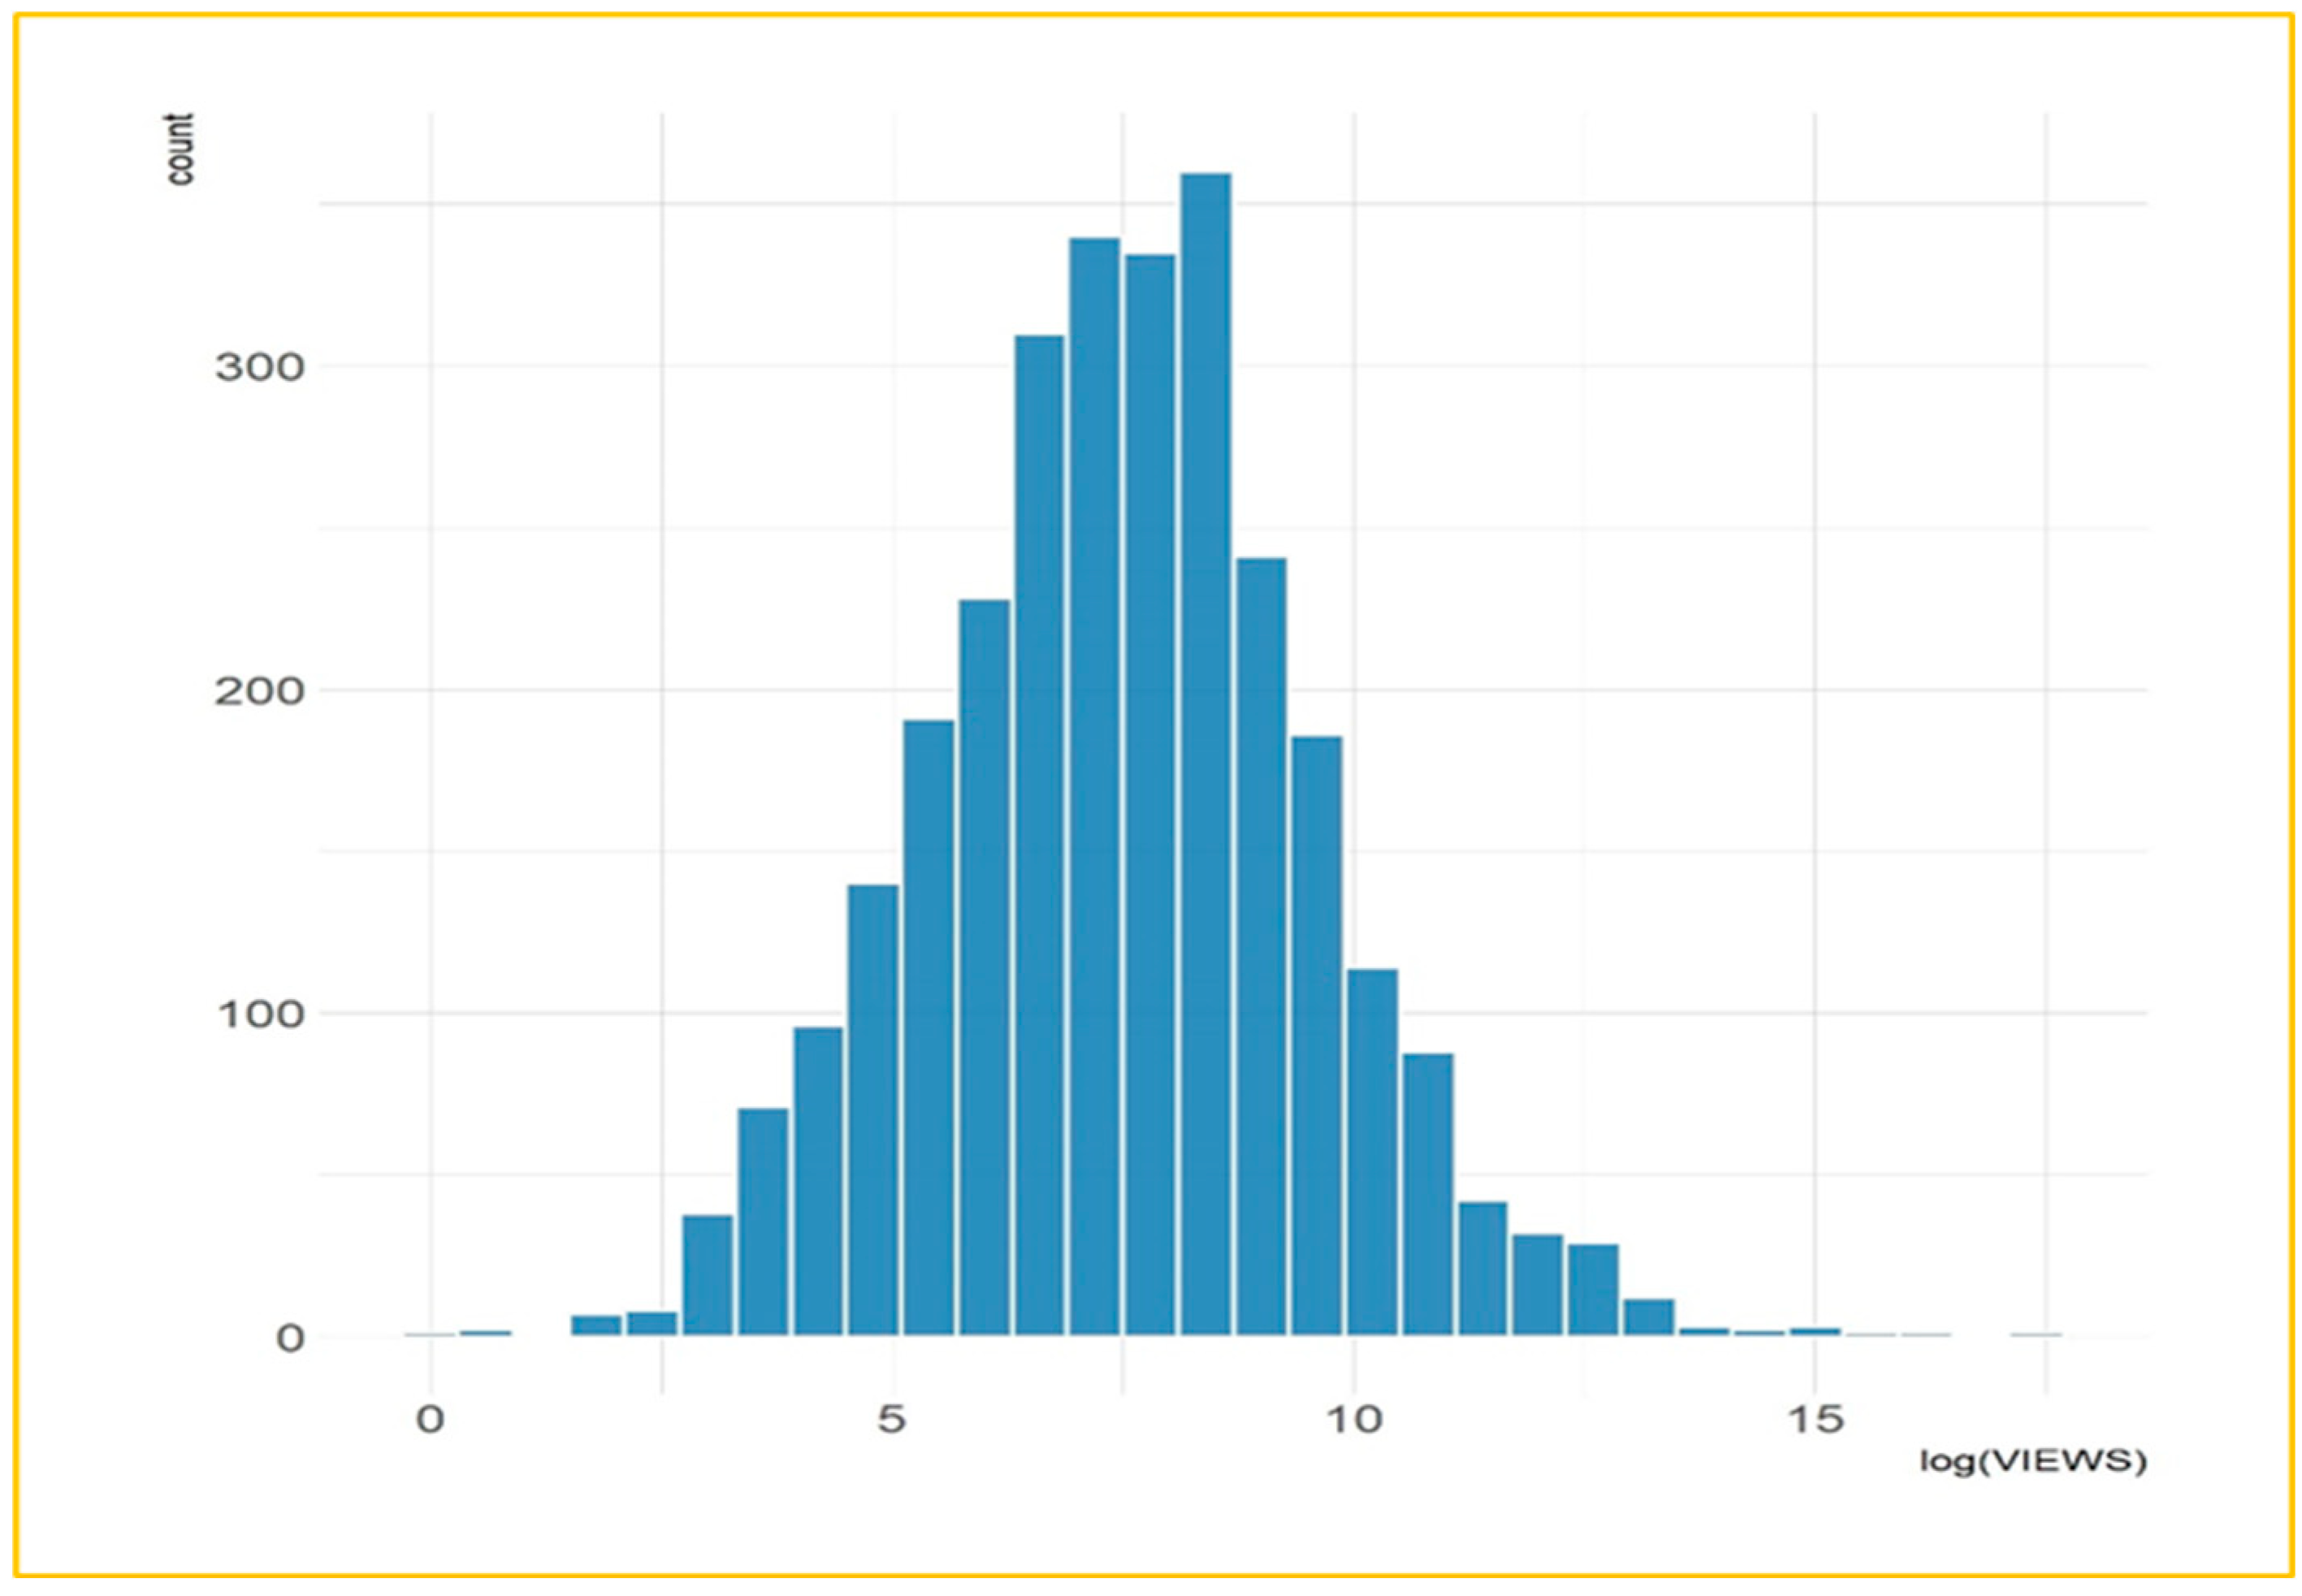
Figure 4.
Sample video duration per channel and their mean values.
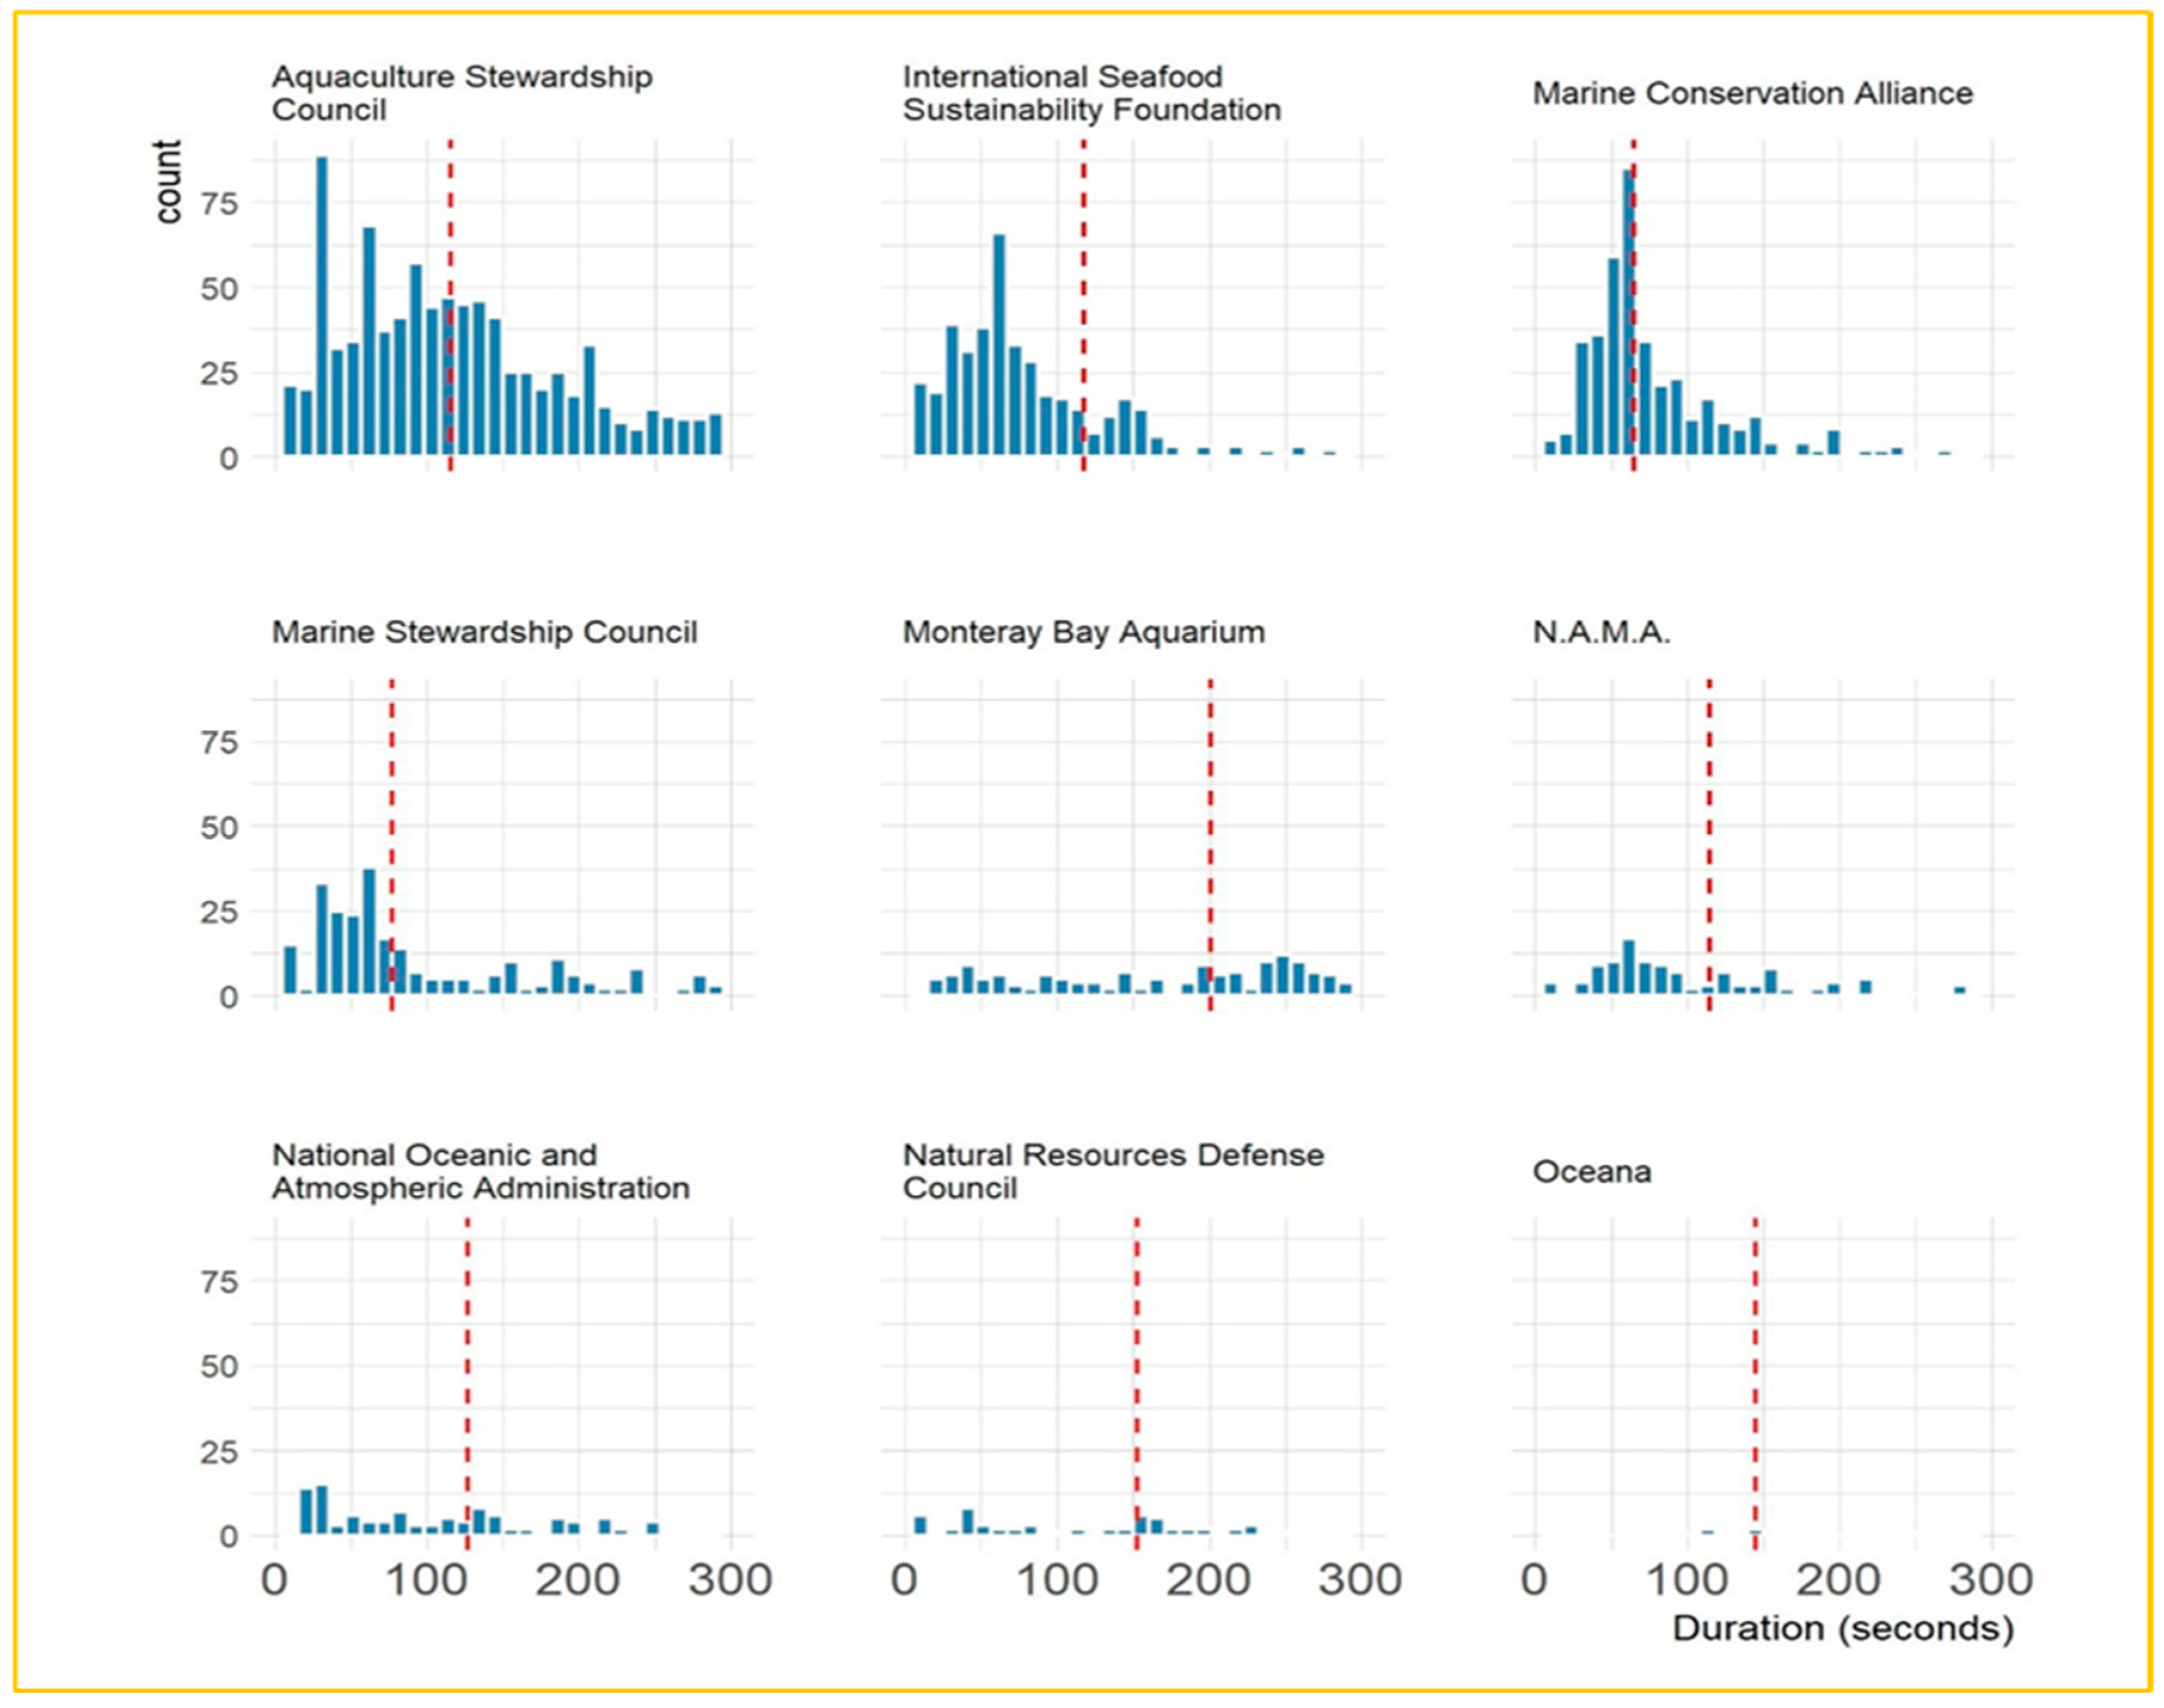
Figure 5.
Length of time a sample video remains active (AGE).
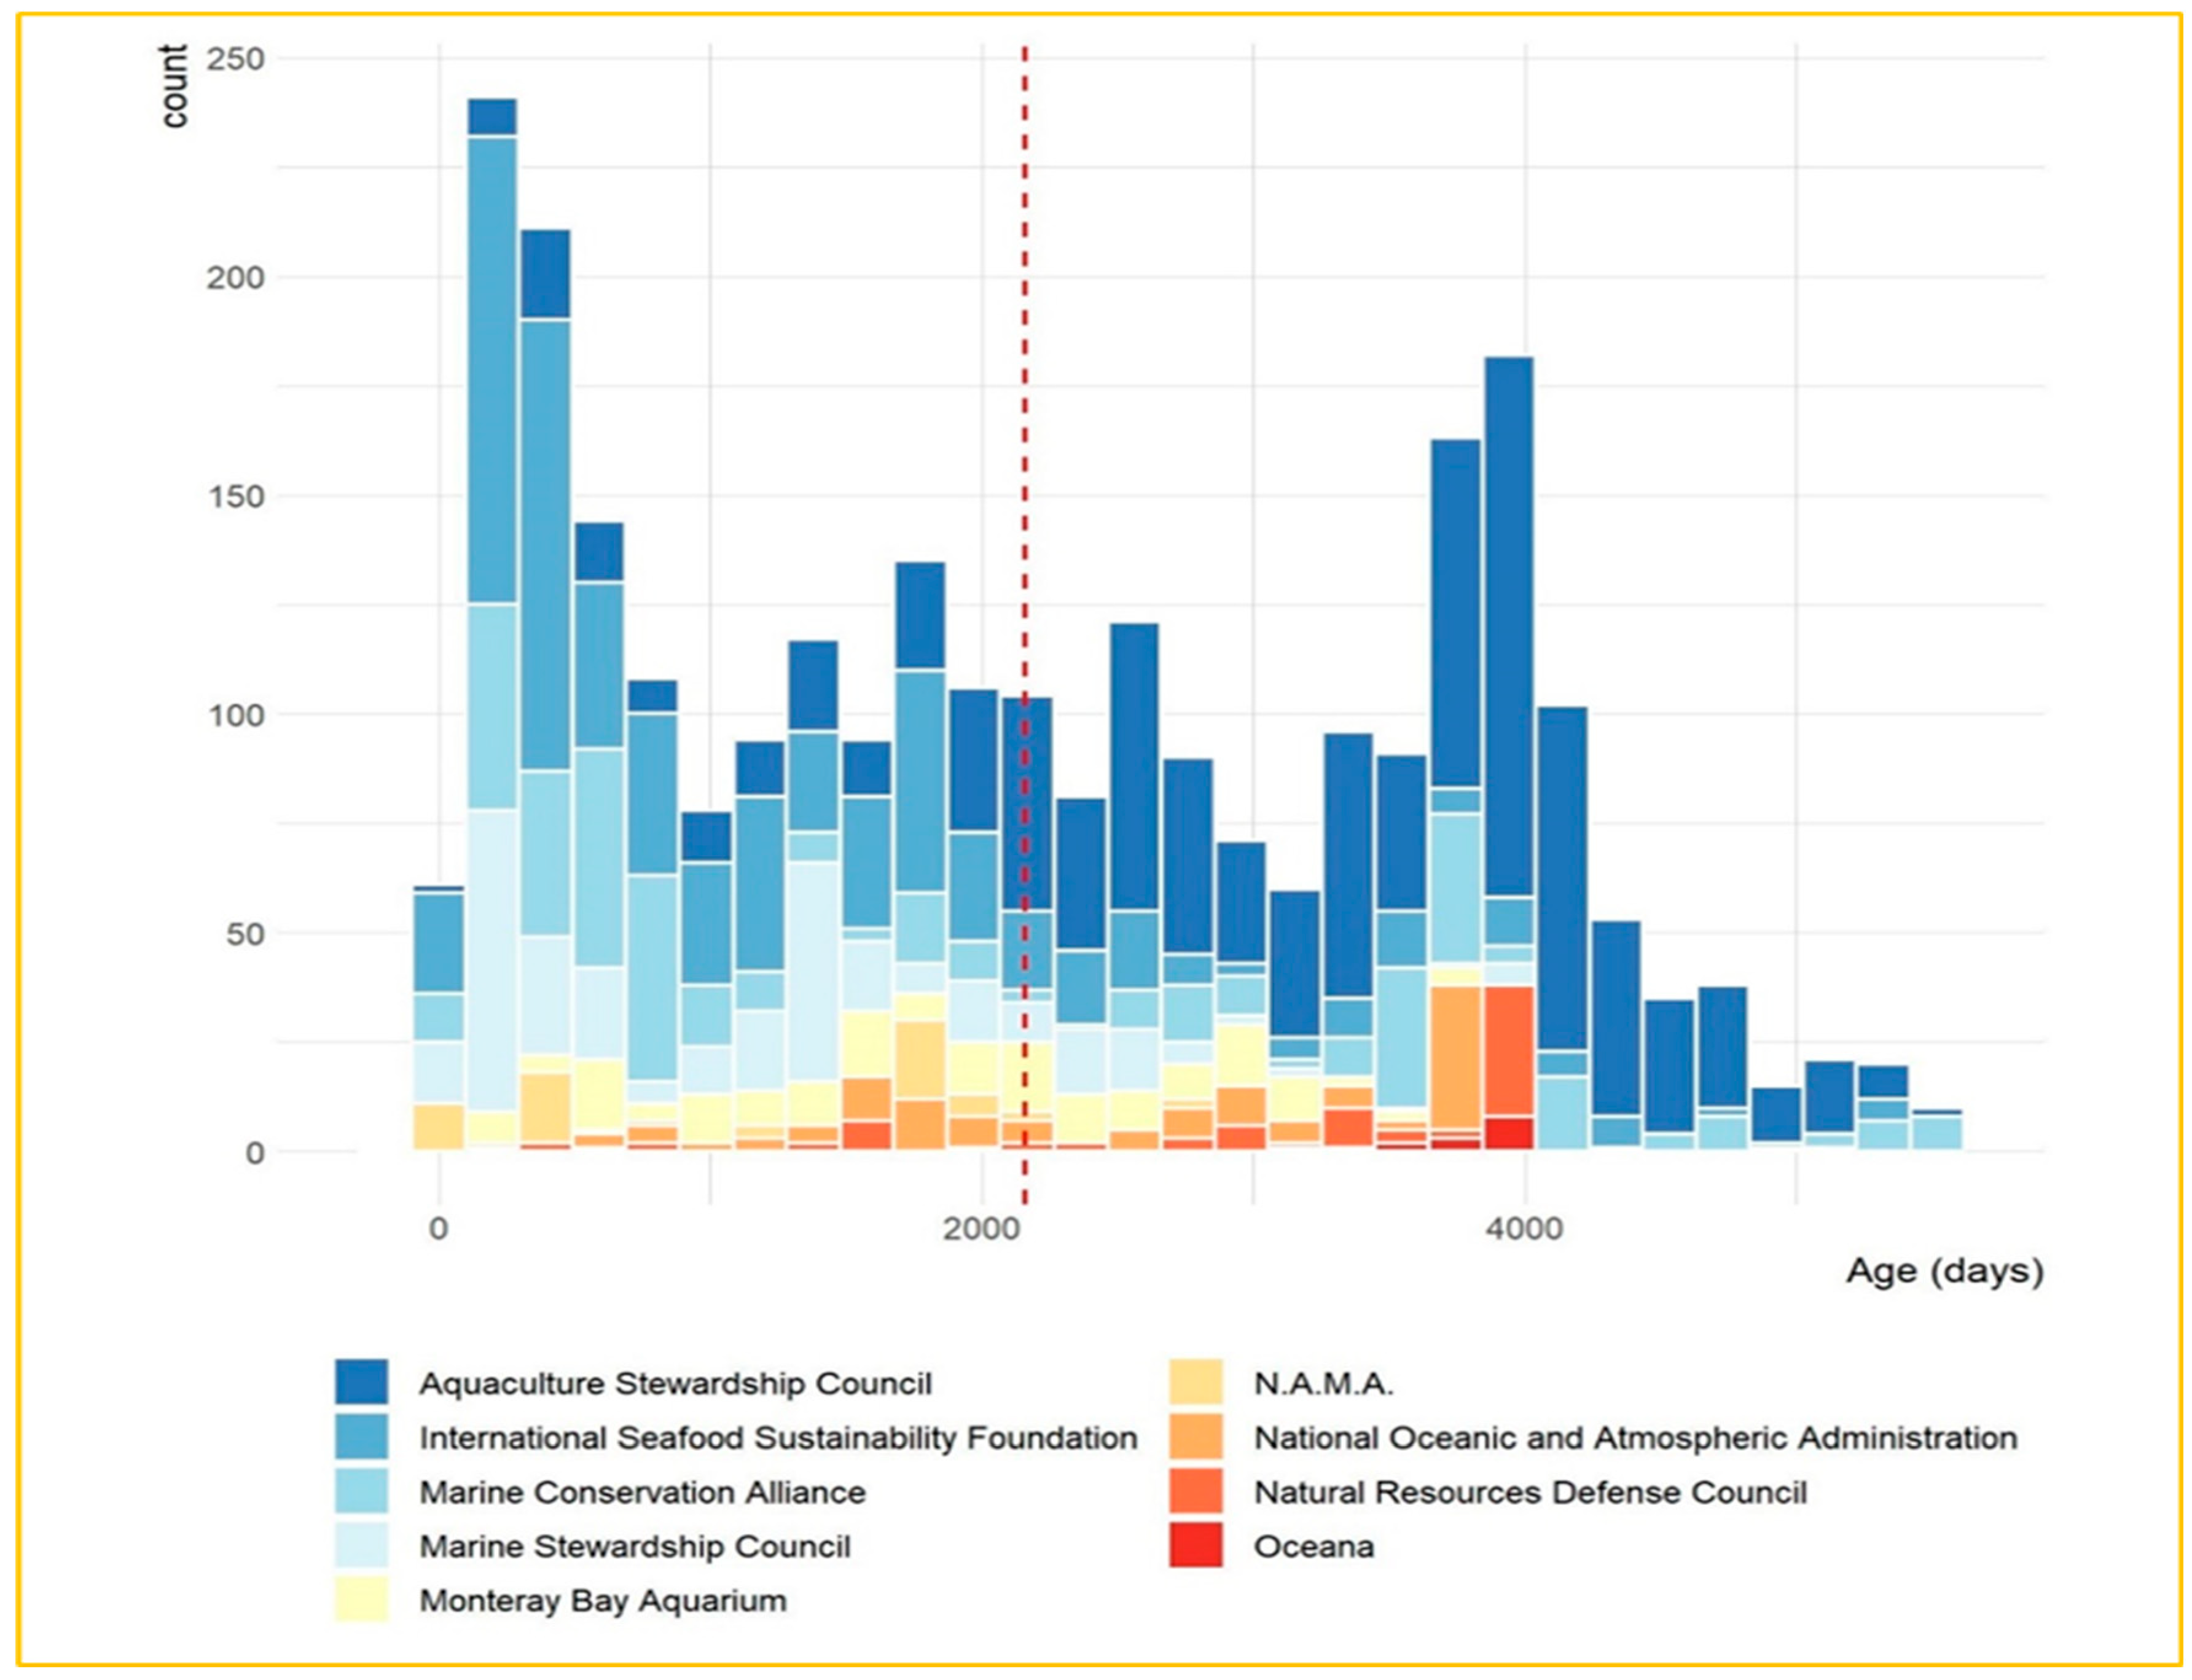
Figure 6.
Title word count distribution (TITLE_COUNT) per channel
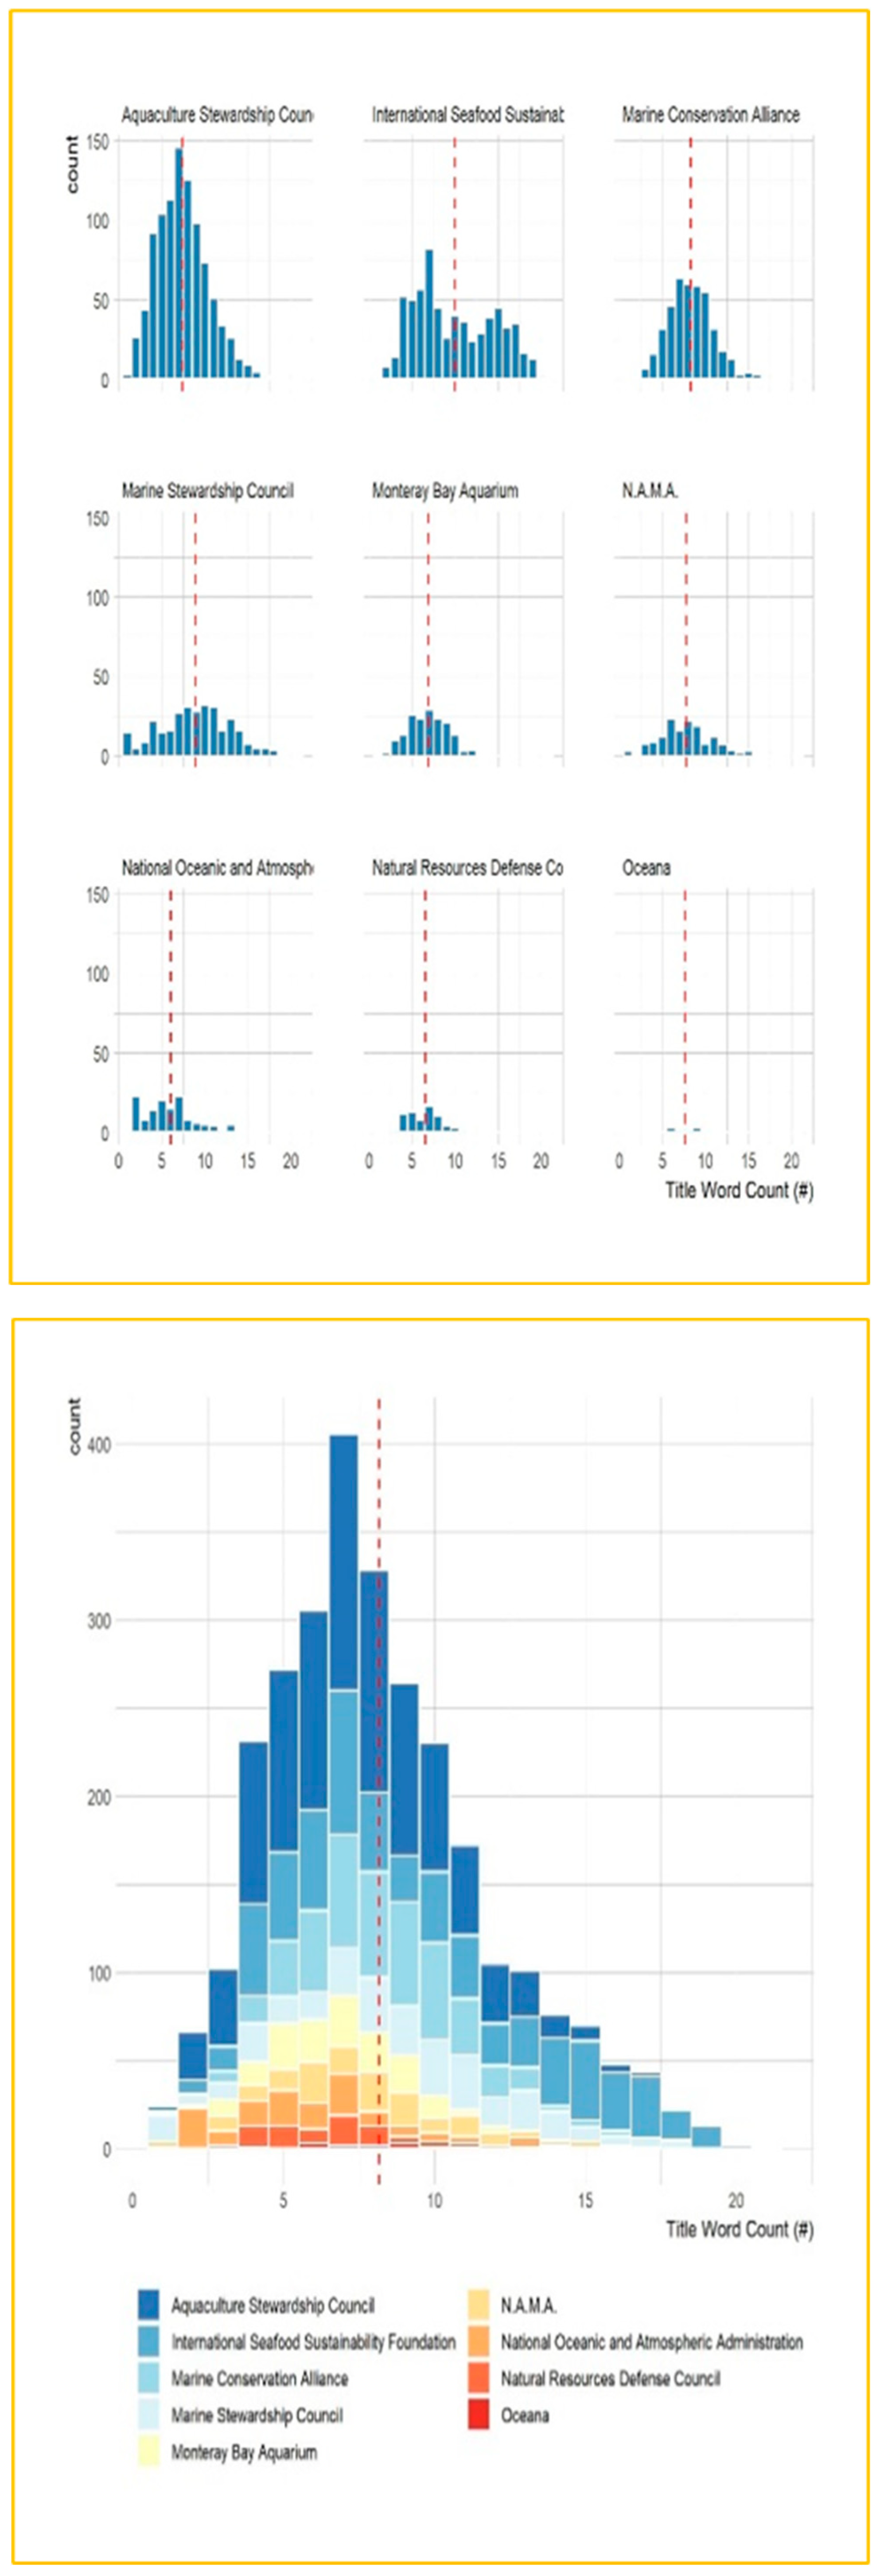
Figure 7.
Distribution of the number of words in the description (DESC_COUNT) of each video and per channel of the sample
Figure 7.
Distribution of the number of words in the description (DESC_COUNT) of each video and per channel of the sample
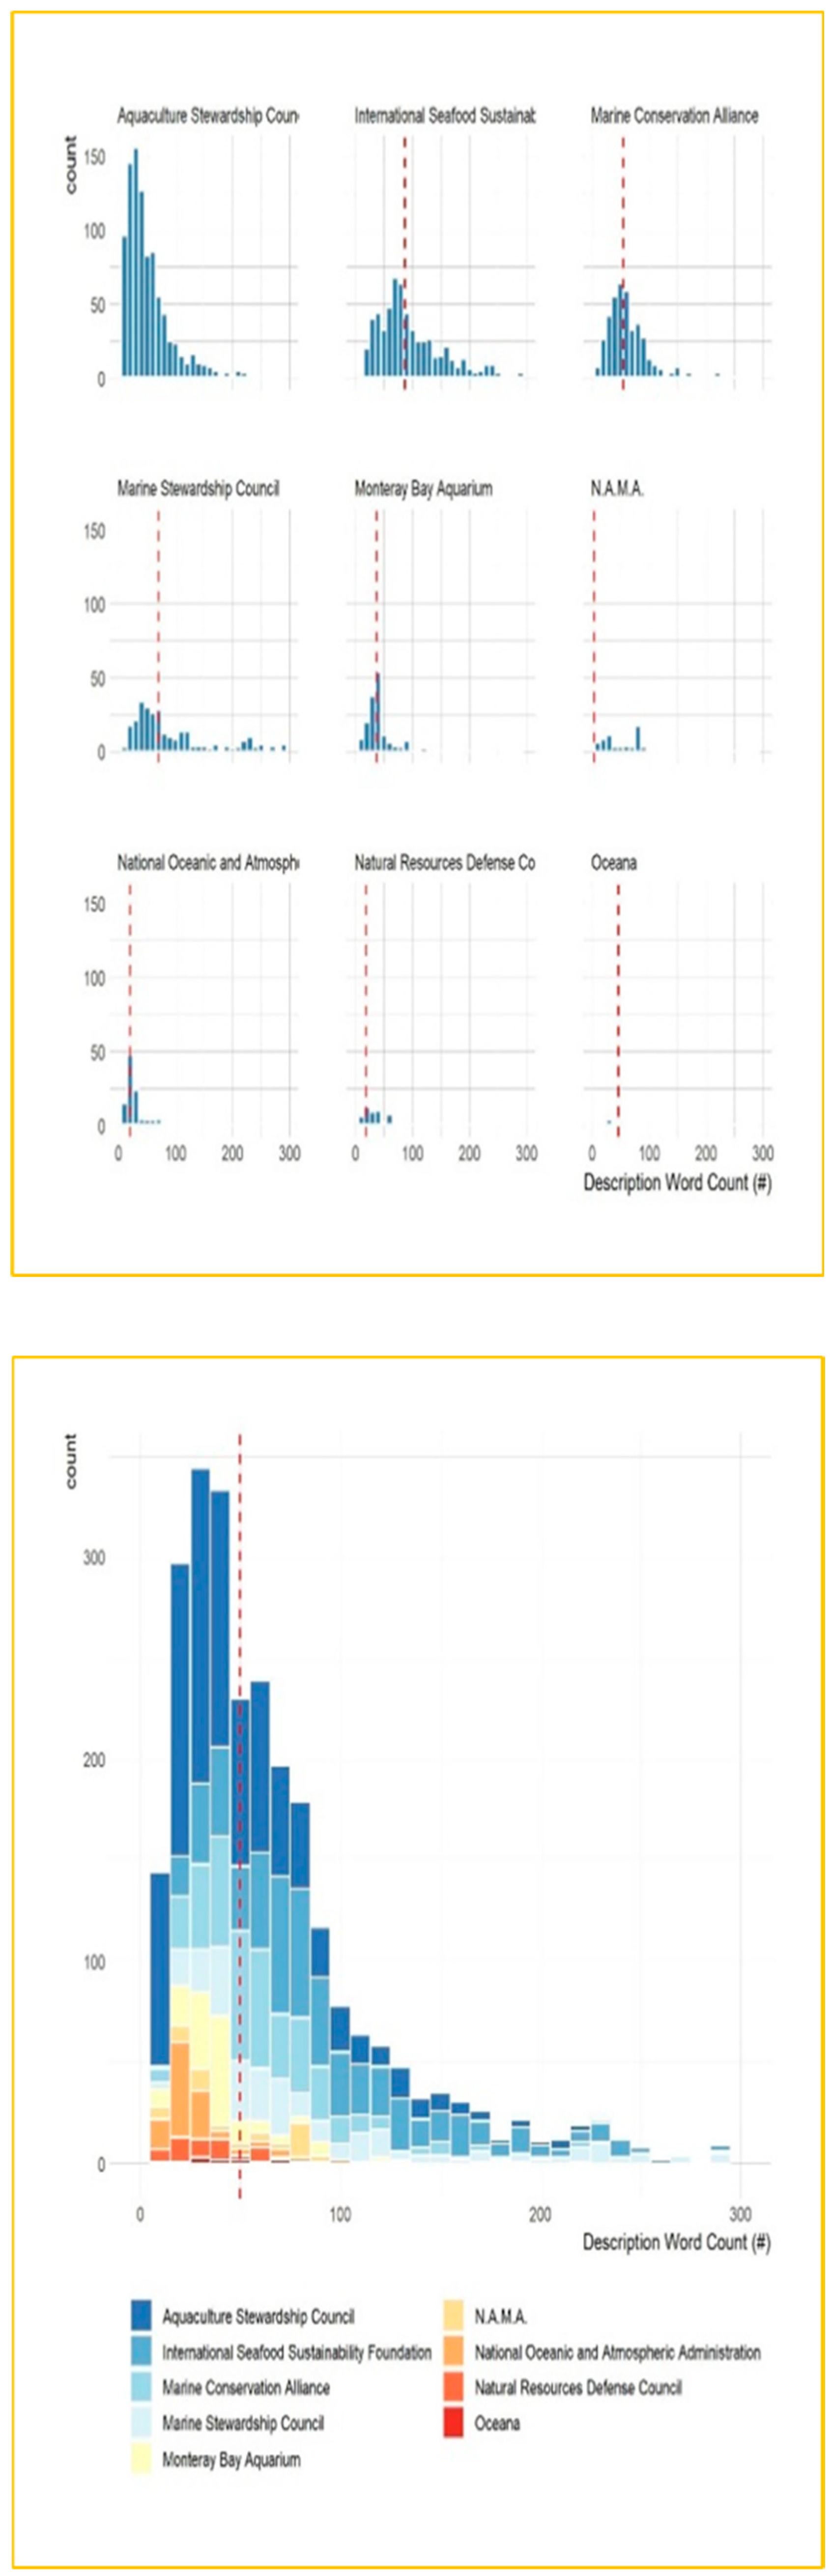
Table 1.
Distribution of videos by channel participating in the survey.
| YouTube Channels | n |
|---|---|
| Aquaculture Stewardship Council | 967 |
| International Seafood Sustainability Foundation | 649 |
| Marine Conservation Alliance | 415 |
| Marine Stewardship Council | 308 |
| Monteray Bay Aquarium | 169 |
| N.A.M.A. | 150 |
| National Oceanic and Atmospheric Administration | 136 |
| Natural Resources Defense Council | 73 |
| Oceana | 15 |
| Total | 2,882 |
Table 2.
Subscribers per sample channel.
| YouTube Channel | Subscribers |
|---|---|
| Aquaculture Stewardship Council | 24,000 |
| International Seafood Sustainability Foundation | 158,000 |
| Marine Conservation Alliance | 116,000 |
| Marine Stewardship Council | 3,630 |
| Monteray Bay Aquarium | 9,040 |
| N.A.M.A. | 310 |
| National Oceanic and Atmospheric Administration | 672 |
| Natural Resources Defense Council | 45 |
| Oceana | 142 |
Table 3.
Production period of the videos per sample channel.
| YouTube Channel | Min Date | Max Date |
|---|---|---|
| Aquaculture Stewardship Council | 08.03.2006 | 24.02.2021 |
| International Seafood Sustainability Foundation | 26.07.2006 | 02.11.2021 |
| Marine Conservation Alliance | 22.06.2006 | 01.05.2021 |
| Marine Stewardship Council | 07.04.2007 | 03.04.2021 |
| Monteray Bay Aquarium | 17.11.2010 | 20.11.2020 |
| N.A.M.A. | 05.08.2013 | 08.04.2021 |
| National Oceanic and Atmospheric Administration | 23.12.2010 | 03.09.2020 |
| Natural Resources Defense Council | 10.04.2010 | 10.07.2020 |
| Oceana | 27.06.2010 | 26.09.2012 |
Table 4.
Asymmetry of sample video views.
| Metrics | Views |
|---|---|
| Min. | 1 |
| 1st Quartile | 459 |
| Median | 1,834,00 |
| Mean | 37,445,00 |
| 3rd Quartile | 6,484 |
| Max. | 36,209,288 |
| Skewness (asymmetry) | 44,1 |
Table 5.
Asymmetry YT LIKES sample video.
| Metrics | Views |
|---|---|
| Min. | 0 |
| Q25 | 3 |
| Median | 13 |
| Mean | 236,4 |
| Q75 | 82 |
| Max. | 161.841 |
| Skewness (asymmetry) | 42,0 |
Table 6.
Asymmetry of video duration per sample channel.
| Metrics (per Channel) | Min | Q25 | Q50 | Q75 | Max | Avg | Skew |
|---|---|---|---|---|---|---|---|
| Aquaculture Stewardship Council | 3 | 63 | 116 | 195 | 5512 | 176.5 | 11.0 |
| International Seafood Sustainability Foundation | 6 | 59 | 118 | 3810 | 43274 | 5079.1 | 1.8 |
| Marine Conservation Alliance | 12 | 50 | 65 | 107 | 35290 | 182.3 | 20.2 |
| Marine Stewardship Council | 13 | 48 | 78 | 207 | 6835 | 303.4 | 5.4 |
| Monteray Bay Aquarium | 15 | 97 | 201 | 258 | 481 | 182.4 | -0.1 |
| N.A.M.A. | 6 | 63 | 114 | 225 | 6588 | 223.2 | 10.1 |
| National Oceanic and Atmospheric Administration | 16 | 49 | 127 | 229 | 3839 | 299.5 | 4.6 |
| Natural Resources Defense Council | 6 | 48 | 153 | 216 | 1094 | 169.3 | 2.9 |
| Oceana | 61 | 110 | 145 | 173 | 384 | 158.3 | 1.4 |
Table 7.
Effect of the active days (AGE) of a sample video on its views.
| Model Summary | |||||||||
|---|---|---|---|---|---|---|---|---|---|
| Observations | 2,743 | ||||||||
| F-statistic | 7.47 | ||||||||
| df-regression | 1 | ||||||||
| df-residuals | 2,742 | ||||||||
| Significance F | 0.006 | ||||||||
| Model Coefficients | |||||||||
| Estimate | 2.5% | 97.5% | Std. Error | t value | Pr(>|t|) | ||||
| AGE (days) | 15 | 4.2 | 25.7 | 5.5 | 2.733 | 0.006 | |||
Table 8.
Effect of the duration of a sample video on its views.
| Model Summary | |||||||||
|---|---|---|---|---|---|---|---|---|---|
| Observations | 2,882 | ||||||||
| F-statistic | 0.19 | ||||||||
| df-regression | 1 | ||||||||
| df-residuals | 2,880 | ||||||||
| Significance F | 0.66 | ||||||||
| Model Coefficients | |||||||||
| Estimate | 2.5 % | 97.5 % | Std. Error | t value | Pr(>|t|) | ||||
| (Intercept) | 39,008 | 11,931 | 66,625 | 14,085 | 2.77 | 0.006 | |||
| DURATION SEC | -1 | -6.5 | 4.1 | 2.7 | -0.44 | 0.66 | |||
Table 9.
Effect of the number of words of a sample video's title on its views
| Model Summary | |||||||||
|---|---|---|---|---|---|---|---|---|---|
| Observations | 2882 | ||||||||
| F-statistic | 0.02 | ||||||||
| df-regression | 1 | ||||||||
| df-residuals | 2880 | ||||||||
| Significance F | 0.90 | ||||||||
| Model Coefficients | |||||||||
| Estimate | 2.5 % | 97.5 % | Std. Error | t value | Pr(>|t|) | ||||
| (Intercept) | 41.299 | -24.567 | 107.165 | 33.592 | 1.23 | 0.22 | |||
| TITLE WORD COUNT | -472 | -7.849 | 6.904 | 3.762 | -0.13 | 0.90 | |||
Table 10.
Effect of the number of words of a sample video's description on its views.
| Model Summary | |||||||||
|---|---|---|---|---|---|---|---|---|---|
| Observations | 2,876 | ||||||||
| F-statistic | 0.19 | ||||||||
| df-regression | 1 | ||||||||
| df-residuals | 2,874 | ||||||||
| Significance F | 0.67 | ||||||||
| Model Coefficients | |||||||||
| Estimate | 2.5 % | 97.5 % | Std. Error | t value | Pr(>|t|) | ||||
| (Intercept) | 42,460 | 7,110 | 77,811 | 18,029 | 2.36 | 0.02 | |||
| DESC COUNT | -70 | -390 | 250 | 163 | -0,43 | 0,67 | |||
Table 11.
Statistical relationship between keywords and the views of the sample videos
| Model Summary | ||
|---|---|---|
| VIEWS | LOG(VIEWS) | |
| Observations | 7.066 | 7.066 |
| F-statistic | 0,82 | 17,54 |
| df-regression | 184 | 184 |
| df-residuals | 6.881 | 6.881 |
| Significance F | 0,96 | 0,00 |
| R2 | 0,02 | 0,32 |
| Adjusted R2 | 0,00 | 0,30 |
Table 12.
Statistical relationship between specific keywords and the views of the sample videos.
| Estimate | 2.5 % | 97.5 % | Pr(>|t|) | ||
|---|---|---|---|---|---|
| (Intercept) | 8.28 | 7.38 | 9.17 | 0.000 | |
| asc | -3.69 | -4.68 | -2.71 | 0.000 | |
| week | -3.59 | -4.60 | -2.58 | 0.000 | |
| custody | -3.99 | -5.13 | -2.85 | 0.000 | |
| chain | -3.88 | -5.01 | -2.75 | 0.000 | |
| recipe | -3.56 | -4.64 | -2.48 | 0.000 | |
| festival | -3.95 | -5.22 | -2.68 | 0.000 | |
| training | -3.57 | -4.75 | -2.39 | 0.000 | |
| wfm | -2.96 | -4.01 | -1.92 | 0.000 | |
| issfsf | -2.74 | -3.83 | -1.65 | 0.000 | |
| reel | -3.31 | -4.66 | -1.96 | 0.000 | |
| matters | -2.72 | -3.86 | -1.57 | 0.000 | |
| insights | -2.95 | -4.20 | -1.71 | 0.000 | |
| fish | -2.20 | -3.15 | -1.26 | 0.000 | |
| fishes | -2.44 | -3.60 | -1.27 | 0.000 | |
| defender | -2.59 | -3.83 | -1.34 | 0.000 | |
| msc | -1.95 | -2.90 | -1.01 | 0.000 | |
| stewardship | -2.10 | -3.12 | -1.08 | 0.000 | |
| council | -2.13 | -3.17 | -1.10 | 0.000 | |
| brewers | -2.43 | -3.63 | -1.24 | 0.000 | |
| pup | 2.23 | 1.12 | 3.34 | 0.000 | |
| tour | -2.45 | -3.68 | -1.22 | 0.000 | |
| seafood | -1.87 | -2.82 | -0.92 | 0.000 | |
| campaign | -2.37 | -3.58 | -1.16 | 0.000 | |
| de | -1.92 | -2.90 | -0.93 | 0.000 | |
| aquaculture | -2.31 | -3.50 | -1.11 | 0.000 | |
| biogems | -2.35 | -3.58 | -1.13 | 0.000 | |
| message | -2.31 | -3.52 | -1.10 | 0.000 | |
| dr | -1.98 | -3.03 | -0.92 | 0.000 | |
| bycatch | -2.20 | -3.39 | -1.00 | 0.000 | |
| power | -1.93 | -3.04 | -0.82 | 0.001 | |
| sustainability | -2.23 | -3.52 | -0.94 | 0.001 | |
| seine | -2.13 | -3.38 | -0.88 | 0.001 | |
| purse | -2.13 | -3.38 | -0.88 | 0.001 | |
| jobs | -2.16 | -3.42 | -0.89 | 0.001 | |
| rule | -2.30 | -3.65 | -0.95 | 0.001 | |
| clean | -1.65 | -2.63 | -0.67 | 0.001 | |
| nrdc's | -1.71 | -2.73 | -0.68 | 0.001 | |
| conference | -1.88 | -3.07 | -0.68 | 0.002 | |
| otters | 1.87 | 0.68 | 3.07 | 0.002 | |
| plant | -2.04 | -3.36 | -0.72 | 0.002 | |
| saving | 1.69 | 0.59 | 2.78 | 0.003 | |
| list | -1.52 | -2.54 | -0.51 | 0.003 | |
| otter | 1.41 | 0.47 | 2.36 | 0.003 | |
| deans | -1.52 | -2.53 | -0.50 | 0.003 | |
| sustainable | -1.43 | -2.39 | -0.47 | 0.003 | |
| earth | -1.68 | -2.82 | -0.54 | 0.004 | |
| plan | -1.88 | -3.17 | -0.59 | 0.004 | |
| party | -1.86 | -3.17 | -0.54 | 0.006 | |
| fisheries | -1.44 | -2.47 | -0.40 | 0.006 | |
| energy | -1.46 | -2.51 | -0.41 | 0.006 | |
| carbon | -1.61 | -2.79 | -0.43 | 0.007 | |
| indian | -1.80 | -3.15 | -0.45 | 0.009 | |
| marine | -1.29 | -2.25 | -0.32 | 0.009 | |
| support | -1.57 | -2.75 | -0.39 | 0.009 | |
| awards | -1.63 | -2.85 | -0.40 | 0.009 | |
| food | -1.31 | -2.32 | -0.30 | 0.011 | |
| climate | -1.18 | -2.15 | -0.20 | 0.018 | |
| talks | -1.43 | -2.62 | -0.23 | 0.019 | |
| planet | -1.48 | -2.74 | -0.21 | 0.022 | |
| change | -1.16 | -2.16 | -0.16 | 0.024 | |
| health | -1.26 | -2.37 | -0.15 | 0.027 | |
| water | -1.11 | -2.10 | -0.13 | 0.027 | |
| sen | -1.44 | -2.73 | -0.15 | 0.028 | |
| offshore | -1.34 | -2.57 | -0.11 | 0.032 | |
| fund | -1.21 | -2.33 | -0.08 | 0.036 | |
| director | -1.28 | -2.53 | -0.03 | 0.044 | |
| fishery | -1.16 | -2.29 | -0.02 | 0.046 | |
| south | -1.26 | -2.51 | -0.02 | 0.047 | |
| action | -1.02 | -2.05 | 0.00 | 0.049 | |
| fishing | -1.01 | -2.02 | 0.00 | 0.050 | |
| save | -1.02 | -2.04 | 0.00 | 0.050 | |
| protect | -1.07 | -2.14 | 0.00 | 0.050 | |
Table 13.
Statistical relationship between video views and the interaction they receive from users (“likes”).
Table 13.
Statistical relationship between video views and the interaction they receive from users (“likes”).
| Model Summary | |||||||||
|---|---|---|---|---|---|---|---|---|---|
| Observations | 2,882 | ||||||||
| F-statistic | 976.2 | ||||||||
| df-regression | 1 | ||||||||
| df-residuals | 2,880 | ||||||||
| Significance F | 0.00 | ||||||||
| R2 | 0.25 | ||||||||
| Adjusted R2 | 0.25 | ||||||||
| Model Coefficients | |||||||||
| Estimate | 2.5 % | 97.5 % | Std. Error | t-value | Pr(>|t|) | ||||
| (Intercept) | 151.5 | 47.2 | 255.7 | 53.2 | 2.8 | 0.004 | |||
| VIEWS | 0.002268 | 0.002126 | 0.002411 | 0.000073 | 31.2 | 0.000 | |||
Table 14.
Statistical comparison of the two sample groups regarding their views and the interaction they receive from users (“likes”).
Table 14.
Statistical comparison of the two sample groups regarding their views and the interaction they receive from users (“likes”).
| Model Summary | ||
|---|---|---|
| Over | Under | |
| Observations | 357 | 2,525 |
| F-statistic | 5,939 | 159,347 |
| df-regression | 1 | 1 |
| df-residuals | 356 | 2,524 |
| Significance F | 0.00 | 0.00 |
| R2 | 0.94 | 0.98 |
| Adjusted R2 | 0.94 | 0.98 |
Table 15.
Analysis of statistics of the two groups created regarding their views and the interaction they receive from users ("likes").
Table 15.
Analysis of statistics of the two groups created regarding their views and the interaction they receive from users ("likes").
| Estimate | 2.5 % | 97.5 % | Std. Error | t value | Pr(>|t|) | |
|---|---|---|---|---|---|---|
| VIEWS_OVER | 0.0112 | 0.0110 | 0.0115 | 0.00015 | 77.1 | 0.000 |
| VIEWS_UNDER | 0.0007 | 0.0007 | 0.0007 | 0.00000 | 399.2 | 0.000 |
Disclaimer/Publisher’s Note: The statements, opinions and data contained in all publications are solely those of the individual author(s) and contributor(s) and not of MDPI and/or the editor(s). MDPI and/or the editor(s) disclaim responsibility for any injury to people or property resulting from any ideas, methods, instructions or products referred to in the content. |
© 2025 by the authors. Licensee MDPI, Basel, Switzerland. This article is an open access article distributed under the terms and conditions of the Creative Commons Attribution (CC BY) license (http://creativecommons.org/licenses/by/4.0/).
Copyright: This open access article is published under a Creative Commons CC BY 4.0 license, which permit the free download, distribution, and reuse, provided that the author and preprint are cited in any reuse.


