
Submitted:
26 March 2025
Posted:
27 March 2025
You are already at the latest version
Abstract
We present a chemiresistor sensor for NO2 leaks. The sensor uses the organometallic semiconductor copper(II)phthalocyanine (CuPc) and is manufactured and characterised easier than previously described organic transistor gas sensors. Resistance R is high but within range of modern voltage buffers. The chemiresistor weakly responds to several gases, with either a small increase (NH3, H2S), or decrease (SO2) of R. However, response is low at environmental pollution levels. Response to NO2 also is near- zero for permitted long-term exposure. Our sensor is therefore not suited for environmental monitoring, but acceptable environmental pollutant levels also do not interfere with the sensor. Above a threshold of ~ 87 ppb, response to NO2 becomes very strong. Response presumably is due to doping of CuPc by the strongly oxidising NO2, and is far stronger than for previously reported CuPc chemiresistors. We relate this to differences in film morphology. Under 1 ppm NO2, R drops by a factor of 870 vs. non- polluted air. 1 ppm NO2 is far above ‘background’ environmental pollution, avoiding false alarms, but far below immediately life-threatening levels, giving time to evacuate. Our sensor is destined for leak detection in the nitrogen fertiliser industry, where NO2 is an important intermediate.
Keywords:
nitrogen dioxide
; sensor
; chemiresistor
; copper phthalocyanine
; fertiliser
1. Introduction
The pollution of our atmosphere with toxic gases such as NO2, NH3, H2S and SO2 is an unfortunate side effect of industrialisation and traffic in the modern world, particularly in the urban environment, and may be particularly intense in some workplaces. For example, NO2 is generated by high-temperature combustion in air (Diesel engines, gas cookers), but it is also an intermediate in the synthesis of nitric acid, which is produced on a large scale in the fertiliser industry. NO2 is, therefore, a common urban and indoor air pollutant causing serious health effects by long-term exposure to lower concentrations, but also poses an imminent danger to life from leaks in fertiliser plants, with a ‘median lethal dose’ LC50 for humans of 174 parts- per- million (ppm) for 1 hr. All major legislations therefore set ‘limiting values’ (LVs) or ‘maximum exposure limits’ (MELs) for NO2 and other toxic gases. These differentiate between environmental air quality, and the permitted exposure of individuals in the workplace, and typically are graded according to the duration of exposure. For example, the EU sets standards for environmental air quality of 200 μg/m3 = 106 ppb NO2 for a maximum of 1 hr, and 40 μg/m3 = 21 ppb for ‘1 year’, i.e. permanent exposure [1]. For the workplace, the EU Occupational Safety and Health Agency (OSHA) defines LVs for CO, SO2, H2S, NH3, NO2, and NO in Commission directive 2017/164 [2]; values are tabulated in supplementary material S1. US legislation sets short term ‘emergency exposure limits’ (EELs) to NO2 in the workplace between a ‘5-minute EEL’ of 35 ppm, and a 60-minute EEL of 10 ppm [3].
The common pollution of air with the aforementioned 4 gases (as well as others) calls for sensor technologies for their identification and quantification. Sensors require a ‘sensitiser’, i.e. a material that binds to the target analyte and changes (at least) one of its physical properties in response, and a ‘transducer’ that measures the change of this physical quantity. A family of materials that are known to bind and respond to toxic and chemically aggressive gases are organic dyes and semiconductors, i.e. organic materials with extended π- conjugated electronic orbitals. Air- and waterborne pollutants often interact with organic dyes and semiconductors and change their optical (e.g. [4]) and/or electronic properties, making them potential sensitisers for such pollutants. Historically, organic semiconductor based sensors often were transduced by organic field effect transistors, known as OFETs or OTFTs, which change their electronic characteristics in line with the semiconductor’s electronic properties. When the OFET is actuated by a gate voltage, field effect enhances charge carrier concentration in the transistor’s channel and therefore its conductivity by many orders- of- magnitude. This is helpful for measurement as charge carrier mobility in organic semiconductors often is low. Also, OFET characteristics may reveal other parameters than carrier mobility, in particular threshold voltage, which may also be employed for the transduction of airborne gases. Examples for real- time and/or multiparametric OFET characterisation systems for gas sensing are e.g. in [5,6]. The poly(triaryl amine) (PTAA) organic semiconductor family has proved particularly sensitive to NO2, leading to solution- processed OFET- based NO2 sensors as reported by Das et al. [7]. Cui et al. [8] later reported a solution- processed copper phthalocyanine (CuPc) OFET sensor for NO2, but the poor solubility of CuPc demands for a toxic perfluorinated organic acid as solvent, resulting transistors show very small saturated drain currents even at high gate voltages (~100 nA at 60 V), and the reported limit- of- detection of 300 ppb is not particularly low. Anisimov et al. [9] have designed and tested a vacuum- evaporated OFET array for the analysis of ambient air with respect to identity and quantity of air pollutants NO2, NH3, H2S and SO2, based on OFETs using different metalloporphyrins (Cu/Zn/TiO- porphyrin) as organic semiconductors. .A review of OFET gas sensors is e.g. by Trul et al. [10].
As impressive as some of these works are, the preparation and electric characterisation of OFET sensor devices require formidable skills and instrumentation. A far simpler approach to gas detection is based on ‘chemiresistors’, i.e. devices that are (only) characterised for electric resistance while exposed to potentially contaminated air. Such chemiresistor sensors have been realised by common insulating polymer matrices filled with conductive ‘carbon black’ (CB) particles. The response to airborne pollutants is not by a direct impact on the conductivity of CB, but by the somewhat selective swelling of different polymer matrices when exposed to airborne pollutants, and the consequential increase in the separation of CB particles leading to reduced conductivity. The only moderate selectivity of swelling calls for the use of sensor arrays with a wide range of polymer matrices, and the subsequent analysis of the array’s response pattern with sophisticated methods. The historic ‘breakthrough’ contribution to this field was the work of Lewis et al. [11]. Such arrays are very useful for the identification and quantification of vapours rather than gases, i.e. molecules escaping into the headspace above a liquid that is thermodynamically stable at ambient pressure and temperature. Typical target analytes are saturated, unsaturated, and aromatic hydrocarbon vapours, chlorinated alkanes, alcohols, and ketones. A recent review is in [12].
However, air pollutant gases like NO2, NH3, H2S and SO2 are harmful at concentrations too low to elicit a strong swelling response and are better sensed by materials that respond directly by their electronic transport properties, like the organic semiconductors in OFET gas sensors introduced above. These have so far not often been applied in the simpler chemiresistor setting due to the high resistances associated with ungated organic semiconductors, and the consequential difficulties with their measurement. However, thanks to the progress of bespoke integrated circuit (IC) voltage followers, the measurement of very high resistances has recently become practically viable: Special engineering methods raise the input resistance of the commercially available voltage buffer Analog Devices AD8244 to an ultra-high value 10 TΩ [13]. This brings the measurement of resistances up to at least 100 GΩ into range with a small experimental footprint.
We therefore here study chemiresistor gas sensors based on copper(II)phthalocyanine, CuPc, a close chemical relative to the metalloporphyrins used by Anisimov et al. [9]. Beyond its widespread use as blue pigment, CuPc has been used as hole- transporting organic semiconductor, e.g. in organic solar cells [14]. We find that CuPc chemiresistors respond to a variety of harmful gases, including NH3, H2S and SO2 at low to moderate concentrations. In some cases response is ‘positive’, i.e. chemiresistor resistance R increases under exposure. We find a ‘negative’ response, i.e. reduced resistance R, only under NO2 and SO2, making our sensor selective for different types of gases. While these findings qualitatively agree with a prior report by Chia et al. [15], we find significant differences in the quantitative response to NO2. Our chemiresistor shows almost no response to NO2 in the concentration range of permitted environmental LVs (< 100 ppb), but responds very strongly above a threshold concentration of 87 ppb. This characteristic destins our sensor for workplace applications where there is a risk of NO2 leakage.
2. Experimental
2.1. Chemiresistor Preparation and Characterisation
Copper(II)phtalocyanine, CuPc, was sourced from Sigma-Aldrich (Cat No. 459712) and was thermally evaporated onto a sapphire (Al2O3) supporting substrate in a high vacuum thermal evaporator (Edwards 306A). We placed about 10 mg of CuPc in a quartz evaporation crucible and steadily increased the crucible heater current, giving a correspondingly steadily increasing evaporation rate, until all CuPc had evaporated from the crucible, resulting in a dark blue film on the sapphire substrate. The substrate carried interdigitated Ti/Au electrodes (n = 15 pairs with L = 50 μm channel length and W = 1 mm overlap, geometry factor n W/L = 15 x 1mm / 50 μm = 300). The large geometry factor somewhat compensates for the high resistivity of CuPc films. Subsequently, film thickness was determined using a Dektak surface profilometer, and film surface was imaged using a Bruker Dimension Icon AFM with a FastScan A tip and ScanAsyst mode. We then used ImageJ software [16] to analyse for grain size and surface roughness.
2.2. Generation of Pollutant Atmospheres for Calibration
Gases were bought in cylinders from air-liquid (Saudi Arabia) with supplier-certified gas concentrations as follows: H2S 20 ppm, NO2 10 ppm, SO2 9 ppm, NH3 200 ppm. They are diluted further using compressed high purity dry ‘zero’ air with the help of a GSM 3000 gas sensor measurement system [17], which is made of four mass flow controllers (MFCs) and a static mixer to ensure a complete mixing of two gases or dilution of a gas with air. We express analyte concentrations c dimensionless as partial pressure, p/patmosphere, which according to the ideal gas equation equals relative abundance. Typical c are in the range 10-9 (parts- per- billion, ppb) to 10-6 (parts- per- million, ppm).
2.3. Resistance Measurement and Quantification of Sensor Response
The resistance of our chemiresistors was monitored in real time under exposure to defined pollutant atmospheres using a high-resistance meter (Keithley 6517B) with an input impedance of 200 TΩ. To have a measurable resistance, the input voltage was increased up to 500 V. Film resistance prior to gas exposure was in the order (400 to 900) MΩ. For evaluation, data are presented as a graph resistance R vs. time t, R(t). The times at which gas exposure begins or gas concentration changes are indicated on the t axis. R(t) may drift somewhat even under zero exposure, and does not always immediately respond fully to gas exposure, but for a given gas concentration c approaches a limiting value with a response time constant, τ. We define a dimensionless response r(c) as this limiting resistance value at a given concentration c of a particular gas, divided by resistance prior to exposure, eq. 1:
(eq. 1) r(c) = R(c, t >> τ) / R(c = 0)
To quantify response time constant τ, we sometimes fit the approach to full response over time to an exponential law,
(eq. 2) R(c,t) = R(c, t = 0) + ΔR(c, t → ∞)exp(-t/τ)
With τ and ΔR(c, t → ∞) as fit parameters, and t = 0 defined by the onset of gas exposure. Eq. 2 also allows extrapolation of R(c, t >> τ) for eq. 1 as R(c, t = 0) + ΔR(c, t → ∞) in cases where τ is long and exposure was ended before reaching full response. We call response ‘positive’ for positive ΔR(c, t → ∞), i.e. r(c > 0) > 1, ‘zero’ for ΔR(c, t → ∞) = 0, i.e. r (c > 0) = 1, and ‘negative’ for negative ΔR(c, t → ∞), i.e. r(c > 0) < 1.
We define the ‘magnitude’ m of a response by a logarithmic metric, as in eq. 3:
e.g. we would consider the magnitude of r(c) = 1 as zero since resistance has not changed, and the magnitudes of both r(c) = 10 and r(c) = 0.1 as equal to 1, and therefore equal to each other. This is because it is an arbitrary choice to evaluate resistance rather than conductance, in which case all responses would be inverted. The magnitude metric eq. 3 is indifferent to this arbitrary choice.
(eq. 3) m(c) = |log r(c)|
3. Results and Discussion
3.1. CuPc Film Morphology
Dektak surface profilometer characterisation of CuPc films prepared as described in part 2a returns an average film thickness of ~ 1 μm and a rms surface roughness of 90 nm, i.e. ~ 9% of film thickness. An AFM image of the film surface is shown in Figure 1:
Analysis of Figure 1 with ImageJ software returns an average grain size of about 140 nm. Our CuPc deposition conditions and resulting morphology show a number of differences to the evaporated CuPc films studied by Chia et al.[15]: They used a silicon / silicon oxide substrate rather than sapphire (Aluminium oxide) and a constant rather than increasing deposition rate. Their final film thickness was only (100 … 200) nm, and their films have a significantly smoother surface with rms roughness of only vs. (3 … 4) nm. We also obtain significantly larger grain sizes. Chia et al. do not report grain size, but when we analyse their Figure 1 with ImageJ software, we find an average grain size of 44 nm / 53 nm for their films of 100 nm / 200 nm thickness.
3.2. CuPc Chemiresistor Response to H2S and NH3
We first tested CuPc chemiresistors under the harmful gases H2S and NH3 at concentrations in the order 1 ppm, which represent typical environmental pollution levels.
Figure 2 shows a positive response (r >1) of CuPc chemiresistors to the studied gases. Table 1 summarises a quantitative evaluation.
We find the response is slow with time constants in the order of (0.5 to 1) hr. Recovery after the end of exposure is similarly slow but was not quantified in detail. The magnitude of responses is relatively small, making it difficult to distinguish a response to a gas from long term drift in the absence of analyte gas. Some such drift is evident from Figure 2. CuPc chemiresistors are therefore not well suited for the detection of ammonia and hydrogen sulfide. Precise comparisons to the CuPc chemiresistors reported by Chia et al. [15] are difficult because they did not wait for, or extrapolate to, full response under a given analyte concentration. However, a rough estimate for the response of their device to 2 ppm NH3 can be made from their Figure 4a. They also find some drift in the absence of analyte odour and a positive response (increased resistance) under exposure, with faster τ (~ 2 min.) but smaller magnitude (m ~ 0.03). The faster response is likely due to their use of thinner films.
3.3. CuPc Chemiresistor Response to SO2 and NO2
We find the response to SO2 and NO2 differs qualitatively from the response to H2S and NH3 studied previously. Namely, response is now ‘negative’, r < 1, which makes CuPc chemiresistors selective between (H2S or NH3) vs. (SO2 and NO2). Figure 3 shows the response of a CuPc chemiresistor exposed to 180 ppb SO2 atmosphere. This is significantly larger than the 24 hr average air quality standard LV in the EU of 125 μg/m3 = 44 ppb [1].
Response is now clearly ‘negative’, i.e. r < 1, albeit the response is only somewhat larger than noise levels, and is again slow with time. Fitting the approach with time to ΔR(t →∞) with eq. 2 fits less well than previously in 3a, but still allows an estimate of τ = 24 min. We find a response of r(180 ppb) = 0.983, i.e. a response magnitude of m = 0.0074. While this is clearly qualitatively different from previous results in the sense of a ‘negative’ (r < 1) rather than ‘positive’ (r > 1) response, the response of the CuPc chemiresistor is both too slow, and of too small magnitude, for its use as a sensor for harmful levels of SO2 pollution. On the other hand, typical environmental levels of SO2 pollution will not interfere with, or deliver false positives for, the detection of other pollutants.
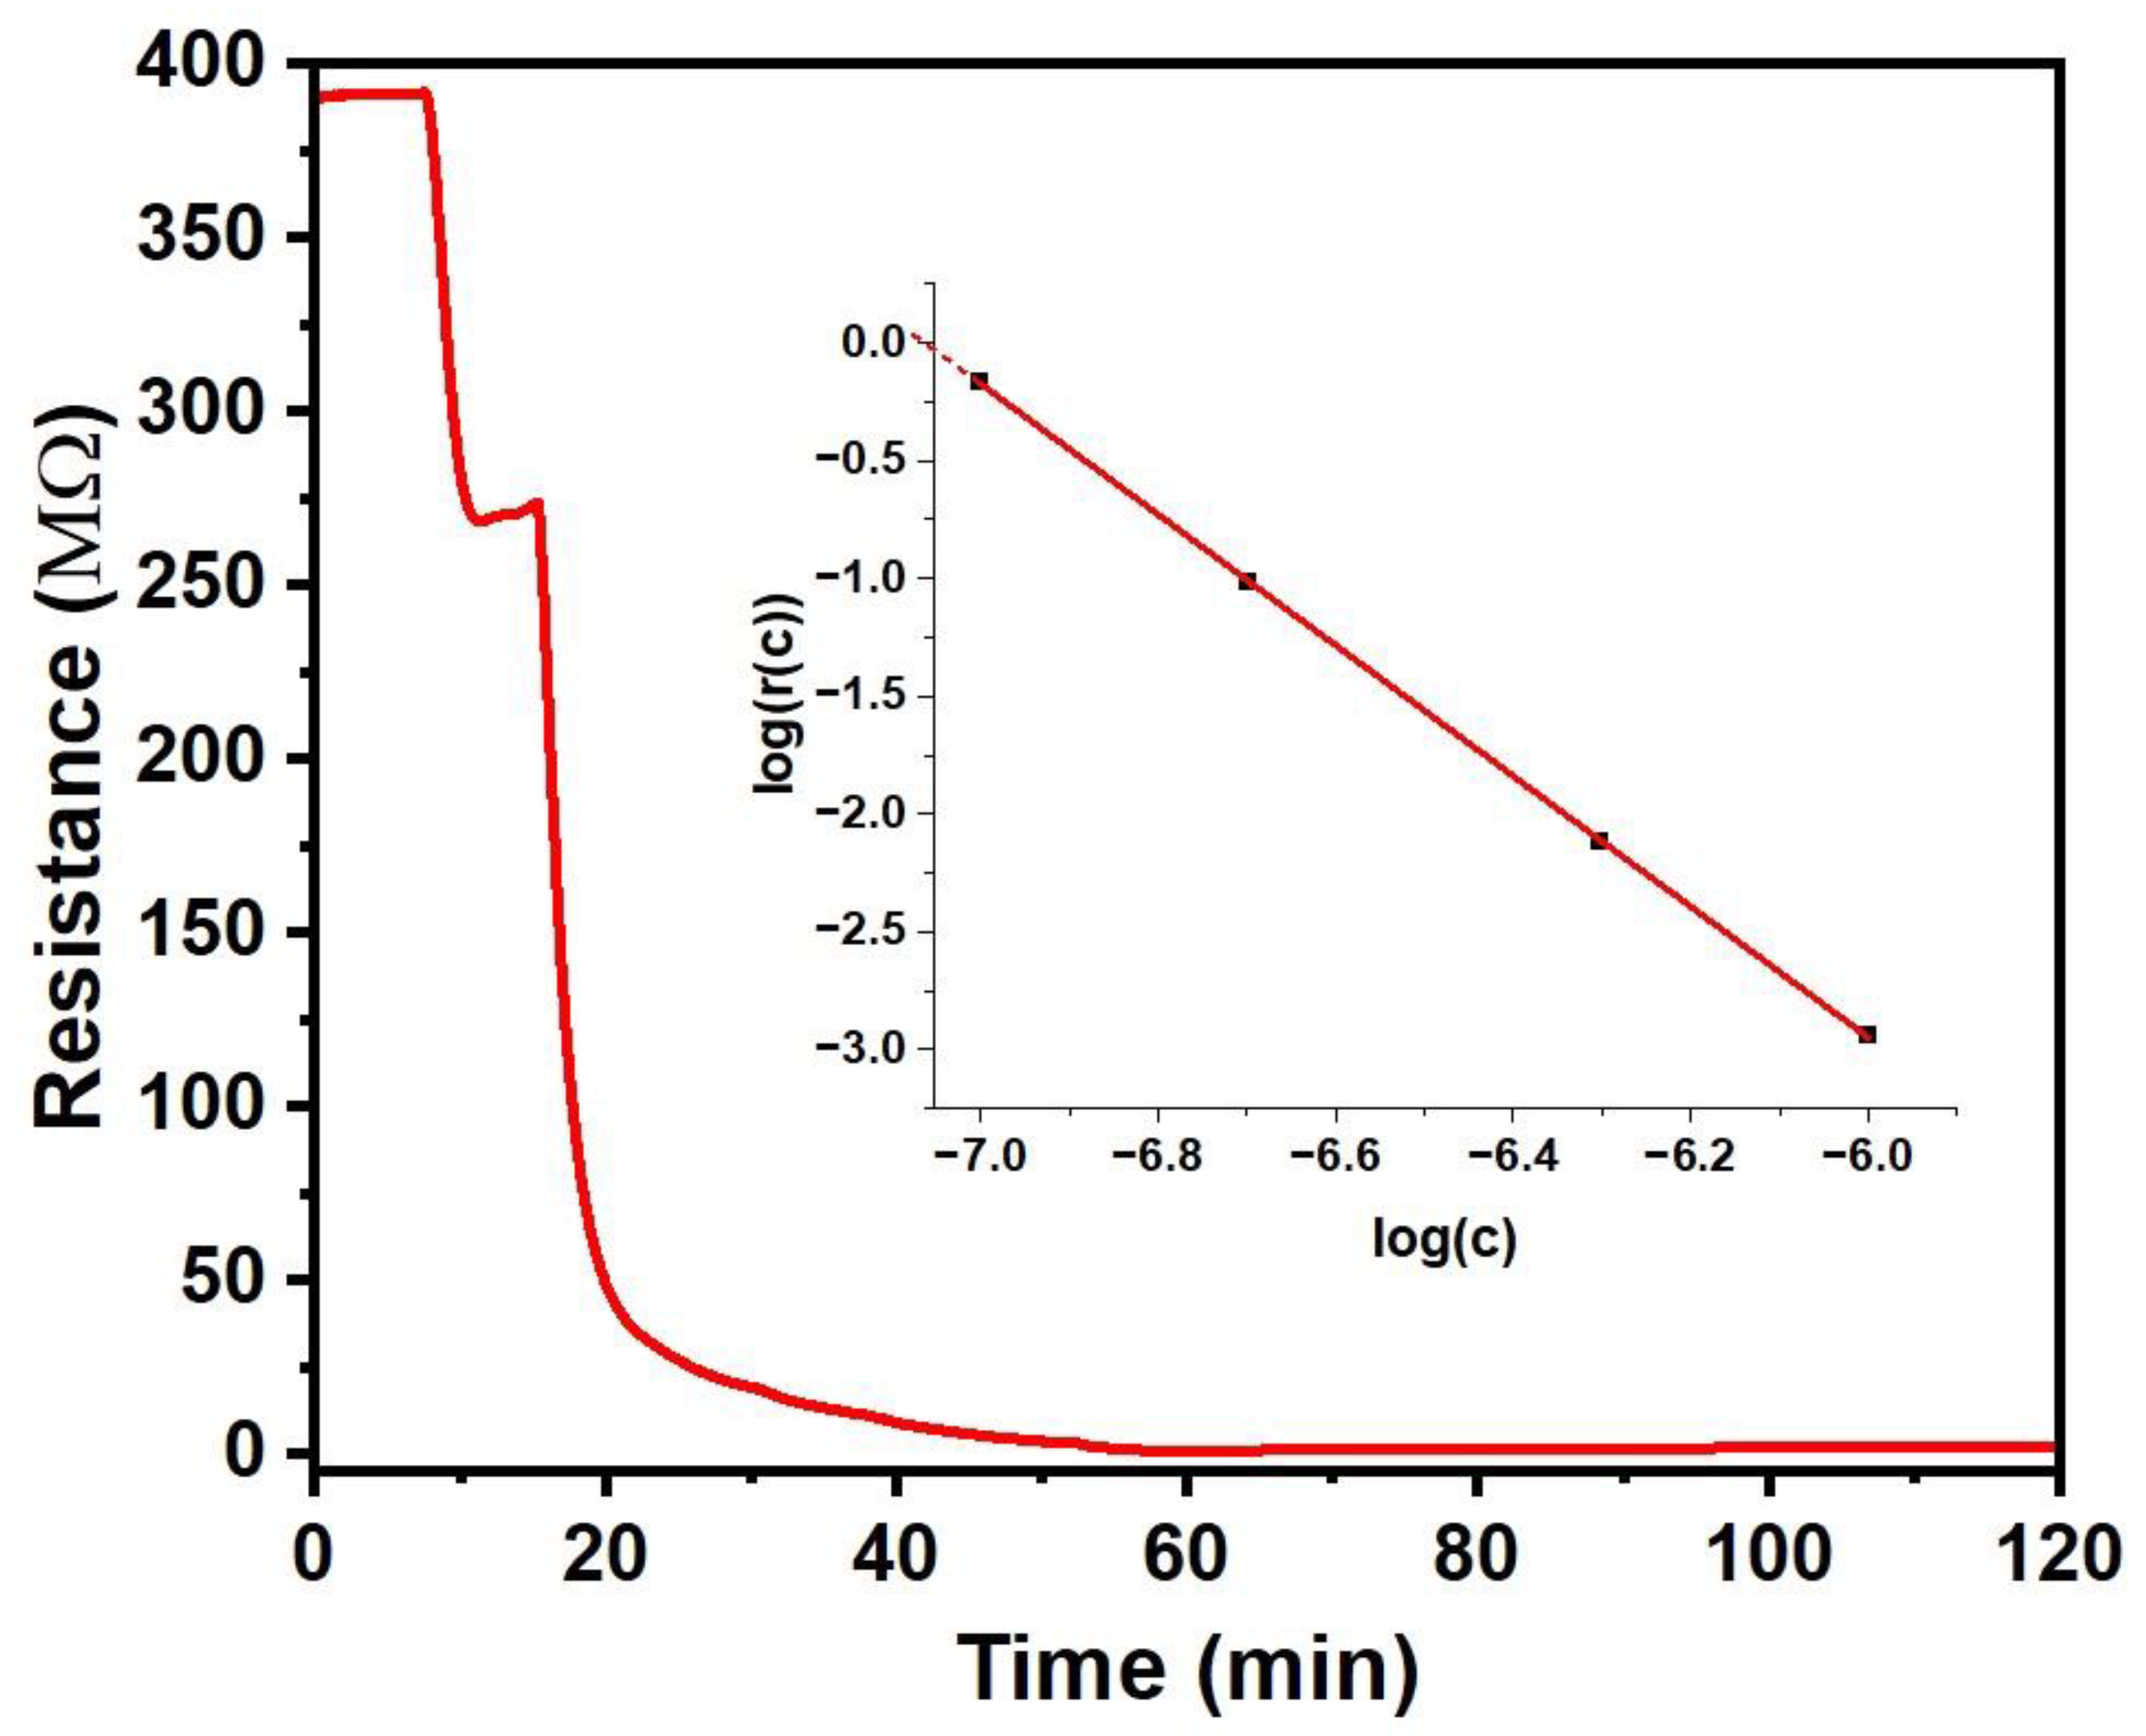
We find a much stronger ‘negative’ response to NO2, which we have therefore studied under a range of concentrations from 100 ppb to 1 ppm, results in Figure 3:
We find a strong negative response (r << 1) under exposure to NO2 concentrations of 100 ppb and more. The reduced resistance is most likely due to oxidative doping of CuPc by the strong oxidising agent NO2, making far more charge carriers available for conduction. Response also develops significantly quicker than for the vapours reported in part 3a. making a fit to an exponential approach as in eq. 2 unnecessary to calculate response r(c) with eq. 1. The inset to Figure 4 shows response magnitude m = |log r(c)|r(c) against a logarithmic c scale. For c = 100 ppb and above, m vs. log c is fitted well by a straight line, as given in eq. 4a. Extrapolating to below c = 100 ppb (log c = -7) suggests zero response, i.e. r(c) = 1, for log c = -7.06, i.e. c = 87 ppb. Since r(c) = 1 for c = 0 as well by definition, the CuPc chemiresistor does not respond for NO2 concentrations below and up to ~ 87 ppb. We, therefore, take the 87 ppb threshold as a limit-of-detection (LoD). However, for NO2 concentrations c = 100 ppb and more, we find a strong response that is well described by a power law with an exponent close to inverse third power in c. For c = 1 ppm (log c = -6), resistance has dropped 870-fold, i.e. the magnitude of response at 1 ppm in the sense of eq. 3 equals 2.94. This far exceeds the magnitudes observed for the ‘positive’ responses in part 3a, and far exceeds any drift. The line in the inset Figure 4 is given by eq. 4a, wherein response magnitude m is as defined in eq. 3. Eq. 4a may be inverted into eq. 4b to calculate NO2 concentration, c, from measured r(c) for c > 87 ppb:
(eq. 4a) m = - log r(c) = 2.774402 log c + 19.59403 (c > 87 ppb)
(eq. 4b) c = 87 ppb (1/r)0.36043 (c > 87 ppb)
Following exposure to 1 ppm NO2, recovery when purging with clean air is very slow and can take several hours, at least two orders- of- magnitude slower than response. It is typical for sensors with strong responses to recover only slowly, accelerated recovery would require heating.
Figure 4.
Response of CuPc chemiresistor to NO2. Inset: Response r(c) shown in a logarithmic plot, log r(c) = - m, showing a power law between r and c. The red line is given by eq. 4a. .
Figure 4.
Response of CuPc chemiresistor to NO2. Inset: Response r(c) shown in a logarithmic plot, log r(c) = - m, showing a power law between r and c. The red line is given by eq. 4a. .
Although both we here, and Chia et al. [15], used vacuum- evaporated CuPc chemiresistors for the detection of NO2 (and other gases), we find remarkable differences in the observed response characteristics. Similarly as observed by Chia et al, we find that response to NH3 and NO2 are distinguished by their different sign, with NH3 leading to an increase / NO2 to a decrease in film resistance. However, the response characteristics to NO2 display remarkable differences. Qualitatively, the ‘threshold’ behaviour observed here is in fact also hinted at in the data shown by Chia et al. on their Figure 3b, with slightly smaller threshold. However, it is not recognised as such since the response at low c has not been investigated. Quantitatively, however, above threshold we here observe a response that is orders- of- magnitude larger than reported by Chia et al.. Their response characteristics are fitted linearly to increasing c with rather shallow slope, while we find a power law with an exponent 2.77. For example, the magnitude of their response at 500 ppb NO2 in the sense of our eq. 3 is only m = 0.0645, while we find a response with magnitude m = 2.12. Another difference to the characteristics observed by Chia et al. [15] is in the recovery after exposure, where their recovery is (only) ~ 2 times slower than response, not 2- orders- of- magnitude slower as for our films.
4. Conclusions
We here present a selective chemiresistor sensor for NO2 based on a thin film of the organometallic semiconductor copper(II)phthalocyanine (CuPc). The sensor is easily manufactured, and can be read by a simple resistance (R) measurement. R is high but within the measurement range of modern voltage buffer ICs like the AD8244 [13]. The CuPc film shows small to moderate response under exposure to several harmful gases. CuPc responds with an increase of resistance (‘positive’ response) to NH3 and H2S, and with a negative response to SO2 and NO2. This gives our sensor some selectivity as the sign of response allows us to discriminate between gases. The response to SO2 is very low up to 180 ppb, r(180ppb) = 0.983, magnitude m = 0.0074, when 180 ppb is already significantly larger than permitted environmental SO2 pollution levels. Common environmental pollutants will therefore not interfere with NO2 detection. Sensitivity to NO2 also is low or zero in the range of permitted long-term or permanent exposure limits, with a limit-of-detection (LoD) of ~ 87 ppb vs. EU permanent exposure limit of 21 ppb [1]. Our sensor is therefore not well suited for environmental monitoring. However, 87 ppb NO2 acts as a threshold above which sensitivity becomes very high, presumably due to the doping of CuPc by the strongly oxidising NO2. Our sensor is therefore destined for industrial settings, particularly in the nitrogen fertiliser industry where NO2 leakage to concentrations far above typical environmental pollution levels poses a clear and present danger. The response characteristic of our sensor is well adapted to warn of such leaks: There is near-zero response to typical and sometimes acceptable environmental ‘background’ NO2 levels < 87 ppb. But in case of an NO2 leak, there will be a ‘shrill’ warning: E.g. at 1 ppm NO2, film resistance R is reduced ~ 870 times (response magnitude m = 2.94) vs. the un- exposed sensor within 50 min. While 1 ppm NO2 is far above ‘background’ environmental pollution, it is still well below immediately life-threatening levels, e.g. the short-term NO2 ‘emergency exposure limit’ (EEL) is 10 ppm for 1 hour [3]. Therefore, our sensor gives a clear warning when there still is time for staff to evacuate. As such an alarm hopefully will be a rare event, recovery of sensors after such exposure is not required: Once exposed to ‘alarm’ levels, sensors shall be exchanged for pristine replacements.
The response to NO2 reported for our chemiresistors here are significantly larger than in the previous report by Chia et al. [15], albeit they used the same organometallic semiconductor, CuPc. We note a few significant differences in the preparation of semiconducting films, with consequential differences in morphology between our films and those reported by Chia et al., cf. part 3a. While we can not give a detailed ‘cause- and- effect’ explanation for the much enhanced response observed by us, we conclude that our morphology enhances chemiresistor response. It is well established that charge transport (and other properties) in a given organic semiconductor strongly depend on its morphology, detailed reviews are e.g. in Stingelin et al. [18] and Bi et al. [19].
References
- EU air quality standards. Available online: https://environment.ec.europa.eu/topics/air/air-quality/eu-air-quality-standards_en (accessed on 18 March 2025).
- Commission Directive (EU) 2017/164 of 31 January 2017 establishing a fourth list of indicative occupational exposure limit values pursuant to Council Directive 98/24/EC, and amending Commission Directives 91/322/EEC, 2000/39/EC and 2009/161/EU (Text with EEA relevance. ). Official Journal of the European Union. p. 115-120.
- Nitrogen Dioxide. Available online: https://www.cdc.gov/niosh/idlh/10102440.html.
- Noh, H.L. , et al., Chromogenic detection of hydrogen sulfide using squarylium-based chemosensors. Spectrochimica Acta Part A: Molecular and Biomolecular Spectroscopy 2020, 239, 118457. [Google Scholar] [CrossRef] [PubMed]
- Wedge, D.C. , et al., Real-time vapour sensing using an OFET-based electronic nose and genetic programming. Sensors and Actuators B: Chemical 2009, 143, 365–372. [Google Scholar] [CrossRef]
- Hague, L. , et al., Simplified Real-Time Organic Transistor Characterisation Schemes for Sensing Applications. Science of Advanced Materials 2011, 3, 907–911. [Google Scholar] [CrossRef]
- Das, A. , et al, A Nitrogen Dioxide Sensor Based on an Organic Transistor Constructed from Amorphous Semiconducting Polymers. Advanced Materials 2007, 19, 4018–4023. [Google Scholar] [CrossRef]
- Cui, Z. , et al., Solution-processed filamentous copper phthalocyanine films for enhanced NO2 gas sensing at room temperature. New Journal of Chemistry 2024, 48, 1254–1263. [Google Scholar] [CrossRef]
- Anisimov, D.S. , et al., Fully integrated ultra-sensitive electronic nose based on organic field-effect transistors. Scientific Reports 2021, 11, 10683. [Google Scholar] [CrossRef] [PubMed]
- Trul, A.A., E. V. Agina, and S.A. Ponomarenko, Gas Sensors Based on Conjugated Oligomers and Polymers as Promising Sensitive Elements for Toxic Gases Monitoring in the Atmosphere. Polymer Science, Series B 2021, 63, 443–458. [Google Scholar] [CrossRef]
- Lonergan, M.C. , et al., Array-Based Vapor Sensing Using Chemically Sensitive, Carbon Black−Polymer Resistors. Chemistry of Materials 1996, 8, 2298–2312. [Google Scholar] [CrossRef]
- Rath, R.J. , et al., Chemiresistive Sensor Arrays for Gas/Volatile Organic Compounds Monitoring: A Review. Advanced Engineering Materials 2023, 25, 2200830. [Google Scholar] [CrossRef]
- AD8244. Available online: https://www.analog.com/en/products/ad8244.html.
- Pindolia, G. , et al., Fluorinated copper phthalocyanine as an electron transport material in perovskite solar cell. International Journal of Energy Research 2022, 46, 15127–15142. [Google Scholar] [CrossRef]
- Chia, L.S. , et al., Interaction of Copper Phthalocyanine with Nitrogen Dioxide and Ammonia Investigation Using X-ray Absorption Spectroscopy and Chemiresistive Gas Measurements. ACS Omega 2019, 4, 10388–10395. [Google Scholar] [CrossRef] [PubMed]
- ImageJ. Available online: https://imagej.net/ij/.
- GSM 3000. Available online: www.phocos.co.kr.
- Virkar, A.A. , et al., Organic Semiconductor Growth and Morphology Considerations for Organic Thin-Film Transistors. Advanced Materials 2010, 22, 3857–3875. [Google Scholar] [CrossRef] [PubMed]
- He, Z. , et al., Manipulate organic crystal morphology and charge transport. Organic Electronics 2022, 103, 106448. [Google Scholar] [CrossRef]
Figure 1.
AFM images of CuPc films deposited on sapphire substrate. a) large size grains. b) 3D image showing rough surface.
Figure 1.
AFM images of CuPc films deposited on sapphire substrate. a) large size grains. b) 3D image showing rough surface.
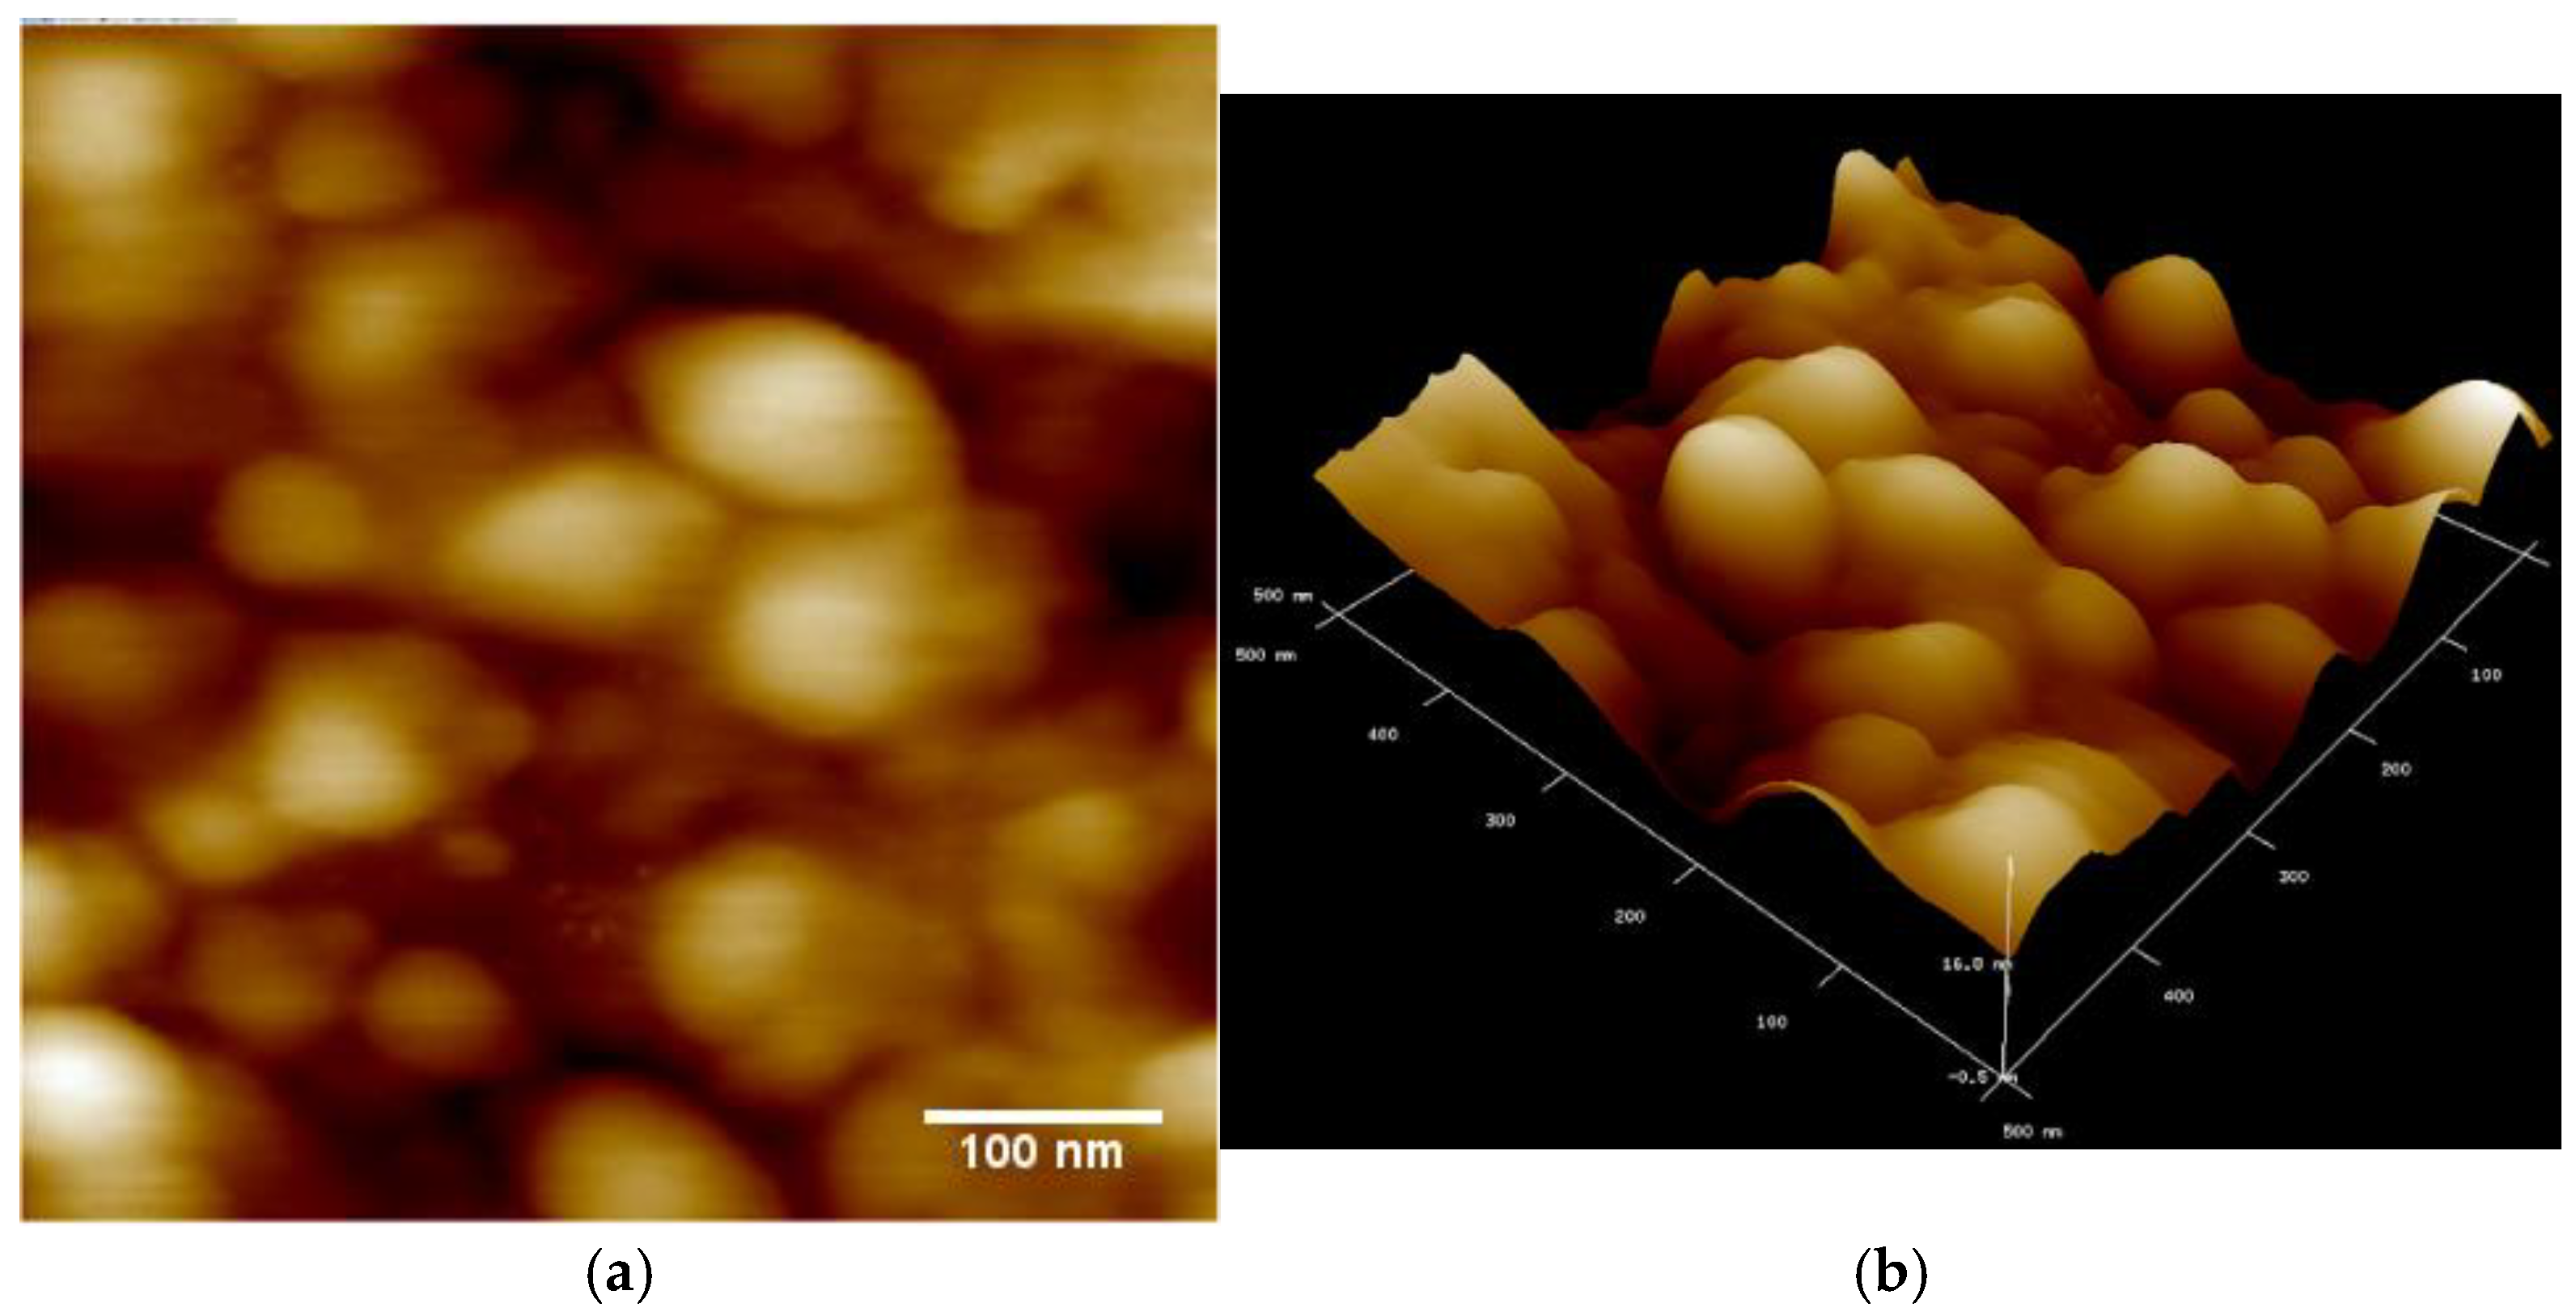
Figure 2.
Exposure of CuPc chemiresistors to a: Ammonia, NH3; b: Hydrogen sulfide, H2S.
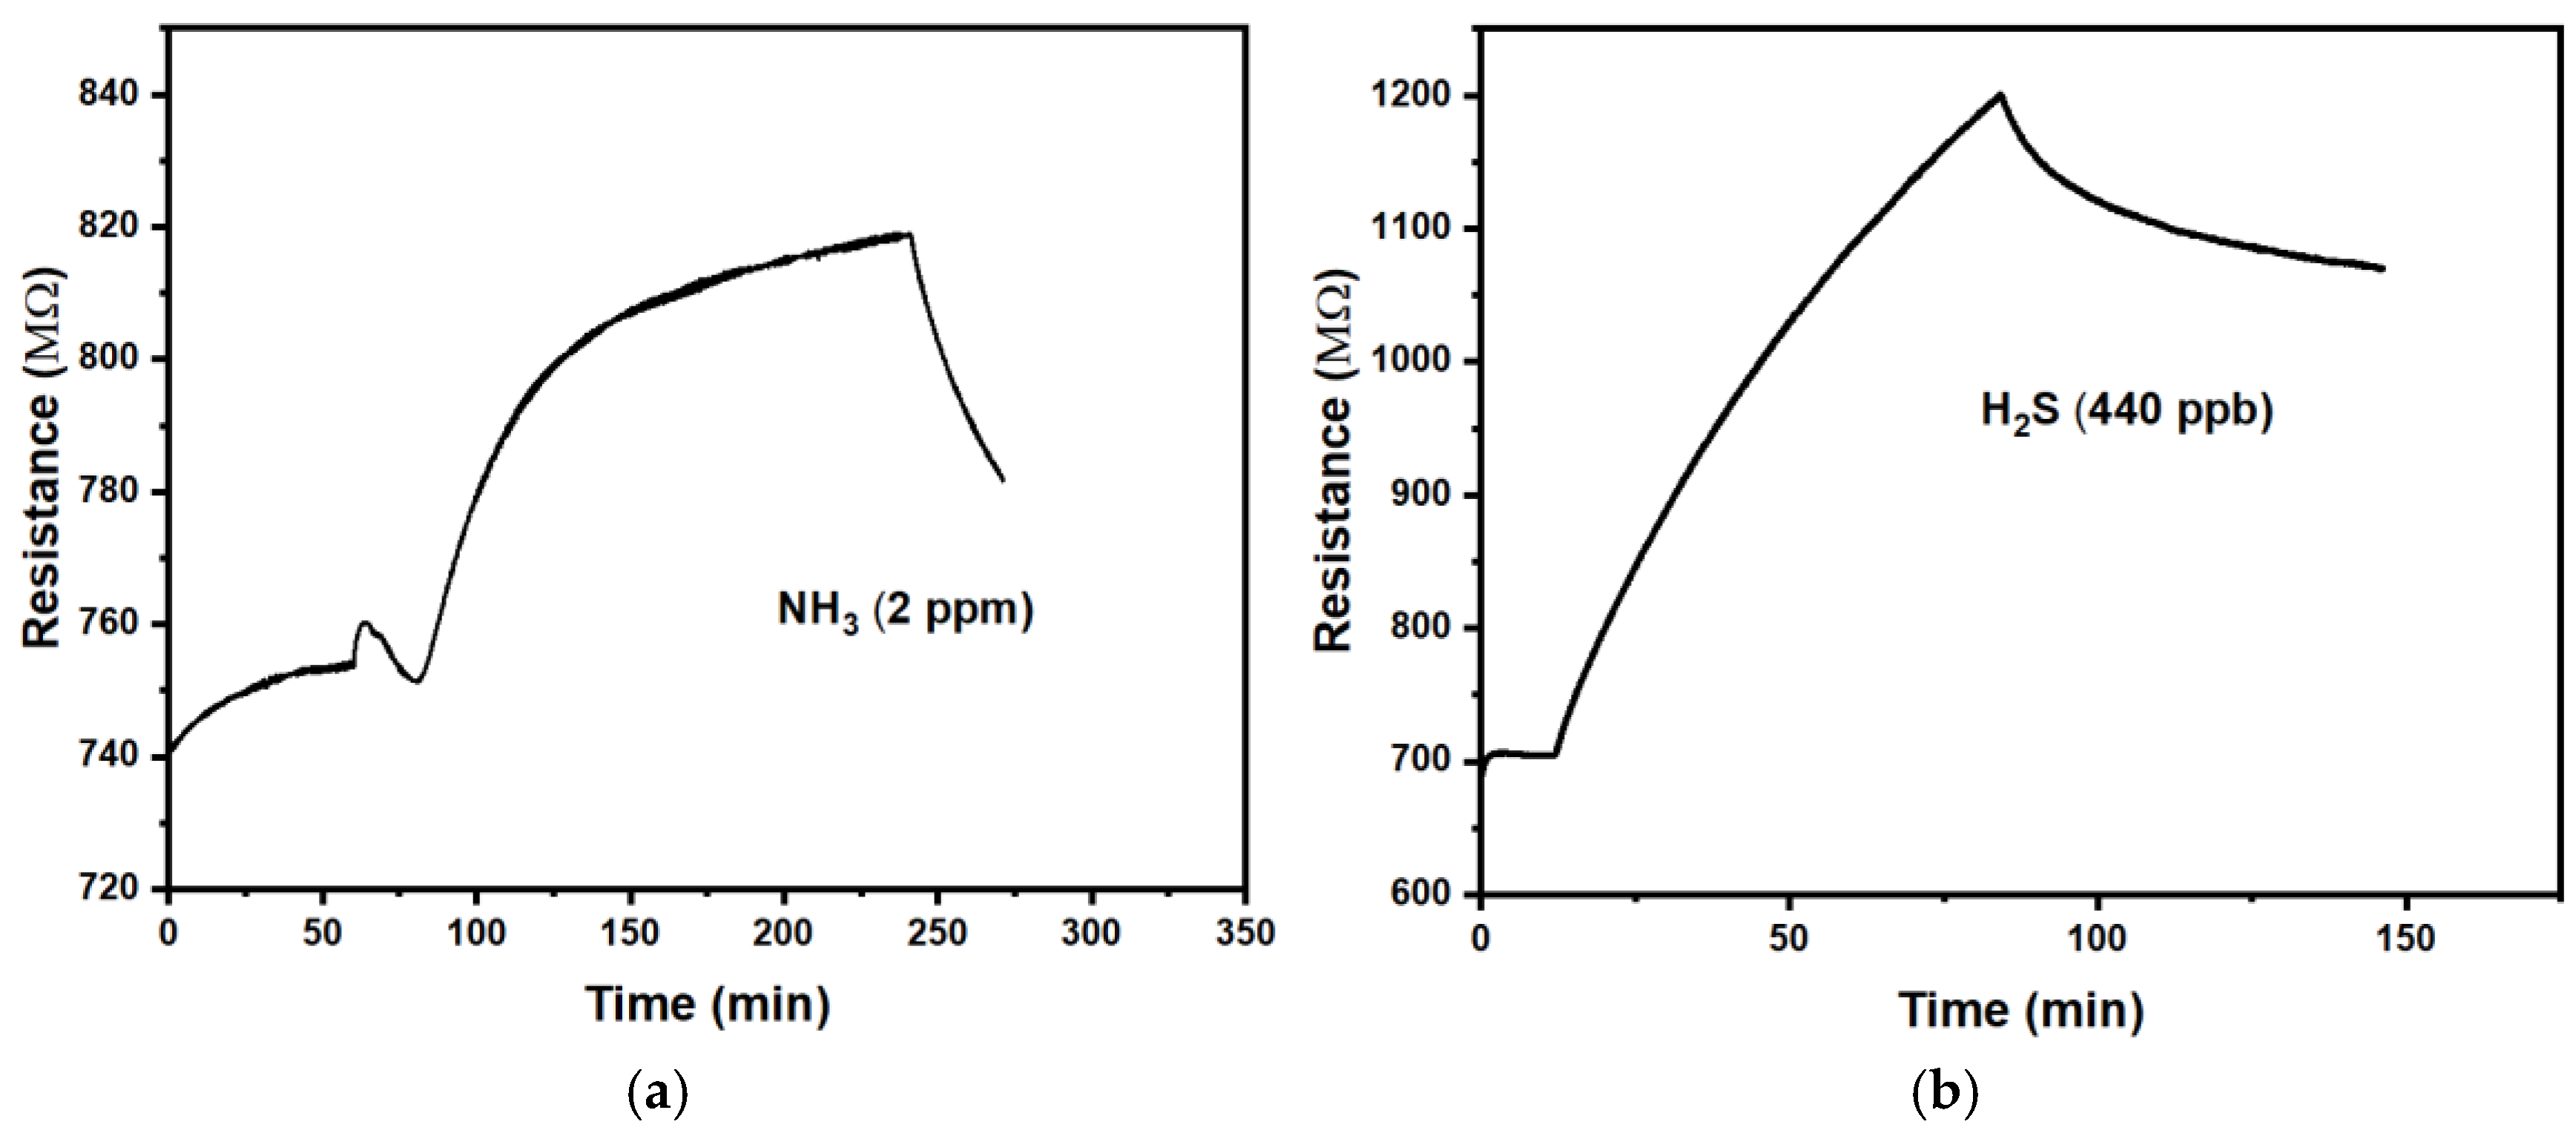
Figure 3.
Response of CuPc chemiresistor to 180 ppb SO2. .
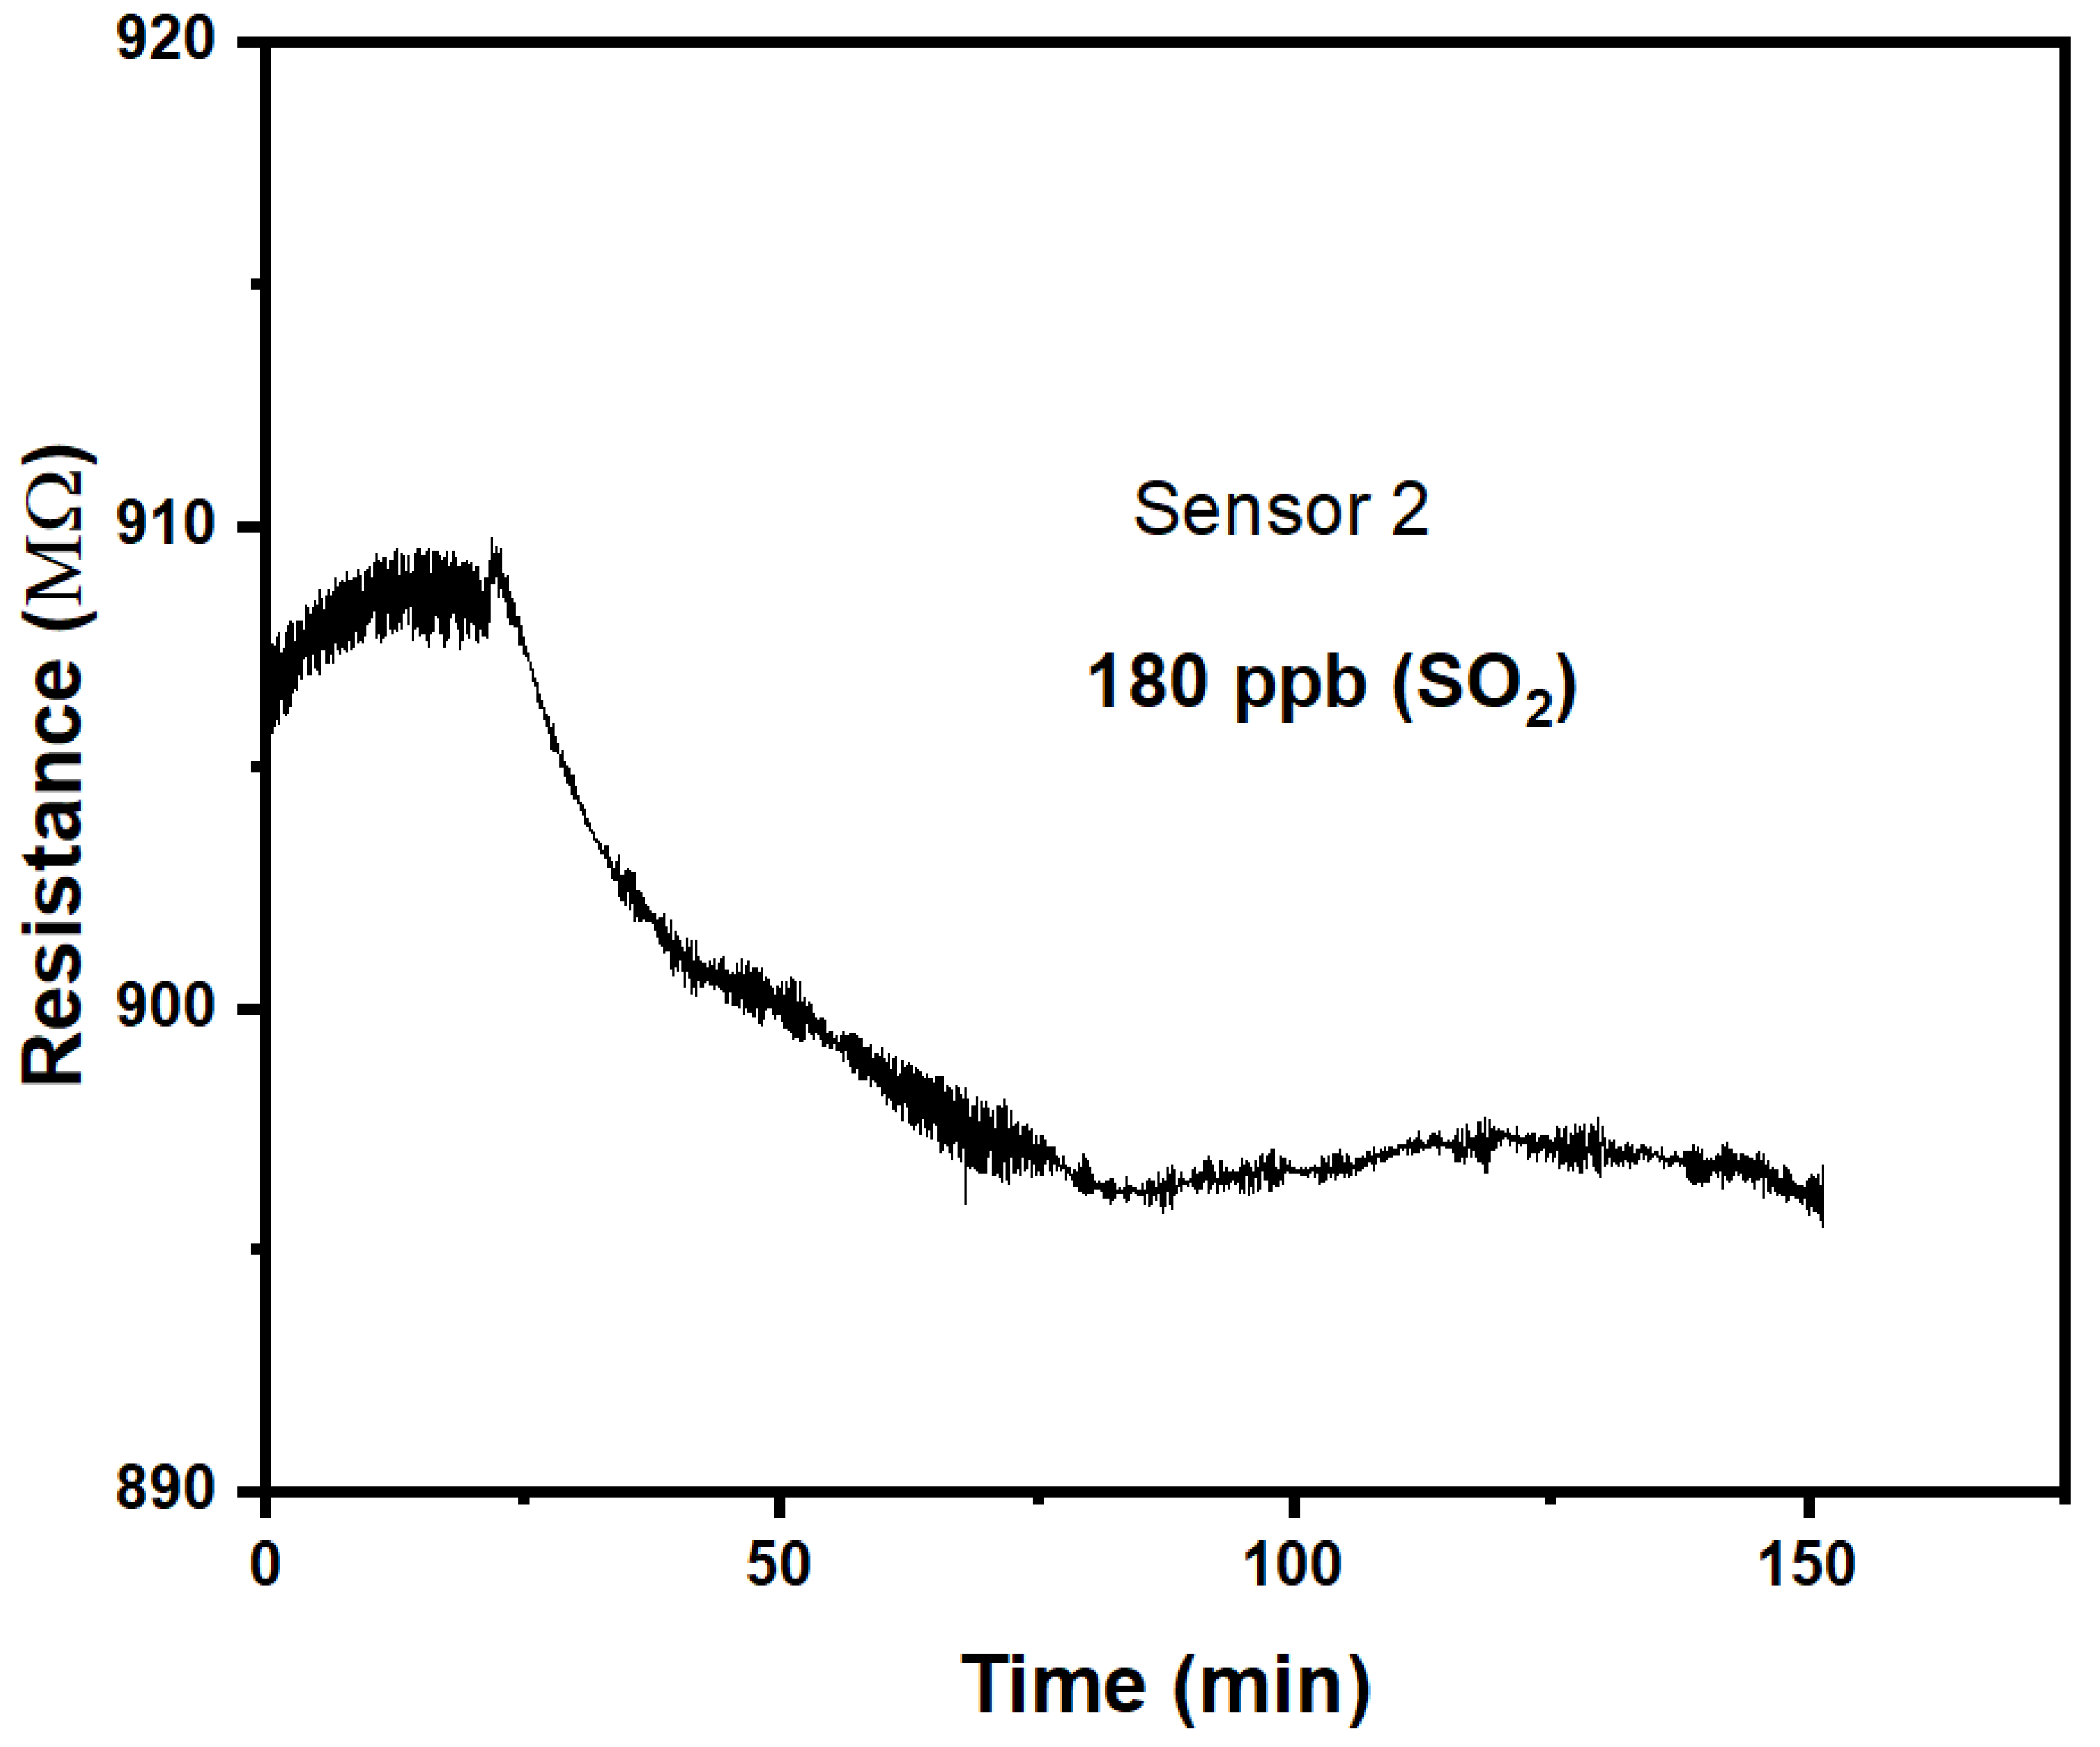

Table 1.
Summary of response characteristics for CuPc chemiresistors under H2S and NH3. Time constant τ and response magnitude m are defined in eq.s 2 and 3, respectively.
Table 1.
Summary of response characteristics for CuPc chemiresistors under H2S and NH3. Time constant τ and response magnitude m are defined in eq.s 2 and 3, respectively.
| Gas | c [ppm] | τ [min] | m |
|---|---|---|---|
| H2S | 0.44 | 63.1 | 0.31 |
| NH3 | 2 | 28.2 | 0.03 |
Disclaimer/Publisher’s Note: The statements, opinions and data contained in all publications are solely those of the individual author(s) and contributor(s) and not of MDPI and/or the editor(s). MDPI and/or the editor(s) disclaim responsibility for any injury to people or property resulting from any ideas, methods, instructions or products referred to in the content. |
© 2025 by the authors. Licensee MDPI, Basel, Switzerland. This article is an open access article distributed under the terms and conditions of the Creative Commons Attribution (CC BY) license (http://creativecommons.org/licenses/by/4.0/).
Copyright: This open access article is published under a Creative Commons CC BY 4.0 license, which permit the free download, distribution, and reuse, provided that the author and preprint are cited in any reuse.


