Submitted:
25 March 2025
Posted:
26 March 2025
You are already at the latest version
Abstract
The aim of this study is twofold. First, it constructs an investor attention index from seven variables: abnormal trading volume, extreme returns, past returns, nearness to the 52-week high, nearness to the historical high, google search volume, and mutual funds inflow and outflow, using principal component analysis (PCA) approach. Second, the study examines the impact of the investor attention index on the KSE-100 index returns. For this purpose, we collect monthly data from January 2000 to June 2020. The PCA identified four components: PCA1 comprises extreme returns, past returns, google search volume, and mutual funds inflow; PCA2 consists of nearness to the 52-week high, abnormal trading volume, past returns, and Google search volume; PCA 3 includes nearness to the historical high, abnormal trading volume, past returns, and google search volume, and PCA 4 comprises nearness to the 52-week high, extreme returns, and mutual funds inflow and outflow. The PCA1 and PCA3 negatively but significantly impact KSE-100 index returns. Consequently, PCA2 and PCA4 positively and significantly impact KSE-100 index returns. The findings of this study have important implications for policymakers, investors, and mutual fund managers to understand the patterns of investor attention, creating policies and procedures to make the financial markets more transparent and protect the investor’s rights.
Keywords:
investor attention
; stock market returns
; KSE-100 index
; and principal component analysis
1. Introduction
The dynamics of investor attention flow to and concentration on individual investments; the subsequent returns on these stocks have become an area of interest in behavioral finance. Behavioral finance has transformed the thinking process of investors and researchers, mainly because of the availability of data and methodological techniques to quantify investor’s sentiments. The current study elucidates the effect of this process in the context of the KSE-100 Index, the most important stock index in Pakistan. More importantly, investor attention measures investors’ attention to a particular stock or the overall market. This concept is more relevant in the Pakistan stock market primarily because of the structural reforms, changes in the investment environment, recent volatility, and performance.
In Pakistan, initially, there were three stock exchanges: the Karachi Stock Exchange (KSE), the Lahore Stock Exchange (LSE), and the Islamabad Stock Exchange (ISE). The separate structure of each stock exchange raised a conflict of interest that threatened the investors as all three exchanges had no mutual coordination and were functioning separately in terms of trading interfaces, indexes, and listing criteria. Hence, the government of Pakistan introduced the Stock Exchanges Act in 2012, integrated all three stock exchanges into one operation, and formed the “Pakistan Stock Exchange” (PSX) on January 11, 2016. It became functional with the beginning of 559 listed companies from 35 sectors, including domestic and foreign companies. The history of PSX has witnessed a significant improvement over the time. It started with just five listed companies with a total paid-up capital of Rs 37 million. Then, in the 1960s, 81 companies were added with a free-float capitalization of Rs 1.8 billion. The PSX witnessed an aggregate market capitalization of Rs 7.692 trillion as of December 31, 2018. The performance of the KSE-100 index is reflected as a barometer to evaluate the country’s economic progress.
Figure 1 shows the KSE-100 price index data from December 2008 through October 2019. The data was extracted from Thomson Reuters DataStream. The figure shows that the Index witnessed a huge financial crash in 2008, wherein the market stopped working for four months after a minor crash in 2005. The military ruling ended in 2008, and the power was transferred to a civil democratic government. After the financial crisis of 2008, many discussions were made to make changes in the stock market. Finally, a new Act was rooted in 2012 named the Corporatization, Demutualization, and Integration Stock Exchanges Act. The PSX was reflected as the best performer among the world’s equity markets from 2016 to 2019. Especially in 2016, it remained the fifth-best stock market globally. It is also considered as an emerging secondary market by the FTSE. In 2017, it is again classified by MSCL (Morgan Stanley Capital International) and NBSP as an emerging market. The economy witnessed a boom, and PSX performed best due to high Chinese Investment in CPEC projects from 2013 to 2018. However, in May 2017, the market showed a bearish trend, and the Index dropped by 28% as an association of China purchased 40% of the shares for $ 85 million. The year 2018 showed mixed trends, while PSX’s performance fell in August 2019 due to the US-China war and the Kashmir dispute between Pakistan and India (Shafique et al., 2019).
Interestingly, in 2020, out of 61 stock exchanges in the world, the PSX secured its position as the fourth best-performing stock exchange in the world and the best-performing stock market in Asia despite the COVID-19 outbreak. In addition, PSX is recognized as one of the premier emerging markets globally, characterized by a high growth rate and a highly liquid environment. However, at the same time, this market is also culturally sensitive and unstable due to macroeconomic differences and political instability (Ghani et al., 2022; Joyo & Lefen, 2019).
The current structure of the financial market of Pakistan provides the opportunity to conduct a wide range of interesting research, but it also leads to several problems. Even though sharp improvements and progressive attempts have been made to increase the depth and stability of the market, more research needs to be done on the PSX compared to developed markets. This gap offers the necessary background to analyze the role of behavioral factors like investor attention in the historically volatile market surrounding the stocks. Research shows that Pakistan’s stock market depends strongly on macroeconomic shocks. Therefore, it is anticipated that more effort must be made to understand the behavior of investors in this regard (Ahmad & Ramzan, 2016).
There is also evidence of heightened investor attention relating to stock returns because of the mirror-neighbors, decision heuristics, and self-organizing map information available in Pakistan’s capital market. Generally, extant finance theories rely on assumptions about self-interest and wealth maximization. However, as obtained from the behavioral finance theory, investors act in ways that can be deemed irrational due to psychological factors and the inability to control their emotions, such as overconfidence, fear, and greed (Gill & Bajwa, 2018). In Pakistan’s case, these behavioral factors, such as heuristics, herding effect, and market variables, have a meaningful influence over the investment decision.
The main motivation behind this study is to shed light on the growing and ever-important phenomenon of investors’ attention in the Pakistani stock market by systematically analyzing the attention proxies affecting future stock returns. In Pakistan, a few studies on investors’ sentiments are available. This study contributes to the body of knowledge by addressing the investor’s attention constructed from the context of the KSE-100 Index and its effects on subsequent returns. It builds upon prior research in the following ways: The PCA methodological technique is used to construct the attention index. It will help policy-makers understand the patterns of investor attention, creating policies and procedures to make the financial markets more transparent and protect the investor’s rights. From the study, market participants could be able to identify key strategic directions that could assist them in predicting market conditions. In addition, appropriate investment decisions could be of considerable benefit and a competitive advantage in the market. It would help academic scholars in behavioral finance and open a new perspective. Besides this, the researcher would look at the signals that affect the performance of the KSE-100 index, effectively managing their portfolios and risk.
The main finding of this research showed that the PCA3 index has negatively and significantly predicted the stock market returns of the KSE-100 index among all four PCA components. Further, 33.5% of the variability in the stock’s return of KSE-100 is explained by the PCA attention index, portraying the possibility of several other exogenous and endogenous factors influencing stock market performance. In Pakistan, macroeconomic indicators, political instability, and lack of financial literacy have affected investors' market sentiments.
2. Literature Review
The theory of efficient markets argues that asset prices absorb the information fully (Fama, 1970). This hypothesis necessitates a condition for investors to be attentive to the available information. In light of this, Merton (1987) concluded in his study that many resources are needed for gathering information on stocks. Therefore, individual investors prefer to save resources by choosing only bits of financial information in their best interest. Kahneman (1973) and Pashler et al. (2001) stated that due to the minimal cognitive capabilities, investors could manage to grasp only limited attention. That attracted the attention of economics and finance scholars and industry experts to discover the theoretical and empirical significance of investor’s attention on the prices of the stocks.
Two ways are identified in the theories through which prices are affected. Informed traders are the first path through which the market learns (Hirshleifer & Teoh, 2003; Huang & Liu, 2007; Peng & Xiong, 2006). The second path is when attention fascinates uninformed traders (Barber & Odean, 2008). The authors documented that individual investors require more attention towards stock prices than institutional investors. It is because a buy decision requires an average investor to gauge the worthiness of thousands of instruments before making a final decision compared to selling decisions, as it needs a small evaluation.
Da et al. (2011) identified that one of the major limitations in empirically testing attention theories is the unavailability of a direct measure of investor attention. Hence, the researchers must take indirect proxies such as extreme returns, trading volume, news and headlines, advertising expenses, and price limits (Da et al., 2011).
Aboody et al. (2010) have taken top percentile stocks, ranked based on prior 12-month price performance from 1971 to 2005. The results showed that strong past returns attract individual investors’ attention, particularly before earning announcements. Another research by Li and Yu (2012) identified that due to scarce attention, future stock returns are positively predicted by the nearness to the 52-week high, while this is the opposite in the case of nearness to the historical high. According to Zhang et al. (2013), attention could be the new barometer for information in financial markets due to the heterogeneous behavior of investors. Consequently, investor attention is the major factor in predicting abnormal stock returns and exhibits contemporary relationships with it. Aouadi et al. (2013) studied the French equity market and identified a positive and significant relationship between investor attention and abnormal trading volume at the market level. Hirshleifer et al. (2013) used Analyst Coverage as a proxy and found that stock returns tend to be high for those firms that are efficient in research and development. Furthermore, the authors identified it because such firms’ earnings per share (EPS) tend to increase in the future (Hirshleifer et al., 2013). If a firm increases advertising spending, the stock price will grow simultaneously, followed by a complete return reversal (Lou, 2014).
Choi and Choi (2019) researched to discover the influence of trading volume on investor attention in the Korean market. For measuring investor attention, the top 30 stocks were considered, and they were discussed online frequently on the message board from 2010 to 2014 using Daum (a widely used internet portal in Korea). Their study concluded that when investors paid high attention to the stocks, the trading volume of such stocks increased suddenly and unexpectedly on that day. Thus, due to short-sell constraints, high investor attention results in low future returns through active trading.
Chemmanur and Yan (2019) studied the US stock market from 1996 to 2005. In the first hypothesis, they tested the relationship between advertising and stock returns and found that more investor attention is drawn from the investors if firms invest highly in advertising. Then, in the second hypothesis, their research investigated whether advertising predicts future stock returns. The results showed that advertising significantly increases investors’ attention to the firm’s stocks and negatively affects future returns. Another study by Düz Tan and Taş (2019) investigated whether firm-specific investor attention predicts the future stock returns for the Borsa Istanbul 100 Index (Turkey). The data was taken from 2013 to 2017, and the study concluded that firms that attract considerable attention could generate higher returns (Düz et al., 2019).
Moreover, Subramaniam and Chakraborty (2020) researched to investigate whether investor attention influences the prices of cryptocurrencies. Their study concluded that retail/individual investors pay high attention to highly ranked cryptocurrencies such as Bitcoin and Ethereum. Therefore, the returns of that cryptocurrency increase. However, the prices of new cryptocurrencies such as Ripple are influenced by investor attention, but only at the time of their superior performance. In addition, this research identified whether high investors’ attention affects the price discovery process of bitcoin. They found that irrational, uninformed trading activity increases when attention is given to the bitcoin market. However, attention is unaffected by fully rational and informed traders. It implies that only uninformed traders paid high attention, leading them to participate more in the bitcoin market, which is unrelated to any increase in informed trading (Ibikunle et al., 2020), Zada, et al. (2023).
Moreover, Yahya et al. (2021) empirically tested the impact of various factors: the outbreak of novel COVID-19, the attention of investors, social isolation, and investors’ sentiments on stock returns of the German Stock Market. The results showed a significant impact of the coronavirus on the Frankfurt Stock Exchange after considering all the anomalies, such as weather disruptions, calendar variations, and oil price volatility. Furthermore, the higher stock returns during the social isolation period resulted from investors’ attention to buying underpriced stock. Thus, a temporary lockdown helped increase investors’ precision in decision-making, leading them to make better investment decisions.
Saleem and Usman (2022) established the relationship between the information risk and cost of equity (COE). Data was gathered from the non-financial firms listed on PSX from 2007 to 2019. The study discussed three types of information risk: private information risk, lack of quality risk, and transparent information risk. The study’s findings concluded that investors’ attention reduces such information risks by increasing the liquidity in stock prices, which, in turn, decreases the cost of equity (Saleem & Usman, 2022).
In another research study, there is empirical evidence that a news release draws the significant attention of retail investors, increasing volatility in stock return post-news announcement (Ballinari et al., 2022). Whereas the same news draws equal attention from institutional investors, it only has a small and negative impact on the stock price volatility post-news announcement days. The researchers used data from 360 US stocks on the S&P 500 index. Thus, the summarized findings are that in stock markets, the information processed and perceived by the stock markets is related to the way retailers and institutional investors pay attention to that information (Ballinari et al., 2022).
Similarly, not very distant research conducted by Dhasmana et al. (2023) regarding Indian companies notes a long-term link between stock prices and their impacts on investors’ sentiments. The study used the NIFTY 100 ESG Index to observe the relationship between the two. Hence, the study concluded that any increase in the ESG Index significantly decreased the investors’ sentiments. In the same breath, a slight decrease in the ESG Index strengthened the sentiments among the investors. Hence, it is easy to observe that stock prices affect the emotions and sentiments of investors in Indian companies.
Liu et al. (2023) examined the relationship between stock prices and investors’ sentiments by analyzing social media messages from the stock market investors and understanding their language patterns. The study, on the very positive end, confirms a significant positive relation between stock prices and the sentiments they trigger among investors. As stock prices rise, investors’ sentiments also rise. Meanwhile, as stock prices decline, investors’ sentiments also recede.
Another study indicated the relationship between investors’ attention and the volatility in the prices of petroleum products (APPP) in the Chinese Stock Market. It was noted that the higher the APPP Index, the higher the stock market volatility. It is also worth noting that the APPP index model best predicts the volatility of the Chinese stock market. Other orthodox methods and predictors did not serve the meaningful purpose of understanding the Chinese Stock Market Volatility. The predictability capacity of the APPP index can hardly be overlooked (Li, 2024).
Never in the history of research has a health crisis had as much impact on financial markets and institutes as has Covid-19. The pandemic set the finest example of analyzing market response to variations in investor’s attention. One of the research studies attempted to explain the changing dynamics of market response through varying investor attention. The study’s findings suggest that as news events or other information drew investors’ attention, the prices responded by incorporating the same news or information. So, it was proved that stock returns are marginally low and that price volatility grew strong as the news or certain information drew investors’ attention (Smales, 2021).
Similarly, another study found that investors’ attention is a key element affecting stock returns and trade volumes. The study conducted by Yang et al. (2021) indicated that investors could focus only on a small number of stocks out of their large stock pool. Consequently, investors could only retrieve a selective amount of stock knowledge. Thus, the research findings concluded that whatever knowledge drew investors’ attention significantly impacted stock returns and trading volumes.
Furthermore, a study by Che-Yahya and Matsuura (2021) establishes that investors’ sentiments positively and significantly affect stock returns and trade volume, especially on the first day of trading following such an event. The study evaluated a sample of 520 IPOs in Japanese Stock Markets from January 2010 to December 2009. The findings corroborate the overvaluation hypothesis that investors' higher optimism results in higher IPO prices than their intrinsic value on the first trading day.
In addition, after reviewing the literature, this study has been finalized to use the PCA prediction technique. Through PCA, market-level measures were aggregated into a single index. For this, the study first aggregates firm-level measures into measures at the market level whenever needed. Thus, an aggregated attention index would employ all information on the proxies and stock market returns.
3. Methodology
3.1. Data Sources and Variables
This study uses monthly time-series data from January 2000 to June 2020 to construct an investor aggregate attention index. We follow the literature and use principal component analysis (PCA) to construct the investor attention index. Therefore, seven major individual attention proxies have been taken, namely abnormal trading volume - and extreme returns - (Barber & Odean, 2008), past returns - (Aboody et al., 2010), nearness to the 52-week high - and nearness to the historical high- - (Li & Yu, 2012), google search volume – (Da, et al., 2011; Aouadi et al., 2013; Ding & Hou, 2015; Yao et al., 2017) and mutual funds inflow and outflow - (Chen et al., 2021). These seven proxies were first used to construct individual investor indexes at the firm level; then, this research aggregated them to the market level by following the Chen et al. (2021) methodology. Table 1 mentions the variables and their definitions and operationalization.
3.2. Aggregate Attention Index
The aggregated attention index is created using all seven proxies together. A factor structure is developed in Equation 1.
“where A∗ t is the true but unobservable investor attention, the sensitivity of attention proxy Ai,t to the true attention A∗t is summarized by factor loadings that is ηi,1. Et is the common error term of all the proxies while ei,t is the idiosyncratic noise solely associated with Ai,t measure.
To efficiently estimate A∗t,, the aforementioned factor structure is imposed on all proxies.
In this way, an attention index is constructed for the study. Based on the attention index, the forecasting regression equation 3 mentioned above is considered for the current research.
where rt+1 is forecasted stock return at time t +1, A∗t is the true but unobservable investor attention at time t, and is the noise term which is unpredictable and unrelated to A∗t. To estimate the model above, the OLS regression is used in line with the literature to examine the impact of investor attention on stock returns.
4. Results and Discussions
4.1. Descriptive and Correlation Analysis
Table 2 shows the summary statistics of all the variables. The current research consisted of monthly data that included 246 observations (months) except 198 observations, 233 observations for NAVEMF, and 211 months for RVMF.
In the study, an attention index comprises seven individual proxies. All these proxies have 246 observations except GSV, with 198 searches; NAVEMF, with 233 observations; and PVMF, with 211. The mean value of NKIWH is 0.856 with SD of 0.113, a minimum value of 0.395, maximum of 1, P1is 0.566, and P99 is 1; skewness is -0.862 showing negatively skewed data, kurtosis is 3.561 which is greater than three meaning the data is leptokurtic. NKIHH shows a mean value of 0.345 with an SD of 0.281, and the minimum and maximum values of the same variable are 0.221 and 1, respectively. P1 is 0.025, P99 is 0.952, positively skewed with 0.67, and 2.054 is kurtosis showing platykurtic. The mean of ATV represented 0.988 and 0.379 of mean and SD values, respectively; 0.004 is the minimum value, and 2.154 is the maximum value, P1 showed 0.201, and P99 showed 1.991 with positively skewed data (0.429), kurtosis (3.09) greater than 3 represents leptokurtic data.
The mean value of GSV is 24.758, with an SD of 2.715, a minimum search of 19, and a maximum of 30. The same variable showed P1 with 19.68 and P99 with 29.97, positively skewed data with 0.096, and platykurtic data with a value of 2.054. ER represents extreme returns with 0.081 mean value and 0.024 SD value, negative minimum extreme returns with 0.1% and 23% with maximum extreme returns, P1 is 1%, and P99 is approximately 16% with 1.674 positive skewness, and kurtosis is 12.694 which means data is leptokurtic. NAVEMF mean is 2194.266 and SD of 1000.307, a minimum of 8 and a maximum of 4666.711, P1 is 9.56, and P99 is 4163.147 with negatively skewed data -0.376 and kurtosis is 3.613. RVMF denoted a mean value of 1909.56 with a SD of 602.415, the minimum and maximum values of 250 and 3784.462. The said variable showed P1 of 678.466 and P99 of 3282.766 with positive skewness of 0.505 and kurtosis of 3.343, which indicates leptokurtic data. The mean value of PR is 0.018 with SD of 0.064, negative 24.8% of minimum past returns and 23.5% maximum returns with P1 of -1.51% and P99 of 1.73%, negative skewness with -0.325 value and 5.02 indicated data is leptokurtic.
The correlation helps in examining the relationship between dependent and independent variables. Table 3 showed a negative and weak correlation of NKIWH, NKIHH, and ATV of -0.114, -0.021, and -0.074 with the dependent variable FESR. The variables GSV, ER, NAVEMF, and RVMF have positive but weak correlations of 0.073, 0.054, 0.054, and 0.083 with FESR. The PR is the only variable with a positive and moderate correlation of 0.335 with FESR. The results showed that the variables do not have the problem of multicollinearity.
4.2. Attention Index Construction Through PCA and its Impact on Stock Market Returns of KSE-100 Index
The Attention Index is constructed through the PCA technique using the same proxies mentioned above. The Kaiser–Meyer–Olkin results are used to analyze the adequacy of samples because the correlations and partial correlations between variables are compared by KMO value in Table 4.
The KMO value for this study is 0.63, which indicates a middling sample and highlights that correlations are high compared to partial correlations.
Table 5 shows eigenvalues for each component. The results stated a total of 4 numbers of components. As per the rules of PCA, if eigenvalues are greater than and/or equal to one (eigenvalues >= 1), such components should be included for further analysis. The eigenvalue suggested by (Cattell, 1966) stated that four components should be retained for factor analysis of this research. Eigenvalues for Comp1 is 1.782, Comp2 is 1.335, Comp3 is 1.222 and Comp4 is 0.965. Comp1 is the first attention index denoted by PCA1, Comp2 is the second index PCA2, Comp 3 is the third index PCA3, and Comp 4 is the fourth index PCA4. The eigenvectors of each variable of each component of PCA are mentioned in Table 5.
The aggregate attention index is constructed using a combination of weights of the individual attention proxies:
The coefficients of Eigenvalues of each variable in each component are provided in Table 7.
According to the results of Table 7, the following proxies contribute to the indices PCA1, PCA2, PCA3, and PCA4. Hence, the final attention indices using the results are:
Once the components were analyzed, the current study regressed each component with the stock market returns to investigate whether PCA predicts future returns or not. The OLS regression results are presented in Table 8:
In Table 8, OLS regressions are applied to examine the impact of PCA1, PCA2, PCA3, and PCA4 attention indices on the stock market returns of the KSE-100 Index. The results in Table 8 showed that the first attention index, PCA1, overall model is significant at a 10% significance level, as the p-value of the test is 0.074, which is less than 0.10. The R2 measure of goodness of the model fit showed that PCA1 explains only 1.6% of the variations. The beta coefficient is -0.005, which shows a negative but significant impact on SMR. The second attention index PCA2 overall model is significant at a 1% confidence interval along with an R2 of 0.187 showing that the model explains 18.7% variations. The beta coefficient is 0.024, which is positive, and the p-value of 0.000 shows a positive and significant impact on SMR. The third attention index is PCA3, and the p-value of the F-test is 0.000, which is significant at a 1% significance level. This index has reported the highest explanatory power with an R2 of 0.335, explaining 33.5% variations. The beta is -0.037, which shows a negative but significant impact on SMR. The last attention index is PCA4, which is also significant with a p-value of F-test 0.000, significant at a 1% significance level, a beta of 0.031, and a p-value of 0.000, showing a positive impact on SMR with an R2 of 0.226. Thus, it can be said that the remaining 77.4% of the variability in future excess returns can be explained by other factors that affect the attention index.
The results showed that all the four components PCA1, PCA2, PCA3 and PCA4 have a significant impact on SMR, however, PCA3 attention index has moderately good explanatory power (R2 of 0.335).
From all seven proxies, the results of PCA3 showed four variables that significantly affect the attention index along with an R2 of 33.5%. The PCA3 attention index comprises NKIWH, ATV, PR, and GSV proxies, as shown in Table 7. Thus, other factors that affect the attention index can explain the remaining 66.5% of the variability in future excess returns. Some of the studies used different proxies or factors such as Hirshleifer et al. (2013) studied Analyst Coverage, and the results showed that the stock returns tend to be high for those firms that are efficient in research and development and because of increasing expected earnings per share. Lou (2014) used Advertising Spending as a proxy, and the results showed that an increase in advertising spending leads to a simultaneous increase in stock price, followed by a complete return reversal. Chemmanur and Yan's (2019) findings were that advertising in the US stock market attracts investors’ attention to the firm’s stocks and affects future returns. Media coverage was also considered an attention measure (Hillert & Ungeheuer, 2015; Zou et al., 2019). Different researchers have already studied the factors above, but in Pakistan, the major limitation was the unavailability of data on these factors. In addition, macroeconomic factors and monetary policy also affect investors' attention. Therefore, Choi and Choi (2019) studied the US equity market and identified a negative and significant relationship between investor attention and abnormal trading volume at the market level. Their study concluded that when investors paid high attention to the stocks, the trading volume of such stocks increased suddenly and unexpectedly on that day. Thus, due to short-sell constraints, high investor attention results in low future returns through active trading. Aboody et al. (2010) took top percentile stocks that were ranked based on prior 12-month price performance for the 1971 through 2005 period and showed that strong past returns tend to attract individual investors’ attention, particularly before earning announcements.
Li and Yu (2012) studied that due to high attention, the nearness to the 52-historical high has a negative impact on future stock returns. Chang et al. (2018) investigated the impact of a historically high ratio on stock index returns of G7 countries. The authors found a negative relationship between the historical high and the stock’s return because the historical high is far from the current stock’s index (Chang et al., 2018). Google Search Volume Index (GSVI) was used as a proxy measure for investor attention as the authors considered it a reliable proxy (Aouadi et al., 2013; Ding & Hou, 2015; Yao et al., 2017).
In this study, we have identified the nearness to the KSE-100 index 52-historical high, which positively contributed to PCA3 variables and attracted Pakistani investors. Consequently, these findings are consistent with the literature. Chen et al. (2022) also concluded that the index had a negative but significant impact on future stock returns of the NASDAQ market. The negative coefficient is consistent with the literature review on investors’ attention index. Yuan (2015) found that market-wise events that grasped the attention of investors led to a decrease in stock return in the future.
From the study, market participants could be able to identify key strategic directions that could assist them in predicting market conditions. In addition, appropriate investment decisions could be of considerable benefit and a competitive advantage in the market. It would help academic scholars in behavioral finance and open a new perspective. Besides this, the researcher would look at the signals that affect the performance of the KSE-100 index, effectively managing their portfolios and risk.
5. Conclusions, Limitations, Implications, and Recommendations
This paper aimed to illuminate the critical and growing phenomenon of investor attention in the Pakistani stock market by systematically analyzing attention proxies affecting stock market returns. For the first time, NKIWH, NKIHH, ATV, ER, PR, GSV, NAVEMF and RVMF. These proxies were used to construct the investor attention index through the PCA approach, renowned for their market prediction capabilities.
The findings reveal that the PCA3 index negatively and significantly predicts the stock market returns of the KSE-100 index among all four PCA components. The results are consistent with Chen et al. (2022) and Chen (2017).
This study highlights the importance of investor attention in Pakistan’s equity market and its substantial role in behavioral finance. Two primary economic sources of predictability were identified: first, lower investor attention leads to higher future uncertainty, prompting investors to demand higher returns as compensation for increased risk, resulting in higher stock returns. Second, heightened investor attention can lead to a surge in trading volume due to active trading and short-sell constraints, ultimately leading to lower future returns. Furthermore, this research underscores two significant points: investor attention substantially influences the aggregate stock market statistically and economically, and individual attention measures understate the true predictive power of investor attention in Pakistan’s stock market when analyzed through PCA. In conclusion, this study has provided valuable insights into the predictive power of investor attention in Pakistan’s stock market, paving the way for future research to build upon these findings and explore new dimensions in behavioral finance.
However, this study faced several limitations. Variables like changes in advertising expenses, media coverage, analyst coverage, and other economic and firm-specific variables were excluded because of data unavailability in Pakistan. The study period was limited from January 1, 2000, to June 30, 2020, with Google Search Volume data starting from 2004. The analysis was also confined to the KSE-100 Index, assuming it represents the Pakistani stock market. Additionally, due to time constraints and the COVID-19 pandemic, the research was limited to market-based variables and in-sample analysis, with data analysis conducted solely using STATA.
Furthermore, one of the limitations was to exclude the period of extreme events that mostly occurred after July 2020, including both endogenous and exogenous events such as the COVID-19 pandemic, political uncertainty as Pakistan was near to default due to liquidity crunch and lowest foreign exchange reserves, high inflation, high currency risk, high dollar-rupee parity, high interest rates, Russian-Ukraine War, Gaza Genocide, and others. Because of these events, researchers were delimitated in taking the sample from January 2000 to June 2020 to examine the impact on better economic conditions. However, the era from June 2020 to June 2024 can be examined to determine the impact of the attention index during the crisis. Hence, there is a research gap that can be studied in future research.
The major implications of this study are a need for more financial literacy and an understanding of investment strategies for earning higher returns. Policymakers can develop and implement transparent policies and procedures to increase effective trading in the stock market. Individual investors can also increase returns by understanding the market sentiments and information. Mutual fund managers can design portfolios based on individual investors’ behavior and risk appetite to maximize future returns. Scholars and academicians can conduct further research studies to understand investors’ attention behavior in different market scenarios and contribute to strengthening knowledge of behavioral finance.
In the current research, a few recommendations are given to researchers and financial institutions who are highly inspired to conduct research, especially in this domain. The authors can consider economic variables for constructing an investor attention index and investigate their impact on predicting future returns. The authors can use firm-specific variables such as dividend-to-price ratio, earnings-to-price ratio, dividend payouts ratio, book-to-market ratio, etc. The researchers may consider the industries to investigate their predictability by investor attention. Industries may include health, manufacturing, energy, and telecommunication, etc. Some industries may be the most predictable by investor attention and vice versa.
Author Contributions
Conceptualization, S.P. and H.Z.; methodology, R.M. and S.A.; software, H.Z. and E.T.; validation, S.P., R.M.; formal analysis, S.A.; investigation, E.T.; resources, S.A.; data curation, H.Z.; writing—original draft preparation, S.P.; writing—review and editing, S.A.; visualization, E.T.; supervision, H.Z.; project administration, R.M.; funding acquisition, E.T. All authors have read and agreed to the published version of the manuscript.
Funding
This research was supported by a grant from the Department of Maritime Studies, Faculty of Maritime and Industrial Studies, University of Piraeus, 185-33 Piraeus, Greece (Eleftherios Thalassinos).
Data Availability Statement
Upon request from the corresponding author.
Conflicts of Interest
The authors declare no conflict of interest.
References
- Aboody, D., Lehavy, R., & Trueman, B. (2010). Limited Attention and the Earnings Announcement Returns of Past Stock Market Winners. Review of Accounting Studies, 15(2), 317–344. [CrossRef]
- Ahmad, N., & Ramzan, M. (2016). Stock Market Volatility and Macroeconomic Factor Volatility. International Journal of Research in Business Studies and Management, 3(7).
- Aouadi, A., Arouri, M., & Teulon, F. (2013). Investor Attention and Stock Market Activity: Evidence from France. Economic Modelling, 35, 674–681. [CrossRef]
- Ballinari, D., Audrino, F., & Sigrist, F. (2022). When Does Attention Matter? The Effect of Investor Attention on Stock Market Volatility Around News Releases. International Review of Financial Analysis, 82(April), 102185. [CrossRef]
- Barber, B. M., & Odean, T. (2008). All that Glitters: The Effect of Attention and News on the Buying Behavior of Individual and Institutional Investors. Review of Financial Studies, 21(2), 785–818. [CrossRef]
- Chang, S. L., Chien, C. Y., Lee, H. C., & Lin, C. (2018). Historical High and Stock Index Returns: Application of the Regression Kink Model. Journal of International Financial Markets, Institutions and Money, 52, 48–63. [CrossRef]
- Che-Yahya, N., & Matsuura, Y. (2021). Does Individual Investors’ Sentiment Explain Japanese IPO Aftermarket Performance? Journal of Asian Finance, Economics and Business, 8(4), 1079–1090. [CrossRef]
- Chemmanur, T. J., & Yan, A. (2019). Advertising, Attention, and Stock Returns. Quarterly Journal of Finance, 9(3). [CrossRef]
- Chen, T. (2017). Investor Attention and Global Stock Returns. Journal of Behavioral Finance, 18(3), 358-372. [CrossRef]
- Chen J, Tang G, Yao J, Zhou G. (2022). Investor Attention and Stock Returns. Journal of Financial and Quantitative Analysis, 57(2), 455-484. [CrossRef]
- Choi, S., & Choi, W. Y. (2019). Effects of Limited Attention on Investors’ Trading Behavior: Evidence from Online Ranking Data. Pacific Basin Finance Journal, 56(June 2018), 273–289. [CrossRef]
- Da, Z., Engelberg, J., & Gao, P. (2011). In Search of Attention. The Journal of Finance, 66(5), 1461-1499.
- Dhasmana, S., Ghosh, S., & Kanjilal, K. (2023). Does Investor Sentiment Influence ESG Stock Performance? Evidence from India. Journal of Behavioral and Experimental Finance, 37, 100789.
- Ding, R., & Hou, W. (2015). Retail Investor Attention and Stock Liquidity. Journal of International Financial Markets, Institutions and Money, 37, 12–26. [CrossRef]
- Düz Tan, S., & Taş, O. (2019). Investor Attention and Stock Returns: Evidence from Borsa Istanbul. Borsa Istanbul Review, 19(2), 106–116. [CrossRef]
- Fama, E. F. (1970). Efficient capital markets. Journal of Finance, 25(2), 383-417.
- Ghani, M., Guo, Q., Ma, F., & Li, T. (2022). Forecasting Pakistan Stock Market Volatility: Evidence from Economic Variables and the Uncertainty Index. International Review of Economics & Finance, 80, 1180–1189.
- Gill, R. K., & Bajwa, R. (2018). Study on Behavioral Finance, Behavioral Biases, and Investment Decisions. International Journal of Accounting and Financial Management Research, 8(3), 1–14.
- Hillert, A., & Ungeheuer, M. (2015). Ninety Years of Media Coverage and the Cross-Section of Stock Returns. SSRN Electronic Journal, March, 1–2. [CrossRef]
- Hirshleifer, D., Hsu, P. H., & Li, D. (2013). Innovative Efficiency and Stock Returns. Journal of Financial Economics, 107(3), 632–654. [CrossRef]
- Hirshleifer, D., & Teoh, S. H. (2003). Limited Attention, Information Disclosure, and Financial Reporting. Journal of Accounting and Economics, 36(1-3 SPEC. ISS.), 337–386. [CrossRef]
- Huang, L., & Liu, H. (2007). Rational Inattention and Portfolio Selection. Journal of Finance, 62(4), 1999–2040. [CrossRef]
- Ibikunle, G., McGroarty, F., & Rzayev, K. (2020). More Heat Than Light: Investor Attention and Bitcoin Price Discovery. International Review of Financial Analysis, 69(January), 101459. [CrossRef]
- Joyo, A. S., & Lefen, L. (2019). Stock Market Integration of Pakistan with its Trading Partners: A Multivariate DCC-GARCH Model Approach. Sustainability, 11(2), 303.
- Kahneman, D. (1973). Attention and Effort. (vol. 1063, pp. 218-226). Prentice-Hall.
- Li, D. (2024). Forecasting Stock Market Realized Volatility: The Role of Investor Attention to the Price of Petroleum Products. International Review of Economics & Finance, 90, 115-122. [CrossRef]
- Li, J., & Yu, J. (2012). Investor Attention, Psychological Anchors, and Stock Return Predictability. Journal of Financial Economics, 104(2), 401–419. [CrossRef]
- Liu, Q., Lee, W. S., Huang, M., & Wu, Q. (2023). Synergy Between Stock Prices and Investor Sentiment in Social Media. Borsa Istanbul Review, 23(1), 76–92. [CrossRef]
- Lou, D. (2014). Attracting investor attention through advertising. Review of Financial Studies, 27(6), 1797–1829. [CrossRef]
- Merton, R. C. (1987). A Simple Model of Capital Market Equilibrium with Incomplete Information.
- Pashler, H., Johnston, J. C., & Ruthruff, E. (2001). Attention and Performance. Annual review of psychology, 52(1), 629-651. [CrossRef]
- Peng, L., & Xiong, W. (2006). Investor Attention, Overconfidence and Category Learning. Journal of Financial Economics, 80(3), 563–602. [CrossRef]
- Saleem, S., & Usman, M. (2022). Impact of Information Risk and Cost of Equity: Moderating Role of Investor Attention. Asia-Pacific Journal of Business Administration, 14(4), 516-538.
- Shafique, A., Ayub, U., & Zakaria, M. (2019). Don’t let the Greed catch you! Pleonexia rule applied to Pakistan Stock Exchange. Physica A: Statistical Mechanics and Its Applications, 524, 157-168. [CrossRef]
- Smales, L. A. (2021). Investor Attention and Global Market Returns During the COVID-19 crisis. International Review of Financial Analysis, 73(June 2020), 101616. [CrossRef]
- Subramaniam, S., & Chakraborty, M. (2020). Investor Attention and Cryptocurrency Returns: Evidence from Quantile Causality Approach. Journal of Behavioral Finance, 21(1), 103–115. [CrossRef]
- Yahya, F., Shaohua, Z., Abbas, U., & Waqas, M. (2021). COVID-19-induced Returns, Attention, Sentiments and Social Isolation: Evidence from Dynamic Panel Model. Global Business Review. [CrossRef]
- Yang, D., Ma, T., Wang, Y., & Wang, G. (2021). Does Investor Attention Affect Stock Trading and Returns? Evidence from Publicly Listed Firms in China. Journal of Behavioral Finance, 22(4), 368–381. [CrossRef]
- Yao, T., Zhang, Y. J., & Ma, C. Q. (2017). How Does Investor Attention Affect International Crude Oil Prices? Applied Energy, 205(July), 336–344. [CrossRef]
- Yuan, Y. (2015). Market-wide Attention, Trading, and Stock Returns. Journal of Financial Economics, 116(3), 548–564. [CrossRef]
- Zada, H., Maqsood, H., Ahmed, S., & Khan, M. Z. (2023). Information shocks, market returns and volatility: a comparative analysis of developed equity markets in Asia. SN Business & Economics, 3(1), 37.
- Zhang, W., Shen, D., Zhang, Y., & Xiong, X. (2013). Open Source Information, Investor Attention, and Asset Pricing. Economic Modelling, 33, 613–619. [CrossRef]
- Zou, L., Cao, K. D., & Wang, Y. (2019). Media Coverage and the Cross-Section of Stock Returns: The Chinese Evidence. International Review of Finance, 19(4), 707–729. [CrossRef]
Figure 1.
Thomson Reuter’s data for the KSE-100 Index.
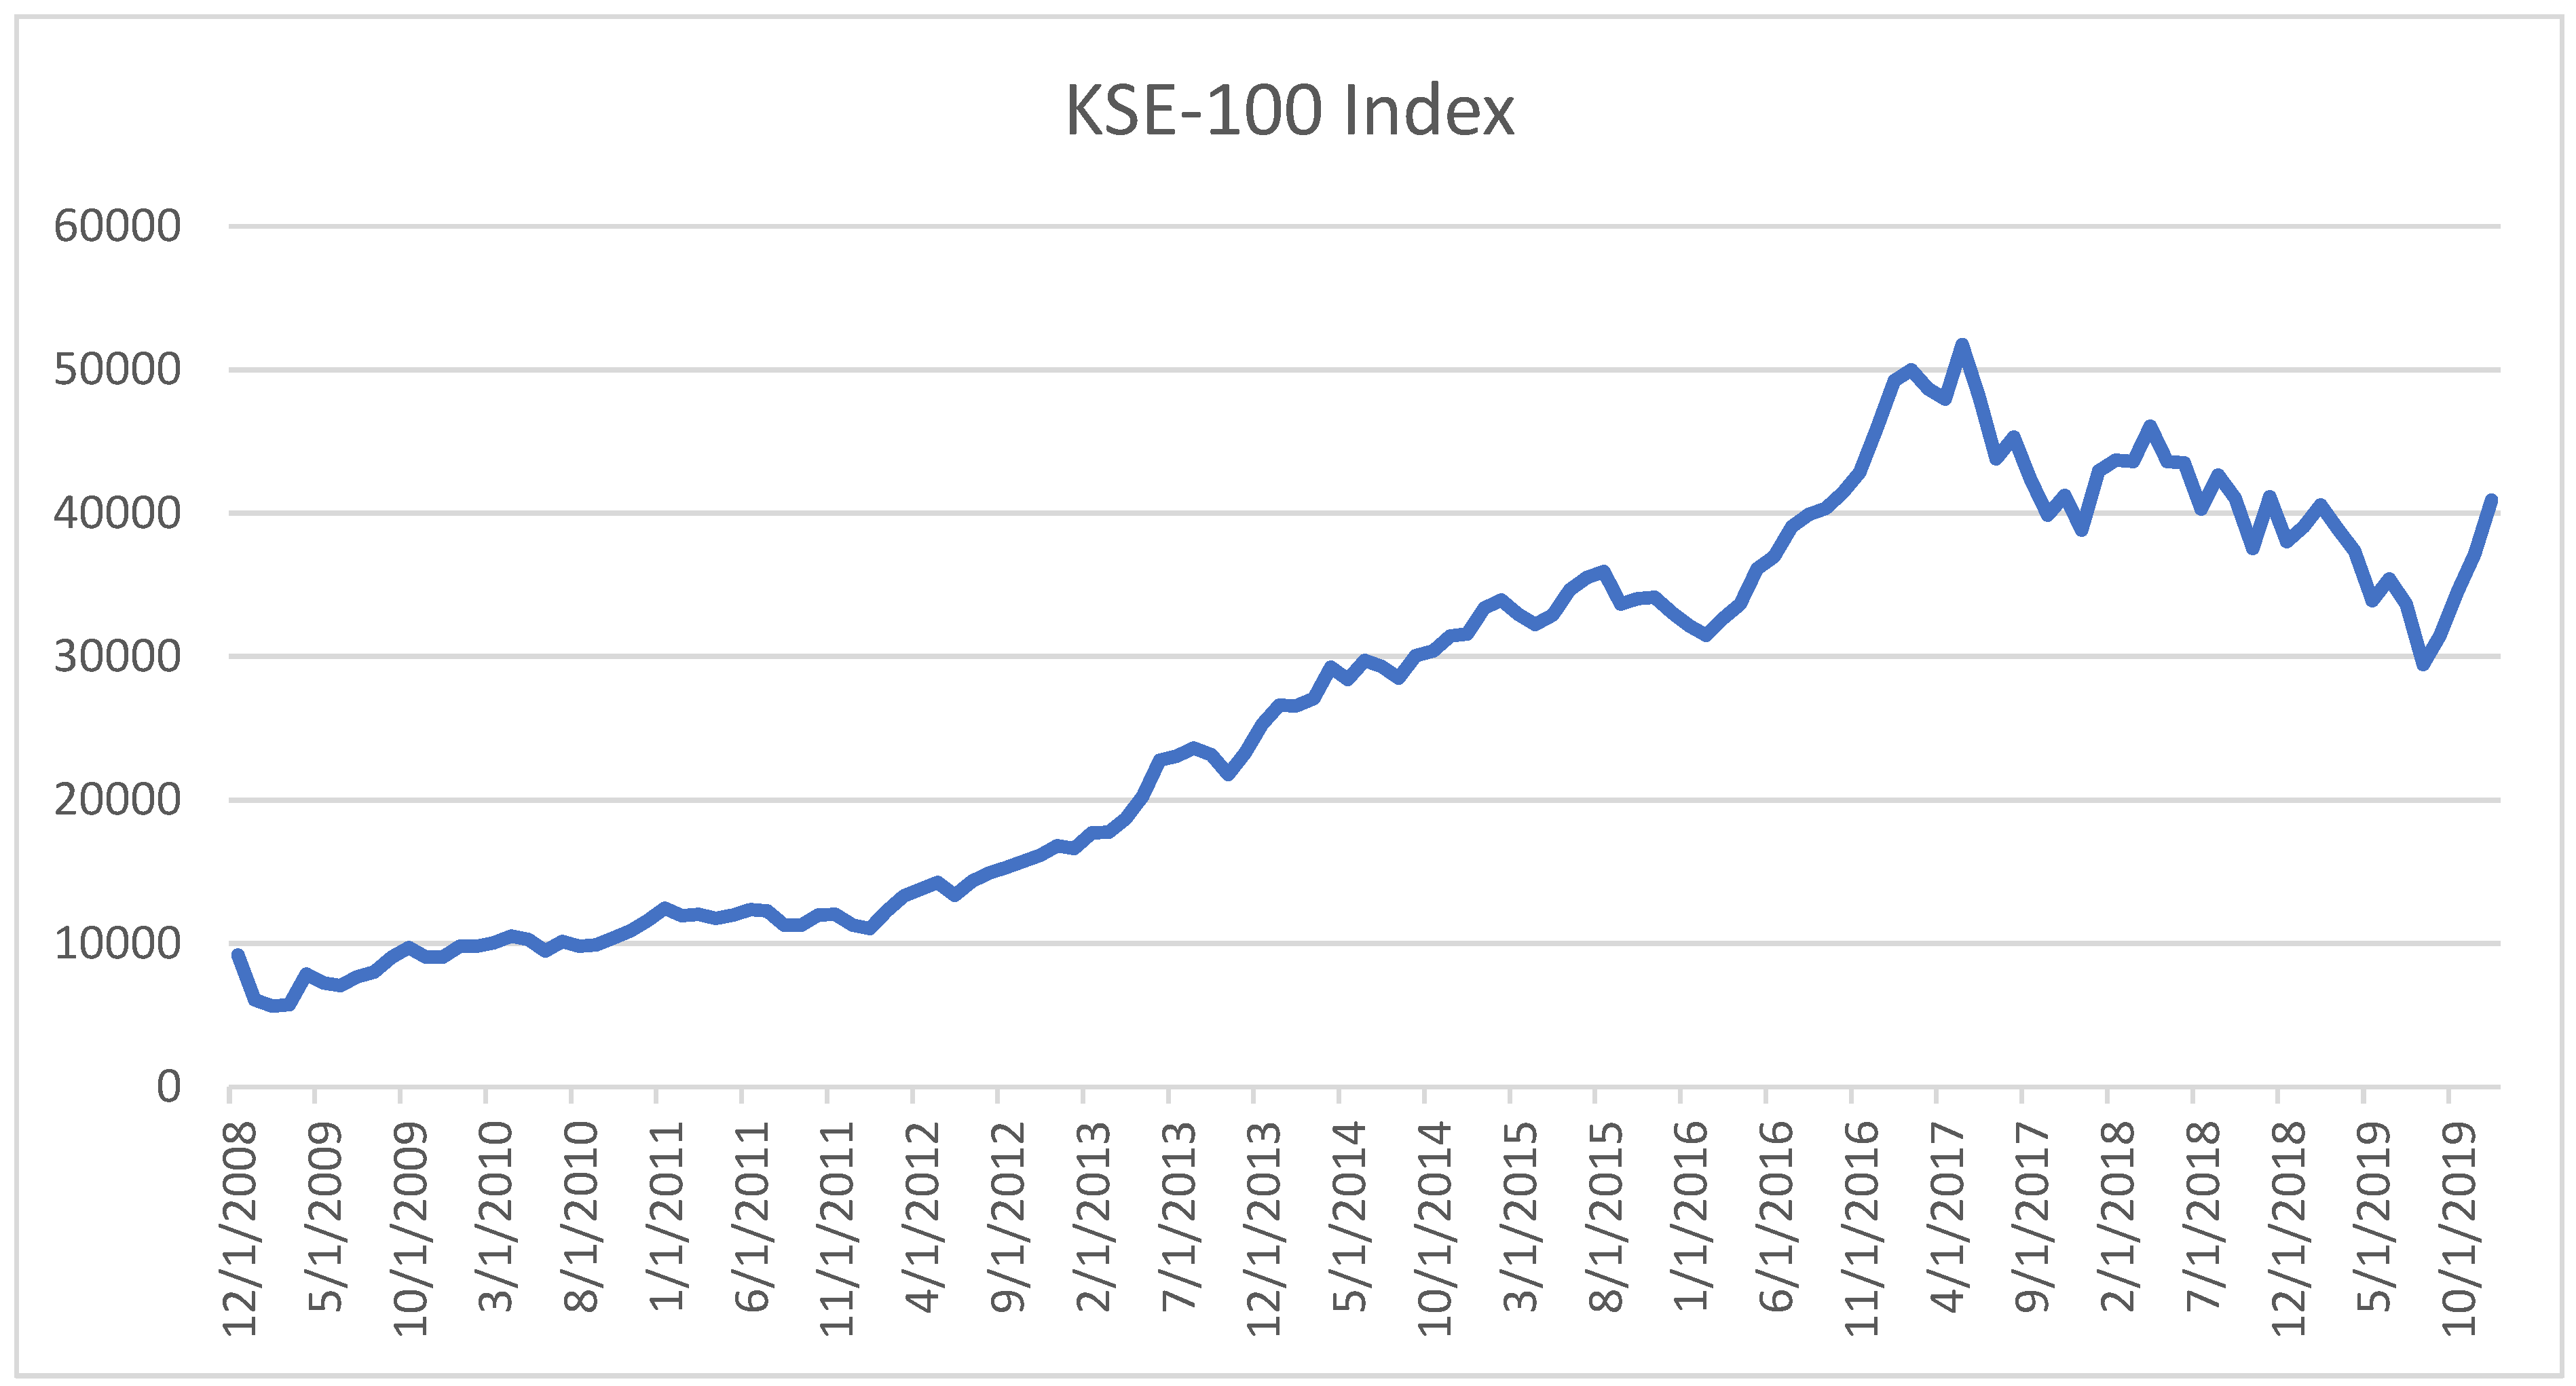

Table 1.
Variables.
| Variables | Symbol and Operationalization | Definition |
|---|---|---|
| Abnormal Trading Volume |
|
the equal-weighted abnormal trading volume at time t across all stocks was calculated as the measure of the market-level attention index. |
| Extreme Returns | the equal-weighted extreme returns at time t across all stocks was calculated. | |
| Past Returns | is the equal weighted past return across all stocks. | |
| Nearness to the KSE-100 Index 52-week high | 52-week high at month t | |
| Nearness to the KSE-100 Index historical high | historical high at month t | |
| Google Search Volume | Total monthly searches of companies listed on the KSE-100 index have been collected through the most crucial website named Google Trends from January 2004 to June 2020. | |
| Equity Mutual Funds Inflow and Outflow | Net asset value of Mutual funds (Inflow) and repurchase value of Mutual funds (Outflow) has been computed for each equity mutual fund i at time t. |
Table 2.
Descriptive Statistics.
| Variables | Obs | Mean | SD | Min | Max | p1 | p99 | Skew | Kurt |
|---|---|---|---|---|---|---|---|---|---|
| NKIWH | 246 | 0.856 | 0.113 | 0.395 | 1 | 0.566 | 1 | -0.862 | 3.561 |
| NKIHH | 246 | 0.345 | 0.281 | 0.022 | 1 | 0.025 | 0.952 | 0.67 | 2.054 |
| ATV | 246 | 0.988 | 0.379 | 0.004 | 2.154 | 0.201 | 1.991 | 0.429 | 3.09 |
| GSV | 198 | 24.758 | 2.715 | 18.86 | 30.4 | 19.68 | 29.97 | 0.096 | 2.054 |
| ER | 246 | 0.081 | 0.024 | -0.001 | 0.228 | 0.001 | 0.156 | 1.674 | 12.69 |
| NAVEMF | 233 | 2194.27 | 1000.31 | 8 | 4666.71 | 9.56 | 4163.15 | -0.376 | 3.613 |
| RVMF | 211 | 1909.56 | 602.42 | 250 | 3784.46 | 678.47 | 3282.77 | 0.505 | 3.343 |
| PR | 246 | 0.018 | 0.064 | -0.248 | 0.235 | -0.151 | 0.173 | -0.325 | 5.02 |
The descriptive statistics of key variables are shown. NKIWH denotes Nearness to 52-Week High, NKIHH represents Nearness to 52-Historical High, ATV denotes Abnormal Trading Volume, GSV is Google Search Volume, ER represents Extreme Returns, NAVEMF represents Equity Mutual Funds Inflow, RVMF represents Equity Mutual Funds Outflow, and PR is Past Returns are shown. The Obs represents the number of observations, Std. Dev is standard deviation, Min is the minimum value, Max is the maximum value in the data series, p1 is the first percentile, p99 is the ninety-ninth percentile, Skew represents skewness, and Kurt is kurtosis. The frequency of the data is monthly, and the period is from January 2000 to June 2020.
Table 3.
Correlation Matrix.
| Variables | (1) | (2) | (3) | (4) | (5) | (6) | (7) | (8) | (9) |
|---|---|---|---|---|---|---|---|---|---|
| (1) SMR | 1.000 | ||||||||
| (2 NKIWH | -0.114 | 1.000 | |||||||
| (3) NKIHH | -0.021 | 0.276 | 1.000 | ||||||
| (4) ATV | -0.074 | 0.387 | 0.043 | 1.000 | |||||
| (5) GSV | 0.073 | 0.232 | 0.515 | 0.015 | 1.000 | ||||
| (6) ER | 0.054 | -0.168 | -0.034 | 0.085 | -0.164 | 1.000 | |||
| (7) NAVEMF | 0.054 | 0.010 | -0.057 | -0.037 | 0.038 | 0.083 | 1.000 | ||
| (8) RVMF | 0.083 | -0.018 | -0.058 | 0.111 | 0.045 | 0.021 | -0.008 | 1.000 | |
| (9) PR | 0.335 | 0.194 | -0.047 | -0.037 | -0.043 | -0.105 | 0.022 | 0.028 | 1.000 |
The correlation matrix is presented in Table 3. The key variables used are Stock Market Returns (SMR), Nearness to a 52-week High (NKIWH), Nearness to a 52-historical High (NKIHH), Abnormal Trading Volume (ATV), Google Search Volume (GSV), Extreme Returns (ER), Net asset value of Mutual funds inflow (NAVEMF), repurchase value of Mutual funds outflow (RVMF), and Past Returns (PR).
Table 4.
KMO Measure of Sampling Adequacy.
| Variable | KMO |
|---|---|
| SMR NKIWH NKIHH ATV ER PR GSV NAVEMF RVMF |
0.428 0.643 0.440 0.772 0.327 0.546 0.588 0.601 0.583 |
| Overall | 0.63 |
In this table, SMR is Stock Market Returns, NKIWH is Nearness to 52-Week High, NKIHH is Nearness to 52-Historical High, ATV is Abnormal Trading Volume, ER is Extreme Returns, PR is Past Returns, GSV is Google Search Volume, NAVEMF is Net Asset Value of Mutual Funds Inflow, and RVMF is Repurchase Value of Mutual Funds Outflow.
Table 5.
Principal components/correlation.
| Component | Eigenvalue | Difference | Proportion | Cumulative |
|---|---|---|---|---|
| Comp1 | 1.782 | 0.447 | 0.162 | 0.500 |
| Comp2 | 1.335 | 0.113 | 0.121 | 0.621 |
| Comp3 | 1.222 | 0.257 | 0.111 | 0.732 |
| Comp4 | 0.965 | 0.280 | 0.088 | 0.820 |
| Comp5 | 0.685 | 0.123 | 0.062 | 0.882 |
| Comp6 | 0.562 | 0.154 | 0.051 | 0.933 |
| Comp7 | 0.408 | 0.109 | 0.037 | 0.970 |
| Comp8 | 0.299 | 0.278 | 0.027 | 0.998 |
The results of PCA are shown in this table.
Table 6.
Principal components (eigenvectors).
| Variable | Comp1 | Comp2 | Comp3 | Comp4 | Unexplained |
|---|---|---|---|---|---|
| NKIWH | 0.192 | 0.492 | 0.259 | -0.260 | 0.260 |
| NKIHH | -0.044 | 0.273 | 0.634 | 0.218 | 0.265 |
| ATV | 0.242 | -0.280 | -0.181 | -0.014 | 0.600 |
| ER | -0.036 | -0.083 | 0.110 | 0.752 | 0.276 |
| PR | 0.070 | 0.444 | 0.404 | 0.039 | 0.411 |
| GSV | -0.111 | 0.472 | 0.134 | -0.175 | 0.496 |
| NAVEMF | 0.471 | -0.196 | 0.157 | -0.097 | 0.065 |
| RVMF | 0.471 | 0.028 | 0.045 | 0.176 | 0.136 |
In this table, NKIWH is Nearness to a 52-week High, NKIHH denotes Nearness to a 52-historical High, ATV is Abnormal Trading Volume, ER is Extreme Returns, PR is Past Returns, GSV is Google Search Volume, NAVEMF is Net Asset Value of Mutual Funds Inflow, and RVMF is Repurchase Value of Mutual Funds Outflow.
Table 7.
eigenvalues Coefficients.
| Variable | Comp 1 (PCA1) |
Comp 2
(PCA2) |
Comp 3
(PCA3) |
Comp 4
(PCA4) |
Unexplained |
|---|---|---|---|---|---|
| NKIWH NKIHH ATV ER PR GSV NAVEMF RVMF |
0.070 -0.111 0.474 0.460 |
0.4920 -0.280 0.444 0.472 |
0.634 -0.181 0.404 0.134 |
-0.260 0.752 -0.097 0.176 |
0.260 0.265 0.600 0.276 0.411 0.496 0.065 0.136 |
Table 7 indicates variables NKIWH, NKIHH, ATV, ER, PR, GSV, NAVEMF, and RVMF, which represent the Nearness to a 52-week High, the Nearness to a Historical High, the Abnormal Trading Volume, Extreme Returns, Past Returns, Google Search Volume, Equity Mutual Funds Inflow, and Equity Mutual Funds Outflow, respectively.
Table 8.
Ordinary Least Square Regression.
| Variables | Coef. | St.Err. | t-value | p-value | R2 | F-test | Prob > F |
|---|---|---|---|---|---|---|---|
| PCA1 | -0.005 | 0.003 | -1.8 | 0.074 | 0.016 | 3.227 | 0.074 |
| Constant | 0 | 0.005 | 0.06 | 0.950 | |||
| PCA2 | 0.024 | 0.004 | 6.71 | 0.000 | 0.187 | 45.019 | 0.000 |
| Constant | 0 | 0.005 | 0.07 | 0.946 | |||
| PCA3 | -0.037 | 0.004 | 9.93 | 0.000 | 0.335 | 98.632 | 0.000 |
| Constant | 0 | 0.004 | 0.08 | 0.94 | |||
| PCA4 | 0.031 | 0.004 | 7.56 | 0.000 | 0.226 | 57.087 | 0.000 |
| Constant | 0 | 0.005 | 0.07 | 0.944 |
In this table, the results OLS regression results are shown. The impact of PCA1, PCA2, PCA3, and PCA4 attention index on SMR (Stock Market Returns) are examined. The results showed that at a 10% significance level, the attention index in PCA1 has a significant impact on SMR; however, with the lowest R2. The PCA2, PCA3 and PCA4 have a significant impact at a 1% significance level with R2 of 0.187, 0.335 and 0.226. The results showed that the PCA3 attention index has moderately good explanatory power but negatively and significantly impacts SMR during the study period.
Disclaimer/Publisher’s Note: The statements, opinions and data contained in all publications are solely those of the individual author(s) and contributor(s) and not of MDPI and/or the editor(s). MDPI and/or the editor(s) disclaim responsibility for any injury to people or property resulting from any ideas, methods, instructions or products referred to in the content. |
© 2025 by the authors. Licensee MDPI, Basel, Switzerland. This article is an open access article distributed under the terms and conditions of the Creative Commons Attribution (CC BY) license (http://creativecommons.org/licenses/by/4.0/).
Copyright: This open access article is published under a Creative Commons CC BY 4.0 license, which permit the free download, distribution, and reuse, provided that the author and preprint are cited in any reuse.


