

Submitted:
09 September 2026
Posted:
11 September 2026
You are already at the latest version
Abstract
Background/Objectives: Physiotherapy practice involves patient handling, sustained or awkward postures, repetitive manual techniques, and prolonged standing. This study estimated Neck Disability Index (NDI)-defined neck disability among physiotherapists in Saudi Arabia, examined demographic and workplace associations with disability severity, and compared quality of life across NDI levels.Methods: A cross-sectional online convenience survey was conducted from 2 April to 22 May 2024 through email and professional networks. The invitation denominator was not tracked, so a response rate could not be calculated. Eligible participants had at least one year of clinical experience. The NDI and WHOQOL-BREF were administered in English. Associations were evaluated using exact tests for sparse tables, Holm adjustment, and a five-variable multinomial model with HC0 robust standard errors. An expanded 11-factor mean bias-reduced multinomial model was the principal sensitivity analysis; additional analyses examined age stability.Results: Among 367 participants, 197 had NDI-defined disability (53.7%; 95% CI, 48.6%–58.7%), predominantly mild (156, 42.5%), and 41 had moderate-or-worse disability (11.2%; 95% CI, 8.3%–14.8%). In the five-variable model, mild disability was associated with female sex (adjusted relative risk ratio [RRR], 2.49; 95% CI, 1.54–4.03) and BMI ≥25 kg/m² (RRR, 2.04; 95% CI, 1.26–3.29); moderate-or-worse disability was associated with non-private employment (RRR, 4.47; 95% CI, 2.06–9.73) and BMI ≥25 kg/m² (RRR, 2.25; 95% CI, 1.05–4.84). The expanded model retained the female-sex/mild and workplace/moderate-or-worse patterns, but the latter BMI interval included 1 (RRR, 2.13; 95% CI, 0.96–4.69). WHOQOL-BREF domain medians were lower across higher NDI levels (all four omnibus Holm-adjusted p < 0.001).Conclusions: Neck disability was common in this convenience sample, and higher NDI severity co-occurred with lower quality-of-life scores. Female-sex and workplace associations were consistent across the principal models; BMI findings require caution. The associations are cross-sectional, exploratory, non-causal, and not nationally representative.
Keywords:
neck-related disability
; neck disability index
; physiotherapists
; quality of life
; occupational health
; Saudi Arabia
1. Introduction
Physiotherapists are exposed to a combination of patient handling, repetitive manual techniques, sustained trunk or neck positions, and prolonged standing. Systematic reviews have consistently identified work-related musculoskeletal disorders (WMSDs) as an important occupational-health concern in this profession [1,2,3,4]. A global meta-analysis of 26 studies estimated pooled neck-region musculoskeletal symptom prevalence at 26.4%, but heterogeneity was very high, reflecting differences in populations, recall periods, instruments, and prevalence denominators [2]. A more recent review likewise identified the lower back, neck, and thumb as frequently affected regions and emphasized the role of manual therapy, patient transfers, static postures, and workload [3]. An ergonomic observational study documented substantial biomechanical exposure during clinical physiotherapy, while a prospective cohort linked patient handling, bent or twisted postures, and manual techniques with subsequent WMSDs [5,6].
A plausible pathway from these exposures to neck-related disability involves repeated cervical flexion or rotation, sustained downward viewing of a treatment table, and forward trunk inclination during manual therapy or patient handling. These tasks may increase muscular demand and fatigue and accompany neck symptoms that interfere with activities such as lifting, reading, work, or sleep [5,6,7,8]. This is a theoretical explanation: the NDI measures perceived consequences of neck symptoms, and an elevated score does not identify their occupational cause. The present survey did not directly measure these postural exposures or test this pathway.
Neck pain contributes substantially to disability burden globally and in the Middle East and North Africa region [9,10]. Estimates among physiotherapists in Saudi Arabia and neighboring countries vary substantially. Saudi studies have reported neck-region WMSD estimates ranging from 26.6% to 59.2%, depending on the outcome definition and recall period [11,12]. Work-related musculoskeletal symptoms have also been reported among physiotherapists in Kuwait and the United Arab Emirates [13,14]. These studies establish that musculoskeletal complaints are common, but most measure symptom occurrence rather than the functional limitations attributable to neck symptoms.
Neck pain and neck-related disability are related but distinct constructs. Neck pain describes a symptom, whereas neck-related disability concerns perceived limitations in activities attributed to neck symptoms. The Neck Disability Index (NDI) combines symptom and activity-related items, including personal care, lifting, reading, concentration, work, driving, sleep, and recreation [7,8]. Symptom prevalence alone cannot distinguish respondents with little interference in daily activities from those with more substantial limitations. NDI scores and severity categories therefore add a standardized description of functional burden to symptom reporting; they do not establish a clinical diagnosis or replace a clinical assessment. Accordingly, an NDI-based study should not be interpreted as estimating neck-pain prevalence alone.
Combining a condition-specific patient-reported measure with a broader quality-of-life instrument can describe complementary aspects of health [15]. The WHOQOL-BREF was selected because it assesses physical health, psychological health, social relationships, and environment within one multidimensional instrument [16]. Comparing these domains across NDI levels allows neck-related functional burden to be considered alongside well-being, relationships, and the wider context of daily life. This provides a more comprehensive occupational-health description than physical symptoms alone, without assuming that neck-related disability causes differences in these domains.
Research among physiotherapists, other healthcare professionals, and general or office-worker populations has examined demographic characteristics, workplace, physical workload, prolonged postures, computer use, psychosocial stress, and body composition in relation to neck symptoms or other WMSDs [1,5,12,17,18,19,20,21,22,23]. These findings provide context rather than direct evidence of NDI-defined disability in Saudi physiotherapists. Nevertheless, evidence specifically describing NDI-defined neck-related disability and its relationship with quality of life among practicing physiotherapists in Saudi Arabia remains limited. This study therefore aimed to estimate the proportion of participating physiotherapists with NDI-defined neck-related disability, examine demographic and workplace associations with disability severity, and compare WHOQOL-BREF domain scores across NDI levels. We hypothesized that NDI severity would vary across selected demographic and workplace characteristics and would be associated with lower WHOQOL-BREF domain scores.
2. Materials and Methods
2.1. Study Design and Reporting
This cross-sectional study was reported with reference to the Strengthening the Reporting of Observational Studies in Epidemiology (STROBE) recommendations [24]. The survey was open from 2 April to 22 May 2024.
2.2. Recruitment and Participants
The survey link was distributed through email and professional networks using non-probability convenience sampling. The invitation targeted physiotherapists practicing in Saudi Arabia, including those working in Ministry of Health hospitals and primary health centers, private medical rehabilitation centers, university hospitals, and military hospitals. Because distribution occurred through open electronic channels and the number of eligible physiotherapists who received or viewed the invitation was not tracked, a response rate could not be calculated.
Eligibility criteria were current physiotherapy practice in Saudi Arabia, at least one year of clinical experience, and electronic consent. Responses were excluded when required data were incomplete or the stated experience was less than one year. The invitation targeted licensed physiotherapists, but professional licensure was not independently verified by a questionnaire item.
2.3. Ethics
The Majmaah University Research Ethics Committee approved the study (registration H-01-R-088; ethics number MUREC-Mar.25/COM-2024/11-1; approval date 25 March 2024; expiry date 25 March 2025). Electronic informed consent was obtained before questionnaire completion.
2.4. Sample-Size Precision
A formal a priori sample-size calculation was not retained in the study records; accordingly, study adequacy is described using the achieved precision rather than a retrospectively reconstructed calculation. With 367 analysed participants, the observed NDI ≥5 proportion of 53.7% had a two-sided 95% Wilson confidence interval of 48.6%–58.7%, corresponding to an approximate half-width of 5.1 percentage points. This describes statistical precision only and does not correct for selection bias or establish national representativeness in a convenience sample.
2.5. Measures
The questionnaire collected age, sex, education, region, workplace, physiotherapy specialty, clinical experience, working hours per day, working days per week, BMI category, and smoking status. The collected variable was labeled “Sex” and offered male and female response categories; therefore, sex terminology is used consistently in this report.
The English NDI contains 10 sections scored from 0 to 5, yielding a total score from 0 to 50; higher scores indicate greater neck-related disability. The standard categories were no disability (0–4), mild disability (5–14), moderate disability (15–24), severe disability (25–34), and complete disability (35–50) [7,8]. These categories describe questionnaire-defined severity and are not clinical diagnoses or measures of fitness for work. Permission to use the NDI was obtained from the copyright holder through Mapi Research Trust.
The English WHOQOL-BREF contains 26 items. Following standard scoring, negatively framed items were reversed and domain means were multiplied by four to produce 4–20 scores for physical health, psychological health, social relationships, and environment; higher scores indicate better quality of life [16]. Permission to use the WHOQOL-BREF was obtained from the World Health Organization. The full copyrighted instruments are not reproduced in the manuscript or supplementary files.
2.6. Data Processing and Statistical Analysis
Of 411 study responses, one was excluded because required data were missing. The remaining 410-response spreadsheet was audited item by item. Forty-three responses from physiotherapists reporting less than one year of clinical experience were excluded, leaving 367 complete eligible responses. No score imputation was used. Trailing spaces in category labels were standardized, and the single “General” specialty entry was harmonized with “General physical therapy.” Exact duplicate response profiles were checked and none were identified; however, duplicate participation could not be definitively excluded because email capture was optional for most respondents. Internal consistency was summarized with Cronbach’s alpha.
The five standard NDI categories were retained for descriptive reporting. Wilson 95% confidence intervals were calculated for any disability (NDI ≥5) and for moderate-or-worse disability (NDI ≥15). Because severe and complete categories were sparse, association analyses used three levels: no disability, mild disability, and moderate-or-worse disability. Age and WHOQOL-BREF scores were compared with Kruskal–Wallis tests. Epsilon-squared was calculated as ε2 = max{0, (H − k + 1)/(n − k)}, where H is the Kruskal–Wallis statistic, k is the number of groups, and n is the total sample. Categorical variables were assessed with Pearson chi-square tests when expected counts were adequate; if any expected cell was <5, a Monte Carlo approximation to the Fisher–Freeman–Halton exact test with 200,000 samples was used. Cramér’s V was reported as the categorical effect size. Holm adjustment was applied across the 11 demographic/work comparisons and separately across the four WHOQOL-BREF domain tests.
Pairwise WHOQOL-BREF comparisons used two-sided Mann–Whitney tests with asymptotic, tie-adjusted p values and no continuity correction. Rank-biserial correlations summarize pairwise effect sizes; Holm adjustment was applied separately to the three comparisons within each domain (Supplementary Table S3).
A proportional-odds model was initially considered. A Brant-type global sandwich Wald test compared predictor slopes from two cumulative binary logistic models while accounting for cross-equation dependence through observation-level influence functions; the slope-difference covariance matrix had rank 5. The parallel-slopes restriction was not supported (χ2 = 15.02, df = 5, p = 0.010) [25]. The adjusted analysis therefore used multinomial logistic regression with no disability as the reference outcome and HC0 Huber–White model-robust sandwich standard errors. After inspection of sparse predictor cells, workplace was post hoc grouped as private medical rehabilitation versus non-private settings, and BMI was post hoc grouped as <25 versus ≥25 kg/m2 to reduce model instability with only 41 participants in the moderate-or-worse group. Sex, age, setting, BMI group, and smoking were entered simultaneously.
The retained five-variable model provides a compact exploratory description of demographic characteristics (sex and age), employment context (workplace), and individual anthropometric and behavioral characteristics (BMI category and smoking). This describes its scope; it does not establish that these five variables are uniquely preferable to the other measured characteristics. A prospectively documented covariate-selection protocol was not available, and the model is not presented as prespecified or as comprehensive confounder control. Its five slopes per outcome contrast (ten in total) limit complexity relative to the 32 slopes per contrast required by all 11 characteristics in their original categories, given only 41 moderate-or-worse observations and several sparse categories. This consideration does not impose a strict five-predictor limit or imply that all omitted variables were sparse. Education, region, specialty, clinical experience, hours/day, and days/week remain described in Table 1 and Table 3 and Supplementary Table S1; their omission from Table 4 is examined in the expanded sensitivity analysis rather than treated as evidence of irrelevance [24,26].
Results are reported as adjusted relative risk ratios (RRRs) with 95% confidence intervals. In these multinomial models, an RRR is the exponentiated coefficient: it describes the multiplicative change in the probability ratio of a specified disability category to no disability for a one-unit predictor change or a category comparison, conditional on the other included variables. It is not a prospective incidence risk ratio. Individual regression coefficient p values and confidence intervals are nominal and were not multiplicity-adjusted; these associations are exploratory. Separately, the expanded sensitivity analysis reports joint factor tests with Holm adjustment across its 11 factors.
In response to peer review, the principal sensitivity analysis was an expanded multinomial model including all 11 measured demographic and work factors in the same 367 participants. The original sex, continuous age, pooled workplace, pooled BMI, and smoking terms were retained; clinical experience was grouped as ≥6 versus 1–5 years, working hours as >8 versus ≤8 hours/day, and working days as 6–7 versus 1–5 days/week. These post hoc groupings limit additional parameters while preserving interpretable occupational contrasts. Education (five categories), specialty (eight categories), and region (five categories) retained their original levels, with bachelor’s degree, orthopedic specialty, and Central region as references. Age was centered at 28 years for numerical stability, without changing its per-year interpretation. The expanded specification estimates 23 slopes per outcome contrast (46 slopes and two intercepts), rather than restoring every original category of the pooled factors. All factors were entered simultaneously without stepwise selection or significance-based screening for this sensitivity analysis. Mean bias-reduced estimation was used through brglm2::brmultinom(type = “AS_mean”) to address sparse-data estimation and separation [27].
The expanded model uses model-based standard errors from the Fisher information evaluated at the bias-reduced estimates, with approximate Wald 95% confidence intervals and two-sided nominal coefficient p values; these are not HC0 intervals or profile-likelihood intervals. Joint Wald tests evaluate each factor across both non-reference outcomes, with Holm adjustment across the 11 joint tests. This adjustment does not apply to individual coefficient confidence intervals or constitute correction across every analysis in the study. Model convergence, full design rank, finite estimates, and covariance calculations were checked. The analysis evaluates sensitivity to broader measured adjustment and a different estimator, without establishing that the original five-variable selection was optimal or that residual confounding has been eliminated (Supplementary Table S2).
Additional sensitivity analyses retained the original workplace and BMI categories, used 2,000 nonparametric bootstrap resamples for age, modelled age in post hoc categories (21–26, 27–29, and 30–42 years), and evaluated a centered quadratic age term. The exact bootstrap resampling indices are supplied so that the reported percentile intervals can be reproduced exactly. The original statistical workflow was executed in R 4.6.1 using nnet 7.3-20, sandwich 3.1-3, and MASS 7.3-65. The expanded sensitivity model was executed in R 4.6.1 using brglm2 1.1.0; the corresponding verification environment included nnet 7.3-21 and sandwich 3.1-3. The deidentified dataset, reproducible R implementation, and both session records are provided as supplementary materials. Two-sided p < 0.05 was considered statistically significant within the stated analysis and multiplicity framework.
2.7. Use of Generative Artificial Intelligence
OpenAI ChatGPT (https://chatgpt.com), including GPT-5.6 Sol during earlier manuscript preparation, was used for English-language editing, document formatting, consistency checks, assistance with preparation and checking of R analysis code, and preparation of submission-support materials. Statistical estimates were obtained by executing R code. The authors reviewed and verified the final manuscript and take full responsibility for its content.
3. Results
3.1. Participant Flow and Characteristics
A total of 411 study responses were received. One response was excluded because required data were missing, and 43 responses were excluded because respondents reported less than one year of clinical experience. The analytic sample therefore comprised 367 participants (Figure 1).
Median age was 28 years (IQR, 26–30; range, 21–42), and 208 participants (56.7%) were female. Most held a bachelor’s degree (321, 87.5%), worked in private medical rehabilitation centers (230, 62.7%), practiced in orthopedics (180, 49.0%), and had one to five years of clinical experience (320, 87.2%) (Table 1).
The median NDI score was 5.0 (IQR, 2.0–10.0). Cronbach’s alpha was 0.844 for the NDI, 0.769 for WHOQOL-BREF physical health, 0.663 for psychological health, 0.787 for social relationships, and 0.852 for environment. The psychological-domain estimate was below 0.70 and is considered when interpreting that domain (Table 2).
3.2. NDI-Defined Neck-Related Disability
Overall, 197 participants had an NDI score ≥5 (53.7%; 95% CI, 48.6%–58.7%). Mild disability was most common (156, 42.5%), followed by moderate disability (35, 9.5%), severe disability (5, 1.4%), and complete disability (1, 0.3%); 170 participants (46.3%) had no disability. In total, 41 participants had moderate-or-worse disability (NDI ≥15; 11.2%; 95% CI, 8.3%–14.8%) (Figure 2).
3.3. Bivariate Associations
In the three-level analysis, sex was associated with NDI level (χ2 = 10.77, df = 2, raw p = 0.005, Cramér’s V = 0.171; Holm-adjusted p = 0.046). Among males, 44.0% had mild or moderate-or-worse disability, compared with 61.1% of females. Workplace was associated with NDI level (Fisher–Freeman–Halton Monte Carlo p < 0.001, Holm-adjusted p = 0.004, Cramér’s V = 0.211). BMI also showed an unadjusted association (Monte Carlo p = 0.006, Cramér’s V = 0.149), but its Holm-adjusted p value was 0.056. Age showed a small unadjusted difference across NDI levels (H = 6.01, raw p = 0.050, ε2 = 0.011) that did not remain significant after Holm adjustment (p = 0.396). Education, region, specialty, experience, working hours, working days, and smoking were not associated with NDI level after multiplicity adjustment (Table 3; Supplementary Table S1).
3.4. Adjusted Multinomial Analysis
The five-variable multinomial model converged and was significant overall (likelihood-ratio χ2 = 48.47, df = 10, p < 0.001; McFadden pseudo-R2 = 0.068). For mild disability versus no disability, positive adjusted associations were observed for female versus male sex (RRR, 2.49; 95% CI, 1.54–4.03; p < 0.001) and BMI ≥25 versus <25 kg/m2 (RRR, 2.04; 95% CI, 1.26–3.29; p = 0.004).
For moderate-or-worse disability versus no disability, positive adjusted associations were observed for non-private versus private rehabilitation employment (RRR, 4.47; 95% CI, 2.06–9.73; p < 0.001) and BMI ≥25 versus <25 kg/m2 (RRR, 2.25; 95% CI, 1.05–4.84; p = 0.037). Each additional year of age had an inverse association in the continuous-age model (RRR, 0.84; 95% CI, 0.74–0.95; p = 0.008), with a 2,000-resample percentile bootstrap interval of 0.71–0.94. However, age was not significant after Holm adjustment in the bivariate analysis, the detailed original-category model yielded RRR 0.86 (95% CI, 0.74–1.00), and categorical age estimates had confidence intervals crossing 1. The age association is therefore treated as exploratory and model-dependent rather than a principal finding (Table 4; Supplementary Table S4).
The principal expanded 11-factor mean bias-reduced model converged with a full-rank design and finite estimates for all terms (n = 367; Supplementary Table S2). For mild versus no disability, the female-sex estimate was RRR 2.66 (95% CI, 1.56–4.51; nominal p < 0.001), and the BMI ≥25 estimate was RRR 1.98 (95% CI, 1.17–3.34; nominal p = 0.011). For moderate-or-worse versus no disability, the non-private workplace estimate was RRR 5.58 (95% CI, 2.35–13.23; nominal p < 0.001). The BMI estimate remained similar to the five-variable result but was less precise (RRR, 2.13; 95% CI, 0.96–4.69; nominal p = 0.062); the age estimate was RRR 0.85 per year (95% CI, 0.74–0.99; nominal p = 0.031). Joint factor tests across both outcome contrasts remained significant after Holm adjustment for sex (p = 0.014) and workplace (p = 0.0014), but not BMI (p = 0.216), age (p = 0.756), or the other factors. Several sparse education and specialty estimates were highly imprecise; lack of statistical evidence does not establish absence of an association. These findings support the consistency of the female-sex/mild and workplace/moderate-or-worse patterns while requiring cautious interpretation of BMI, age, and sparse subgroup estimates.
The centered quadratic age term was not statistically significant in either outcome contrast (p = 0.265 for mild versus no disability and p = 0.311 for moderate-or-worse versus no disability), providing no clear evidence of age nonlinearity. The original-category sensitivity model produced point estimates that were not uniformly directional; their wide confidence intervals preclude firm conclusions about differences between individual categories. For mild disability, overweight BMI had an RRR of 2.52 (95% CI, 1.50–4.24), whereas obesity had an RRR of 0.35 (95% CI, 0.08–1.62) based on only 13 participants with obesity. Similarly, the mild-disability estimate for military hospitals was 0.55 (95% CI, 0.21–1.41), whereas the pooled non-private estimate was 1.10. Thus, the grouped BMI and workplace results are parsimonious model summaries that can mask non-monotonic or setting-specific patterns (Supplementary Table S2).
3.5. Quality of Life Across NDI Levels
WHOQOL-BREF domain medians decreased across higher NDI levels. The largest omnibus difference was observed for physical health (H = 74.29, Holm-adjusted p < 0.001, ε2 = 0.199), followed by psychological health (H = 41.15, adjusted p < 0.001, ε2 = 0.108), environment (H = 34.78, adjusted p < 0.001, ε2 = 0.090), and social relationships (H = 16.01, adjusted p < 0.001, ε2 = 0.038) (Table 5). Pairwise comparisons with within-domain Holm adjustment are provided in Supplementary Table S3. The mild versus moderate-or-worse contrast was significant for physical health (adjusted p = 0.002) and environment (adjusted p = 0.047), but not for psychological health (adjusted p = 0.136) or social relationships (adjusted p = 0.659). Thus, significant omnibus differences do not imply that every pair of NDI groups differed in every domain.
4. Discussion
4.1. Principal Findings
In this convenience sample of physiotherapists practicing in Saudi Arabia, 53.7% met the NDI threshold for some degree of neck-related disability, most of which was mild, and 11.2% had moderate-or-worse disability. Female sex and BMI ≥25 kg/m2 were associated with mild disability in the five-variable model; BMI ≥25 kg/m2 and the pooled non-private setting variable were associated with moderate-or-worse disability. The expanded sensitivity model retained the female-sex/mild and workplace/moderate-or-worse patterns, whereas the moderate-or-worse BMI estimate remained similar but its confidence interval included 1. Sex and workplace were the only factors with Holm-adjusted joint p < 0.05 in that expanded model. The pooled predictors were heterogeneous in the original-category sensitivity model. All four quality-of-life domains were lower at higher NDI levels. The inverse continuous-age estimate was exploratory and model-dependent. These are cross-sectional associations and do not establish temporal or causal relationships.
4.2. Comparison with Previous Research
The observed NDI-defined proportion should not be equated directly with neck-pain or WMSD symptom prevalence. The global physiotherapist meta-analysis estimated pooled neck-region symptom prevalence at 26.4%, but heterogeneity was high and the included studies used differing instruments, recall periods, and denominators [2]. In the present sample, 11.2% (95% CI, 8.3%–14.8%) had NDI scores ≥15, indicating moderate-or-worse neck-related disability; this threshold is more clinically substantial than NDI ≥5 but still is not equivalent to a symptom-prevalence definition. Saudi studies have reported neck-region WMSD estimates of 26.6% and 59.2% [11,12], while a 2025 UAE study reported neck symptoms in 28.7% of respondents [14]. NDI-based studies in physiotherapists have also reported substantial neck-related limitations, but differences in samples and scoring make direct numerical comparison difficult [28,29]. The present results are therefore best interpreted as sample-specific NDI distributions rather than national neck-pain prevalence.
An important contribution of the present study is its description of the degree of neck-related functional burden using the NDI. The distinction between predominantly mild disability and the smaller moderate-or-worse group conveys information that a single symptom-prevalence estimate would miss. The NDI addresses consequences for daily activities and work alongside symptoms, helping characterize how respondents are affected [7,8]. It does not establish a neck disorder diagnosis, work incapacity, or an indication for treatment, and no item-level occupational performance outcomes were analysed here. The contribution is the combined description of NDI severity and multidimensional quality of life in this sample, rather than the first use of the NDI among physiotherapists [28,29].
The sex pattern is broadly consistent with the systematic review by Vieira et al. and the Saudi study by Kakaraparthi et al., which reported greater musculoskeletal symptom burden among female physiotherapists in some analyses [1,12]. However, sex associations are not consistent across studies; the UAE study did not identify a statistically significant sex difference [14]. In the present data, the bivariate sex association remained significant after Holm correction (adjusted p = 0.046). In the adjusted model, the female-sex estimate was statistically significant for mild versus no disability, whereas the moderate-or-worse estimate was imprecise and its confidence interval included 1. Significance in one contrast and non-significance in another do not establish that the coefficients differ. The decision to use multinomial regression rests on the formal proportional-slopes assessment reported in Section 2.6.
The association between the pooled non-private setting variable and moderate-or-worse disability is compatible with prior observations that work setting may influence workload, patient mix, equipment, direct-contact time, and organizational demands [1,2,3,12]. However, the detailed sensitivity estimates varied across settings and were imprecise. The military-hospital estimate below 1 concerned mild versus no disability (RRR, 0.55; 95% CI, 0.21–1.41); for moderate-or-worse versus no disability, its estimate was above 1 (RRR, 2.31; 95% CI, 0.69–7.75). Neither military-hospital interval excluded 1. The pooled estimate therefore summarizes a heterogeneous set of settings and should be viewed as a signal for targeted exposure measurement, not evidence that non-private employment as a whole causes disability. The expanded model also yielded a positive pooled workplace estimate for moderate-or-worse disability (RRR, 5.58; 95% CI, 2.35–13.23), supporting the consistency of this conditional association after broader measured adjustment, without resolving the heterogeneity within non-private settings.
BMI ≥25 kg/m2 was associated with both severity contrasts in the parsimonious model, whereas Muaidi and Shanb reported no BMI association with WMSDs [11]. The original-category sensitivity analysis showed a non-monotonic pattern: overweight BMI was associated with mild disability, while the obesity estimate was below 1 and highly imprecise because only 13 participants were obese. The pooled ≥25 kg/m2 result should therefore not be interpreted as evidence of a dose-response relationship. The inverse continuous-age association was confined to moderate-or-worse disability and persisted in the exact archived bootstrap resamples, but it was not supported after multiplicity adjustment in the bivariate analysis, weakened in the detailed model, and was not statistically precise when age was categorized. Given the narrow age distribution and only 41 moderate-or-worse observations relative to the five adjusted predictors, no firm age-related inference is warranted. In the expanded model, the moderate-or-worse BMI estimate was 2.13 (95% CI, 0.96–4.69; nominal p = 0.062), compared with 2.25 (95% CI, 1.05–4.84) in the five-variable model. The similar estimates with differing precision do not establish that the association disappeared. The mild-disability BMI contrast remained nominally significant, but the expanded model’s joint BMI test did not remain significant after Holm adjustment (p = 0.216); the joint age test likewise did not (p = 0.756). Because the expanded model changes both the adjustment set and the estimation method, differences between models cannot be attributed solely to additional covariate adjustment.
The predominance of respondents with 1–5 years of experience (320/367, 87.2%) is also relevant to occupational-health interpretation. Previous physiotherapist research has described WMSD onset early in professional practice, and qualitative work with final-year students highlights challenges in selecting feasible workplace injury-prevention strategies [30,31]. Early-career clinicians may encounter frequent direct patient handling and substantial physical demands while developing practical ergonomic adaptations. Lower seniority may also limit control over caseload, breaks, task allocation, or choice of work setting. These are plausible contextual explanations, not measured characteristics of this cohort: ergonomic adaptation, clinical autonomy, and patient-handling frequency were not assessed. Moreover, clinical experience was not associated with NDI category in the bivariate analysis (Holm-adjusted p = 1.000), and relatively few participants had more than five years of experience. The sample composition therefore supports attention to early-career occupational health but does not demonstrate that less experience causes greater disability.
WHOQOL-BREF scores were lower at higher NDI levels, with the largest effect in physical health. This pattern is consistent with previous research reporting associations between WMSDs, lower quality of life, and workplace stress among physical therapists [32]. Some conceptual overlap is expected because the NDI assesses functional limitations while WHOQOL-BREF domains capture related dimensions of daily health and well-being. The psychological-domain finding should be interpreted with additional caution because its internal-consistency estimate was 0.663 in this sample. The findings demonstrate concurrent association, not that neck-related disability caused lower quality of life.
An earlier, non-peer-reviewed report of this research, “The Prevalence and Associated Factors of Neck Disability Among Physiotherapists in Saudi Arabia,” was posted on Preprints.org on 25 March 2025 [33]. The present report is a reanalysis of the same survey, not an independent cohort. The authors confirm that 433 responses in the preprint was a typographical error: 411 responses were received; one response with missing required data was excluded, producing the retained 410-response export, and 43 respondents with less than one year of clinical experience were excluded, leaving 367 complete eligible participants. Thus, the preprint’s analysis denominator of 411 is superseded by 367, while 410 is an intermediate count; exclusion for less than one year implements an eligibility criterion already stated in the preprint, and no missing scores were imputed. The total received and the incomplete-response exclusion follow the authors’ clarification; the retained export and analysis dataset support the 410-to-367 eligibility step. The current workflow audits category labels and recomputes questionnaire scores from item responses: all ten NDI items are scored 0–5 and summed to 0–50, with the five standard categories retained descriptively (170 no, 156 mild, 35 moderate, 5 severe, and 1 complete disability), while sparse severe and complete categories are combined with moderate disability for inference. The current estimates are 197/367 with any disability (53.7%; Wilson 95% CI, 48.6%–58.7%) and 41/367 with moderate-or-worse disability (11.2%; 95% CI, 8.3%–14.8%). Whereas the preprint presented WHOQOL-BREF domains in verbal categories, the current analysis verifies reverse coding of items 3, 4, and 26 and evaluates each domain separately as its item mean multiplied by four, on the 4–20 scale, without a combined domain total; earlier scoring syntax was unavailable, so a specific original coding error is not asserted. Compared with the preprint’s reported chi-square and Kruskal–Wallis analyses, the current workflow adds sparse-table Fisher–Freeman–Halton Monte Carlo inference with 200,000 samples, Cramér’s V and epsilon-squared, and Holm adjustment across 11 demographic/work comparisons, four WHOQOL-BREF domain tests, and three pairwise comparisons within each domain; pairwise Mann–Whitney tests are two-sided, asymptotic and tie-adjusted, without continuity correction, and include rank-biserial effect sizes. The preprint emphasized a workplace-only multinomial model; the current main model simultaneously includes sex, continuous age, workplace, BMI category, and smoking, after a Brant-type assessment did not support proportional slopes (χ2 = 15.02, df = 5, p = 0.010), with post hoc workplace/BMI pooling, HC0 robust standard errors, and adjusted RRRs with nominal coefficient inference. The original-category workplace/BMI model, 2,000 archived bootstrap resamples for age, post hoc categorical age, and centered quadratic age analyses were already part of the JCM submission; the expanded 11-factor mean bias-reduced model and its separately Holm-adjusted joint factor tests were added during peer review. The original five-variable model remains a limited exploratory specification, and neither robust standard errors nor expanded adjustment establishes complete control of confounding. The preprint named SPSS 26; the current R workflow provides the deidentified dataset, data dictionary, analysis code, exact bootstrap indices and coefficients, and session information. The current WHOQOL-BREF domain medians are lower at higher NDI levels, with all four omnibus Holm-adjusted p < 0.001, superseding the preprint’s interpretation that quality of life was unaffected; mild versus moderate-or-worse adjusted pairwise p values are 0.002, 0.136, 0.659, and 0.047 for physical health, psychological health, social relationships, and environment, respectively, so omnibus differences do not imply differences between every pair. The current adjusted associations, including the uncertainty of the moderate-or-worse BMI estimate in the expanded analysis, concern different eligibility, coding, adjustment, and inference from the preliminary report; changes cannot be attributed exclusively to sample size, software, scoring, or multiplicity correction, and remain non-causal. Wael Alghamdi was added relative to the preprint for data interpretation and writing—review and editing, with final approval and accountability; he was already listed in the manuscript supplied to JCM, and formal analysis remains assigned to M.A. Funding was awarded before the preprint and acknowledged there, but its Funding section incorrectly described the study as unfunded; the current Funding declaration corrects disclosure of existing support rather than reporting a subsequent new award, and the declared funder role is unchanged. Descriptions of methods not reported in the preprint concern reporting and do not establish that those procedures were never performed. The current results and interpretation supersede the preliminary report.
4.3. Strengths
Strengths include recruitment across all five Saudi regions and multiple workplace types, use of established patient-reported instruments with documented permissions, direct re-audit of scoring rules, exact testing for sparse contingency tables, multiplicity adjustment for exploratory bivariate analyses and the expanded model’s joint factor tests, assessment of model assumptions, HC0 robust standard errors, an expanded mean bias-reduced sensitivity model including all 11 measured factors, explicit age-stability analyses, and transparent reporting of post hoc predictor pooling and its heterogeneity. The primary statistical workflow was executed in R 4.6.1 with captured session information; the deidentified numeric dataset, data dictionary, exact bootstrap draws, and reproducible R analysis code are supplied with the submission. Reporting has been aligned with STROBE [24].
4.4. Limitations and Implications
The study has several limitations. First, its cross-sectional design precludes causal or temporal inference. Second, open electronic convenience recruitment creates selection bias; the invitation denominator was unavailable, so response rate could not be calculated, and the sample cannot be assumed representative of all Saudi physiotherapists. Third, licensure was targeted in recruitment but not independently verified. Fourth, all measures were self-reported, BMI was recorded as a self-selected category rather than measured, no clinical examination was performed, and duplicate participation could not be completely excluded because most email fields were blank. The use of English-language instruments may also have favored respondents with greater English proficiency. Fifth, detailed ergonomic exposure, patient-handling frequency, caseload, psychosocial factors, physical activity, and relevant comorbidities were not measured. Sixth, the sample was young and concentrated in the one-to-five-year experience category, limiting comparisons across career stages. Some self-reported age–experience combinations were unusual; checking the original export confirmed the recorded values, but their accuracy could not be independently established. Seventh, sparse severe and complete categories required outcome aggregation, and sparse predictor cells led to post hoc workplace and BMI pooling. The primary pooled estimates mask heterogeneity across original categories, while the moderate-or-worse subgroup remained small. The continuous-age estimate was sensitive to model specification and should be considered exploratory. The five-variable model does not adjust for education, region, specialty, experience, hours/day, or days/week; the post hoc expanded sensitivity model includes these measured factors but cannot establish that either specification achieves complete confounder control. The absence of a prospectively documented selection protocol and the exploratory category pooling remain limitations. The expanded model estimates 46 slopes plus two intercepts, and some education and specialty categories contain very few participants. Mean bias reduction produced finite estimates, but several confidence intervals were extremely wide; convergence and finite estimates do not establish adequate precision or eliminate residual confounding. Robust standard errors in the original model do not remove sparse-data bias, and the expanded model uses model-based approximate Wald inference, with nominal coefficient intervals and a separate Holm-adjusted family of joint factor tests. Eighth, internal consistency of the psychological WHOQOL-BREF domain was 0.663. Finally, overlap between neck-related disability content and WHOQOL-BREF domains may inflate some concurrent associations.
The results do not demonstrate the effectiveness of screening, ergonomic assessment, or occupational-health interventions. They identify questions for future evaluation. Probability-based or registry-supported sampling would improve representativeness; prospective cohorts should measure patient transfers, manual therapy exposure, posture, workload, psychosocial demands, and physical activity using standardized definitions. Intervention studies could then test whether organizational, ergonomic, educational, or workload modifications reduce incident neck symptoms and disability.
5. Conclusions
More than half of the participating physiotherapists reported some degree of NDI-defined neck-related disability, predominantly mild, and 11.2% had moderate-or-worse disability. In the five-variable model, female sex and BMI grouping were associated with mild disability, while BMI grouping and the heterogeneous pooled workplace variable were associated with moderate-or-worse disability relative to no disability. The expanded 11-factor sensitivity analysis supported the female-sex/mild and workplace/moderate-or-worse patterns; the moderate-or-worse BMI interval included 1, and BMI and age findings require caution. Higher NDI levels co-occurred with lower quality-of-life scores in all WHOQOL-BREF domains. These findings are exploratory, non-causal, and not nationally representative; they identify priorities for representative longitudinal research with direct measurement of occupational exposures rather than demonstrating the effectiveness of screening or intervention strategies.
Supplementary Materials
The following supporting information can be downloaded at the website of this paper posted on Preprints.org, Table S1: Full crosstabs; Table S2: Principal expanded 11-factor bias-reduced sensitivity analysis and retained original workplace/BMI-category sensitivity analysis, with accompanying coefficient and joint-test CSV files; Table S3: Quality-of-life pairwise comparisons; Table S4: Age stability analyses; Data S5: Deidentified analysis dataset; File S6: Data dictionary; Code S7: Reproducible R analysis; File S8: Age bootstrap log coefficients; File S9: Exact 2,000-resample bootstrap indices; File S10: R session information for the original and expanded analyses.
Author Contributions
Conceptualization, M.A.; methodology, M.A.; formal analysis, M.A.; writing—original draft preparation, M.A. and A.S.A.; writing—review and editing, W.A.; funding acquisition, M.A.; supervision, M.A.; data curation, A.S.A.; resources, A.S.A. W.A. also contributed to interpretation of the data. All authors have approved the version to be published and agree to be accountable for the work, including the investigation and resolution of questions concerning its accuracy or integrity.
Funding
The authors extend their appreciation to the Deanship of Postgraduate Studies and Scientific Research at Majmaah University for funding this research work through project number (R-2026-000). The funder had no role in the study design; data collection, analysis, or interpretation; preparation of the manuscript; or the decision to submit the manuscript for publication.
Institutional Review Board Statement
The Majmaah University Research Ethics Committee approved the study (registration H-01-R-088; ethics number MUREC-Mar.25/COM-2024/11-1; approval date 25 March 2024; expiry date 25 March 2025).
Informed Consent Statement
Electronic informed consent was obtained before questionnaire completion.
Data Availability Statement
The deidentified numeric analysis dataset (Data S5), data dictionary (File S6), reproducible R analysis script (Code S7), archived bootstrap coefficients (File S8), exact 2,000-resample bootstrap indices (File S9), expanded-model coefficient and joint-test outputs (Table S2 companion files), and R session information (File S10) are provided with this submission. Copyrighted questionnaire wording, timestamps, email addresses, and free-text fields are not included. The original survey export is not publicly shared because it contains potentially identifying information and copyrighted instrument text.
Conflicts of Interest
All authors declare no competing interests.
References
- Vieira, E.R.; Schneider, P.; Guidera, C.; Gadotti, I.C.; Brunt, D. Work-related musculoskeletal disorders among physical therapists: a systematic review. J. Back. Musculoskelet. Rehabil. 2016, 29(3), 417–428. [Google Scholar] [CrossRef] [PubMed]
- Gorce, P.; Jacquier-Bret, J. Global prevalence of musculoskeletal disorders among physiotherapists: a systematic review and meta-analysis. BMC Musculoskelet. Disord. 2023, 24, 265. [Google Scholar] [CrossRef] [PubMed]
- Gorce, P.; Jacquier-Bret, J. A systematic review of work related musculoskeletal disorders among physical therapists and physiotherapists. J. Bodyw. Mov. Ther. 2024, 38, 350–367. [Google Scholar] [CrossRef] [PubMed]
- Jacquier-Bret, J.; Gorce, P. Prevalence of body area work-related musculoskeletal disorders among healthcare professionals: a systematic review. Int. J. Environ. Res. Public Health 2023, 20(1), 841. [Google Scholar] [CrossRef] [PubMed]
- Fan, L.J.; Liu, S.; Jin, T.; Gan, J.G.; Wang, F.Y.; Wang, H.T.; Lin, T. Ergonomic risk factors and work-related musculoskeletal disorders in clinical physiotherapy. Front. Public Health 2022, 10, 1083609. [Google Scholar] [CrossRef] [PubMed]
- Campo, M.; Weiser, S.; Koenig, K.L.; Nordin, M. Work-related musculoskeletal disorders in physical therapists: a prospective cohort study with 1-year follow-up. Phys. Ther. 2008, 88(5), 608–619. [Google Scholar] [CrossRef] [PubMed]
- Vernon, H.; Mior, S. The Neck Disability Index: a study of reliability and validity. J. Manip. Physiol. Ther. 1991, 14(7), 409–415. [Google Scholar]
- MacDermid, J.C.; Walton, D.M.; Avery, S.; Blanchard, A.; Etruw, E.; McAlpine, C.; Goldsmith, C.H. Measurement properties of the Neck Disability Index: a systematic review. J. Orthop. Sports Phys. Ther. 2009, 39(5), 400–417. [Google Scholar] [CrossRef] [PubMed]
- GBD 2021 Neck Pain Collaborators. Global, regional, and national burden of neck pain, 1990–2020, and projections to 2050: a systematic analysis of the Global Burden of Disease Study 2021. Lancet Rheumatol. 2024, 6(3), e142–e155. [Google Scholar] [CrossRef] [PubMed]
- Ahangar-Sirous, R.; Alizadeh, M.; Nejadghaderi, S.A.; Noori, M.; Khabbazi, A.; Sullman, M.J.M.; Kolahi, A.A.; Collins, G.S.; Safiri, S. The burden of neck pain in the Middle East and North Africa region, 1990–2019. Heliyon 2023, 9(11), e21296. [Google Scholar] [CrossRef] [PubMed]
- Muaidi, Q.I.; Shanb, A.A. Prevalence causes and impact of work related musculoskeletal disorders among physical therapists. J. Back. Musculoskelet. Rehabil. 2016, 29(4), 763–769. [Google Scholar] [CrossRef] [PubMed]
- Kakaraparthi, V.N.; Vishwanathan, K.; Gadhavi, B.; Reddy, R.S.; Samuel, P.S.; Alshahrani, M.S.; Kakaraparthi, L.; Gannamaneni, V.K.; Tedla, J.S. The prevalence, characteristics, and impact of work-related musculoskeletal disorders among physical therapists in the Kingdom of Saudi Arabia: a cross-sectional study. Med. Pr. 2021, 72(4), 363–373. [Google Scholar] [CrossRef] [PubMed]
- Alrowayeh, H.N.; Alshatti, T.A.; Aljadi, S.H.; Fares, M.; Alshamire, M.M.; Alwazan, S.S. Prevalence, characteristics, and impacts of work-related musculoskeletal disorders: a survey among physical therapists in the State of Kuwait. BMC Musculoskelet. Disord. 2010, 11, 116. [Google Scholar] [CrossRef] [PubMed]
- Alshuweihi, H.H.; Mohammad Zadeh, S.A.; Al-Sharman, A.; Nambi, G.; Azab, A.R.; Elsayed, S.H.; Abdelbaset, W.K.; Abdelbasset, W.K. Prevalence and risk factors associated with work-related musculoskeletal disorders among physiotherapists in United Arab Emirates. Sci. Rep. 2025, 15, 38878. [Google Scholar] [CrossRef] [PubMed]
- Churruca, K.; Pomare, C.; Ellis, L.A.; Long, J.C.; Henderson, S.B.; Murphy, L.E.D.; Leahy, C.J.; Braithwaite, J. Patient-reported outcome measures (PROMs): a review of generic and condition-specific measures and a discussion of trends and issues. Health Expect. 2021, 24(4), 1015–1024. [Google Scholar] [CrossRef] [PubMed]
- The WHOQOL Group. Development of the World Health Organization WHOQOL-BREF quality of life assessment. Psychol. Med. 1998, 28(3), 551–558. [Google Scholar] [CrossRef] [PubMed]
- Almogbil, I.H.; Alrashidi, L.R.; Alhajlah, R.S.; Alqasim, A.K.; Alharbi, N.S.; Alghamdi, M.A.; Alshahrani, A.H. Prevalence of shoulder and neck pain among healthcare workers in the central region of Saudi Arabia. Cureus 2023, 15(7), e42286. [Google Scholar] [CrossRef] [PubMed]
- Yang, H.; Haldeman, S.; Nakata, A.; Choi, B.; Delp, L.; Baker, D. Work-related risk factors for neck pain in the US working population. Spine 2015, 40(3), 184–192. [Google Scholar] [CrossRef] [PubMed]
- Jun, D.; Zoe, M.; Johnston, V.; O’Leary, S. Physical risk factors for developing non-specific neck pain in office workers: a systematic review and meta-analysis. Int. Arch. Occup. Environ. Health 2017, 90(5), 373–410. [Google Scholar] [CrossRef] [PubMed]
- Kim, R.; Wiest, C.; Clark, K.; Cook, C.; Horn, M. Identifying risk factors for first-episode neck pain: a systematic review. Musculoskelet. Sci. Pract. 2018, 33, 77–83. [Google Scholar] [CrossRef] [PubMed]
- Jahre, H.; Grotle, M.; Smedbråten, K.; Dunn, K.M.; Øiestad, B.E. Risk factors for non-specific neck pain in young adults: a systematic review. BMC Musculoskelet. Disord. 2020, 21, 366. [Google Scholar] [CrossRef] [PubMed]
- Malińska, M.; Bugajska, J.; Bartuzi, P. Occupational and non-occupational risk factors for neck and lower back pain among computer workers: a cross-sectional study. Int. J. Occup. Saf. Ergon. 2021, 27(4), 1108–1115. [Google Scholar] [CrossRef] [PubMed]
- Alghadir, A.; Zafar, H.; Iqbal, Z.A.; Al-Eisa, E. Work-related low back pain among physical therapists in Riyadh, Saudi Arabia. Workplace Health Saf. 2017, 65(8), 337–345. [Google Scholar] [CrossRef] [PubMed]
- von Elm, E.; Altman, D.G.; Egger, M.; Pocock, S.J.; Gøtzsche, P.C.; Vandenbroucke, J.P.; STROBE Initiative. The Strengthening the Reporting of Observational Studies in Epidemiology statement: guidelines for reporting observational studies. The Lancet 2007, 370(9596), 1453–1457. [Google Scholar] [CrossRef] [PubMed]
- Brant, R. Assessing proportionality in the proportional odds model for ordinal logistic regression. Biometrics 1990, 46(4), 1171–1178. [Google Scholar] [CrossRef]
- Vandenbroucke, J.P.; von Elm, E.; Altman, D.G.; Gøtzsche, P.C.; Mulrow, C.D.; Pocock, S.J.; Poole, C.; Schlesselman, J.J.; Egger, M.; STROBE Initiative. Strengthening the Reporting of Observational Studies in Epidemiology (STROBE): explanation and elaboration. PLoS Med. 2007, 4(10), e297. [Google Scholar] [CrossRef] [PubMed]
- Kosmidis, I.; Firth, D. Multinomial logit bias reduction via the Poisson log-linear model. Biometrika 2011, 98(3), 755–759. [Google Scholar] [CrossRef]
- Głowiński, S.; Bryndal, A.; Grochulska, A. Prevalence and risk of spinal pain among physiotherapists in Poland. PeerJ 2021, 9, e11715. [Google Scholar] [CrossRef] [PubMed]
- Aljinović, J.; Barun, B.; Benzon, B.; Marinović, I.; Aljinović, A.; Poljičanin, A. Neck Disability Index detects higher neck-related disability levels among physiotherapists and family medicine specialists than among dentists. Healthcare 2023, 11(4), 581. [Google Scholar] [CrossRef] [PubMed]
- Adegoke, B.O.A.; Akodu, A.K.; Oyeyemi, A.L. Work-related musculoskeletal disorders among Nigerian physiotherapists. BMC Musculoskelet. Disord. 2008, 9, 112. [Google Scholar] [CrossRef] [PubMed]
- Potter, M.; Jones, S. Entry-level physiotherapists’ strategies to lower occupational injury risk in physiotherapy: a qualitative study. Physiother. Theory Pract. 2006, 22(6), 329–336. [Google Scholar] [CrossRef] [PubMed]
- Bae, Y.H.; Min, K.S. Associations between work-related musculoskeletal disorders, quality of life, and workplace stress in physical therapists. Ind. Health 2016, 54(4), 347–353. [Google Scholar] [CrossRef] [PubMed]
- Alqarni, A.S.A.; Alzhrani, M. The Prevalence and Associated Factors of Neck Disability Among Physiotherapists in Saudi Arabia. Preprints.org, version 1, posted 25 March 2025. Not peer-reviewed. 2025. Available online: https://www.preprints.org/manuscript/202503.1875 (accessed on 8 September 2026).
Figure 1.
Participant flow. Of 411 responses received, 44 were excluded: one because required data were missing and 43 because respondents reported less than one year of clinical experience. The final analytic sample comprised 367 participants.
Figure 1.
Participant flow. Of 411 responses received, 44 were excluded: one because required data were missing and 43 because respondents reported less than one year of clinical experience. The final analytic sample comprised 367 participants.
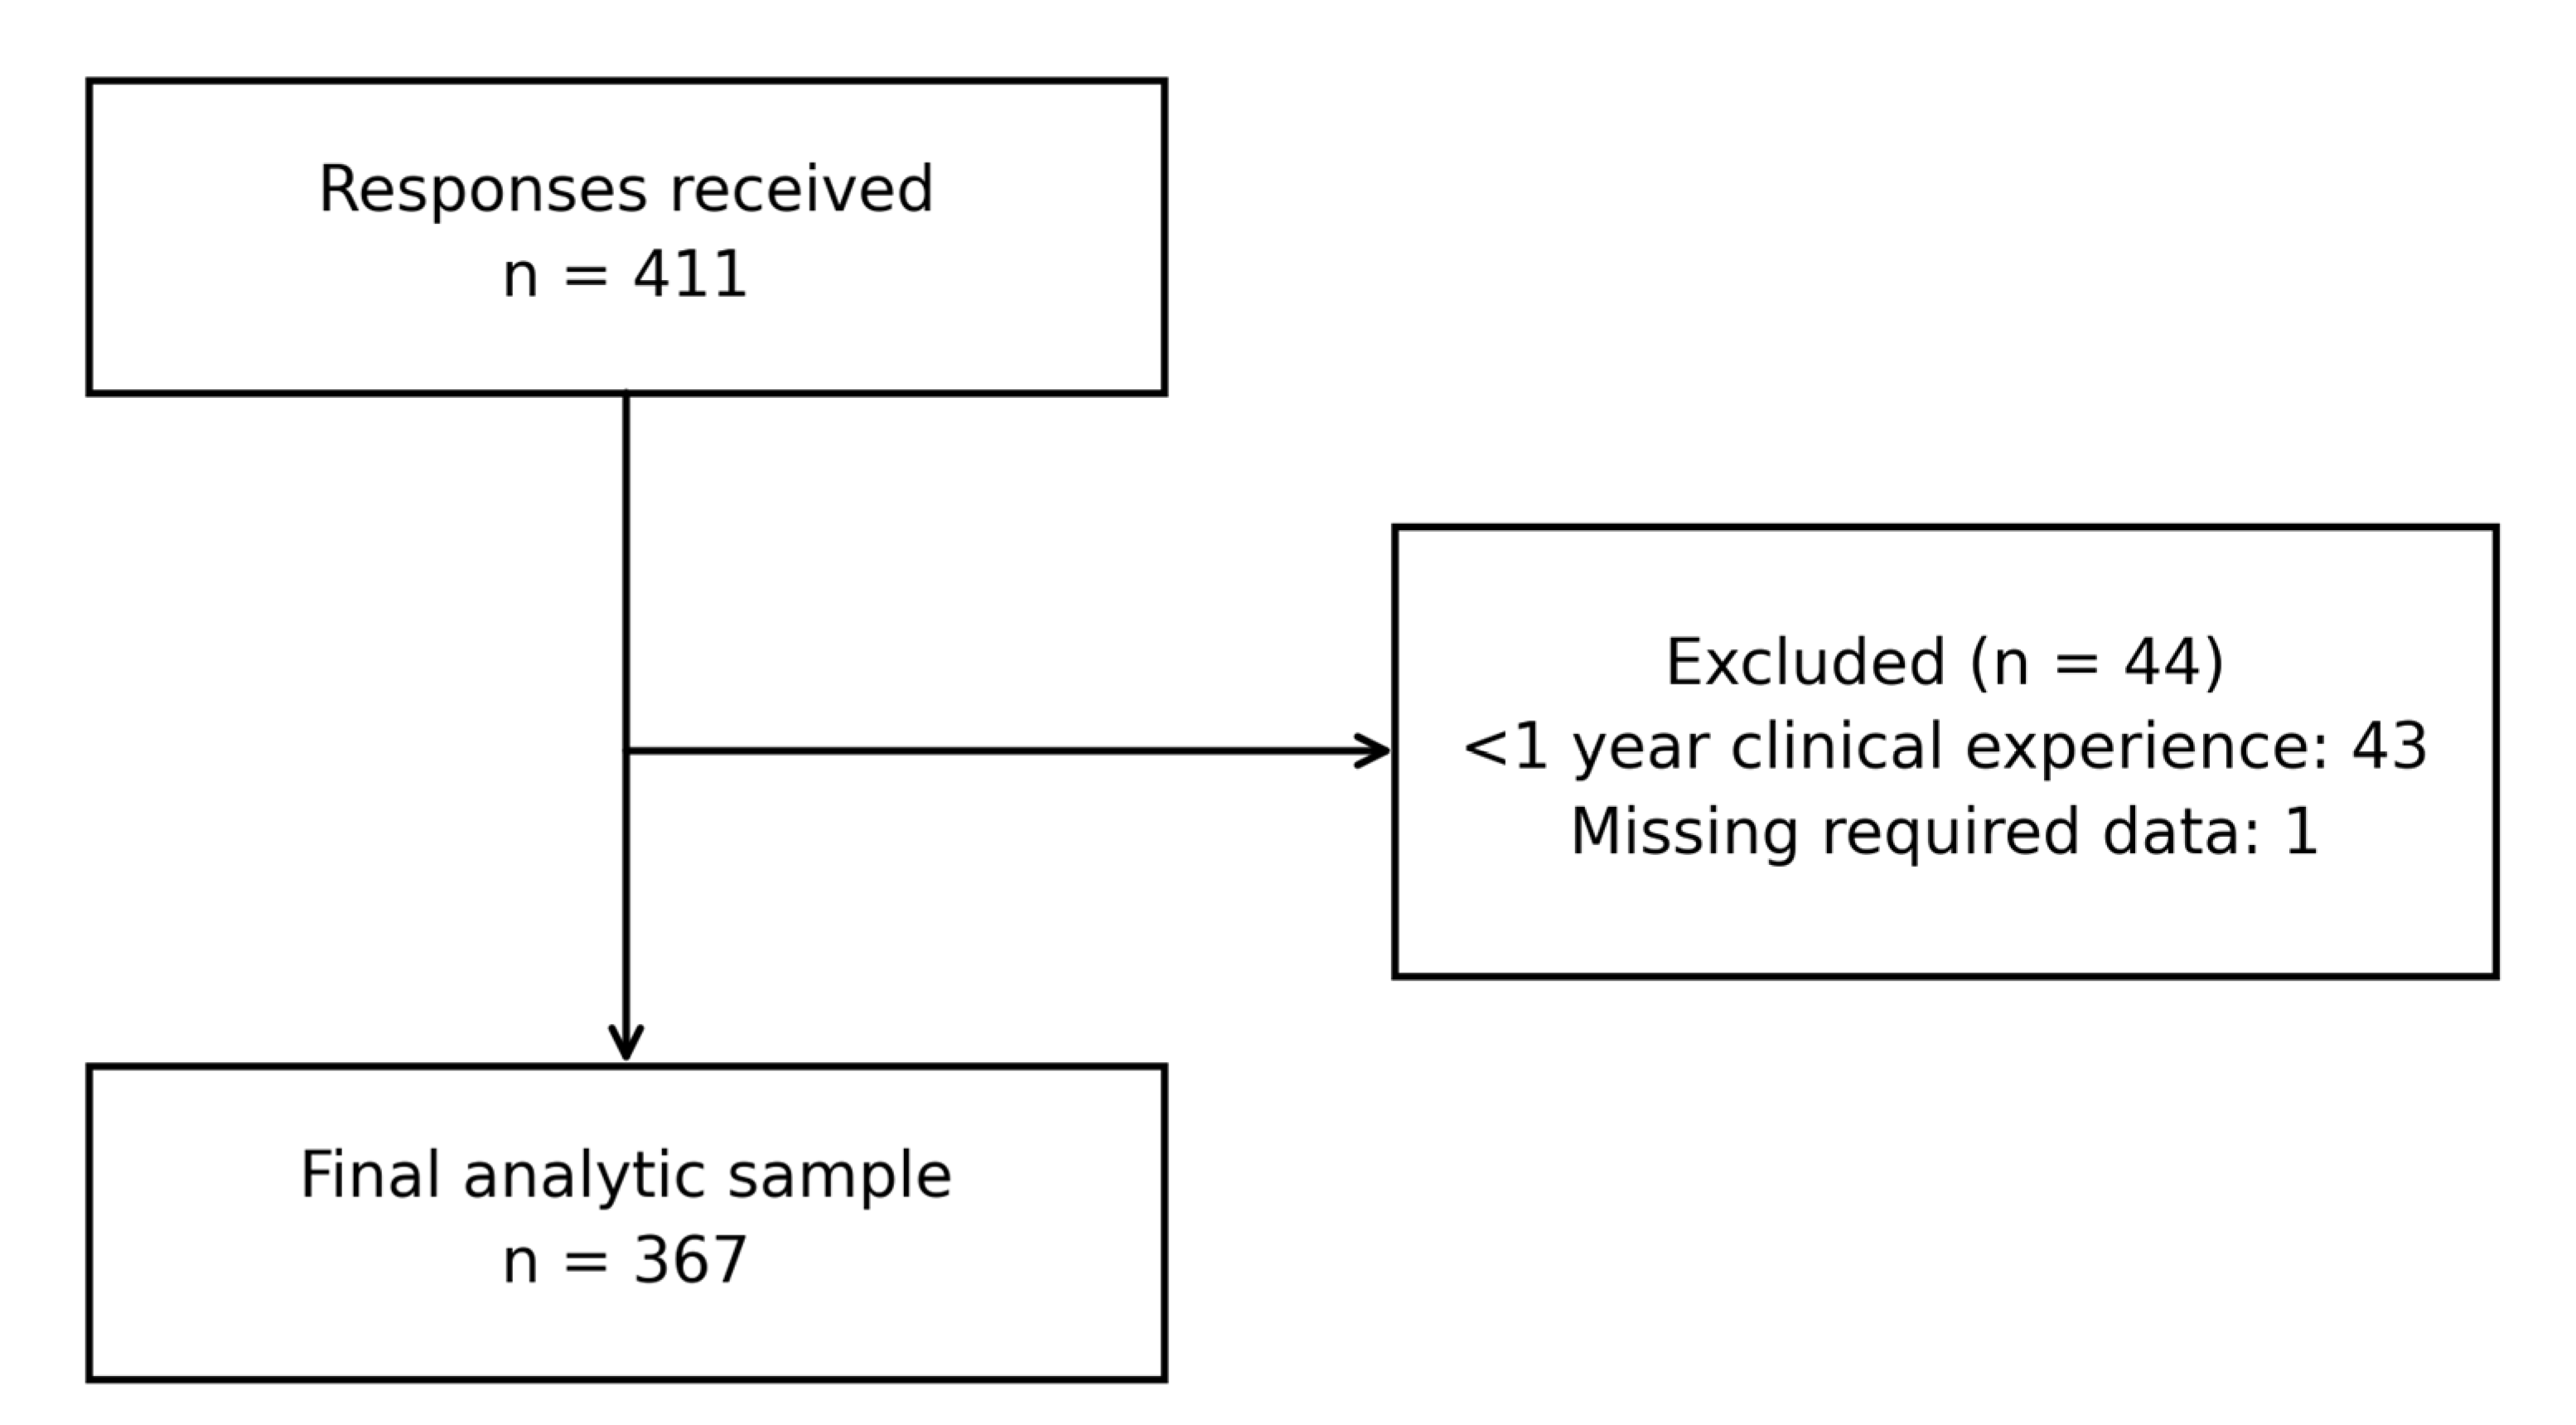
Figure 2.
Distribution of the five standard Neck Disability Index (NDI) categories among 367 participating physiotherapists. Percentages are calculated using the final analytic sample as the denominator.
Figure 2.
Distribution of the five standard Neck Disability Index (NDI) categories among 367 participating physiotherapists. Percentages are calculated using the final analytic sample as the denominator.
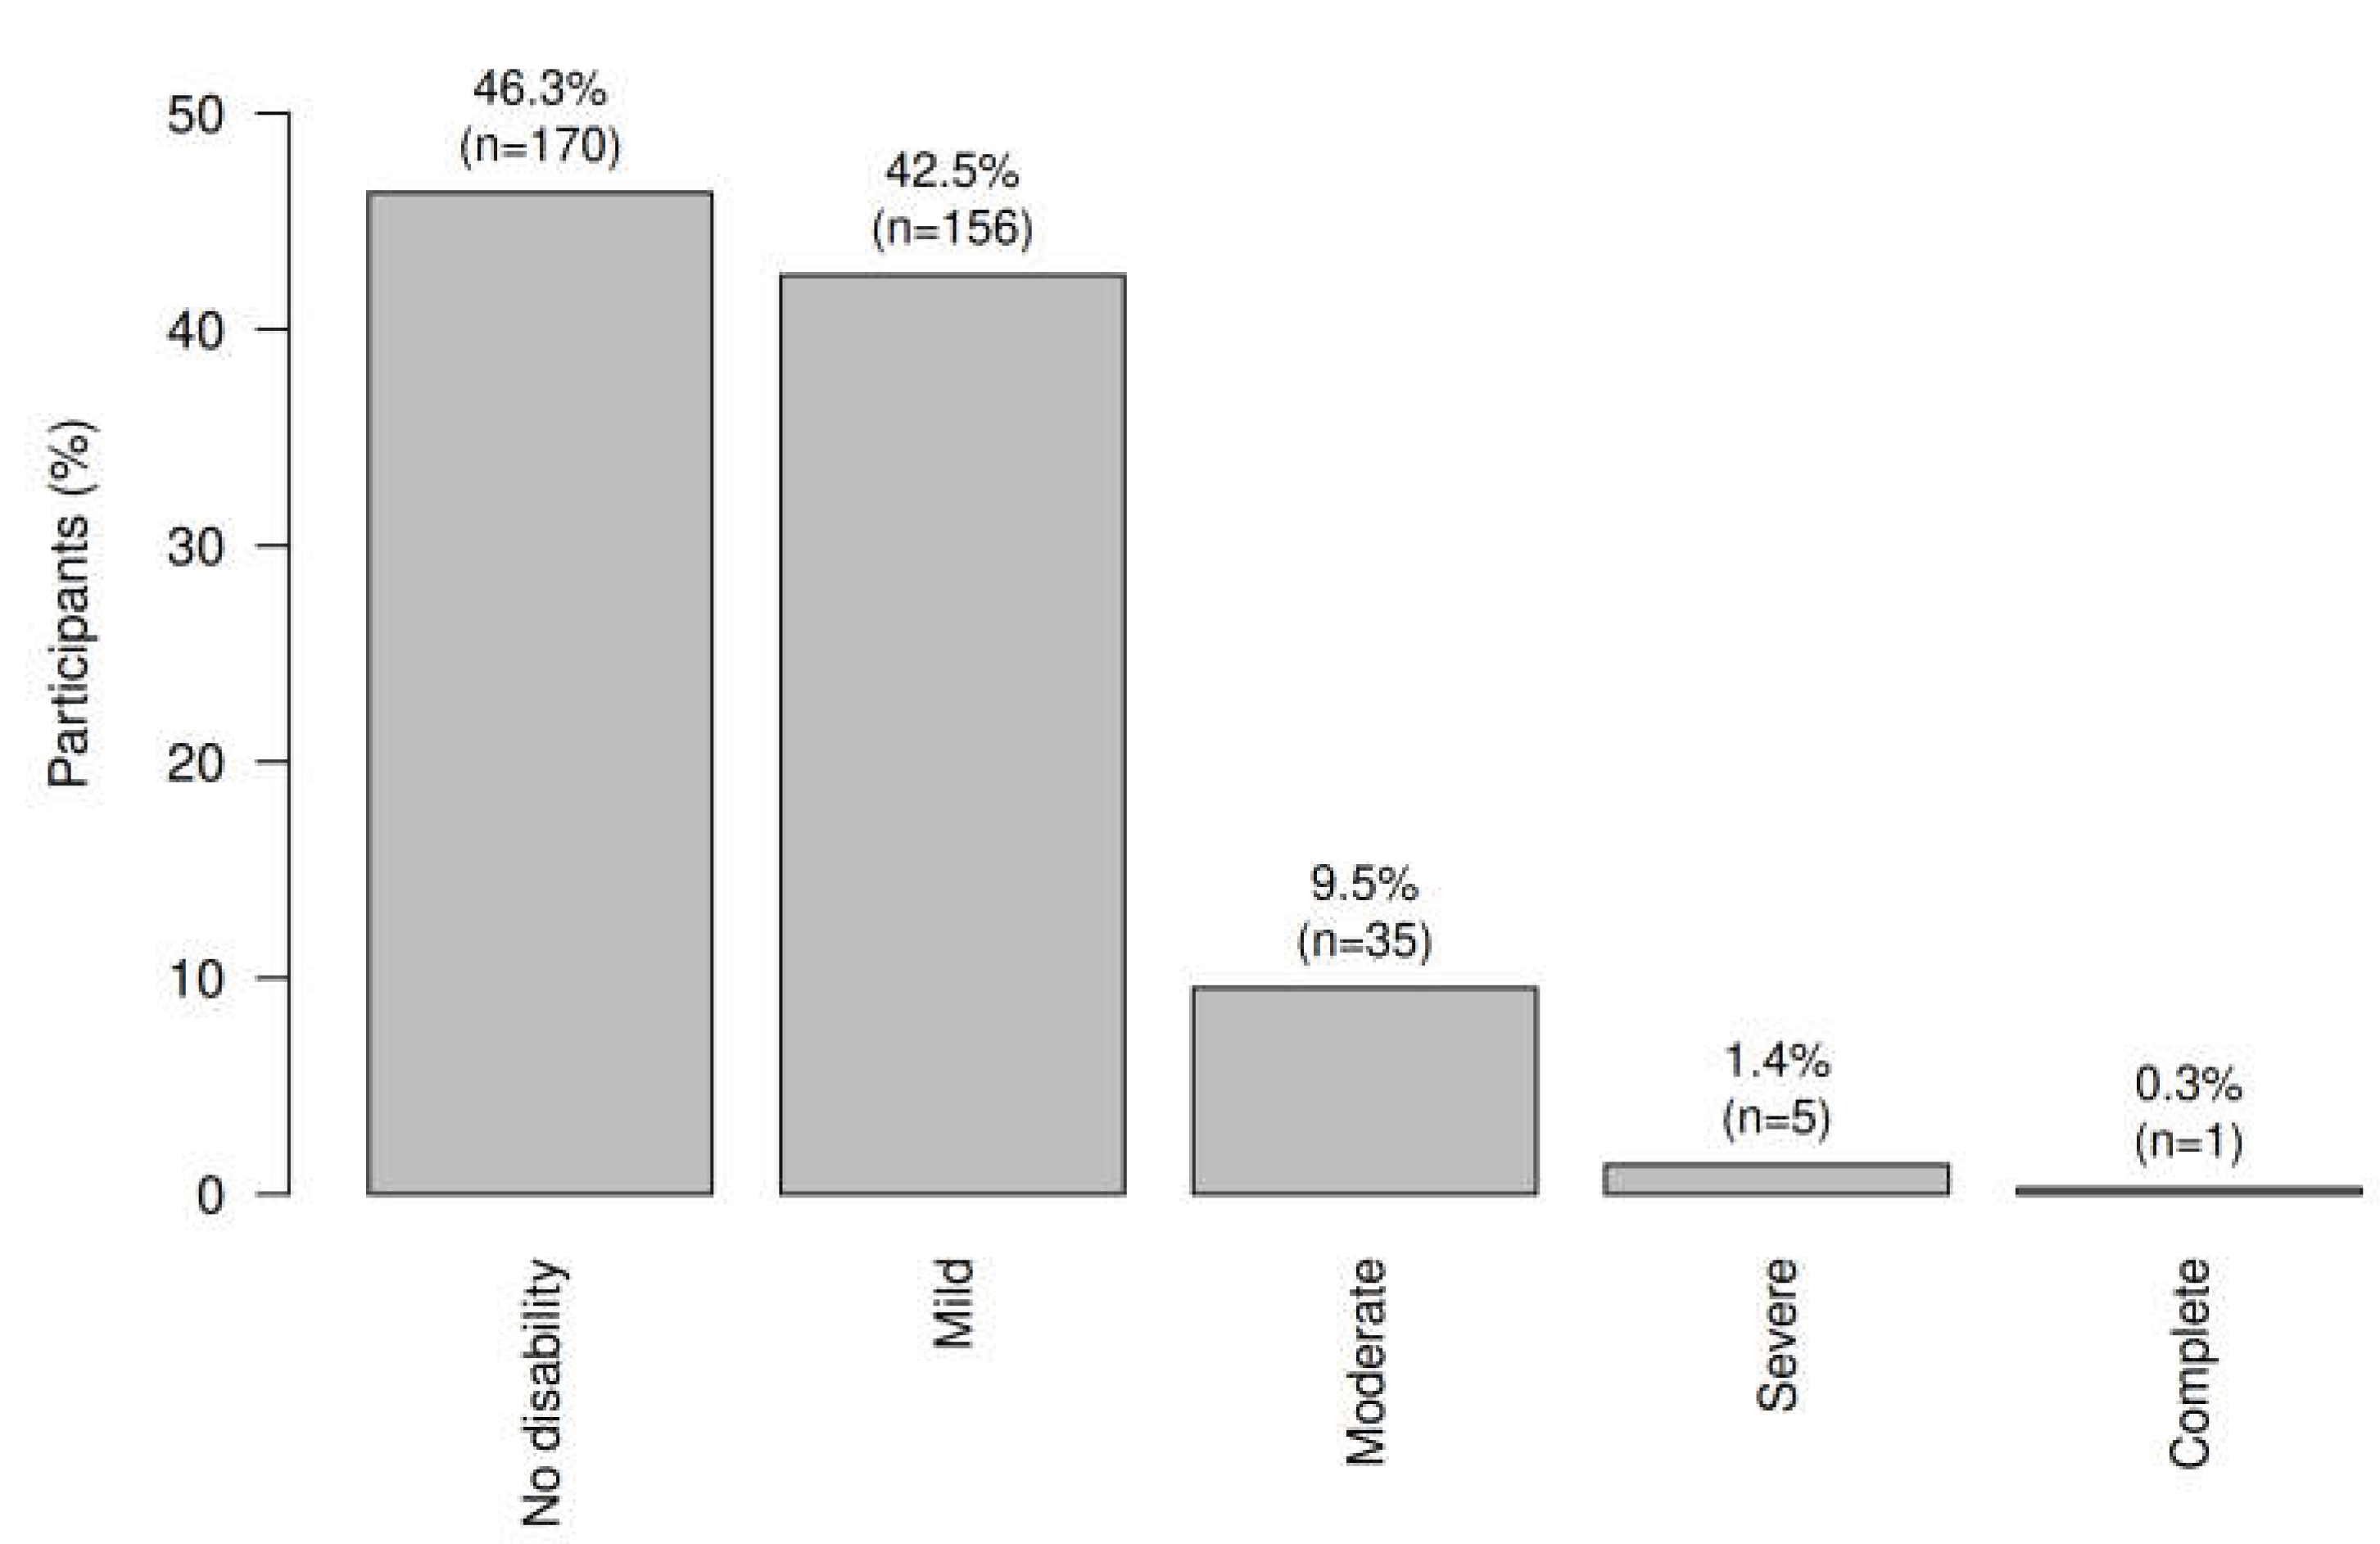

Table 1.
Participant characteristics (n = 367).
| Characteristic | Category | n (%) or summary |
| Age, years | Median (IQR); range | 28 (26-30); 21-42 |
| Sex | Male | 159 (43.3%) |
| Female | 208 (56.7%) | |
| Education | Diploma | 4 (1.1%) |
| Bachelor’s degree | 321 (87.5%) | |
| Completed some postgraduate | 8 (2.2%) | |
| Master’s degree | 32 (8.7%) | |
| PhD | 2 (0.5%) | |
| Region | Central Region | 98 (26.7%) |
| Eastern Region | 40 (10.9%) | |
| Western Region | 100 (27.2%) | |
| Southern Region | 88 (24.0%) | |
| Northern Region | 41 (11.2%) | |
| Workplace | Private medical rehabilitation centers | 230 (62.7%) |
| Ministry of Health hospitals | 80 (21.8%) | |
| Primary health centers (Ministry of Health) | 15 (4.1%) | |
| University hospitals | 16 (4.4%) | |
| Military hospitals | 26 (7.1%) | |
| PT specialty | Orthopedic | 180 (49.0%) |
| Neurology | 55 (15.0%) | |
| Pediatric | 66 (18.0%) | |
| Geriatrics | 14 (3.8%) | |
| Cardiothoracic | 6 (1.6%) | |
| Oncology | 7 (1.9%) | |
| General physical therapy | 35 (9.5%) | |
| Musculoskeletal | 4 (1.1%) | |
| Clinical experience | 1-5 years | 320 (87.2%) |
| 6-9 years | 33 (9.0%) | |
| >=10 years | 14 (3.8%) | |
| Working hours/day | <5 hours | 21 (5.7%) |
| 5-8 hours | 291 (79.3%) | |
| 9-12 hours | 50 (13.6%) | |
| >12 hours | 5 (1.4%) | |
| Working days/week | 1-3 days | 17 (4.6%) |
| 4-5 days | 192 (52.3%) | |
| 6-7 days | 158 (43.1%) | |
| BMI category | Underweight | 24 (6.5%) |
| Normal weight | 224 (61.0%) | |
| Overweight | 106 (28.9%) | |
| Obese | 13 (3.5%) | |
| Smoking | No | 311 (84.7%) |
| Yes | 56 (15.3%) |
BMI, body mass index. Age is presented as median (IQR) and range; categorical variables as n (%).
Table 2.
NDI and WHOQOL-BREF score distributions.
| Measure | Median (IQR) | Range | Cronbach α |
| NDI total score | 5.0 (2.0–10.0) | 0.0–35.0 | 0.844 |
| WHOQOL-BREF physical | 14.3 (12.0–16.6) | 7.4–20.0 | 0.769 |
| WHOQOL-BREF psychological | 13.3 (11.3–15.3) | 6.7–20.0 | 0.663 |
| WHOQOL-BREF social relationships | 13.3 (12.0–16.0) | 4.0–20.0 | 0.787 |
| WHOQOL-BREF environment | 13.0 (11.0–15.5) | 4.0–20.0 | 0.852 |
NDI, Neck Disability Index. WHOQOL-BREF domain scores use the 4–20 scale; higher scores indicate better quality of life. The psychological-domain alpha (0.663) is below the conventional 0.70 benchmark and is interpreted cautiously.
Table 3.
Bivariate associations with three-level NDI severity.
| Variable | Test | Statistic | df | Raw p | Holm p | Effect size | Min expected |
| Age | Kruskal-Wallis | H=6.01 | 2 | 0.050 | 0.396 | ε2=0.011 | |
| Sex | Pearson chi-square | χ2=10.77 | 2 | 0.005 | 0.046 | Cramér V=0.171 | 17.76 |
| Education | Fisher-Freeman-Halton Monte Carlo | χ2=8.68 | 8 | 0.359 | 1.000 | Cramér V=0.109 | 0.22 |
| Region | Fisher-Freeman-Halton Monte Carlo | χ2=9.60 | 8 | 0.326 | 1.000 | Cramér V=0.114 | 4.47 |
| Workplace | Fisher-Freeman-Halton Monte Carlo | χ2=32.54 | 8 | <0.001 | 0.004 | Cramér V=0.211 | 1.68 |
| PT specialty | Fisher-Freeman-Halton Monte Carlo | χ2=14.55 | 14 | 0.383 | 1.000 | Cramér V=0.141 | 0.45 |
| Clinical experience | Fisher-Freeman-Halton Monte Carlo | χ2=0.37 | 4 | 0.974 | 1.000 | Cramér V=0.023 | 1.56 |
| Working hours/day | Fisher-Freeman-Halton Monte Carlo | χ2=2.05 | 6 | 0.874 | 1.000 | Cramér V=0.053 | 0.56 |
| Working days/week | Fisher-Freeman-Halton Monte Carlo | χ2=1.64 | 4 | 0.759 | 1.000 | Cramér V=0.047 | 1.90 |
| BMI category | Fisher-Freeman-Halton Monte Carlo | χ2=16.28 | 6 | 0.006 | 0.056 | Cramér V=0.149 | 1.45 |
| Smoking | Pearson chi-square | χ2=1.82 | 2 | 0.403 | 1.000 | Cramér V=0.070 | 6.26 |
NDI outcome: no disability, mild disability, and moderate-or-worse disability. Pearson χ2 was used only when expected counts were adequate; otherwise a Fisher–Freeman–Halton test with 200,000 Monte Carlo samples was used. Holm adjustment covers the 11 demographic/work comparisons. ε2=max{0,(H−k+1)/(n−k)}.
Table 4.
Adjusted multinomial logistic regression for NDI severity.
| Outcome contrast | Predictor | Adjusted RRR (95% CI) | z | p |
| Mild vs no disability | Female vs male | 2.49 (1.54–4.03) | 3.71 | <0.001 |
| Mild vs no disability | Age, per year | 0.99 (0.92–1.07) | -0.17 | 0.866 |
| Mild vs no disability | Non-private vs private rehabilitation setting | 1.10 (0.68–1.77) | 0.40 | 0.692 |
| Mild vs no disability | BMI ≥25 vs <25 kg/m2 | 2.04 (1.26–3.29) | 2.90 | 0.004 |
| Mild vs no disability | Smoking: yes vs no | 1.59 (0.81–3.10) | 1.35 | 0.176 |
| Moderate-or-worse vs no disability | Female vs male | 1.83 (0.80–4.21) | 1.43 | 0.153 |
| Moderate-or-worse vs no disability | Age, per year | 0.84 (0.74–0.95) | -2.66 | 0.008 |
| Moderate-or-worse vs no disability | Non-private vs private rehabilitation setting | 4.47 (2.06–9.73) | 3.78 | <0.001 |
| Moderate-or-worse vs no disability | BMI ≥25 vs <25 kg/m2 | 2.25 (1.05–4.84) | 2.08 | 0.037 |
| Moderate-or-worse vs no disability | Smoking: yes vs no | 2.43 (0.86–6.85) | 1.67 | 0.094 |
Reference outcome: no disability. RRR, relative risk ratio. HC0 Huber–White model-robust sandwich standard errors. Predictor pooling of workplace and BMI was post hoc because of sparse cells and the limited moderate-or-worse event count. All listed predictors were entered simultaneously. Adjustment is limited to these five variables; individual p values and 95% confidence intervals are nominal, without multiplicity adjustment. The principal expanded 11-factor bias-reduced sensitivity analysis is reported in Supplementary Table S2.
Table 5.
WHOQOL-BREF domains across NDI severity levels.
| Domain |
No disability Median (IQR) |
Mild Median (IQR) |
Moderate-or-worse Median (IQR) |
H | Holm p | ε2 |
| Physical health | 16.0 (13.7–17.1) | 13.1 (12.0–14.9) | 12.0 (10.9–13.1) | 74.29 | <0.001 | 0.199 |
| Psychological health | 14.7 (12.7–16.0) | 12.7 (10.7–14.7) | 12.0 (10.7–13.3) | 41.15 | <0.001 | 0.108 |
| Social relationships | 14.7 (12.0–16.0) | 13.3 (10.7–16.0) | 12.0 (10.7–14.7) | 16.01 | <0.001 | 0.038 |
| Environment | 14.5 (12.5–16.0) | 12.2 (10.5–15.0) | 11.5 (10.5–13.0) | 34.78 | <0.001 | 0.090 |
WHOQOL-BREF domain scores are on the 4–20 scale; higher scores indicate better quality of life. Holm adjustment covers the four domain-level Kruskal–Wallis tests. ε2=max{0,(H−k+1)/(n−k)}.
Disclaimer/Publisher’s Note: The statements, opinions and data contained in all publications are solely those of the individual author(s) and contributor(s) and not of MDPI and/or the editor(s). MDPI and/or the editor(s) disclaim responsibility for any injury to people or property resulting from any ideas, methods, instructions or products referred to in the content. |
© 2026 by the authors. Licensee MDPI, Basel, Switzerland. This article is an open access article distributed under the terms and conditions of the Creative Commons Attribution (CC BY) license.
Copyright: This open access article is published under a Creative Commons CC BY 4.0 license, which permit the free download, distribution, and reuse, provided that the author and preprint are cited in any reuse.