Submitted:
20 March 2025
Posted:
21 March 2025
You are already at the latest version
Abstract
Melanoma is the most common type of skin cancer. Melanomas are well-known for their ability to metastasize to other organs, including the lungs, liver, brain, and bones. The ability of melanoma cells to switch among different phenotypes is a key mechanism that underscores their metastatic potential. We report here on the effect of calcium sulfide (CaS) dispersions in melanoma cells. Melanomas with the mesenchymal and epithelial phenotypes were observed during cell culture preparation. The dispersion reduced the relative percentage of melanomas with the mesenchymal and epithelial phenotypes to (55 + 5) and (57 + 5) %, respectively. In contrast, the viability of normal fibroblasts treated with the dispersion, or the reactants used to prepare the dispersion, remains nearly constant in the same period. Fluorescence imaging measurements are consistent with the release of cytochrome c from mitochondria and its translocation to the cell nuclei. The average expression of caspases 3 and 9 were found to be higher than in the corresponding melanoma control, consistent with intrinsic apoptosis. The response of vinculin expression was slightly different in types of cells. Vinculin was found to delocalize in the cytoplasm of treated mesenchymal melanoma cells with a slightly higher concentration at the end of the actin fibers. A statistically significant increase in the number of FAP in the edge of the cell membrane-external cellular matrix (ECM) was observed in post treated melanoma that exhibited the epithelial phenotype. The changes in vinculin expression and in the number of FAP are consistent with regulation of proteins associated with programmed cell death. It is proposed that the sulfides produced from the reactions of the nanoclusters in the acidic environment facilitate the regulation of proteins required to initiate apoptosis, although other processes may also be involved. Extension of the efforts to animal models will be an important step to the commercialization of the dispersion for melanoma treatment.
Keywords:
Focal Adhesion Kinase (FAK)
; SRC
; melanoma
; calcium sulfide nanoclusters
; extracellular pH
; caspases
; intrinsic apoptosis
Introduction
About 200,000 cases of melanoma were diagnosed in the USA according to the American Cancer Society. Early state of melanoma is a localized cancer, with a 5-year survival rate of 94%. However, a late diagnosis or intervention may be fatal: melanoma is the most metastatic type of cancer. Indeed, only 32 % of patients survive metastasis. Melanoma has the capacity to use the host microenvironment to promote cellular proliferation and tumor growth, switching between different phenotypes. In nature, melanoma is highly angiogenic, and mesenchymal (Braeuer, et. al. 2014). The mesenchymal phenotype has well defined actin fibers including dynamic actin-rich protrusions such as filopodia and lamellipodia at their leading edges. These protrusions are involved in cell migration and are powered by the dynamic polymerization and depolymerization of actin filaments. Those with the epithelial state, on the other hand, are characterized by well-organized cortical actin network located just beneath the plasma membrane. This network supports the cell’s shape and maintains a tight, sheet-like structure.
Melanoma cells with epithelial phenotypes play central roles in the formation of localized tumors due to their proliferative characteristics (Hossain & Eccles 2023). Melanoma cells with mesenchymal phenotypes are more difficult to treat with chemotherapeutic agents because of higher mobility and metastatic characteristics (Hossain & Eccles 2023). The dynamic actin cytoskeleton facilitates this behavior, allowing cells to crawl along surfaces and navigate through tissues forming focal adhesion points. This diversity may result in a complicated design of chemotherapeutic agents to reduce melanoma cell proliferation and/or metastasis. During melanoma progression, cells may undergo an epithelial-to-mesenchymal transition (EMT), where they lose epithelial characteristics and gain mesenchymal properties. This transition involves significant changes in actin organization, including loss of tight junctions and enhanced stress fiber formation. EMT is a complex process that involves transcription factors and genes (Goncharov et al., 2024). These transitions are bidirectional and play a central role in facilitating melanoma cell migration to nearby and distant tissues and organs (Ortiz et al., 2021). EMT is associated with melanoma metastasis (Pei et al., 2019).
Cell adhesion and migration depend on intracellular processes and their interactions with the extracellular matrix through important groups of proteins that constitute the focal adhesion points (FAP) (Guadagno & Progida, 2023). These FAP are crucial for cell migration and are involved in signaling pathways that regulate cell movement and response to the extracellular environment. FAP complexes are formed from the interactions among various proteins and kinases including vinculin, actin, talin, paxillin, integrin, focal adhesion kinase (FAK), SRC, PI3K, among others (Ortiz et al., 2021). In normal cells, regulation of the focal adhesion point formation is largely due to activation and de-activation of several of these proteins. (Mishra & Manavathi, 2021) That regulation mechanism plays a significant role in controlling cell death and proliferation. (Zhou & Tang, 2019) Proper FAK, as well as other kinases, regulation requires adequate phosphorylation and de-phosphorylation of tyrosine residues by cysteine residues. Calcium sulfide nanoclusters are sulfide and calcium ion precursors. In aqueous solutions, these clusters generate a sulfide distribution that is believed to include H2S, both in solution and gas, as well as the HS- and S−2 ions (Rivera el al., 2022). Interactions with the different proteins in the cell environment can affect this distribution and/or facilitate cluster survival-either intact or fragmented. We hypothesize that the sulfide rich environment brought by the chemistry of the CaS nanoclusters can provide additional sulfides to help in the cysteine function. (Tautz et al. 2013) If so, we expect these clusters to facilitate protein regulation and the cascade of events that result in cell death.
Methodology and Approach
Cell culture. Human Fibroblast cells CCD1090Sk (ATCC® CRL2106™) and Melanoma cell line Hs 895.T (ATCC® CRL7637™) were passaged and maintained in complete cell media. The complete medium has a final composition of 89% Minimum Essential Medium (EMEM) and Dulbecco's Modification of Eagle's Medium (DMEM) respectively, with 10% Fetal Bovine Serum (FBS) and 1% of Penicillin: Streptomycin: Amphotericin B solution as supplied by Corning Antibiotic Antimycotic Solution 100X 30-004-CL (complete medium). The experiments described below were performed with cells at 60-80 % confluency.
CaS Dispersion preparation. CaS dispersions were adapted and modified from previous studies (Castro and Rivera, 2013). Briefly, a trace amount of laboratory grade calcium acetate (Ca (CH3CO2-)2), purchased from Fisher Scientific, was dissolved with 5 mL of dimethyl sulfide (DMSO) and the resulting dispersion was placed in a commercial microwave oven and warmed in intervals of 5 seconds until a total time of 30 seconds was accumulated. The resulting dispersion was found to be slightly yellow.
Treatments. Cells were seeded in multiple well plates and incubated for about 24 h prior to the dispersion treatment. The culture medium was removed, and the desired treatment of dispersion mixed with cell culture media was added. Cell culture media was used as a control. At least 3 replicates per treatment combination were performed for both the CCD1090Sk (ATCC® CRL2106™) and Hs 895.T (ATCC® CRL7637™) cell lines. Imagining measurements included DNA label (DAPI and Hoechst/PI) and immunostaining (vinculin, actin, mitochondria and cytochrome c). The cells were placed in an incubator at 37 oC and 5 % CO2 for further studies. Melanoma cell cultures were also treated with dispersions of calcium acetate or zinc acetate. These dispersions contained the same amounts of acetate and cation as the dispersions of CaS nanostructures employed for the experiments.
Cell viability measurements. Human skin melanoma adherent cell culture were prepared from the ATCC Hs 895.T CLR-7637 line. Human skin normal fibroblasts were prepared from the ATCC CCD 1090 sk CRL-2106 cell line. Cell cultures samples were prepared in 96- well microtiter plate (Costar) and incubated for 24 hours at 37°C and 5% CO2. After this initial incubation, cells were exposed to various concentrations of CaS dispersions, diluted in the cell culture medium, in various concentrations which are labelled A to D (Figure 1). The media used for melanoma and benign skin cells are different. Phenol red is used as the pH indicator in both media. The orange color of the indicator, due to a slightly acidic media, appears immediately after the melanoma cells are mixed with the media. This is not observed with the benign cells and the corresponding media- they keep the reddish color typical of basic pH values until they reach maximum confluence. The cell cultures were stained with Hoechst/PI solution after 24 hour and 48 of incubation and imaged in a digital fluorescence & confocal microscope with a 4x magnification and analyzed with the microscope’s Cell Reporter Xpress Pico Image System (Molecular Devices) for the cell viability measurements. The number of cells was determined from counting the nuclei stained by the Hoechst/PI solution. The number of cells alive was determined from the difference between the total number of cells and number of dead cells. Quantitative analyses were obtained with the Graph Pad package. The reported viability references the number of live cells in the sample to the corresponding number in the control experiment. Error bars represent the standard deviation from the average obtained from analysis of three to five measurements at the indicated dispersion concentration.
Vinculin and actin expression. Cells were seeded in multiple well plates and incubated for about 24 h prior to the dispersion treatment. Cells were immunostained with the Actin Cytoskeleton and Focal Adhesion Staining kit (Millipore Sigma FAK100) for the actin expression measurements. The cells were incubated overnight with a modified protocol that included TRITC-conjugated Phalloidin (Part No. 90228) diluted in 1% BSA, 0.1 % Tween®-20 and PBS1X. For the vinculin expression measurements, we used the Actin Cytoskeleton and Focal Adhesion Staining kit (Millipore Sigma FAK100) in combination with the Vinculin Monoclonal Antibody, purified clone 7F9 (Part No. 90227) and Fluorescein (FITC) AffiniPure Goat Anti-Mouse IgG (H+L) 2 mg - 115-095-003 (Jackson Immuno Research) with the following modifications: the antibodies were diluted in 1% BSA, 0.1 % Tween®-20 and PBS1X and primary antibodies were incubated overnight instead of 4 hours. An optimum working concentration of 1:250 was determined based on personal criteria of adequate cell image an exposure time of 400 milli seconds.
Mitochondria and cytochrome C labeling measurements. The protocol included with the commercial ApoTrack™ Cytochrome c Apoptosis ICC Antibody - ab110417 was used without significant modifications. For immunostaining, cells were incubated overnight at 4°C with primary antibodies (Anti-Cytochrome c monoclonal antibody (clone 37BA11) and Anti-Complex V alpha monoclonal antibody (clone 15H4C4)) for the cytochrome C and mitochondria, respectively. Both primary antibodies were diluted in 10% goat serum prior to incubation. Following primary antibody incubation, cells were incubated for 1 hour at room temperature with two fluorophore-conjugated secondary antibodies. These two antibodies included Goat anti-mouse IgG2a - FITC secondary antibody and Goat anti-mouse IgG2b - TXRD secondary antibody for the cytochrome C and mitochondria imaging measurements, respectively. Rinses with 1% goat serum were performed as manufacturers recommended. To visualize nuclei, DAPI staining was added during the final wash for a duration of 10 minutes. Finally, an antifade mounting medium was applied, and the prepared samples were observed using a fluorescence microscope.
Caspase expression measurements. The Multiplex Activity Assay Kit (Fluorometric) ab219915 was used for the determination of Caspase 3, Caspase 8 and Caspase 9 expression. Cells were seeded one day before the study to ensure proper adherence. After reaching approximately 60% confluence, the cells underwent treatment with the dispersion to induce caspase activation over a 24-hour period following the manufacturers recommendation. The relative amount of the caspases was estimated from the fluorescence intensity was determined using a spectrofluorometer (Jasco FP-8500 (ST)). The caspase-specific excitation/emission wavelengths employed included: 535/620 nm for Caspase 3, 490/525 nm for Caspase 8, and 370/450 nm for Caspase 9.
Cell imaging and processing Cell imaging was performed with the ImageXpress Pico Automated Plate/Slide/Dish Imager which is a fluorescence and digital confocal microscope. The microscope has specialized filter cubes for FITC, TRITC, and DAPI measurements that can be employed at 40x and 63x magnifications. The CRX image acquisition & analysis software program included with the microscope was used to quantify the amount of DNA, F-Actin, and Vinculin. The excitation wavelength of 490 nm and an emission wavelength of 525 nm for the secondary antibody (FITC) for the vinculin and cytochrome C imaging measurements. The excitation wavelength of 535 nm, and an emission wavelength of 617 nm for the TRITC-conjugated Phalloidin for the actin and mitochondria imaging measurements. Finally, the excitation wavelength of 387 nm and emission wavelength of 470 nm for DAPI for nucleus imaging measurements.
Results
Benign cell cytotoxicity. At the onset we wish to report that the amounts of dispersion employed for the experiments reported here has little effect on the viability of benign cells. The 24 and 48 hour viability of benign cells as a function of dispersion percentage in the media are summarized on the left and right hand side of Figure 1, respectively. Reported viability represents the percentage of cells alive referenced to the average number of cells found alive in the control experiment. Dispersion percentage was varied by simply adding different dispersion volumes (of the order of microliters) to the media employed to feed the cells. Dispersion percentages employed are A= 0 %, B = 1.0 %, C= 2.0 and D= 2.5 %. The 24- and 48-hour viabilities were found to remain nearly constant within experimental uncertainty in the range of dispersion concentrations employed. The 48-hour viability of benign cells ranged between (100.0 + 0.2) for the control and (93 + 2) when the dispersion B is employed. The viability of the benign cells at the highest dose employed was found to be (94 + 2).). These range of values are significantly close to each other and an ANOVA test of the measurements does not allow us to distinguish among the four measurements with a p<0.05. The viabilities of dispersions B and D can be distinguished from the control at a p-value < 0.1, which is typically considered higher than the standard p-values employed in this type of measurement. We did not observe any changes in the physical characteristics of the benign cells. These results lead us to conclude that the range of dispersion concentrations employed have little effect on benign cell viability at 24- and 48-hour post dose with the dispersion concentrations employed here. These range of viabilities are lower than those reported for other chemotherapeutic agents under FDA evaluation or commercially available medications and drugs (Mhaidat et al., 2007) (Huang et al., 2017).
Mesenchymal and epithelial melanoma. Melanoma cells with epithelial phenotype frequently exhibit a distinctive arrangement of G-actin localized in the cortex below the plasma membrane. G-actin is involved in various cellular processes, including muscle contraction, cell motility, and cellular shape. In contrast, the mesenchymal phenotype is characterized by actin filaments or F-actin, which are formed from globular actin polymerization. Mesenchymal cells have a dispersed or non-homogeneous distribution of actin throughout the cytoplasm, forming stress fibers and other filamentous structures. This organization contrasts with the G-actin seen in epithelial cells discussed above. The arrangement of F-actin in the melanoma cells with mesenchymal phenotype facilitates cell migration and plays an important role in the characteristic elongated cell shape.
The Hs 895.T (ATCC® CRL7637™) line was found to be predominantly mesenchymal melanomas as received and used after a handful of passages as illustrated on Figure 2a. These cells are wide in the middle and become thinner towards the two ends. A mixture of cells with shapes similar yet not identical to the ones reported for epithelial or mesenchymal cells are observed after about forty (40) passages from the initial seed of the received cell line as illustrated on Figure 2b. We refer to these cells as having a cuboidal-like or fibroblast-like morphology. This trend can also be observed in new cell cultures that grown after several freeze-thaw cycles. Cell cultures close to maximum confluence have a cuboidal-like morphology as illustrated in Figure 2c.
The fraction of cells with fibroblast-like and cuboidal-like morphologies as a function of days after a passage are represented by the open and closed circles in figure d, respectively. The general trend observed is the increase in the fraction of cuboidal-like melanoma cells at the expense of a decrease in the fraction of fibroblast-like cells with the number of days after a passage. This trend suggests a shift towards a more proliferative state, potentially impacting tumor growth and response to therapies. This transition can be influenced by various factors, including cell environment, signaling pathways, and genetic alterations (Pedri et al., 2021). Prospective treatments must be effective to reduce proliferation and growth of mesenchymal and epithelial melanoma cells.
Melanoma Cell Cytotoxicity. Melanoma cells with predominantly epithelial phenotype are observed after conducting 15 and 20 passages of the initial cells received from ATCC. These melanomas reproduce quickly to form clusters containing about 3 to about 15 cells
Prior to the viability measurements described below. The viability of melanoma cells with the epithelial phenotype as a function of the treatment percentage determined at 24 and 48 hours are summarized on the left- and right-hand side of Figure 3, respectively. The treatment percentages fed to the cell cultures ranged from A=0% (control) to D=3%. Viabilities were obtained from fluorescence microscopy measurements of stained nuclei (Hoechst dye) at 24 and 48 hours post treatment. Reported values represent the average of three to five biological replicates at the same times and dose. Viabilities of the malignant cell culture at the indicated times without treatment (A) are used as control experiments. The viability of malignant cells reaches values as low as (55 + 5) % and (13 + 1) % at 24- and 48-hours post treatment, respectively, when the dispersion of concentration D is used: these values are statistically different from those observed in the melanoma control at the same times.
Cytochrome C expression. Cytochrome C is a protein localized inside the mitochondria. One of the most important functions of cytochrome C is to facilitate the transfer of electrons between complex III and complex IV in the respiratory chain (Garrido et al., 2006). Cytochrome C is also known to play important roles in programmed cell death, particularly in intrinsic apoptosis. After mitochondria is permeabilized by Bad/Bax protein complexes, cytochrome C is released from the intermembrane space of the mitochondria to the cytosol (Garrido et al., 2006). Cytochrome C then activates caspase enzymes, initiating a cascade of proteolytic events that ultimately result in cell death (Garrido et al., 2006). Images of mitochondria (red) and cytochrome C (green) are summarized on left (A) and right (B) hand side of Figure 4, respectively. Anti-ATP synthase subunit alpha and anti-cytochrome C antibodies were used to label the mitochondria and cytochrome C, respectively. There is a significant co-localization of cytochrome c in the mitochondria. However, careful evaluation of the images reveal that cytochrome C is also present in regions outside the mitochondria and the nuclei as shown in the 200 × 200 μm2 insert on the right-hand side of Figure 4. The red arrow indicates cytochrome C released from the mitochondria 24 hours post-treatment. Translocation of cytochrome c from the mitochondria to the cytoplasm and nuclei is consistent with the activation of intrinsic apoptotic mechanisms (Garrido et al., 2006).
Caspase Expression Measurements. The expression of caspases 3, 8 and 9 in melanoma cells with the epithelial phenotype is summarized in Figure 5. Caspase expressions were obtained from fluorescence spectroscopy measurements of cell culture supernatants following 24-hour post treatment with the D dispersion. Results on the fluorescence measurements corresponding to caspase assays from melanoma cells with the epithelial phenotype without treatments are used as control experiments. The average fluorescence intensity of caspase 3 is found to be more than 2.5 times higher in treated melanoma cells than in the corresponding control cell (p>0.005). The data corresponding to the fluorescence intensity of caspases 8 and 9 have a significant scatter that results in average values with higher standard errors, limiting the interpretation of the results; however, the average value of caspase 9 is higher than the corresponding control. Early death events in the cell will change the sensitivity of the assays rendering caspases 8 and 9 signal intensity of less value to differentiate among extrinsic and intrinsic programmed death cell process. If so, further experiments at shorter times will be of interest to elucidate the role of these caspases in the apoptotic events related to the effect of these engineered nanoclusters in melanoma cells.
Vinculin and Actin Expression. The vinculin and actin expression of melanoma cells with the epithelial phenotype 24 hours post treatment are represented by the green and red areas in the left and center panel of Figure 6. Localized clusters of vinculin near the nuclei are easily identified in treated and control melanoma cells exhibiting the epithelial phenotype. There is little co-localization of the vinculin and actin expressed regions close to the nuclei. This is not surprising since vinculin does not bind directly to globular actin, which is the dominant form in epithelial cells. (Golji & Mofrad, 2013) This observation reflects the importance of vinculin participation in cellular processes that do not have a direct association with actin. These processes may include modulation of integrin signaling and nuclear signaling- which can influence gene expression, cell cycle regulation, cell proliferation and survival (Holland et al., 2024). No statistically significant difference was found between the average number of vinculin clusters in either the neighborhood of the nuclei of cell cytoplasm in treated melanoma and control cells.
Co-localization of vinculin and actin is observed at the cell membrane and extracellular matrix (ECM) which is usually associated with focal adhesion points (FAP). FAP are complexes that connect the cell's cytoskeleton to the extracellular matrix, providing stable anchors. Increasing focal adhesion points generally favors cell adhesion over cell mobility (Ngu et al., 2010) (Legerstee & Houtsmuller, 2021).
Quantitative measurements of the number of FAP in the cell membrane with ECM are summarized in Figure 7. The standard error measurements are used as the uncertainty of the measurements. Statistically significant differences were found (p < 0.0001) in the number of FAP in the cell membrane-substrate support interphase between the melanoma cells with epithelial phenotypes 24-hour post treatment and corresponding control. We conclude that treatment with the CaS dispersion increases the number of FAP and anchoring to the substrate.
Cell citoxicity in melanoma cells with mesenchymal phenotype. Results of cell viability measurements on melanoma cells with the mesenchymal phenotype are summarized in Figure 8. Cell viability decreases with treatment concentration until it reaches about (57 +/- 5) % with dispersion D at 24 hours post treatment.
Vinculin (green) and actin (red) expression in melanoma cells with mesenchymal phenotype are summarized in Figure 9. Vinculin in the nuclear neighborhood and well-defined actin fibers and the elongated shape are characteristics of melanoma cells with mesenchymal phenotypes. Vinculin expression in the control cells is highly localized close to the nuclei with significant co-localization with actin, particularly close to the nuclei. Images of vinculin and actin expression in these mesenchymal melanomas 24-hour post treatment results in delocalization of vinculin in the cytoplasmic fluid and increased colocalization of vinculin and actin as evidenced by the larger orange area in the composite image. The emergence of well-defined co-localization of vinculin and actin in the extracellular matrix (ECM) of treated mesenchymal cells is a significant difference to the trend observed in the control experiments.
Discussion
At the onset, we refer the reader to the scheme in Figure 10 to guide the eye through the discussion. Many cancer treatments have an adverse impact on healthy cells which cause undesirable secondary effects that may be as severe as organ damage. We found that the CaS nanoclusters have no effect on the viability of benign cells. The same concentrations of CaS nanocluster dispersion result in reduced viability of melanoma cells. The viability of melanomas with the epithelial and mesenchymal phenotypes are reduced to about (55 + 5) and (57 + 5) %, respectively, in 24-hour post-treatment. The viability of melanomas with the epithelial phenotype are reduced to (13 + 1) % 48-hour post-treatment. The selectivity of the CaS to affect the viability of melanomas with little effect on the viability of benign fibroblasts highlights the potential of this nanotechnology with little modification as an active ingredient to treat melanomas (Manoharan-Valerio et al., 2014). Along these lines, the findings reported here are consistent with our previous research with lung and breast malignancies (Figueroa et.al., 2025; Rodriguez et.al., 2023; Rivera et al., 2022), where the viability of cancer cells was found to selectively decrease with little or no significant effect on the viability of benign cells. We have proposed that the acidic extracellular pH of cancer cells facilitates the release of Ca2+ and sulfides according to:
CaS(s) + 2H+(aq) à Ca2+(aq) + H2S(aq)
The formation of H2S from CaS(s) in acidic- but not basic- environments has been documented by us (Rodriguez et.al., 2023; Rivera et al., 2022; Rivera et al., 2014). The H2S is expected to form a distribution of sulfides that include H2S(gas), H2S(aq), HS-(aq) and S−2(aq). Recent work from our group determined an increase in Ca2+(aq) concentration in the supernatant of non-small cell lung carcinoma (NSCLC) cultures treated with CaS dispersions similar to the ones used here (Figueroa et al., 2025). The sulfide distribution and the Ca2+ ions can also participate in events that results in cell death (Forti et al., 2016).
Calcium ions are part of the cocktail of chemicals that will be formed upon dissociation of the calcium sulfide nanoclusters. Calcium ions are also necessary components of membrane polarization that is associated with cytochrome c release (Garrido et al., 2006). It is appropriate to highlight the results related to the effect of calcium acetate in the viability of melanoma cells. The results of the viability measurements of cell cultures treated with calcium acetate in DMSO summarized on figure 3 suggest that the concentrations of the calcium precursor employed for the nanocluster synthesis are too small to facilitate cell death. By contrast, the viability of melanoma cells treated with the calcium sulfide nanostructures is reduced to (13 + 1) % at 48-hour post dose. We conclude that the calcium ions released by the nanostructures in the experiments reported here are not large enough to initiate intrinsic apoptosis.
Damage to the cell mitochondria results in the release of cytochrome-c (Garrido et al., 2006). Evidence for the release of cytochrome c to the cell cytoplasm and translocation to the nuclei is summarized in Figure 4. Initiator caspase-9 is activated during the intrinsic pathway by released cytochrome-c (Garrido et al., 2006). Indeed, the average expression of caspase 9 in treated melanomas is found to be higher than the corresponding expression in the control melanoma cultures. In general, the executor caspase 3 is activated by the apoptosome formed by the three-way interactions among cytochrome-c and caspase 9 and APAF-1 (Garrido et al., 2006). The expression of caspase 3 is statistically higher by a factor of three in treated melanomas than in the corresponding control. Thus, the experimental measurements are consistent with the intrinsic apoptotic pathway to cell death.
Proto-oncogene tyrosine-protein kinase (SRC) and focal adhesion kinase (FAK) regulate the intrinsic apoptotic pathway by modulating key proteins such as the BCL-2 family members, including BAX and BAK, and p53, which control the permeabilization of the mitochondrial membrane that facilitates the release of cytochrome c (Lu et al., 2012). SRC and FAK also regulate key intracellular signaling pathways that support melanoma cell survival and proliferation and migration (Pelaz & Tabernero, 2022). In cancer cells, the FAK and SRC are not properly regulated, which results from improper phosphorylation/dephosphorylation of tyrosine residues (Pelaz & Tabernero, 2022). Tyrosine dephosphorylation is generally accepted to be initiated by sulfide rich cysteine residues (Netto & Machado, 2022). Along this line, the engineered nanostructures can provide sulfides that may substitute this cysteine function and provide an alternative mechanism to tyrosine dephosphorylation. These sulfides may include the distribution of H2S, both in solution and gaseous, HS- and S−2 ions as well as partially unreacted clusters that may have entered the cell after surviving the acidic extracellular environment of melanoma. These species may facilitate dephosphorylation and appropriate FAK/SRC regulation. In addition to intrinsic apoptosis, evidence for regulation of these proteins initiated by the treatment includes the increase in the number of focal adhesion points (FAP) in the cell membrane of melanoma cells with epithelial phenotypes. Melanoma cells with the epithelial phenotype exhibit focal-adhesion-bound vinculin, which is not colocalized with actin, in a gradient from the cell membrane to the cytoplasm and immediate outer regions of the nuclei (Chen et al., 2005; Thievessen et.al. 2013). The dispersion has no effect on these focal adhesions in melanomas with the epithelial phenotype. In mesenchymal cells, on the other hand, the dispersion treatment delocalizes vinculin bound to actin in FAP in the cytoplasm.
This difference in response of the two melanoma cell types to the dispersion is intriguing. Vinculin localization, interactions, and functions can differ significantly due to the different cellular environments. (Ziegler et al., 2006). These differences can result in conformational changes in vinculin structure. In epithelial melanomas, vinculin may be in a closed conformation that facilitates cell to cell junctions and tissue cohesion (Chen et al., 2005). Relevant interactions of vinculin with cadherins, a and b catenins, p120-catenin and actin in the epithelial cells facilitate this function. In mesenchymal cells, on the other hand, vinculin has an open and dynamic conformation that facilitates interaction with proteins related to cell migration, focal adhesion points (FAP) and ECM interactions (Chorev et al., 2018). These proteins include the integrins, paxillin, talin and actin. Pinpointing the nature of the nanostructure or sulfide interactions that result in the observed vinculin response is beyond the scope of the present work and deserves further research (Nelson et al., 2011). In passing, we note that FAK and SRC also play an important role in the mesenchymal to epithelial transition. Mesenchymal and epithelial cell cultures resulted in similar viabilities at 24-hour post dose. Thus, the dispersion appears to have a more important role in promoting cell death than affecting the mesenchymal to epithelial transition. This is an important observation. The melanoma MET-EMT among phenotypes facilitates survival to chemotherapies and the individual’s own immune system.
The discussion in the previous paragraphs focused on apoptosis to account for the decrease in viability of both melanomas with dispersion treatment. Some of our observations may also occur in other cell death process like necrosis or ferroptosis. Vinculin delocalization for instance may occur in other, processes where changes in the cell skeleton is associated with cell death. It is generally accepted that necrosis and ferroptosis are caspase independent processes, in sharp contrast with our observations. Nanosulfides may bring new cell death mechanisms that may contribute to the reduced viability of melanomas.
In summary, we have studied the effect of engineered nanoclusters on the viability of melanoma cells with mesenchymal and epithelial phenotypes. We found 24-hour viability slightly over 50% in melanoma cells with either phenotype. An increase in the number of actin fibers is observed 24 hours post-treatment of melanoma cells with the mesenchymal phenotype (Figure 8), a trend in the opposite direction was seen for the mesenchymal control. In contrast, melanomas with epithelial phenotypes do not exhibit significant changes in the globular actin distribution as compared to its control. Vinculin delocalization was evident in melanoma cells with both phenotypes 24-hour post-treatment, yet they exhibited different interactions with actin. Mesenchymal melanoma cells displayed increased vinculin co-localization with actin. The vinculin delocalization in melanomas with the epithelial cell phenotype led to a significant rise in focal adhesion points at the interphase of the cell membrane and ECM (Figure 6 AB).
Acknowledgments
We gratefully acknowledge National Institute of General Medical Sciences (NIGMS) for financial support under grant numbers R25GM127191 and 3R25GM127191-03S1 are gratefully acknowledged. We acknowledge help in data analysis from Mateo Cortez Cuervo (FAP count) and Alina M. Varona Figueroa for data analysis of the experiments with Ca(CH3CO2)2. Kiara Gonzalez acknowledges financial assistance from the NIH National Institute of Diabetes and Digestive and Kidney Diseases (NIDDK) HS STEP UP program. MCR and OMRM thank financial support from the PR Department of Economic Development grant number 2024-000577.
References
- Amruta, Narayanappa, et al. "SARS-CoV-2 mediated neuroinflammation and the impact of COVID-19 in neurological disorders." Cytokine & growth factor reviews 58 (2021): 1-15.
- Braeuer, R. R. , Watson, I. R., Wu, C. J., Mobley, A. K., Kamiya, T., Shoshan, E., & Bar-Eli, M. Why is melanoma so metastatic? Pigment cell & melanoma research 2014, 27, 19–36. [Google Scholar]
- Castro, M. E. , & Rivera, D. (2015). Synthesis of calcium sulfide (CaS) nanoparticles. (US Patent No. US894549B1). Google Patents. US8945494B1 - Synthesis of calcium sulfide (CaS) nanoparticles - Google Patents.
- Chen, H. , Cohen, D. M., Choudhury, D. M., Kioka, N., & Craig, S. W. Spatial distribution and functional significance of activated vinculin in living cells. The Journal of cell biology 2005, 169, 459–470. [Google Scholar] [CrossRef]
- Chorev, D. S. , Volberg, T., Livne, A., Eisenstein, M., Martins, B., Kam, Z., Jockusch, B. M., Medalia, O., Sharon, M., & Geiger, B. Conformational states during vinculin unlocking differentially regulate focal adhesion properties. Scientific Reports 2018, 8. [Google Scholar] [CrossRef]
- Chuang HH, Zhen YY, Tsai YC, Chuang CH, Hsiao M, Huang MS, Yang CJ. FAK in Cancer: From Mechanisms to Therapeutic Strategies. Int J Mol Sci. 2022 Feb 2;23(3):1726. [CrossRef] [PubMed] [PubMed Central]
- Citi V, Martelli A, Brancaleone V, Brogi S, Gojon G, Montanaro R, Morales G, Testai L, Calderone V. Anti-inflammatory and antiviral roles of hydrogen sulfide: Rationale for considering H2 S donors in COVID-19 therapy. Br J Pharmacol. 2020 Nov;177(21):4931-4941. [CrossRef] [PubMed] [PubMed Central]
- Cronin, N. M. , & DeMali, K. A. Dynamics of the actin cytoskeleton at adhesion complexes. Biology 2021, 11(1), 52. [Google Scholar]
- de Aberasturi AL, Calvo A. TMPRSS4: an emerging potential therapeutic target in cancer. Br J Cancer. 2015 Jan 6;112(1):4-8. [CrossRef] [PubMed] [PubMed Central]
- Du, B. , & Shim, J. S. Targeting Epithelial-Mesenchymal Transition (EMT) to Overcome Drug Resistance in Cancer. Molecules (Basel, Switzerland), 2016; 21, 965. [Google Scholar] [CrossRef]
- Epstein, Richard J. "The secret identities of TMPRSS2: Fertility factor, virus trafficker, inflammation moderator, prostate protector and tumor suppressor." Tumor Biology 43.1 (2021): 159-176.
- Figueroa Rosado MM, Muñoz Forti K, Rodríguez-Rodríguez P, Arroyo-Martínez G, Rodríguez-Irizarry VJ, Ruiz-Rivera A, Quinones-Rodriguez JI, Santiago-Cardona PG, Rodriguez Martinez OM, Almodovar S, Castro-Rosario Miguel and Suarez Edu, Calcium Sulfide Nanoclusters Trigger DNA Damage and Induce Cell Cycle Arrest in Non-Small-Cell Lung Adenocarcinoma Cells. International Journal of Molecular Sciences. 2025; 26(4):1665. [CrossRef]
- Forti, K. M. , Figueroa, M., Torres, B., Bernard, F., Rivera, D., Castro, M. E. Calcium Sulfide (CaS) Nanostructure Treatment on Non-Small Cell Lung Cancer. The FASEB Journal 2016, 30, 1099-4. [Google Scholar] [CrossRef]
- Fu, J.; Liu, S.; Tan, Q.; Liu, Z.; Qian, J.; Li, T.; Du, J.; Song, B.; Li, D.; Zhang, L.; et al. Impact of TMPRSS2 Expression, Mutation Prognostics, and Small Molecule (CD, AD, TQ, and TQFL12) Inhibition on Pan-Cancer Tumors and Susceptibility to SARS-CoV-2. Molecules 2022, 27, 7413. [Google Scholar] [CrossRef]
- Garrido, C. , Galluzzi, L., Brunet, M., Puig, P. E., Didelot, C., & Kroemer, G. Mechanisms of cytochrome c release from mitochondria. Cell Death & Differentiation 2006, 13, 1423–1433. [Google Scholar] [CrossRef]
- Golji, J. , & Mofrad, M. R. The interaction of vinculin with actin. PLoS computational biology 2013, 9(4), e1002995. [Google Scholar] [CrossRef] [PubMed]
- Goncharov, A. P. , Vashakidze, N., & Kharaishvili, G. (2024). Epithelial-Mesenchymal Transition: A Fundamental Cellular and Microenvironmental Process in Benign and Malignant Prostate Pathologies. Biomedicines, 12(2), 418. [CrossRef]
- Guadagno, N. A. , & Progida, C. (2023). Probing the ER-Focal Adhesion Link During Cell Migration. Methods in molecular biology (Clifton, N.J.), 2608, 39–50. [CrossRef]
- Hamidi H, Ivaska J. Every step of the way: integrins in cancer progression and metastasis. Nat Rev Cancer. 2018 Sep;18(9):533-548. 10.1038/s41568-018-0038-z. Erratum in: Nat Rev Cancer. 2019 Mar;19(3):179. [CrossRef] [PubMed] [PubMed Central]
- Hess, A. R. , Postovit, L. M., Margaryan, N. V., Seftor, E. A., Schneider, G. B., Seftor, R. E., Nickoloff, B. J., & Hendrix, M. J. Focal adhesion kinase promotes the aggressive melanoma phenotype. Cancer research 2005, 65(21), 9851–9860. [Google Scholar] [CrossRef]
- Holland, E. N. , Fernández-Yagüe, M. A., Zhou, D. W., O'Neill, E. B., Woodfolk, A. U., Mora-Boza, A., Fu, J., Schlaepfer, D. D., & García, A. J. FAK, vinculin, and talin control mechanosensitive YAP nuclear localization. Biomaterials 2024, 308, 122542. [Google Scholar] [CrossRef]
- Hossain, S. M. , & Eccles, M. R. (2023). Phenotype Switching and the Melanoma Microenvironment; Impact on Immunotherapy and Drug Resistance. International journal of molecular sciences, 24(2), 1601. [CrossRef]
- Huang, X. , He, J., Zhang, H., Sun, K., Yang, J., Wang, H., Zhang, H., Guo, Z., Zha, Z., & Zhou, C. Effect of dacarbazine on CD44 in live melanoma cells as measured by atomic force microscopy-based nanoscopy. International Journal of Nanomedicine 2017, 12, 8867–8886. [Google Scholar] [CrossRef]
- Legerstee, K. , & Houtsmuller, A. B. A Layered View on Focal Adhesions. Biology 2021, 10(11), 1189. [Google Scholar] [CrossRef] [PubMed]
- Li, F. , Han, M., Dai, P. et al. Distinct mechanisms for TMPRSS2 expression explain organ-specific inhibition of SARS-CoV-2 infection by enzalutamide. Nat Commun 12, 866 (2021). [CrossRef]
- Lu, Q. , & Rounds, S. Focal adhesion kinase and endothelial cell apoptosis. Microvascular research 2012, 83(1), 56–63. [Google Scholar] [CrossRef]
- Manoharan-Valerio, M. , Ortiz, C., Quiñones, J., Feliciano, G., Diaz, A., Rivera, D., Castro, M. and Suarez, E., 2014. Determination of the IC50 and LD50 of calcium sulfide (CaS) clusters on malignant carcinoma and normal fibroblasts cell lines (LB580). The FASEB Journal, 28, p.LB580.
- Mhaidat, N. M. , Xu Dong Zhang, Allen, J. D., Avery-Kiejda, K. A., Scott, R. J., & Hersey, P. Temozolomide induces senescence but not apoptosis in human melanoma cells. British Journal of Cancer 2007, 97, 1225–1233. [Google Scholar] [CrossRef] [PubMed]
- Mishra, Y. G. , & Manavathi, B. Focal adhesion dynamics in cellular function and disease. Cellular signalling 2021, 85, 110046. [Google Scholar]
- Nelson, E. S. , Folkmann, A. W., Henry, M. D., & DeMali, K. A. Vinculin activators target integrins from within the cell to increase melanoma sensitivity to chemotherapy. Molecular cancer research: MCR 2011, 9, 712–723. [Google Scholar] [CrossRef] [PubMed]
- Netto, L. E. S. , & Machado, L. E. S. F. (2022). Preferential redox regulation of cysteine-based protein tyrosine phosphatases: structural and biochemical diversity. The FEBS journal, 289(18), 5480–5504. [CrossRef]
- Ngu, H. , Feng, Y., Lu, L., Oswald, S. J., Longmore, G. D., & Yin, F. C. Effect of focal adhesion proteins on endothelial cell adhesion, motility and orientation response to cyclic strain. Annals of biomedical engineering 2010, 38(1), 208–222. [Google Scholar] [CrossRef]
- Ortiz, M.A. , Mikhailova, T., Li, X. et al. Src family kinases, adaptor proteins and the actin cytoskeleton in epithelial-to-mesenchymal transition. Cell Commun Signal 2021, 19, 67. [Google Scholar] [CrossRef]
- Patel, A. , Sabbineni, H., Clarke, A., & Somanath, P. R. Novel roles of Src in cancer cell epithelial-to-mesenchymal transition, vascular permeability, microinvasion and metastasis. Life sciences 2016, 157, 52–61. [Google Scholar] [CrossRef]
- Pedri, D. , Karras, P., Landeloos, E., Marine, J., & Rambow, F. Epithelial-to-mesenchymal-like transition events in melanoma. The FEBS Journal 2021, 289, 1352–1368. [Google Scholar] [CrossRef]
- Pei, D. , Shu, X., Gassama-Diagne, A., & Thiery, J. P. Mesenchymal–epithelial transition in development and reprogramming. Nature cell biology 2019, 21, 44–53. [Google Scholar] [PubMed]
- Pelaz, S. G. , & Tabernero, A. Src: coordinating metabolism in cancer. Oncogene 2022, 41, 4917–4928. [Google Scholar] [CrossRef] [PubMed]
- Rivera, Daniel Dissertation, University of Puerto Rico at Mayaguez, Mayaguez, PR, 2022.
- Rivera Vazquez, D.; Munoz Forti, K.; Figueroa Rosado, M.M.; Gutierrez Mirabal, P.I.; Suarez-Martinez, E.; Castro-Rosario, M.E. Effect of CaS Nanostructures in the Proliferation of Human Breast Cancer and Benign Cells In Vitro. Appl. Sci. 2022, 12, 10494. [Google Scholar] [CrossRef]
- Rivera, D. , Carrasco, N., Maldonado, L., Suarez, E., Poventud, C., Marrero, C., & Castro, M. Killing cancer cells with nanotechnology: the effect of CaS nanostructures on the cell replication rate and survival of human mammary adenocarcinoma cell lines (780.9). The FASEB Journal 2014, 28, 780–789. [Google Scholar]
- Rodríguez Martínez, O.M.; Narváez Ramos, M.A.; Soto Acevedo, A.A.; Colón Colón, C.C.; Malavé Ramos, D.; Castro Rivera, C.; Castro Rosario, M.E. pH-Selective Reactions to Selectively Reduce Cancer Cell Proliferation: Effect of CaS Nanostructures in Human Skin Melanoma and Benign Fibroblasts. BioChem 2023, 3, 15–30. [Google Scholar] [CrossRef]
- Tapial Martínez P, López Navajas P, Lietha D. FAK Structure and Regulation by Membrane Interactions and Force in Focal Adhesions. Biomolecules. 2020 Jan 24;10(2):179. [CrossRef] [PubMed] [PubMed Central]
- Tautz L, Critton DA, Grotegut S. Protein tyrosine phosphatases: structure, function, and implication in human disease. Methods Mol Biol. 2013;1053:179-221. [CrossRef] [PubMed] [PubMed Central]
- Tautz, L. , Critton, D. A., & Grotegut, S. (2013). Protein tyrosine phosphatases: structure, function, and implication in human disease. Methods in molecular biology (Clifton, N.J.), 1053, 179–221. [CrossRef]
- Thievessen, I. , Thompson, P. M., Berlemont, S., Plevock, K. M., Plotnikov, S. V., Zemljic-Harpf, A., Ross, R. S., Davidson, M. W., Danuser, G., Campbell, S. L., & Waterman, C. M. Vinculin-actin interaction couples actin retrograde flow to focal adhesions, but is dispensable for focal adhesion growth. The Journal of cell biology 2013, 202, 163–177. [Google Scholar] [CrossRef]
- Zhou, J. , Yi, Q. & Tang, L. The roles of nuclear focal adhesion kinase (FAK) on Cancer: a focused review. J Exp Clin Cancer Res 2019, 38, 250. [Google Scholar] [CrossRef]
- Ziegler, W. H. , Liddington, R. C., & Critchley, D. R. The structure and regulation of vinculin. Trends in cell biology 2006, 16, 453–460. [Google Scholar] [CrossRef]
Figure 1.
The effect of the dispersion on benign cells is also reported here. Fibroblasts treated with teh dispersion did not develope significant difference from the corresponding control. The 24 and 48 hour viability of benign cells as a function of dispersion percentage (%).
Figure 1.
The effect of the dispersion on benign cells is also reported here. Fibroblasts treated with teh dispersion did not develope significant difference from the corresponding control. The 24 and 48 hour viability of benign cells as a function of dispersion percentage (%).
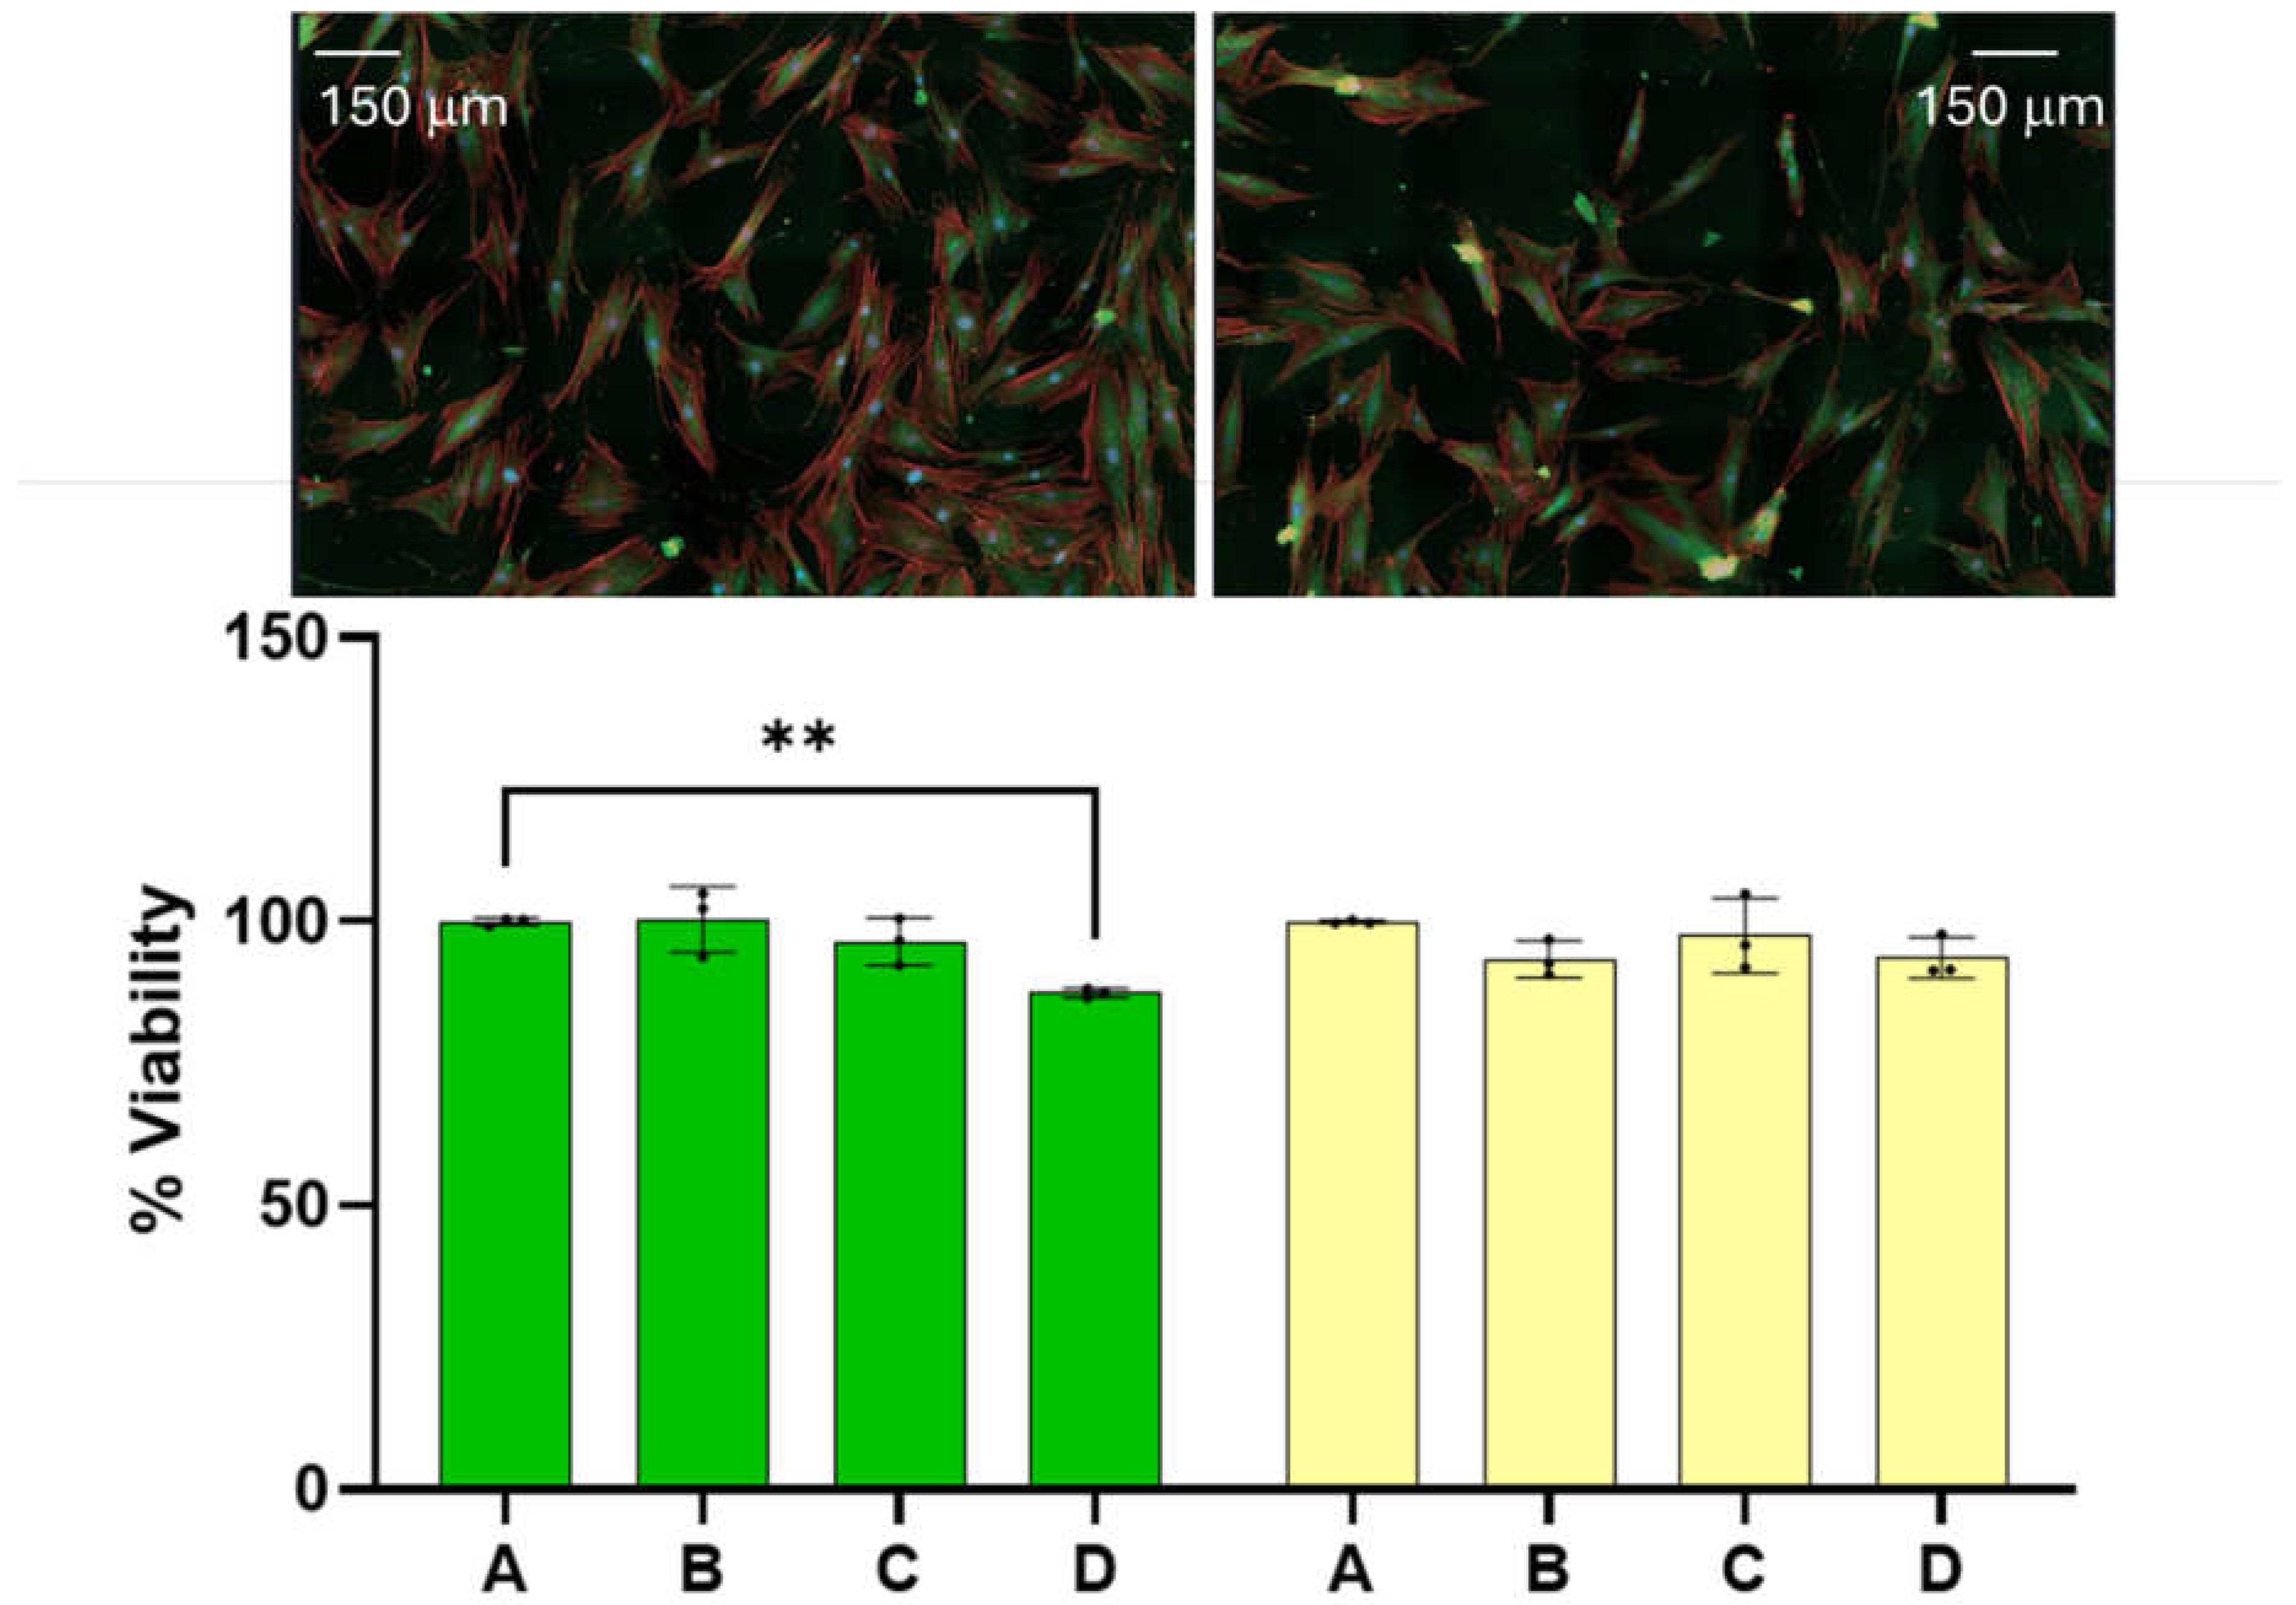
Figure 2.
Optical microscopy images of melanoma cells with (a) predominantly fibroblast phenotype, (b) mixture of cells with fibroblast-like and cuboidal-like morphologies and (c) predominantly epithelial phenotype at maximum confluence. The fraction of cells with fibroblast-like and cubic-like morphologies as a function of days after the passage are represented by the open and closed circles in figure d, respectively. The cut lines are to guide the eye through the discussion and do not represent a model fit to the data.
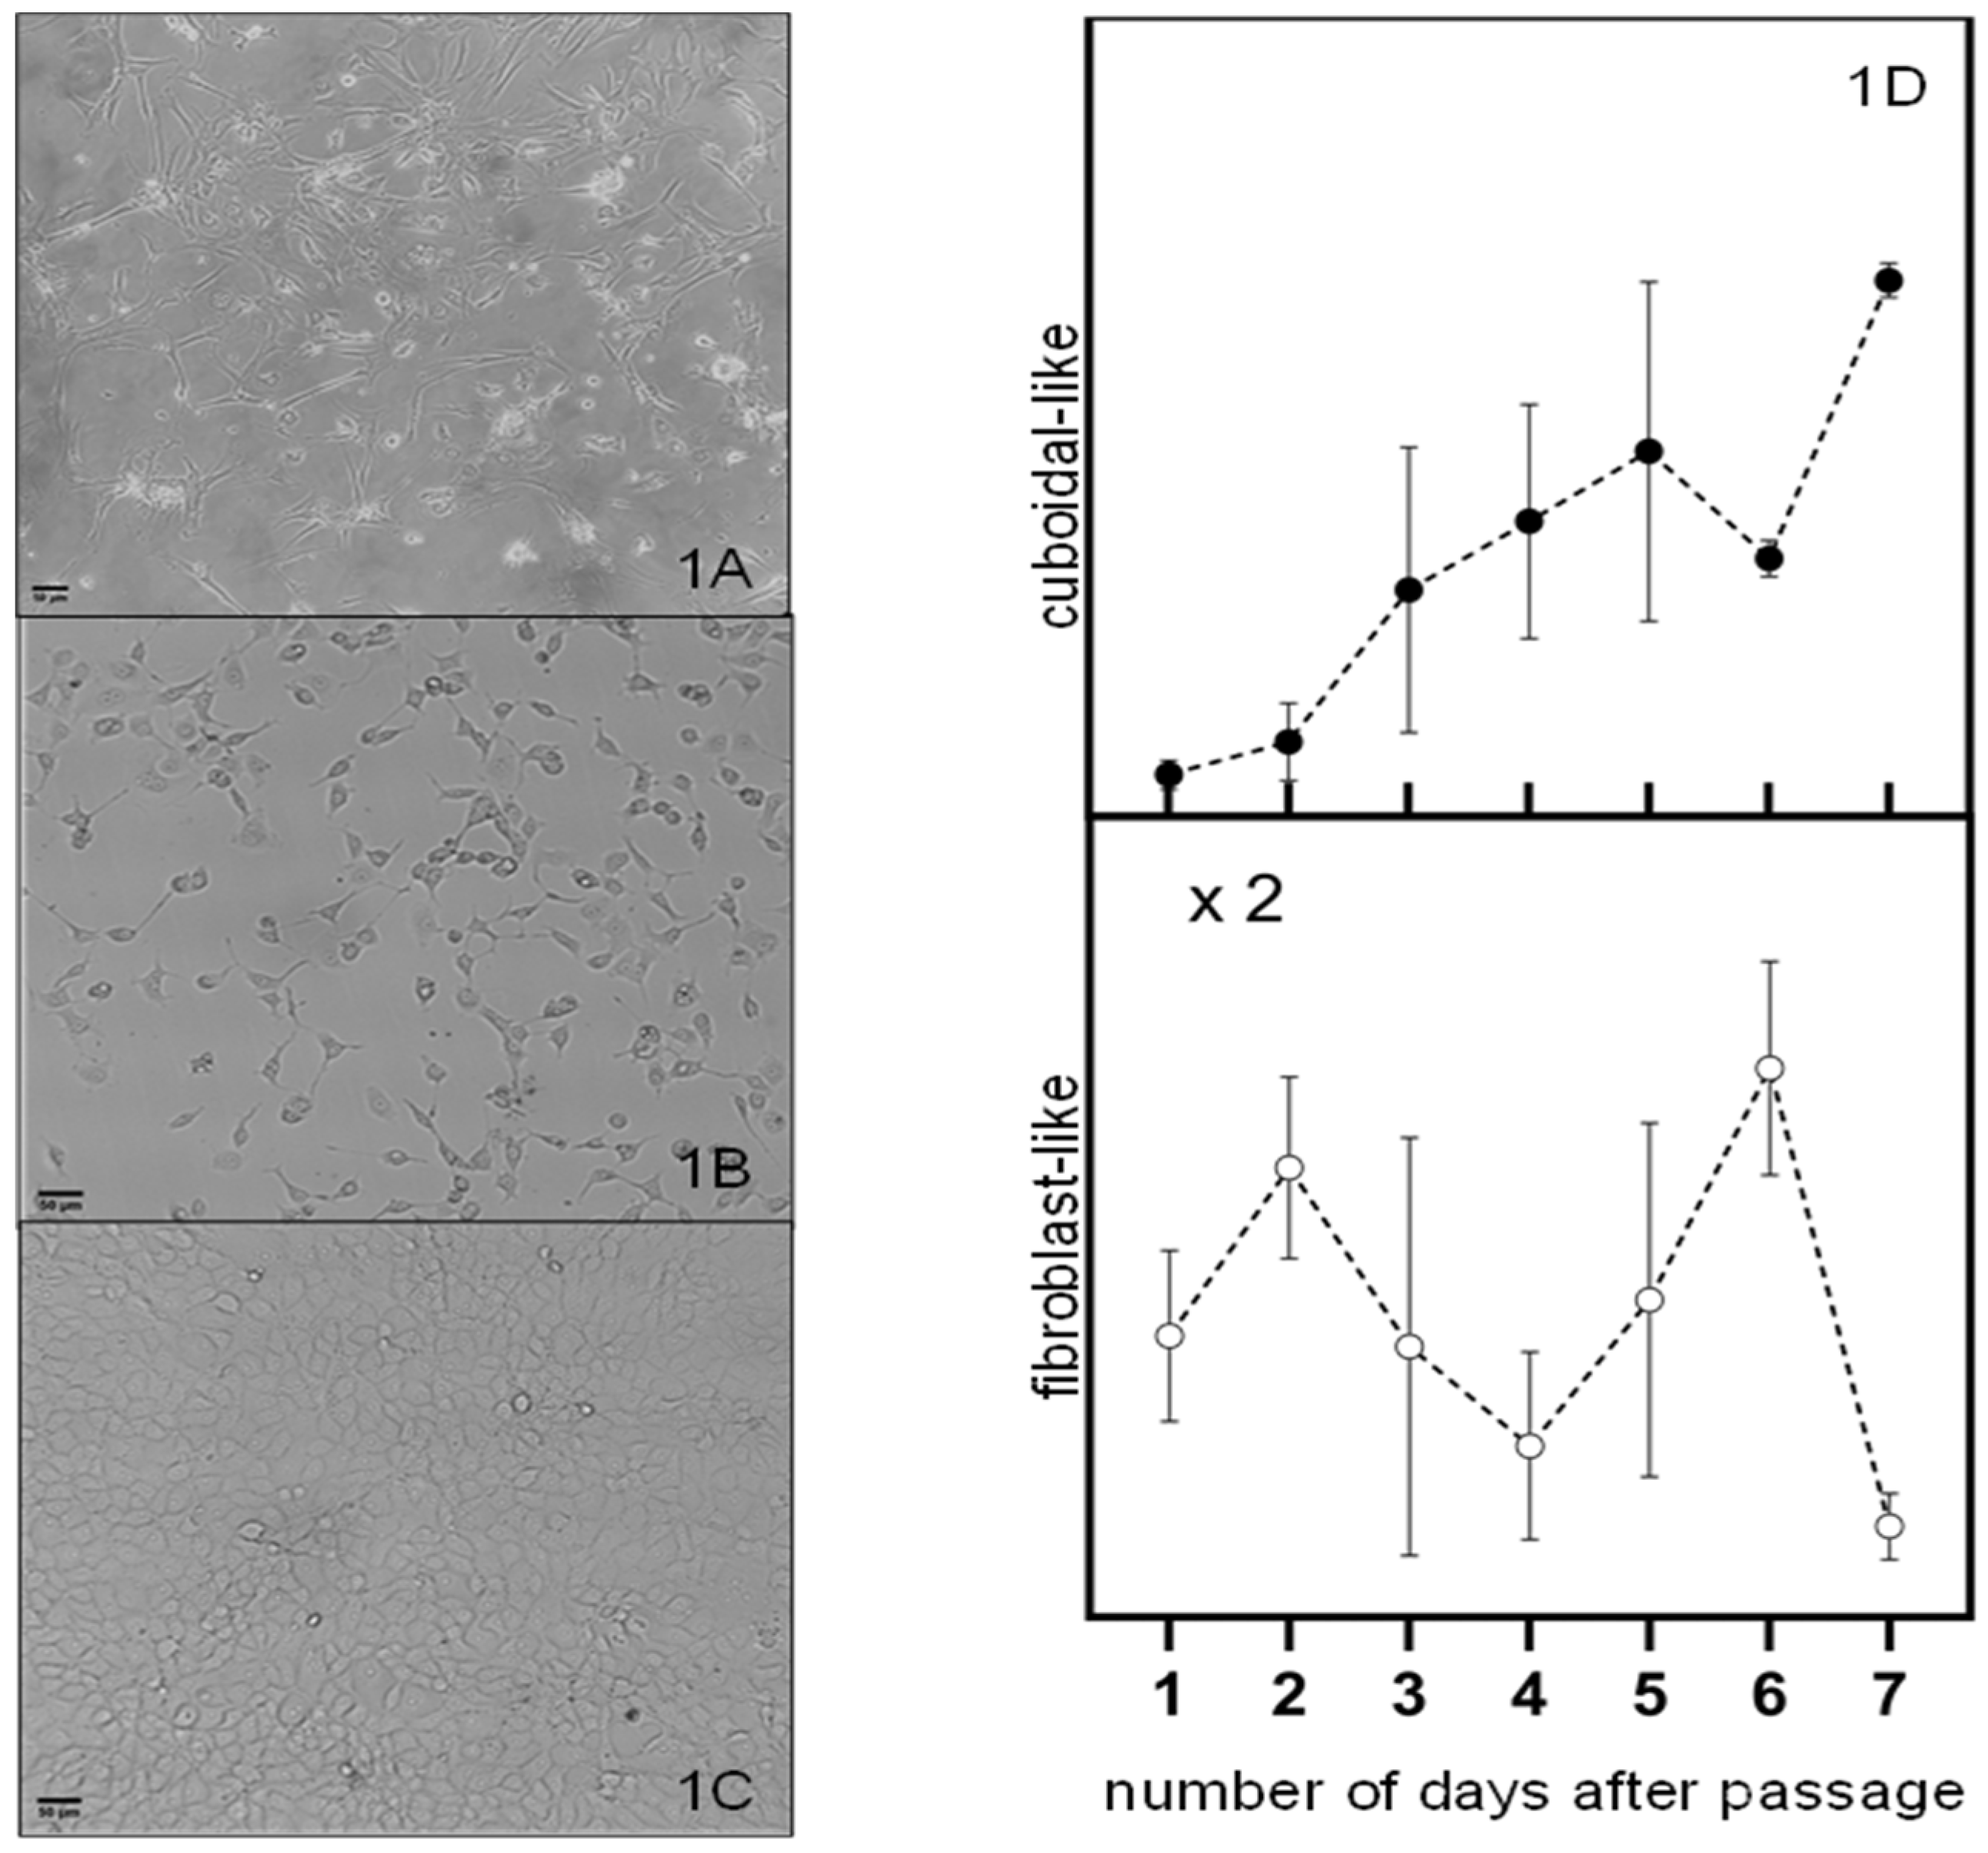
Figure 3.
The viability of melanoma cells with epithelial phenotype as a function of the dispersion percentage (%). Viabilities determined at 24- and 48-hours post treatment are summarized on the left- and right-hand side of Figure 3, respectively. Error bars represent standard error. The symbols *, **, and *** show a significant difference in p-values of 0.01, 0.001 and 0.0001, respectively, among the treatment concentrations employed. Dispersions of Ca(CH3CO2)2 in DMSO with the same concentrations as the one employed to prepare the CaS dispersions employed for the experiments described here did not results in viability differences statistically different from the corresponding control at 24 0r 48 hours post dose.
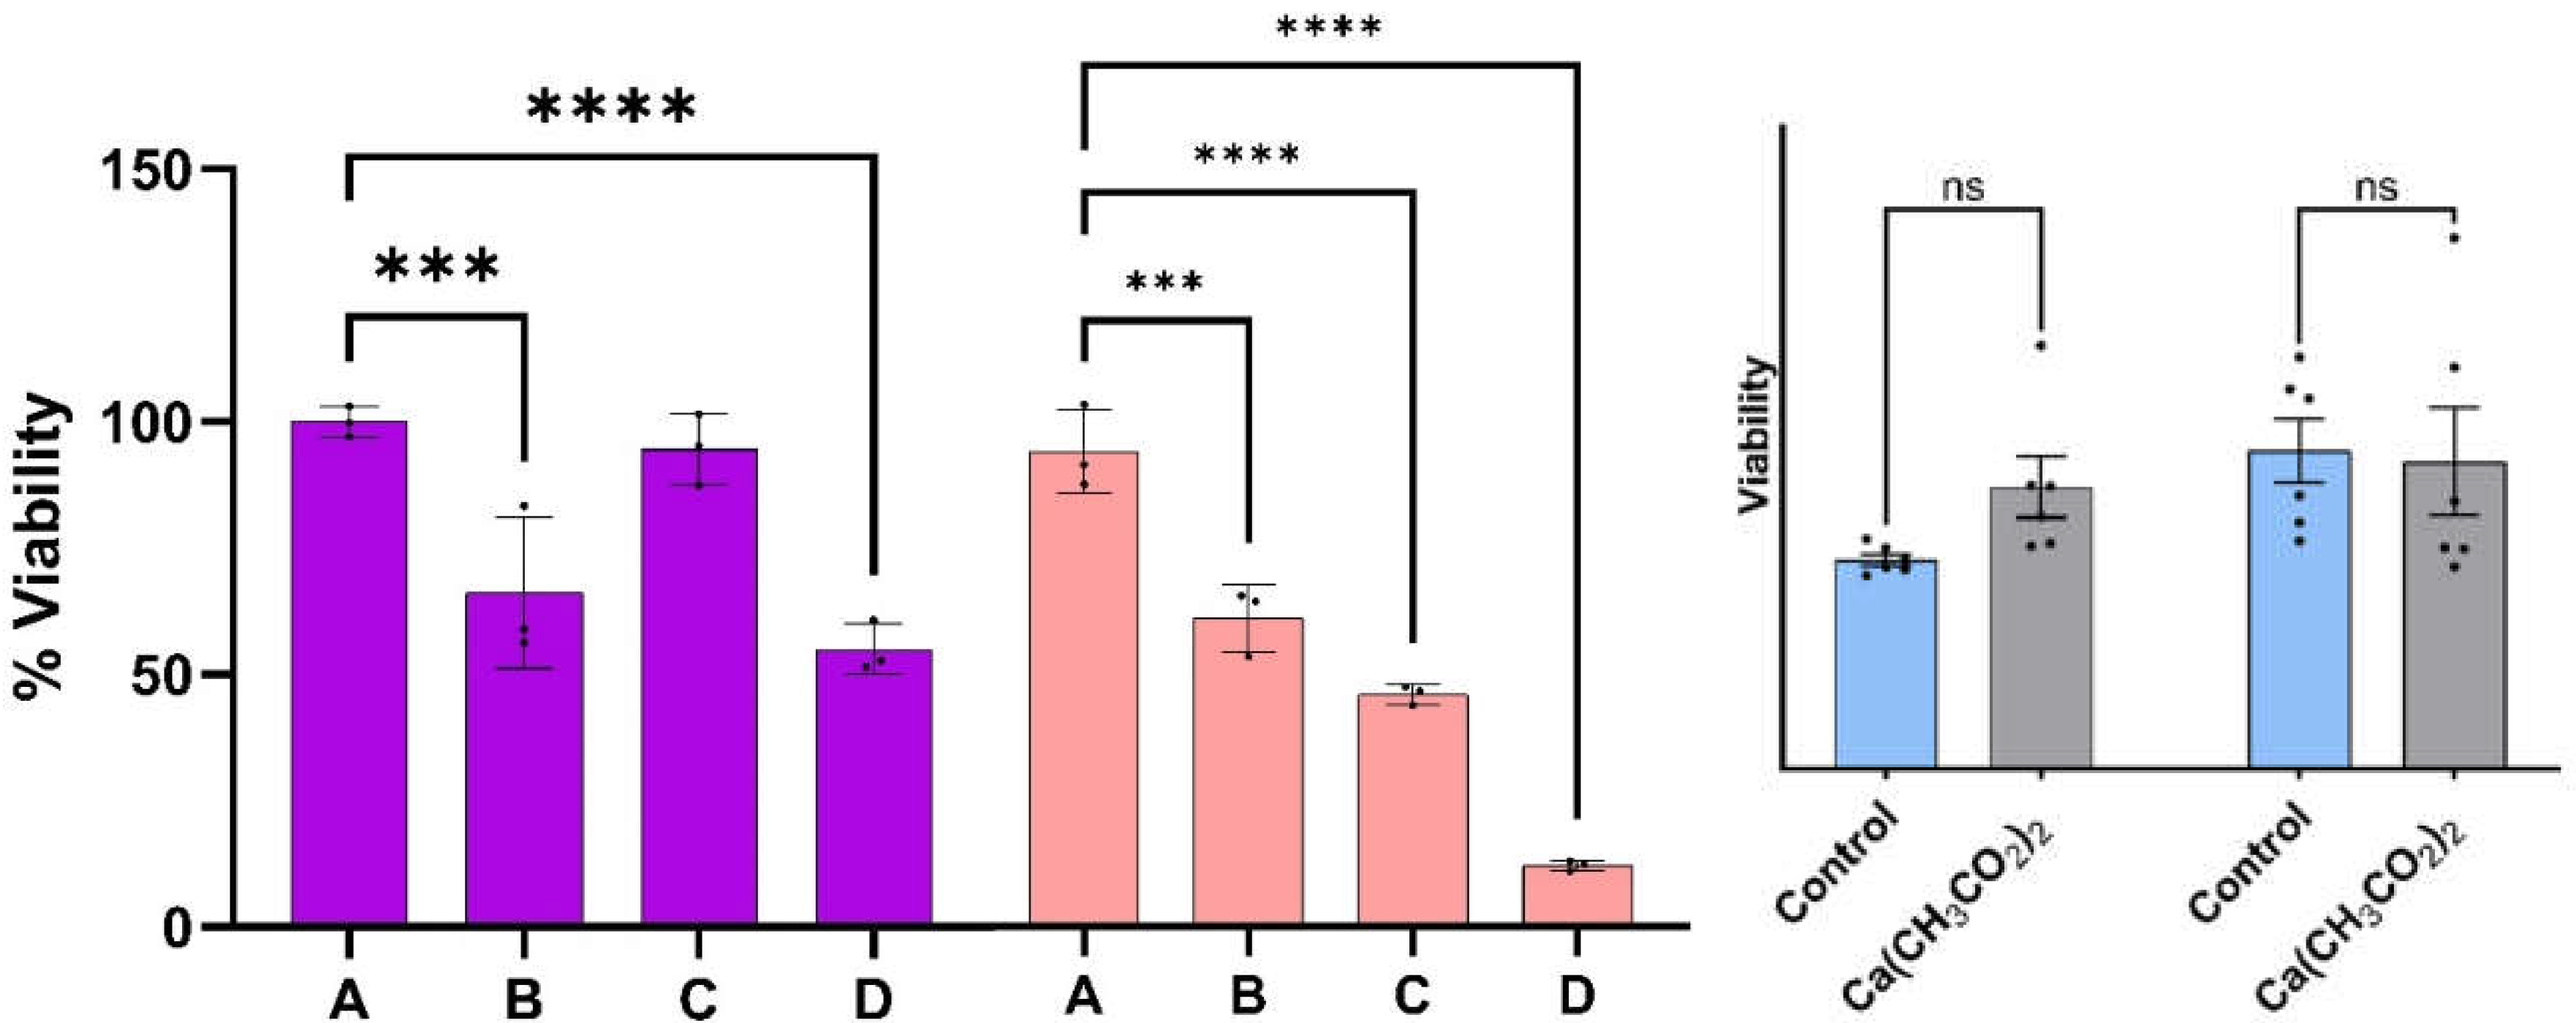
Figure 4.
The left- and right-hand side of Figure 4 summarizes the mitochondria and cytochrome C of melanoma cells with epithelial phenotype at 24 hours post treatment. The objective magnification is 20x. The insert at the upper right-hand corner represents a 200 x 200 m2 region magnified by a factor of about 4 of the indicated 24-hour measurement. The red arrow indicates cytochrome C release from mitochondria.
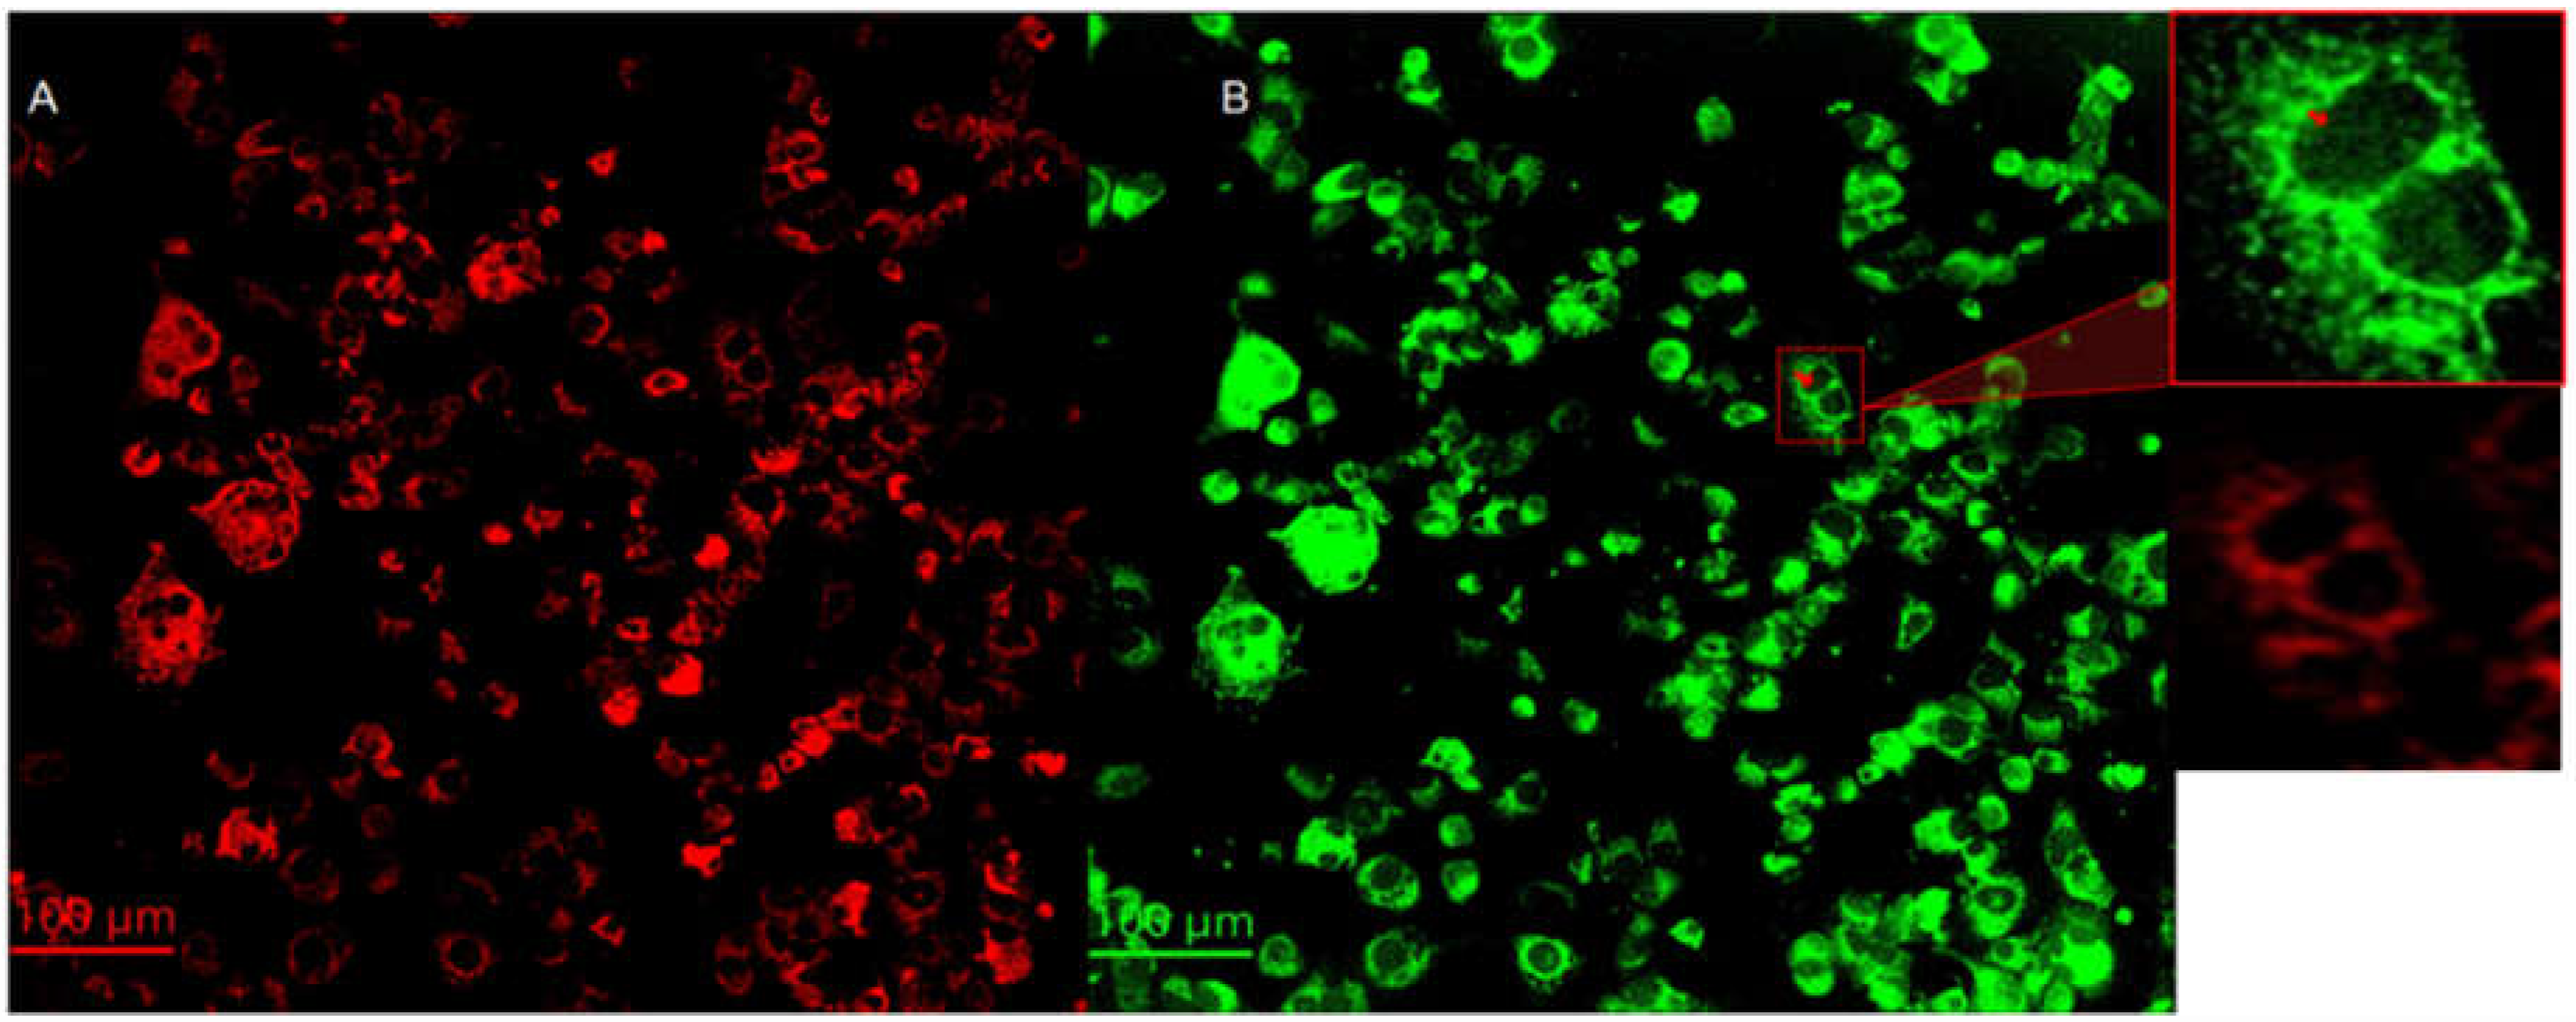
Figure 5.
Average fluorescence intensities corresponding to caspases 3, 8, and 9 expressions in melanoma cells with epithelial phenotype at 24-hour post-treatment with the dispersion D. MC and MD represent melanoma control and melanoma dispersion, respectively. Error bars represent the standard error. Fluorescence intensity of caspases 8 and 9 were multiplied by a factor of 2 for purposes of using the same scale for all measurements. The symbols * and *** indicate a significant difference in p-values between MC and MD (the number of * characters correspond to the decimal places in reported values.
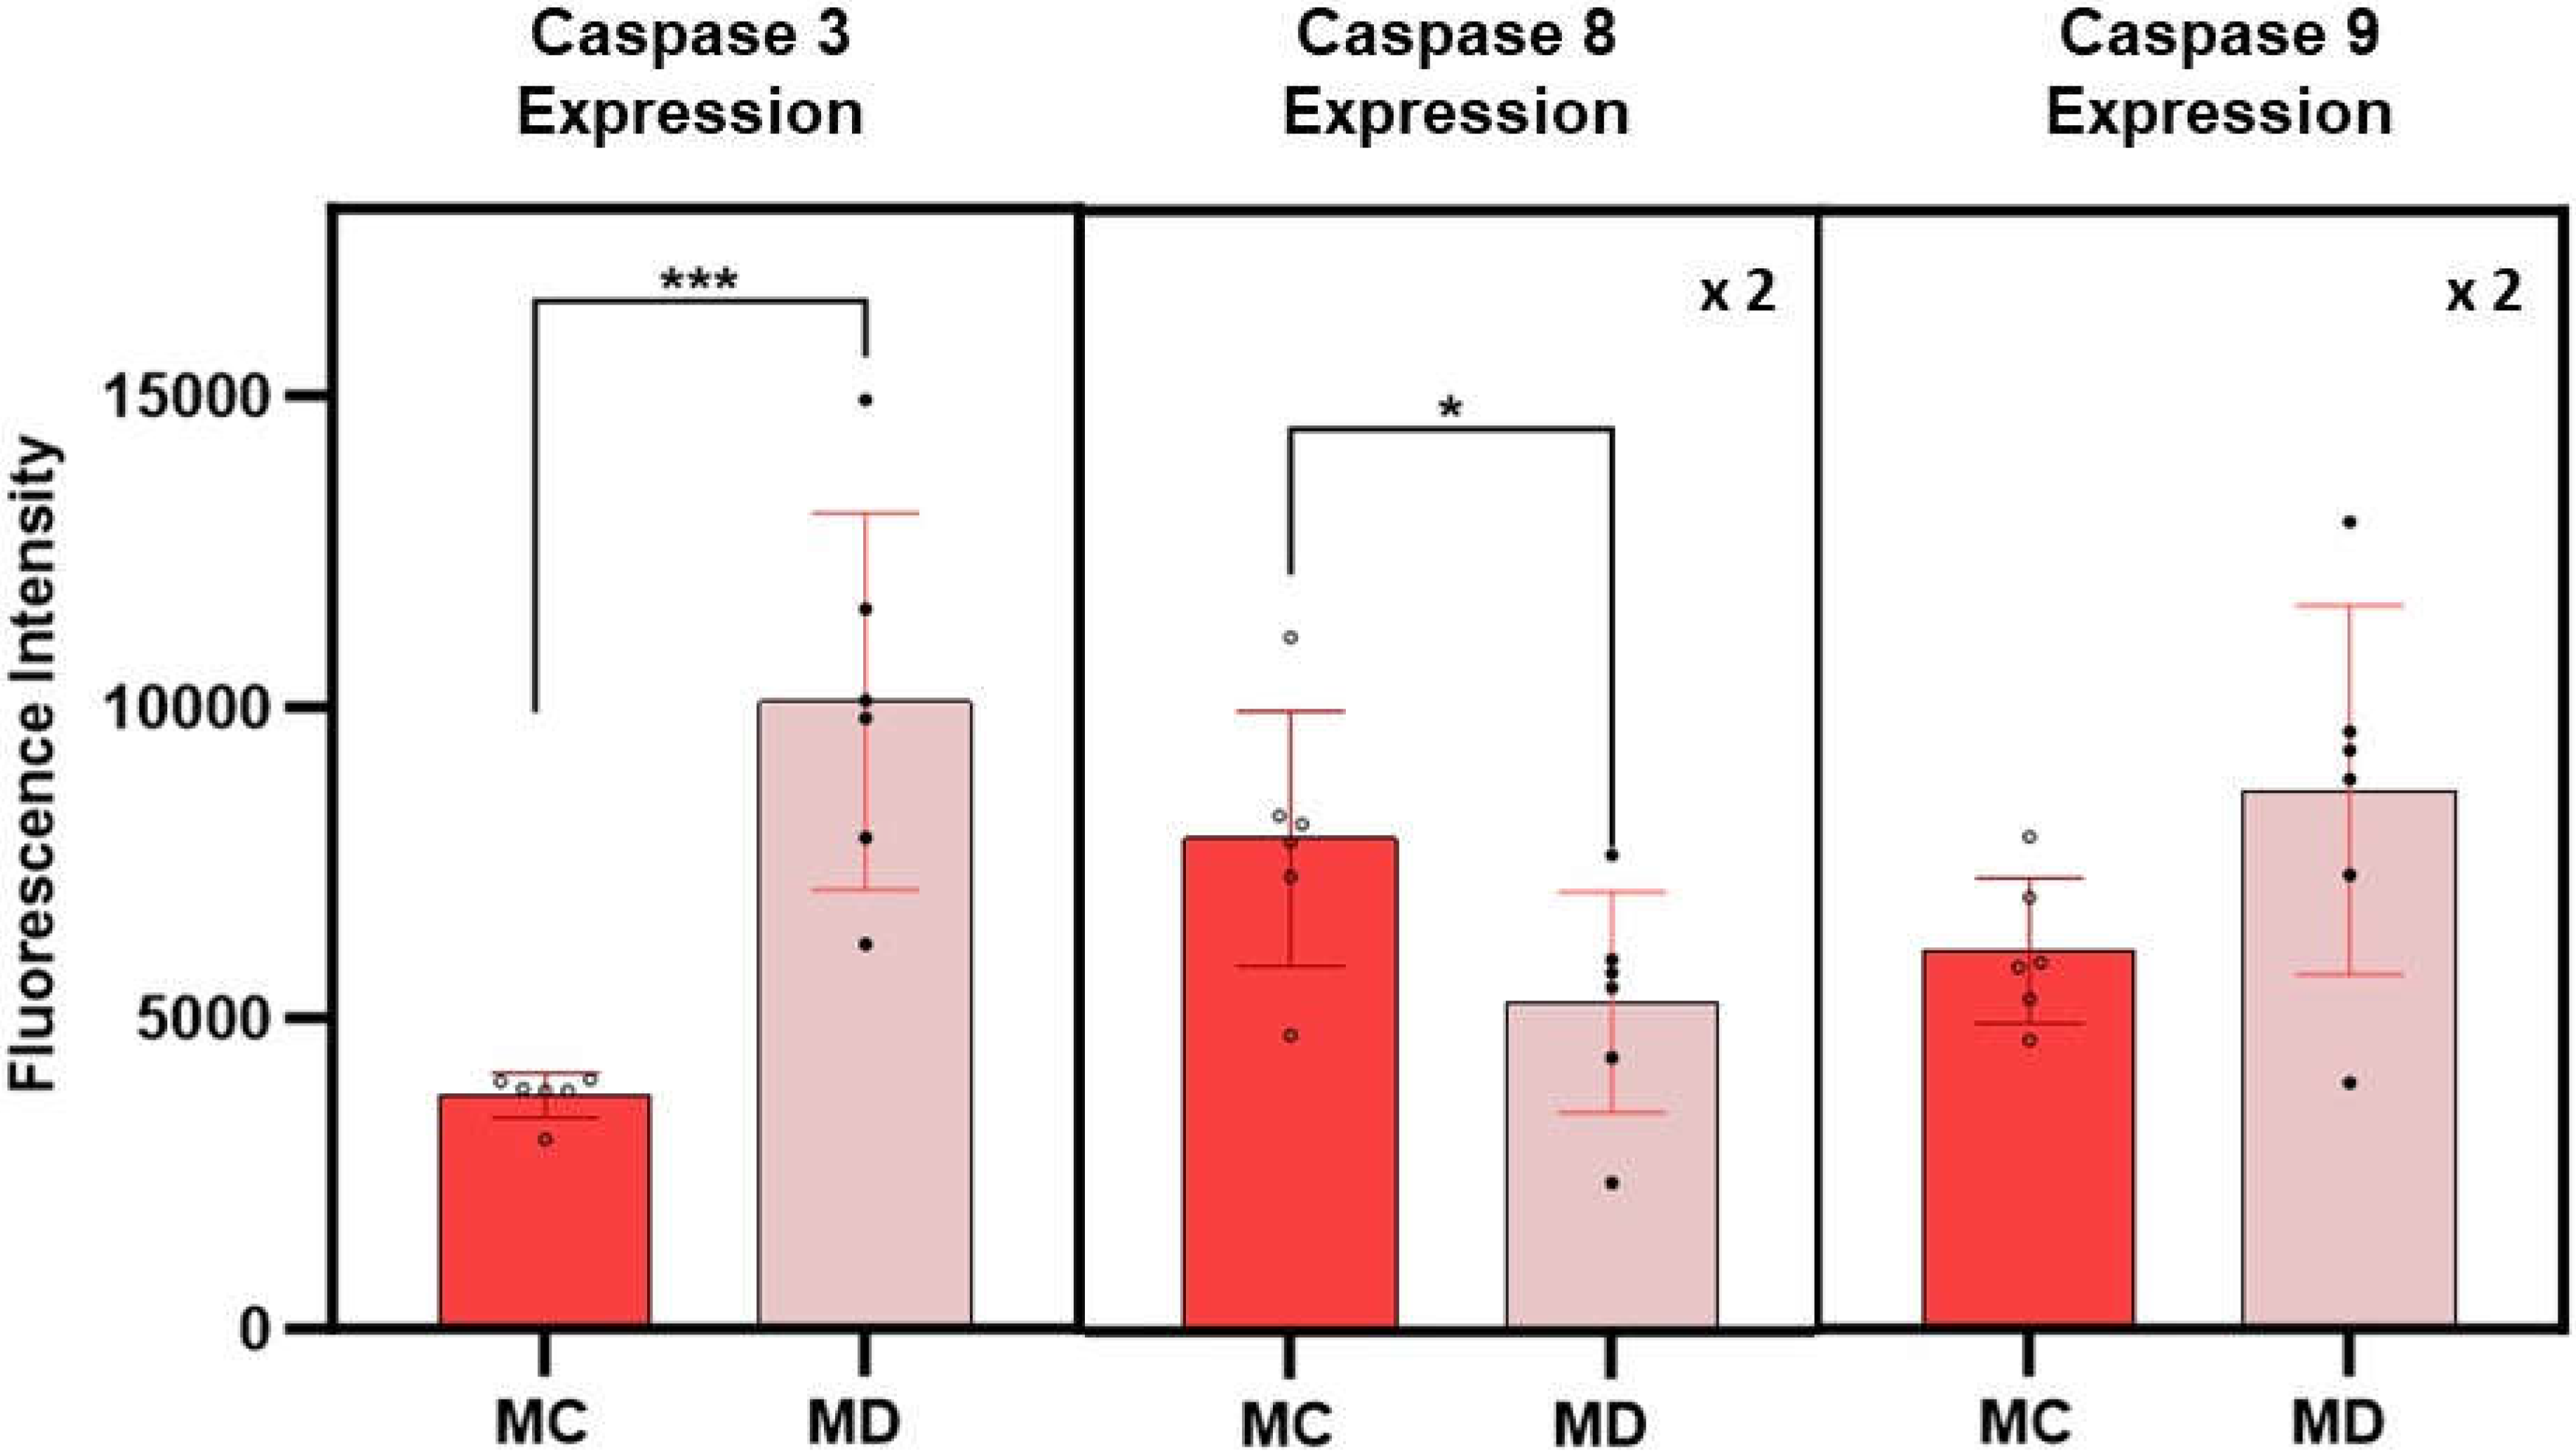
Figure 6.
Digital confocal fluorescence microscopy at 60X magnification of focal adhesion, and actin cytoskeleton in Hs 895.T (ATCC® CRL7637™) cells in (A) control and (B) 24 hours post treatment. Focal adhesions were detected using an anti-Vinculin monoclonal antibody and a FITC-conjugated secondary antibody, actin was detected using TRITC conjugated Phalloidin. The delocalization of vinculin in the cytoplasm is taken as evidence of FAK regulation in post treated malignant cells. Focal adhesion points localized on the interphase with the ECM increase as evidenced by the bright spots on the cell membrane.
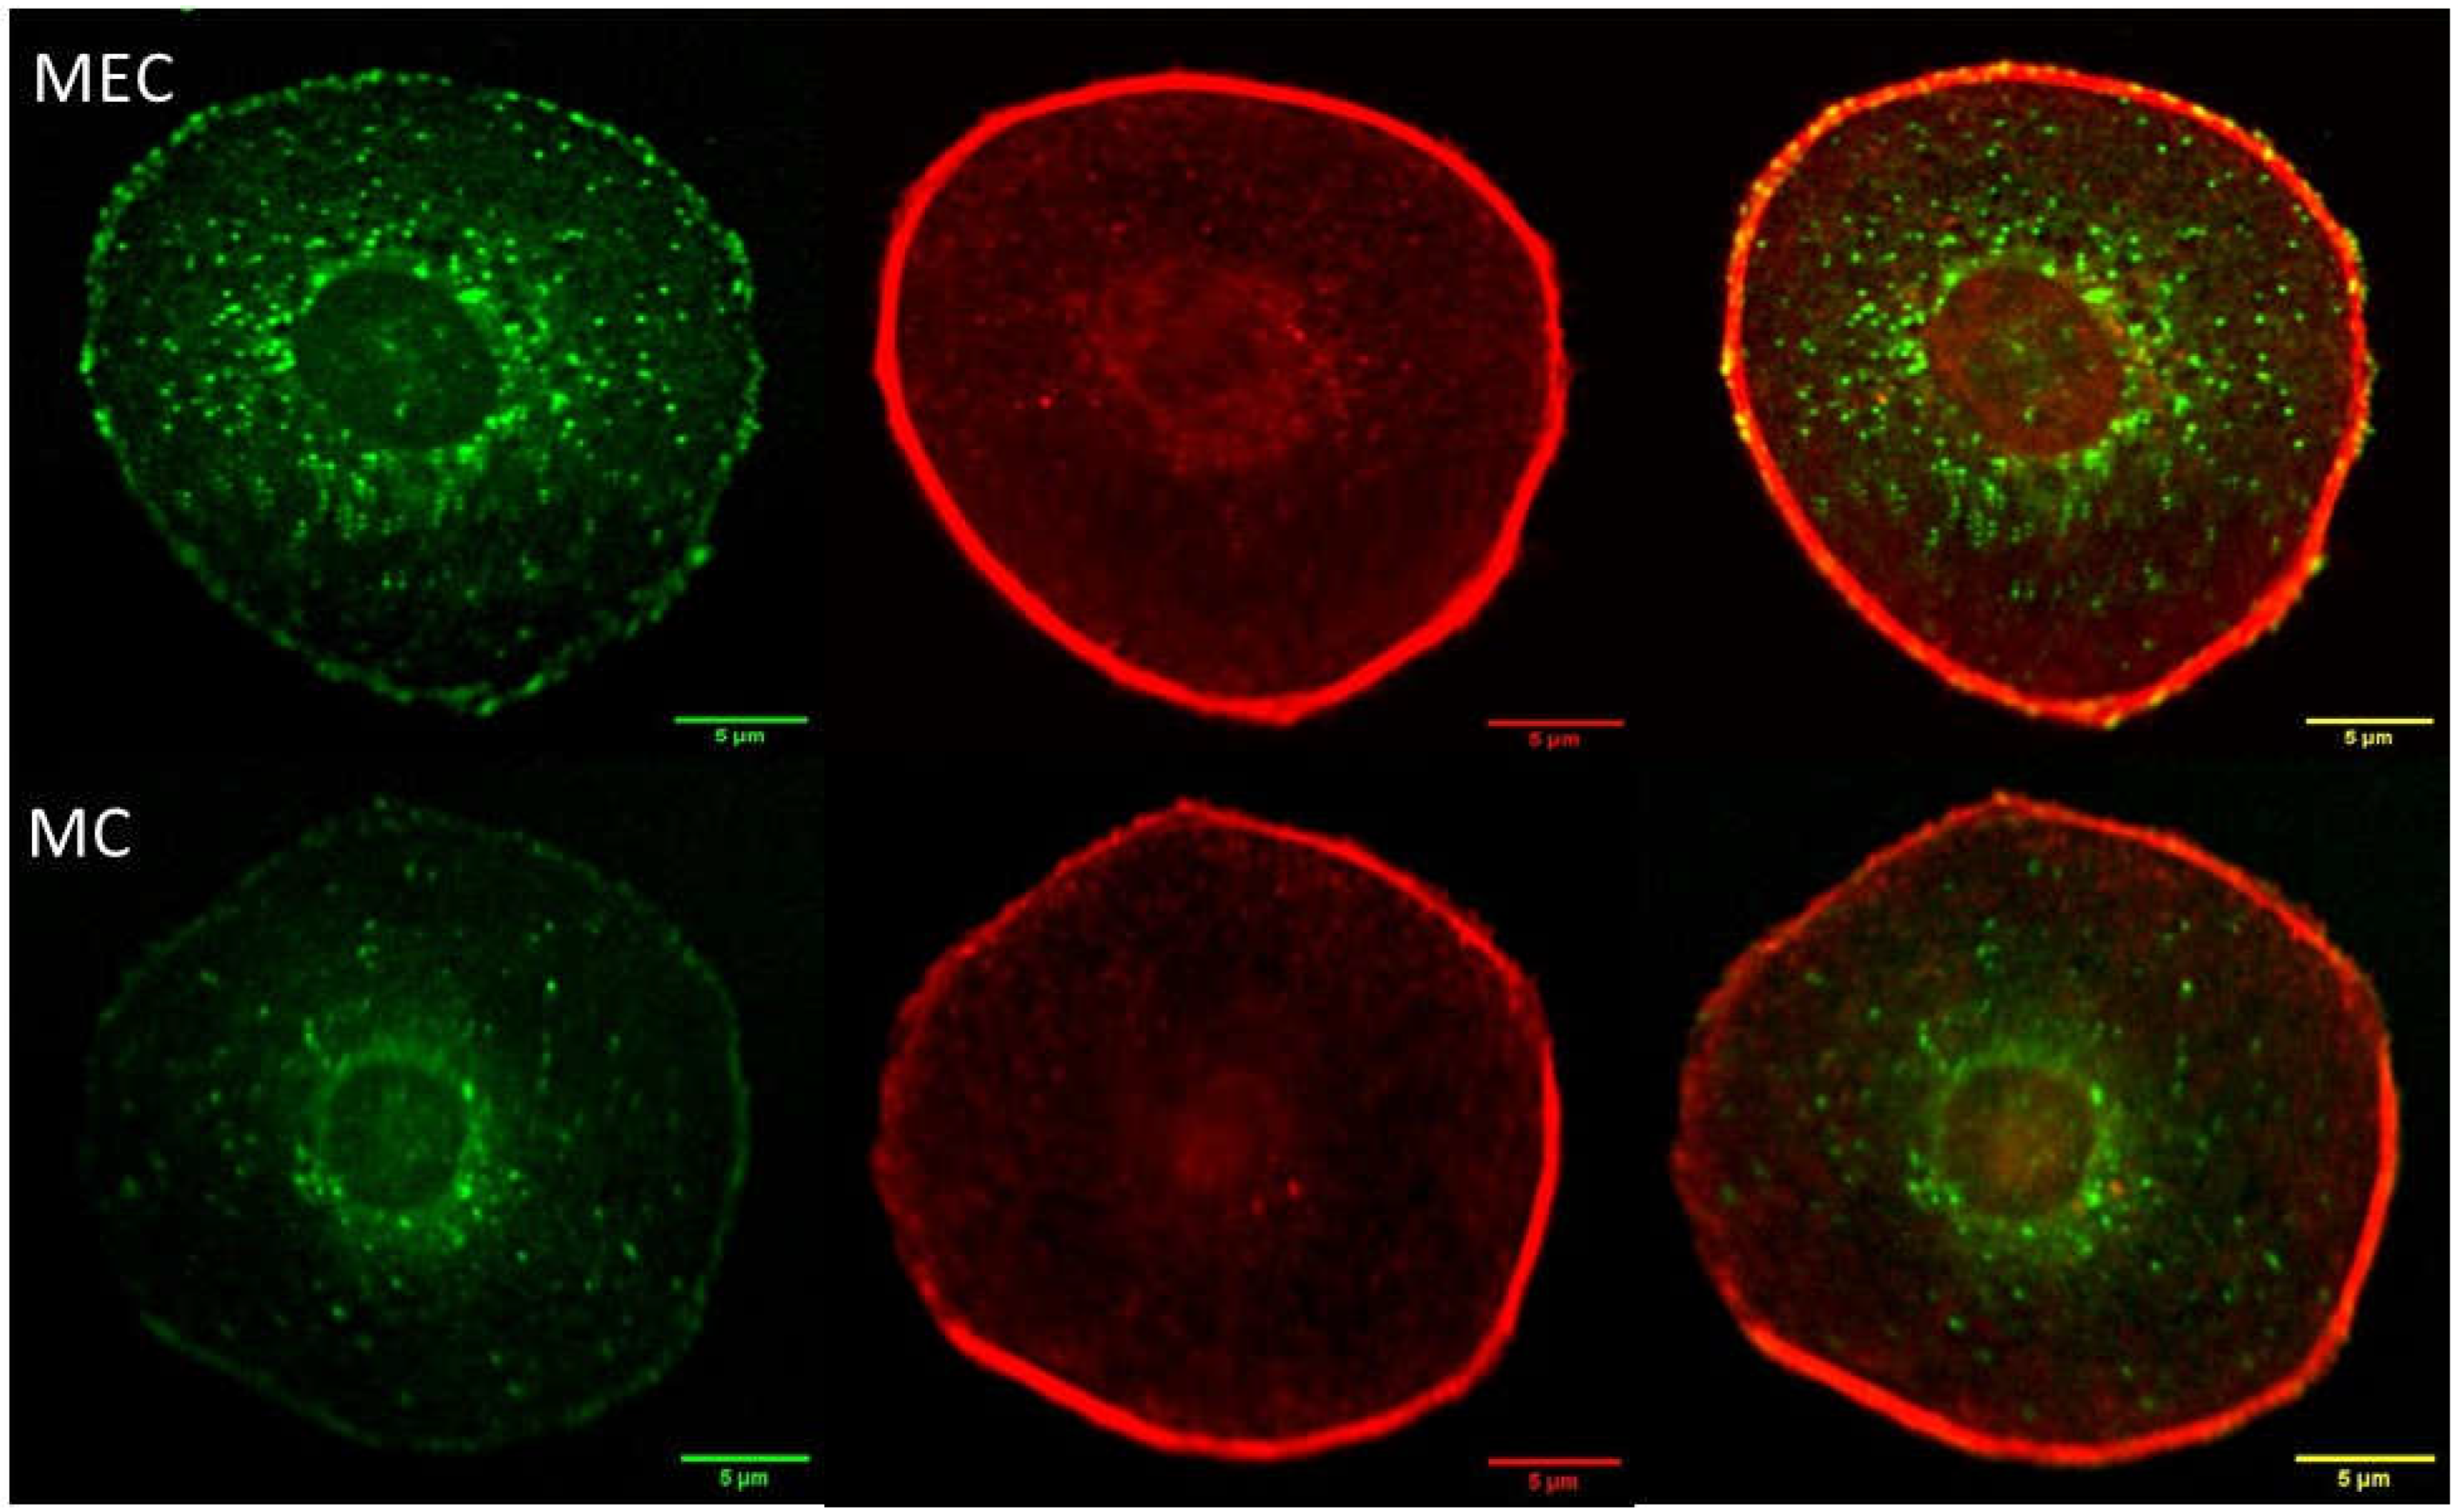
Figure 7.
The dispersion increases the number of bright focal adhesion points (FAP) at the cell membrane - ECM interphase in melanoma cells 24 hours post-treatment as summarized on Figure 7 A-C (p < 0.0001). The FA close to the nuclei (IC) and at a distance of 1.75 nuclear radio (OC) are statistically unchanged in control and treated melanoma cells as summarized on Figure 7D. The error bars in the graphs represent the standard error of measurements within a 95% confidence limit. The number of asterisks (****) corresponds to the level of significance in the p-value representing a statistically significant difference while the number of asterisks indicate the decimal places in the p-value.
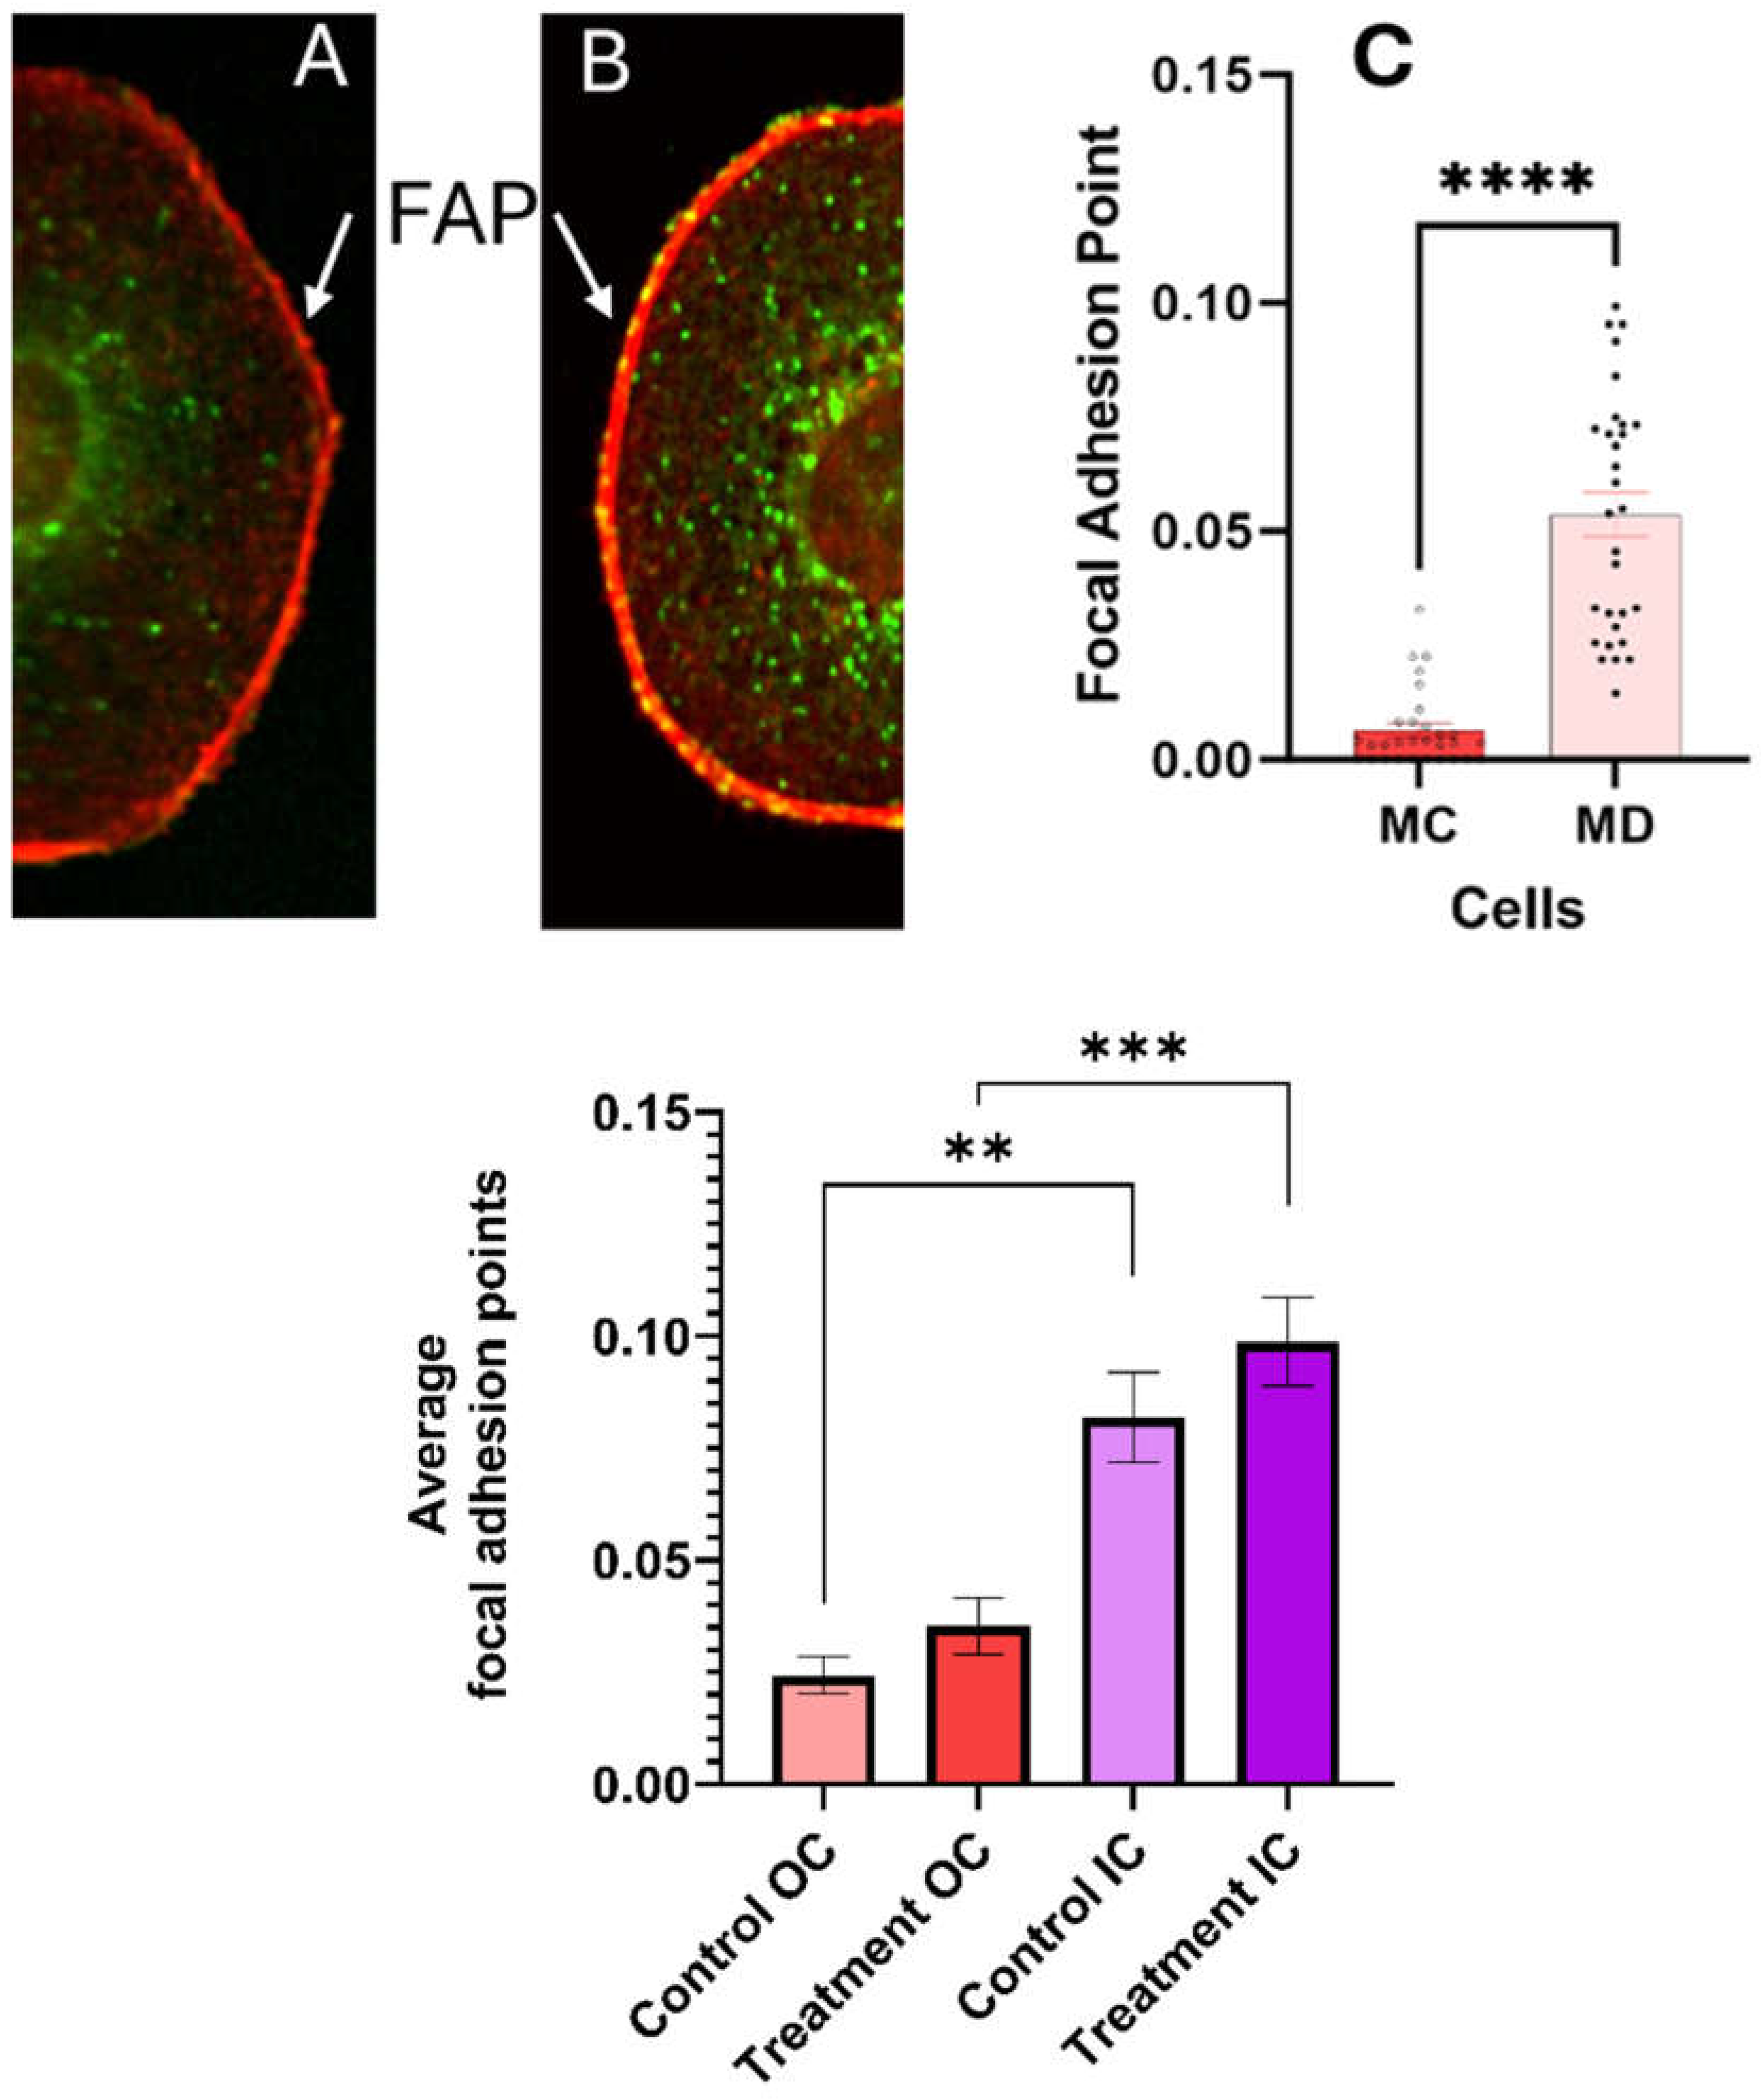
Figure 8.
The 24-hour viability of melanoma cells with mesenchymal phenotypes as a function of the percentage (%) of dispersion used. Error bars represent the standard error with confidence level of 95%.
Figure 8.
The 24-hour viability of melanoma cells with mesenchymal phenotypes as a function of the percentage (%) of dispersion used. Error bars represent the standard error with confidence level of 95%.
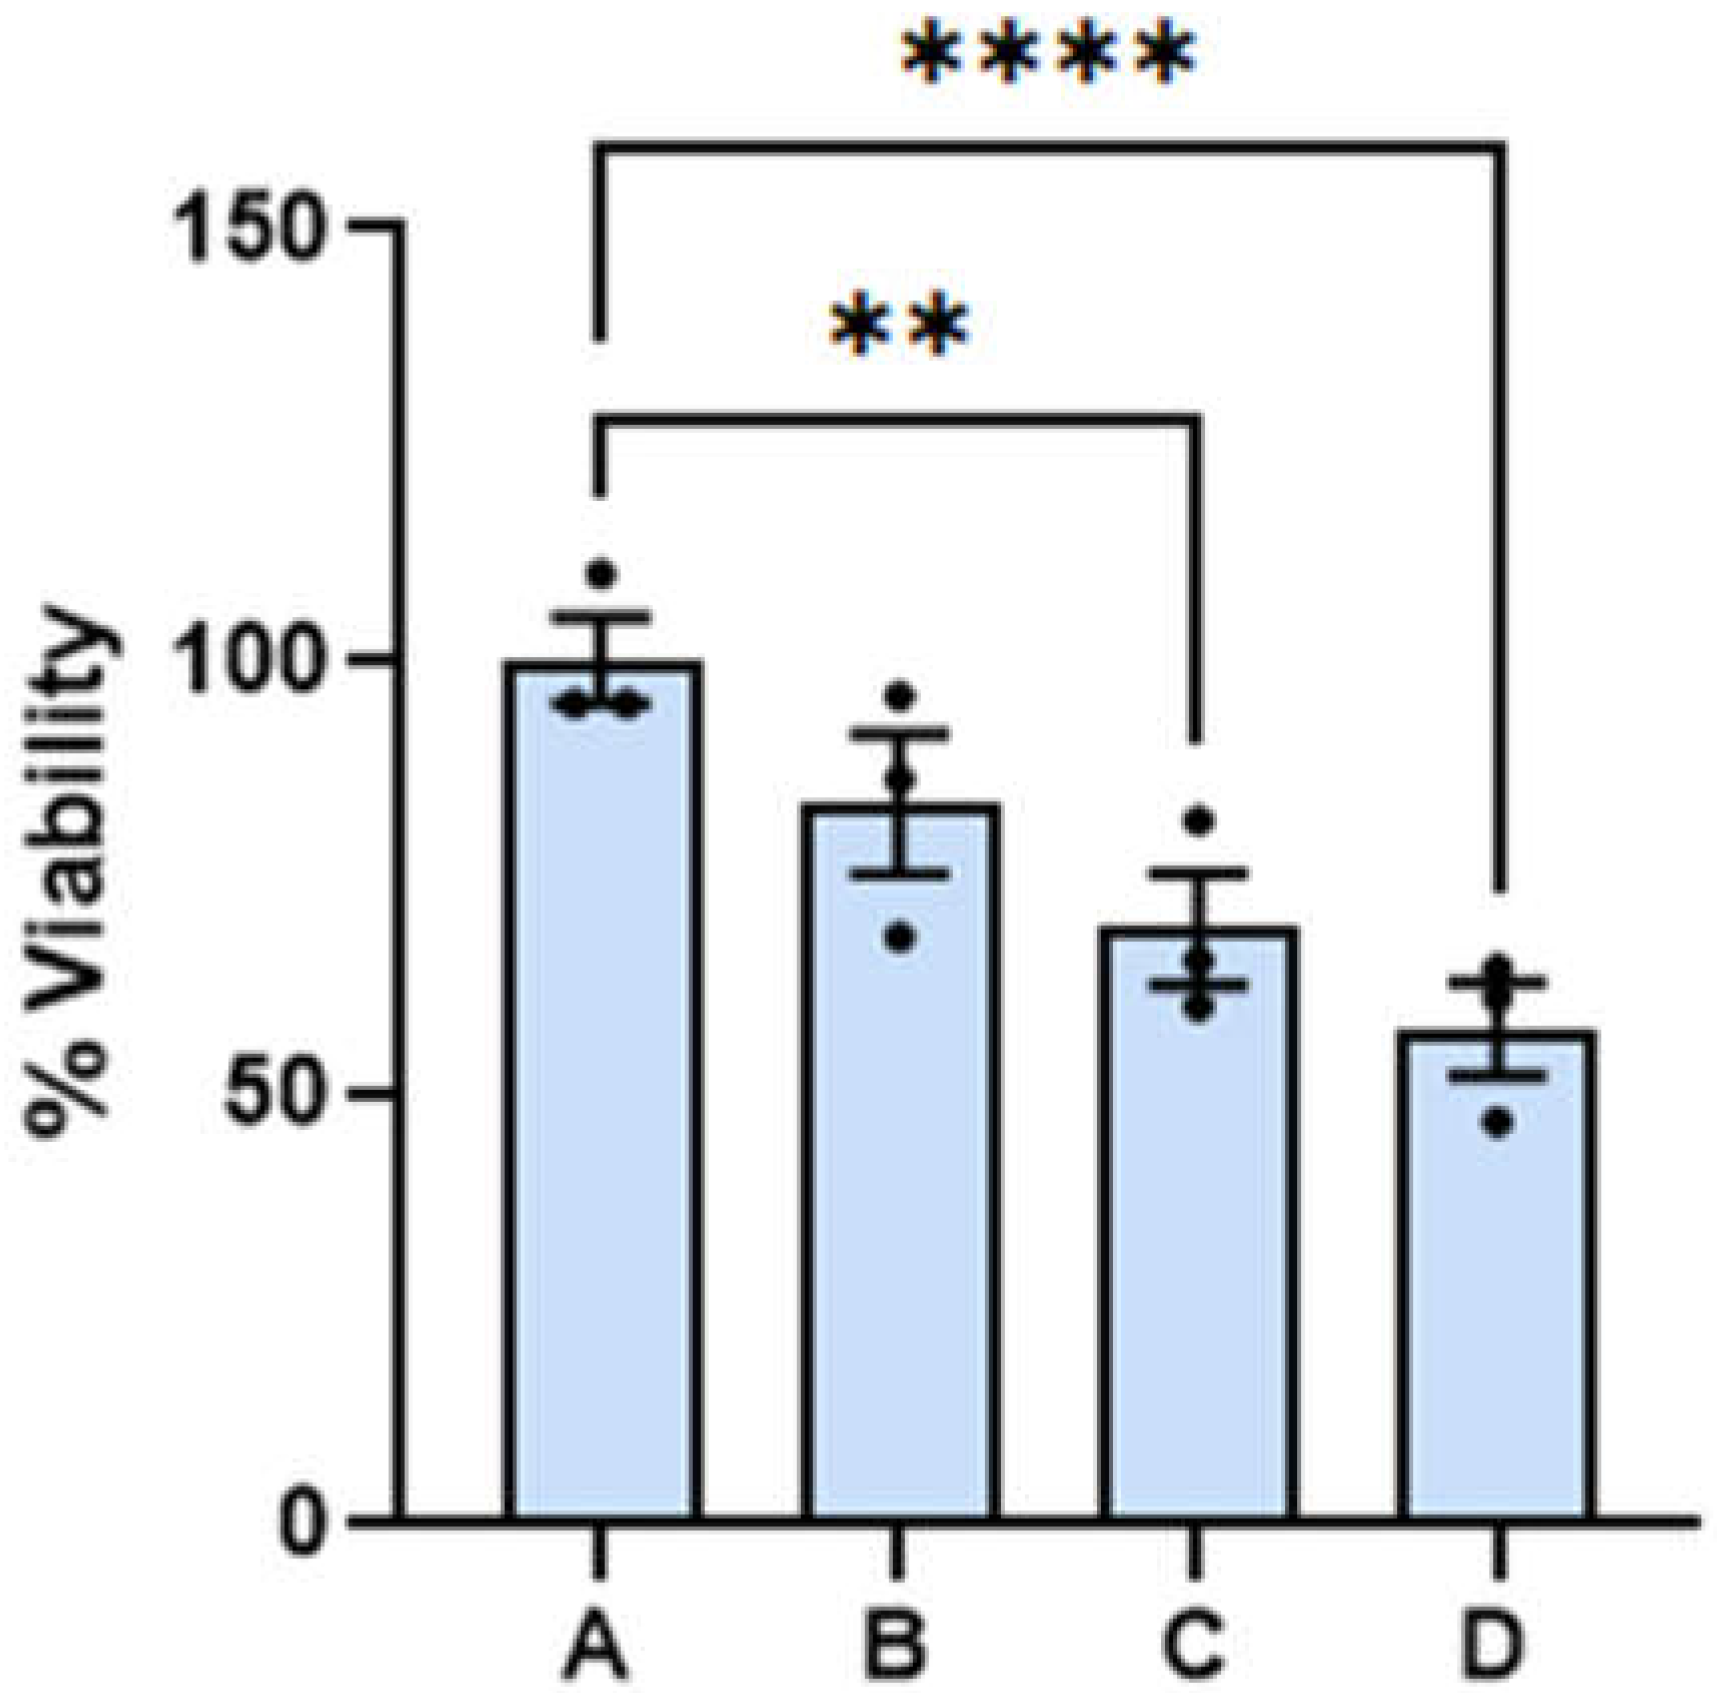
Figure 9.
The dispersion facilitates the regulation of relevant proteins associated with FAP. Digital confocal fluorescence microscopy at 60X magnification of vinculin (green) and actin (red) expression in Hs 895.T (ATCC® CRL7637™) melanoma with predominantly mesenchymal phenotype. The images corresponding to the control and 24 hours post treatment are indicated at left and right hand sides of the figure, respectively. The delocalization of vinculin in the cytoplasm is taken as evidence of FAK regulation in post treated malignant cells.
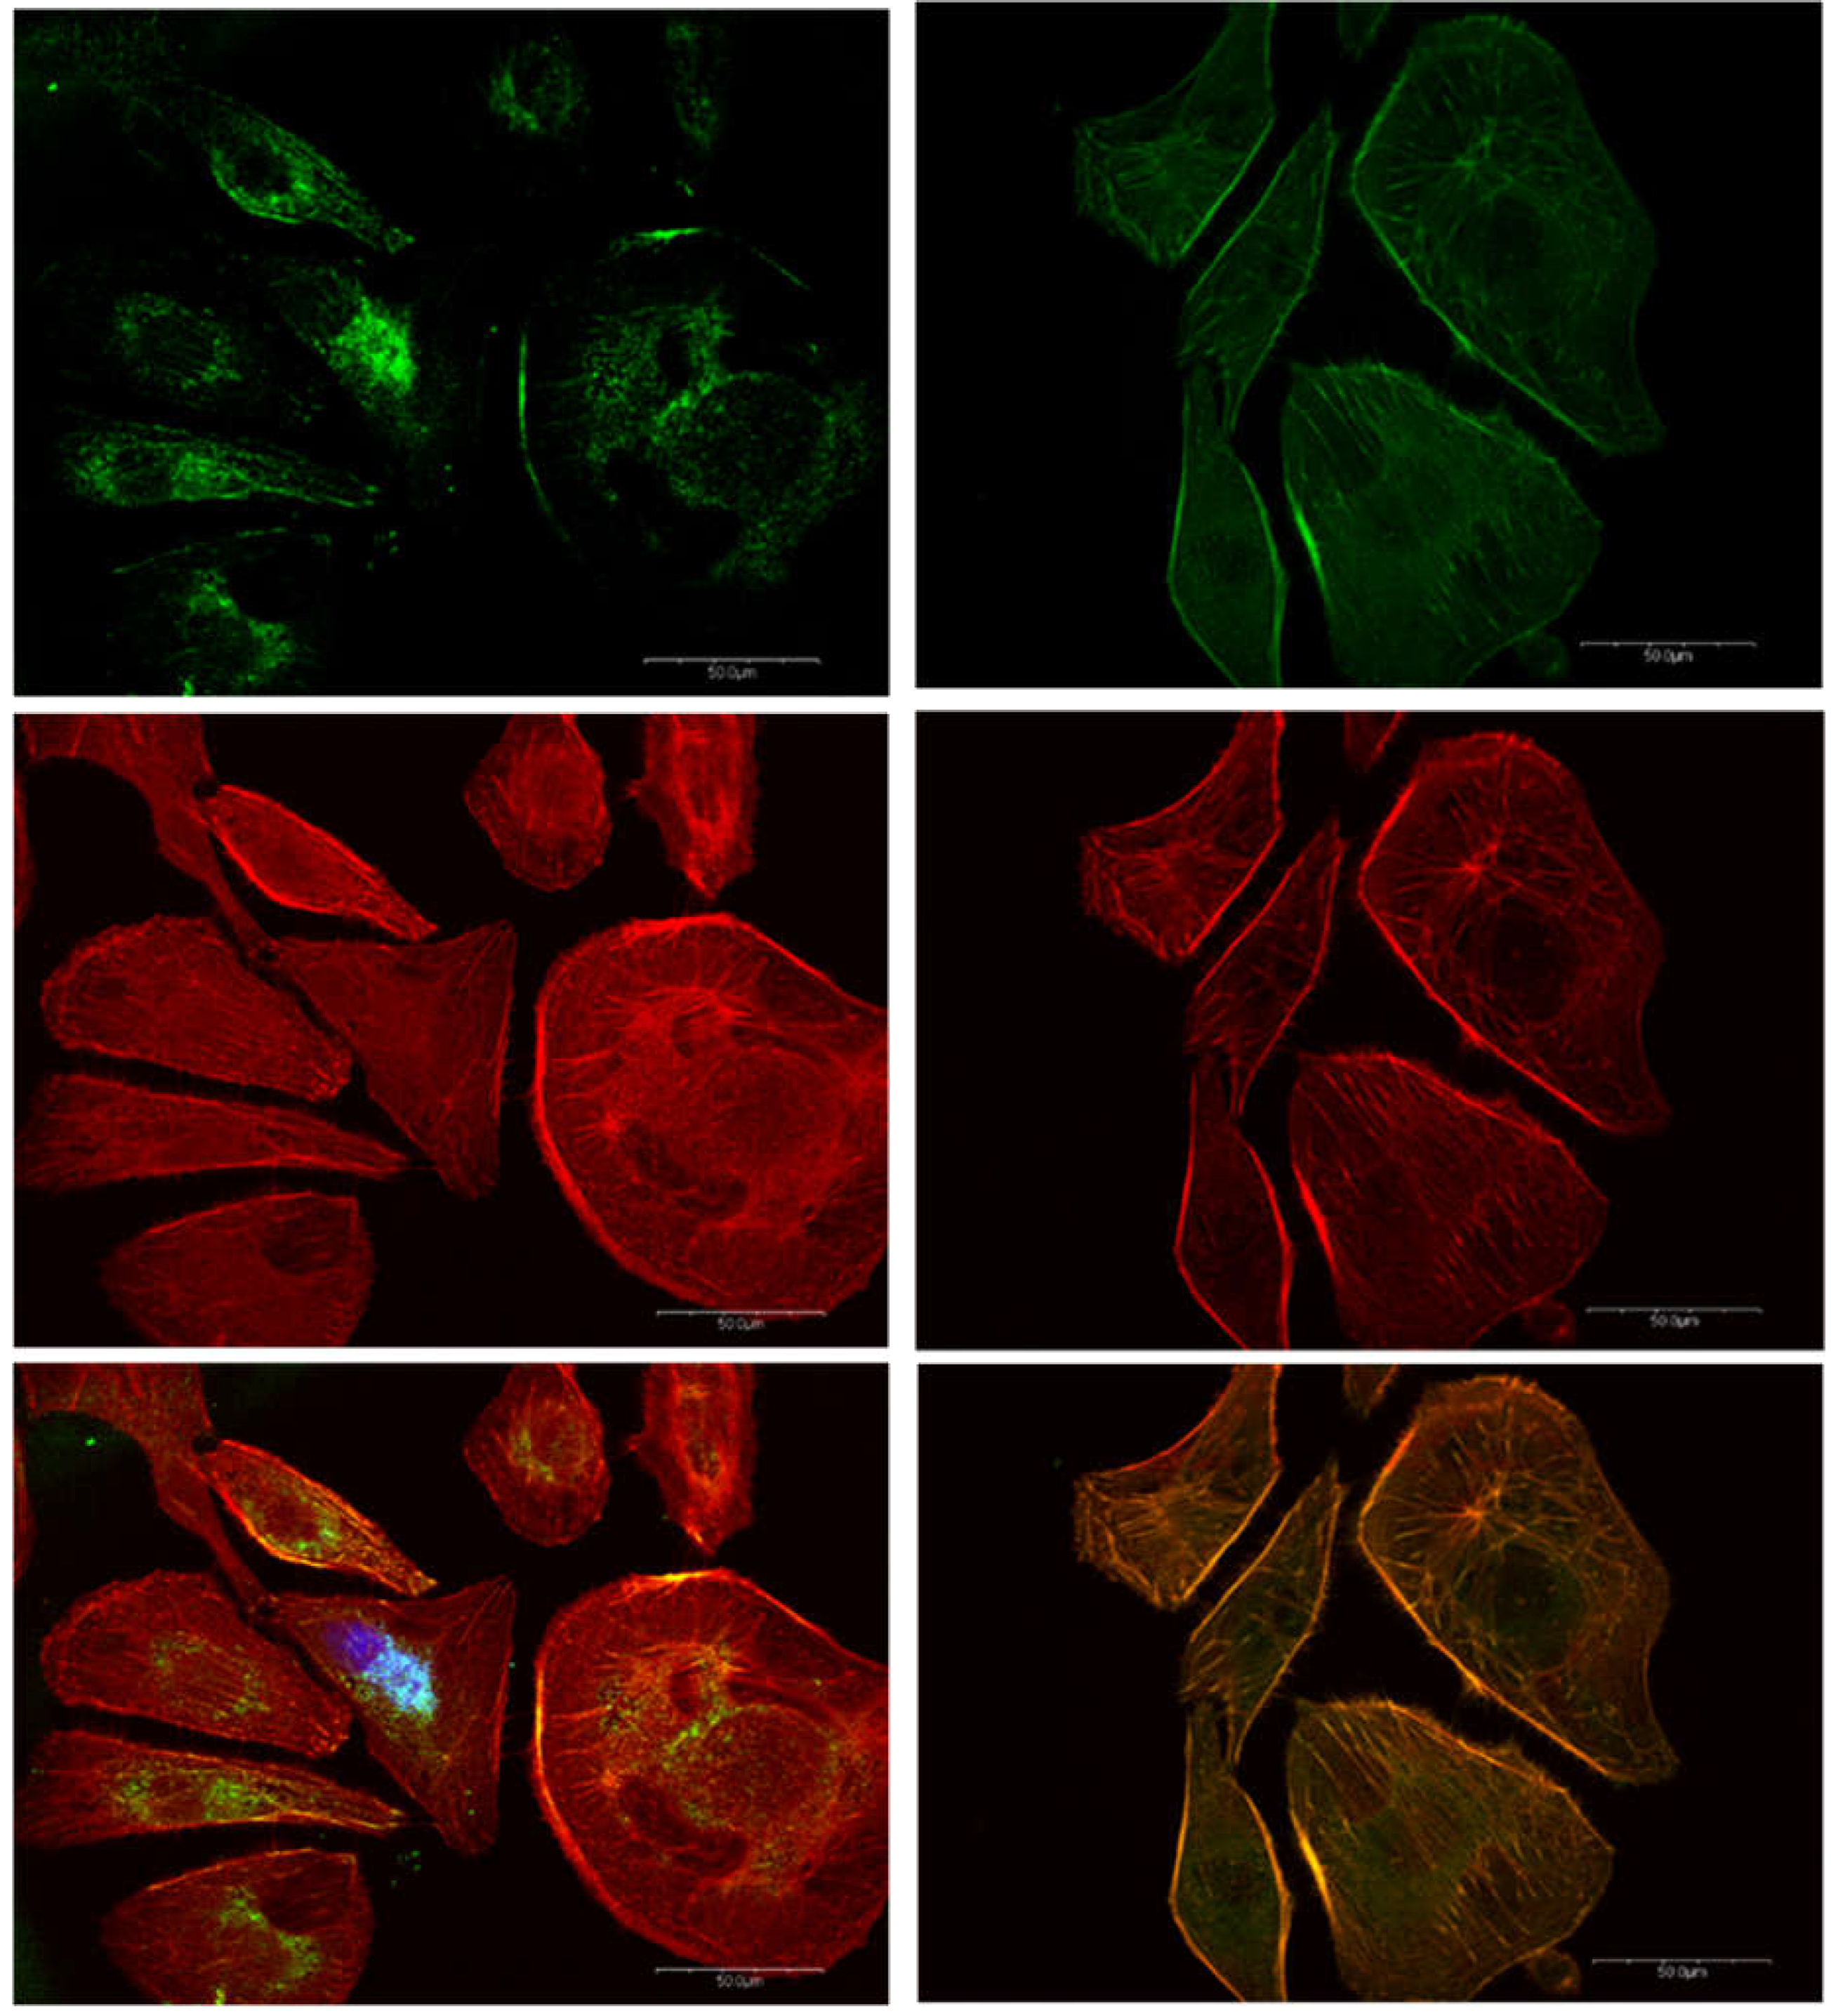
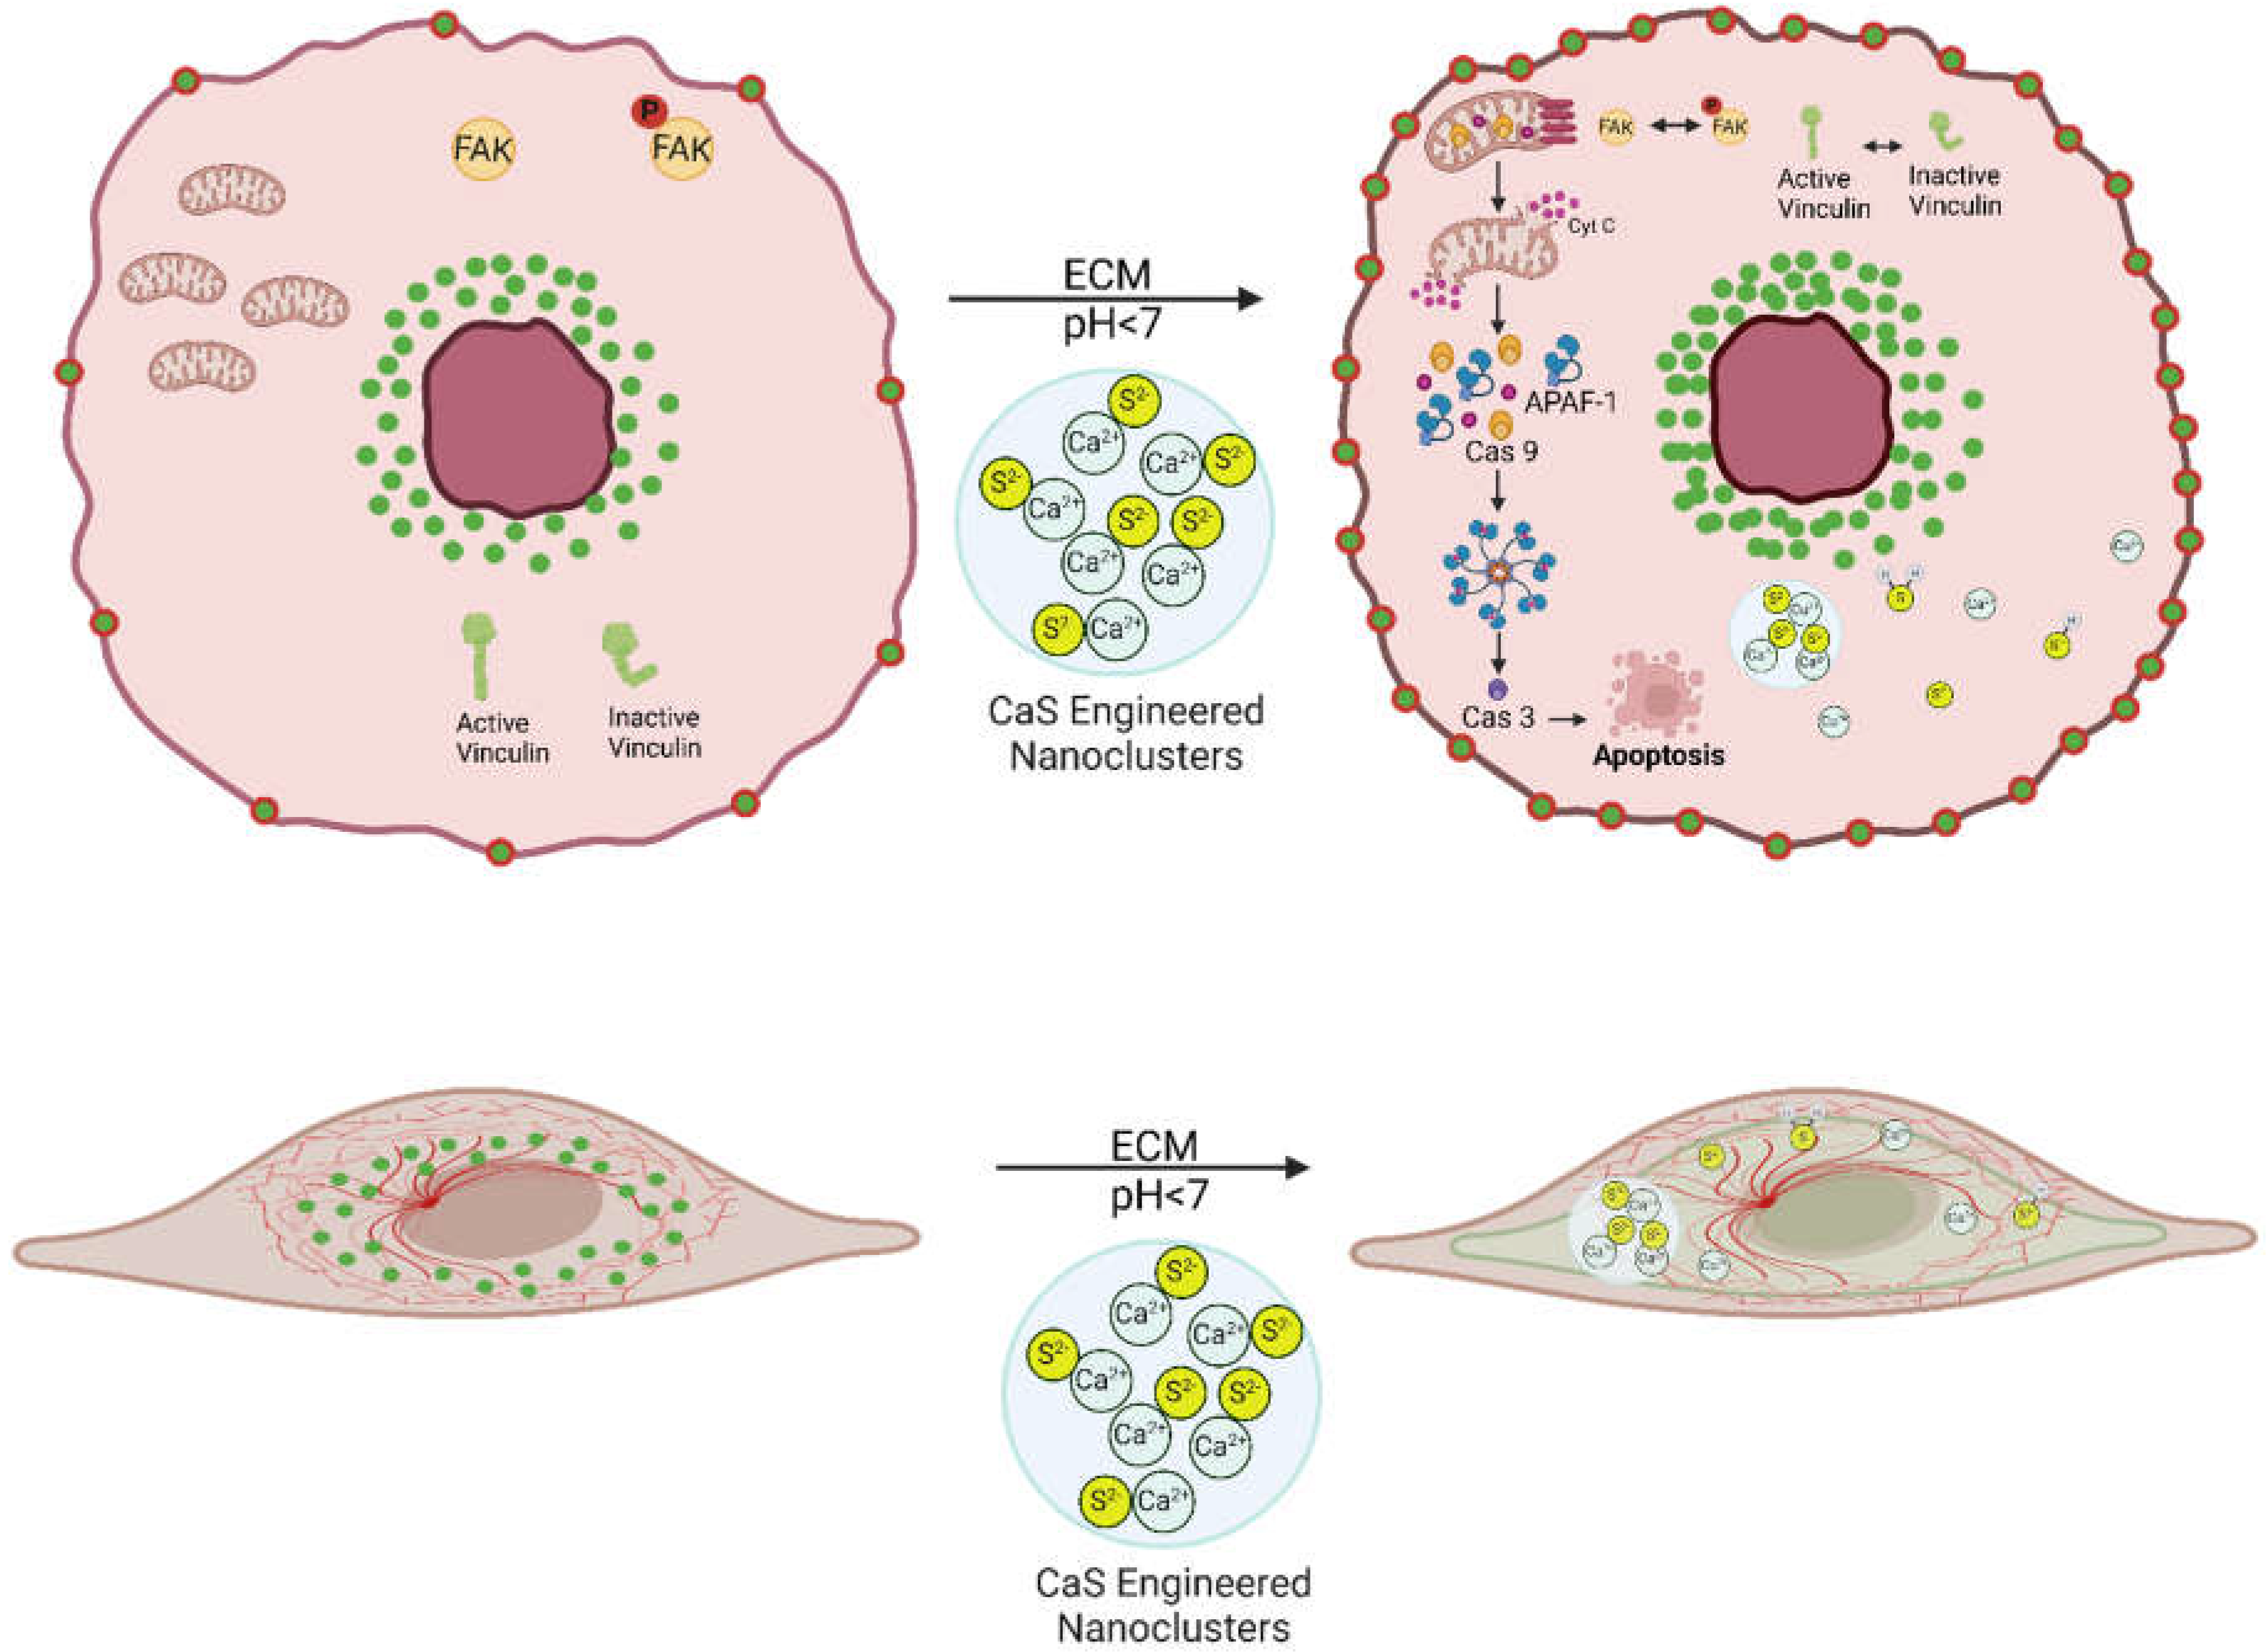
Figure 10.
Scheme to guide the eye through the discussion. The viability of melanoma cells with the predominantly the epithelial or mesenchymal phenotype is reduced by the activation of CaS nanoclusters. The resulting sulfide distribution is proposed to enter the malignant cells where the regulation of key proteins promote intrinsic apoptosis.
Disclaimer/Publisher’s Note: The statements, opinions and data contained in all publications are solely those of the individual author(s) and contributor(s) and not of MDPI and/or the editor(s). MDPI and/or the editor(s) disclaim responsibility for any injury to people or property resulting from any ideas, methods, instructions or products referred to in the content. |
© 2025 by the authors. Licensee MDPI, Basel, Switzerland. This article is an open access article distributed under the terms and conditions of the Creative Commons Attribution (CC BY) license (http://creativecommons.org/licenses/by/4.0/).
Copyright: This open access article is published under a Creative Commons CC BY 4.0 license, which permit the free download, distribution, and reuse, provided that the author and preprint are cited in any reuse.


