Submitted:
19 March 2025
Posted:
20 March 2025
You are already at the latest version
Abstract
Simian foamy virus (SFV) is a retrovirus that infects primates, including American primates (AP), but epidemiological studies are often limited to captive animals. The state of Rio de Janeiro (RJ) is home to an endemic AP species, Leontopithecus rosalia, and an invasive species, Leontopithecus chrysomelas, both endangered. This study assessed the molecular prevalence of SFV in these species. Genomic DNA was extracted from 48 oral swab samples of L. chrysomelas (Niterói/RJ) and 102 of L. rosalia (Silva Jardim/RJ). qPCR was performed to diagnose and evaluate proviral load (pVL). SFV prevalence was 23% in L. chrysomelas and 33% in L. rosalia. No age-related differences were observed, but L. rosalia showed a higher average pVL (3.27 log10/10⁶ cells) compared to L. chrysomelas (3.03 log10/10⁶ cells) (p=0.005). The viral sequence of L. rosalia clustered within a monophyletic SFVlro clade, distinct from two SFVlchrysom lineages. Origin of SFVlro dates back to 79.6 thousands of years ago. This was the first study to determine the molecular prevalence of SFV in free-living populations of Leontopithecus, and may be of great importance for elucidating the complex evolutionary history of SFV in AP.
Keywords:
spumavirus
; neotropical primates
; South America
; prevalence
; retroviruses
1. Introduction
Simian foamy virus (SFV) is a complex retrovirus classified within the Simiispumavirus genus under the subfamily Spumaretrovirinae [1,2]. SFV was first described in 1954 [3] and isolated in 1955 [4] and, since then, numerous non-human primates have been described as hosts, including prosimians, Old World primates (OWP) [5,6,7] and American primates (AP) [8,9,10,11]. Among AP, the first SFV was detected in 1973, in a culture of brain cells from Ateles sp. [12]. Nevertheless, it was only after 34 years that the first complete genome of this virus was obtained [13,14,15]. AP are highly diverse, with approximately 187 species distributed within 23 genera under five families (Aotidae, Atelidae, Callitrichidae, Cebidae and Pitheciidae) according to molecular analyses [16,17]. Among AP, 41 species (~22%) have molecular evidence of SFV infection, however only five of them have complete viral genomes sequenced, a small number considering the wide diversity of AP. The available sequences include, in addition to the one that infects Ateles sp. (SFVasp) [10,15], the SFV that infects Callithrix jacchus (SFVcja) [18], Sapajus xanthosternos (SFVsxa) [13], Brachyteles arachnoides (SFVbar) [14] and Saimiri sciureus (SFVssc) [18].
Little is known about the prevalence of SFV in AP. It is estimated that the average prevalence of SFV in captive AP is 23 - 61% [8,11,12,19,20] and among the free-living AP is 16 - 29% [8,9,20]. The scarce studies on natural SFV infections are a limiting factor in our understanding of the epidemiology of this virus [10]. Furthermore, although there are few complete and partial SFV genomes from AP available in the literature, it is possible to observe through phylogenetic analyses that in general, as in OWP, SFV follows the co-speciation theory [9,11,20]. AP arrived in the Americas approximately 40 million years ago [21], diverging between 41.1 - 22.7 million years ago [21]. As the AP speciation occurred recently and many of the existing species occupy the same environment and have similar habits, there is evidence of cross-species transmission events of SFV between AP species and genera [7,20,22,23].
Over 40% of AP species are endangered, including lion tamarins (genus Leontopithecus) [24]. The Leontopithecus genus is composed of four species: L. rosalia (golden-lion-tamarins), L. chrysomelas (golden-faced-lion-tamarins), L. chrysopygus (black-lion-tamarins) and L. caissara (black-faced-lion-tamarins) [25]. L. rosalia is endemic to the Atlantic Forest in Rio de Janeiro, Brazil [26]. They are arboreal and territorial primates, living in small familiar groups. Classified as endangered by the International Union for Conservation of Nature in 2022 [27], the non-governmental organization Associação Mico-Leão-Dourado (AMLD) has been working since 1992 on the conservation of this species in Rio de Janeiro [28]. L. chrysomelas also inhabits the Atlantic Forest, being natural of the state of Bahia, Brazil. Despite that, some L. chrysomelas have been found in the city of Niterói, Rio de Janeiro, Brazil, as a result of an introduction by a collector in the middle 90s [29]. Therefore, these primates have been established in fragments of the Atlantic Forest in this city. Also considered endangered, L. chrysomelas are monitored, captured, and transported for centers of preservation in their natural habitat in Bahia by institutions such as Centro de Primatologia do Rio de Janeiro (CPRJ), Fundação Pri-Matas, Instituto Chico Mendes de Conservação da Biodiversidade (ICMBio) and Instituto Estadual do Ambiente (Inea) [29].
Both species have ecological importance and are threatened by deforestation, habitat fragmentation, illegal traffic and diseases. They also face threats in competition for territory and resources or exposure to pathogens due to interaction with other primate species, like those from the Callithrix genus [30]. Although there are studies demonstrating the infection and prevalence of SFV in lion tamarins, they are limited to a few individuals and/or captive animals [8,11,20,31]. Herein, we describe for the first time the prevalence of SFV in free-living L. rosalia and L. chrysomelas.
2. Materials and Methods
2.1. Sample Collection
Oral swabs were collected from L. rosalia in Silva Jardim (state of Rio de Janeiro, Brazil) by Associação Mico Leão Dourado (AMLD), and from L. chrysomelas in Niterói (state of Rio de Janeiro, Brazil) by Centro de Primatologia do Rio de Janeiro (CPRJ). Sample collection occurred between February and September 2021 and the animals were habituated to human contact, being constantly monitored by veterinarians of both centers. Animals were captured individually with Tomahawk® traps with banana baits as described in [32]. All captured tamarins from Silva Jardim/RJ were taken to AMLD field laboratory for routine veterinary examinations before release and the animals from Niterói/RJ were allocated in appropriate enclosures at CPRJ. Animals were anesthetized with an injection of ketamine (10-15 mg/Kg) in the caudal region and general information was collected for all sampled animals, such as identification number, group, species, age, sex, weight and clinical conditions. While the animals were still anesthetized, samples of oral swabs were collected. Animals aged four to nine months were considered juveniles, nine to 12 months as subadults, and adults aged < 12 months. For estimating age from animals whose birth date were unknown, measurements such as body size and weight, identification pattern and postnatal ossification were also used [33,34,35]. This project was approved by the Ethics Committee on the Use of Animals (CEUA) of UFRJ (reference number 037/14). All procedures were conducted in full compliance with Federal permits issued by the Brazilian Ministry of the Environment (SISBIO 75941-4) and samples were collected following the national guidelines and provisions of IBAMA (Instituto Brasileiro do Meio Ambiente e dos Recursos Naturais Renováveis, Brazil; permanent license number 11375–1). The geographic coordinates of samples collected in Silva Jardim are available in Supplementary Table S1. We did not have the coordinates of the collections made in Niterói.
2.2. Sample Processing and Analysis of Genomic DNA Integrity
Collected swabs were placed in 1.5 mL eppendorf tubes containing 500 µL of RNAlater (Invitrogen, Thermo Fisher Scientific, USA). All samples were stored at room temperature and sent to the Laboratory of Diversity and Viral Diseases (LDDV) at the Universidade Federal do Rio de Janeiro (UFRJ), Rio de Janeiro, Brazil, to be stored at -80°C until processing. Genomic DNA (gDNA) was extracted from oral swabs using the PureLink® Genomic DNA kit (ThermoFisher Scientific, Grand Island, NY, USA) according to the manufacturer’s specifications. After extraction, samples had their contaminants (PCR inhibitors) removed with the PureLink™ PCR Purification Kit (Invitrogen). Samples were then quantified using Nanodrop ND-1000 (ThermoFisher Scientific) and stored at −20 °C. gDNA integrity for PCR analysis was checked by PCR amplification of the mitochondrial constitutive gene cytochrome B (cytB), as previously described [8]. cytB-positive samples were considered suitable for performing quantitative real-time PCR (qPCR) diagnostic for AP SFV.
2.3. Diagnostic qPCR
As described by Muniz and collaborators [36], a qPCR assay was used to simultaneously detect and quantify AP SFV integrated into host gDNA of the oral mucosa epithelium cells, obtained through oral swabs. TaqMan (Thermo Fisher Scientific) was used with primers and a probe for the amplification of a 124 bp fragment located in the virus pol gene (integrase region) [36]. The construction of the standard curve was performed through serial dilutions of 108 down to 101 copies of a pCR4-TOPO plasmid containing an insert corresponding to a 6,400 bp genomic fragment of the Saimiri SFV (SFVsqu) containing the pol gene. The plasmid was purified with the QIAGEN™ Plasmid Midi Kit (QIAGEN, Chatsworth, CA), according to the manufacturer's protocol.
All reactions were set up in a total volume of 21 μl containing 10 μl of GoTaq® Probe qPCR Master Mix 20X (Promega, São Paulo, Brazil), 1 μl of primers and probe and 10 μl of gDNA. Reactions were carried out in 96-well optical microtiter plates on a 7500 Real-Time PCR platform (Applied Biosystems, Foster City, CA), following uniform cycling parameters previously described [30]. The sensitivity of the assay was 100 copies of SFV/reaction, as determined previously [30]. Samples with more than 100 viral copies per 106 cells were considered positive for SFV infection in the qPCR. To calculate the integrated proviral load in 106 cells, the amount of DNA was converted from nanograms to picograms (pg) and multiplied by 1 million cells, with a cell having an average of 6 pg of DNA [37].
2.4. PCR of Pol Region
A nested PCR was performed to amplify a larger fragment of SFV pol in Leontopithecus for subsequent sequencing and phylogenetic analysis. The first PCR round aimed to amplify a 486-bp fragment of the pol gene and the second round amplified a 404-bp fragment internal to the first round. The primers used were specific for SFV pol infecting the Cebidae and Callitrichidae families and conditions were the same as those previously reported for other generic PCRs for SFV pol [11]. Successfully amplified fragments were purified with the E-Gel CloneWellTM (Invitrogen), according to manufacturer instructions.
Purified samples were submitted to sequencing using the Big Dye Terminator Cycle Sequencing kit v3.1 (Life Technologies, Washington, USA). The plate was precipitated and stored at -20°C protected from light until sequencing in an 3130XL genetic analyzer (Life Technologies, Foster City, USA). The obtained sequences were assembled and edited in SeqMan 7.0 (DNASTAR, Madison, WI, USA).
2.5. Phylogenetic and Timescale Analyses
The assembled sequences were analyzed with the Basic Local Alignment Search Tool (BLAST) against the complete GenBank dataset available as of September 1st, 2024. Up to 100 SFV pol sequences were retrieved and, with the removal of identical sequences, a dataset of 90 sequences was built to further evolutionary contextualization. The SFV pol sequence of Prosimiispumavirus otocrafo (accession number: NC_03902.1) was added to this dataset to root the phylogeny. Sequences were aligned with sequences representing different SFV strains, comprising a comprehensive dataset of 92 pol sequences with 213 nucleotide positions (Supplementary Table S2).
Sequences were aligned with MAFFT v7.505 [38] and subsequently trimmed with TrimAl v.1.4 [39] with a gap threshold of 0.9, removing sites from alignments composed of gaps in 10% or more sequences. Maximum likelihood trees were inferred with IQ-Tree v.2.1.4 [40] with the best fit model suggested by ModelFinder [41]. Node supports were estimated using the SH-type approximate likelihood ratio test (SH-aLRT) [42] and ultrafast bootstrap [43] with 10,000 replicates.
As the phylogenetic pattern for the American SFV observed at the golden-lions tree was not consistent with the ancient within-species diversity model expected, we inferred a time-scaled phylogenetic tree by RelTime-ML [44,45,46] to obtain chronological information. This analysis was performed in MEGA11 and estimated host divergence dates were used to calibrate internal nodes of the viral tree, following [21].
A Jukes-Cantor substitution model with a Gamma distribution and invariable rate variation model (JC+G4+I) and six calibration constraints were used to build the timetree. The ancestral node of the Macaca SFV was calibrated with a normal distribution centered at 11.2 million years ago (Mya) and a standard deviation of 0.35. Similarly, the ancestral clade of the Pongo SFV was calibrated with a normal distribution of mean 1.55 Mya and a standard deviation of 0.15. For the Pan SFV ancestral node, a calibration of 8.01 Mya with a standard deviation of 0.45 was applied. The shared ancestral node of the Pan and Pongo SFV was calibrated at 20.32 Mya with a standard deviation of 0.85, while the shared ancestral node of the Pan, Pongo, and Macaca SFV was set to 31.08 Mya with a standard deviation of 0.95. Finally, the ancestral node of Platyrrhini and Catarrhini SFV was calibrated at 39.03 Mya with a standard deviation of 1.1 , following [21].
The phylogenetic tree and timetree were visualised using ggtree v.3.10 [47] in R v.4.3.2. The original nucleotide dataset, final alignment file, generated tree files, and timescale files are provided in Supplementary File S1.
2.6. Statistical Analyses
For statistical analysis and graphing, RStudio version 4.3.1 [48] and GraphPad Prism 8 [49] (GraphPad Software, Boston, Massachusetts USA) were used. To compare the prevalence and associations in relation to the analyzed species, sex, or age group of individuals, Pearson's chi-square test [50] was used, a test indicated to compare two independent categorical variables. To compare mean proviral loads, the Welch t-test was used, or t-test for unequal variances, a two-sample location test used to test the hypothesis that two populations have equal means.
3. Results
3.1. Study Population
Oral swab samples were collected from 150 Leontopithecus specimens, 48 of which were L. chrysomelas housed at CPRJ and 102 L. rosalia captured at AMLD. While for L. rosalia the distribution of samples was similar between sexes (48 females and 54 males), for L. chrysomelas there was a predominance of samples from male animals (n: 29, 60%). There was no additional information on the L. chrysomelas specimens, but for L. rosalia the age categories were obtained, where a predominance of adults was observed (n: 48, 47%), as well as morphological information and field data, all described in Table 1.
The L. rosalia were in good body condition, with a median weight of 521g, with an average weight of 83.1 millimeters and no changes were observed in the physical examination. Such information was not available for L. chrysomelas. Geospatial coordinates and group composition were also available. The median collection per point was 5 individuals, and per group was 3. All information is summarized in Table 1.
3.2. SFV Prevalence
All samples had the constitutive cytB gene PCR amplified successfully and were deemed suitable for SFVdiagnosis by qPCR. The overall prevalence of SFV infection in the Leontopithecus genus was 30% (45/150). In L. chrysomelas, the overall prevalence was 23% (11/48) (Figure 1A), with 33% of females (6/18) and 17% of males (5/29) positive for SFV (p=0.18) (Figure 1B). The overall SFV prevalence of L. rosalia was 33% (34/102) (Figure 1A). The prevalence in females was 33% (16/48), as well as in males (18/54) (p= 0.58) (Figure 1B). There was no statistical difference between SFV prevalence in L. rosalia and L. chrysomelas (p = 0.5).
For the L. rosalia population, it was possible to estimate the SFV prevalence according to the age of the individuals. Juveniles had a prevalence of 29% (9/31), subadults had 22% (5/23), and adults had 42% (20/48) (Figure 1C). There were no significant differences in SFV prevalence between the age groups. L. rosalia individuals are organized into groups at different geographic locations and, in this study, animals belonging to 12 locations and 31 groups were sampled (Figure 2; Table 1 and Table 2). Thus, it was possible to indicate the SFV prevalence at each of the collection points, as well as in each of the groups, while the median prevalence was 25% (0-100%). Table 2 shows the SFV prevalence according to the location and Table 3 shows the prevalence according to the groups at each of these collection points.
3.3. SFV Proviral Load
Upon qPCR analysis, it was possible to measure the SFV proviral load of the infected animals. The average proviral load was 2.36 x 10⁴ copies per 106 cells (log10 3.03; min 1.29 log - max 5.89 log). In L. rosalia, the average SFV proviral load was 3.04 x 10⁴ per 106 cells (log10 3.17; min 1.43 log - max 5.89 log), while in L. chrysomelas, the average SFV proviral load was 2.36 x 10⁴ copies per 106 cells (log10 3.03) (min 1.29 log - max 3.30 log) (Figure 3A). We observed a significant difference in the SFV proviral load between L. chrysomelas and L. rosalia (p =0.0017). There was no statistical significance between sexes when comparing the two different species or between the age groups in L.rosalia (Figures 3B and C, respectively).
3.4. Phylogenetic and Timescale Analysis
To sequence the SFV infecting free-living populations of the two Leontopithecus species, a PCR was performed to amplify a larger fragment of the SFV pol gene, a 404-bp fragment of the integrase region. All samples positive for SFV infection in the qPCR diagnosis (n = 50), 34 from L. rosalia and 16 from L. chrysomelas, were subjected to PCR of the larger fragment of pol. However, only three samples of L. chrysomelas and one sample of L. rosalia had that fragment successfully amplified and were thus directed to sequencing. Only one of the positive samples analyzed, a sample from L. rosalia, had the sequence successfully determined (MP261), generating a 213-bp DNA fragment (GenBank accession number: PP960560).
The maximum likelihood phylogeny inferred recovered a topology consistent with previously proposed SFV, with most host specific viral lineages inferred with high support values (SH-aLRT > 75, UFBoot > 75). The L. rosalia generated sequence grouped with SFV of the Cebidae and Callitrichidae families, close to another sequence from L. rosalia (SFVlro; GenBank accession number: PP960560) as expected, forming a monophyletic clade of SFVlro with strong support (SH-aLRT > 98.8, UFBoot > 100). However, it did not form a sister clade with either of the two circulating L. chrysomelas SFV lineages (SFVlchrysom) (Figure 4A). The phylogeny of SFV infecting the Cebidae and Callitrichidae families can be further visualized in Figure 4B.
While our phylogeny inferred the SFV infecting Old World primates (OWP) as a monophyletic clade within each of the host family that they infect, we do not observe the same happening in the SFV infecting AP. For instance, the SFV infecting the family Pitheciidae did not form a monophyletic clade in our analysis. Also, we can observe the presence of two lineages of SFV circulating both in the Sapajus and Leontopithecus genus. Although the SFV families are mixtured in the AP, we observe monophyletic clades in each SFV lineage. The SFV infecting Leontopithecus genus always forms a sister clade of SFV from Cebidae or Callitrichidae families.
Considering this unique pattern, a time scale phylogenetic tree was obtained by the RelTime-ML method. The SFV found in OWP served as calibration points using its host divergence dates to calibrate internal nodes of the viral tree. The L. rosalia SFV sequence obtained in this work has an origin calculated of 79.6 thousands of years ago (Tya), indicating a recent circulation among L. rosalia. The SFVlro shares recents ancestors with Sapajus SFV (673.7 Tya) and L. chrysomelas SFV 1 (1.09 Mya), belonging to an older monophyletic lineage of Cebidae SFV (3.61 Mya). A similar pattern is found for the L. chrysomelas SFV 2, who shares an ancestor with Sapajus nigritus SFV (2.36 Mya) and is a sister clade to a lineage of Callithrix SFV (2.88 Mya), outgrouped by a Sapajus xanthosternos SFV clade (3.49 Mya). Interestingly, a pattern of host switching between Callitrichidae and Cebidae is observed, as the monophyletic lineage of all Callitrichidae SFV and Cebidae SFV (4.032 Mya) is not exclusive to either host family.
4. Discussion
Despite APs being a highly diverse group with a wide geographic distribution in South and Central Americas [51], data about the prevalence of viral agents, including SFV, remain scarce, especially in free-living populations. SFV are widely disseminated retroviral agents that coevolve with their primate hosts [7] and their diagnosis and monitoring can serve as a biomarker of zoonotic transmission of the virus between different callitrichid species. This is the first study to show the prevalence of SFV in free-living populations of L. chrysomelas and L. rosalia. The SFV prevalence in both species are in agreement with those reported in previous studies, between 20 and 50% in free-living AP [8,11,31]. We did observe a significant difference in the SFV proviral load (p = 0.005) between L. chrysomelas (average SFV proviral load of 3.03 log per 106 cells) and L. rosalia (3.27 log). Host immunogenetic diversity can act as a factor that impacts the viral burden in different individuals, with some managing to maintain low levels of proviral DNA and others failing to prevent viral replication and integration [52]. The immune response to SFV is not yet well understood, however it is thought that IFN-γ production can play a role in SFV replication [53]. In this sense, each individual could have different immune responses to SFV infections that lead to different proviral loads. Falcone et al. argue that the distribution of infected cells in the oral mucosa might not be homogeneous [54]. Thus, the mode of oral swabs collection may also impact the results of the proviral load detected in qPCR. In fact, Falcone et al. found, through in situ hybridization, that actively infected cells are distributed in small sparse foci [54].
When comparing the prevalence of SFV infecting free-living L. chrysomelas in this study with that of recently captured L. chrysomelas [11], the prevalence was similar, either in the comparison of individuals with up to six months of captivity (p = 0.72) or those that have been in captivity for more than six months (p = 0.13). In agreement to what has been found previously for OWP and AP, we did not find any significant difference between the SFV prevalence in males and females of both species, showing that sex is not a factor that impacts SFV transmission [11,31,55].
Hood et al. [52] showed that the SFV prevalence in animals tends to grow with advancing age in Macaca fascicularis. As SFV promotes a chronic infection, implying that there is greater exposure to SFV as age advances [20,56], we sought to compare the SFV prevalence in juveniles, subadults and adults. The prevalence in juveniles was 29%, 22% in subadults and 42% in adults, and therefore there were no significant differences in SFV prevalence between the age groups.
In general, there was a high variability in SFV prevalence among the collection points sampled at AMLD (0 - 100%). The L. rosalia population is distributed in 13 forest fragments, in an area of approximately 4,500 km2 of lowland Atlantic coastal rainforest. Each fragment has limited or no forest connection with other fragments. These fragments are called management units (MUs). In 2019, AMLD had detected 24 social groups [57]. The main factor responsible for habitat fragmentation is the presence of physical structures, such as roads, cars or traffic. This factor is known as the “barrier effect” and can cause restrictions on individual movement, ultimately resulting in losses in population size and persistence [58]. The dispersion of L. rosalia occurs more frequently from small and nearby fragments than from large, isolated forests. That being so, a fragmented landscape may lead to low dispersal rates [59]. The population dynamics and viability is highly affected by dispersion [60]. As some fragments inhabited by L. rosalia are closer to roads than others, that may have impacted the number of collections [58].
We attempted to correlate the geospatial arrangement of L. rosalia with SFV prevalence, assuming that nearby groups would have similar prevalence, but due to the small sample size of each group, a robust statistical analysis was not possible to be conducted. With the provided data, we also observed the prevalence in each group within each of the AMLD animal collection points. Some points were better represented than others, as was the case at the Afetiva collection point (Table 3). On the other hand, at other collection points, sampling probably did not represent the local population, such as at Sítio Quelinho and Andorinha points, with samples from a single group of two and four animals, respectively.
For phylogenetic analysis, a conventional PCR of the pol region was carried out and 8% (4 out of 45) of the positive samples for SFV were amplified. SUch limited PCR amplification success may be indicative of a great genetic variability of SFV strains circulating among this group of animals. The pol PCR was developed with the few available sequences of SFV infecting the primate families Cebidae and Callitrichidae, which included SFV from Sapajus, Callithrix, and Leontopithecus [11]. In this sense, the primers used may not comprise the diversity of SFV present in these families of primates, being a major limitation for the study of molecular characterization by conventional methods. As new strains of SFV are sequenced, especially through massive sequencing techniques, an improvement in molecular techniques for detecting this virus is warranted.
The only SFV sequence of L. rosalia obtained formed a monophyletic clade with a previous SFVlro sequence from a captive L. rosalia specimen from the Rio de Janeiro Primate Center obtained in the study by Muniz and collaborators [20]. However, there was no grouping with any clade of the SFVlchrysom lineages, which would be expected by the co-divergence hypothesis. The identification of two circulating strains in L. chrysomelas was observed in [11], in which viral strains SFVlcm-1 and SFVlcm-2 were identified. In agreement with what was found in Muniz et al. [8], we also observe two circulating SFV strains in the Sapajus genus. One hypothesis is that the co-speciation process between SFV and AP might still be in progress. On the other hand, the SFVs infecting the Leontopithecus genus do not group in the same clade, and one alternative explanation would be that ongoing zoonotic transmission events occurred that resulted in multiple SFV strains coevolving with their primate hosts in Leontopithecus. That could explain the fact that we observe monophyletic clades of SFV within the primates families Cebidae and Callitrichidae, but the SFV infecting the same families do not cluster together.
The same phenomenon may take place in L. rosalia, and it is possible that we have sequenced only one of the SFV strains infecting that species. A more recent cross species SFV transmission event from Sapajus to L. rosalia may not be discarded, but only could have occurred in captivity, since the Sapajus apella is not autochthonous of the state of Rio de Janeiro [61]. This could explain the grouping between the sequences of SFVlro and SFV from S. apella seen herein, since some L. rosalia specimens have been reintroduced into the wild or are descendants of reintroduced animals. Thus, the animals may have had direct or indirect contact with Sapajus during their time in captivity, although it is not common for animals of different species to be housed in the same enclosure. Those hypotheses could be better investigated through the use of molecular dating techniques. However, since the sequence generated is short (213 bp) compared to the pol gene (approximately 3,440 bp), testing such hypotheses is not currently permitted. The same event of SFVlro clustering with SFVsxa was observed in captive L. rosalia in [20], and the hypothesis of two independent cross-species SFV transmission events is debated, with a possible ancient host-switching. The sequencing of larger regions of pol and/or other viral genes from the wide range of SFVs infecting AP will allow more robust phylogenetic analyses, bringing a better resolution and understanding onto the evolution of SFV in AP.
The SFV infecting Pitheciidae form a monophyletic clade with the previous Cebidae family classification [8] and, with the recently division in the Cebidae family in Cebidae, Callitrichidae and Aotidae, multiple strains are noted infecting the three families, similar to what occurs with papillomavirus [62]. Although the SFV infecting the Pitheciidae family do not form a monophyletic clade in our analysis, they grouped together in other studies by our group [8,20]. The SFV of the Atelidae family is the only one within the AP to exhibit a unique clade. We observe monophyletic clades with multiple SFV strains, except for Sapajus xanthosternos. Several strains do not form single monophyletic clades, but rather multiple strains circulating between Sapajus and Leontopithecus in a virus complex for which we do not have representative viruses sequenced. Besides the short fragment used for phylogenetic and timescale analysis, the dating matches the dates of separation of the of the Old World primates and New World primates, with the split between catarrhines and platyrrhines occurring between 41.1 and 36.7 My [21], with the crown Platyrrhini diverging in 26.5-22.7 Mya [21]. The most recent common ancestor (MRCA) of Pitheciidae diversified approximately in 18.08 Mya [63], the MRCA of Atelidae radiated at 15.29 My [63] and the MRCA of Cebidae diverged in 20.86 My. The diversification between Leontopithecus–Callimico and Callithrix is estimated to have occurred at 10–11 Mya [64].
5. Conclusions
In conclusion, we describe for the first time the prevalence of SFV in free-living populations of L. rosalia and L. chrysomelas. We did not observe any significant difference in SFV prevalence according to infected species or associated with sex. We also did not observe any significant difference in SFV proviral loads associated with the sex or age of the animals. However, the SFV proviral load was higher in L. rosalia than in L. chrysomelas. It was not possible to establish relationships between the geographic distribution of animals at AMLD and SFV prevalence. We identified that the SFV strain circulating in L. rosalia does not cluster with any of the SFV strains circulating in L. chrysomelas but rather with SFVs that infect the Sapajus genus, which may be the result of one or more zoonotic transmission events, and further molecular and phylogenetic analyses are necessary to elucidate this issue. With the split of the Cebidae family into three families, the evolutionary history of SFV proved to be more complex in four of five AP families. The molecular dating of SFV infecting AP was also determined herein.
Supplementary Materials
The following supporting information can be downloaded at the website of this paper posted on Preprints.org, Table S1: Geographic Coordinates of Leontopithecus rosalia, Table S2: Alignment dataset, Table S3: Anotation Dataset, Sanger sequencing output, qPCR output and report.
Author Contributions
Conceptualization, A.F.A.S., M.D., M.A.S.; methodology, D.L.G., T.S.M., M.A.C.C., C.F.A.S., T.M.F., M.D.H., B.C.A., F.L.S., S.S.F., S.B.M., A.P., C. R.R.; validation, C.F.A.S., T.M.F., M.D.H., B.C.A., F.L.S., S.S.F., S.B.M., A.P., C.R.R.; formal analysis, D.L.G., T.S.M., M.A.C.C., A.F.A.S., M.D.; investigation, D.L.G., T.S.M., M.A.C.C.; resources, A.F.A.S., M.D., M.A.S; data curation, D.L.G., T.S.M., M.A.C.C., T.M.F., M.D.H., B.C.A., F.L.S., S.S.F., S.B.M., A.P., C. R.R.; writing—original draft preparation, D.L.G., T.S.M., A.F.A.S., M.D.; writing—review and editing, D.L.G., T.S.M., T.M.F., A.P., C. R.R., M.A.S., M.D., A.F.A.S.; supervision, M.D., A.F.A.S.; project administration, M.D., A.F.A.S.; funding acquisition, A.F.A.S... All authors have read and agreed to the published version of the manuscript.
Funding
This study was supported by the Rio de Janeiro State Science Foundation (FAPERJ) grants E-26/211.355/221 and E-26/201.193/2022 to A.F.A.S. and by the National Research Council (CNPq) grant 309850/2020-7 to M.A.S.
Institutional Review Board Statement
The animal study protocol was approved by the Ethics Committee on the Use of Animals (CEUA) of UFRJ (reference number 037/14). All procedures were conducted in full compliance with Federal permits issued by the Brazilian Ministry of the Environment (SISBIO 75941-4) and samples were collected following the national guidelines and provisions of IBAMA (Instituto Brasileiro do Meio Ambiente e dos Recursos Naturais Renováveis, Brazil; permanent license number 11375–1).
Data Availability Statement
The sequence generated in the present work was submitted to Genbank under the accession number PP960560.
Acknowledgments
We thank the field team of the Associação do Mico-Leão-Dourado (AMLD) and Centro de Primatologia do Rio de Janeiro (CPRJ) for providing samples and demographic data.
Conflicts of Interest
The authors declare no conflicts of interest.
References
- Kehl, T.; Tan, J.; Materniak, M. Non-Simian Foamy Viruses: Molecular Virology, Tropism and Prevalence and Zoonotic/interspecies Transmission. Viruses 2013, 5, 2169–2209. [Google Scholar] [CrossRef] [PubMed]
- Khan, A.S.; Bodem, J.; Buseyne, F.; Gessain, A.; Johnson, W.; Kuhn, J.H.; Kuzmak, J.; Lindemann, D.; Linial, M.L.; Löchelt, M.; et al. Spumaretroviruses: Updated Taxonomy and Nomenclature. Virology 2018, 516, 158–164. [Google Scholar] [CrossRef]
- Enders, J.F.; Peebles, T.C. Propagation in Tissue Cultures of Cytopathogenic Agents from Patients with Measles. Proc. Soc. Exp. Biol. Med. 1954, 86, 277–286. [Google Scholar] [CrossRef] [PubMed]
- Rustigian, R.; Johnston, P.; Reihart, H. Infection of Monkey Kidney Tissue Cultures with Virus-like Agents. Proc. Soc. Exp. Biol. Med. 1955, 88, 8–16. [Google Scholar] [CrossRef]
- Hashimoto-Gotoh, A.; Yoshikawa, R.; Nakagawa, S.; Okamoto, M.; Miyazawa, T. Phylogenetic Analyses Reveal That Simian Foamy Virus Isolated from Japanese Yakushima Macaques (Macaca Fuscata Yakui) Is Distinct from Most of Japanese Hondo Macaques (Macaca Fuscata Fuscata). Gene 2020, 734. [Google Scholar] [CrossRef]
- Shankar, A.; Sibley, S.D.; Goldberg, T.L.; Switzer, W.M. Molecular Analysis of the Complete Genome of a Simian Foamy Virus Infecting Hylobates Pileatus (Pileated Gibbon) Reveals Ancient Co-Evolution with Lesser Apes. Viruses 2019, 11. [Google Scholar] [CrossRef] [PubMed]
- Switzer, W.M.; Salemi, M.; Shanmugam, V.; Gao, F.; Cong, M.E.; Kuiken, C.; Bhullar, V.; Beer, B.E.; Vallet, D.; Gautier-Hion, A.; et al. Ancient Co-Speciation of Simian Foamy Viruses and Primates. Nature 2005, 434, 376–380. [Google Scholar] [CrossRef]
- Muniz, C.P.; Troncoso, L.L.; Moreira, M.A.; Soares, E.A.; Pissinatti, A.; Bonvicino, C.R.; Seuánez, H.N.; Sharma, B.; Jia, H.; Shankar, A.; et al. Identification and Characterization of Highly Divergent Simian Foamy Viruses in a Wide Range of New World Primates from Brazil. PLoS One 2013, 8, e67568. [Google Scholar] [CrossRef]
- Ghersi, B.M.; Jia, H.; Aiewsakun, P.; Katzourakis, A.; Mendoza, P.; Bausch, D.G.; Kasper, M.R.; Montgomery, J.M.; Switzer, W.M. Wide Distribution and Ancient Evolutionary History of Simian Foamy Viruses in New World Primates. Retrovirology 2015, 12. [Google Scholar] [CrossRef]
- Santos, A.F.; Cavalcante, L.T.F.; Muniz, C.P.; Switzer, W.M.; Soares, M.A. Simian Foamy Viruses in Central and South America: A New World of Discovery. Viruses 2019, 11. [Google Scholar] [CrossRef]
- Miranda, T.S.; Muniz, C.P.; Moreira, S.B.; Bueno, M.G.; Kierulff, M.C.M.; Molina, C.V.; Catão-Dias, J.L.; Pissinatti, A.; Soares, M.A.; Santos, A.F. Eco-Epidemiological Profile and Molecular Characterization of Simian Foamy Virus in a Recently-Captured Invasive Population of Leontopithecus Chrysomelas (golden-Headed Lion Tamarin) in Rio de Janeiro, Brazil. Viruses 2019, 11. [Google Scholar] [CrossRef]
- Hooks, J.J.; Gibbs, C.J., Jr; Chou, S.; Howk, R.; Lewis, M.; Gajdusek, D.C. Isolation of a New Simian Foamy Virus from a Spider Monkey Brain Culture. Infect. Immun. 1973, 8, 804–813. [Google Scholar] [CrossRef] [PubMed]
- Troncoso, L.L.; Muniz, C.P.; Siqueira, J.D.; Curty, G.; Schrago, C.G.; Augusto, A.; Fedullo, L.; Soares, M.A.; Santos, A.F. Characterization and Comparative Analysis of a Simian Foamy Virus Complete Genome Isolated from Brazilian Capuchin Monkeys. Virus Res. 2015, 208, 1–6. [Google Scholar] [CrossRef] [PubMed]
- Muniz, C.P.; Cavalcante, L.T.F.; Dudley, D.M.; Pissinatti, A.; O’Connor, D.H.; Santos, A.F.; Soares, M.A. First Complete Genome Sequence of a Simian Foamy Virus Infecting the Neotropical Primate Brachyteles Arachnoides. Microbiol Resour Announc 2018, 7. [Google Scholar] [CrossRef]
- Thümer, L.; Rethwilm, A.; Holmes, E.C.; Bodem, J. The Complete Nucleotide Sequence of a New World Simian Foamy Virus. Virology 2007, 369, 191–197. [Google Scholar] [CrossRef] [PubMed]
- Schrago, C.G.; Menezes, A.N.; Furtado, C.; Bonvicino, C.R.; Seuanez, H.N. Multispecies Coalescent Analysis of the Early Diversification of Neotropical Primates: Phylogenetic Inference under Strong Gene Trees/species Tree Conflict. Genome Biol. Evol. 2014, 6, 3105–3114. [Google Scholar] [CrossRef]
- Primates-SG - Home Available online:. Available online: http://www.primate-sg.org/ (accessed on 12 August 2024).
- Pacheco, B.; Finzi, A.; McGee-Estrada, K.; Sodroski, J. Species-Specific Inhibition of Foamy Viruses from South American Monkeys by New World Monkey TRIM5{alpha} Proteins. J. Virol. 2010, 84, 4095–4099. [Google Scholar] [CrossRef]
- Marczynska, B.; Jones, C.J.; Wolfe, L.G. Syncytium-Forming Virus of Common Marmosets (Callithrix Jacchus Jacchus). Infect. Immun. 1981, 31, 1261–1269. [Google Scholar] [CrossRef]
- Muniz, C.P.; Jia, H.; Shankar, A.; Troncoso, L.L.; Augusto, A.M.; Farias, E.; Pissinatti, A.; Fedullo, L.P.; Santos, A.F.; Soares, M.A.; et al. An Expanded Search for Simian Foamy Viruses (SFV) in Brazilian New World Primates Identifies Novel SFV Lineages and Host Age-Related Infections. Retrovirology 2015, 12, 94. [Google Scholar] [CrossRef]
- Kuderna, L.F.K.; Gao, H.; Janiak, M.C.; Kuhlwilm, M.; Orkin, J.D.; Bataillon, T.; Manu, S.; Valenzuela, A.; Bergman, J.; Rousselle, M.; et al. A Global Catalog of Whole-Genome Diversity from 233 Primate Species. Science 2023, 380, 906–913. [Google Scholar] [CrossRef]
- Katzourakis, A.; Aiewsakun, P.; Jia, H.; Wolfe, N.D.; LeBreton, M.; Yoder, A.D.; Switzer, W.M. Discovery of Prosimian and Afrotherian Foamy Viruses and Potential Cross Species Transmissions amidst Stable and Ancient Mammalian Co-Evolution. Retrovirology 2014, 11, 61. [Google Scholar] [CrossRef] [PubMed]
- Chen, Y.; Zhang, Y.-Y.; Wei, X.; Cui, J. Multiple Infiltration and Cross-Species Transmission of Foamy Viruses across the Paleozoic to the Cenozoic Era. J. Virol. 2021, 95, e0048421. [Google Scholar] [CrossRef] [PubMed]
- Primates-SG - Primate Diversity by Region Available online:. Available online: http://www.primate-sg.org/primate_diversity_by_region/ (accessed on 12 August 2024).
- Meyer, A.L.S.; Pie, M.R.; Passos, F.C. Assessing the Exposure of Lion Tamarins (Leontopithecus Spp.) to Future Climate Change. Am. J. Primatol. 2014, 76, 551–562. [Google Scholar] [CrossRef]
- Kierulff, M.C.M.; Ruiz-Miranda, C.R.; de Oliveira, P.P.; Beck, B.B.; Martins, A.; Dietz, J.M.; Rambaldi, D.M.; Baker, A.J. The Golden Lion Tamarin Leontopithecus Rosalia: A Conservation Success Story. Int. Zoo Yearbook 2012, 46, 36–45. [Google Scholar] [CrossRef]
- Primates-SG - Home Available online:. Available online: http://www.primate-sg.org/ (accessed on 12 August 2024).
- Associação Mico-Leão-Dourado – Conectando Florestas para salvar a espécie Available online:. Available online: https://micoleao.org.br/ (accessed on 12 August 2024).
- Publicações – Associação Mico-Leão-Dourado Available online:. Available online: https://micoleao.org.br/publicacoes-2/ (accessed on 12 August 2024).
- Ruiz-Miranda, C.R.; Affonso, A.G.; Morais, M.M. de; Verona, C.E.; Martins, A.; Beck, B.B. Behavioral and Ecological Interactions between Reintroduced Golden Lion Tamarins (Leontopithecus Rosalia Linnaeus, 1766) and Introduced Marmosets (Callithrix Spp, Linnaeus, 1758) in Brazil’s Atlantic Coast Forest Fragments. Braz. Arch. Biol. Technol. 2006, 49, 99–109. [Google Scholar] [CrossRef]
- Muniz, C.P.; Zheng, H.Q.; Jia, H.; Cavalcante, L.T.F.; Augusto, A.M.; Fedullo, L.P.; Pissinatti, A.; Soares, M.A.; Switzer, W.M.; Santos, A.F. A Non-Invasive Specimen Collection Method and a Novel Simian Foamy Virus (SFV) DNA Quantification Assay in New World Primates Reveal Aspects of Tissue Tropism and Improved SFV Detection. PLoS One 2017, 12. [Google Scholar] [CrossRef]
- Miranda, T.D.S.; Schiffler, F.B.; D’arc, M.; Moreira, F.R.R.; Cosentino, M.A.C.; Coimbra, A.; Mouta, R.; Medeiros, G.; Girardi, D.L.; Wanderkoke, V.; et al. Metagenomic Analysis Reveals Novel Dietary-Related Viruses in the Gut Virome of Marmosets Hybrids (Callithrix Jacchus X Callithrix Penicillata), Brazil. Virus Res. 2023, 325, 199017. [Google Scholar] [CrossRef]
- Ruiz-Miranda, C.R.; Kleiman, D.G.; Dietz, J.M.; Moraes, E.; Grativol, A.D.; Baker, A.J.; Beck, B.B. Food Transfers in Wild and Reintroduced Golden Lion Tamarins, Leontopithecus rosalia. Am. J. Primatol. 1999, 48, 305–320. [Google Scholar] [CrossRef]
- Dietz, J.M.; Baker, A.J.; Miglioretti, D. Seasonal Variation in Reproduction, Juvenile Growth, and Adult Body Mass in Golden Lion Tamarins (Leontopithecus rosalia). Am. J. Primatol. 1994, 34, 115–132. [Google Scholar] [CrossRef]
- Rylands, A.B. Marmosets and Tamarins: Systematics, Behaviour, and Ecology; Oxford University Press, 1993; ISBN 9780198540229.
- Muniz, C.P.; Cavalcante, L.T.F.; Jia, H.; Zheng, H.; Tang, S.; Augusto, A.M.; Pissinatti, A.; Fedullo, L.P.; Santos, A.F.; Soares, M.A.; et al. Zoonotic Infection of Brazilian Primate Workers with New World Simian Foamy Virus. PLoS One 2017, 12, e0184502. [Google Scholar] [CrossRef]
- Tandon, R.; Cattori, V.; Gomes-Keller, M.A.; Meli, M.L.; Golder, M.C.; Lutz, H.; Hofmann-Lehmann, R. Quantitation of Feline Leukaemia Virus Viral and Proviral Loads by TaqMan Real-Time Polymerase Chain Reaction. J. Virol. Methods 2005, 130, 124–132. [Google Scholar] [CrossRef] [PubMed]
- Katoh, K.; Standley, D.M. MAFFT Multiple Sequence Alignment Software Version 7: Improvements in Performance and Usability. Mol. Biol. Evol. 2013, 30, 772–780. [Google Scholar] [CrossRef]
- Capella-Gutiérrez, S.; Silla-Martínez, J.M.; Gabaldón, T. trimAl: A Tool for Automated Alignment Trimming in Large-Scale Phylogenetic Analyses. Bioinformatics 2009, 25, 1972–1973. [Google Scholar] [CrossRef] [PubMed]
- Minh, B.Q.; Schmidt, H.A.; Chernomor, O.; Schrempf, D.; Woodhams, M.D.; Von Haeseler, A.; Iq-Tree, R.L. 2: New Models and Efficient Methods for Phylogenetic Inference in the Genomic Era., 2020, 37. DOI: https://doi. org/10. 1093/molbev/msaa015 2020, 1530–1534. [CrossRef]
- Kalyaanamoorthy, S.; Minh, B.Q.; Wong, T.K.F.; von Haeseler, A.; Jermiin, L.S. ModelFinder: Fast Model Selection for Accurate Phylogenetic Estimates. Nat. Methods 2017, 14, 587–589. [Google Scholar] [CrossRef] [PubMed]
- Guindon, S.; Dufayard, J.-F.; Lefort, V.; Anisimova, M.; Hordijk, W.; Gascuel, O. New Algorithms and Methods to Estimate Maximum-Likelihood Phylogenies: Assessing the Performance of PhyML 3.0. Syst. Biol. 2010, 59, 307–321. [Google Scholar] [CrossRef]
- Minh, B.Q.; Nguyen, M.A.T.; von Haeseler, A. Ultrafast Approximation for Phylogenetic Bootstrap. Mol. Biol. Evol. 2013, 30, 1188–1195. [Google Scholar] [CrossRef]
- Tamura, K.; Battistuzzi, F.U.; Billing-Ross, P.; Murillo, O.; Filipski, A.; Kumar, S. Estimating Divergence Times in Large Molecular Phylogenies. Proc Natl Acad Sci U S A 2012, 109, 19333–19338. [Google Scholar] [CrossRef]
- Tamura, K.; Tao, Q.; Kumar, S. Theoretical Foundation of the RelTime Method for Estimating Divergence Times from Variable Evolutionary Rates. Mol Biol Evol 2018, 35, 1770–1782. [Google Scholar] [CrossRef]
- Mello, B.; Tao, Q.; Tamura, K.; Kumar, S. Fast and Accurate Estimates of Divergence Times from Big Data. Mol Biol Evol 2017, 34, 45–50. [Google Scholar] [CrossRef]
- Yu, G.; Smith, D.K.; Zhu, H.; Guan, Y.; Lam, T.T.-Y. Ggtree: An R Package for Visualization and Annotation of Phylogenetic Trees with Their Covariates and Other Associated Data. Methods Ecol. Evol. 2017, 8, 28–36. [Google Scholar] [CrossRef]
- Ripley, B.D. The R Project in Statistical Computing. MSOR Connect. 2001, 1, 23–25. [Google Scholar] [CrossRef]
- Home - GraphPad Available online:. Available online: https://www.graphpad.com/ (accessed on 12 August 2024).
- Pearson, K. X. On the Criterion That a given System of Deviations from the Probable in the Case of a Correlated System of Variables Is Such That It Can Be Reasonably Supposed to Have Arisen from Random Sampling. The London, Edinburgh, and Dublin Philosophical Magazine and Journal of Science 1900, 50, 157–175. [Google Scholar] [CrossRef]
- Estrada, A.; Garber, P.A.; Rylands, A.B.; Roos, C.; Fernandez-Duque, E.; Di Fiore, A.; Nekaris, K.A.-I.; Nijman, V.; Heymann, E.W.; Lambert, J.E.; et al. Impending Extinction Crisis of the World’s Primates: Why Primates Matter. Sci Adv 2017, 3, e1600946. [Google Scholar] [CrossRef] [PubMed]
- Hood, S.; Mitchell, J.L.; Sethi, M.; Almond, N.M.; Cutler, K.L.; Rose, N.J. Horizontal Acquisition and a Broad Biodistribution Typify Simian Foamy Virus Infection in a Cohort of Macaca Fascicularis. Virol. J. 2013, 10. [Google Scholar] [CrossRef]
- Falcone, V.; Schweizer M; Toniolo, A. ; Neumann-Haefelin, D.; Meyerhans, A. Gamma Interferon Is a Major Suppressive Factor Produced by Activated Human Peripheral Blood Lymphocytes That Is Able to Inhibit Foamy Virus-Induced Cytopathic Effects. Journal of virology 1999, 73. [Google Scholar] [CrossRef]
- Falcone, V.; Leupold, J.; Clotten, J.; Urbanyi, E.; Herchenröder, O.; Spatz, W.; Volk, B.; Böhm, N.; Toniolo, A.; Neumann-Haefelin, D.; et al. Sites of Simian Foamy Virus Persistence in Naturally Infected African Green Monkeys: Latent Provirus Is Ubiquitous, Whereas Viral Replication Is Restricted to the Oral Mucosa. Virology 1999, 257, 7–14. [Google Scholar] [CrossRef]
- Mouinga-Ondémé, A.; Kazanji, M. Simian Foamy Virus in Non-Human Primates and Cross-Species Transmission to Humans in Gabon: An Emerging Zoonotic Disease in Central Africa? Viruses 2013, 5, 1536–1552. [Google Scholar] [CrossRef]
- Blasse, A.; Calvignac-Spencer, S.; Merkel, K.; Goffe, A.S.; Boesch, C.; Mundry, R.; Leendertz, F.H. Mother-Offspring Transmission and Age-Dependent Accumulation of Simian Foamy Virus in Wild Chimpanzees. J. Virol. 2013, 87, 5193–5204. [Google Scholar] [CrossRef]
- Ruiz-Miranda, C.R.; de Morais, M.M., Jr; Dietz, L.A.; Rocha Alexandre, B.; Martins, A.F.; Ferraz, L.P.; Mickelberg, J.; Hankerson, S.J.; Dietz, J.M. Estimating Population Sizes to Evaluate Progress in Conservation of Endangered Golden Lion Tamarins (Leontopithecus rosalia). PLoS One 2019, 14, e0216664. [Google Scholar] [CrossRef]
- Lucas, P. da S.; Alves-Eigenheer, M.; Francisco, T.M.; Dietz, J.M.; Ruiz-Miranda, C.R. Spatial Response to Linear Infrastructures by the Endangered Golden Lion Tamarin. Diversity 2019, 11, 100. [Google Scholar] [CrossRef]
- Romano, V.; Martins, A.F.; Ruiz-Miranda, C.R. Unraveling the Dispersal Patterns and the Social Drivers of Natal Emigration of a Cooperative Breeding Mammal, the Golden Lion Tamarin. Am. J. Primatol. 2019, 81, e22959. [Google Scholar] [CrossRef] [PubMed]
- Moraes, A.M.; Ruiz-Miranda, C.R.; Galetti, P.M., Jr; Niebuhr, B.B.; Alexandre, B.R.; Muylaert, R.L.; Grativol, A.D.; Ribeiro, J.W.; Ferreira, A.N.; Ribeiro, M.C. Landscape Resistance Influences Effective Dispersal of Endangered Golden Lion Tamarins within the Atlantic Forest. Biol. Conserv. 2018, 224, 178–187. [Google Scholar] [CrossRef]
- Sapajus Apella: Boubli, J.P. , Stevenson, P.R., Palacios, E., de La Torre, S., Ravetta, A.L., Messias, M.R., Carvalho, A.S. & Mittermeier, R.A. IUCN Red List Threat Species 2020. [Google Scholar] [CrossRef]
- D’arc, M.; Moreira, F.R.R.; Dias, C.A.; Souza, A.R.; Seuánez, H.N.; Soares, M.A.; Tavares, M.C.H.; Santos, A.F.A. The Characterization of Two Novel Neotropical Primate Papillomaviruses Supports the Ancient within-Species Diversity Model. Virus Evol. 2020, 6, veaa036. [Google Scholar] [CrossRef]
- Jameson Kiesling, N.M.; Yi, S.V.; Xu, K.; Gianluca Sperone, F.; Wildman, D.E. The Tempo and Mode of New World Monkey Evolution and Biogeography in the Context of Phylogenomic Analysis. Mol. Phylogenet. Evol. 2015, 82, 386–399. [Google Scholar] [CrossRef]
- Schneider, H.; Sampaio, I. The Systematics and Evolution of New World Primates - A Review. Mol. Phylogenet. Evol. 2015, 82 Pt B, 348–357. [Google Scholar] [CrossRef]
Figure 1.
Prevalence of SFV infection. 1A. Prevalence according to Leontopithecus species. Of the 102 L. rosalia, 34 (33%) were infected. Of the 48 L. chrysomelas, 11 (23%) were infected. The green bars represent SFV-positive individuals, while blue represents SFV-negative specimens. No significant difference was observed (p = 0.500). 1B. Prevalence according to sex in L. rosalia and in L. chrysomelas. The dark pink bars represent SFV-positive females, while light pink bars represent SFV-negative females. The dark blue bars represent SFV-positive males, while light blue bars represent the SFV-negative males. No significant difference was observed (p = 0.180). 1C. Prevalence according to the age group in L. rosalia. The green bars represent SFV-positive individuals, while blue bars represent SFV-negative individuals. SFV prevalence was split into juveniles (4 to 9 months), subadults (9 to 12 months) and adults (over 12 months). No statistically significant difference was observed between the comparison of the age classes. In all three panels, the number of individuals is found within the bars.
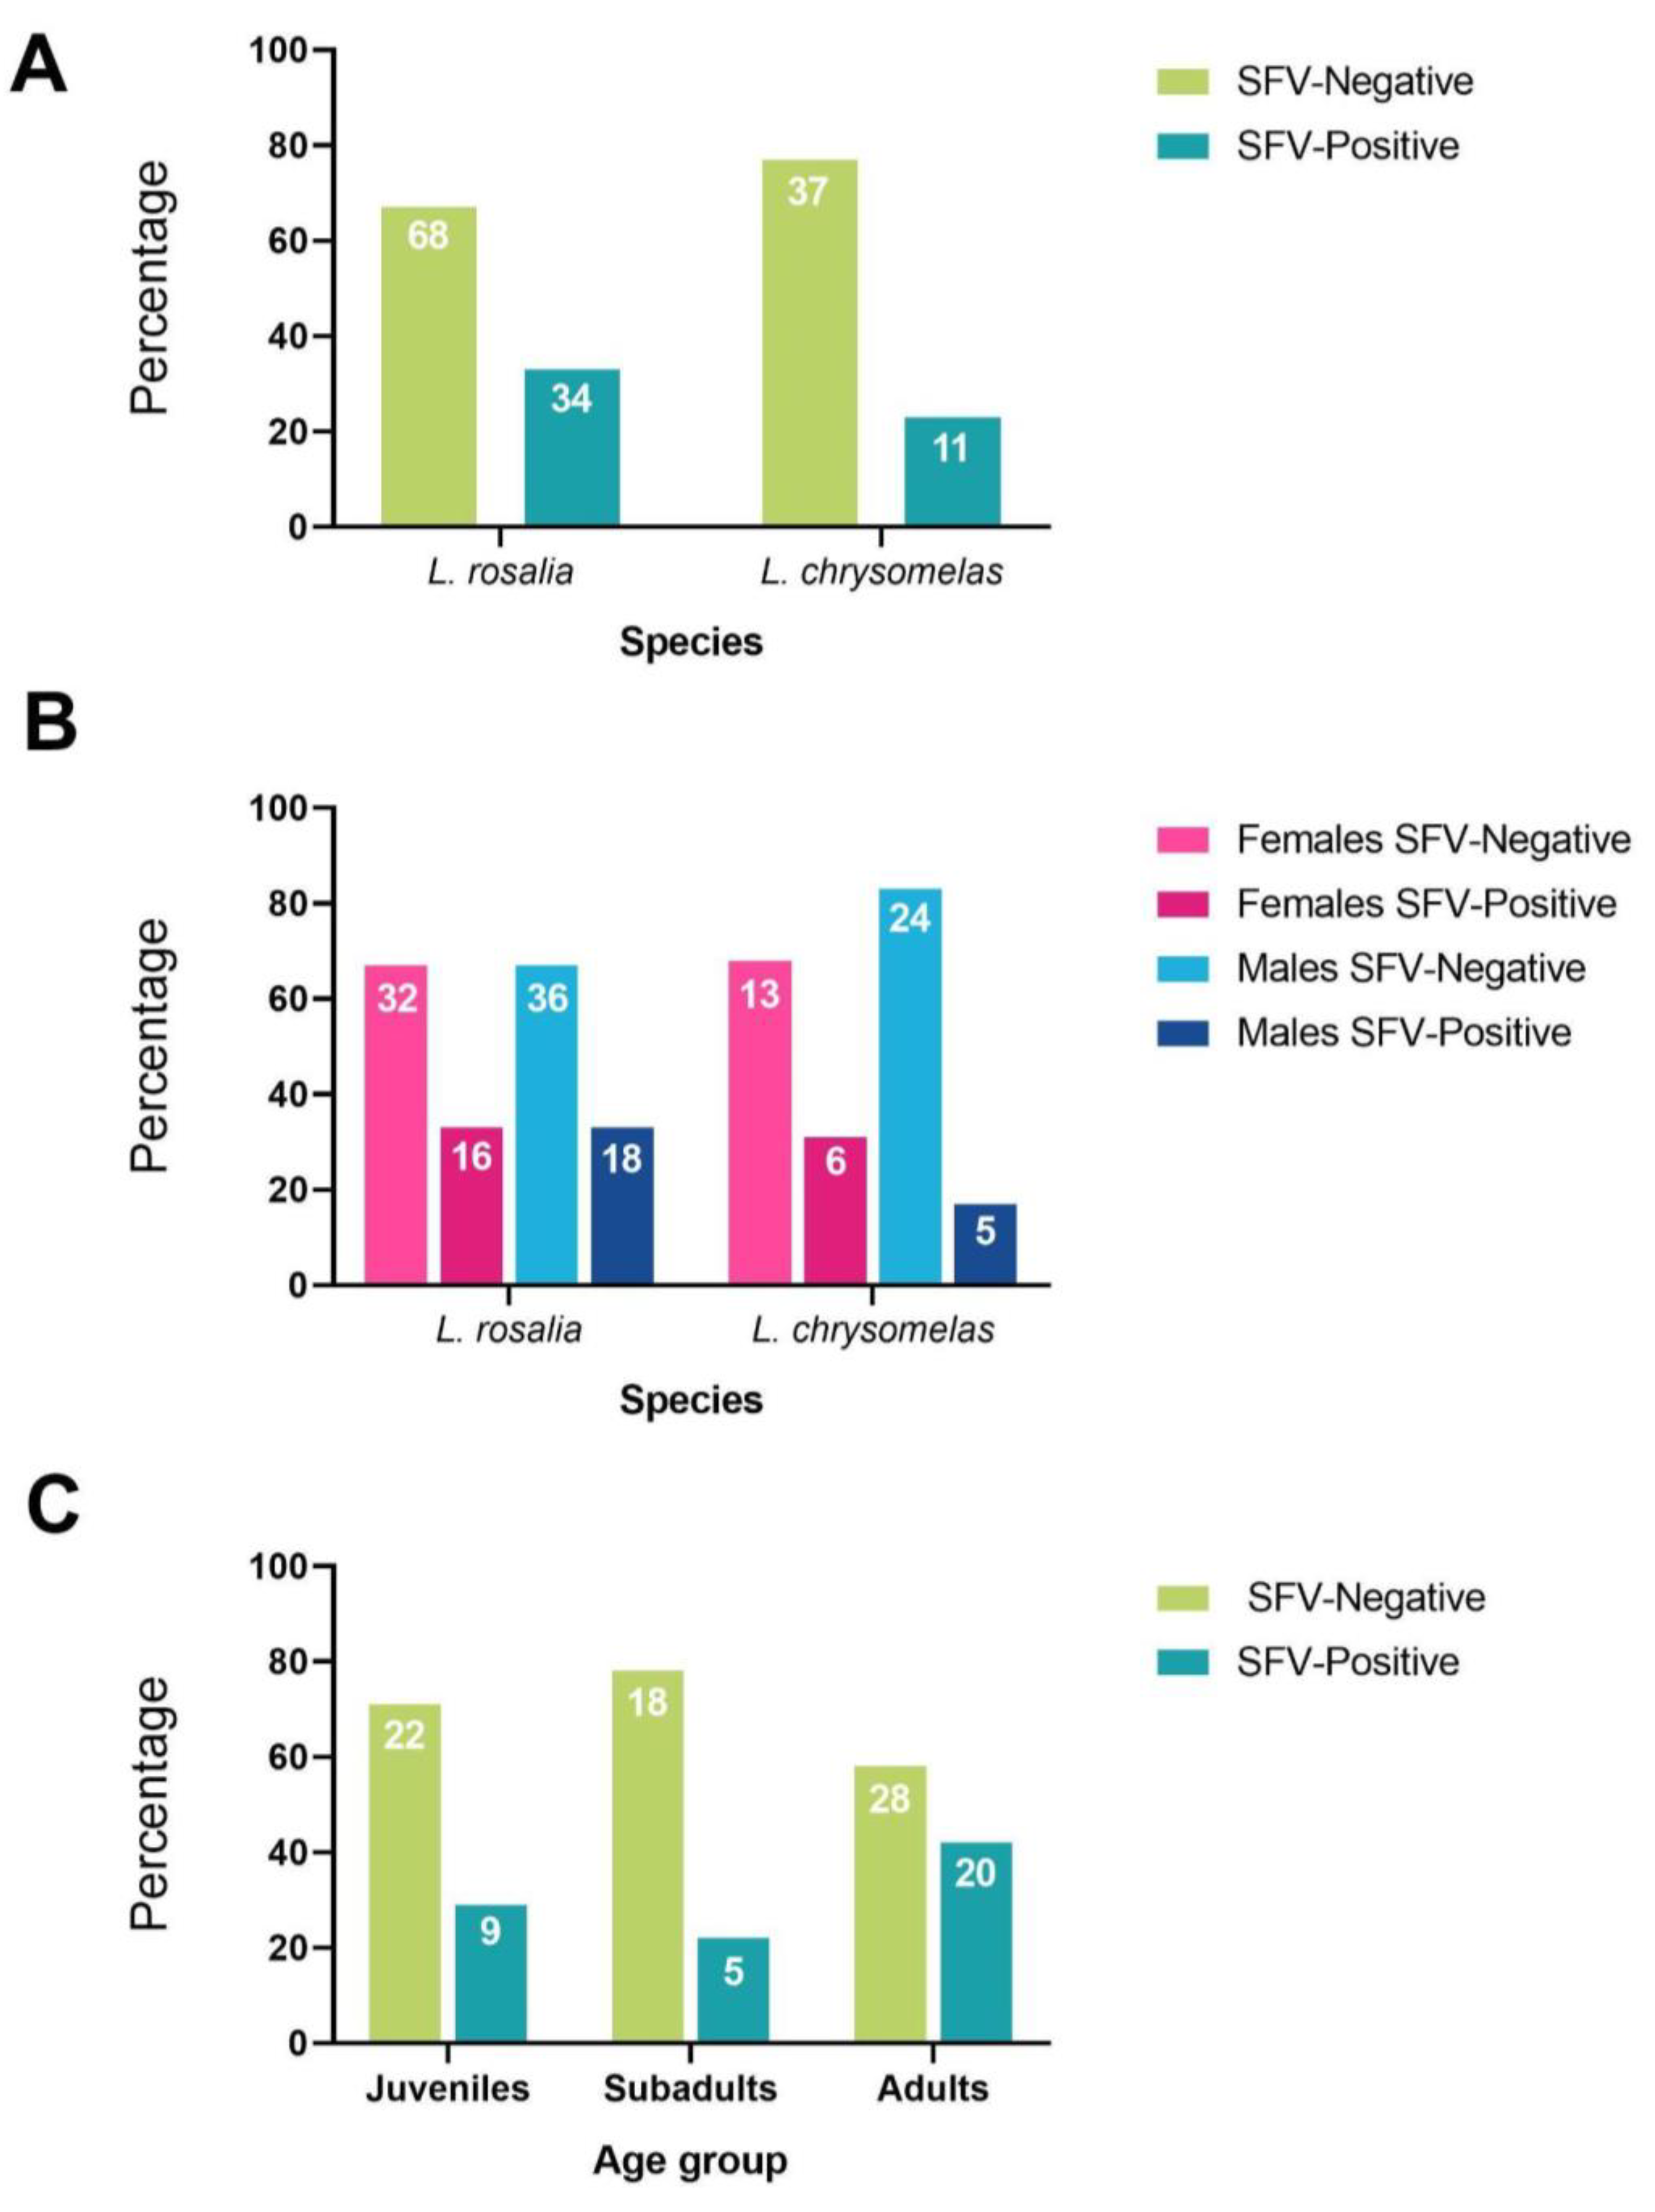
Figure 2.
Geographic distribution of the groups sampled in the AMLD in the state of Rio de Janeiro (RJ), in the municipalities of Silva Jardim and Rio Bonito. In (A) the state of RJ is highlighted on the map of Brazil. In (B), the collection points of AMLD in the state of RJ are highlighted. In (C), we highlight the municipalities where the collections were carried out, with Silva Jardim being the most representative, with 10 collection points, and Rio Bonito with only one. Each color represents a different collection point, as can be seen in the image. SFV prevalence in each of the collection points can be seen in the legend.
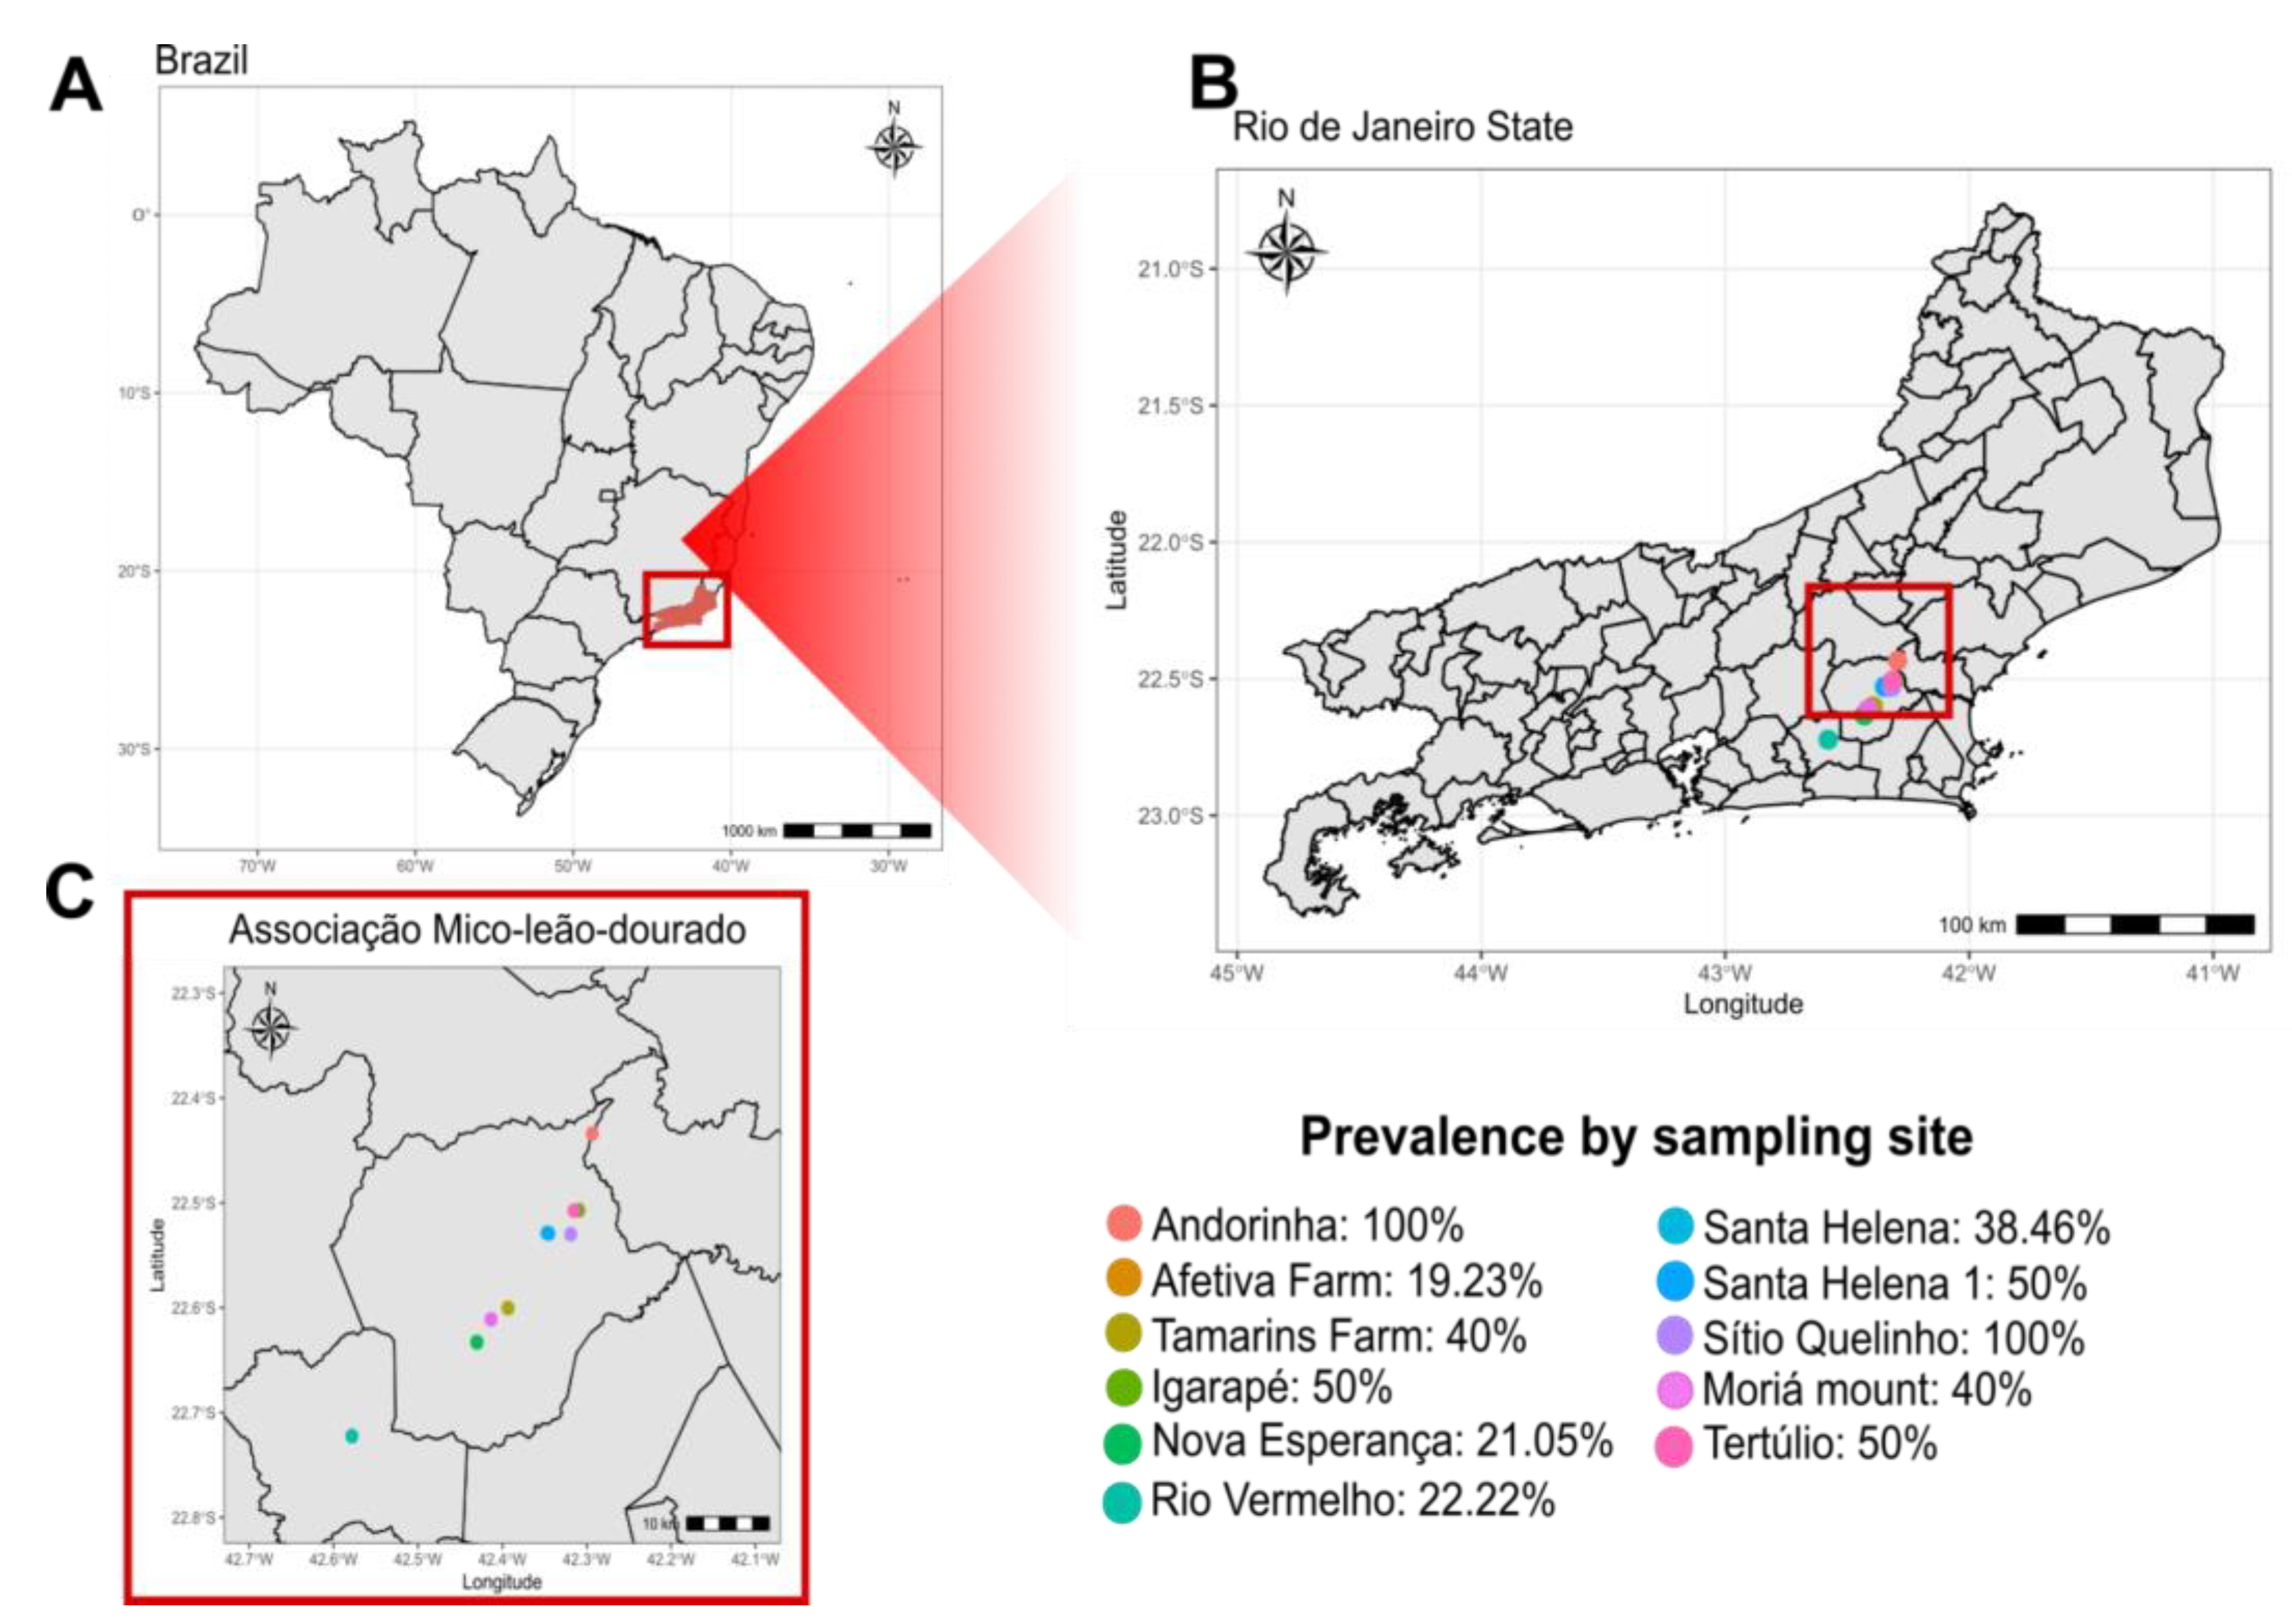
Figure 3.
SFV proviral load among the animals studied. (A) SFV proviral load according to species. L. rosalia is represented in green and L. chrysomelas in blue; p-value = 0.0051. (B) SFV proviral load according to sex. L. rosalia is represented in light green and L. chrysomelas in dark green. No statistically significant difference was observed according to the sex in L. rosalia (p = 0.2266) nor in L. chrysomelas (p = 0.5809). (C) SFV proviral load according to age group in L.rosalia. No significant differences were observed between age groups.
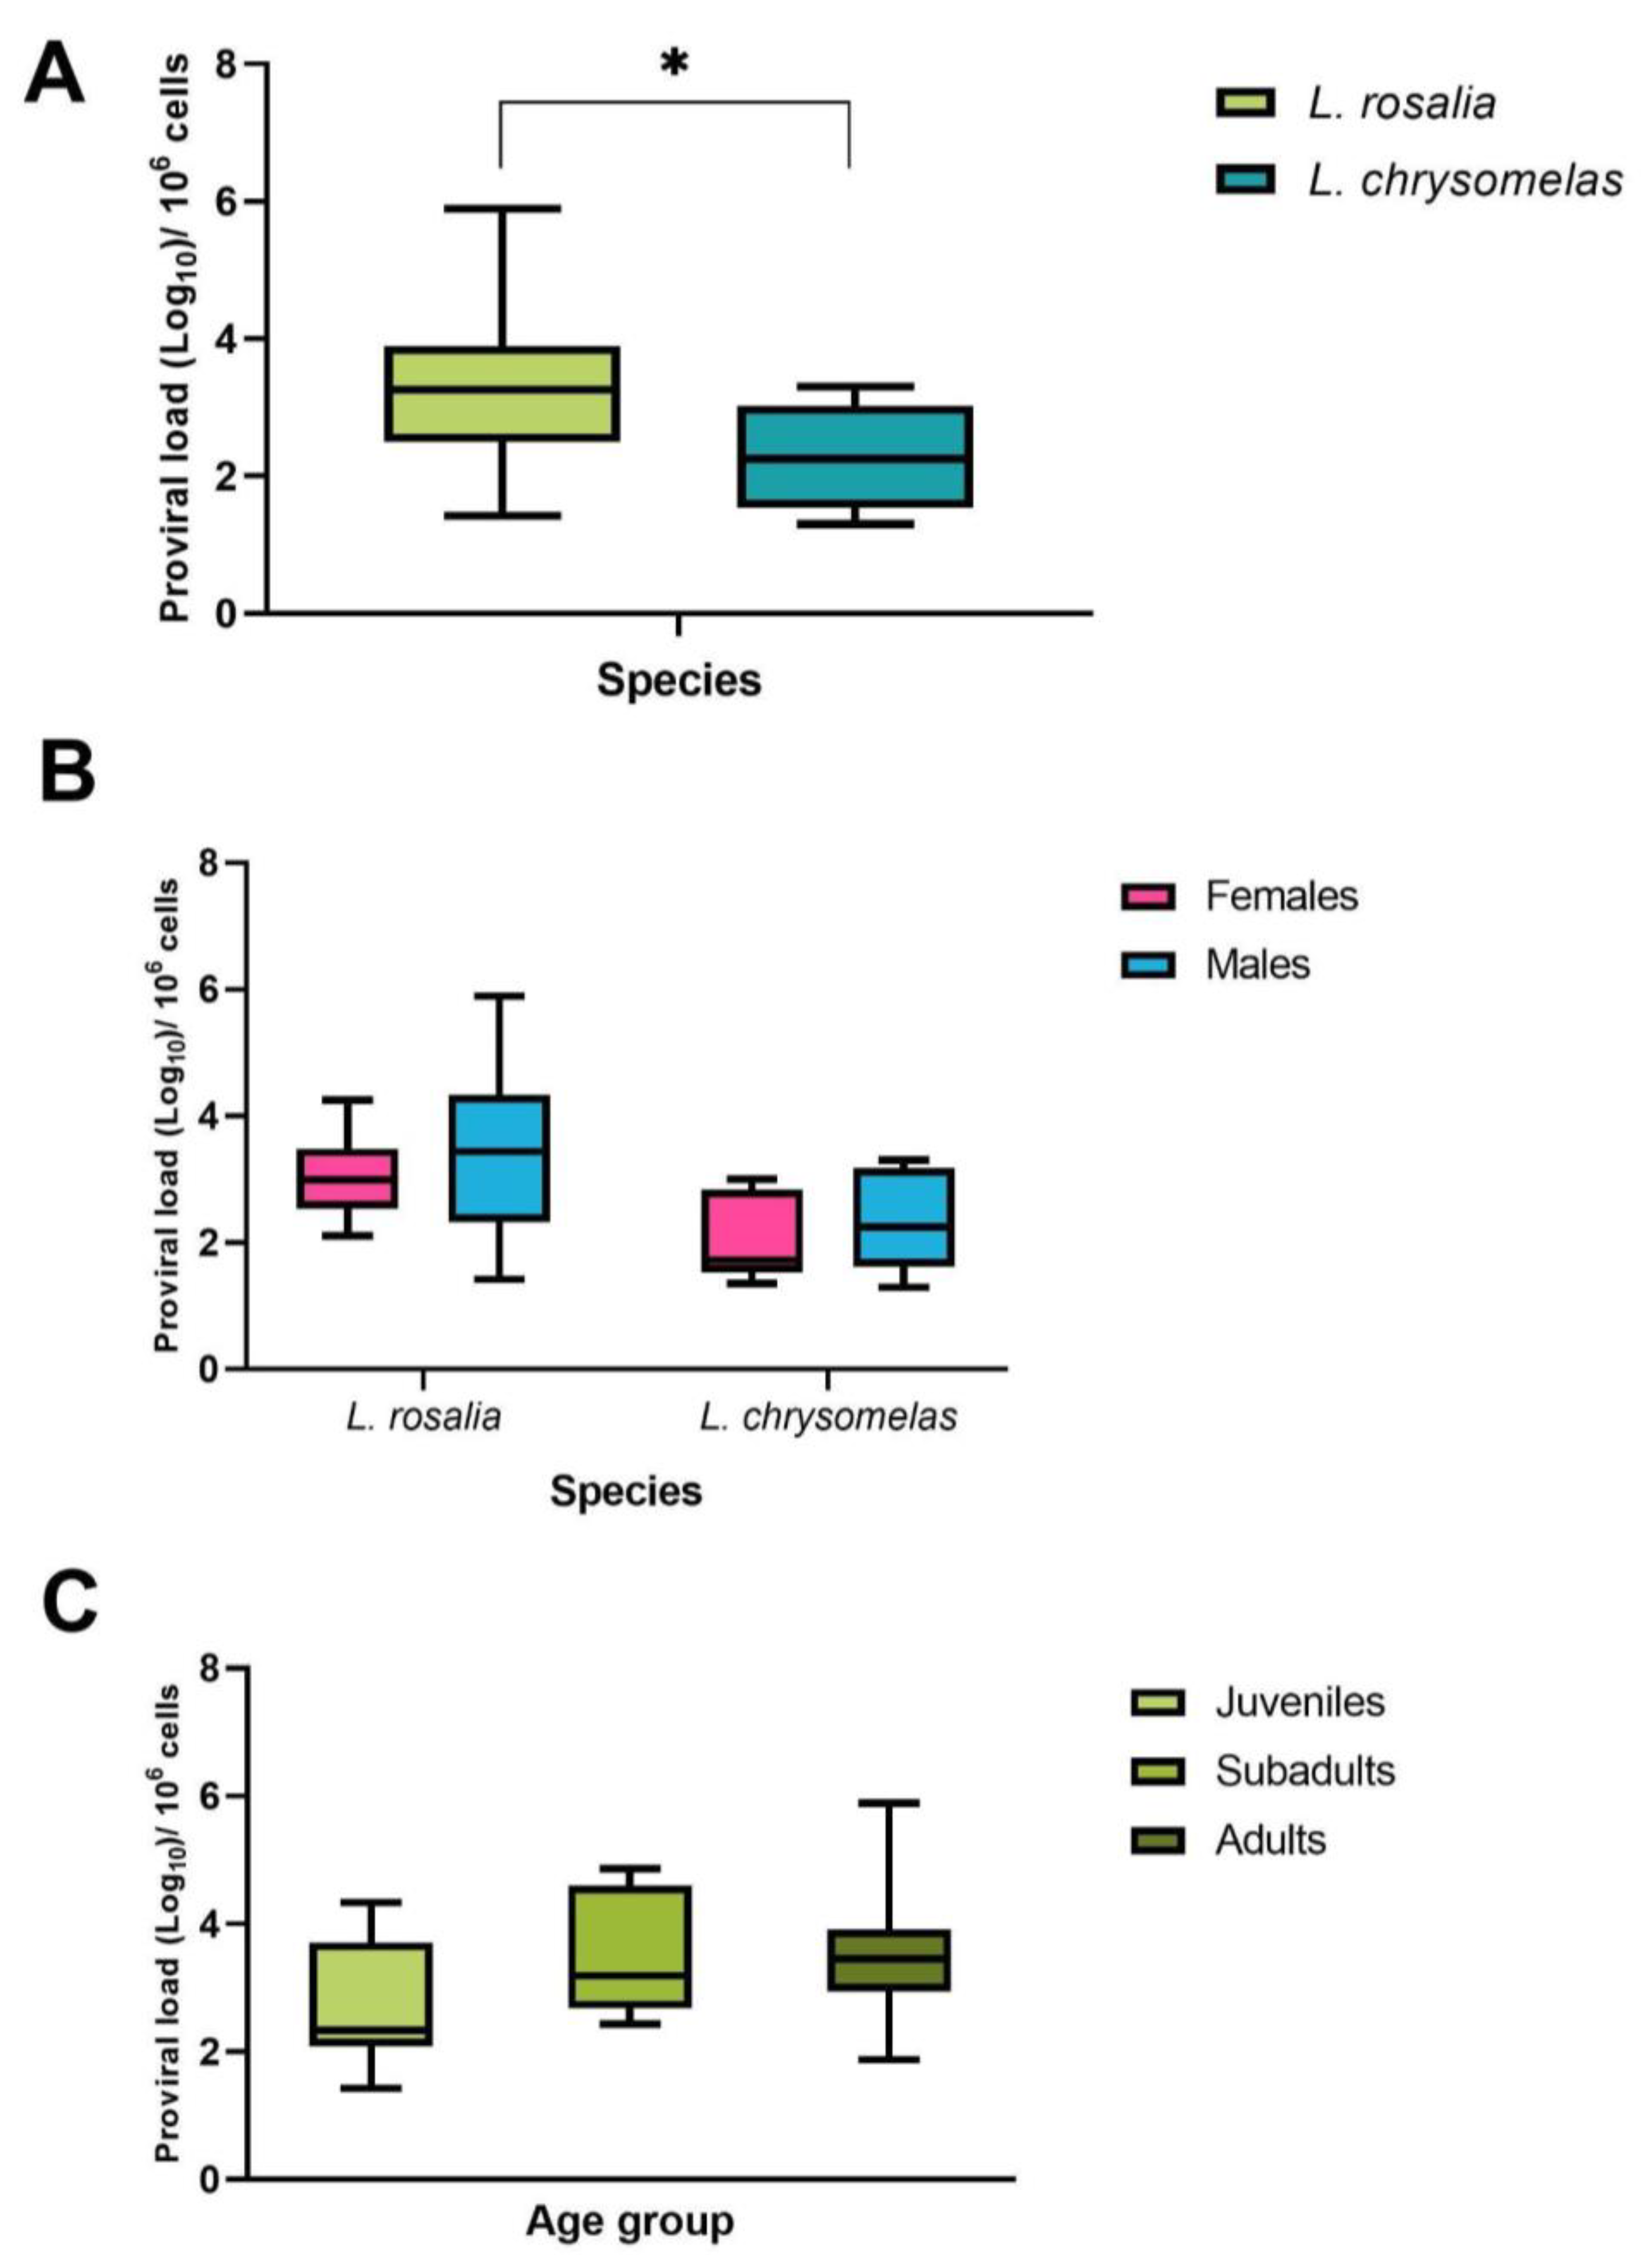
Figure 4.
Phylogenetic tree inferred using maximum likelihood analysis with a fragment of SFV viral polymerase (213-bp). The new sequence generated in the current study is marked with a golden star. The host species within the Callitrichidae and the Cebidae families are listed. The node labels are colored according to the host family used in the dataset. The node labels colored in black represent support for SH-aLRT and bootstrap equal to or greater than 75%. When only SH-aLRT is superior to the cutoff, the label is represented in gray, while only UFBoot node labels are represented by white squares. When both parameters are lower than 75%, no label is depicted. Purple rectangles represent the calibration points used to further explore the timescale of the phylogeny.
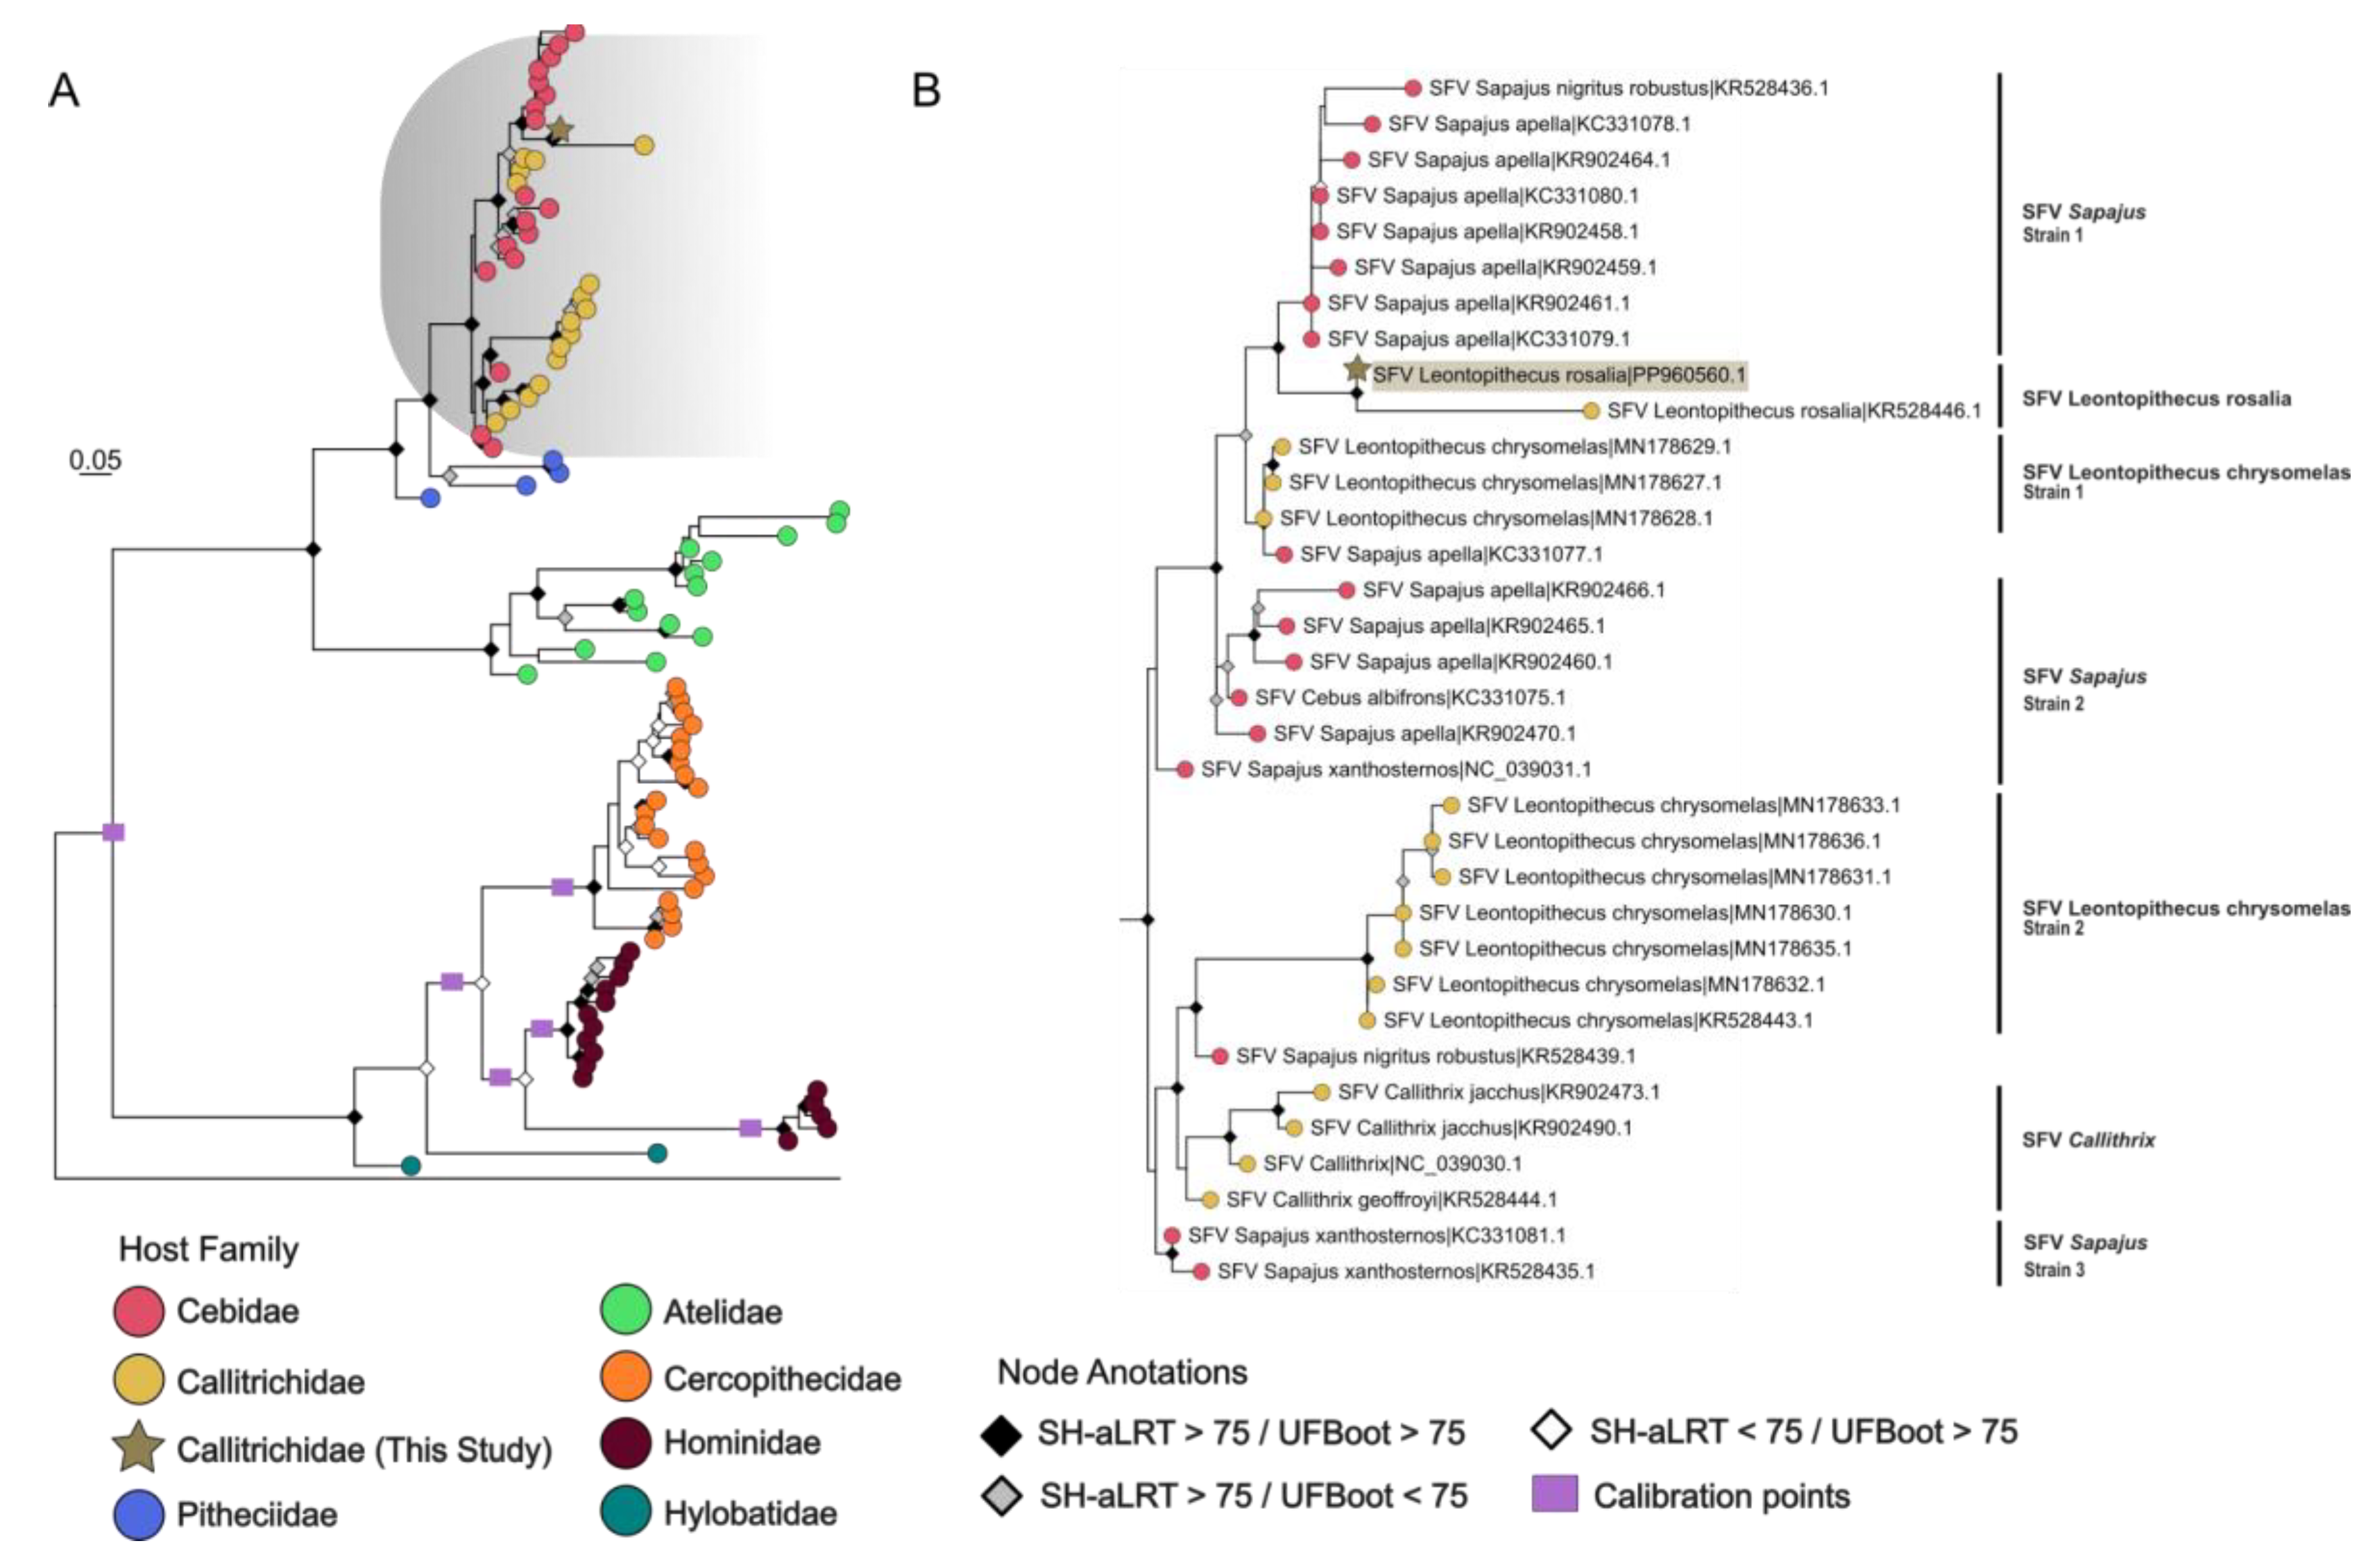
Figure 5.
Timescale phylogenetic tree generated by RelTime-ML. Estimated host divergence dates were used to calibrate internal nodes of the viral tree. The node labels are colored according to the host family used in the dataset. The sequence generated in the current study is marked with a golden star. The x-axis summarizes geological time scale of the timetree: Oligocene (Ol), Miocene (Mio), Plioceno (Pli) and Pleistocene (Ple).
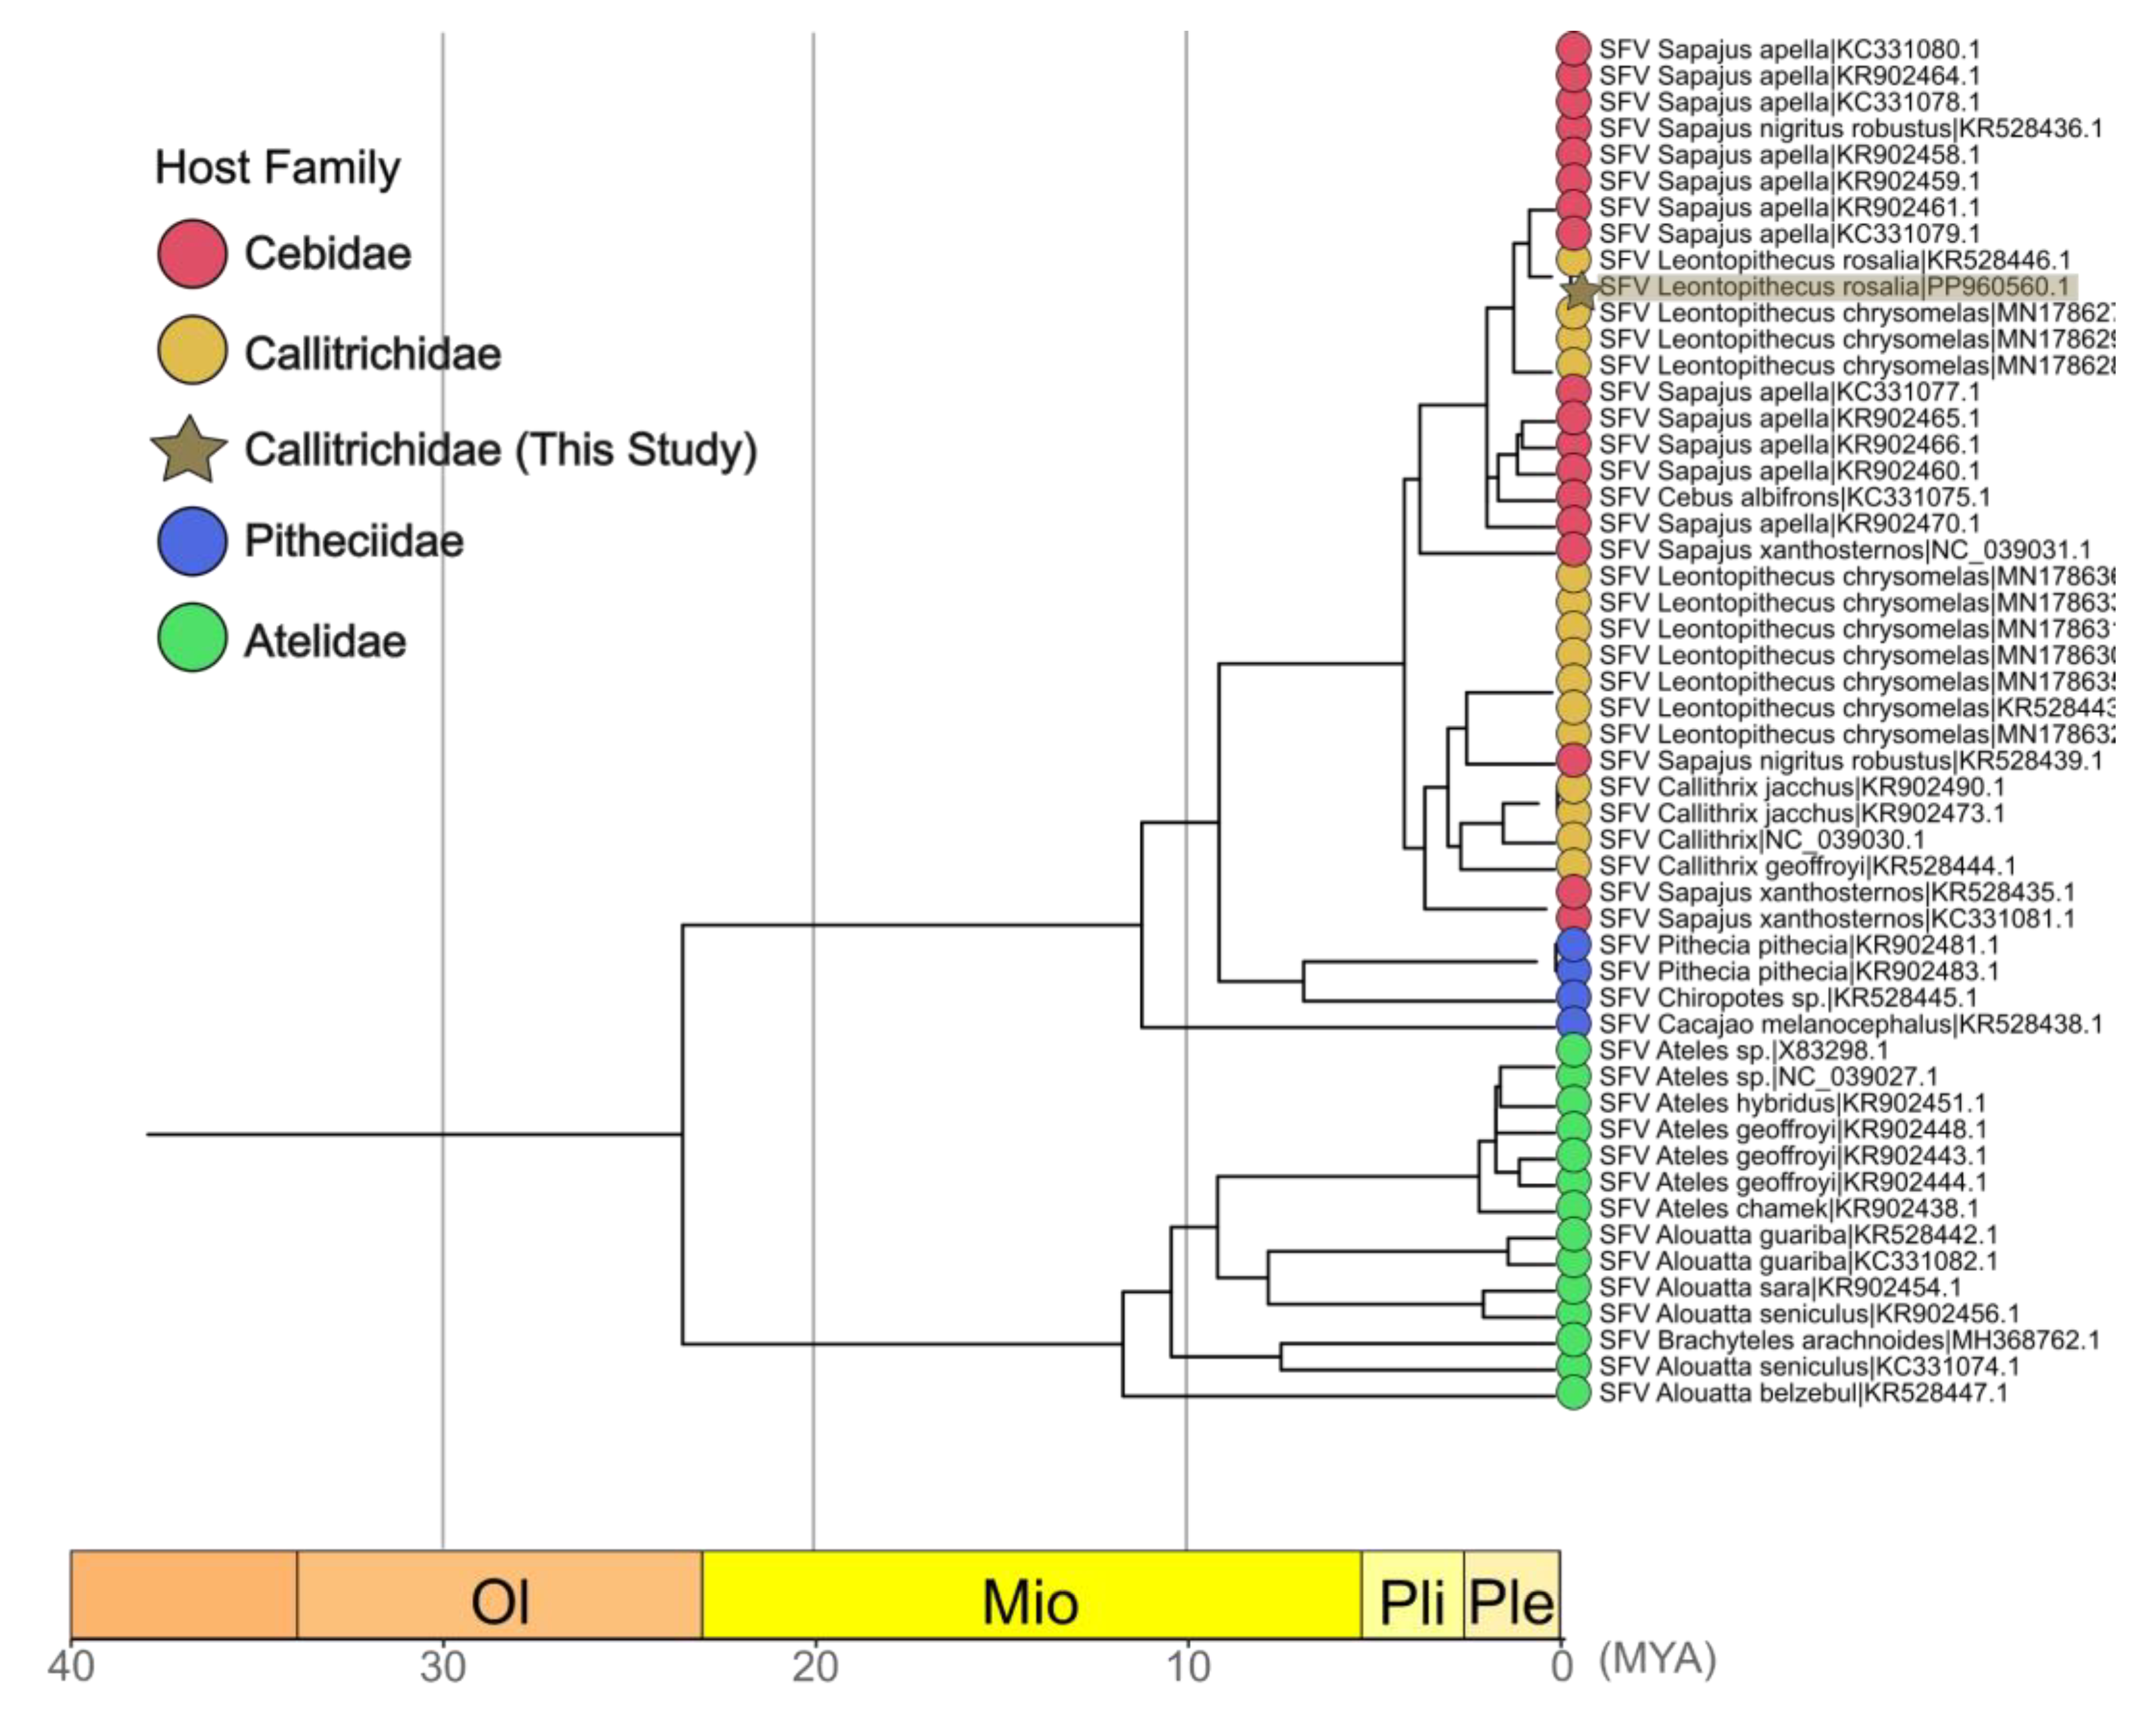

Table 1.
Demographic data of Leontopithecus population.
| Individuals | L. rosalia | L. chrysomelas |
| All individuals | 102 | 48 |
| Males | 54 (53%) | 29 (60%) |
| Females | 48 (7%) | 19 (40%) |
| Adults | 48 (47%) | N/A* |
| Subadults | 23 (23%) | N/A |
| Juveniles | 31 (30%) | N/A |
| Median weight (grams) | 521 (259 - 754) g | N/A |
| Average knee-heel distance | 83 (65 -97) cm | N/A |
| Median collection per site | 5 (2-26) | N/A |
* N/A - not available.
Table 2.
SFV prevalence and proviral load according to age group in Leontopithecus rosalia.
| Collection point | Animals sampled | Juveniles | Subadults | Adults | Prevalence (%) | Average proviral load* |
| Afetiva Farm | 26 | 12 | 9 | 5 | 19 | 03.04 |
| Tamarins Farm | 5 | 0 | 2 | 3 | 40 | 3.81 |
| Igarapé | 12 | 3 | 3 | 6 | 50 | 3.30 |
| Nova esperança | 19 | 4 | 4 | 11 | 21 | 3.14 |
| Rio Vermelho | 9 | 4 | 0 | 5 | 22 | 2.74 |
| Ribeirão | 2 | 0 | 0 | 2 | 0 | N/A |
| Santa Helena | 13 | 1 | 4 | 8 | 35 | 3.73 |
| Santa Helena I | 4 | 1 | 1 | 2 | 50 | 4.56 |
| Sítio Quelinho | 2 | 1 | 0 | 1 | 100 | 3.91 |
| Tertúlio | 2 | 1 | 0 | 1 | 50 | 3.93 |
| Monte Moriá | 5 | 4 | 0 | 1 | 40 | 3.63 |
| Andorinha | 3 | 0 | 0 | 3 | 100 | 4.22 |
*Average proviral load (log10) per 106 cells.
Table 3.
SFV prevalence and proviral load according to location of collection in Leontopithecus rosalia.
Table 3.
SFV prevalence and proviral load according to location of collection in Leontopithecus rosalia.
| Collection point | Group | Animals | Prevalence (%) | #break#Average proviral load* |
| Afetiva | Afetiva 1 | 2 | 50%% | 2.05 |
| Afetiva | Afetiva 2/ AF2 | 12 | 25% | 2.19 |
| Afetiva | Afetiva 3/ AF3 | 2 | 0% | N/A* |
| Afetiva | UR | 4 | 0% | N/A |
| Afetiva | FP | 5 | 20% | 2.33 |
| Afetiva | FP3 | 1 | 0% | N/A |
| Andorinha | CH2 | 3 | 100% | 4.22 |
| Tamarins Farm | Sidney 3 | 1 | 100% | 3.49 |
| Tamarins Farm | TM2 | 4 | 25,00% | 4.12 |
| Igarapé | IG | 8 | 62% | 2.81 |
| Igarapé | ph2 | 4 | 25% | 1.88 |
| Moriá Mount | Ronaldo Machado (RM) | 2 | 40% | 6.63 |
| Nova Esperança | GM2 | 3 | 0% | N/A |
| Nova Esperança | GM3 | 7 | 29% | 3.02 |
| Nova Esperança | GM4 | 2 | 100% | 3.05 |
| Nova Esperança | GM5 | 4 | 0% | N/A |
| Nova Esperança | GM7 | 3 | 0% | N/A |
| Rio vermelho | M6 | 1 | 100% | 2.51 |
| Rio vermelho | Mistura fina | 3 | 0% | N/A |
| Rio vermelho | RV | 4 | 25% | 2.96 |
| Rio vermelho | RT | 1 | 0% | N/A |
| Ribeirão | ZN | 2 | 0% | N/A |
| Santa Helena | FN | 2 | 100% | 2.65 |
| Santa Helena | JA | 5 | 20% | 4.34 |
| Santa Helena | JN | 2 | 100% | 4.30 |
| Santa Helena | JR | 4 | 0% | N/A |
| Santa Helena 1 | SH | 1 | 0% | N/A |
| Santa Helena 1 | SS2 | 3 | 67% | 4.56 |
| Sítio Quelinho | q1 | 2 | 100% | 3.91 |
| Tertulio | JD | 2 | 50% | 3.93 |
*Average proviral load (log10) per 106 cells.
Disclaimer/Publisher’s Note: The statements, opinions and data contained in all publications are solely those of the individual author(s) and contributor(s) and not of MDPI and/or the editor(s). MDPI and/or the editor(s) disclaim responsibility for any injury to people or property resulting from any ideas, methods, instructions or products referred to in the content. |
© 2025 by the authors. Licensee MDPI, Basel, Switzerland. This article is an open access article distributed under the terms and conditions of the Creative Commons Attribution (CC BY) license (http://creativecommons.org/licenses/by/4.0/).
Copyright: This open access article is published under a Creative Commons CC BY 4.0 license, which permit the free download, distribution, and reuse, provided that the author and preprint are cited in any reuse.


