Submitted:
20 March 2025
Posted:
20 March 2025
Read the latest preprint version here
Abstract
Accurate estimating green canopy cover in rubber plantations is crucial for monitoring vegetation health and assessing stress impacts. This study validates satellite-derived canopy cover estimates by integrating UAV-based measurements, ground observations, remote sensing, and machine learning approaches. Sentinel-2 and Landsat imagery were utilized to derive spectral vegetation indices (SVIs) under varying stress condi-tions, while UAV-based canopy cover assessments provided high-resolution reference data for validation. The findings revealed that while certain SVIs exhibited strong cor-relations with canopy density under stable conditions, their predictive accuracy de-clined significantly during extreme stress events, such as Pestalotiopsis outbreaks and seasonal leaf fall periods. To improve estimation accuracy, machine learning models were developed, with Random Forest (RF) outperforming Support Vector Machines (SVM), Classification and Regression Trees (CART), and Linear Regression (LR). RF achieved the highest predictive accuracy (R² = 0.82, RMSE = 6.48, MAE = 4.97), demon-strating its reliability in capturing non-linear interactions between canopy heterogene-ity and environmental stressors. These results highlight the limitations of traditional vegetation indices and emphasize the importance of multi-sensor integration and ad-vanced modeling techniques for more precise canopy monitoring. This study contrib-utes to developing robust remote sensing frameworks for early stress detection and sustainable plantation management in tropical rubber ecosystems.
Keywords:
rubber plantations
; remote sensing
; pestalotiopsis
; canopy dynamics
; machine learning
1. Introduction
Rubber (Hevea brasiliensis) plantations play a vital role in the global rubber industry, particularly in tropical regions such as Indonesia, one of the leading producers. However, rubber production is increasingly threatened by environmental stressors, including Pestalotiopsis leaf fall disease, which has significantly impacted latex yields since 2016 [1] This fungal disease accelerates defoliation, weakens tree vigor, and disrupts the global rubber supply chain. The ability to monitor canopy health is essential for early disease detection and effective plantation management. Canopy cover serves as a key indicator of tree health, as defoliation reduces photosynthetic activity and increases vulnerability to secondary infections [2]. Severe outbreaks can result in tree mortality, necessitating costly replanting and negatively affecting both large-scale plantations and smallholder farmers [3]. Given rubber’s economic significance in tire manufacturing, industrial products, and medical supplies, accurate canopy monitoring is crucial for mitigating economic losses and strengthening disease control strategies.
Remote sensing has become a critical tool for mapping and monitoring tree canopy cover, offering valuable insights for environmental research, forest management, and land-use planning [4,5,6] By leveraging satellite and aerial imagery, such as Landsat, MODIS, WorldView, and LiDAR, remote sensing enables large-scale estimation of canopy attributes, including density, structure, and biomass [6,7,8]. Advanced image processing and machine learning techniques have further improved the accuracy of canopy mapping. Phenology-based approaches utilizing vegetation indices such as NDVI, EVI, and LSWI have demonstrated effectiveness in distinguishing rubber plantations from other vegetation types [9,10,11]. Additionally, object-based classification, combined with phenological data, has enhanced the accuracy of rubber plantation mapping, reducing errors associated with fragmented landscapes [12,13,14].
Machine learning models, including Random Forest (RF) and Support Vector Machines (SVM), have significantly improved the precision of canopy mapping and disease detection in rubber plantations. RF models trained with multi-temporal and multi-source remote sensing data have been successfully applied to estimate canopy cover and aboveground biomass, demonstrating their utility for monitoring forest and plantation ecosystems [4,13]. Empirical and neural network (NN) models have also been developed for assessing rubber canopies, demonstrating high accuracy in predicting leaf area index (LAI) [15]. While deep learning architectures such as Convolutional Neural Networks (CNNs) and Long Short-Term Memory networks (LSTMs) have been explored for extracting spatial and temporal features from remote sensing datasets, their application in rubber plantation monitoring remains limited due to extensive data requirements and computational constraints [16].
Mapping rubber canopy during disease outbreaks or natural leaf fall season presents significant challenges due to changes in spectral and temporal characteristics. Remote sensing techniques, including Sentinel-2 and PlanetScope imagery, have been instrumental in detecting phenological variations in rubber plantations affected by Pestalotiopsis-induced leaf fall [17,18]. However, previous studies evaluating canopy dynamics under Pestalotiopsis outbreaks, such as those by [17] and [19] primarily relied on single vegetation indices (VIs), which are highly susceptible to background contamination. To overcome these limitations, this study employs Sentinel-2 and Landsat series imagery, integrating multiple VIs with time-series analysis to enhance accuracy. Time-series analysis and machine learning models, such as RF regressors, have been utilized to assess canopy conditions by linking disease severity stages with defoliation cycles and climatic variables [18]. UAV-based multispectral imaging has also emerged as an effective tool for high-resolution disease monitoring, enabling the identification of infected trees through spectral and textural analysis [20,21]. Additionally, spectral vegetation indices derived from UAV-based monitoring have been employed to classify rubber clones and assess their resistance to environmental stressors [22]. However, challenges such as cloud contamination, seasonal spectral variations, disease-induced leaf fall, and natural defoliation cycles persist. Integrating multi-source remote sensing data with advanced classification techniques, such as SVM and feature selection algorithms, improves disease detection accuracy and provides valuable insights for mitigating production losses in rubber plantations [23,24,25,26]
To address these challenges, this study integrates remote sensing, UAV-based canopy validation, and machine learning techniques to analyze the dynamics of rubber tree canopies under Pestalotiopsis outbreaks and climatic stressors. By leveraging multi-scale data and advanced computational methods, the study aims to enhance monitoring accuracy, enable early stress detection, and improve predictive modelling for plantation resilience. A key novelty of this study is the use of time-series ground observations to validate and model canopy dynamics under varying stress conditions, offering deeper insights into seasonal variations, disease progression, and environmental stress responses. Unlike single-time-point assessments, time-series observations capture long-term trends and canopy recovery patterns, improving the reliability and applicability of remote sensing-based models for plantation management. Green canopy cover estimates derived from satellite imagery are cross validated against high-resolution UAV data and ground measurements, ensuring a comprehensive and robust evaluation of canopy conditions.
In addition to RF and SVM, this study applies Classification and Regression Trees (CART) and Linear Regression models to enhance the robustness of canopy cover prediction. While RF and SVM have been widely employed in remote sensing for canopy classification and disease detection, incorporating CART and Linear Regression offers a more holistic assessment of model performance [27,28]. Moreover, the study acknowledges the potential of deep learning architectures, such as CNNs and LSTMs, although their application remains limited due to the need for extensive labeled datasets and high computational power [16]. Additionally, the study acknowledges the increasing importance of remote sensing in enhancing rubber plantation monitoring through improved mapping, change detection, and carbon and biomass assessment [6]. Therefore, this study primarily focuses on traditional machine learning approaches, with future research considering the integration of deep learning techniques for improved canopy monitoring.
By combining remote sensing, machine learning, and UAV-based validation, this research contributes to the advancement of precision agriculture strategies for rubber plantations. The findings will support plantation managers and policymakers in implementing proactive disease control measures, optimizing rubber production, and ensuring sustainable plantation management in the face of climate variability and emerging threats.
Given the complexity of this research, the findings are structured into two complementary studies. This paper focuses on modeling canopy density through remote sensing, UAV-based validation, and machine learning. A second study extends this work by analyzing time-series variations in green canopy cover in relation to climate conditions, disease outbreaks, and tree characteristics, including clone type and age. Together, these studies provide a comprehensive understanding of canopy dynamics in rubber plantations under both environmental and disease-related stressors.
2. Study Area
The study was conducted at the Sembawa Rubber Research Center plantation, located in Banyuasin Regency, South Sumatra Province, Indonesia (Figure 1a–c). The research center, managed under the Indonesian Rubber Research Institute, spans a total area of 3,379 hectares and serves as a key site for rubber cultivation research, breeding programs, and agronomic studies. The plantation is strategically divided into five distinct districts, each designated for specific research and cultivation purposes. This study specifically focused on Block 2010G2 and Block 2011G, both dedicated to rubber cultivation. These blocks were selected due to their differing planting years and clone compositions, allowing for an in-depth comparative analysis of canopy dynamics under varying environmental conditions. Block 2011G, established in 2011, consists of a mixed clone composition of IRR 112, and BPM 24, which are known for their resilience and latex production potential. Meanwhile, Block 2010G2, planted in 2010, features IRR 118, 105, 100, BPM 109, 107, 24, IRR 112, 05, RRIC 100, PR 303, GT 1, PB 260, 330, and 340 clones, each possessing distinct physiological characteristics that influence their growth response to environmental stressors such as seasonal leaf fall and disease outbreaks.
3. Materials and Methods
This section outlines the methodologies employed in this study, as illustrated in Figure 2, to examine the intricate dynamics influencing rubber green canopy cover. By integrating satellite imagery, Unmanned Aerial Vehicle (UAV) imagery, and field measurements. This study utilizes canopy cover data from two plantation blocks, 2010G2 and 2011G, to assess the impact of Pestalotiopsis outbreaks and natural leaf fall events. Outbreak periods were defined as occurring between November and February (from 2018 onward), while seasonal leaf fall was observed between June and August [29]. These defined periods enable a systematic evaluation of canopy dynamics and their correlation with environmental and biological stressors.
3.1. Data Collection
Integrating datasets from various sources, including ground-level observations, UAV imagery, and medium-resolution satellite images, facilitates a nuanced understanding of the vegetative dynamics within rubber plantations. This approach enables a detailed examination of the spatial and temporal variations that impact rubber plant health and productivity. Table 1 summarizes the research data and variables, underlining the study’s methodological rigor and the depth of data integration.
3.1.1. Field Survey Collection
This study is grounded in comprehensive field observations within rubber plantations, focusing on two primary aspects: the spatial distribution of green canopy cover and tree characteristics. Detailed mappings of these observations were facilitated using GPS Geodetic Hi Target V30. Additionally, the canopy conditions were documented using a GoPro 360 camera for visual analysis. Insights into the prevalence and impact of leaf fall outbreak, seasonal leaf fall, and Pestalotiopsis outbreak were further enriched through interviews with plantation managers.
To ensure a representative and comprehensive dataset, a stratified grid sampling method was utilized, covering 218 grids distributed over two sample blocks (2010G and 2011G) during five consecutive survey periods: March 2022 (normal season), June 2022 (natural leaf fall season), February 2023 (Pestalotiopsis outbreak), July 2024 (natural leaf fall season), and November 2024 (normal season). Each block was mapped using a grid-based approach with a resolution of 30 by 30 meters. Within each grid, 3 to 5 observation points were collected, allowing for detailed and systematic data collection across varying levels of canopy density (Figure 1e,f).
3.1.2. Remote Sensing Data
High-resolution multispectral imagery was obtained using the DJI Phantom 4 Multi-spectral UAV, equipped with sensors capturing the following wavelengths: Blue (B): 450 nm ± 16 nm, Green (G): 560 nm ± 16 nm, Red (R): 650 nm ± 16 nm, Red Edge (RE): 730 nm ± 16 nm, and Near-Infrared (NIR): 840 nm ± 26 nm. The UAV flights were conducted at an altitude of 150 meters, with a front overlap of 80% and a side overlap of 70%. Real-time kinematic (RTK) positioning was used to ensure precise geolocation of each image captured. This high-resolution data was crucial for detailed Green Canopy Cover Fracture measurements.
Sentinel-2 (S2) is a part of the Copernicus program, consisting of two satellites, Sentinel-2A and Sentinel-2B, which provide high-resolution optical imagery. The sensor captures data in 13 spectral bands: Visible (Blue, Green, Red), Red Edge (four narrow bands between red and infrared), Near-Infrared (two bands), and Short-Wave Infrared (two bands). The spatial resolution ranges from 10 meters for RGB and NIR, 20 meters for red edge and short-wave infrared, to 60 meters for atmospheric correction bands. Sentinel-2 imagery has been utilized to calculate NDVI at a 10-meter resolution, aiding in precise vegetation density and health analysis over the plantation areas.
The Landsat program’s satellites, including Landsat 7 (L7), Landsat 8 (L8), and Landsat 9 (L9), have been pivotal in acquiring the multispectral data necessary for these calculations. Landsat 7 carries the Enhanced Thematic Mapper Plus (ETM+), while Landsat 8 and 9 are equipped with the Operational Land Imager (OLI) and the Thermal Infrared Sensor (TIRS). The OLI captures imagery across multiple spectral bands: Blue, Green, Red, Near-Infrared (NIR), and Short-Wave Infrared (SWIR). It also includes a Coastal Aerosol band designed for coastal studies and a Cirrus band for cloud detection. Landsat data offer a 30-meter spatial resolution for most spectral bands, making them highly suitable for broad-scale trend analysis and long-term environmental monitoring. Over eight years, this data has been instrumental in tracking phenological changes and assessing the sustained health of vegetation within plantation landscapes.
3.2. Data Processing
3.2.1. Satellite Data Preprocessing
The data processing framework for this study was meticulously designed to integrate and harmonize multispectral imagery from three distinct satellite sources, each offering unique spatial resolutions crucial for our analysis. The imagery was sourced from Landsat-7 (L7), Landsat-8 (L8), and Landsat-9 (L9), all with a 30-meter resolution, as well as Sentinel-2A (S2A) and Sentinel-2B (S2B), also with a 30-meter resolution. Our harmonization process adopted the methodologies and code outlined by [30], utilizing Google Earth Engine (GEE) for efficient processing. This study followed the procedure established by [30], which included the use of relative spectral response (RSR) adjustments. Additionally, leveraging the harmonization framework by [30], the vegetation index (VI) algorithm was applied uniformly across the datasets to ensure consistency in the analyses.
Data cleaning and harmonization with remote sensing datasets involved several key steps to ensure data consistency and accuracy. Initially, raw satellite data underwent atmospheric correction to mitigate distortions caused by atmospheric particles. Cloud and cloud shadow masking were applied to remove noise from the imagery. The datasets were adjusted for view and illumination angles to maintain uniformity across acquisition times. Co-registration ensured spatial alignment between images from different sensors, while reprojection and resampling standardized the data to an ordinary pixel resolution and map projection. Finally, band adjustments were made to harmonize the spectral differences between the Landsat and Sentinel datasets, resulting in a seamless, near-daily harmonized surface reflectance.
Weekly composite images were generated to enhance temporal consistency further and facilitate comparison with ground survey data. These composites were created by aggregating the best-available, cloud-free observations from Landsat series and Sentinel-2 datasets within a seven-day rolling window centered on each field survey date. This approach ensured that the remote sensing data was closely aligned with the field measurement period, minimizing temporal discrepancies and improving the reliability of canopy condition assessments. The compositing process effectively reduced noise from transient atmospheric conditions and provided a more stable representation of canopy reflectance, making it suitable for analyzing vegetation health dynamics over time.
3.2.2. UAV Data Preprocessing
The integration processing of high-resolution Multispectral Unmanned Aerial Vehicle (UAV) imagery was a key stage, providing unprecedented information about plantation health and the progression of rubber leaf fall disease. The stage began with collecting UAV imagery, which was painstakingly processed to generate high-resolution spatial information. High-resolution UAV imagery played a crucial role in revealing in-depth variations in density and health within the plantation, offering a level of detail inaccessible through medium-resolution satellite imagery.
The UAV photos underwent a meticulous mosaicking exercise, during which a series of photos taken with a drone were blended seamlessly together to produce high resolution, geographical accuracy, and orthomosaic. The orthomosaic captured a two-dimensional representation of the study area, with significant information such as X and Y coordinates and values for each pixel’s reflectance. All the work in processing UAV images was conducted using Agisoft Metashape, which produced high accuracy in orthomosaics and a digital surface model. High-detail texture mapping, dense point cloud creation, and precise image alignment were conducted using Agisoft Metashape, ensuring fidelity and spatial accuracy in the output datasets.
3.2.3. Ground Truth Data Preparation
A comprehensive data cleaning and harmonization process was conducted to ensure consistency and accuracy across datasets. Field-collected data, including tree characteristics (clone type, tree height, tree age, tree diameter, and canopy condition), were first checked for completeness and accuracy. When possible, missing values were addressed using interpolation methods or cross-referencing with field notes. Outliers and anomalies were identified through statistical analysis, such as boxplots and Z-score assessments, and were either corrected or removed based on their context and relevance. Once cleaned, the field data were harmonized with remote sensing datasets. This involved georeferencing field observation points to align with the spatial resolution of the satellite imagery (30x30 meters for Landsat and Sentinel-2). Coordinate adjustments were made to ensure a precise overlay, accounting for any GPS discrepancies that occurred during field collection. Temporal harmonization was also performed to match the field data collection dates with the corresponding satellite imagery acquisition dates, ensuring that both datasets represented the same phenological stages. Finally, spectral vegetation indices derived from satellite imagery were linked to the corresponding field data points. This integration allowed for a robust comparison between remote sensing-derived metrics and ground-truth observations, facilitating subsequent modeling and analysis.
3.2.4. Green Canopy Cover
This process enabled accurate quantification of the extent of vegetation within the study area. Green Canopy Cover (GCC) was calculated using NDVI-derived classification, combined with manual selection, to ensure accurate differentiation between tree canopy and non-canopy areas. Since high NDVI values can also originate from background vegetation, such as grass, a two-step approach was implemented:
- NDVI thresholding was applied to identify potential green canopy pixels.
- Manual selection was performed to refine the classification, ensuring that only tree canopy pixels were included while excluding non-canopy vegetation such as grass and shrubs.
The final Green Canopy Cover (GCC) value was determined using the following formula [31]:
This approach enhanced the accuracy and reliability of canopy cover estimation by integrating automated spectral classification with manual refinement, minimizing misclassification errors caused by background vegetation.
3.3. Vegetation Index Calculation
Spectral Vegetation Indices (SVIs) are mathematical combinations of spectral bands designed to enhance signals related to vegetation characteristics such as biomass, chlorophyll content, and canopy structure. They are essential tools for assessing vegetation health, canopy cover, and stress conditions in both agricultural and natural ecosystems. The selection of SVIs in this study was guided by their proven effectiveness in monitoring canopy dynamics, sensitivity to specific vegetation traits, and applicability in previous research on rubber plantations and disease stress assessments. Selection Criteria for SVIs:
Structural Attributes
- Normalized Difference Vegetation Index (NDVI): Widely used to quantify vegetation density and vigor, NDVI is sensitive to chlorophyll presence and effectively assesses canopy extent. Tucker’s research demonstrated the effectiveness of NDVI in monitoring photosynthetically active biomass in plant canopies [32].
- Enhanced Vegetation Index (EVI): This index offers improved sensitivity in high-biomass regions, reducing atmospheric and canopy background noise, making it suitable for monitoring dense vegetation. A. Huete et al. (2002) highlighted EVI’s ability to enhance the vegetation signal with improved sensitivity in high biomass regions and improved vegetation monitoring through de-coupling the canopy background signal and reducing atmosphere influences [33].
- Modified Triangular Vegetation Index 2 (MTVI2): Enhances sensitivity to chlorophyll content and is less affected by soil background, aiding in accurate biomass estimation. While specific studies on MTVI2 in rubber plantations are limited, its general effectiveness in vegetation monitoring suggests potential applicability.
Physiological Health
- Green NDVI (GNDVI): Utilizes green and near-infrared bands to assess chlorophyll concentration, providing insights into photosynthetic activity. While GNDVI has effectively monitored crop health, its application in rubber plantations has not been extensively documented.
Environmental Stress Factors
- Optimized Soil-Adjusted Vegetation Index (OSAVI): Adjusts for soil brightness, improving vegetation monitoring in areas with sparse canopy cover [34]. OSAVI’s effectiveness in rubber plantations has not been specifically documented, suggesting an area for future research.
- Atmospherically Resistant Vegetation Index (ARVI): Reduces atmospheric effects, enhancing the accuracy of vegetation monitoring under varying atmospheric conditions. ARVI has been utilized to minimize atmospheric influences in vegetation monitoring, though specific applications in rubber plantations are limited.
Soil-Canopy Interactions
- Modified Soil-Adjusted Vegetation Index (MSAVI): Reduces soil background influence, enhancing canopy detection accuracy, especially in areas with sparse vegetation [35]. A. R. Huete (1988) Introduced the Soil-Adjusted Vegetation Index (SAVI) to address soil brightness influences, and MSAVI builds upon this to further minimize soil effects [36].
This targeted selection ensures the study captures multiple canopy attributes while minimizing errors due to background reflectance or environmental noise. By incorporating SVIs that are sensitive to structural, physiological, and environmental factors, the study aims to comprehensively assess the health and stress conditions of rubber plantations.

Table 2.
Vegetation Index.
| Vegetation Index | Formula | Description | Reference |
| ARVI | (NIR - (2 × RED) + BLUE) / (NIR + (2 × RED) + BLUE) | Enhances vegetation signal while reducing atmospheric effects. | [37] |
| EVI | 2.5 × (NIR - RED) / (NIR + 6 × RED - 7.5 × BLUE + 1) | Optimizes vegetation signal by reducing soil and atmospheric influences. | [33] |
| GNDVI | (NIR - GREEN) / (NIR + GREEN) | Sensitive to chlorophyll concentration and plant health. | [38] |
| MSAVI | (2NIR + 1 - sqrt((2NIR + 1)^2 - 8(NIR - RED))) / 2 | Minimizes soil brightness influence on vegetation measurements. | [35] |
| MTVI2 | 1.5 × [1.2(NIR - GREEN) - 2.5(RED - GREEN)] / sqrt((2NIR + 1)^2 - (6NIR - 5sqrt(RED)) - 0.5) | Enhances detection of chlorophyll content and canopy structure. | [39] |
| NDVI | (NIR - RED) / (NIR + RED) | Standard index for measuring vegetation vigor and biomass. | [40] |
| OSAVI | (NIR - RED) / (NIR + RED + 0.16) | Reduces soil influence for sparse vegetation cover analysis. | [34] |
3.4. Machine Learning Modeling
3.4.1. Model Selection
Selecting the appropriate machine learning models is crucial for accurately predicting green canopy cover and understanding the phenological patterns of rubber plantations. This study employed Random Forest (RF), Support Vector Machines (SVM), Classification and Regression Trees (CART), and Linear Regression (LR) based on their proven performance in previous vegetation and canopy mapping studies, their ability to handle spectral vegetation indices (SVIs), and their varying complexity in capturing nonlinear relationships. RF, an ensemble learning method, constructs multiple decision trees and merges their results to enhance accuracy while controlling overfitting. RF is particularly effective for vegetation classification due to its robustness in handling high-dimensional data, ability to process large datasets, and resistance to noise and outliers, making it an optimal choice for predicting canopy variation [41]. SVM, a supervised learning model, is well-suited for high-dimensional feature spaces and has been widely applied in vegetation classification and land cover mapping. Its kernel trick enables nonlinear classification, allowing it to differentiate between subtle spectral variations in canopy stress conditions [42]. CART, a decision-tree-based model, is known for its simplicity and interpretability, making it useful for identifying key spectral features associated with canopy health. While prone to overfitting in complex datasets, CART provides insights into hierarchical decision-making processes in vegetation modeling [43]. LR, despite its limitations in handling nonlinear relationships, serves as a baseline model for benchmarking the performance of more advanced algorithms. It is widely used in spectral vegetation index analysis, offering a simple yet interpretable approach to understanding canopy variation trends [44]. While deep learning approaches, such as Convolutional Neural Networks (CNNs) and Long Short-Term Memory (LSTM) networks, have shown promise in remote sensing applications, their reliance on large labeled datasets and computationally intensive training processes makes them less practical for this study. By focusing on traditional machine learning models with varying levels of complexity, this study ensures a comprehensive evaluation of predictive modeling techniques for green canopy estimation.
3.4.2. Feature Engineering
Spectral vegetation indices (SVIs) are mathematical combinations of spectral bands designed to highlight specific characteristics of vegetation, such as chlorophyll content, water stress, or biomass. This study employed SVIs as key features to predict green canopy cover, leveraging their sensitivity to various vegetation properties. A diverse set of spectral vegetation indices was initially considered, encompassing indices sensitive to chlorophyll content, vegetation vigor, and structural attributes of the canopy.
3.4.3. Model Training, Validation, and Evaluation
The process of model training, model testing, and model evaluation was designed with care to validate and evaluate model accuracy and prediction robustness. K-fold cross-validation was conducted for model testing, in which a k-way partitioning of the dataset into folds of similar size, training, and testing with k-1 folds and testing with one-fold, and then iterated for k=5 times, with one fold being utilized in one run, and then averaging for an unbiased model performance estimate [45].
Model performance was measured through a range of key performance statistics. Root Mean Square Error (RMSE) gauged average prediction error size, estimating model accuracy. Variability in the target variable predictable in terms of proportion with explanatory variable(s) was gauged using the Coefficient of Determination (R²) and mean of average absolute prediction and observation value discrepancies through the use of the Mean Absolute Error (MAE). Adjusted R² also incorporated consideration for model complexity through an allowance for a range of model predictors, providing a more accurate model fit [46].
Model performance hyperparameters for improvement utilized a grid search algorithm using cross-validation, in which a range of values for a range of hyperparameters were examined sequentially for a specific hyperparameter value for a maximized model performance. Tuned important hyperparameters included the learning rate, controlling model optimization step size; trees, controlling model iterations, such as trees, in an ensemble model; and the maximum tree, controlling tree complexity; and regularization coefficients, controlling model over-fitting through penalty for high coefficients [47].
4. Results
4.1. Validation of Satellite-Derived Vegetation Indices with Field Observations
Figure 3 presents the Pearson correlation coefficients between green canopy coverage and various spectral vegetation indices across five distinct periods: March 2022 (normal season after a Pestalotiopsis outbreak), June 2022 (natural leaf fall season), February 2023 (during a Pestalotiopsis outbreak), July 2024 (natural leaf fall season), and November 2024 (normal season). The spectral vegetation indices analyzed include NDVI, EVI, MTVI2, GNDVI, ARVI, OSAVI, and MSAVI, each representing different vegetation biophysical and biochemical properties.
The highest correlation values are observed in November 2024, particularly for GNDVI (0.57), ARVI (0.55), MSAVI (0.53), and NDVI (0.55), suggesting a strong linear relationship between these indices and green canopy coverage during this normal growth period. The strong correlation of GNDVI, which is particularly sensitive to chlorophyll content, highlights the importance of this index in capturing photosynthetic activity under healthy vegetation conditions. Similarly, MSAVI and NDVI, which are designed to minimize soil background influence, exhibit robust correlations, confirming their effectiveness in assessing vegetation density and productivity during stable environmental conditions.
In contrast, February 2023, which coincides with a Pestalotiopsis outbreak, shows the weakest correlations across all indices, with EVI displaying the lowest value (0.03). This decline suggests that disease-related chlorophyll degradation and structural damage to the canopy significantly reduce the effectiveness of spectral indices in capturing vegetation characteristics. EVI, optimized for minimizing atmospheric and soil background noise, relies heavily on healthy canopy reflectance in the near-infrared (NIR) spectrum. During the disease outbreak, reduced chlorophyll concentration and increased leaf senescence likely diminished the spectral contrast necessary for EVI to maintain strong correlations with green canopy cover. Similarly, GNDVI (0.21) and NDVI (0.26) exhibit weak associations, indicating that leaf senescence and defoliation alter the spectral response in the visible and NIR bands, reducing the predictive power of these indices.
March 2022, which follows a previous Pestalotiopsis outbreak, exhibits moderate correlations, particularly for MSAVI (0.49), MTVI2 (0.50), and NDVI (0.50). These values suggest partial recovery of the canopy, as some vegetation indices regain their ability to detect healthy green biomass. MSAVI, which is particularly effective in correcting for soil background interference, demonstrates its utility in monitoring regrowth in environments where canopy cover is recovering from disease-induced stress. The moderate correlation of NDVI and MTVI2 also suggests that vegetation productivity is improving, but lingering effects from the outbreak may still influence spectral reflectance.
Periods associated with seasonal leaf fall, namely June 2022 and July 2024, display lower but relatively stable correlations, ranging between 0.24 and 0.35 across different indices. This pattern aligns with expected canopy thinning and reduced leaf area index (LAI) during natural defoliation, which affects the spectral signals captured by vegetation indices. NDVI and GNDVI remain relatively stable in these periods, indicating their robustness in detecting green canopy even in partially defoliated conditions. In contrast, indices that rely more on the contrast between vegetation and soil reflectance, such as EVI and MTVI2, show weaker correlations, likely due to increased exposure of the underlying surface.
Overall, the observed correlation trends highlight the impact of environmental stressors, including disease outbreaks and seasonal defoliation, on the spectral response of green canopy cover. The results emphasize that while NDVI, GNDVI, and MSAVI consistently exhibit strong correlations, their effectiveness varies depending on canopy health conditions. In normal growth periods, indices like GNDVI and NDVI are highly effective, whereas EVI becomes less reliable under stress conditions such as disease outbreaks. These findings suggest that selecting appropriate vegetation indices should consider not only the phenological stage of vegetation but also the presence of external stress factors, ensuring accurate monitoring of canopy dynamics under diverse environmental conditions.
The UAV imagery shown in Figure 4 provides a Visual comparison of canopy conditions across five key periods: March 2022 (normal season after a Pestalotiopsis outbreak), June 2022 (natural leaf fall season), February 2023 (during a Pestalotiopsis outbreak), July 2024 (natural leaf fall season), and November 2024 (normal season). The imagery highlights canopy health and density differences over time, correlating with observed changes in spectral vegetation indices. In March 2022, the canopy showed signs of recovery following the Pestalotiopsis outbreak, with moderate greenness and sparse healthy patches. June 2022, during the natural leaf fall season, displays a mix of healthy green and fallen leaves, indicating a natural reduction in canopy density. February 2023, marked by an active Pestalotiopsis outbreak, exhibits the most significant canopy degradation, with widespread discoloration and reduced green cover, aligning with the low vegetation index correlations observed during this period. In July 2024, despite being another natural leaf fall season, the imagery reveals a unique issue: the background grass appears significantly taller and denser, contributing to misleadingly high greenness levels in satellite-recorded spectral vegetation indices. This discrepancy suggests that the index may have captured the greenness of the grass rather than the actual canopy, potentially inflating the correlation values for this period. Finally, November 2024 shows a fully recovered, dense green canopy typical of a normal season, corresponding with the highest vegetation index correlations observed in the earlier heatmap analysis. These UAV observations underscore how ground conditions, such as grass growth, can influence vegetation index readings from satellite imagery, emphasizing the importance of accounting for such factors when interpreting remote sensing data.
4.2. Green Canopy Cover Model Performance
Table 3 elucidates the predictive efficacy of four distinct models: Random Forest (RF), Support Vector Machine (SVM), Classification and Regression Trees (CART), and Linear Regression, employed to estimate green canopy coverage using various spectral vegetation indices (SIVs). The evaluative metrics include Root Mean Square Error (RMSE), Mean Absolute Error (MAE), R-squared (R²), and Adjusted R-squared (Adj. R²), assessed for both training and testing datasets. The Random Forest (RF) model exhibits superior predictive performance compared to the other models, attaining the lowest RMSE (3.01) and MAE (2.24) during training and maintaining strong performance in testing with RMSE (6.46) and MAE (4.97). Its R² and Adj. R² values of 0.96 in training and 0.82/0.81 in testing underscore its robustness, accounting for a substantial proportion of variance in green canopy cover. This confirms the model’s high reliability for predictive applications. The SVM model ranks second in efficacy, achieving RMSE (6.67) and MAE (5.04) in training, with similar results in testing (RMSE: 6.62, MAE: 5.12). While slightly less accurate than RF, its R² and Adj. R² values (0.81/0.80 in both training and testing) suggest a strong correlation between spectral vegetation indices and green canopy cover. The CART model demonstrates slightly lower performance compared to SVM, with an RMSE of 7.06 and MAE of 5.30 in training, and a higher RMSE of 7.78 and MAE of 5.66 in testing. The corresponding R² and Adj. R² values (0.78/0.78 in training and 0.74/0.72 in testing) indicate moderate predictive power but reduced model stability. The Linear Regression model performs the least favorably, yielding the highest RMSE (9.13) and MAE (6.99) in training, with testing results (RMSE: 9.04, MAE: 7.17) confirming its substantial prediction inaccuracies. Its R² and Adj. R² values (0.64/0.63 in training and 0.64/0.62 in testing) indicate limited explanatory power, capturing only 64% of the variance in green canopy coverage.
In conclusion, the RF model emerges as the most precise and reliable for forecasting green canopy coverage using spectral vegetation indices, followed by SVM, CART, and Linear Regression. The significant performance disparity between RF and Linear Regression underscores the advantages of utilizing advanced machine-learning techniques for complex environmental modeling. Given its exceptional accuracy and stability, the RF model is selected for subsequent time-series forecasting of green canopy coverage.
Figure 5 illustrates the correlation between measured and predicted green canopy cover percentages using the RF Model across five distinct temporal intervals, each influenced by specific environmental conditions. The data from June 2022, collected during the natural leaf abscission season, exhibits the highest RMSE of 4.518 and an R² of 0.651, indicating increased variability due to seasonal leaf shedding. The March 2022 dataset, recorded following the Pestalotiopsis outbreak, shows an RMSE of 4.179 and an R² of 0.64, suggesting residual effects of the outbreak on canopy recovery. The February 2023 dataset, collected during an active Pestalotiopsis outbreak, demonstrates improved predictive accuracy with an RMSE of 3.365 and an R² of 0.715, likely due to the model effectively capturing canopy degradation patterns. The July 2024 dataset, obtained during another natural leaf fall period, presents an RMSE of 4.888 and an R² of 0.655, where the presence of taller background grasses during this season may have influenced vegetation index assessments, leading to slight discrepancies in predictions. Finally, the November 2024 dataset, collected during the standard season, yields the best model performance, with the lowest RMSE of 2.831 and the highest R² of 0.738, reflecting complete canopy recovery and stable environmental conditions. Overall, while the model maintains consistent predictive performance, variations in accuracy are influenced by environmental factors such as disease outbreaks and seasonal leaf abscission, which introduce fluctuations across different timeframes
Figure 6 presents the Canopy Density Map at the 2011G2 Block, illustrating the spatiotemporal variations in green canopy cover across five different time intervals, each influenced by distinct environmental conditions. In March 2022, following the Pestalotiopsis outbreak, the canopy showed moderate recovery, with patches of yellow and green indicating spatial heterogeneity in regrowth, suggesting lingering effects of the outbreak on tree health. By June 2022, during the natural leaf fall season, the canopy cover appears more variable, with an increased presence of yellow shades indicating lower density, aligning with the expected seasonal reduction in canopy greenness. In February 2023, during an active Pestalotiopsis outbreak, the canopy density map revealed widespread yellow regions, signifying significant degradation and reduced vegetation health. In July 2024, another natural leaf fall period, the canopy density exhibits a similar decline, with yellow areas reflecting seasonal leaf shedding, potentially compounded by background vegetation such as taller grasses. By November 2024, in the normal season, the canopy demonstrates full recovery, with a predominance of green shades reflecting higher canopy density, suggesting stable environmental conditions and healthy tree growth. The high-resolution imagery in the lower row further validates these observations, reinforcing the spatial patterns in canopy cover dynamics and highlighting the impact of seasonal changes and disease outbreaks over time.
5. Discussion
The findings from this study highlight the varying effectiveness of spectral vegetation indices (VIs) in monitoring green canopy coverage under different environmental stress conditions, including normal growth periods, disease outbreaks, and seasonal leaf fall. These results align with past studies that have explored the relationships between VIs and vegetation health under various stressors, including fungal infections, nematode infestations, and physiological changes resulting from environmental factors. The observed decrease in correlation values during the Pestalotiopsis outbreak (February 2023) supports findings from [48], who reported that rubber tree infection with powdery mildew significantly reduces chlorophyll content, leading to decreased reflectance in the red and near-infrared (NIR) wavelengths. The present study’s lowest correlation for EVI (0.03) during the outbreak aligns with previous findings, which indicate that EVI is negatively correlated with chlorophyll reduction due to infection (- 0.265). This suggests that EVI is highly sensitive to chlorophyll degradation and structural damage, making it unreliable for assessing canopy health under severe stress conditions. Similarly, research on South American Leaf Blight (SALB) has found that disease symptoms significantly alter spectral reflectance, particularly in the visible (400–700 nm) and NIR (NIR, 750–1300 nm) regions [49]. The significant decrease in spectral contrast due to disease-induced mesophyll cell damage parallels the weak correlation of NDVI (0.26) and GNDVI (0.21) during the Pestalotiopsis outbreak in the present study. These findings highlight the significance of leaf structure and pigment concentration in determining the efficacy of spectral indices for disease detection.
Further studies emphasize that spectral variations in rubber trees are influenced by both canopy and leaf-level characteristics, with notable differences observed in the shortwave infrared (SWIR) region [50]. This aligns with the present study’s findings, where GNDVI, an index highly sensitive to chlorophyll content, exhibited strong correlations under normal conditions but declined during periods of stress. The distinction in spectral responses between canopy and leaf levels, particularly in the SWIR spectrum, suggests that morphological differences, sun exposure, and water content play significant roles in shaping spectral reflectance patterns. The moderate correlations observed in March 2022, during the post-outbreak recovery phase, and the relatively stable yet lower correlations during seasonal leaf fall periods (June 2022 and July 2024) further indicate how environmental stressors affect canopy spectral properties. Research has demonstrated that damaged trees experience spectral shifts in the green-to-red band region (550–640 nm), similar to the patterns observed in this study, where NDVI and GNDVI remained relatively stable during seasonal leaf thinning, while indices like EVI and MTVI2 exhibited weaker correlations [49,51]. This highlights the importance of selecting appropriate vegetation indices based on phenological stages and canopy conditions.
Additionally, different vegetation indices respond uniquely to variations in vegetation health. Karlson et al. (2015) demonstrated that NDVI and ARVI effectively detect moderate to high canopy cover, which aligns with the findings of this study, where NDVI and MSAVI exhibited strong correlations under normal growth conditions. Conversely, studies by [15] indicate that MSAVI and SAVI outperform NDVI in mixed vegetation environments by minimizing soil background effects, supporting the present study’s observations that soil-adjusted indices are particularly effective in stable canopy conditions. [9] further highlighted that index relying on phenological trends, such as EVI and MTVI2, may be less reliable during stress conditions, which corresponds with their weaker performance in this study during seasonal leaf fall and post-disease recovery phases.
These findings reinforce the importance of considering phenological stage, canopy health, and external stressors when selecting the most suitable vegetation index. While NDVI and MSAVI perform well under normal conditions, indices such as SAVI may be more effective in detecting vegetation stress in sparse or heterogeneous canopies. Given these variations, integrating multi-source remote sensing data and advanced machine learning techniques can enhance the accuracy and reliability of vegetation monitoring, particularly for applications in rubber plantation health assessment and precision forestry.
Moreover, nematode infestations in rubber tree orchards have been associated with weak R² values (<0.31) when correlating nematode density with spectral indices (Lemes et al., 2020). This aligns with the weak correlation values observed during disease outbreaks in the present study, reinforcing the idea that severe biotic stressors reduce the predictive power of VIs. The comparative model analysis revealed that Random Forest (RF) performed best in predicting green canopy cover, with a considerable margin over Support Vector Machines (SVM), Classification and Regression Trees (CART), and Linear Regression (LR). RF achieved the lowest RMSE (6.46) and the highest R² (0.82), making it the most dependable model for estimating rubber tree canopy variation. These results indicate that RF outperformed other predictive models in estimating green canopy coverage using spectral vegetation indices. This finding aligns with previous studies demonstrating the robustness of machine-learning techniques in vegetation analysis [52,53]. The superior performance of RF is likely due to its ability to handle complex, nonlinear relationships between vegetation indices and canopy cover while mitigating overfitting through ensemble learning [23]. In contrast, SVM struggled with high-dimensional spectral data, which often exhibit nonlinear interactions requiring careful kernel selection and hyperparameter tuning, leading to suboptimal performance in this study. Similarly, CART demonstrated lower accuracy due to its tendency to overfit training data, especially when dealing with noisy or overlapping spectral information, resulting in poor generalization to new canopy conditions.
These findings align with previous studies that have demonstrated the effectiveness of ensemble-based learning models in vegetation analysis [54,55]. The temporal analysis of green canopy coverage across five different periods demonstrates promising results, though accuracy varies depending on environmental conditions. The lowest accuracy was observed during the natural leaf fall period and the Pestalotiopsis outbreak, where the presence of a strong green background from grass interfered with spectral vegetation indices’ ability to accurately detect canopy loss [50]. This issue arises because traditional vegetation indices rely on spectral differences to assess canopy health, but the green background from understory vegetation can mask actual canopy decline, leading to overestimated vegetation index values. This limitation is further evidenced by the low correlation between vegetation indices and actual canopy cover during the Pestalotiopsis outbreak and the seasonal leaf fall period. While machine learning approaches enhance canopy cover predictions by incorporating additional spectral and spatial information, they are still limited by background interference, which reduces accuracy. As demonstrated in previous studies, RF outperforms methods that rely solely on vegetation indices despite these challenges. These findings highlight the importance of integrating advanced classification methods or multi-source data to enhance accuracy.
The difficulty in assessing canopy loss using vegetation indices is further reinforced by the weak correlation between vegetation indices and canopy cover during the Pestalotiopsis outbreak and the seasonal leaf fall period. This suggests that the primary challenge lies in accurately modeling canopy dynamics under varying environmental conditions rather than simply evaluating vegetation index performance. Moreover, the observed relationship between increasing Pestalotiopsis severity and decreasing leaf area index (LAI) aligns with previous research, which has reported a strong negative correlation between Pestalotiopsis outbreaks and reductions in LAI [55]. Other studies have also confirmed a significant decline in LAI during abnormal leaf fall (ALF) disease outbreaks, with variations depending on the region and period [3]. The findings underscore the efficacy of RF in predicting green canopy coverage using spectral vegetation indices. The model’s robustness across various environmental conditions underscores its potential for real-time forest health monitoring, particularly in relation to disease outbreaks and seasonal leaf dynamics. Integrating additional spectral, texture, and color features alongside higher-resolution imagery could further refine model accuracy. Future research should incorporate advanced remote sensing techniques and multi-source data fusion to improve predictive capabilities and support sustainable rubber plantation management efforts.
6. Conclusions
In conclusion, this study underscores the varying effectiveness of spectral vegetation indices in monitoring green canopy coverage under different environmental stress conditions, including normal growth periods, disease outbreaks, and seasonal leaf fall. The findings reveal that indices such as NDVI, GNDVI, and MSAVI perform well under stable conditions, while EVI demonstrates significant limitations in detecting canopy health during disease outbreaks due to its sensitivity to chlorophyll degradation and structural damage. The weak correlations observed during the Pestalotiopsis outbreak align with previous research highlighting the impact of fungal infections and mesophyll cell damage on spectral reflectance. Additionally, seasonal variations influence spectral responses, with moderate correlations in post-outbreak recovery phases and lower but stable correlations during natural leaf fall, reinforcing the importance of phenological considerations when selecting vegetation indices.
Machine learning models, particularly Random Forest (RF), significantly enhance the accuracy of canopy cover estimation compared to traditional regression-based methods. The superior performance of RF, characterized by its ability to handle nonlinear relationships and mitigate overfitting, makes it a robust tool for predicting green canopy dynamics. In contrast, Support Vector Machines (SVM) and Classification and Regression Trees (CART) exhibited lower predictive accuracy due to their inherent limitations in handling complex spectral interactions. The study also highlights challenges in assessing canopy loss when background vegetation, such as taller grasses, affects spectral reflectance, leading to overestimated vegetation index values. This emphasizes the need for integrating additional data sources, such as LiDAR, SAR, and high-resolution UAV imagery, to improve model accuracy and minimize misclassification errors.
Overall, this study contributes to the growing body of research on remote sensing applications for vegetation monitoring, demonstrating the necessity of multi-index approaches, machine learning techniques, and high-resolution data integration for accurate canopy assessment. Future research should focus on incorporating multi-source remote sensing data, refining phenology-based classification models, and enhancing climate-informed predictive modeling to improve vegetation health monitoring in dynamic ecosystems. By leveraging these advancements, more effective strategies can be developed for sustainable rubber plantation management, forest conservation, and precision agriculture applications.
Building on this work, this paper specifically focuses on modeling rubber canopy density during disease outbreaks, providing crucial insights into canopy loss’s spatial and temporal dynamics. However, understanding the underlying mechanisms driving disease progression remains a key challenge. To further investigate this aspect, a forthcoming manuscript will explore disease progression mechanisms within rubber plantation ecosystems. Before formal journal submission, this follow-up study will be available as a preprint. Together, these complementary studies contribute to a comprehensive framework for rubber plantation health monitoring, offering valuable insights into the interactions between disease outbreaks, environmental stressors, and canopy dynamics.
Author Contributions
Conceptualization & Study Design: MDMM, IPAS, MM, S, R; Methodology Development: MDMM, IPAS, S, R; Data Collection & Fieldwork: MDMM, AFE, FA, FDP, CTS, TRF, AAAS, DMA, AAR, GNP, RPN, KAP, RP; Data Processing & Analysis: MDMM, AFE, FA, FDP; Model Development & Validation: MDMM; Statistical Analysis & Data Visualization: MDMM, AFE, FA, FDP; Literature Review & Theoretical Framework: MDMM, CTS, TRF, RL, S; Manuscript Drafting: MDMM, AFE, FA; Manuscript Editing & Review: MDMM, AFE, FA; Supervision & Project Funding: MDMM, KK, MM, RL.
Funding
Universitas Indonesia collaboratively funded this research under research grant PUTI Q1 2023 with grant contact number NKB-480/UN2.RST/HKP.05.00/2023 and Technology Research Partnership for Sustainable Development (SATREPS PROGRAM) program entitled Development of Complex Technologies for Prevention and Control of Rubber Tree Leaf Fall.
Data Availability Statement
The data used in this research is available upon request to the corresponding author, subject to approval from the Indonesian Rubber Research Institute.
Acknowledgments
The authors thank the Indonesian Rubber Research Institute for facilitating the measurement inside the Sembawa plantation.
Conflicts of Interest
The authors declare no conflicts of interest.
References
- Damiri, N.; Pratama, Y.; Febbiyanti, T.R.; Rahim, S.E.; Astuti, D.T.; Purwanti, Y. Pestalotiopsis Sp. Infection Causes Leaf Fall Disease of New Arrivals in Several Clones of Rubber Plants. Biodiversitas 2022, 23. [CrossRef]
- Hadi Ismail, M.Z.; Mahyudin, M.M.; Noran, A.S.; Zambri, A.M.A.; Maiden, N.A.; Atan, S.; Aris, M.N.M. Identification and Characterisation of Causal Pathogens of Pestalotiopsis Leaf Fall Disease in Hevea Brasiliensis Using a Detached Leaf Technique. Journal of Rubber Research 2024 27:1 2024, 27, 159–173. [CrossRef]
- Alchemi, P.J.K.; Jamin, S. Impact Of Pestalotiopsis Leaf Fall Disease On Leaf Area Index and Rubber Plant Production. In Proceedings of the IOP Conference Series: Earth and Environmental Science; 2022; Vol. 995.
- Karlson, M.; Ostwald, M.; Reese, H.; Sanou, J.; Tankoano, B.; Mattsson, E. Mapping Tree Canopy Cover and Aboveground Biomass in Sudano-Sahelian Woodlands Using Landsat 8 and Random Forest. Remote Sensing 2015, Vol. 7, Pages 10017-10041 2015, 7, 10017–10041. [CrossRef]
- Klobucar, B.; Sang, N.; Randrup, T.B. Comparing Ground and Remotely Sensed Measurements of Urban Tree Canopy in Private Residential Property. Trees, Forests and People 2021, 5, 100114. [CrossRef]
- Azizan, F.A.; Kiloes, A.M.; Astuti, I.S.; Aziz, A.A. Application of Optical Remote Sensing in Rubber Plantations: A Systematic Review. Remote Sensing 2021, Vol. 13, Page 429 2021, 13, 429. [CrossRef]
- Wu, W. DERIVATION OF TREE CANOPY COVER BY MULTISCALE REMOTE SENSING APPROACH. The International Archives of the Photogrammetry, Remote Sensing and Spatial Information Sciences 2012, XXXVIII-4-W25, 142–149. [CrossRef]
- Carreiras, J.M.B.; Pereira, J.M.C.; Pereira, J.S. Estimation of Tree Canopy Cover in Evergreen Oak Woodlands Using Remote Sensing. For Ecol Manage 2006, 223, 45–53. [CrossRef]
- Zhai, D.; Dong, J.; Cadisch, G.; Wang, M.; Kou, W.; Xu, J.; Xiao, X.; Abbas, S. Comparison of Pixel- and Object-Based Approaches in Phenology-Based Rubber Plantation Mapping in Fragmented Landscapes. Remote Sensing 2018, Vol. 10, Page 44 2017, 10, 44. [CrossRef]
- Fan, H.; Fu, X.; Zhang, Z.; Wu, Q. Phenology-Based Vegetation Index Differencing for Mapping of Rubber Plantations Using Landsat OLI Data. Remote Sensing 2015, Vol. 7, Pages 6041-6058 2015, 7, 6041–6058. [CrossRef]
- Li, P.; Zhang, J.; Feng, Z. Mapping Rubber Tree Plantations Using a Landsat-Based Phenological Algorithm in Xishuangbanna, Southwest China. Remote Sensing Letters 2015, 6, 49–58. [CrossRef]
- Razak, J.A. binti A.; Shariff, A.R. bin M.; Ahmad, N. bin; Ibrahim Sameen, M. Mapping Rubber Trees Based on Phenological Analysis of Landsat Time Series Data-Sets. Geocarto Int 2018, 33, 627–650. [CrossRef]
- Cui, B.; Huang, W.; Ye, H.; Chen, Q. The Suitability of PlanetScope Imagery for Mapping Rubber Plantations. Remote Sensing 2022, Vol. 14, Page 1061 2022, 14, 1061. [CrossRef]
- Chen, X.M.; Chen, H.L.; Li, W.G.; Liu, S.J. Remote Sensing Monitoring of Spring Phenophase of Natural Rubber Forest in Hainan Province. Chinese Journal of Agrometeorology 2016, 37. [CrossRef]
- Dai, S.; Luo, H.; Hu, Y.; Zheng, Q.; Li, H.; Li, M.; Yu, X.; Chen, B. Retrieving Leaf Area Index of Rubber Plantation in Hainan Island Using Empirical and Neural Network Models with Landsat Images. 2023, 17, 014503. [CrossRef]
- Gao, Y.; Yun, T.; Chen, B.; Lai, H.; Wang, X.; Wang, G.; Wang, X.; Wu, Z.; Kou, W. Improving the Accuracy of Canopy Height Mapping in Rubber Plantations Based on Stand Age, Multi-Source Satellite Images, and Random Forest Algorithm. International Journal of Applied Earth Observation and Geoinformation 2024, 131, 103941. [CrossRef]
- Herdiyeni, Y.; Mumtaz, M.F.; Laxmi, G.F.; Setiawan, Y.; Prasetyo, L.B.; Febbiyanti, T.R. Analysis and Prediction of Rubber Tree Phenological Changes during Pestalotiopsis Infection Using Sentinel-2 Imagery and Random Forest. 2024, 18, 014524. [CrossRef]
- Sopian, N.A.M.; Supriatna, S.; Manessa, M.D.M.; Shidiq, I.P.A.; Nagasawa, R.; Haidar, M. A Study on Spatio-Temporal Trend of Rubber Leaf Fall Phenomenon Using Planetscope Multi-Index Vegetation Imagery in Relations to Climatological Conditions. Environmental and Materials 2024, 2, 45–60. [CrossRef]
- Azizan, F.A.; Astuti, I.S.; Aditya, M.I.; Febbiyanti, T.R.; Williams, A.; Young, A.; Aziz, A.A. Using Multi-Temporal Satellite Data to Analyse Phenological Responses of Rubber (Hevea Brasiliensis) to Climatic Variations in South Sumatra, Indonesia. Remote Sensing 2021, Vol. 13, Page 2932 2021, 13, 2932. [CrossRef]
- Zeng, T.; Zhang, H.; Li, Y.; Yin, C.; Liang, Q.; Fang, J.; Fu, W.; Wang, J.; Zhang, X. Monitoring the Severity of Rubber Tree Infected with Powdery Mildew Based on UAV Multispectral Remote Sensing. Forests 2023, 14. [CrossRef]
- Rasib, A.W.; Hamid, N.R.A.; Yaacob, M.L.M.; Ghani, Z.A.; Idris, N.H.; Alvin, L.M.S.; Hassan, M.I.; Idris, K.M.; Dollah, R.; Salleh, A.M.; et al. Rubber-Tree Leaf Diseases Mapping Using Close Range Remote Sensing Images. International Journal of Integrated Engineering 2022, 14. [CrossRef]
- Hazir, M.H.M.; Daud, R.; Shahabudin, M.S.; Othman, M.F.; Hamid, N.R.A. Canopy Reflectance Spectra’s Variability, Physical Traits’ Uniqueness and the Prediction of Rubber Clones (Hevea Brasiliensis). Ind Crops Prod 2023, 201. [CrossRef]
- Zeng, T.; Fang, J.; Yin, C.; Li, Y.; Fu, W.; Zhang, H.; Wang, J.; Zhang, X. Recognition of Rubber Tree Powdery Mildew Based on UAV Remote Sensing with Different Spatial Resolutions. Drones 2023, 7. [CrossRef]
- Ranganath, B.K.; Pradeep, N.; Manjula, V.B.; Gowda, B.; Rajanna, M.D.; Shettigar, D.; Rao, P.P.N. Detection of Diseased Rubber Plantations Using Satellite Remote Sensing. Journal of the Indian Society of Remote Sensing 2004, 32. [CrossRef]
- Lemes, E.M.; Machado, T. V.; Gontijo, L.N.; de Andrade, S.L.; Torres, J.L.R.; Santos, M.A.; Coelho, L. Detection of Rubber Tree Orchards Infested by Meloidogyne Exigua Using Vegetation Indexes Obtained from Satellite Images. New For (Dordr) 2020, 51. [CrossRef]
- Ayu, F.; Manessa, M.D.M.; Stevanus, C.T.; Efriana, A.F. Machine Learning Approach to Assess Rubber Plant Health through Canopy Density Mapping Using Very High-Resolution Aerial Photographs. 2024, 12977, 667–676. [CrossRef]
- Joshi, C.; Leeuw, J. De; Skidmore, A.K.; Duren, I.C. van; van Oosten, H. Remotely Sensed Estimation of Forest Canopy Density: A Comparison of the Performance of Four Methods. International Journal of Applied Earth Observation and Geoinformation 2006, 8, 84–95. [CrossRef]
- Ke, Y.; Quackenbush, L.J. A Review of Methods for Automatic Individual Tree-Crown Detection and Delineation from Passive Remote Sensing. Int J Remote Sens 2011, 32, 4725–4747. [CrossRef]
- Kusdiana, A.P.J. Pengaruh Klon Karet Terhadap Epidemi Penyakit Gugur Daun Pestalotiopsis. Warta Perkaretan 2021, 40, 41–52.
- Berra, E.F.; Fontana, D.C.; Yin, F.; Breunig, F.M. Harmonized Landsat and Sentinel-2 Data with Google Earth Engine. Remote Sens (Basel) 2024, 16, 2695.
- Raj, R.; Walker, J.P.; Pingale, R.; Nandan, R.; Naik, B.; Jagarlapudi, A. Leaf Area Index Estimation Using Top-of-Canopy Airborne RGB Images. International Journal of Applied Earth Observation and Geoinformation 2021, 96, 102282.
- Tucker, C.J. Red and Photographic Infrared Linear Combinations for Monitoring Vegetation. Remote Sens Environ 1979, 8, 127–150.
- Huete, A.; Didan, K.; Miura, T.; Rodriguez, E.P.; Gao, X.; Ferreira, L.G. Overview of the Radiometric and Biophysical Performance of the MODIS Vegetation Indices. Remote Sens Environ 2002, 83, 195–213. [CrossRef]
- Rondeaux, G.; Steven, M.; Baret, F. Optimization of Soil-Adjusted Vegetation Indices. Remote Sens Environ 1996, 55, 95–107.
- Qi, J.; Chehbouni, A.; Huete, A.R.; Kerr, Y.H.; Sorooshian, S. A Modified Soil Adjusted Vegetation Index. Remote Sens Environ 1994, 48, 119–126.
- Huete, A.R. A Soil-Adjusted Vegetation Index (SAVI): Remote Sensing of the Environment, 25, 295–309 1988.
- Kaufman, Y.J.; Tanre, D. Atmospherically Resistant Vegetation Index (ARVI) for EOS-MODIS. IEEE transactions on Geoscience and Remote Sensing 1992, 30, 261–270.
- Gitelson, A.A.; Kaufman, Y.J.; Merzlyak, M.N. Use of a Green Channel in Remote Sensing of Global Vegetation from EOS-MODIS. Remote Sens Environ 1996, 58, 289–298.
- Haboudane, D.; Miller, J.R.; Pattey, E.; Zarco-Tejada, P.J.; Strachan, I.B. Hyperspectral Vegetation Indices and Novel Algorithms for Predicting Green LAI of Crop Canopies: Modeling and Validation in the Context of Precision Agriculture. Remote Sens Environ 2004, 90, 337–352.
- Rouse Jr, J.W.; Haas, R.H.; Deering, D.W.; Schell, J.A.; Harlan, J.C. Monitoring the Vernal Advancement and Retrogradation (Green Wave Effect) of Natural Vegetation; 1974;
- Belgiu, M.; Drăguţ, L. Random Forest in Remote Sensing: A Review of Applications and Future Directions. ISPRS journal of photogrammetry and remote sensing 2016, 114, 24–31.
- Mountrakis, G.; Im, J.; Ogole, C. Support Vector Machines in Remote Sensing: A Review. ISPRS journal of photogrammetry and remote sensing 2011, 66, 247–259.
- De’ath, G.; Fabricius, K.E. Classification and Regression Trees: A Powerful yet Simple Technique for Ecological Data Analysis. Ecology 2000, 81, 3178–3192.
- Gitelson, A.A.; Gritz, Y.; Merzlyak, M.N. Relationships between Leaf Chlorophyll Content and Spectral Reflectance and Algorithms for Non-Destructive Chlorophyll Assessment in Higher Plant Leaves. J Plant Physiol 2003, 160, 271–282.
- Kohavi, R. A Study of Cross-Validation and Bootstrap for Accuracy Estimation and Model Selection. Morgan Kaufman Publishing 1995.
- Draper, N.R. Applied Regression Analysis; McGraw-Hill. Inc, 1998;
- Bergstra, J.; Bengio, Y. Random Search for Hyper-Parameter Optimization. Journal of machine learning research 2012, 13.
- Zeng, T.; Wang, Y.; Yang, Y.; Liang, Q.; Fang, J.; Li, Y.; Zhang, H.; Fu, W.; Wang, J.; Zhang, X. Early Detection of Rubber Tree Powdery Mildew Using UAV-Based Hyperspectral Imagery and Deep Learning. Comput Electron Agric 2024, 220, 108909. [CrossRef]
- Sterling, A.; Di Rienzo, J.A. Prediction of South American Leaf Blight and Disease-Induced Photosynthetic Changes in Rubber Tree, Using Machine Learning Techniques on Leaf Hyperspectral Reflectance. Plants 2022, 11. [CrossRef]
- Amaral, C.H.; Almeida, T.I.R.; Quitério, G.C.M.; Alves, M.N.; Souza Filho, C.R. Change Analysis of the Spectral Characteristics of Rubber Trees at Canopy and Leaf Scales during the Brazilian Autumn. In Proceedings of the International Archives of the Photogrammetry, Remote Sensing and Spatial Information Sciences - ISPRS Archives; 2012; Vol. 39, pp. 381–386.
- Lai, H.; Chen, B.; Wang, G.; Yin, X.; Wang, X.; Yun, T.; Lan, G.; Wu, Z.; Yang, C.; Kou, W. Unraveling the Dynamic of Rubber Phenology in Hainan Island, China: Insights from Multi-Source Remote Sensing and Climate Data. Authorea Preprints 2024. [CrossRef]
- Akın, A.; Çilek, A.; Middel, A. Modelling Tree Canopy Cover and Evaluating the Driving Factors Based on Remotely Sensed Data and Machine Learning. Urban For Urban Green 2023, 86, 128035. [CrossRef]
- Nasiri, V.; Beloiu, M.; Asghar Darvishsefat, A.; Griess, V.C.; Maftei, C.; Waser, L.T. Mapping Tree Species Composition in a Caspian Temperate Mixed Forest Based on Spectral-Temporal Metrics and Machine Learning. International Journal of Applied Earth Observation and Geoinformation 2023, 116, 103154. [CrossRef]
- Xue, J.; Su, B. Significant Remote Sensing Vegetation Indices: A Review of Developments and Applications. J Sens 2017, 2017, 1353691. [CrossRef]
- Chang, A.; Yeom, J.; Jung, J.; Landivar, J. Comparison of Canopy Shape and Vegetation Indices of Citrus Trees Derived from UAV Multispectral Images for Characterization of Citrus Greening Disease. Remote Sensing 2020, Vol. 12, Page 4122 2020, 12, 4122. [CrossRef]
Figure 1.
Map of Study Area (a) Indonesia, (b) South Sumatra Province, (c) The Sembawa Rubber Research Center plantation blocks, (d-e) Block 2010G2 and 2011G with grid and point samples, (f-g) field data collection, (h-j) canopy photo from high to low density.
Figure 1.
Map of Study Area (a) Indonesia, (b) South Sumatra Province, (c) The Sembawa Rubber Research Center plantation blocks, (d-e) Block 2010G2 and 2011G with grid and point samples, (f-g) field data collection, (h-j) canopy photo from high to low density.
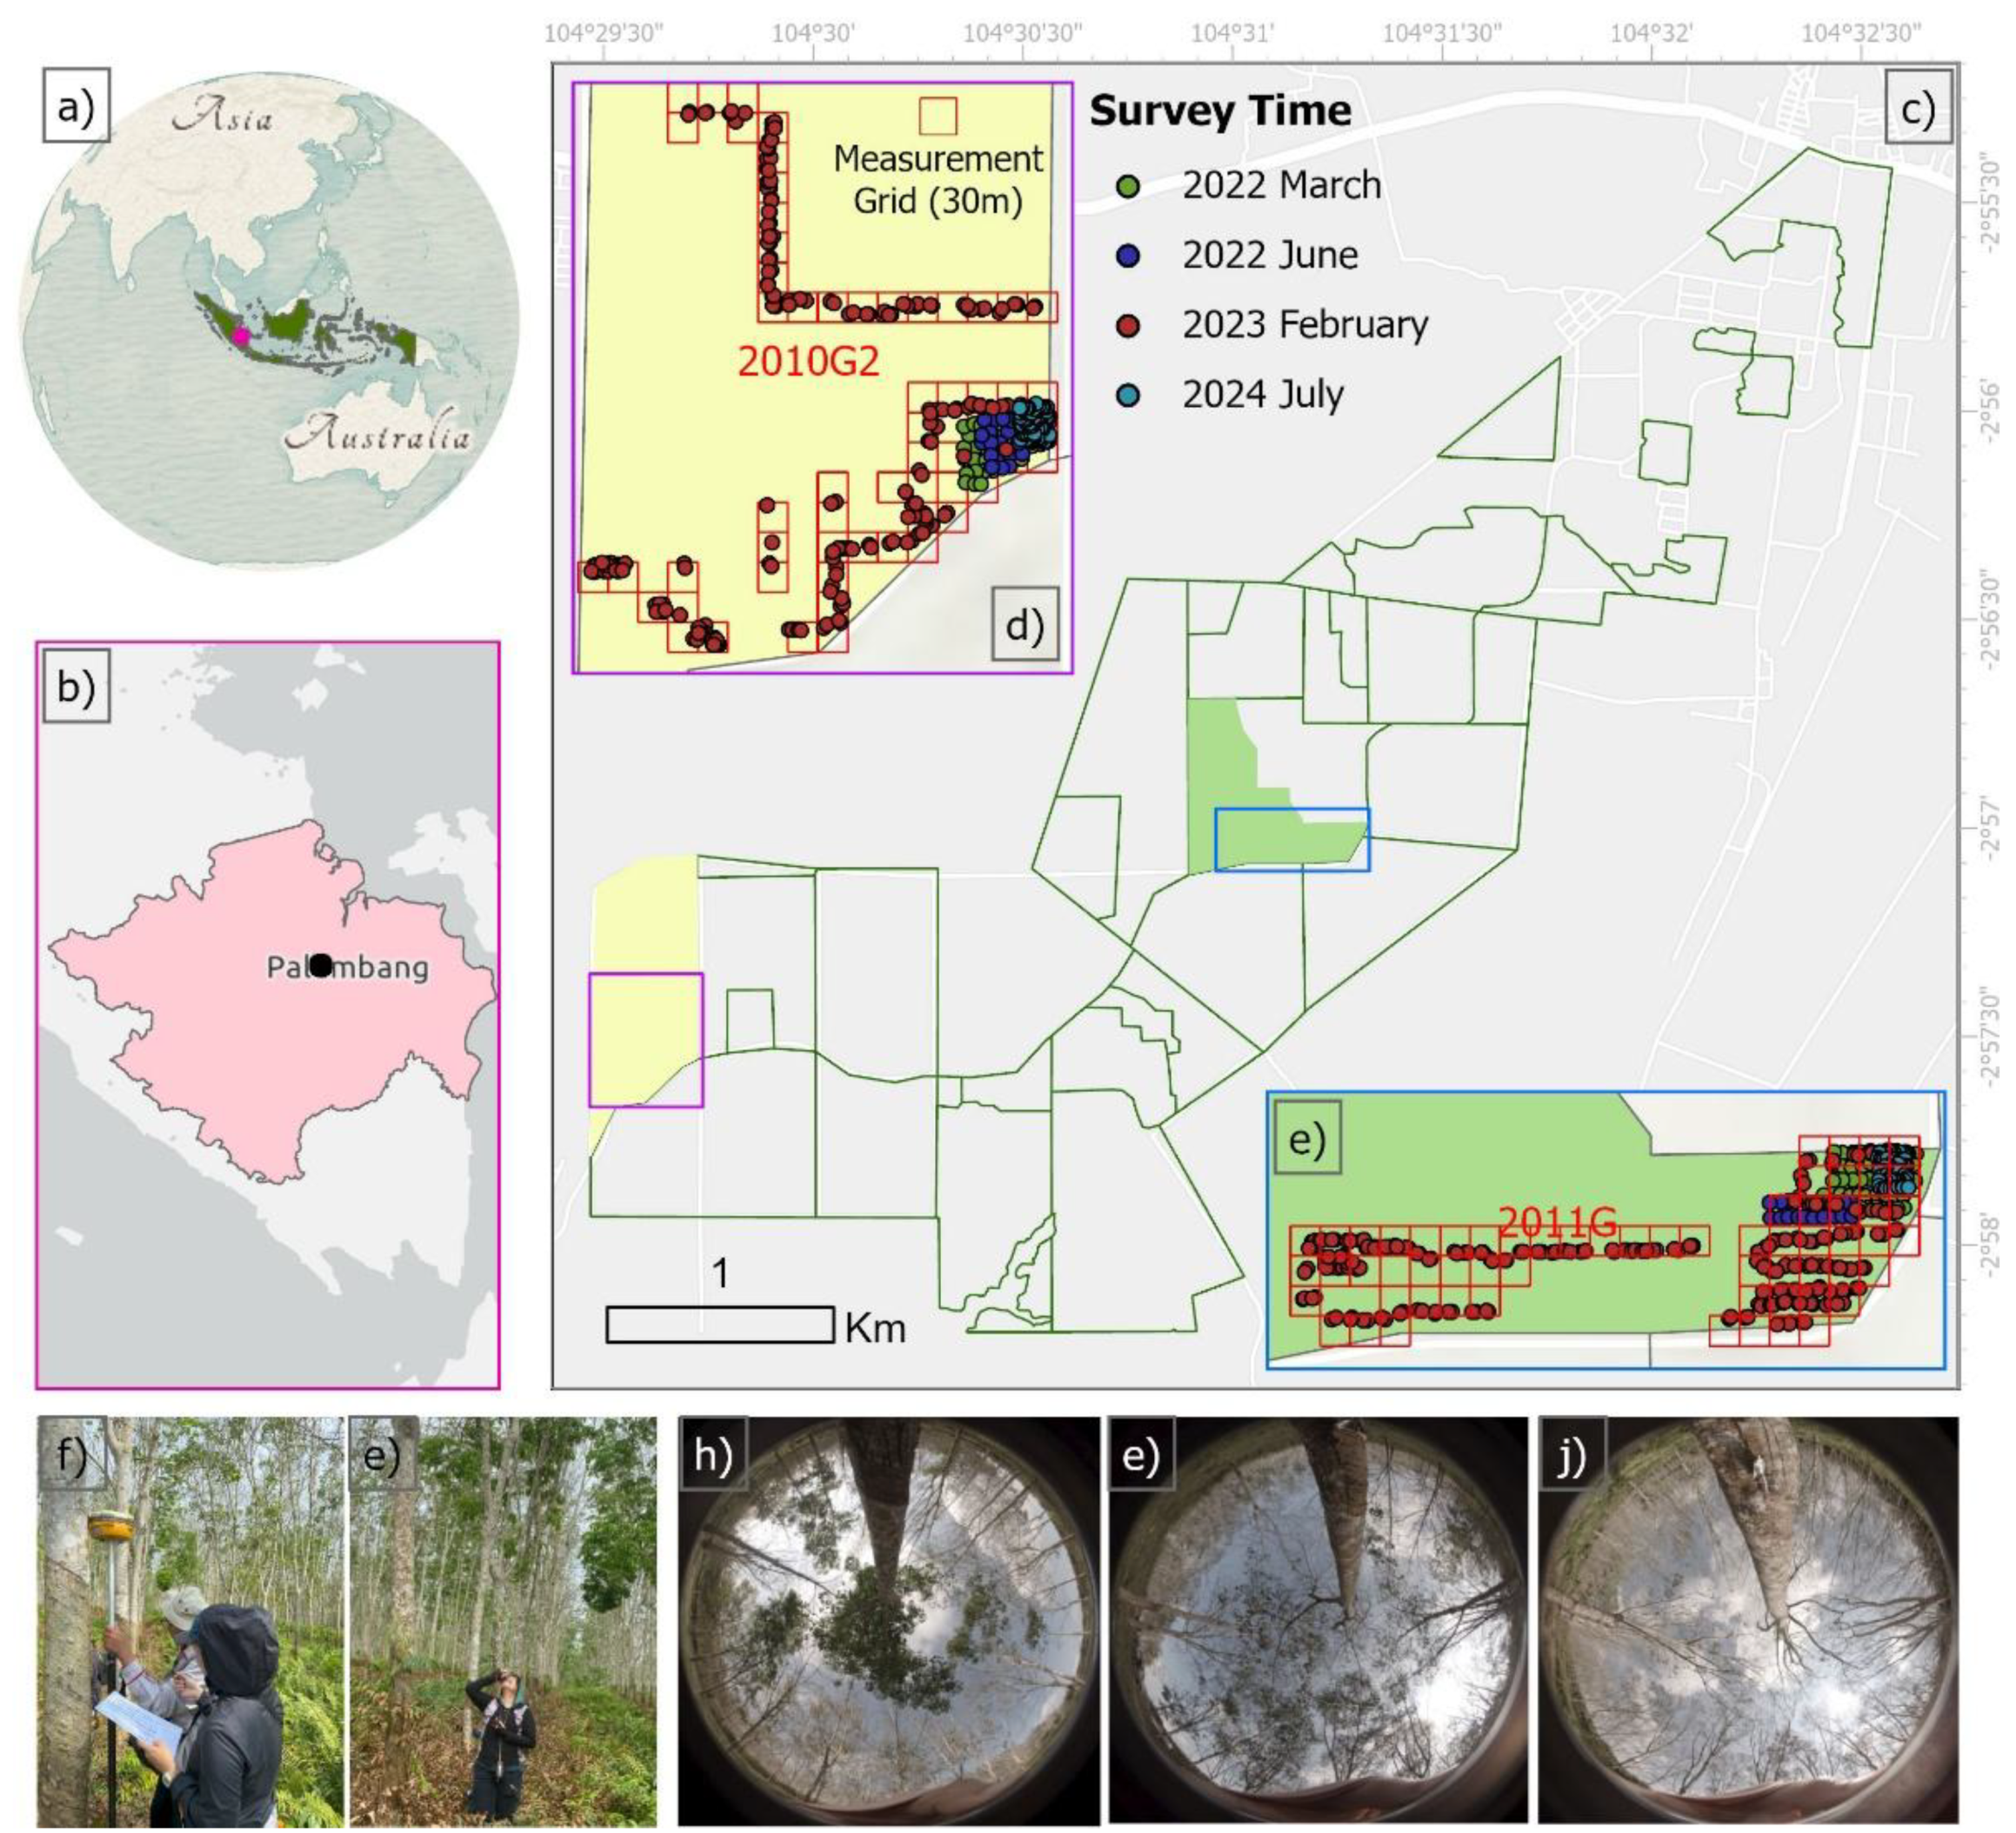
Figure 2.
Workflow.
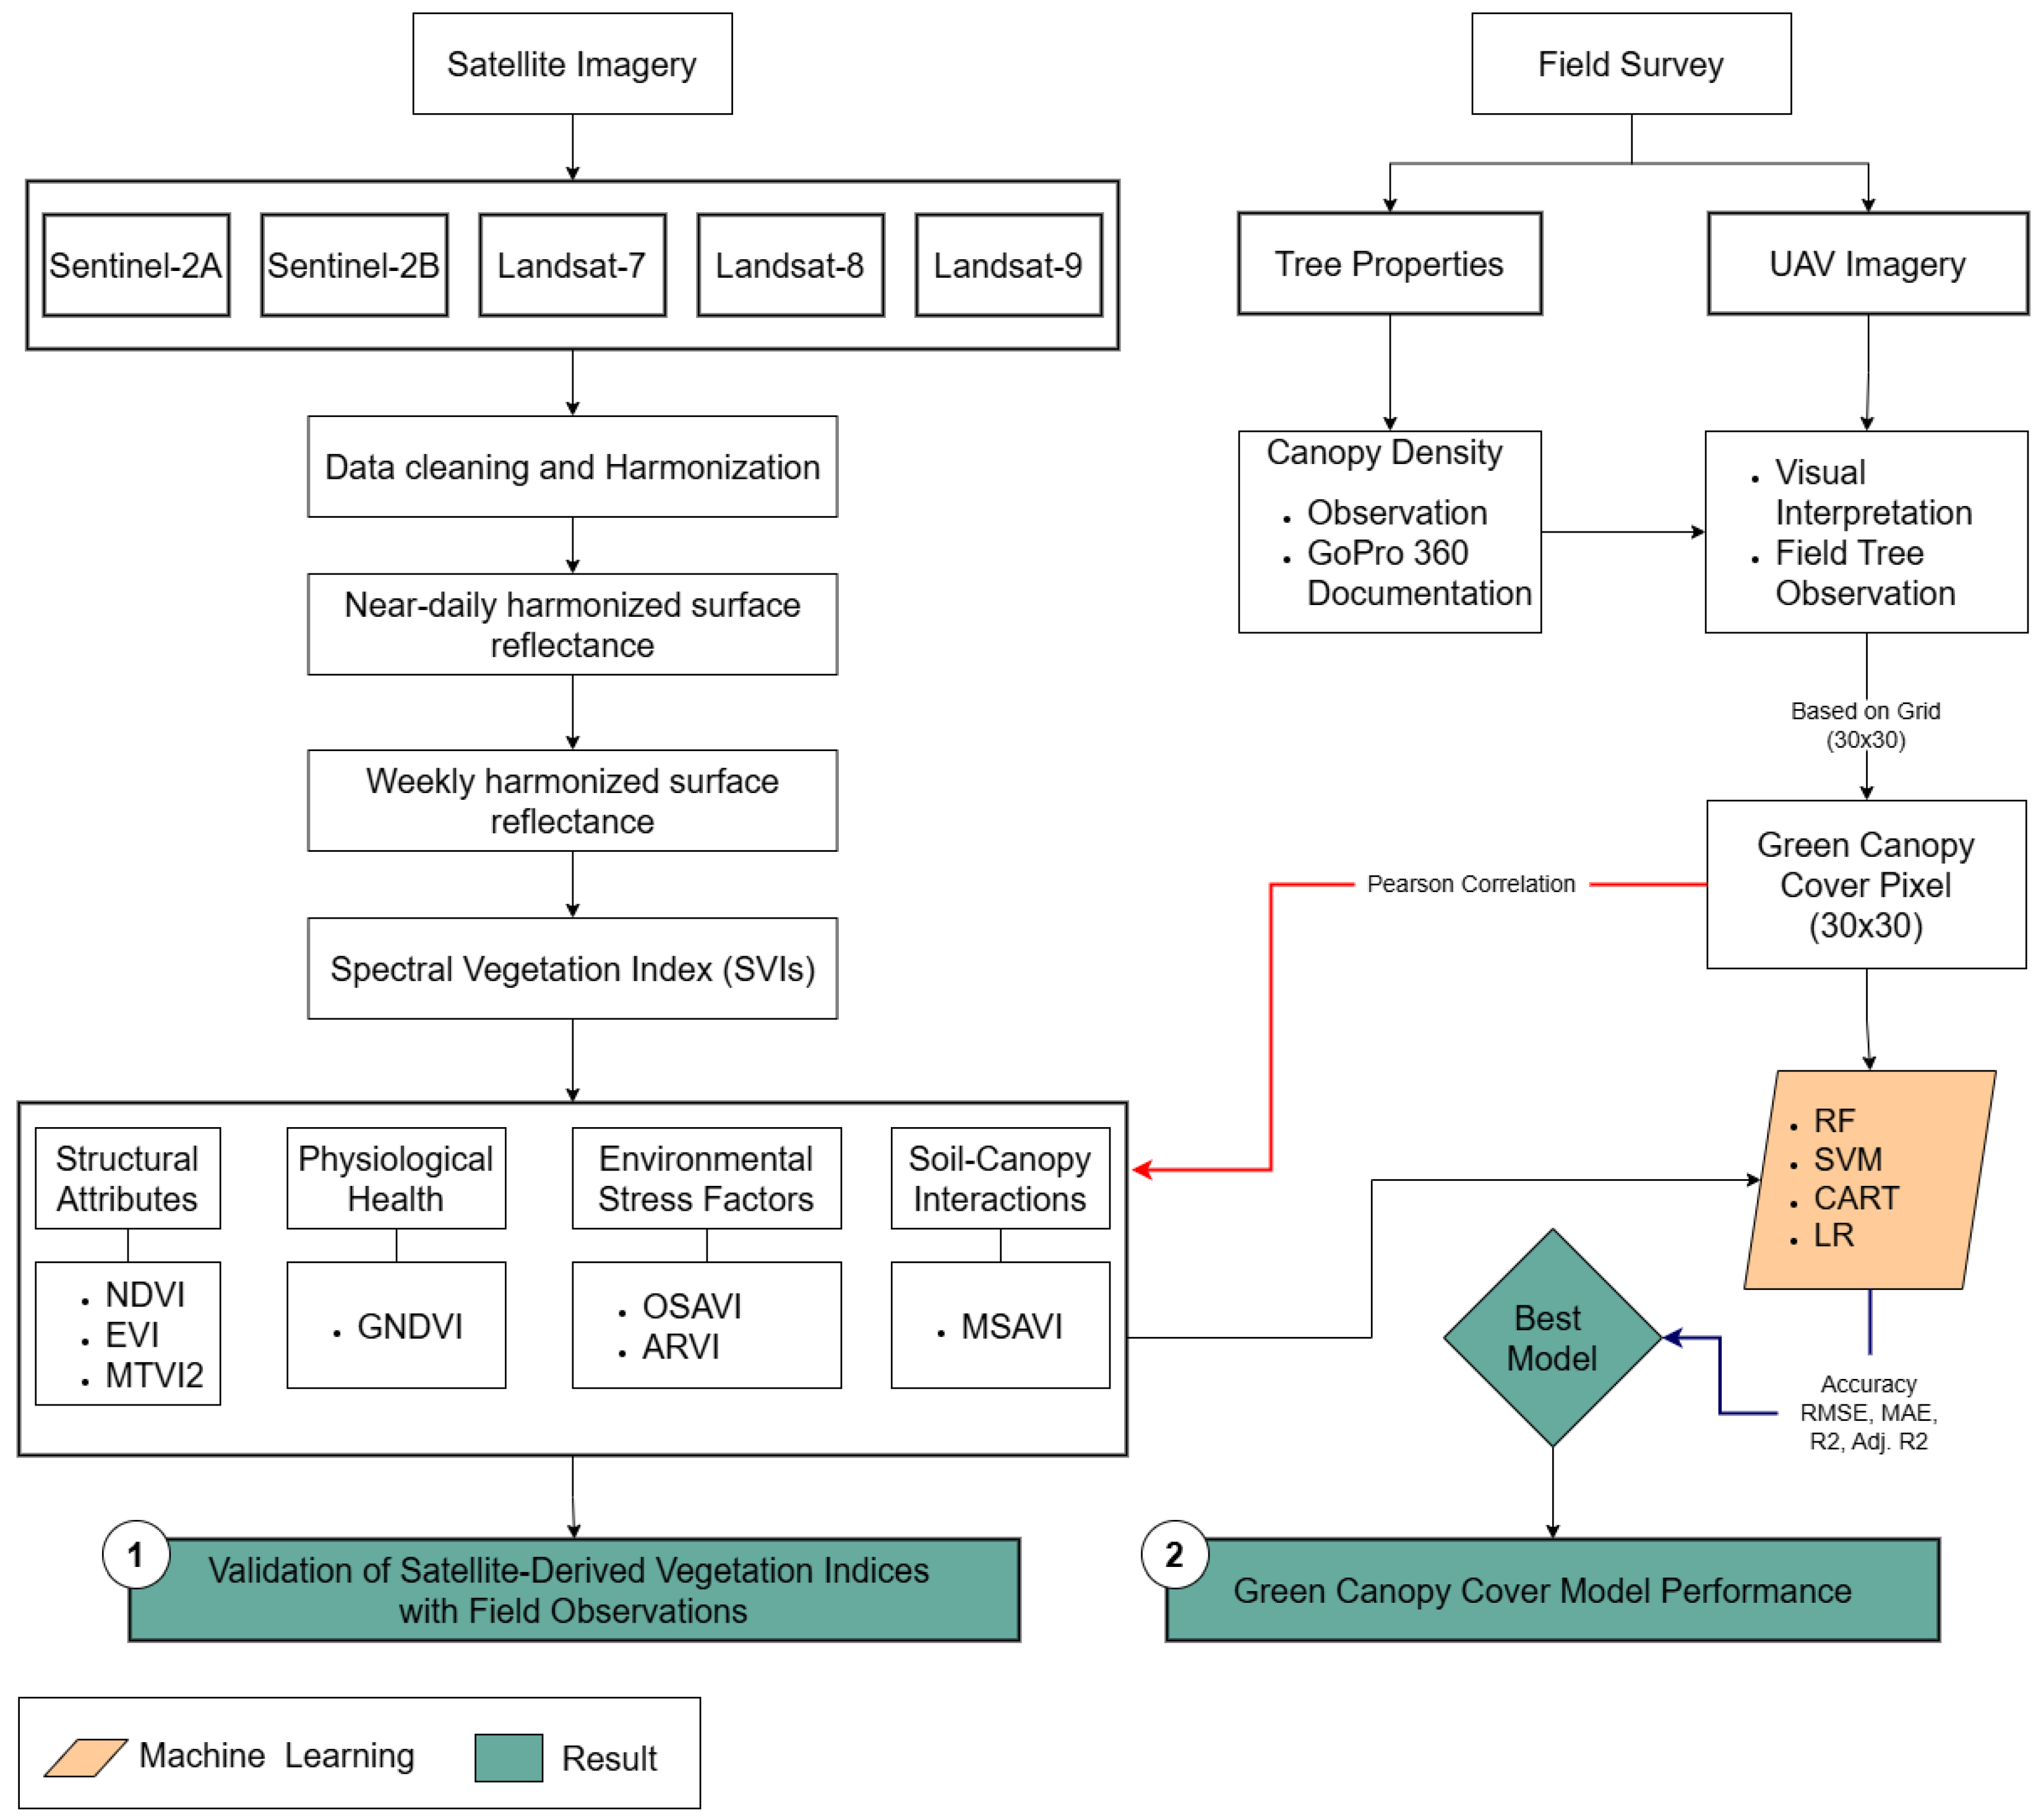
Figure 3.
Graph of Correlation matrix between Green Tree Canopy and Vegetation Index. The correlation values range from 0 to 1, with a color gradient indicating the strength of the relationship—blue representing lower correlations and orange to red indicating stronger correlations.
Figure 3.
Graph of Correlation matrix between Green Tree Canopy and Vegetation Index. The correlation values range from 0 to 1, with a color gradient indicating the strength of the relationship—blue representing lower correlations and orange to red indicating stronger correlations.
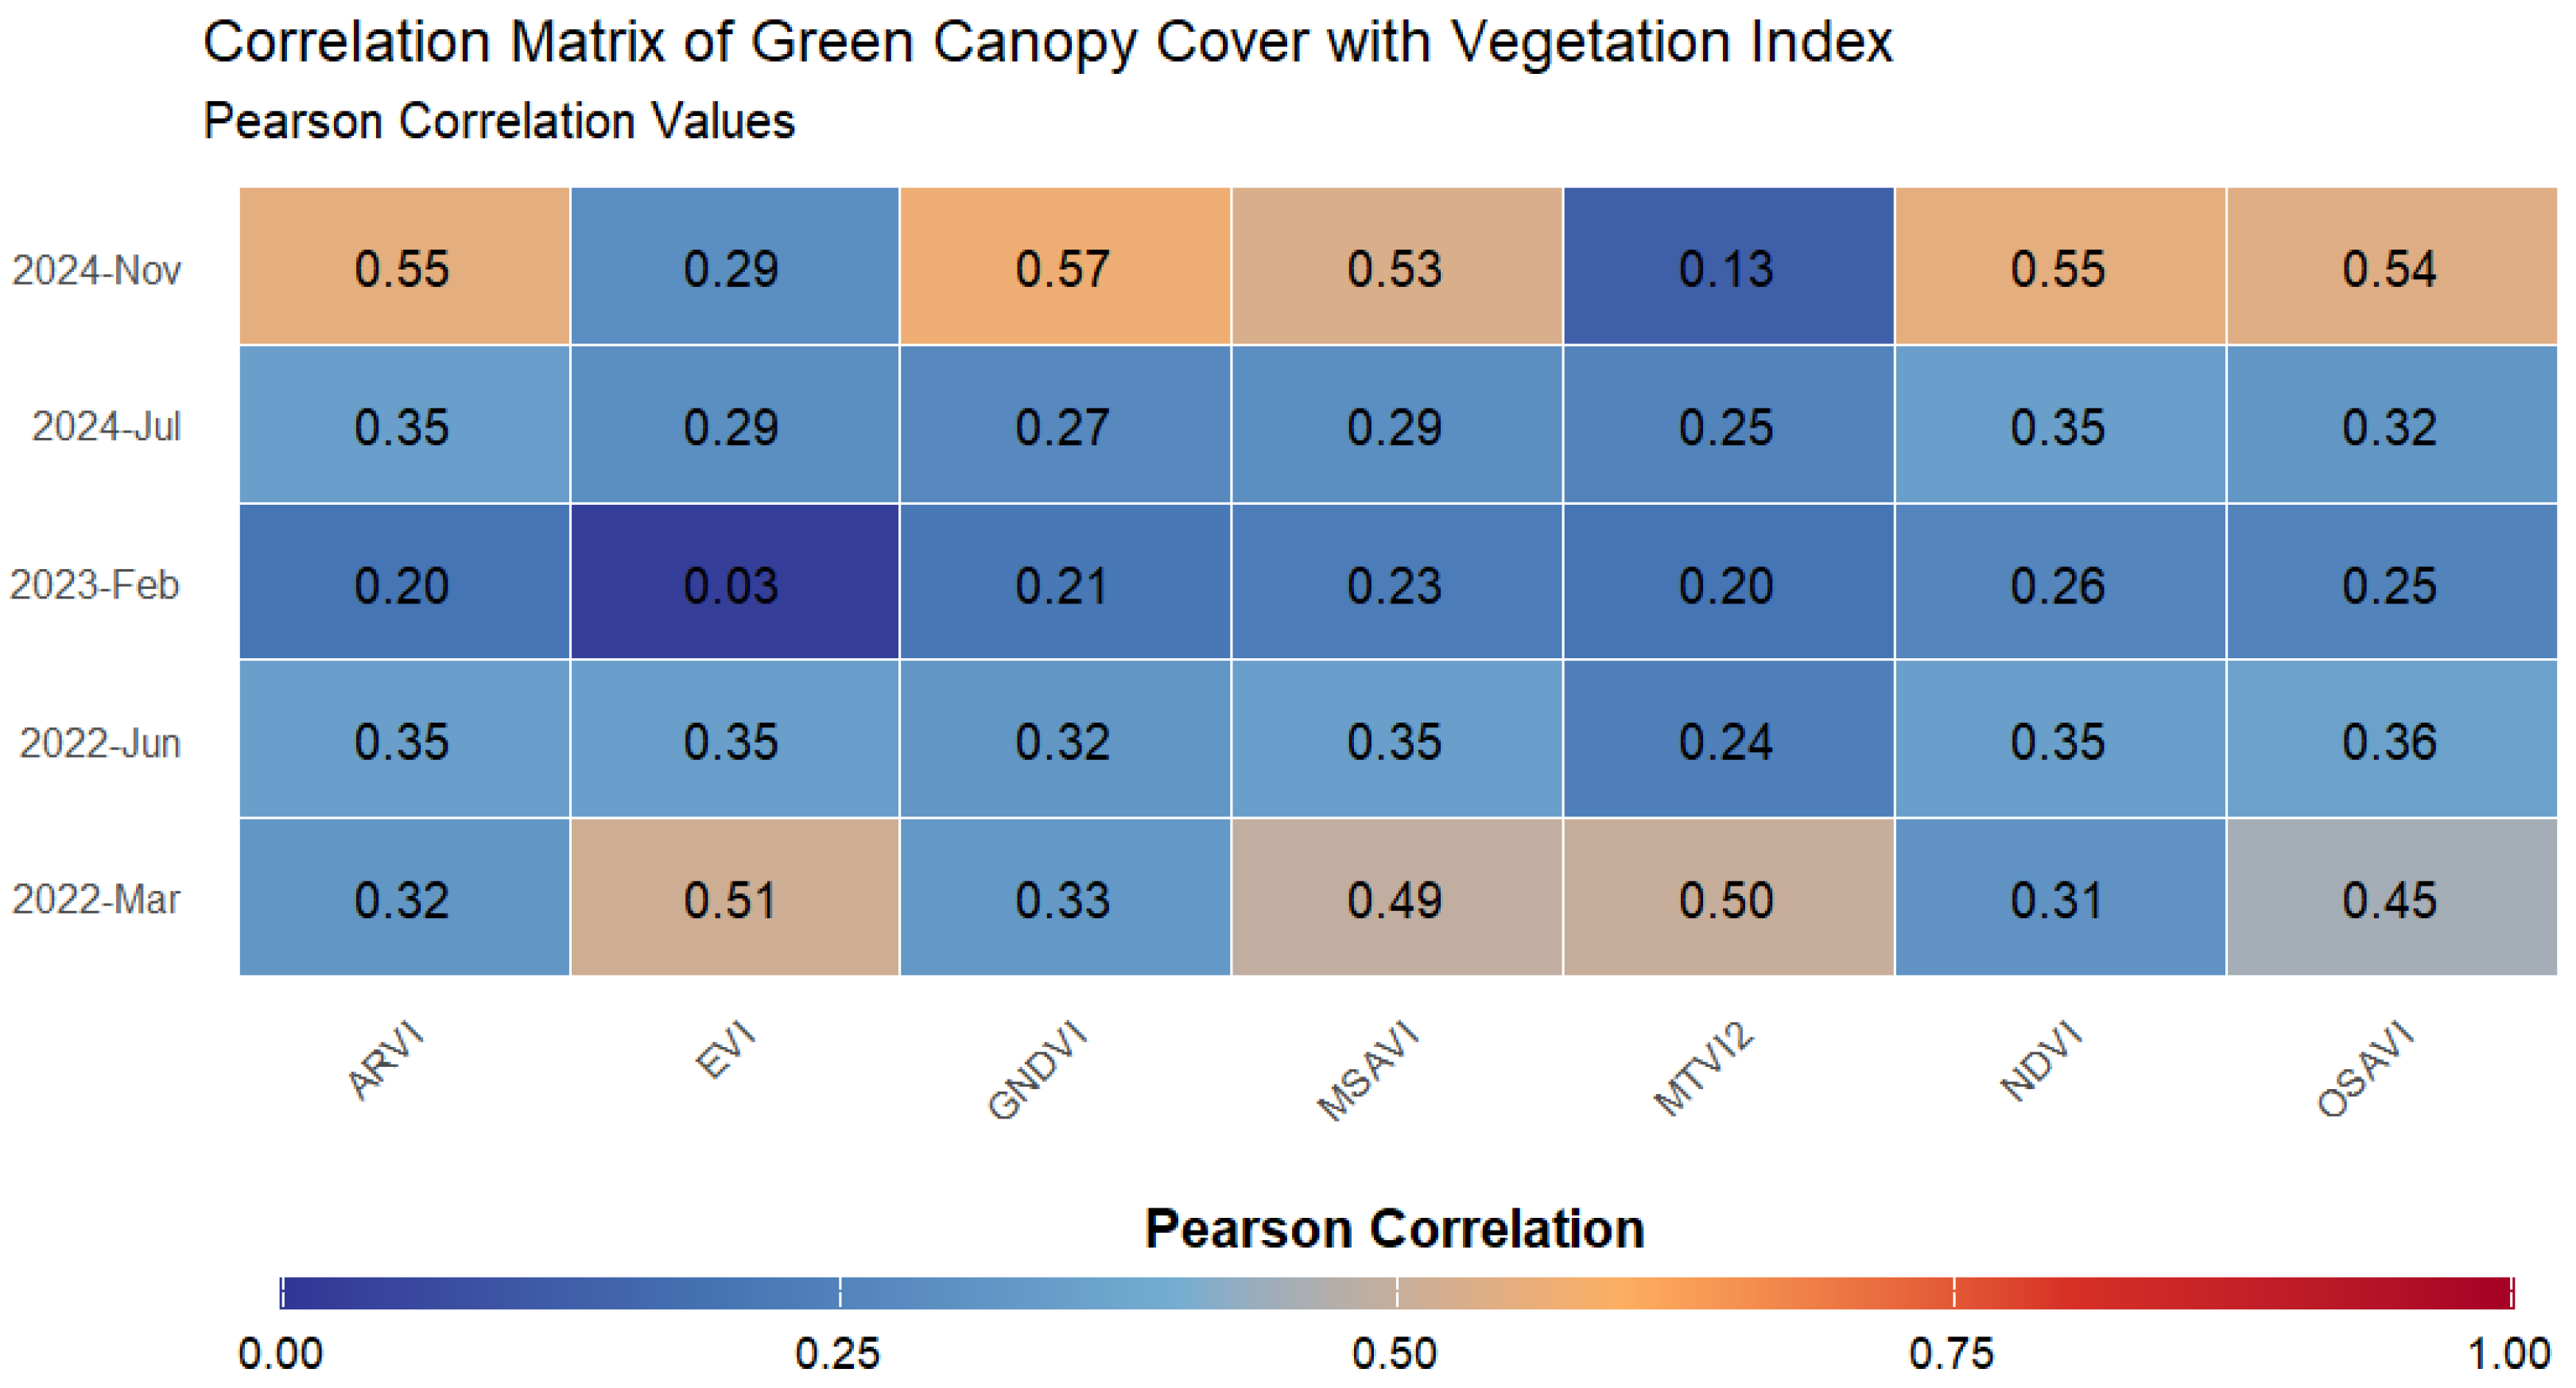
Figure 4.
UAV imagery showing rubber tree canopy changes across normal seasons, natural leaf fall, and Pestalotiopsis outbreaks from 2022 to 2024: (upper) natural composite, (lower) false composite.
Figure 4.
UAV imagery showing rubber tree canopy changes across normal seasons, natural leaf fall, and Pestalotiopsis outbreaks from 2022 to 2024: (upper) natural composite, (lower) false composite.
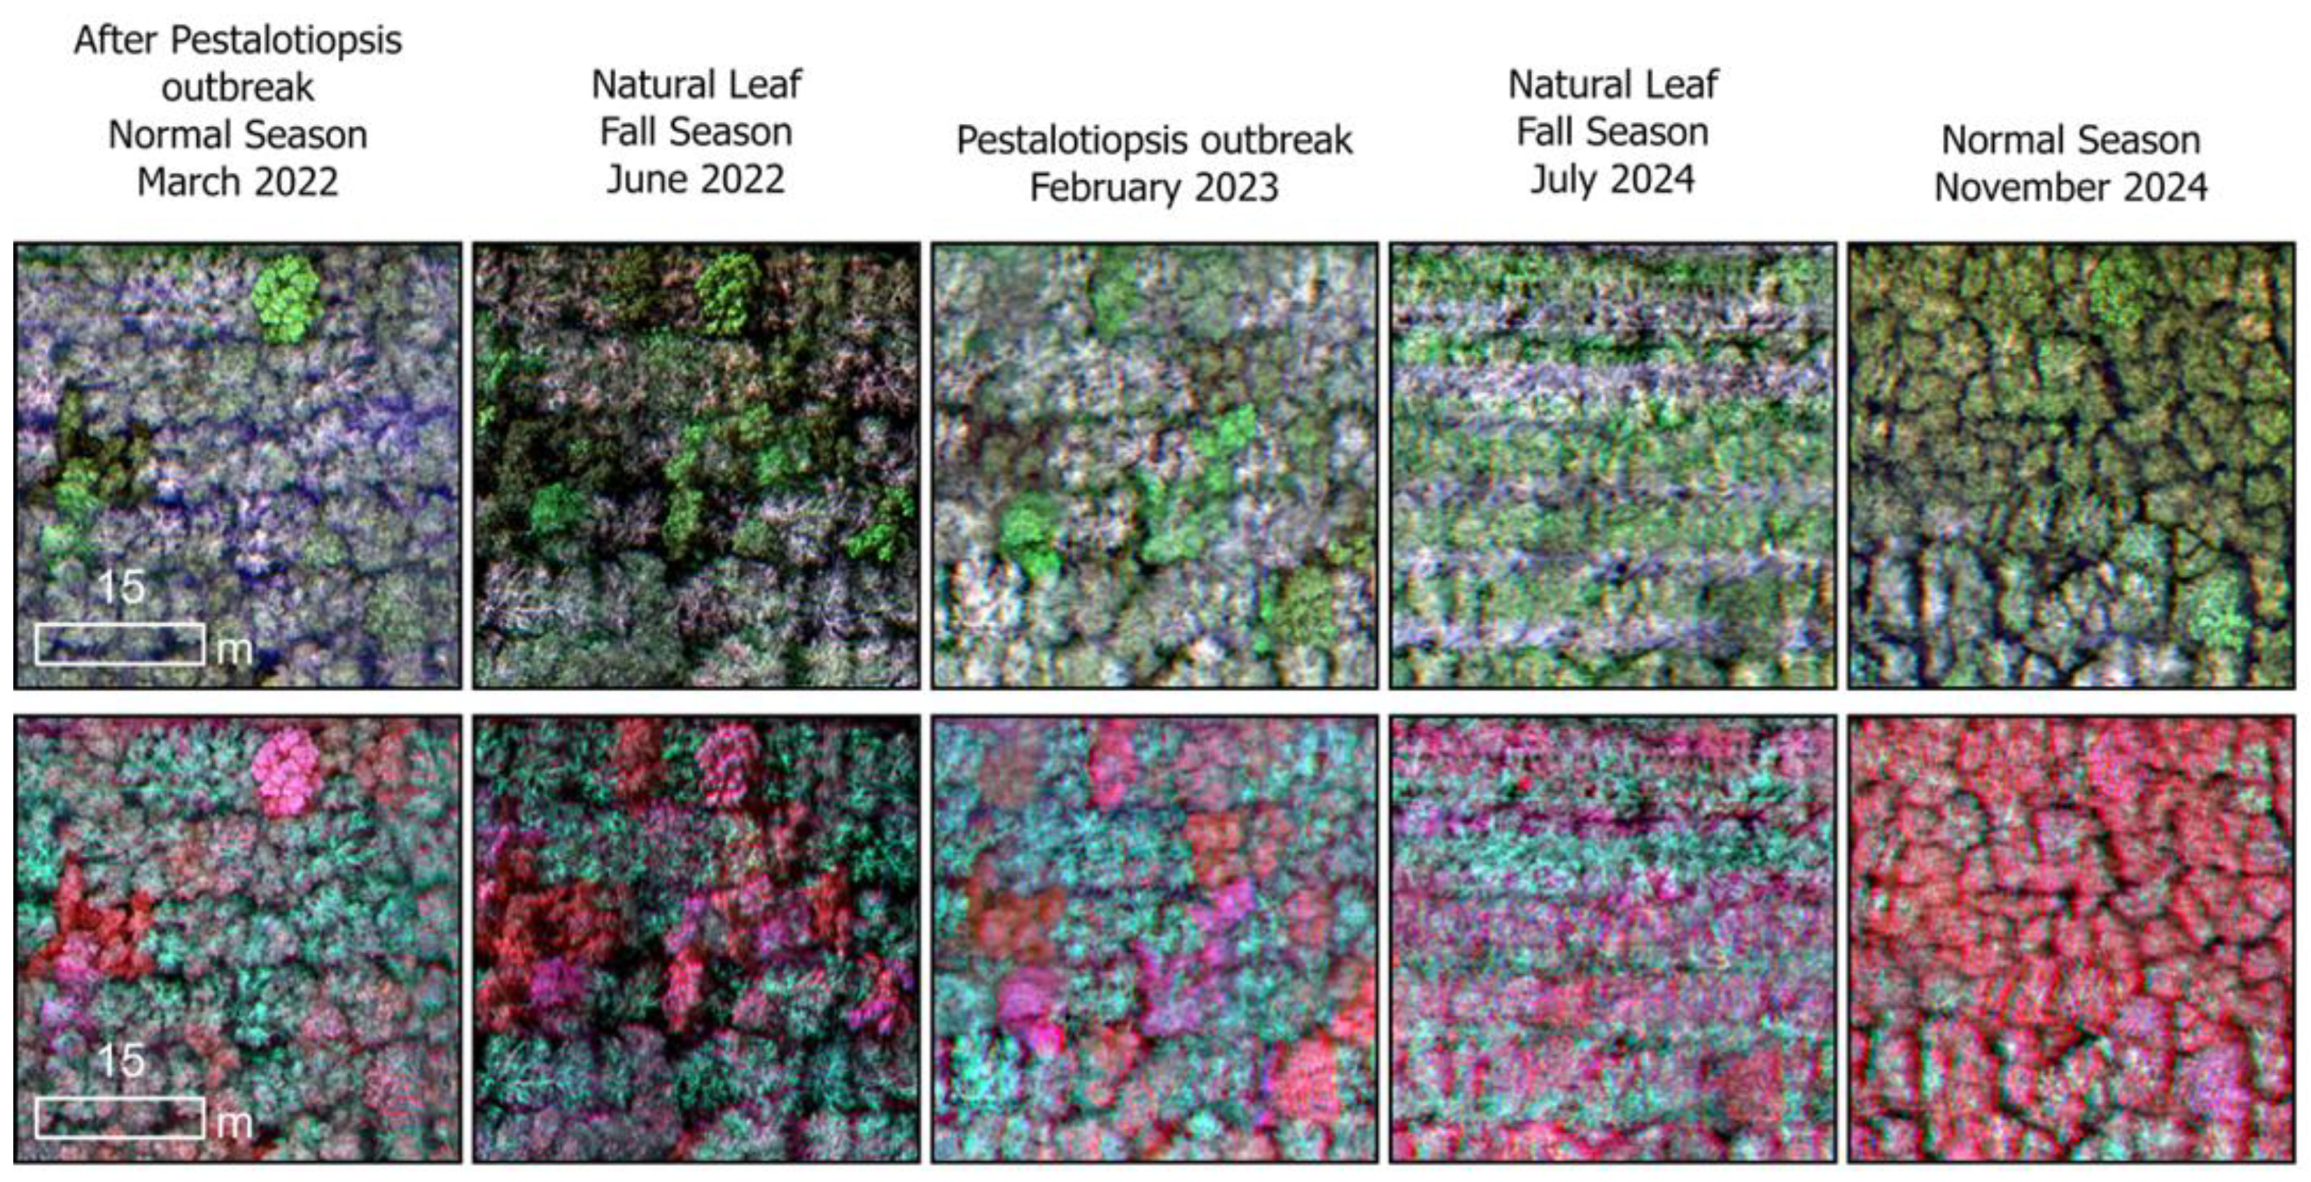
Figure 5.
Scatterplot of measured versus predicted green canopy density (%) across five different periods: March 2022 (normal season after Pestalotiopsis outbreak), June 2022 (natural leaf fall season), February 2023 (Pestalotiopsis outbreak), July 2024 (natural leaf fall season), and November 2024 (normal season). Each color represents a different survey period, with performance metrics (RMSE and R²) indicating the model’s prediction accuracy. The orange line represents the ideal 1:1 relationship between measured and predicted values.
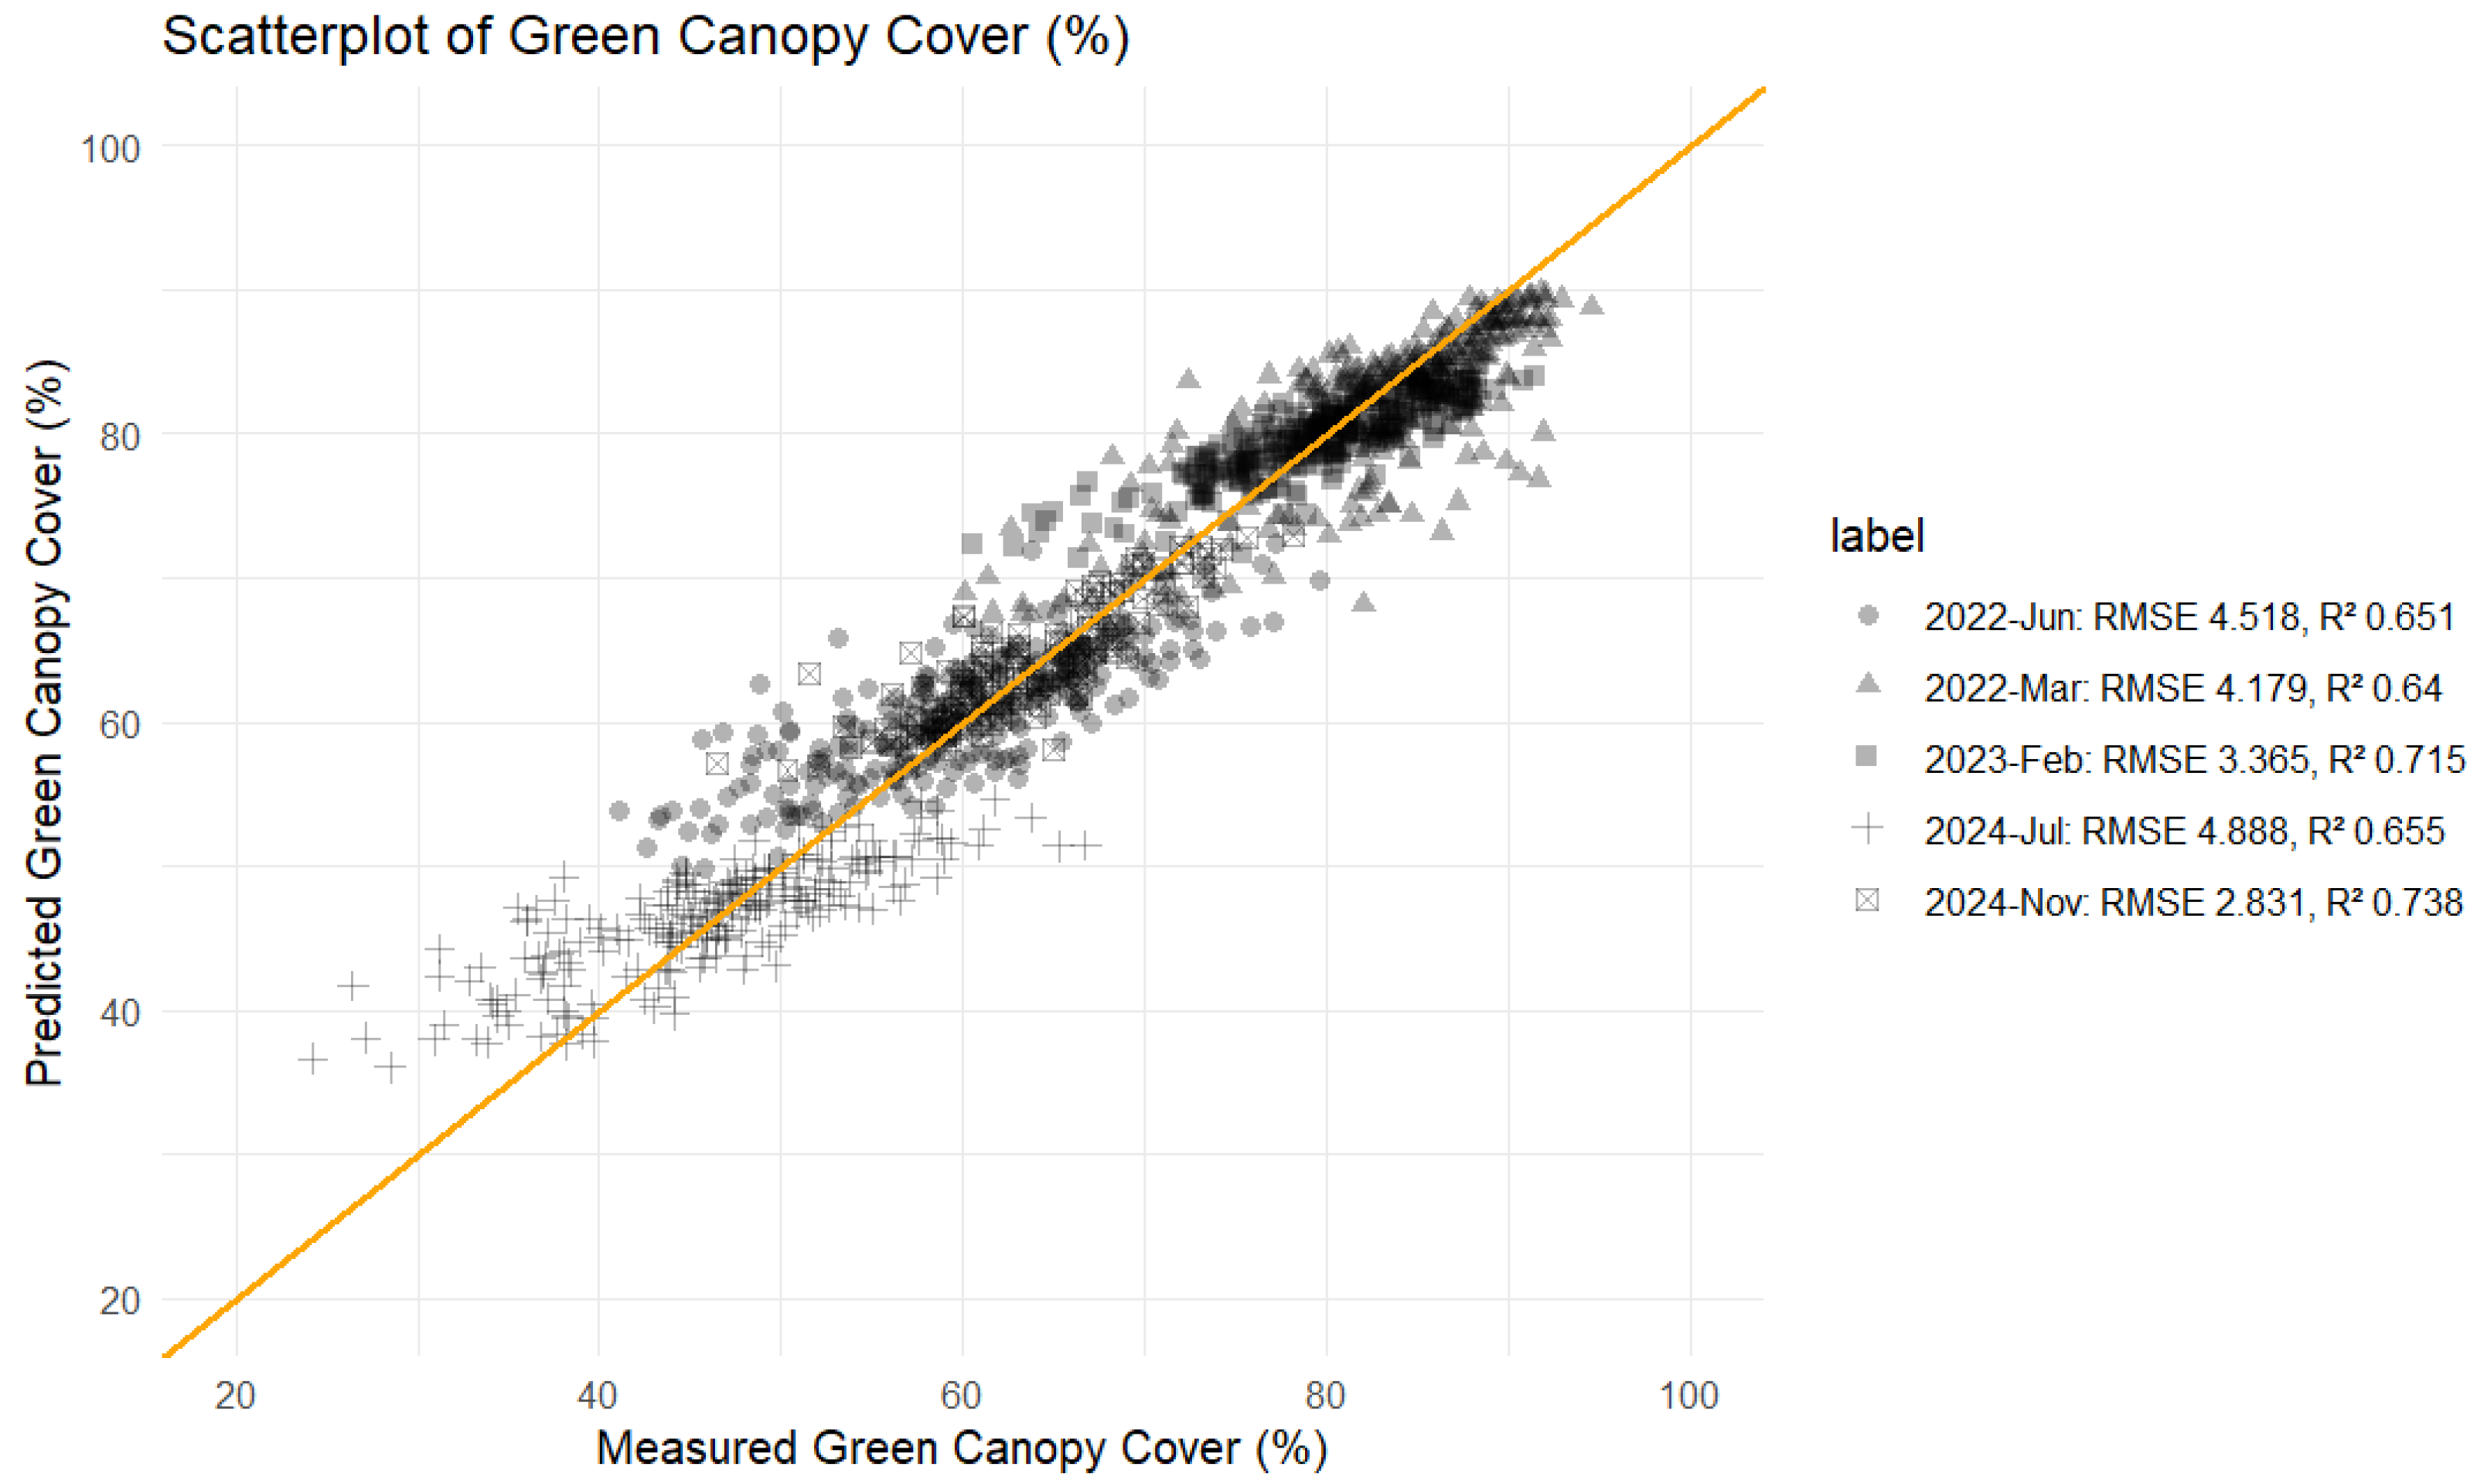
Figure 6.
Canopy Density Map at 2011G2 Block. The upper row presents pixel-based canopy density maps, while the lower row displays corresponding UAV imagery used for validation within the sample grid of Block 2011G2. The color scale at the bottom, ranging from 50 (yellow, indicating lower canopy density) to 100 (green, representing higher canopy density), visually depicts the spatial variations in canopy coverage across the study area.
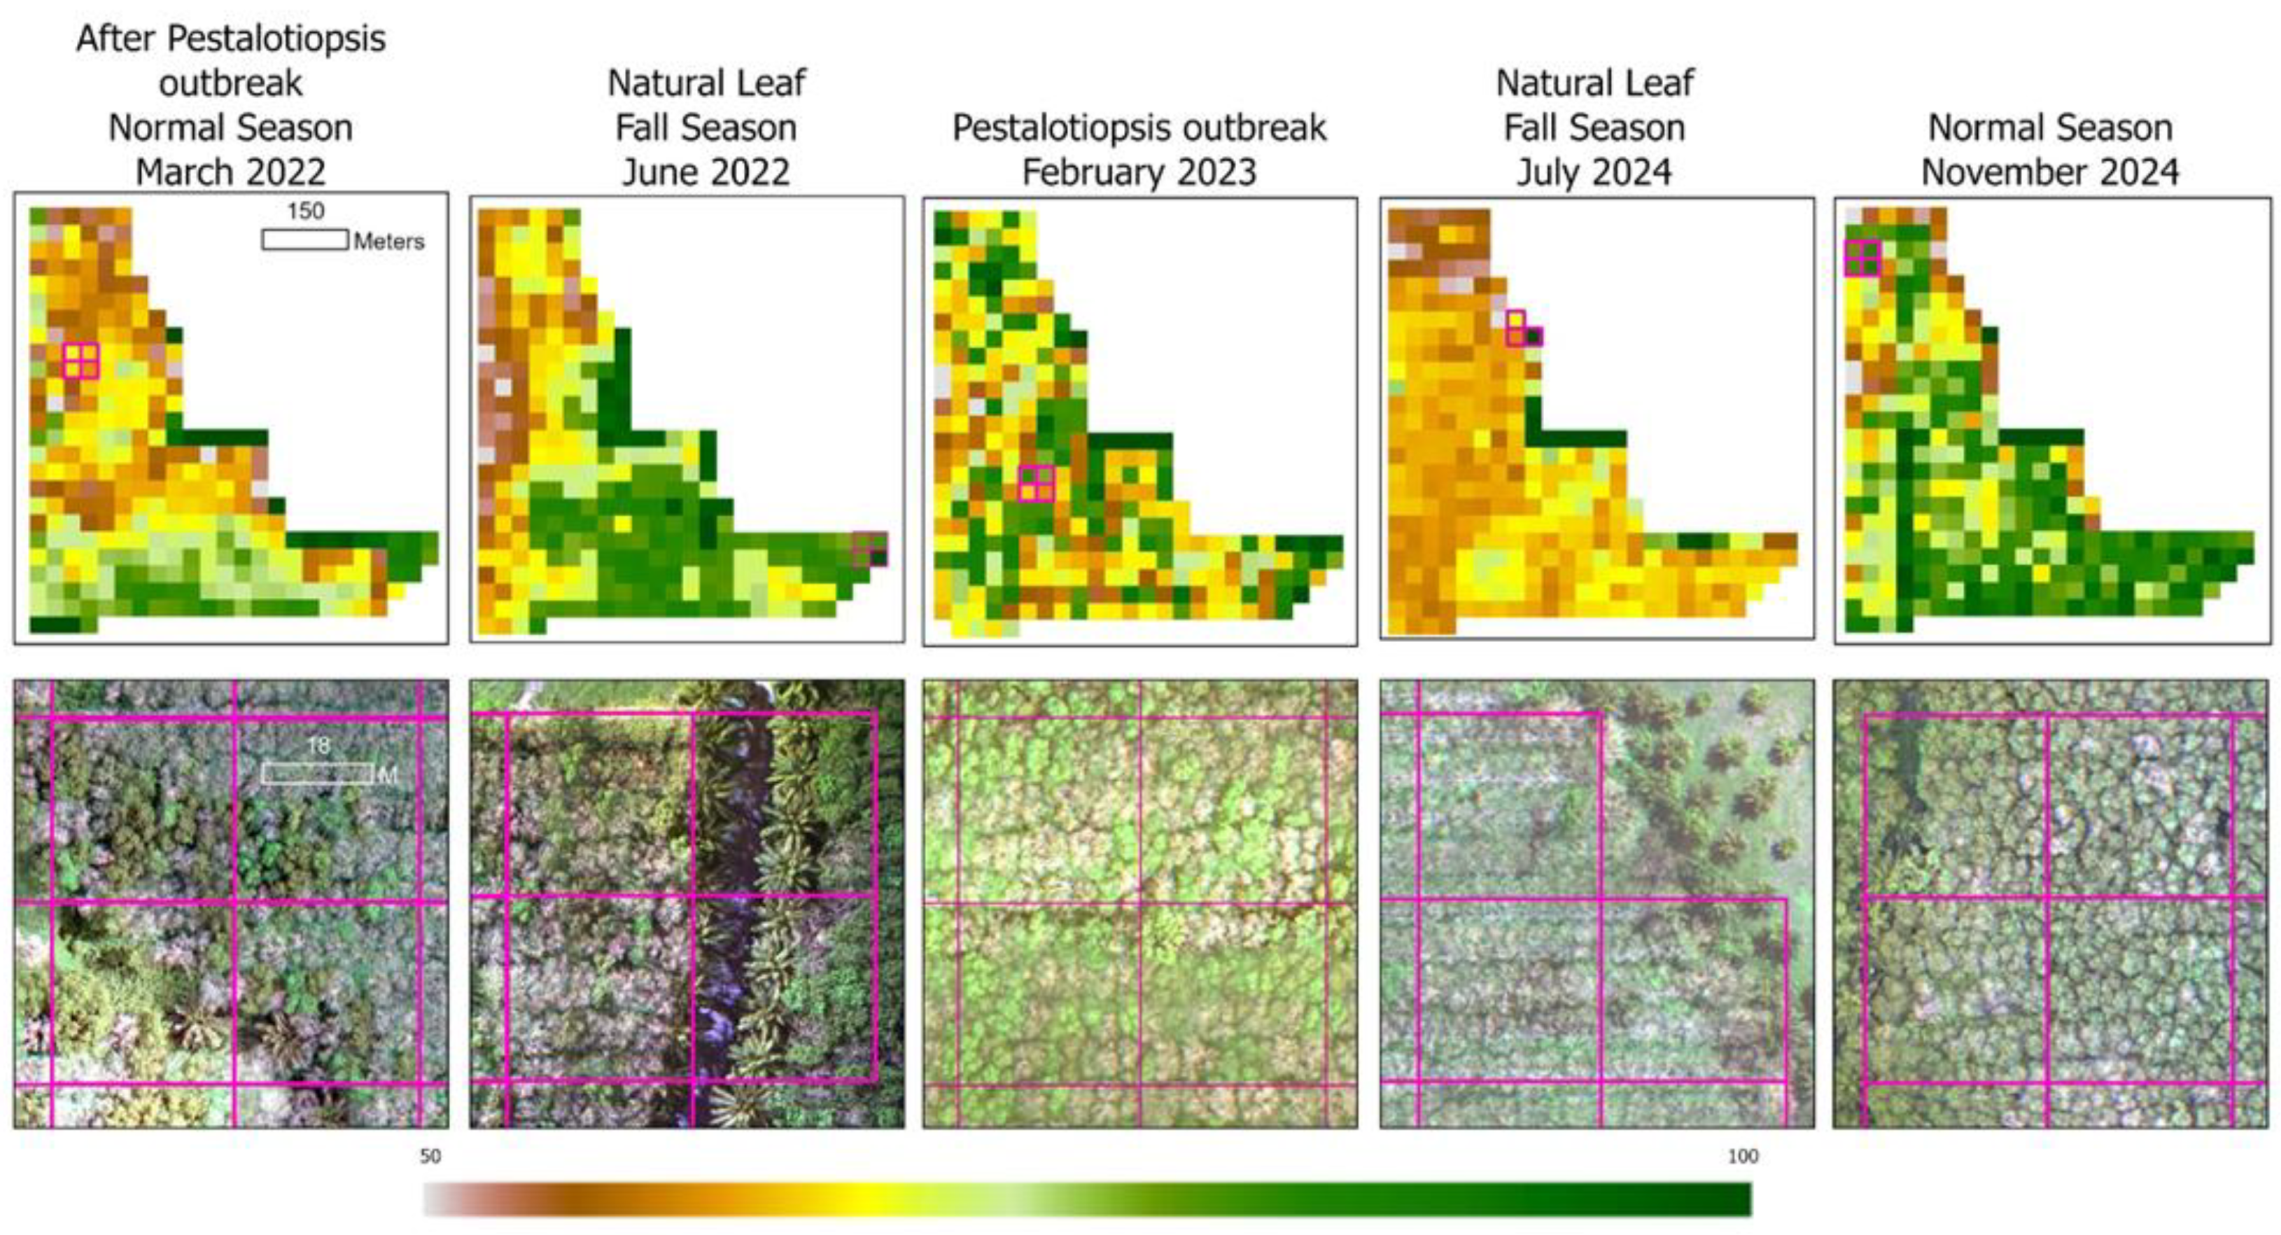
Table 1.
Research Data and Variables.
| Variable | Data Source | Time Frame | Spatial & Temporal Resolution |
| Tree Properties (Height, Diameter, Canopy Density, Photo) | Field Survey | 25-28 March 2022 8-12 June 2022 7-13 February 2023 1-5 July 2024 |
– |
| UAV Imagery | 25-28 March 2022 8-12 June 2022 7-13 February 2023 1-5 July 2024 6-11 November 2024 |
10cm | |
| Vegetation Index |
Sentinel-2A (ESA) | 2022–2024 | 10m, 5 Day |
| Sentinel-2B (ESA) | |||
| Landsat-7 (USGS) | 30m, 16 Day | ||
| Landsat-8 (USGS) | |||
| Landsat-9 (USGS) | 2022–2024 |
Table 3.
Model prediction performance.
| Model | Training | Testing | ||||||
| RMSE | MAE | R2 | Adj. R2 | RMSE | MAE | R2 | Adj. R2 | |
| RF | 3.01 | 2.24 | 0.96 | 0.96 | 6.46 | 4.97 | 0.82 | 0.81 |
| SVM | 6.67 | 5.04 | 0.81 | 0.8 | 6.62 | 5.12 | 0.81 | 0.8 |
| CART | 7.06 | 5.3 | 0.78 | 0.78 | 7.78 | 5.66 | 0.74 | 0.72 |
| Linear Regression | 9.13 | 6.99 | 0.64 | 0.63 | 9.04 | 7.17 | 0.64 | 0.62 |
Disclaimer/Publisher’s Note: The statements, opinions and data contained in all publications are solely those of the individual author(s) and contributor(s) and not of MDPI and/or the editor(s). MDPI and/or the editor(s) disclaim responsibility for any injury to people or property resulting from any ideas, methods, instructions or products referred to in the content. |
© 2025 by the authors. Licensee MDPI, Basel, Switzerland. This article is an open access article distributed under the terms and conditions of the Creative Commons Attribution (CC BY) license (http://creativecommons.org/licenses/by/4.0/).
Copyright: This open access article is published under a Creative Commons CC BY 4.0 license, which permit the free download, distribution, and reuse, provided that the author and preprint are cited in any reuse.


