Submitted:
19 March 2025
Posted:
20 March 2025
You are already at the latest version
Abstract
Understanding how extreme weather events (EWEs) impact vegetation phenology is crucial for assessing ecosystem stability under climate change. This study systematically investigated the ecosystem growing season length (GL) response to four types of EWEs- extreme heat, extreme cold, extreme wetness (surplus precipitation), and extreme drought (lack of precipitation). The EWEs extremity thresholds were found statistically using detrended long time series (2000-2022) ERA5 meteorological data through z-score transformation. The analysis was based on grassland ecosystem in the Mongolian Plateau (MP) from 2000 to 2022. Using solar-induced chlorophyll fluorescence data and event coincidence analysis, we evaluated the probability of GL anomalies coinciding with EWEs and assessed vegetation sensitivity to climate variability. Our results showed negative GL anomalies exhibited a stronger association with EWEs than positive anomalies, particularly in arid and cold regions of the MP, where extreme drought and extreme cold events predominantly shortened the GL. Conversely, extreme heat and extreme wet events played dominant role in warmer and wetter regions, influencing both GL lengthening and shortening. The regional background hydrothermal conditions modulated vegetation sensitivity, with warmer regions being more susceptible to extreme heat stress and drier regions exhibiting higher vulnerability to extreme drought conditions. Furthermore, grassland ecosystems demonstrated lower resilience to extreme drought than forest ecosystems likely due to differences in root structure and water use efficiency. These findings emphasize the importance of regional weather variability and climate characteristics in shaping vegetation phenology and provide new insights into how weather extremes impact ecosystem stability in semi-arid and arid regions. Future research should explore extreme weather events and the role of human activities to enhance predictions of vegetation-climate interactions in grassland ecosystems of the MP.
Keywords:
Cold
; Extreme drought
; Event Coincidence Analysis
; Extreme heat
; Phenology
; Solar-Induced Chlorophyll Fluorescence
; Extreme wetness
1. Introduction
Amid ongoing global change and increased radiative forcing, the probability of weather anomalies and extreme weather events (EWEs) shows a persistent upward trend everywhere in the world [1,2,3]. These changes not only alter global climate patterns but also have profound impacts on plant growth cycles, ecosystem productivity, and key ecological processes such as the carbon cycle [4,5,6].
Vegetation phenology captures plant growth dynamics influenced by weather conditions [7,8]. It is highly sensitive to long term climatic variations and is thus considered one of the best indicators of ecosystem dynamics [9]. Vegetation phenology can be assessed through SOS (start of season), EOS (end of season), and GL (growing season length). Changes in vegetation phenology can significantly impact growth and reproduction patterns of species, which in turn influences material cycling and biodiversity within ecosystems and their essential ecosystem services, such as water regulation and soil conservation [10]. Vegetation phenology and growth are tightly linked through photosynthesis providing cellular structure buildings. During photosynthesis, light is re-emitted from the chlorophyll molecules in leaves as a “side-effect” called Sun induced chlorophyll fluorescence (SIF) [11,12]. The level of the emitted chlorophyll fluorescence indicates the plant’s health, energy production power, and overall conditions within an ecosystem through climatic changes when monitored over time [13,14]. Balde et al. (2024) and Martini et al. (2022) investigated the effect of EWE- extreme heat in Europe on evergreen broadleaved trees characterized with a relatively invariant canopy structure using field-scale SIF and both found inverted relationship between photosynthesis and fluorescence, showing highly nonlinear protective mechanism of the plants from the adverse effects of high light intensity, and also both SIF and growth variations and their relationships to depend on the temporal scale [15,16]. Against traditional measurements at small spatial and temporal scale, remote sensing observed SIF with satellites provides valuable data for large scale analyses.
The Mongolian Plateau (MP) is one of the world’s largest and exhibits a predominantly semi-arid to arid climate regime [17,18]. Situated at the periphery of the East Asian monsoon weather system, this region demonstrates pronounced seasonality with prolonged cold winters and brief hot summers, coupled with marked precipitation variability [19,20]. These climatic features make the MP ecosystems highly sensitive to climate change, gradually becoming one of the most climate-sensitive regions in the world [21,22]. The MP has witnessed a marked escalation in both the occurrence and the severity of EWEs over recent decades, triggering substantial impacts on its fragile ecosystems [23,24,25,26]. EWEs such as extreme heat or cold wave, heavy precipitation and various droughts have posed serious challenges to the stability of the ecosystems, accelerating soil erosion, vegetation cover loss, and soil moisture depletion, and potentially disrupting the normal phenological cycles of vegetation [27,28,29]. Previous research on MP vegetation phenology predominantly explored EWEs impacts on SOS and EOS, while their effects on GL remain understudied. Increasing evidence suggests that GL is directly related to ecosystem carbon sequestration capacity, with a longer GL promoting plant growth and photosynthesis, thereby enhancing carbon fixation and storage [30,31,32,33]. Additionally, variations in GL are closely linked to water use efficiency, with a longer growing season facilitating more efficient soil water utilization and improving plant drought resistance [34,35,36]. In the context of climate change, alterations in GL duration, whether prolonged or shortened, could lead to changes in ecosystem carbon sink function, thereby impacting the global carbon cycling and the climate system [37,38]. Therefore, investigating the response of GL, alongside SOS and EOS, to EWEs is crucial for understanding the relationship between plant growth cycles and climate change, and for providing scientific guidance in addressing climate change.
Event coincidence analysis (ECA) is a key methodology for evaluating vegetation responses to extreme climate impacts [39]. Unlike traditional statistical methods such as linear regression, which focus on examining the overall relationship between two variables, ECA specifically investigates the probability of concurrent occurrences of multiple events. This makes ECA particularly suited for exploring the direct response of GL to EWEs.
This study employed SIF data and quantified four EWEs to evaluate ecosystem GL responses on short-term weather dynamics and long-term climate change in the MP over 2000–2022 with focus mostly on grassland as the dominant ecosystem. The key objectives included: (1) characterizing spatiotemporal patterns of grassland phenology; (2) quantifying coincidence probabilities between GL anomalies and EWEs using ECA; and (3) determining GL sensitivity gradients to EWE intensity variations.
2. Materials and Methods
2.1. Study Area
The MP is located in the central hinterland of Asia with significant geographical extent on the Asian continent (Figure 1). Encompassing Mongolia and China’s Inner Mongolia Autonomous Region, the MP extends between latitudes 37°46′-53°08′N, and longitudes 87°40′-122°15′E, with a total land area of approximately 3.5 million square kilometers.
The MP is a typical plateau region, characterized by prominent mountain ranges in the west and north, where elevations are relatively high, whereas the eastern and southern parts are comparatively flat (Figure 1a). Dominant vegetation type is grassland, with overall vegetation coverage being relatively low due to the region’s arid climate. The northeastern plateau supports savanna ecosystems, contrasting with sparse grasslands dominating southwestern areas (Figure 1b). A marked north-south thermal gradient governs the region, with elevated southern temperatures and cooler northern zones (Figure 1c), shaped by topographic complexity and seasonal dynamics. The continental climate combines aridity, thermal limitations, and pronounced seasonality. Precipitation patterns show east-south distribution (Figure 1d), with western-northern zones receiving minimal rainfall; over 60% of annual precipitation falls during summer months.
2.2. Datasets
2.2.1. Climate Datasets
This study utilized the ERA5 reanalysis temperature and precipitation dataset (European Centre for Medium-Range Weather Forecasts) to assess vegetation responses to EWEs. Selected for its robust quality control and temporal consistency, ERA5 supports long-term analysis of ecosystem-climate interactions. Extreme temperature thresholds were derived from daily maximum/minimum values rather than averages, as temperature extremes exert stronger controls on vegetation physiology instead of mean conditions [4]. Cumulative precipitation during the growing season (April–September) was analyzed to capture hydrological impacts on vegetation dynamics. All weather variables were temporally aligned with the vegetation growing period.
2.2.2. SIF Vegetation Index Data
The SIF(CSIF) dataset used in this study was derived using a neural network model developed previously [40] and covered the period 2000-2022. This dataset has a temporal resolution of 4 days and a spatial resolution of 0.05° (ca. 4 km over the MP). To ensure spatial consistency with the meteorological data, the SIF data were resampled to 0.1° resolution. The data were obtained from the National Tibetan Plateau Data Center of China (http://data.tpdc.ac.cn).
2.2.3. Land Cover Classification
This study employed MODIS MCD12Q1 V006 (500 m resolution) land cover data, adhering to the International Geosphere-Biosphere Programme (IGBP) classification system. Vegetation was classified into three ecosystem types: forests (30–60% tree cover), dense herbaceous grassland (>60% herbaceous cover <2 m), and sparse herbaceous grassland (10–60% herbaceous cover <2 m). Non-vegetated areas (e.g., urban, water) were excluded. To ensure spatial consistency with the meteorological data, land cover layers were resampled to 0.1° resolution via mode filtering. A 15-year land cover stability threshold (unchanged classification in ≥15 of the 20 years) was applied to minimize temporal variability impacts, enhancing reliability in assessing the vegetation-climate interactions.
2.3. Methods
2.3.1. Extraction of Grassland Phenology
This study utilized the PhenoFit R package [41] to extract phenological metrics from the SIF time series data. PhenoFit employs a weighted curve-fitting approach to reconstruct time series and offers multiple phenological extraction methods. The derivative approach (DER) was selected to identify SOS (start of season) and EOS (end of season). Initially, quality control was performed on the input SIF time series to remove outliers (spike values) and missing values. To further reduce noise, the weighted Whittaker smoothing method [42] was applied as a preliminary curve-fitting step. PhenoFit effectively handles the irregular sampling characteristics of SIF data, making it suitable for datasets with varying temporal resolutions.
Subsequently, the first order DER was used to compute the rate of change in the vegetation index, with SOS and EOS identified as the time points corresponding to the maximum positive and negative rates of change, respectively. The GL (growing season length) was then derived as the difference between EOS and SOS. The DER method effectively captures vegetation growth dynamics and has been widely applied in phenological studies across diverse ecosystems [43]. Compared to traditional threshold-based methods, the derivative approach provides a more accurate representation of SIF change inflection points, thereby avoiding biases associated with arbitrary threshold selection.
2.3.2. Identification of Extreme Weather Events
The study examined four categories of extreme weather events: extreme heat, extreme cold, extreme wetness, and extreme drought. Primary metrics were established using monthly peak temperatures, monthly temperature minima, and cumulative monthly precipitation as diagnostic indicators. To mitigate the influence of longitudinal trends, an initial data processing phase removed long-term trends from growing season data (April-September) through detrending procedure. Annual weather signatures were subsequently derived by aggregating monthly indicator values across the vegetative period. The detection of extremity thresholds employed a z-score transformation methodology. This standardized anomaly approach calculates deviations from climatic norms through the formula: (observed value - multiannual mean)/standard deviation, enabling quantitative evaluation of event severity. The identification framework commenced with detrending of monthly climatic variables, progressed through temporal aggregation of growing season parameters, and ultimately implemented statistical standardization for extremity classification. The formula is as follows:
represents the standardized anomaly, corresponds to the annual parameter value, denotes the multiannual mean, and quantifies the interannual standard deviation. Extreme weather events are classified when temperature or precipitation anomalies exceed ± 1 thresholds: values ≥ +1 indicate extreme heat or pluviosity (positive deviations), whereas ≤ −1 signifies extreme cold or aridity (negative deviations). Vegetation phenology analysis also adopts analogous thresholds, where standardized vegetation index anomalies below −1 are categorized as phenological shortening events, while those exceeding +1 denote lengthening events. This framework facilitates quantitative evaluation of geographically distinct vegetation responses to divergent extreme climate regimes, revealing region-specific mechanistic linkages between climatic stressors and altered phenological dynamics. The systematic detection of phenological shifts under extreme conditions supports spatially explicit impact assessments of vegetation-climate interactions.
2.3.3. Event Coincidence Analysis
This study applied ECA to statistically evaluate the synchronization probability between extreme climatic events and vegetation phenological anomalies. The Coincidence Rate (CR, unitless) was calculated as the ratio of temporally concurrent event pairs (EWEs and GL anomalies) to the total EWEs recorded during the 2001–2021 observation period.
where corresponds to vegetation phenological anomalies and to extreme weather events. The CR, ranging 0–1, quantifies vegetation-climate linkages, with elevated CR values reflecting stronger vegetation responses to weather extremes.
We investigated synchronous occurrences between the four EWEs (heat, cold, wetness, and drought) and vegetation GL anomalies. To distinguish statistically meaningful associations from random alignments, significance testing was conducted through temporal randomization. This involved preserving the original GL anomaly chronology while shuffling EWEs timings, followed by recalculating CR values for 100 randomized permutations to establish baseline coincidence probabilities. Statistical significance was determined by comparing the original CR distribution against randomized counterparts via t-test (p<0.05). This rigorous validation confirmed that observed vegetation-climate event linkages exceeded chance-level fluctuations, ensuring the robustness of the detected relationships.
2.3.4. Sensitivity Analysis
In this study, absolute values of were applied to eliminate directional discrepancies among EWE types (e.g., opposing signs between extreme heat and cold anomalies). This normalization ensured consistent measurement of their absolute impacts on vegetation phenology.
For each pixel across the study period (2001–2021), (in standard deviations) was scaled against anomaly (in standard deviations) for each event type. The ratio was defined as:
The ratio between these variables functions as a vegetation sensitivity indicator to climatic extremes. A positive value signals enhanced vegetation growth during an extreme climate event relative to baseline conditions, whereas a negative value reflects growth suppression. This metric offers a direct quantitative measure of vegetation-climate interaction intensity, clarifying the proportional response of ecosystems to climatic extremes.
3. Results
3.1. Spatial Distribution and Interannual Variation of Vegetation Phenology in the Mongolian Plateau
The spatial patterns of vegetation phenology (SOS, EOS, GL) across the MP during 2001–2020 revealed pronounced regional heterogeneity (Figure 2). SOS exhibited marked latitudinal contrasts: mid-April onset in southwestern areas versus late April–early May in the northeast, with central and southwestern regions delayed to late May–June (Figure 2a). EOS displayed a southwest–northwest decreasing gradient, with a mean value of day 260 in southern Inner Mongolia versus day 220 in western arid areas (Figure 2b). Its distribution followed hydrothermal gradients, linearly increasing from day 230 (−1°C) to day 250 (19°C). For GL, the northeastern humid regions exhibited a longer growing season, with an average duration of 110 days. In contrast, the drier southwestern regions had a significantly shorter growing season, averaging only 50–70 days. In other areas, GL generally ranged between 80 and 100 days (Figure 2c).
A further analysis of the interannual trends in vegetation phenology revealed significant regional variations across the MP (Figure 3). During the period 2001–2020, SOS exhibited a distinct spatial pattern. In the central and northern regions of the plateau, SOS generally showed an increasing trend, indicating a delayed onset of vegetation growth. In contrast, the eastern and southeastern regions exhibited a decreasing trend, suggesting an earlier start of the growing season (Figure 3a). For EOS, changes were relatively minor across most of the study area (Figure 3b). Apart from certain central regions, where EOS increased at a rate exceeding 0.5 days per year, 70.2% of the study area experienced only marginal changes, with EOS trends falling within the range of −0.5 to 0.5 days per year. The GL trend map revealed that 26.2% of the study area experienced a significant increase in growing season length (>0.5 days per year), predominantly concentrated in the southeastern region, indicating a notable extension of the phenological growing season (Figure 3c). Conversely, 17.8% of the study area showed a decreasing GL trend exceeding −0.5 days per year, primarily occurring in the arid regions of the MP, suggesting a shortening of the growing season in these areas.
3.2. Coincidence Analysis of GL and EWEs
We quantified CR between GL anomalies and four EWEs (extreme heat, cold, wet, drought), assessing divergent responses of positive versus negative GL anomalies to climatic extremes (Figure 4). Across the MP, negative GL anomalies exhibited strong association with all EWEs, with 94% of pixels displaying CR> 0.2, and 8.2% of pixels showing an extremely high coincidence rate (CR> 0.8). These high-coincidence regions were predominantly in the arid and low-precipitation areas in the southeastern MP (Figure 4a). For positive GL anomalies, 95.5% of the study area exhibited a CR> 0.2, and 9% of vegetated areas had a CR exceeding 0.8 with EWEs. However, the spatial distribution of high CR values differed from that of negative anomalies, with high-coincidence regions primarily occurring in relatively humid areas in the western and eastern MP (Figure 4b). Overall, in response to extreme climate events, negative GL anomalies exhibited higher coincidence rates than positive GL anomalies, indicating that reductions in growing season length were more strongly associated with weather extremes than growing season extensions.
We further examined the CR values between GL anomalies and individual extreme weather event types, providing a more detailed spatial assessment of their relationships (Figure 5). Across the MP, the dominant extreme weather event type influencing negative GL anomalies varied by region (Figure 5a). In the humid, high-vegetation coverage areas of the northeast, negative GL anomalies were primarily associated with extreme wet conditions. In contrast, in the southern and western regions, where long-term low precipitation is prevalent, extreme drought was the dominant driver of negative GL anomalies. In parts of the northwestern and northern MP, extreme low temperatures played a leading role, whereas in the central MP, extreme high temperatures emerged as the primary climatic factor influencing negative GL anomalies. For positive GL anomalies, the dominant extreme weather event types also exhibited regional variations (Figure 5b). Moreover, spatial patterns of extreme weather impacts diverged between positive and negative GL anomalies, indicating that EWEs may modulate oppositely GL depending on regional climatic conditions.
Our analysis revealed that EWEs predominantly drive GL anomalies across the MP (Figure 6), accounting for 83.7% of negative and 87.4% of positive anomalies. For negative GL anomalies, contributions from extreme drought, wetness, heat, and cold were 18.5, 27, 20.5, and 17.7%, respectively. Their corresponding CR values ranked as: extreme wetness (0.39) > heat (0.38) > drought (0.37) > cold (0.36). Positive GL anomalies exhibited distinct EWE contributions: drought (15.1%), wetness (27.7%), heat (25.4%), and cold (19.2%), with CR values decreasing from wetness (0.42) to heat (0.38), drought (0.36), and cold (0.35).
3.3. Dependence of the Coincidence Rate on Regional Background Hydrothermal Conditions
In this section, we examine spatial patterns of CR for four EWEs (Figure 7), revealing distinct thermal dependencies. Extreme heat displayed rising CR with higher growing-season temperatures, peaking (CR=0.31) at 21°C, while extreme cold events exhibited declining CR trends despite fluctuations, inversely correlated with thermal gradients. A similar pattern was found for extreme drought and extreme wet conditions. As precipitation levels increased, areas with higher annual average rainfall during the growing season exhibited a progressive decline in the CR of extreme drought. A distinct stepwise downward gradient was observed, with CR values remaining low in regions where annual growing season precipitation exceeded 200 mm. For extreme wet conditions, a reverse trend was evident. As precipitation levels increased, regions became increasingly influenced by extreme wet events, leading to a gradual rise in CR values. A clear gradient shift was observed, with regions experiencing more than 250 mm of annual precipitation during the growing season showing higher susceptibility to extreme wet conditions. In these areas, CR values consistently exceeded 0.2, indicating a greater influence of extreme wet events on vegetation phenology.
Similarly, we analyzed the dependence patterns of the coincidence rate (CR) for the four types of extreme weather events on background hydrothermal conditions in relation to positive GL anomalies (Figure 8). Notably, whether under a precipitation gradient or a temperature gradient, the CR of extreme weather events exhibited distinct trend variations in response to background hydrothermal conditions. However, these trends followed an opposite pattern compared to those observed in negative GL anomalies. Specifically, under the temperature gradient, extreme high-temperature events exhibited higher CR values in regions with lower annual average temperatures during the growing season, reaching a maximum of 0.3. In contrast, for extreme low-temperature events, CR values showed strong fluctuations, similar to the pattern observed in negative GL anomalies. Along with precipitation gradients, extreme drought CR increased with higher annual precipitation but remained lower in arid zones. Extreme wet conditions exhibited a reverse trend, with CR peaking in drier regions and declining in humid zones.
In summary, the analysis reveals the distribution characteristics of CR values of GL anomalies caused by extreme weather based on local background hydrothermal conditions in the MP. The study found that when extreme high temperature or extreme wetness events occur in areas with higher annual mean temperature or higher precipitation during the growing season, the possibility of GL shortening is higher. Similarly, when extreme drought events occur in areas with less precipitation, the possibility of GL shortening is higher. On the contrary, in areas with lower annual mean temperature or less precipitation during the growing season, the possibility of GL lengthening is higher when extreme high temperature or extreme wetness occurs.
3.4. Sensitivity of GL to Extreme Climate Events During the Growing Season
Vegetation GL sensitivity to EWEs displayed marked spatial heterogeneity across the MP (Figure 9). Extreme cold events induced GL suppression (negative sensitivity) in 56.4% of pixels, with the strongest reductions clustered in northwestern regions. Conversely, extreme heat triggered widespread GL enhancement (positive sensitivity), spatially mirroring cold-event impacts. Extreme wetness promoted GL in 42.5% of pixels, particularly in the northeast, whereas drought caused GL shortening in 43.2% of areas, highlighting water limitations on phenological duration. These results demonstrate region-specific vegetation responses to EWEs, with opposing event types (e.g., heat vs. cold, wet vs. drought) generating contrasting GL anomalies within shared geographic contexts.
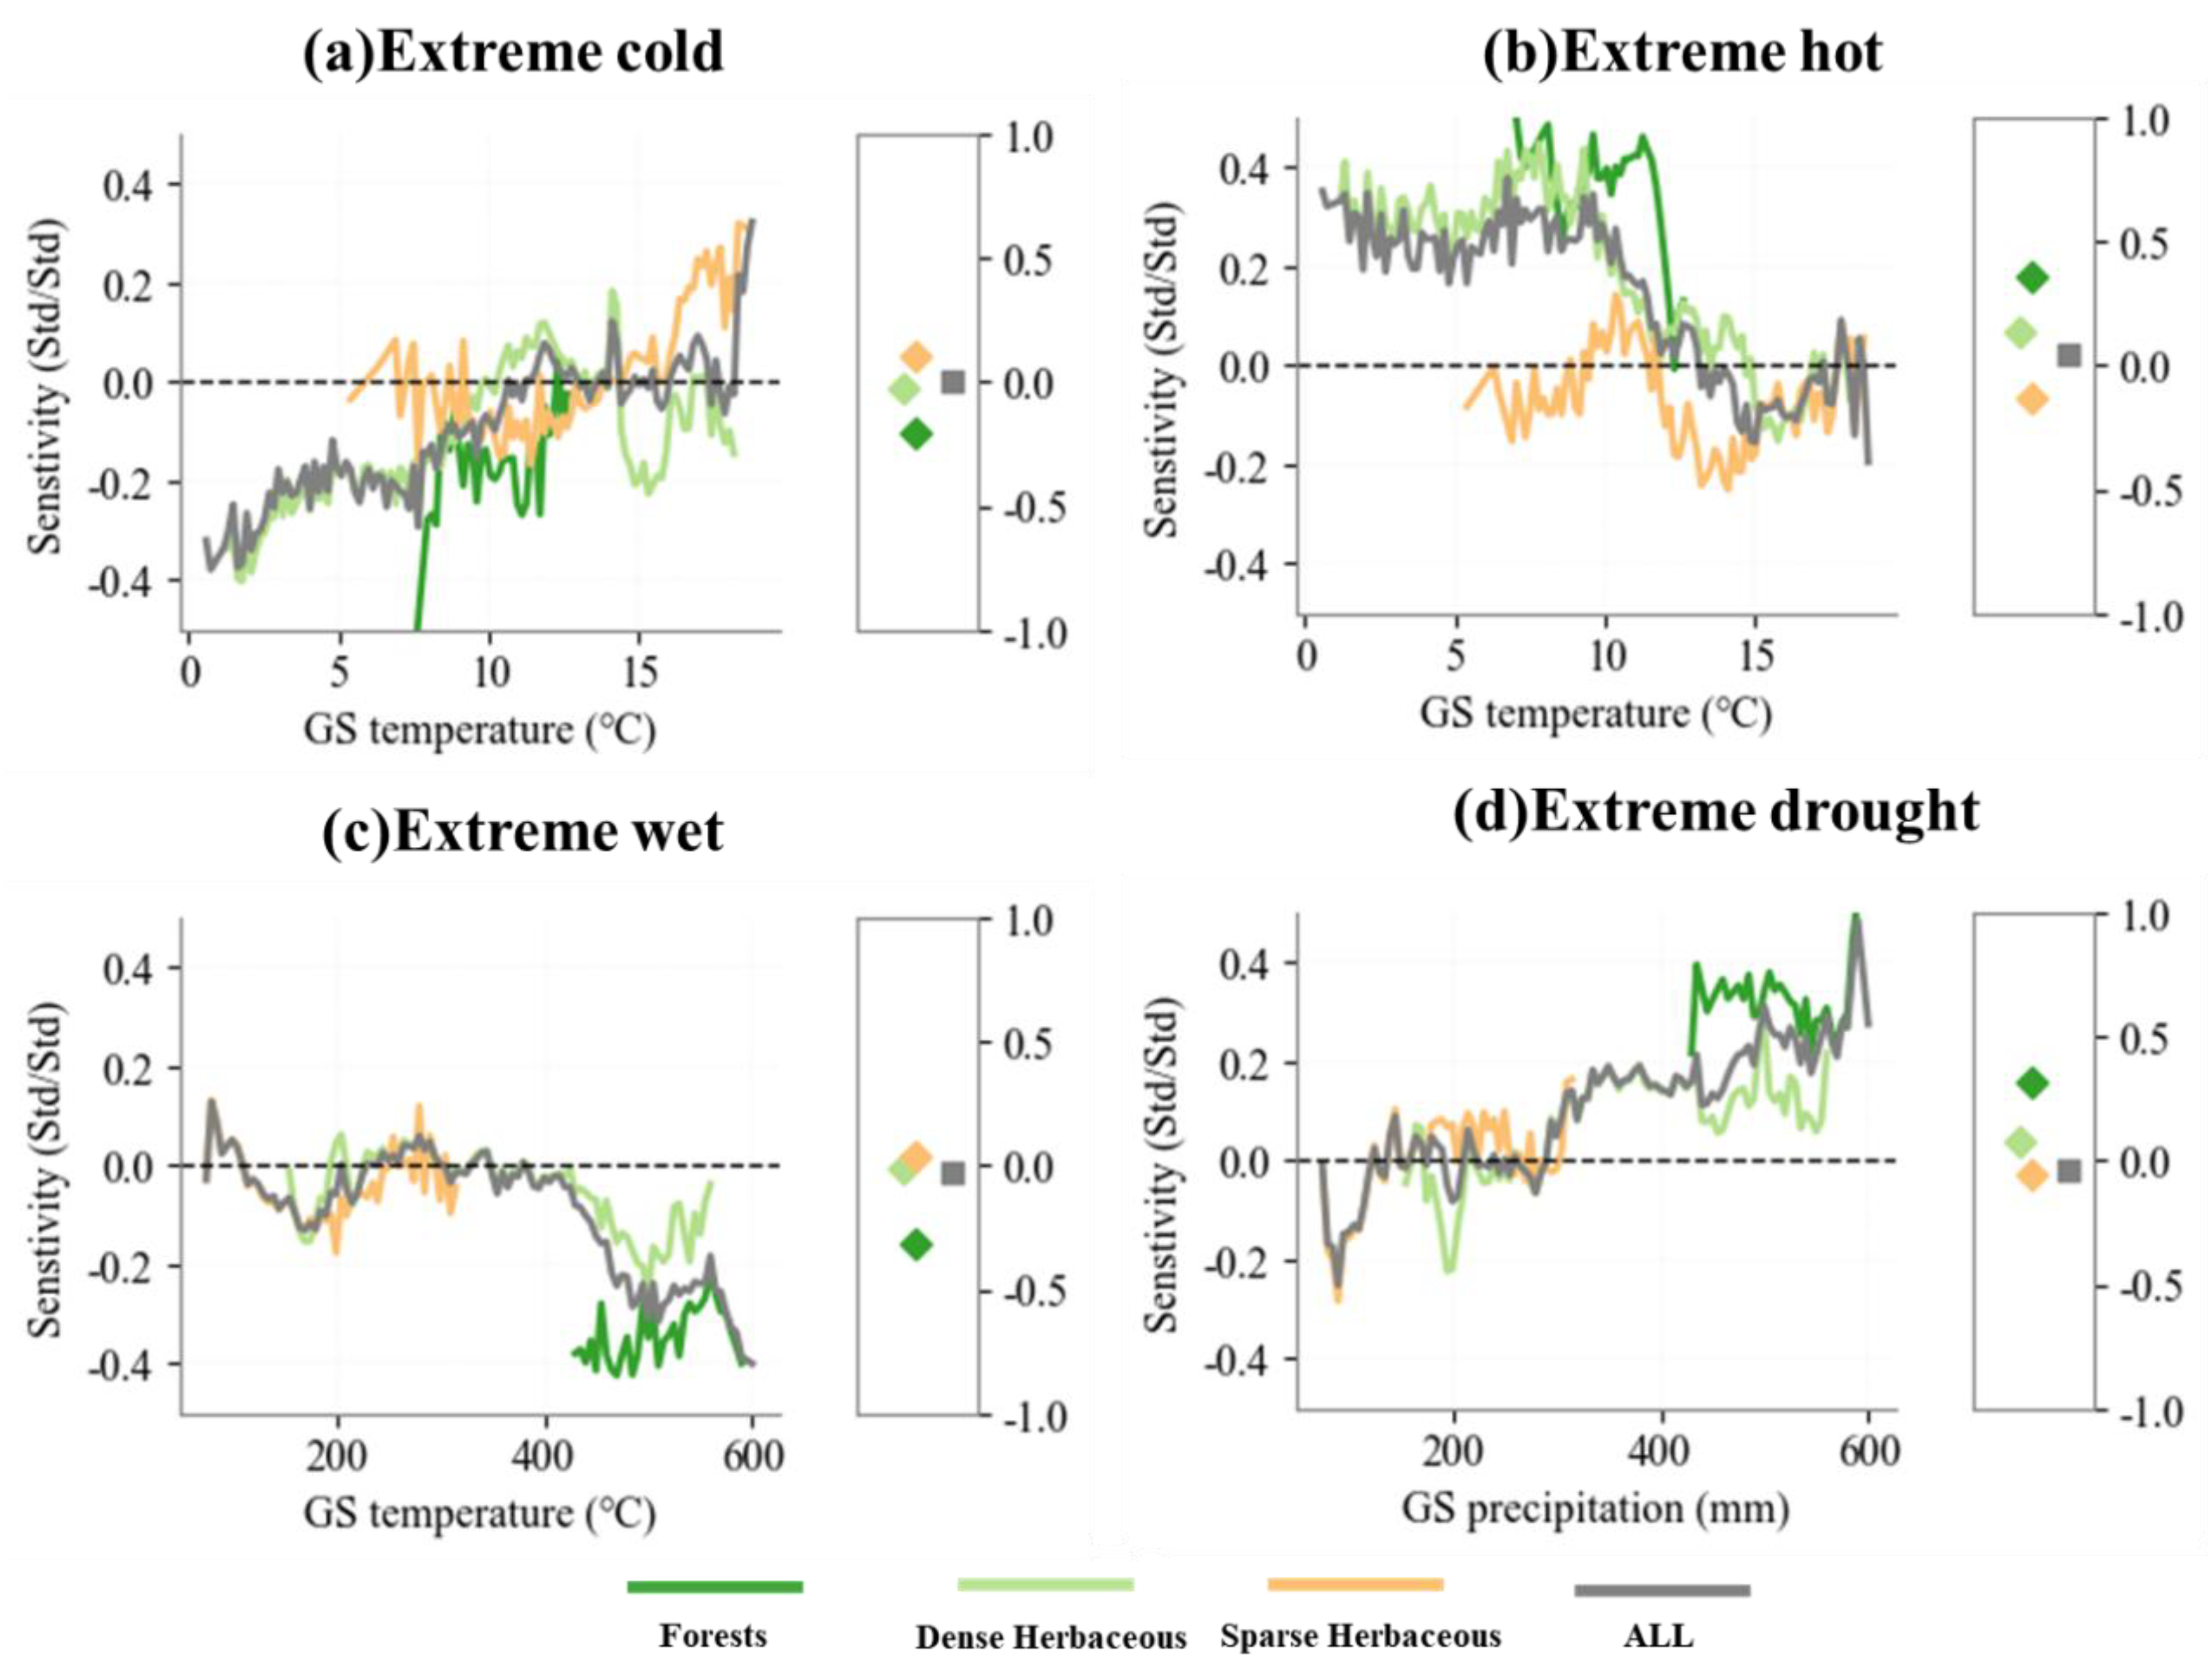
Subsequent analysis demonstrates vegetation type-specific sensitivity to EWEs aligns with regional hydrothermal gradient-driven CR variations (Figure 10). For extreme low-temperature events, when growing season temperatures are below 12°C, extreme cold conditions have an abnormal suppressive effect on vegetation growing season length (GL), leading to GL shortening. However, as temperature increases, the influence of extreme low-temperature events shifts from an inhibitory to a promotive effect on GL extension. In contrast, for extreme high-temperature events, the sensitivity of vegetation phenology exhibits a symmetrical distribution relative to that of extreme low-temperature events. When growing season temperatures exceed 12°C, extreme heat conditions promote GL extension, whereas at temperatures below 12°C, GL is shortened by extreme high temperatures. For extreme wet and extreme dry events, sensitivity patterns follow the precipitation gradient. Extreme wet conditions exhibit an increasingly inhibitory effect on GL as precipitation increases, whereas extreme drought conditions have the opposite effect, progressively enhancing GL extension as precipitation levels decline.
4. Discussion
4.1. Hydrothermal Modulation of Vegetation Thermal-Hydraulic Sensitivity
This study demonstrates that regional hydrothermal climatic conditions modulate EWE-driven GL variations of grassland ecosystems across large geographical areas such as the MP. Grassland GL sensitivity to extreme wet events was primarily controlled by local hydrological regimes, whereas thermal extremes exerted temperature-dependent impacts governed by baseline climatic conditions. First and more obviously, the sensitivity of vegetation to extreme wet events is closely related to local hydrological conditions. In humid regions, excessive water can inhibit plant growth, leading to root oxygen deficiency and limited photosynthetic activity [44,45], which may also lead to the accumulation of toxic substances such as alcohols and aldehydes, further disrupting the normal physiological functions of plants [46]. In contrast, vegetation in dry regions is susceptible to damage caused by drought [47]. This is because vegetation in arid regions is more dependent on water availability during growth, and even short-term water deficits can cause physiological damage to plants.
Secondly, in warmer regions, GL was more susceptible to damage from extreme heat, whereas in colder regions, it was vulnerable to extreme cold. The SIF data showed higher values in the warm, humid regions where heat extends the growing season, and lower values in the arid/cold regions where heat induces drought stress or exceeds thermal tolerance (Figure 1 and Figure 2). Plants in warmer regions are adapted to high temperatures, but temperatures exceeding their heat tolerance thresholds reduces photosynthesis efficiency significantly [48]. High temperatures cause damage to photosynthetic enzymes, particularly the Rubisco enzyme, reducing carbon fixation and inhibiting photosynthesis [49]. Extreme heat promotes SIF because plants experience saturation of nonphotochemical quenching, causing a change in the allocation of energy dissipation pathways towards SIF (Martini et al., 2021). Low temperatures cause plant cell walls and membranes to lose elasticity, and the water inside the cells freezes, leading to structural damage and disrupting normal metabolic functions [50]. Low temperatures also reduce the efficiency of photosynthesis, affecting chloroplast function, particularly the efficiency of photochemical electron transport and ATP synthesis, which limits plant growth [51].
4.2. Divergent Ecosystem Adaptations to Extreme Drought Under Uniform Precipitation
According to the land cover classes, forest ecosystems had greater drought resistance than grasslands under equivalent precipitation conditions. This difference is closely related to the morphological and physiological adaptations of vegetation [52,53]. Woody plants have deep root systems, allowing effective utilization of deep soil moisture, while thickened xylem conduits and leaf cuticles help reduce transpiration losses [54,55]. Particularly in mixed forests, as species diversity increases, drought resistance also improves, which is closely linked to the complementary water use strategies of different tree species [56]. In contrast, root systems of herbaceous plants- grasslands are relatively shallow compared to forests, making them more dependent on surface soil moisture, resulting in weaker drought resistance [54,57].
The influence of temperature gradients on plant growth shows significant differentiation. Compared to woody plants, herbaceous plants exhibit growth advantages in cold environments. Studies have shown that the optimal photosynthetic temperature threshold for herbaceous plants is lower than that of woody plants [58]. This adaptation is attributed to their short life cycle characteristics, enabling them to maintain metabolic activity at low temperatures by adjusting the concentration of osmotic regulators, such as proline [59,60]. Conversely, woody plants adapt to high temperatures by providing canopy shading, which creates a microclimate and reduces under-canopy temperatures [61]. The increase in Rubisco enzyme activity induced by high temperatures enhances photosynthetic efficiency, allowing woody plants to better tolerate heat [62].
4.3. Research Constraints and Future Study Directions
The study has several points of caution. First, the effects of human activities such as grazing intensity and land-use practices are important factors to affect the vegetation phenology [63,64,65,66]. Overgrazing weakens the grassland’s buffering capacity against extreme weather events by damaging vegetation cover and altering the soil microbial community structure [67,68]. Su et al. investigated the effects of grazing and vegetation type on community characteristics and ecosystem functions, indicating that grazing reduces the cover, height, species richness, and aboveground biomass in meadow and typical grasslands, but has little impact on desert grasslands [26]. Wang et al. (2023) analyzed grazing dataset from 114 counties on the Tibetan Plateau in conjunction with SIF data to assess the impact of grazing intensity on vegetation phenology. Their study found that the sensitivity of the SOS and EOS to grazing intensity decreased as grazing intensity increased. Reducing grazing intensity enhanced soil moisture, resulting in an earlier SOS under moderate grazing levels in spring [69]. Therefore, different grazing intensities have varying effects on plant phenology, which in turn influences the GL’s responses to extreme climate events.
Furthermore, this study primarily focused on the impacts of independent EWEs, neglecting the combined effects of multiple EWEs. The impact of compound events on ecosystems can be more severe than that of individual events. For instance, co-occurrence of drought and heatwave events exert a more significant and pronounced destructive effect on natural ecosystems compared to isolated extreme heat or drought events [70]. Zhou et al. (2024) assessed the impact of Compound Drought and Heatwave Events (CDHEs) on vegetation across climate zones and ecosystems from 1993 to 2020. They found that vegetation was most affected by CDHEs lasting 5 to 9 days, with an expanded geographical extent and decreased lag time [71]. Future studies should prioritize examining the synergistic impacts of compound extreme climatic events on GL, particularly under intensifying global climate variability.
5. Conclusions
This study systematically investigated the response of growing season length (GL) to extreme weather events (EWEs) on the Mongolian Plateau (MP) from 2000 to 2022, using solar-induced fluorescence (SIF) data and Event Coincidence Analysis (ECA). It is among the very few studies to define EWEs for geo-environmental investigations statistically based on long time series of ERA5 meteorological data through initial detrending extremity thresholds detection through z-score transformation. The results highlighted that negative GL anomalies were stronger associated with EWEs than positive anomalies, with extreme heat and extreme wet events significantly contributing to GL shortening in warmer and wetter regions, respectively. Conversely, extreme cold and extreme drought events played a dominant role in drier and colder regions, leading to varied GL responses. Additionally, we observed that hydrothermal conditions modulate vegetation sensitivity, with warmer regions more susceptible to heat stress and drier regions more vulnerable to drought impacts.
The findings emphasize the importance of regional weather variation and long-term climatic conditions in shaping vegetation phenology and provide critical insights into how future weather extremes may impact ecosystem stability. Future studies should further investigate the combined effects of multiple extreme events and human influences, such as grazing and land-use changes, to refine our understanding of vegetation-climate interactions in arid and semi-arid ecosystems.
Author Contributions
Conceptualization, W.Z., K.M. and S.L.; Methodology, WZ and SL; Software, W.Z. and Q.G.; Validation, W.Z and S.L.; Formal Analysis, W.Z.; Investigation, W.Z., Q.G., G.W., K.M. and S.L.; Resources, W.Z.; Data Curation, W.Z., Q.G. and G.W.; Writing – Original Draft Preparation, W.Z.; Writing – Review & Editing, W.Z., Q.G., G.W., K.M. and S.L.; Visualization, W.Z.; Supervision, K.M. and S.L.; Project Administration, S.L.; Funding Acquisition, S.L.
Funding
Please add: This research was funded by the National Key Research & Development Plan (2024YFF1306101) and the National Natural Science Foundation of China (32171555, 31961143022).
Data Availability Statement
Data will be made available on request.
Acknowledgments
The authors would like to thank the editors and anonymous reviewers for their thoughtful comments, which improved the quality of this paper.
Conflicts of Interest
The authors declare no conflicts of interest.
References
- Perkins-Kirkpatrick, S.E.; Lewis, S.C. Increasing trends in regional heatwaves. Nature Communications 2020, 11, 3357. [Google Scholar] [CrossRef] [PubMed]
- Yin, J.; Gentine, P.; Zhou, S.; Sullivan, S.C.; Wang, R.; Zhang, Y.; Guo, S. Large increase in global storm runoff extremes driven by climate and anthropogenic changes. Nature Communications 2018, 9, 4389. [Google Scholar] [CrossRef] [PubMed]
- Mahecha, M.D.; Bastos, A.; Bohn, F.J.; Eisenhauer, N.; Feilhauer, H.; Hickler, T.; Kalesse-Los, H.; Migliavacca, M.; Otto, F.E.L.; Peng, J.; et al. Biodiversity and Climate Extremes: Known Interactions and Research Gaps. Earth’s Future 2024, 12, e2023EF003963. [Google Scholar] [CrossRef]
- Chiang, F.; Mazdiyasni, O.; AghaKouchak, A. Evidence of anthropogenic impacts on global drought frequency, duration, and intensity. Nature Communications 2021, 12, 2754. [Google Scholar] [CrossRef]
- Piao, S.; Liu, Q.; Chen, A.; Janssens, I.A.; Fu, Y.; Dai, J.; Liu, L.; Lian, X.; Shen, M.; Zhu, X. Plant phenology and global climate change: Current progresses and challenges. Glob Chang Biol 2019, 25, 1922–1940. [Google Scholar] [CrossRef]
- Zhang, Y.; Gentine, P.; Luo, X.; Lian, X.; Liu, Y.; Zhou, S.; Michalak, A.M.; Sun, W.; Fisher, J.B.; Piao, S.; et al. Increasing sensitivity of dryland vegetation greenness to precipitation due to rising atmospheric CO(2). Nat Commun 2022, 13, 4875. [Google Scholar] [CrossRef]
- Shen, M.; Piao, S.; Chen, X.; An, S.; Fu, Y.H.; Wang, S.; Cong, N.; Janssens, I.A. Strong impacts of daily minimum temperature on the green-up date and summer greenness of the Tibetan Plateau. Glob Chang Biol 2016, 22, 3057–3066. [Google Scholar] [CrossRef]
- Xu, X.; Riley, W.J.; Koven, C.D.; Jia, G.; Zhang, X. Earlier leaf-out warms air in the north. Nature Climate Change 2020, 10, 370–375. [Google Scholar] [CrossRef]
- Richardson, A.D.; Keenan, T.F.; Migliavacca, M.; Ryu, Y.; Sonnentag, O.; Toomey, M. Climate change, phenology, and phenological control of vegetation feedbacks to the climate system. Agricultural and Forest Meteorology 2013, 169, 156–173. [Google Scholar] [CrossRef]
- Li, Y.; Zhang, W.; Schwalm, C.R.; Gentine, P.; Smith, W.K.; Ciais, P.; Kimball, J.S.; Gazol, A.; Kannenberg, S.A.; Chen, A.; et al. Widespread spring phenology effects on drought recovery of Northern Hemisphere ecosystems. Nature Climate Change 2023, 13, 182–188. [Google Scholar] [CrossRef]
- Mohammed, G.H.; Colombo, R.; Middleton, E.M.; Rascher, U.; van der Tol, C.; Nedbal, L.; Goulas, Y.; Pérez-Priego, O.; Damm, A.; Meroni, M.; et al. Remote sensing of solar-induced chlorophyll fluorescence (SIF) in vegetation: 50 years of progress. Remote Sensing of Environment 2019, 231, 111177. [Google Scholar] [CrossRef] [PubMed]
- Wu, H.; Zhou, P.; Song, X.; Sun, W.; Li, Y.; Song, S.; Zhang, Y. Dynamics of solar-induced chlorophyll fluorescence (SIF) and its response to meteorological drought in the Yellow River Basin. Journal of Environmental Management 2024, 360, 121023. [Google Scholar] [CrossRef] [PubMed]
- Xu, S.; Atherton, J.; Riikonen, A.; Zhang, C.; Oivukkamäki, J.; MacArthur, A.; Honkavaara, E.; Hakala, T.; Koivumäki, N.; Liu, Z.; et al. Structural and photosynthetic dynamics mediate the response of SIF to water stress in a potato crop. Remote Sensing of Environment 2021, 263, 112555. [Google Scholar] [CrossRef]
- Jiao, W.; Chang, Q.; Wang, L. The Sensitivity of Satellite Solar-Induced Chlorophyll Fluorescence to Meteorological Drought. Earth’s Future 2019, 7, 558–573. [Google Scholar] [CrossRef]
- Martini, D.; Sakowska, K.; Wohlfahrt, G.; Pacheco-Labrador, J.; van der Tol, C.; Porcar-Castell, A.; Magney, T.S.; Carrara, A.; Colombo, R.; El-Madany, T.S.; et al. Heatwave breaks down the linearity between sun-induced fluorescence and gross primary production. New Phytologist 2022, 233, 2415–2428. [Google Scholar] [CrossRef]
- Soudani, K.; Goulas, Y.; Hmimina, G.; Latouche, G.; Ounis, A.; Balde, H. Investigating the responses of sun-induced chlorophyll fluorescence, gross primary production and their inter-relationship to abiotic factors changes in a temperate deciduous forest; 2024.
- Mu, Q.; Bayarsaikhan, S.; Bao, G.; Vandansambuu, B.; Tong, S.; Gantumur, B.; Ganbold, B.; Bao, Y. Spring Phenological Responses of Diverse Vegetation Types to Extreme Climatic Events in Mongolia. Sustainability 2024, 16, 9931. [Google Scholar] [CrossRef]
- Li, C.; Filho, W.L.; Wang, J.; Yin, J.; Fedoruk, M.; Bao, G.; Bao, Y.; Yin, S.; Yu, S.; Hu, R. An assessment of the impacts of climate extremes on the vegetation in Mongolian Plateau: Using a scenarios-based analysis to support regional adaptation and mitigation options. Ecological Indicators 2018, 95, 805–814. [Google Scholar] [CrossRef]
- Piao, J.; Chen, W.; Chen, S.; Gong, H. Role of the internal atmospheric variability on the warming trends over Northeast Asia during 1970–2005. Theoretical and Applied Climatology 2022, 149, 1317–1328. [Google Scholar] [CrossRef]
- Gao, B.; Ye, X.; Ding, L.; Zhang, P.; Wang, Y.; Xiao, L. Water availability dominated vegetation productivity of Inner Mongolia grasslands from 1982 to 2015. Ecological Indicators 2023, 151, 110291. [Google Scholar] [CrossRef]
- Chen, J.; John, R.; Zhang, Y.; Shao, C.; Brown, D.G.; Batkhishig, O.; Amarjargal, A.; Ouyang, Z.; Dong, G.; Wang, D.A.N.; et al. Divergences of Two Coupled Human and Natural Systems on the Mongolian Plateau. BioScience 2015, 65, 559–570. [Google Scholar] [CrossRef]
- Hilker, T.; Natsagdorj, E.; Waring, R.H.; Lyapustin, A.; Wang, Y. Satellite observed widespread decline in Mongolian grasslands largely due to overgrazing. Glob Chang Biol 2014, 20, 418–428. [Google Scholar] [CrossRef] [PubMed]
- Cai, Q.; Chen, W.; Chen, S.; Xie, S.-P.; Piao, J.; Ma, T.; Lan, X. Recent pronounced warming on the Mongolian Plateau boosted by internal climate variability. Nature Geoscience 2024, 17, 181–188. [Google Scholar] [CrossRef]
- He, L.; Guo, J.; Yang, W.; Jiang, Q.; Chen, L.; Tang, K. Multifaceted responses of vegetation to average and extreme climate change over global drylands. Sci Total Environ 2023, 858, 159942. [Google Scholar] [CrossRef] [PubMed]
- Ren, G.; Chan, J.C.L.; Kubota, H.; Zhang, Z.; Li, J.; Zhang, Y.; Zhang, Y.; Yang, Y.; Ren, Y.; Sun, X.; et al. Historical and recent change in extreme climate over East Asia. Clim Change 2021, 168, 22. [Google Scholar] [CrossRef]
- Su, R.; Cheng, J.; Chen, D.; Bai, Y.; Jin, H.; Chao, L.; Wang, Z.; Li, J. Effects of grazing on spatiotemporal variations in community structure and ecosystem function on the grasslands of Inner Mongolia, China. Scientific Reports 2017, 7, 40. [Google Scholar] [CrossRef]
- Mo, Y.; Zhang, X.; Liu, Z.; Zhang, J.; Hao, F.; Fu, Y. Effects of Climate Extremes on Spring Phenology of Temperate Vegetation in China. Remote Sensing 2023, 15, 686. [Google Scholar] [CrossRef]
- Pei, T.; Ji, Z.; Chen, Y.; Wu, H.; Hou, Q.; Qin, G.; Xie, B. The Sensitivity of Vegetation Phenology to Extreme Climate Indices in the Loess Plateau, China. Sustainability 2021, 13, 7623. [Google Scholar] [CrossRef]
- Zhang, J.; Hao, F.; Wu, Z.; Li, M.; Zhang, X.; Fu, Y. Response of vegetation phenology to extreme climate and its mechanism. Acta Geographica Sinica 2023, 78, 2241–2255. [Google Scholar]
- Dang, C.; Shao, Z.; Huang, X.; Zhuang, Q.; Cheng, G.; Qian, J. Climate warming-induced phenology changes dominate vegetation productivity in Northern Hemisphere ecosystems. Ecological Indicators 2023, 151, 110326. [Google Scholar] [CrossRef]
- Chen, X.; Zhang, Y. Impacts of climate, phenology, elevation and their interactions on the net primary productivity of vegetation in Yunnan, China under global warming. Ecological Indicators 2023, 154, 110533. [Google Scholar] [CrossRef]
- Sun, H.; Chen, Y.; Xiong, J.; Ye, C.; Yong, Z.; Wang, Y.; He, D.; Xu, S. Relationships between climate change, phenology, edaphic factors, and net primary productivity across the Tibetan Plateau. International Journal of Applied Earth Observation and Geoinformation 2022, 107, 102708. [Google Scholar] [CrossRef]
- Zhang, R.; Guo, J.; Yin, G. Response of net primary productivity to grassland phenological changes in Xinjiang, China. PeerJ 2021, 9, e10650. [Google Scholar] [CrossRef] [PubMed]
- Tan, X.; Jia, Y.; Niu, C.; Yang, D.; Lu, W.; Hao, C. Response of water-use efficiency to phenology in the natural forest and grassland of the Loess Plateau in China. Science China-Earth Sciences 2023, 66, 2081–2096. [Google Scholar] [CrossRef]
- Cheng, M.; Jin, J.; Jiang, H. Strong impacts of autumn phenology on grassland ecosystem water use efficiency on the Tibetan Plateau. Ecological Indicators 2021, 126, 107682. [Google Scholar] [CrossRef]
- Zhang, Y.; Zhang, J.; Xia, J.; Guo, Y.; Fu, Y.H. Effects of Vegetation Phenology on Ecosystem Water Use Efficiency in a Semiarid Region of Northern China. Front Plant Sci 2022, 13, 945582. [Google Scholar] [CrossRef]
- Fu, Y.; Zhang, J.; Wu, Z.; Chen, S. Vegetation phenology response to climate change in China. Journal of Beijing Normal University. Natural Science 2022, 58, 424–433. [Google Scholar]
- Wang, J.; Zhou, G.; He, Q.; Zhou, L. Phenological characteristics of net ecosystem carbon exchange of Stipa krylovii steppe in Inner Mongolia, China and its remote sensing monitoring. Chinese Journal of Applied Ecology 2024, 35, 659–668. [Google Scholar]
- Donges, J.F.; Schleussner, C.F.; Siegmund, J.F.; Donner, R.V. Event coincidence analysis for quantifying statistical interrelationships between event time series. The European Physical Journal Special Topics 2016, 225, 471–487. [Google Scholar] [CrossRef]
- Yao, Z. A global spatially contiguous solar-induced fluorescence (CSIF) dataset using neural networks (2000-2022). 2021. [CrossRef]
- Kong, D.; McVicar, T.R.; Xiao, M.; Zhang, Y.; Peña-Arancibia, J.L.; Filippa, G.; Xie, Y.; Gu, X. phenofit: An R package for extracting vegetation phenology from time series remote sensing. Methods in Ecology and Evolution 2022, 13, 1508–1527. [Google Scholar] [CrossRef]
- Kong, D.; Zhang, Y.; Gu, X.; Wang, D. A robust method for reconstructing global MODIS EVI time series on the Google Earth Engine. ISPRS Journal of Photogrammetry and Remote Sensing 2019, 155, 13–24. [Google Scholar] [CrossRef]
- Zeng, L.; Wardlow, B.D.; Xiang, D.; Hu, S.; Li, D. A review of vegetation phenological metrics extraction using time-series, multispectral satellite data. Remote Sensing of Environment 2020, 237, 111511. [Google Scholar] [CrossRef]
- Manghwar, H.; Hussain, A.; Alam, I.; Khoso, M.A.; Ali, Q.; Liu, F. Waterlogging stress in plants: Unraveling the mechanisms and impacts on growth, development, and productivity. Environmental and Experimental Botany 2024, 224, 105824. [Google Scholar] [CrossRef]
- Zhou, W.; Chen, F.; Meng, Y.; Chandrasekaran, U.; Luo, X.; Yang, W.; Shu, K. Plant waterlogging/flooding stress responses: From seed germination to maturation. Plant Physiology and Biochemistry 2020, 148, 228–236. [Google Scholar] [CrossRef] [PubMed]
- TAMANG, B.G.; MAGLIOZZI, J.O.; MAROOF, M.A.S.; FUKAO, T. Physiological and transcriptomic characterization of submergence and reoxygenation responses in soybean seedlings. Plant, Cell & Environment 2014, 37, 2350–2365. [Google Scholar] [CrossRef]
- Zuidema, P.A.; Babst, F.; Groenendijk, P.; Trouet, V.; Abiyu, A.; Acuña-Soto, R.; Adenesky-Filho, E.; Alfaro-Sánchez, R.; Aragão, J.R.V.; Assis-Pereira, G.; et al. Tropical tree growth driven by dry-season climate variability. Nature Geoscience 2022, 15, 269–276. [Google Scholar] [CrossRef]
- Zahra, N.; Hafeez, M.B.; Ghaffar, A.; Kausar, A.; Zeidi, M.A.; Siddique, K.H.M.; Farooq, M. Plant photosynthesis under heat stress: Effects and management. Environmental and Experimental Botany 2023, 206, 105178. [Google Scholar] [CrossRef]
- Mathur, S.; Agrawal, D.; Jajoo, A. Photosynthesis: Response to high temperature stress. Journal of Photochemistry and Photobiology B: Biology 2014, 137, 116–126. [Google Scholar] [CrossRef]
- Takahashi, D.; Willick, I.R.; Kasuga, J.; Livingston III, D.P. Responses of the Plant Cell Wall to Sub-Zero Temperatures: A Brief Update. Plant and Cell Physiology 2021, 62, 1858–1866. [Google Scholar] [CrossRef]
- Bhattacharya, A. Effect of Low Temperature Stress on Photosynthesis and Allied Traits: A Review. In Physiological Processes in Plants Under Low Temperature Stress, Bhattacharya, A., Ed.; Springer Singapore: Singapore, 2022; pp. 199–297. [Google Scholar]
- Li, B.; Wang, X.; Li, Z. Plants extend root deeper rather than increase root biomass triggered by critical age and soil water depletion. Science of The Total Environment 2024, 914, 169689. [Google Scholar] [CrossRef]
- Nicolai-Shaw, N.; Zscheischler, J.; Hirschi, M.; Gudmundsson, L.; Seneviratne, S.I. A drought event composite analysis using satellite remote-sensing based soil moisture. Remote Sensing of Environment 2017, 203, 216–225. [Google Scholar] [CrossRef]
- Xing, Y.; Chen, M.; Dao, J.; Lin, L.; Chen, C.; Chen, Y.; Wang, Z. Fine-root morphology of woody and herbaceous plants responds differently to altered precipitation: A meta-analysis. Forest Ecology and Management 2024, 552, 121570. [Google Scholar] [CrossRef]
- Schuldt, B.; Buras, A.; Arend, M.; Vitasse, Y.; Beierkuhnlein, C.; Damm, A.; Gharun, M.; Grams, T.E.E.; Hauck, M.; Hajek, P.; et al. A first assessment of the impact of the extreme 2018 summer drought on Central European forests. Basic and Applied Ecology 2020, 45, 86–103. [Google Scholar] [CrossRef]
- Liu, D.; Wang, T.; Peñuelas, J.; Piao, S. Drought resistance enhanced by tree species diversity in global forests. Nature Geoscience 2022, 15, 800–804. [Google Scholar] [CrossRef]
- Li, X.; Li, Y.; Chen, A.; Gao, M.; Slette, I.J.; Piao, S. The impact of the 2009/2010 drought on vegetation growth and terrestrial carbon balance in Southwest China. Agricultural and Forest Meteorology 2019, 269–270, 239–248. [Google Scholar] [CrossRef]
- Yamori, W.; Hikosaka, K.; Way, D.A. Temperature response of photosynthesis in C3, C4, and CAM plants: temperature acclimation and temperature adaptation. Photosynthesis Research 2014, 119, 101–117. [Google Scholar] [CrossRef]
- Zia, R.; Nawaz, M.S.; Siddique, M.J.; Hakim, S.; Imran, A. Plant survival under drought stress: Implications, adaptive responses, and integrated rhizosphere management strategy for stress mitigation. Microbiological Research 2021, 242, 126626. [Google Scholar] [CrossRef]
- Zahedi, S.M.; Karimi, M.; Venditti, A.; Zahra, N.; Siddique, K.H.M.; Farooq, M. Plant Adaptation to Drought Stress: The Role of Anatomical and Morphological Characteristics in Maintaining the Water Status. Journal of Soil Science and Plant Nutrition 2024. [Google Scholar] [CrossRef]
- Zhou, C.; Wu, S.; Li, C.; Quan, W.; Wang, A. Response Mechanisms of Woody Plants to High-Temperature Stress. Plants 2023, 12, 3643. [Google Scholar] [CrossRef]
- Wijewardene, I.; Shen, G.; Zhang, H. Enhancing crop yield by using Rubisco activase to improve photosynthesis under elevated temperatures. Stress Biology 2021, 1, 2. [Google Scholar] [CrossRef]
- Li, G.; Jiang, C.; Cheng, T.; Bai, J. Grazing alters the phenology of alpine steppe by changing the surface physical environment on the northeast Qinghai-Tibet Plateau, China. Journal of Environmental Management 2019, 248, 109257. [Google Scholar] [CrossRef]
- Tadey, M. Reshaping phenology: Grazing has stronger effects than climate on flowering and fruiting phenology in desert plants. Perspectives in Plant Ecology, Evolution and Systematics 2020, 42, 125501. [Google Scholar] [CrossRef]
- Richardson, W.; Stringham, T.K.; Lieurance, W.; Snyder, K.A. Changes in Meadow Phenology in Response to Grazing Management at Multiple Scales of Measurement. Remote Sensing 2021, 13, 4028. [Google Scholar] [CrossRef]
- Zhao, R.; Liu, X.; Dong, J.; Zhao, G.; Manevski, K.; Andersen, M.N.; Tang, Q. Human activities modulate greening patterns: a case study for southern Xinjiang in China based on long time series analysis. Environ Res Let 2022, 17, 044012. [Google Scholar] [CrossRef]
- Fang, M.; Lu, G.; Zhang, S.; Liang, W. Overgrazing on unmanaged grassland interfered with the restoration of adjacent grazing-banned grassland by affecting soil properties and microbial community. Front Microbiol 2023, 14, 1327056. [Google Scholar] [CrossRef]
- Jiang, A.; Dong, Y.; Asitaiken, J.; Zhou, S.; Nie, T.; Wu, Y.; Liu, Z.; An, S.; Yang, K. Response of soil fungal communities and their co-occurrence patterns to grazing exclusion in different grassland types. Front Microbiol 2024, 15, 1404633. [Google Scholar] [CrossRef]
- Wang, L.; Li, P.; Li, T.; Zhou, X.; Liu, Z.; Zou, Z.; Zhu, Q.; Peng, C. Grazing alters vegetation phenology by regulating regional environmental factors on the Tibetan Plateau. Agriculture, Ecosystems & Environment 2023, 351, 108479. [Google Scholar] [CrossRef]
- Camarero, J.J.; Gazol, A.; Sangüesa-Barreda, G.; Fajardo, A. Coupled climate–forest growth shifts in the Chilean Patagonia are decoupled from trends in water–use efficiency. Agricultural and Forest Meteorology 2018, 259, 222–231. [Google Scholar] [CrossRef]
- Zhou, S.; Wu, S.; Gao, J.; Liu, L.; Li, D.; Yan, R.; Wang, J. Increased stress from compound drought and heat events on vegetation. Sci Total Environ 2024, 949, 175113. [Google Scholar] [CrossRef]
Figure 1.
Mean geographic and meteorological characteristics (2001–2020) of the Mongolian Pateau. The Mongolia-Inner Mongolia border is depicted by line. Land cover classification derived from MODIS product (MCD12Q1 V006).
Figure 1.
Mean geographic and meteorological characteristics (2001–2020) of the Mongolian Pateau. The Mongolia-Inner Mongolia border is depicted by line. Land cover classification derived from MODIS product (MCD12Q1 V006).
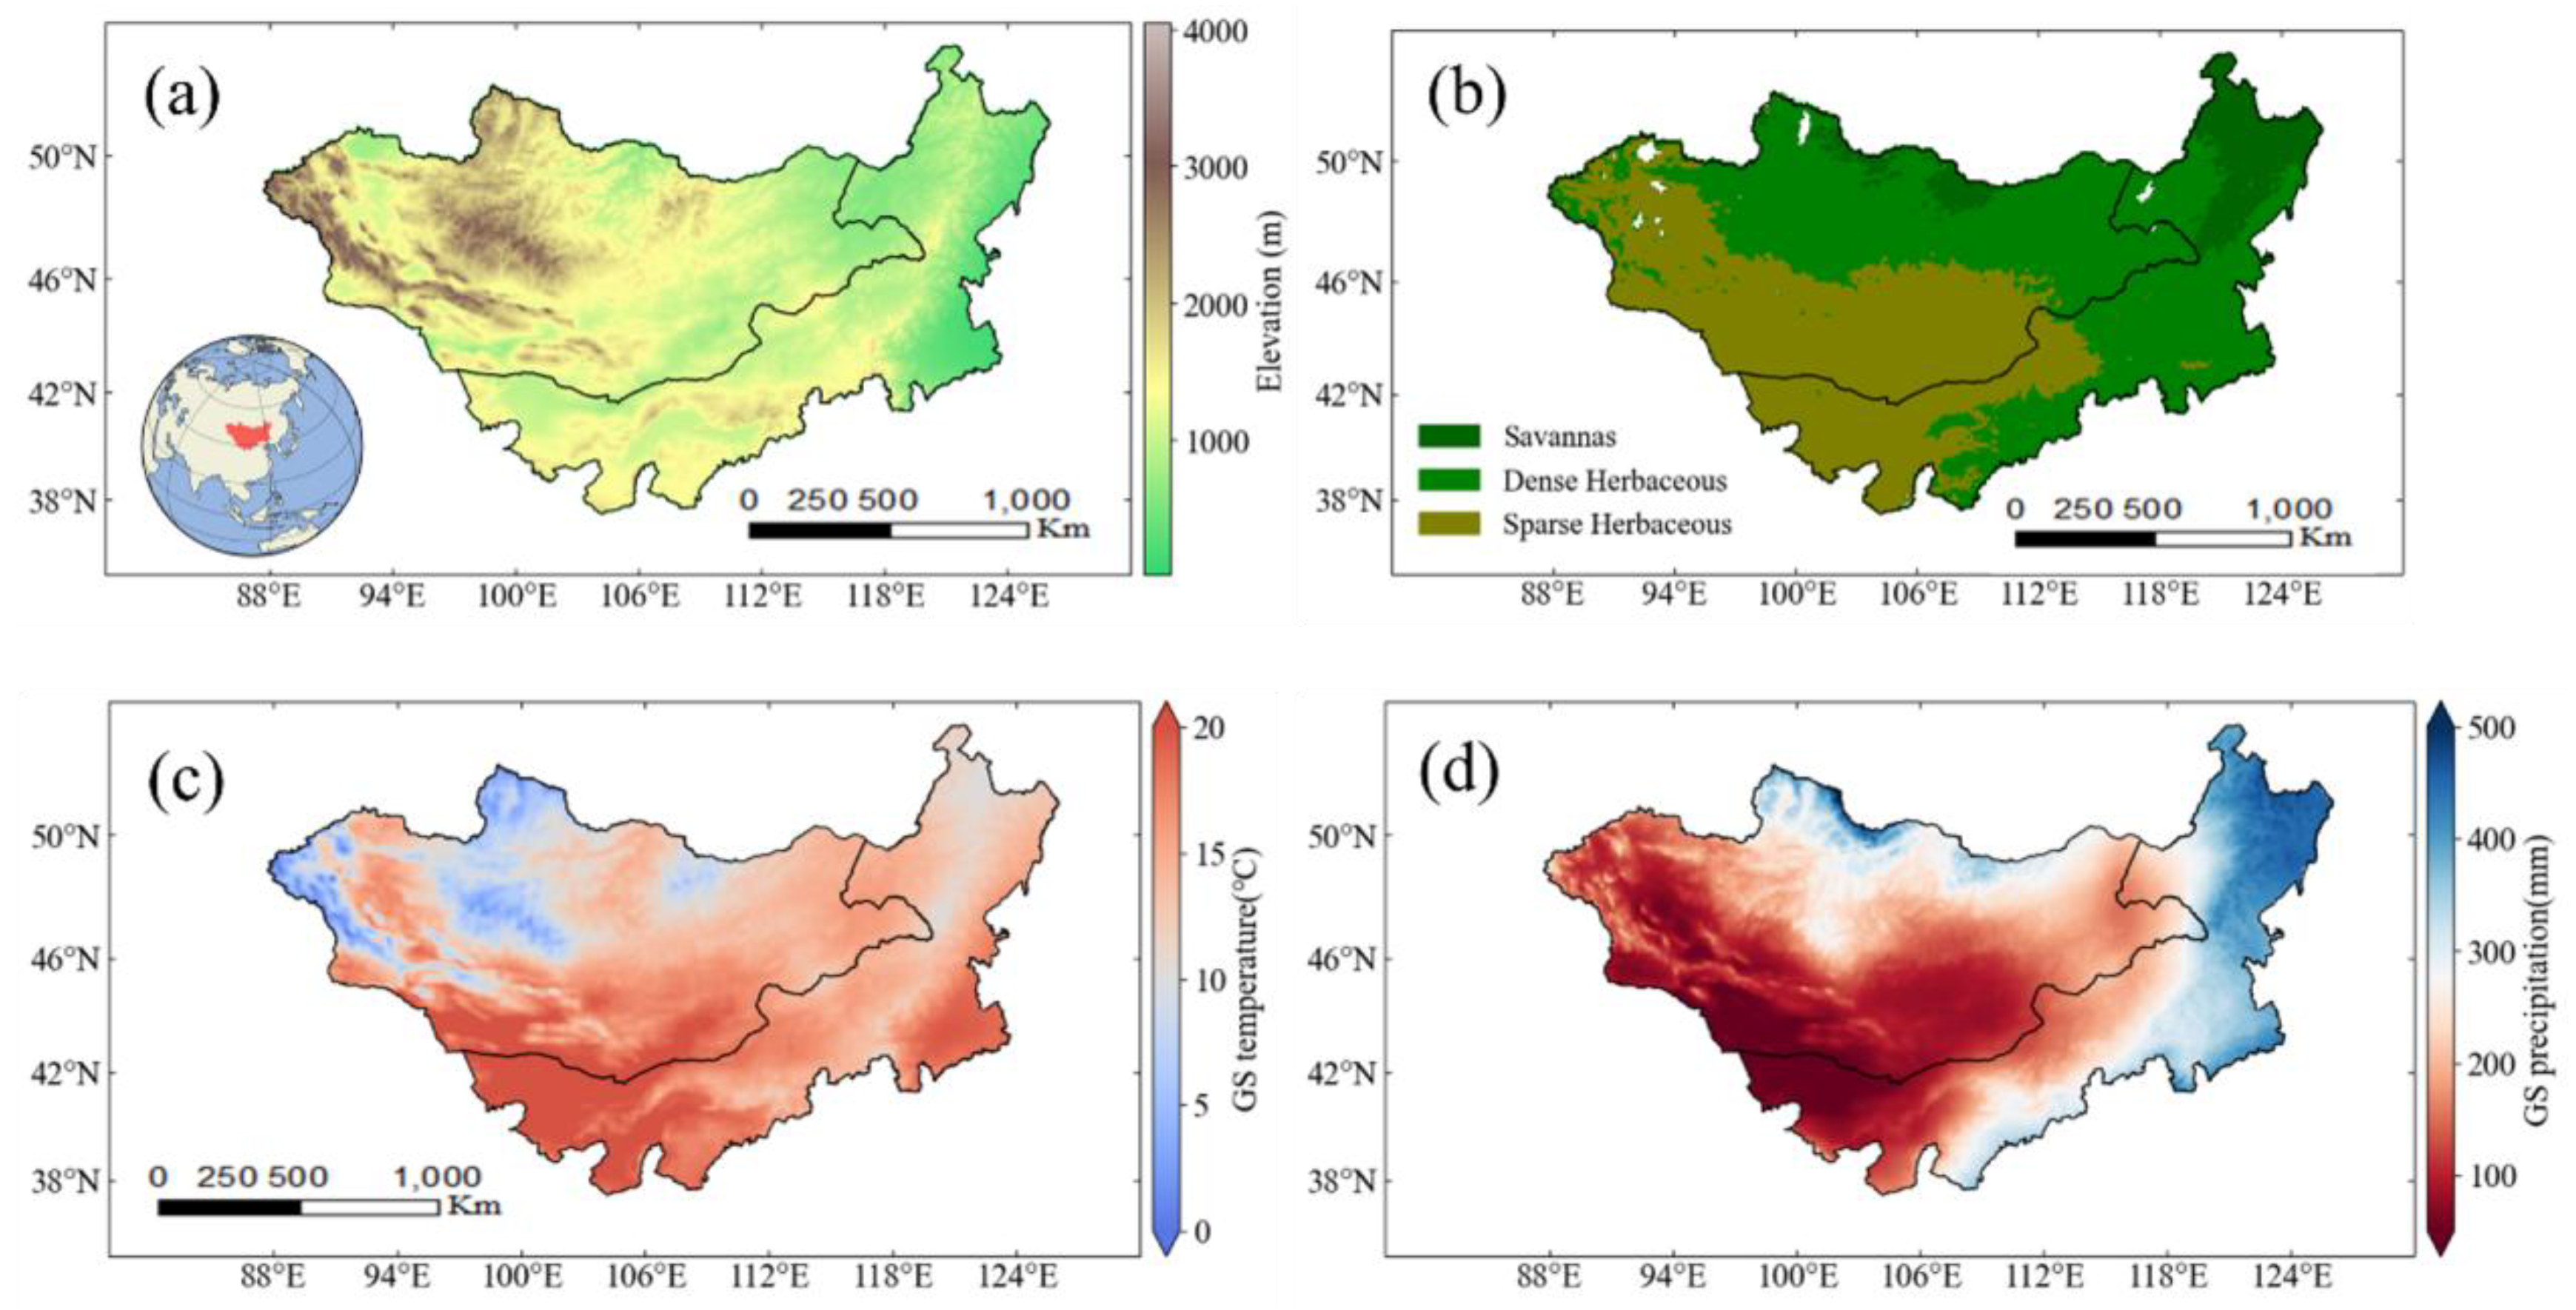
Figure 2.
Spatial distribution of vegetation phenology (unit of days) on the Mongolian Plateau and its variation along climatic gradients. Start- (SOS) and End of the growing Season (EOS) and Growing season Length (GL) are presented in two panels: left is multi-year (2001–2020) mean, right is annual variations along regional growing-season (GS) temperature and precipitation gradients.
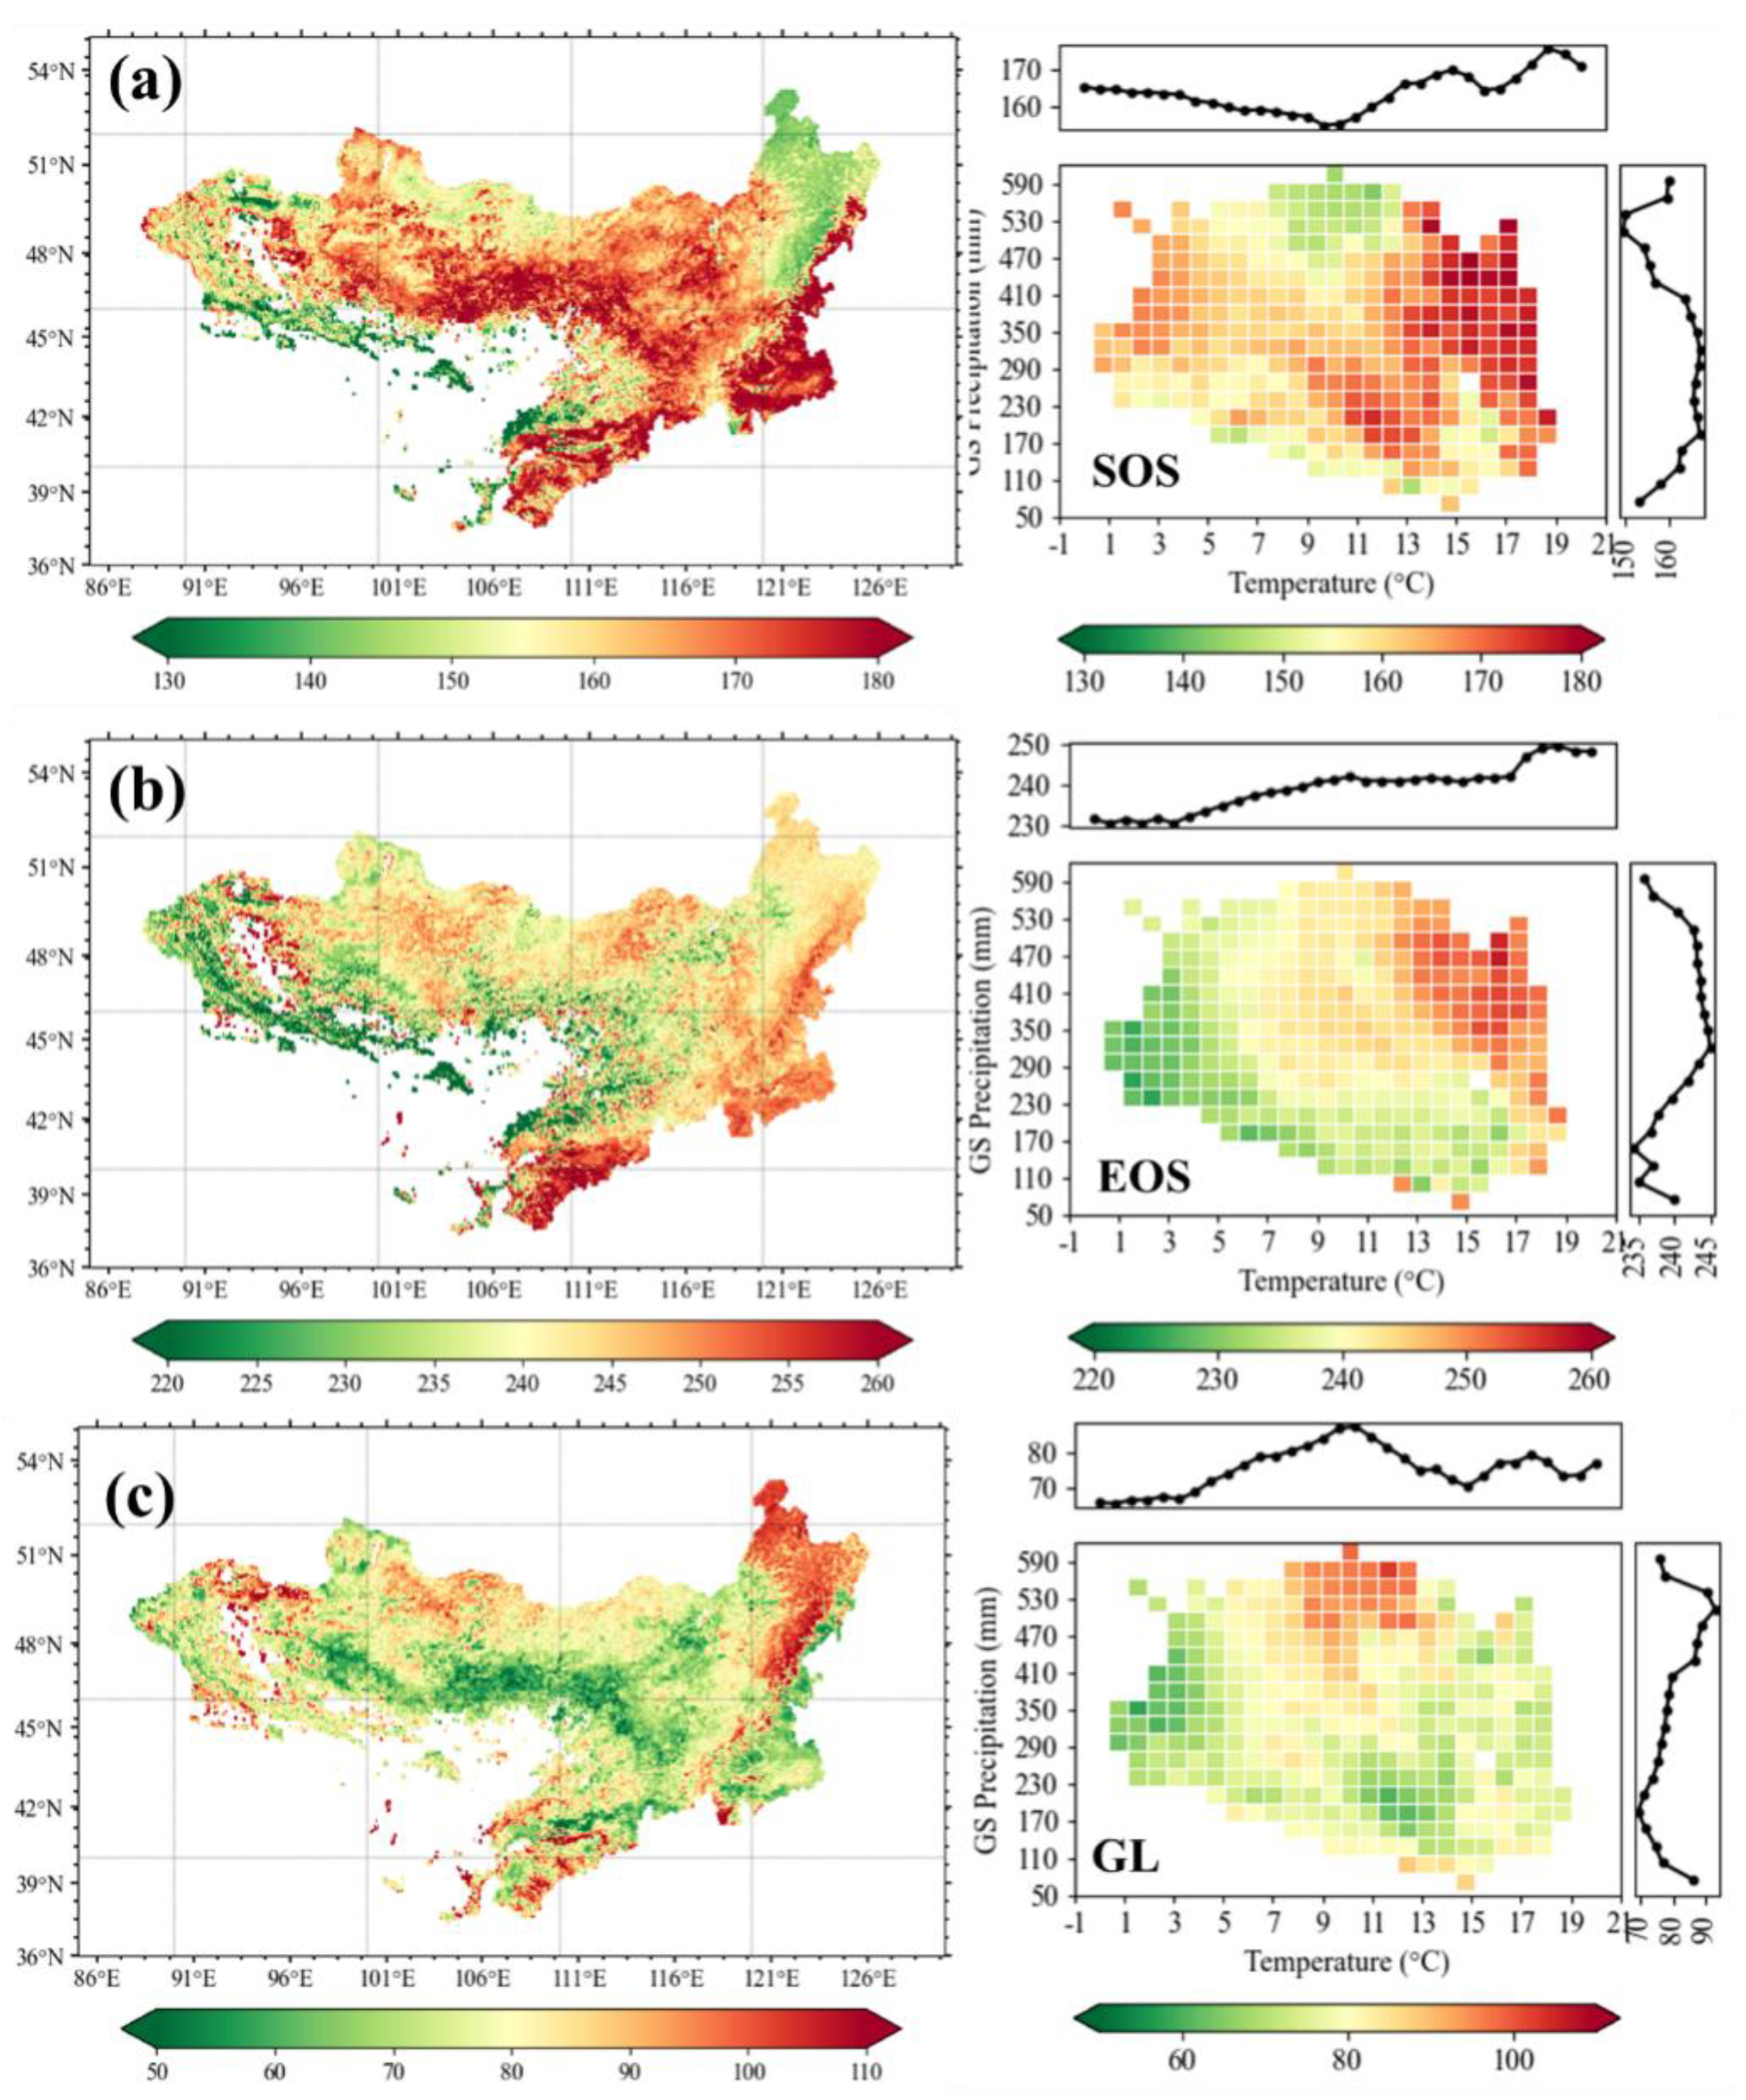
Figure 3.
Interannual variation trend of phenology (unit of days). Right figure shows the distribution statistics within each variation trend interval for Start- (SOS) and End of the growing Season (EOS) and the Length of the Growing season (GL). Left figure shows %-wise contribution.
Figure 3.
Interannual variation trend of phenology (unit of days). Right figure shows the distribution statistics within each variation trend interval for Start- (SOS) and End of the growing Season (EOS) and the Length of the Growing season (GL). Left figure shows %-wise contribution.
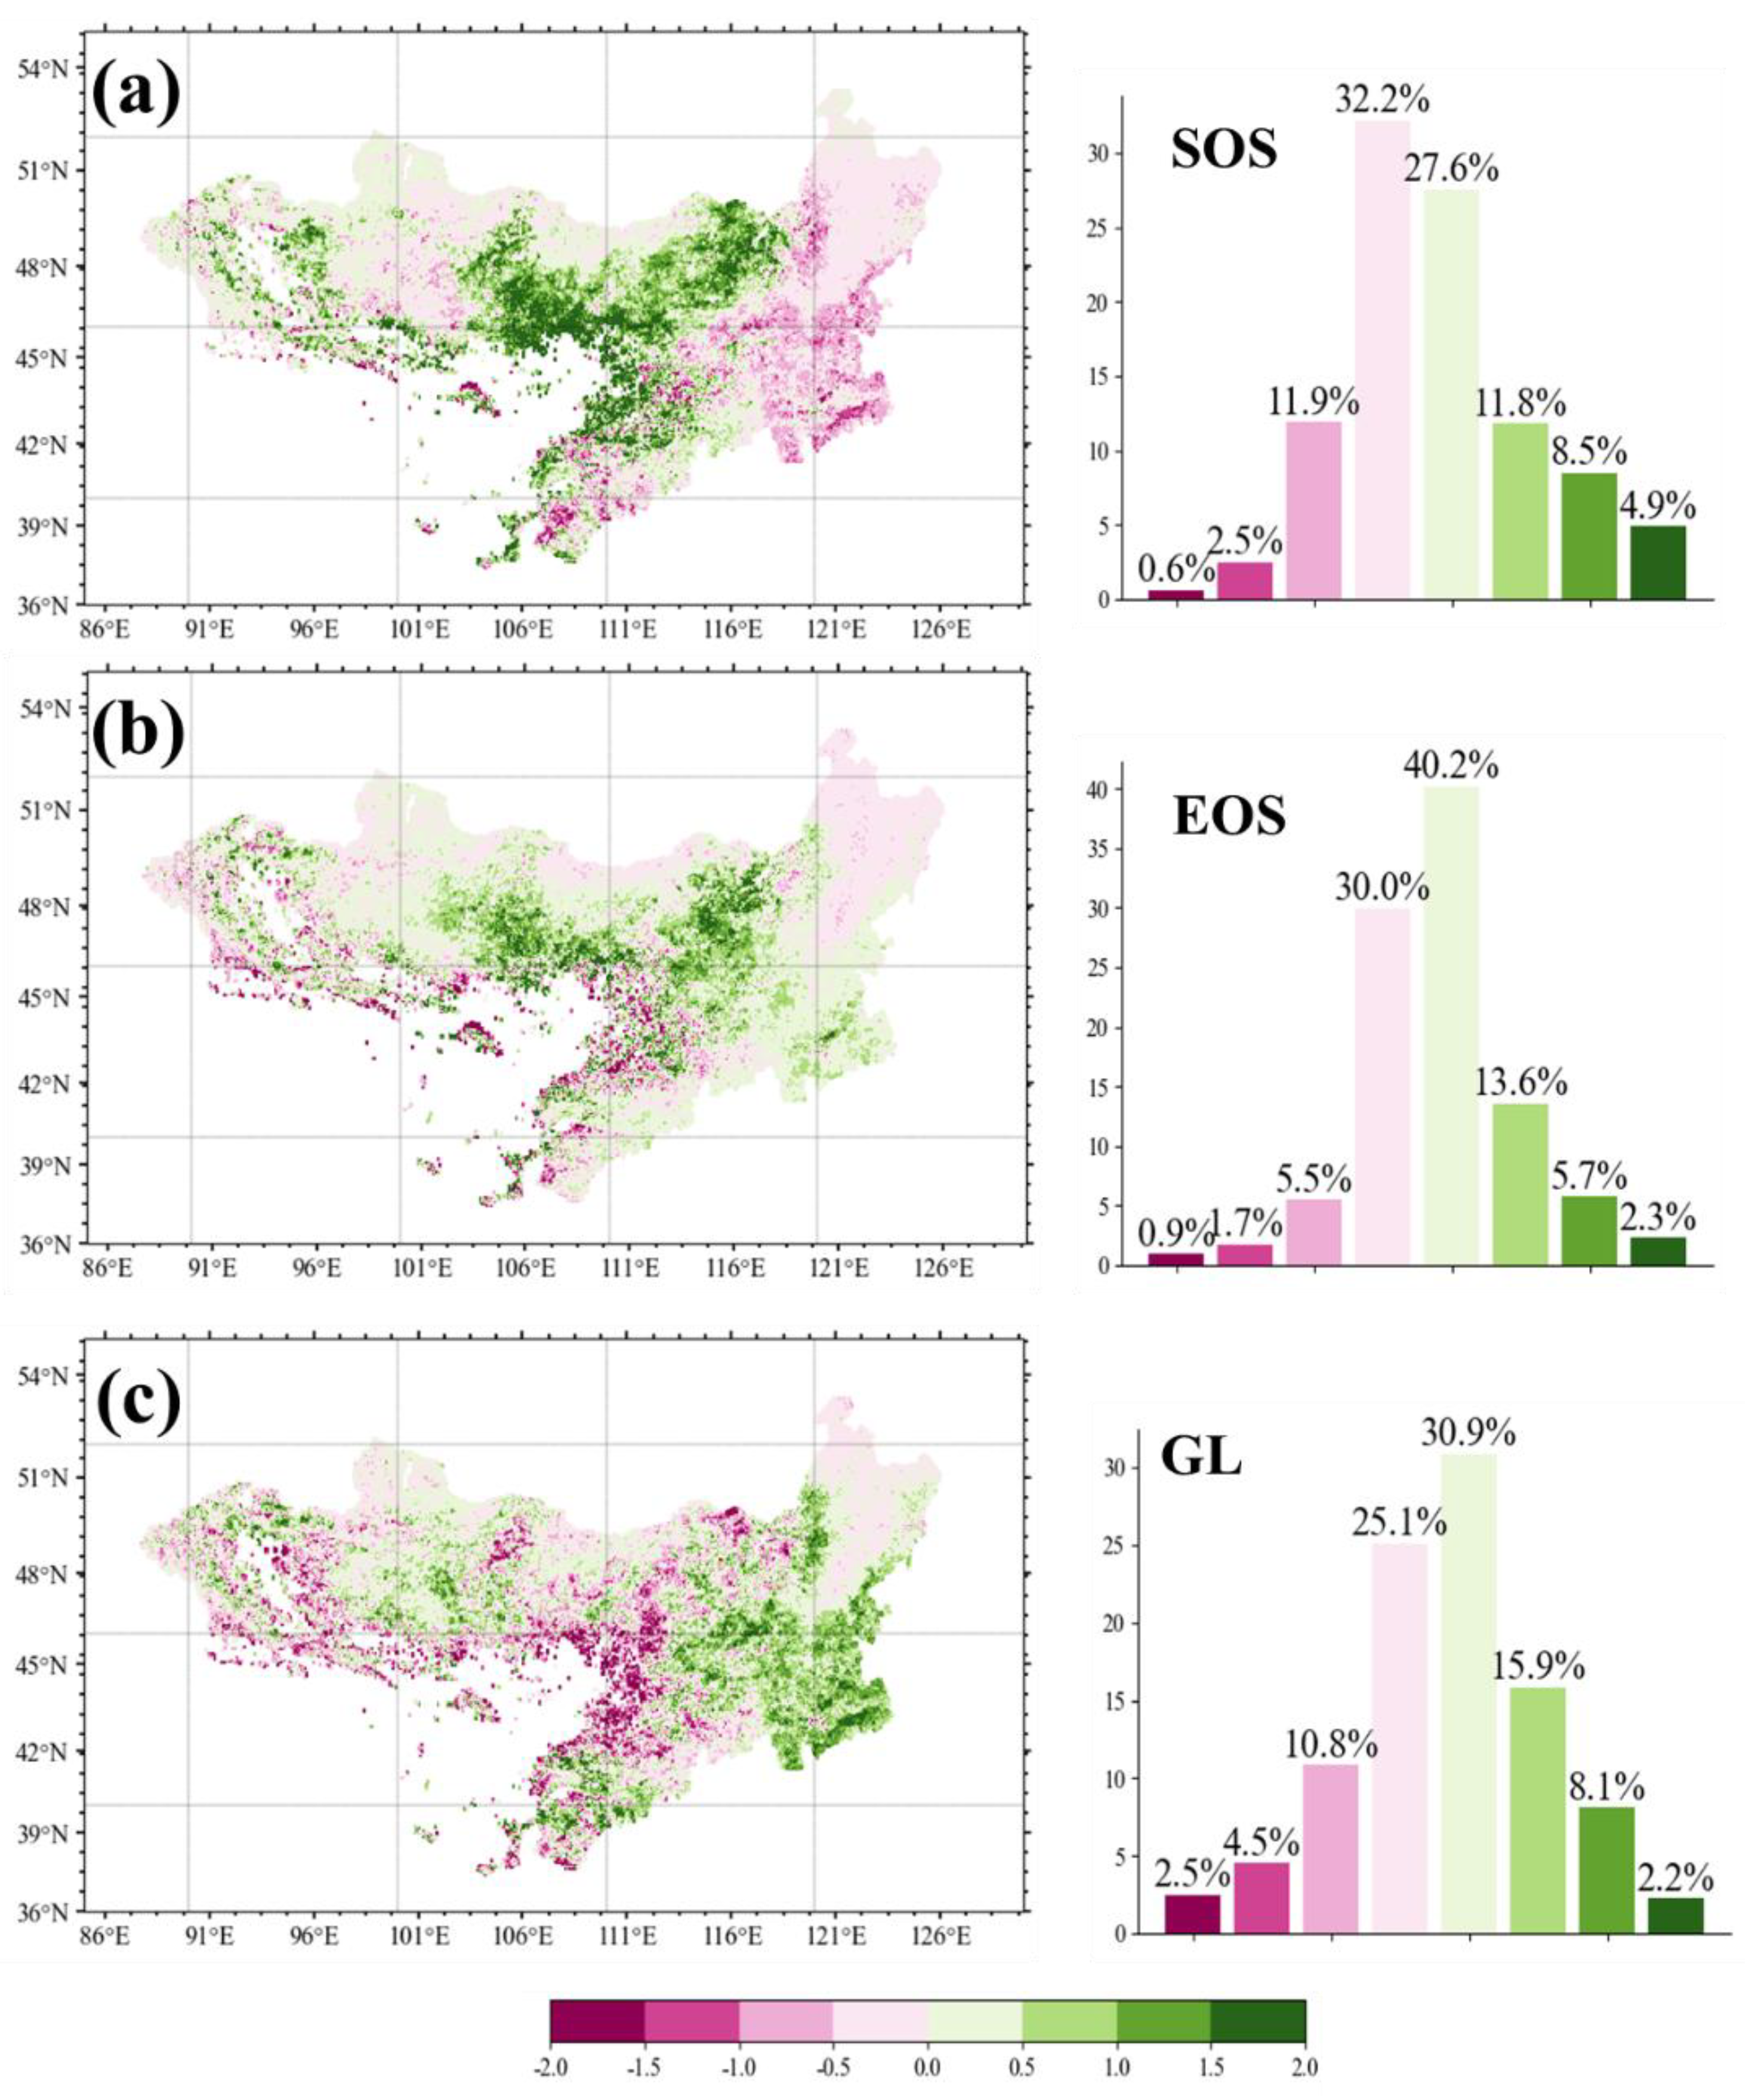
Figure 4.
Spatial patterns of coincidence rates (CR) between growing season length (GL) anomalies and extreme weather events (EWEs) across the Mongolian Plateau.
Figure 4.
Spatial patterns of coincidence rates (CR) between growing season length (GL) anomalies and extreme weather events (EWEs) across the Mongolian Plateau.
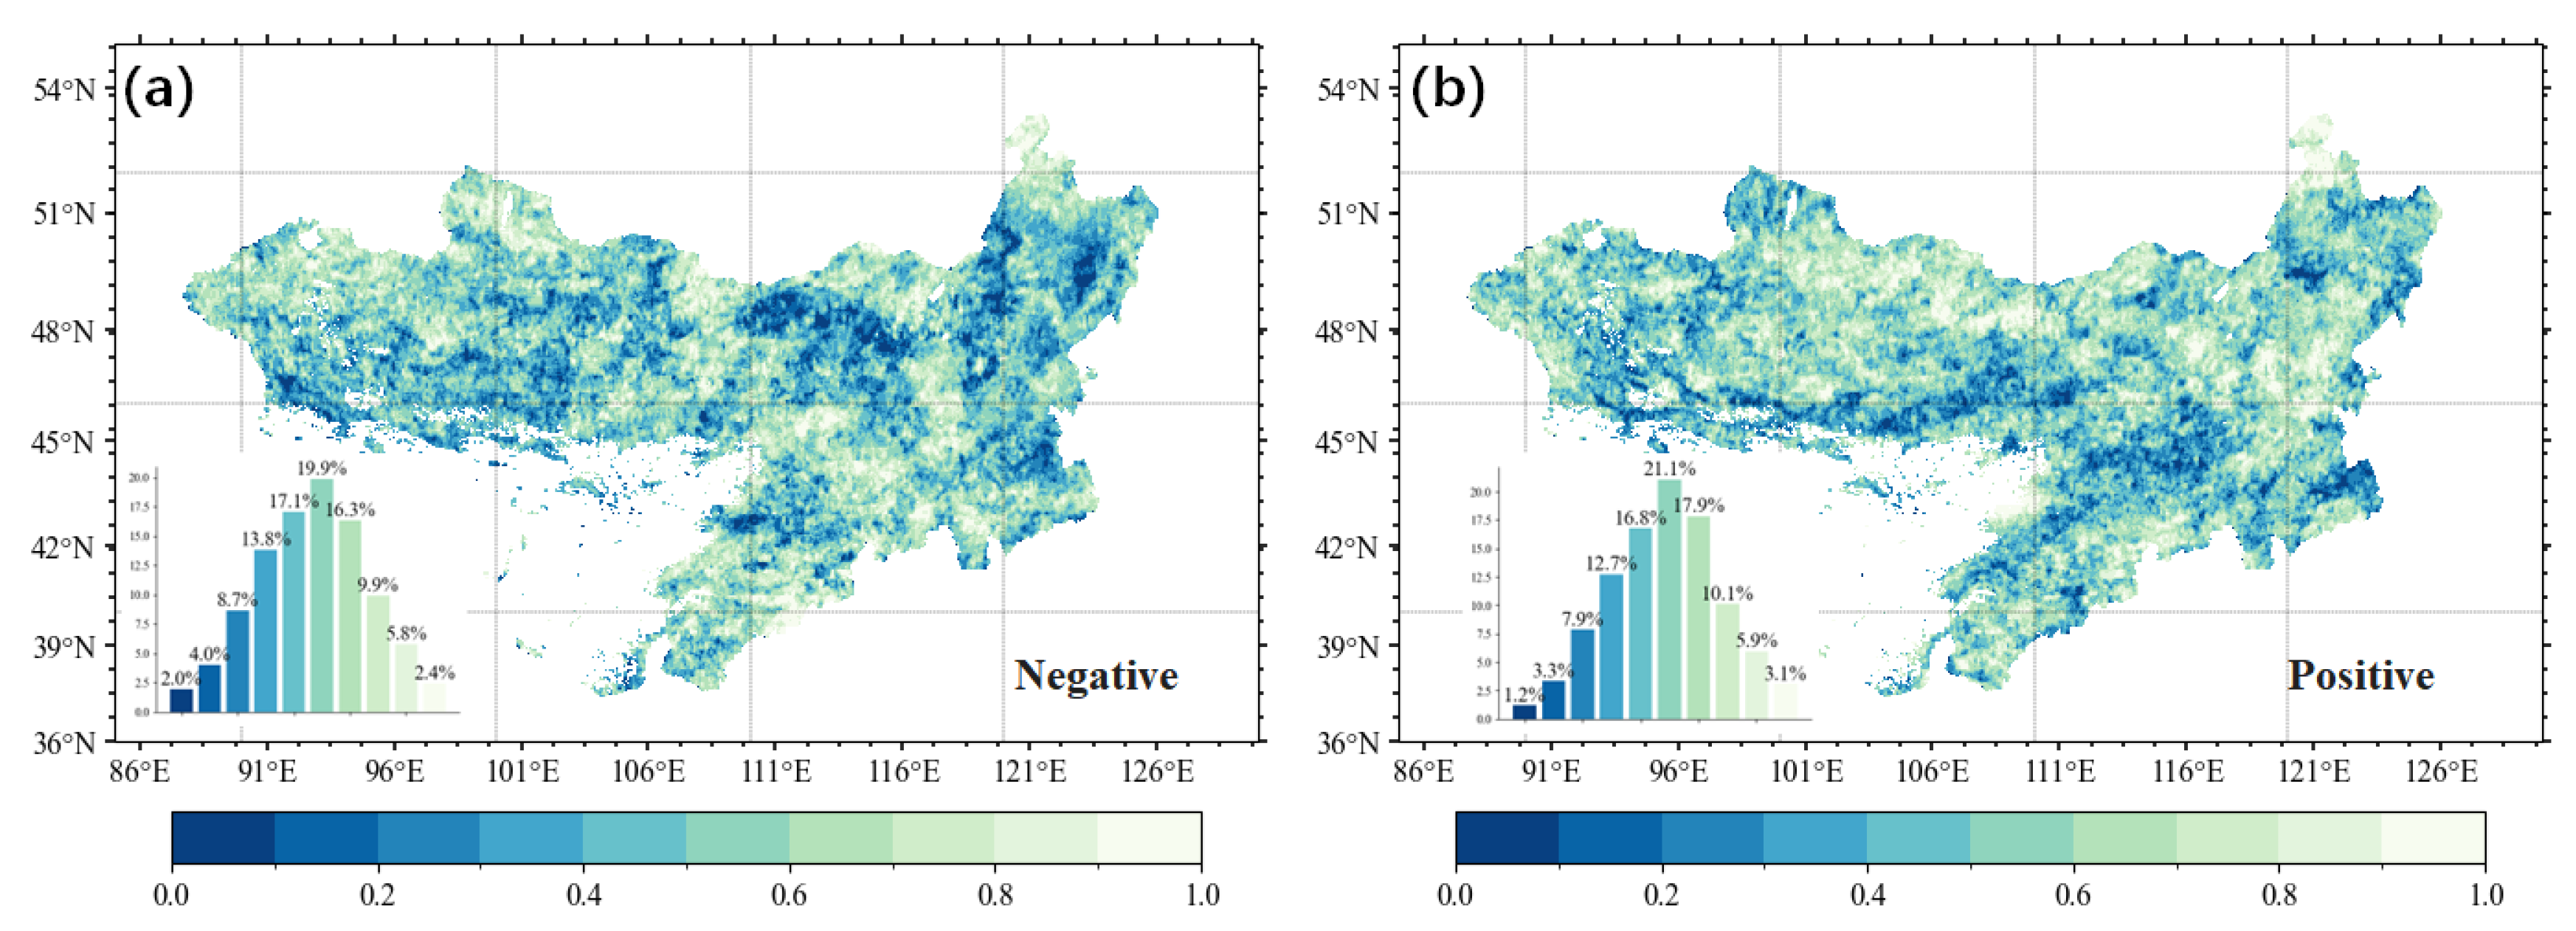
Figure 5.
Spatial patterns of coincidence rates (CR) between growing season length (GL) anomalies and extreme climate events (EWEs). Symbols W-, W+, T+ and T- denote extreme drought, extreme humidity, extreme high temperature and extreme low temperature, respectively.
Figure 5.
Spatial patterns of coincidence rates (CR) between growing season length (GL) anomalies and extreme climate events (EWEs). Symbols W-, W+, T+ and T- denote extreme drought, extreme humidity, extreme high temperature and extreme low temperature, respectively.
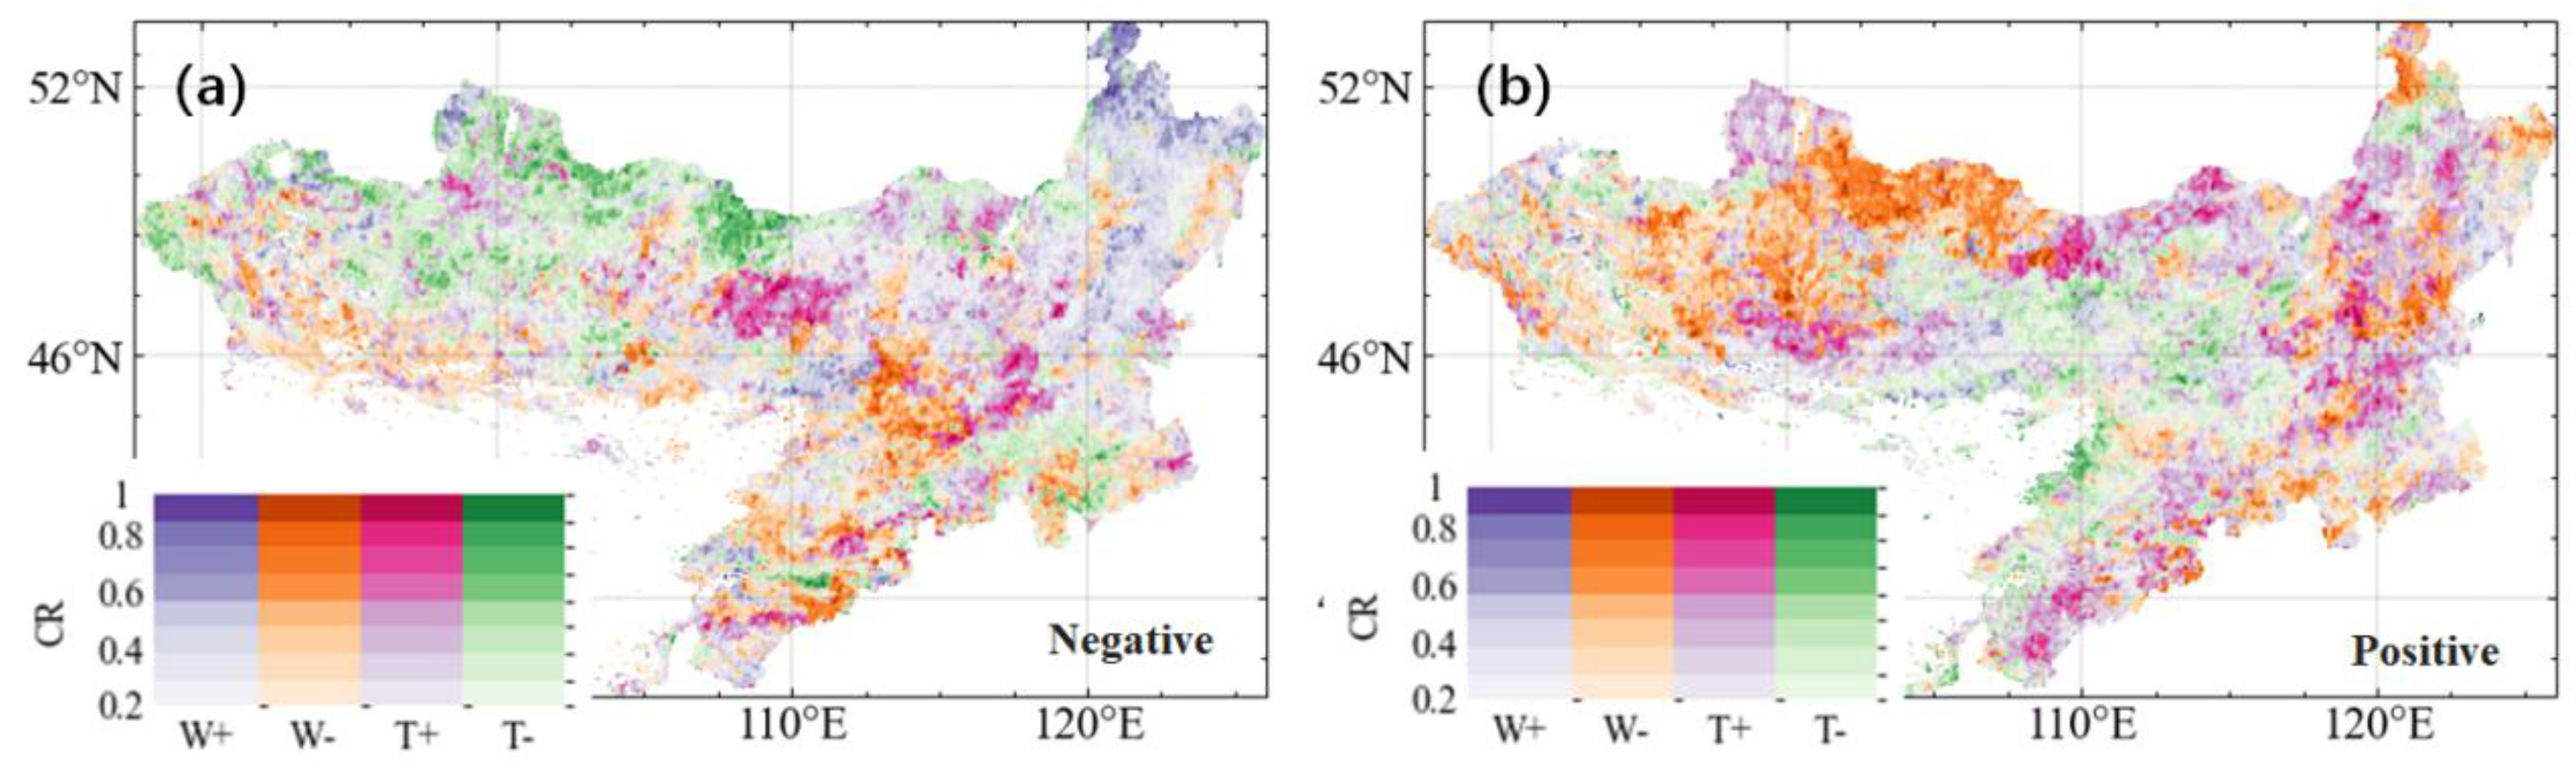
Figure 6.
Contribution metrics of individual EWEs to GL anomalies (negative/positive), quantified by dominant area percentage and coincidence rate (CR), analyzed for statistically valid pixels (p<0.05). Symbols W-, W+, T+ and T- denote extreme drought, extreme wetness, extreme high temperature and extreme low temperature, respectively.
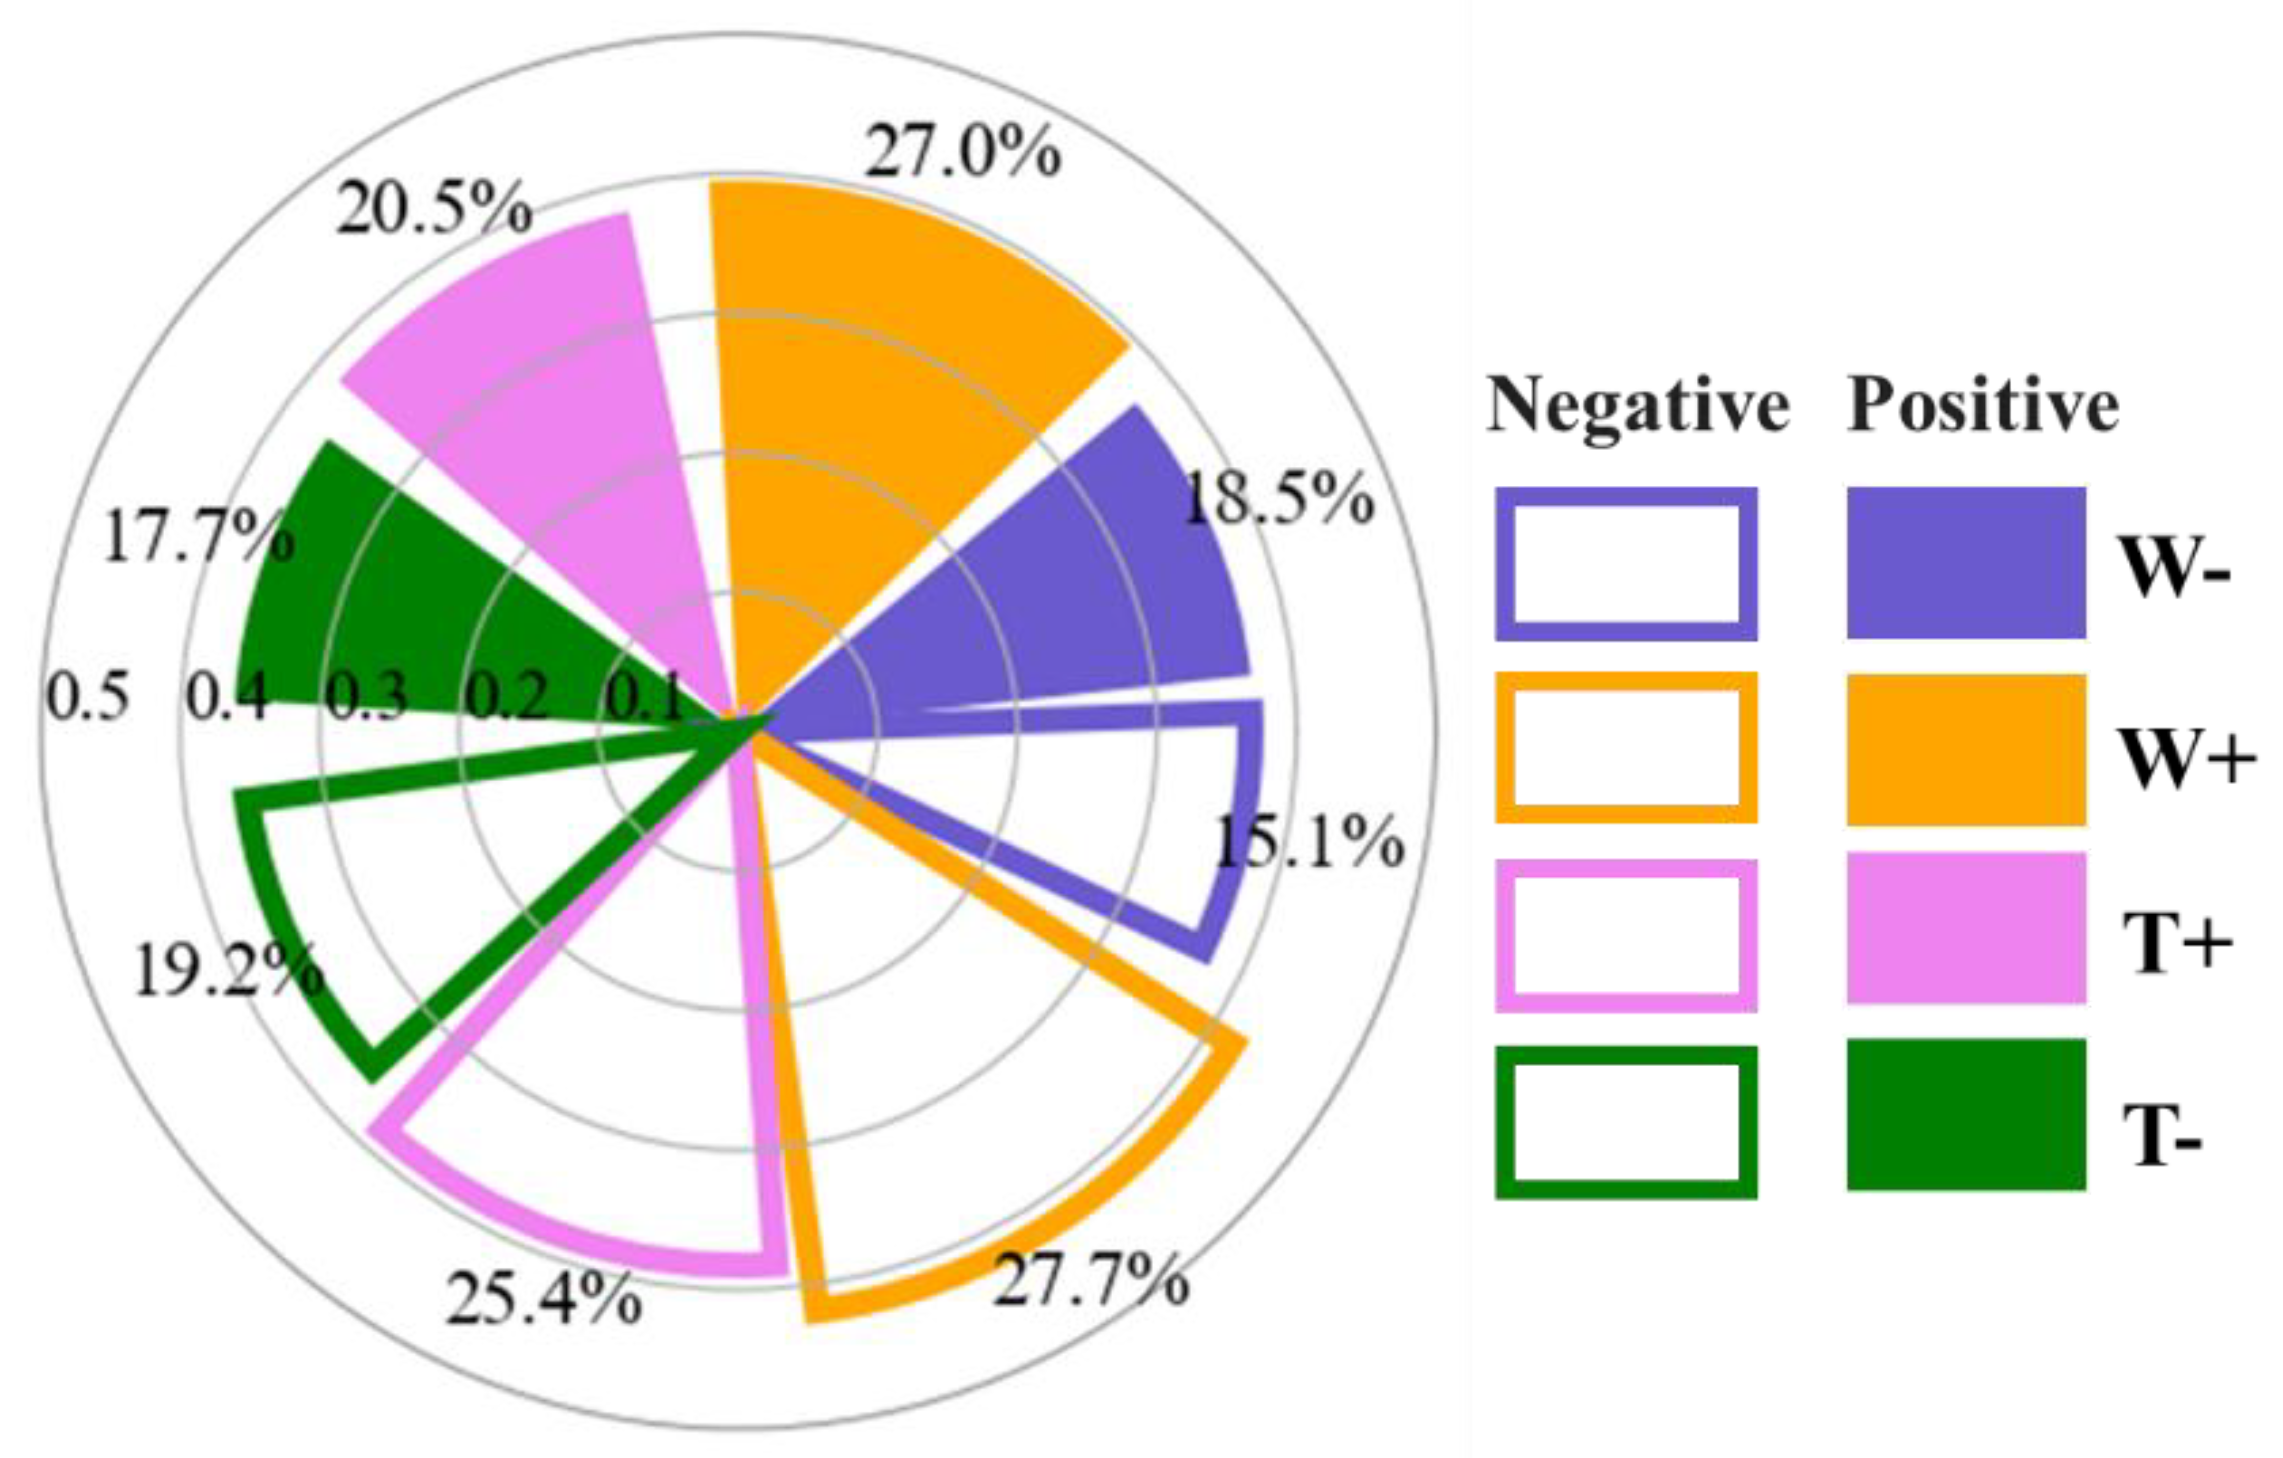
Figure 7.
Coincidence rate (CR) distribution between negative growing season length anomalies and extreme weather events across regional hydrothermal gradients (regional growing-season (GS) temperature and precipitation). Curves (upper-right) depict mean CR per 0.5°C thermal or 50 mm precipitation interval.
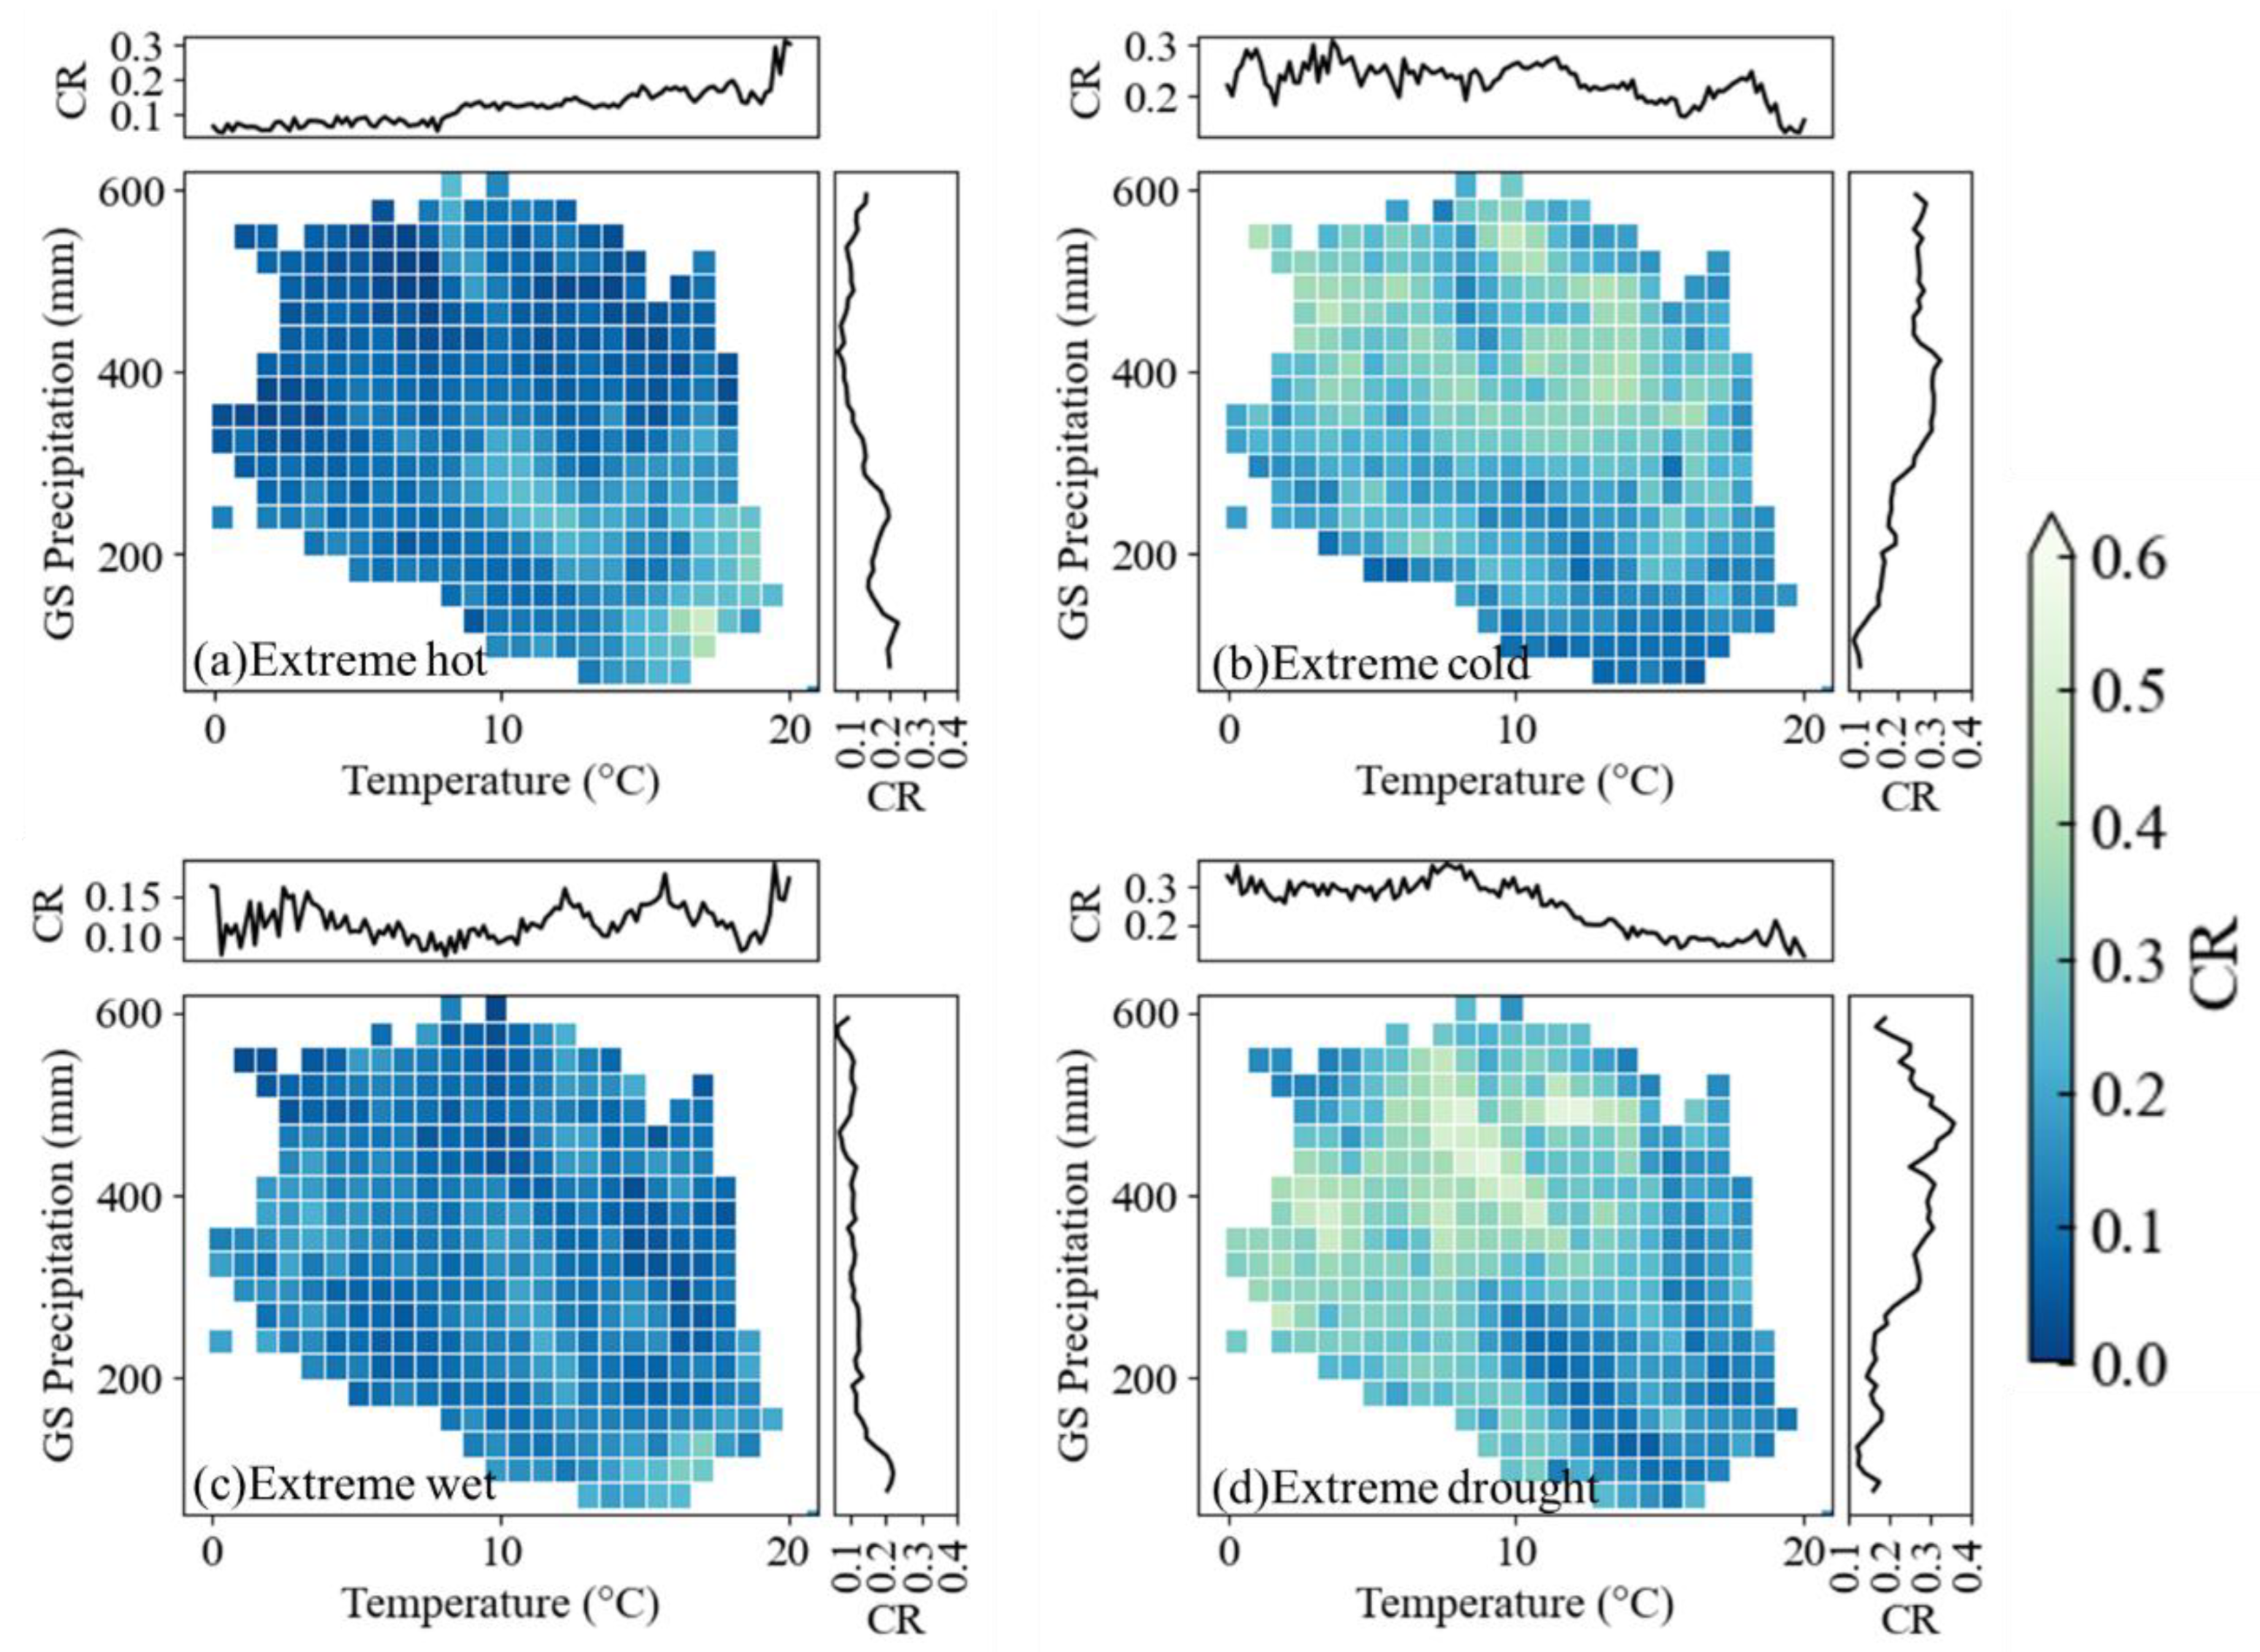
Figure 8.
Coincidence rate (CR) distribution between positive gradients (regional growing-season (GS) temperature and precipitation). Curves (upper-right) depict mean CR per 0.5°C thermal or 50 mm precipitation interval.
Figure 8.
Coincidence rate (CR) distribution between positive gradients (regional growing-season (GS) temperature and precipitation). Curves (upper-right) depict mean CR per 0.5°C thermal or 50 mm precipitation interval.
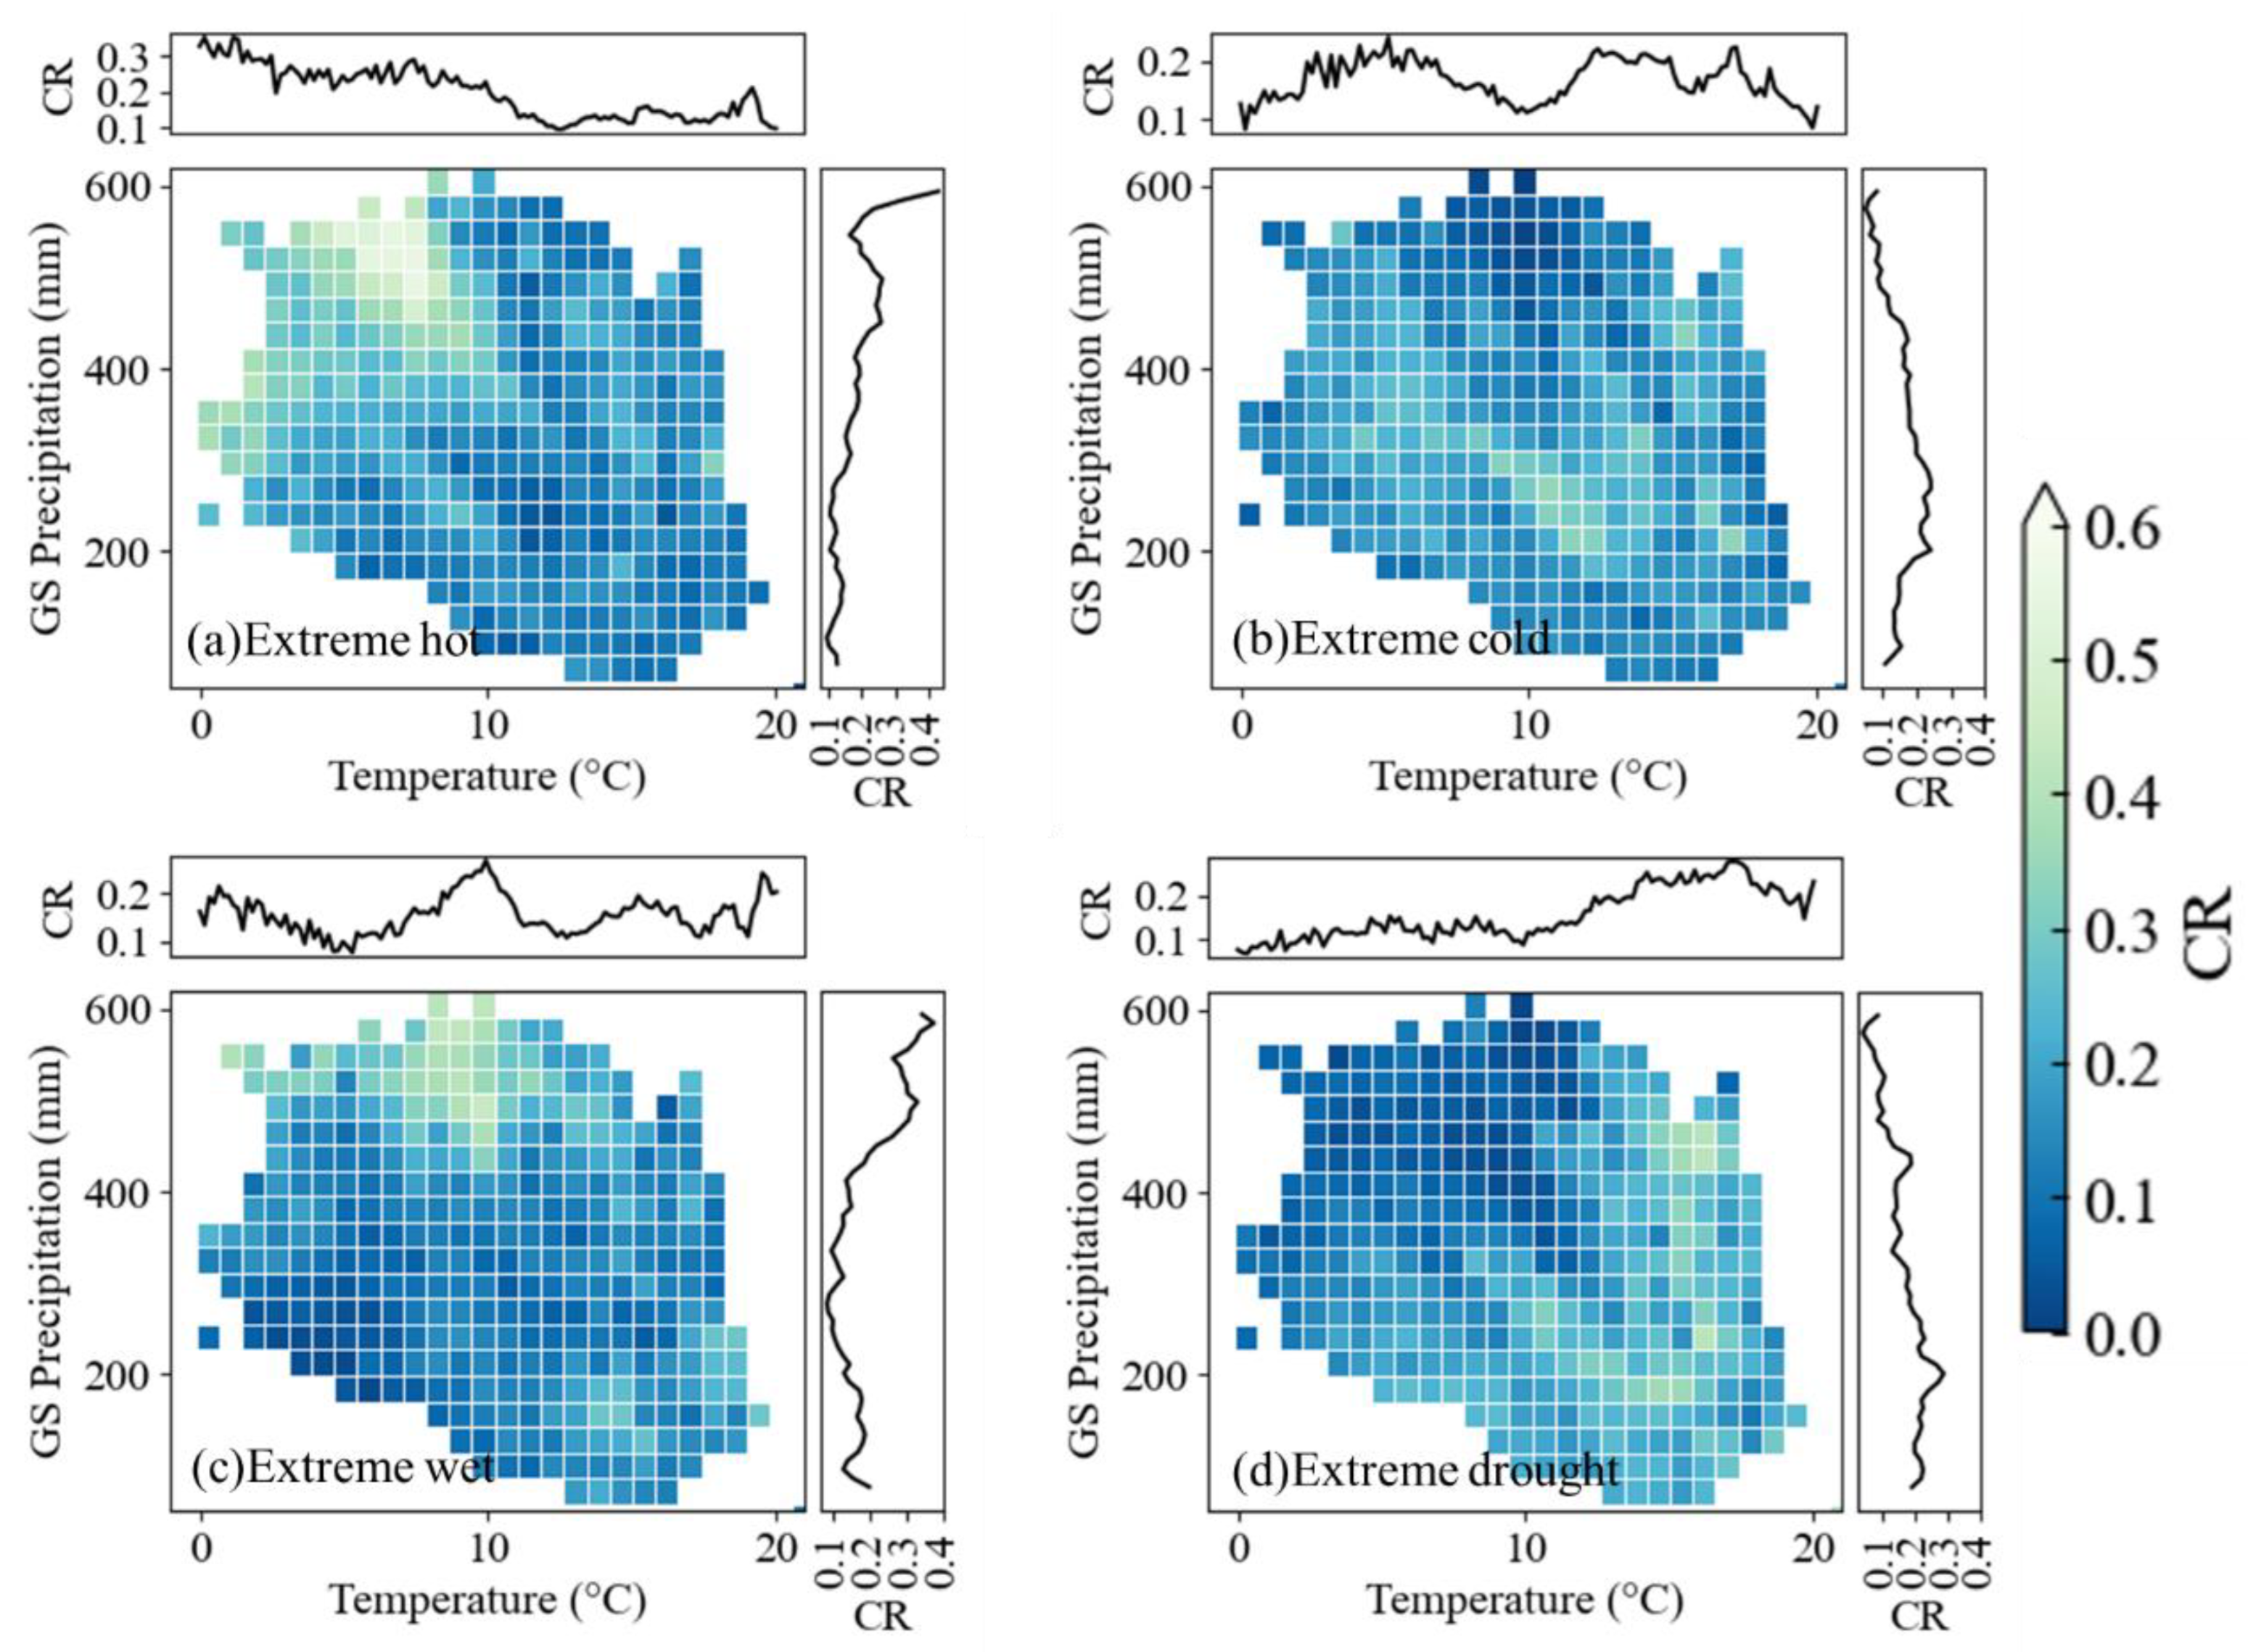
Figure 9.
Vegetation Growing season Length (GL) anomaly sensitivity to extreme weather events (EWEs). Insets show %-wise contribution of each event type.
Figure 9.
Vegetation Growing season Length (GL) anomaly sensitivity to extreme weather events (EWEs). Insets show %-wise contribution of each event type.
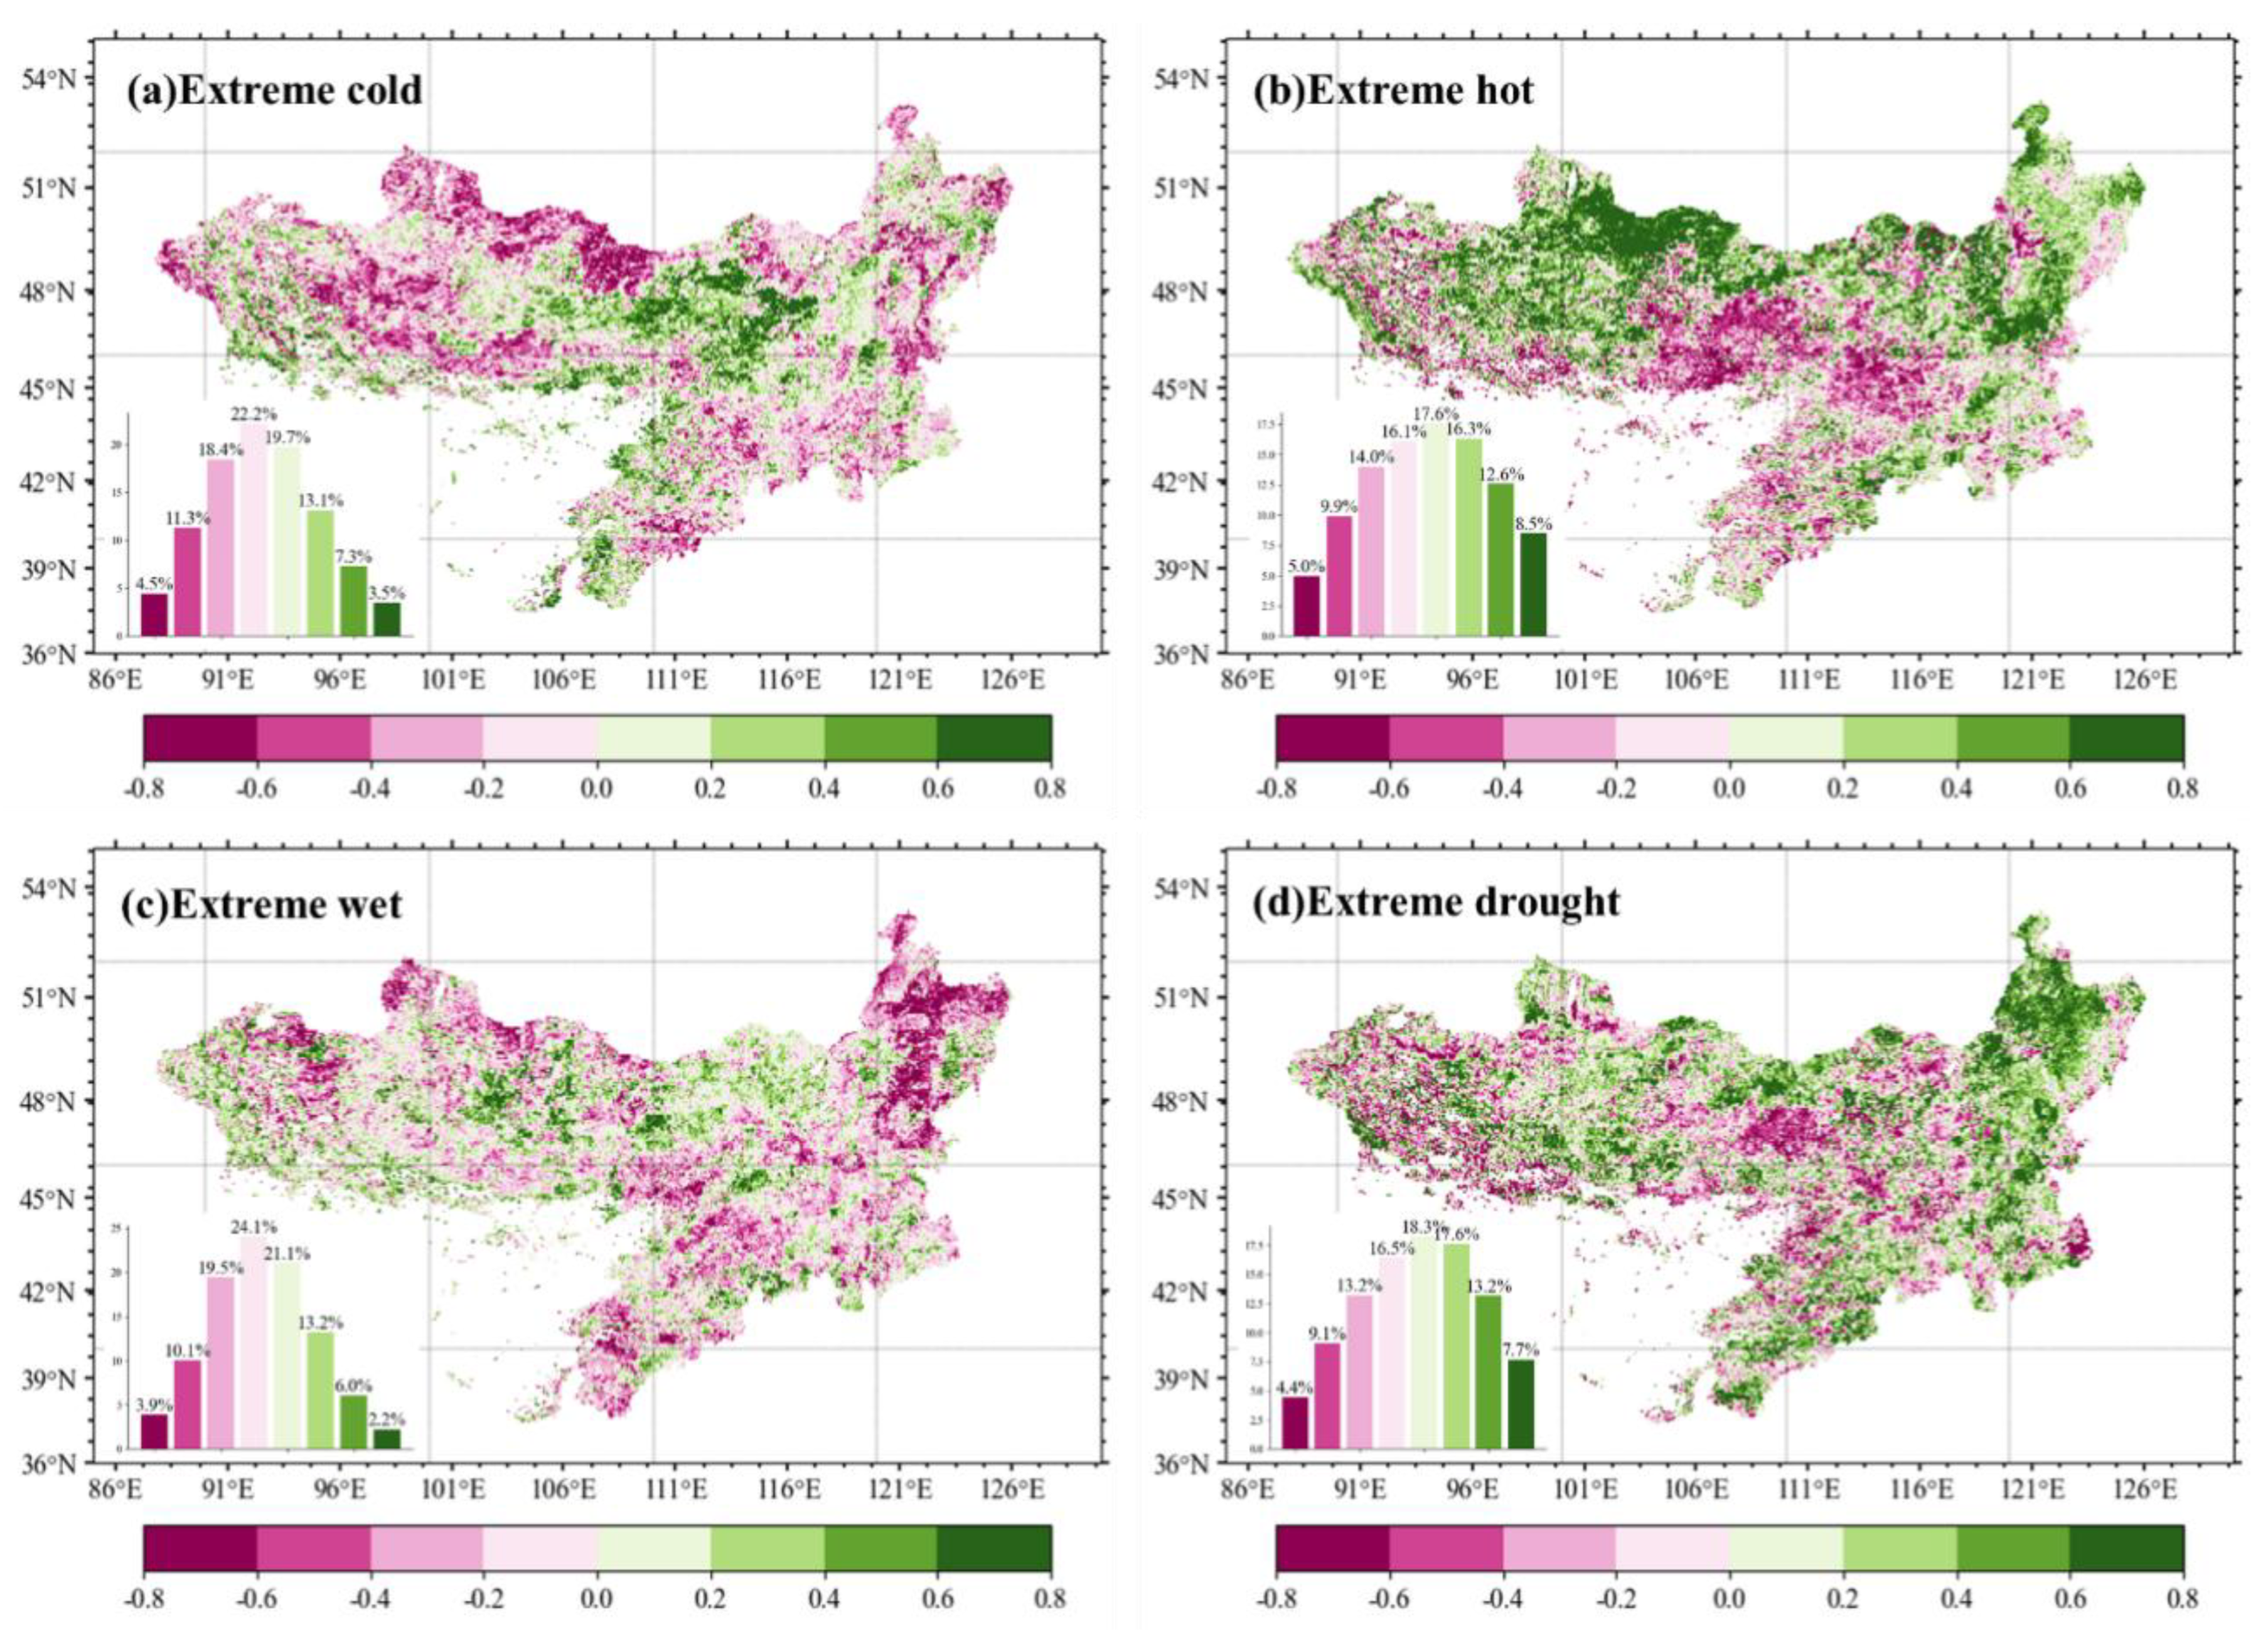
Figure 10.
Distribution of Growing season Length (GL) sensitivity to extreme weather events (EWEs) of different vegetation types along the temperature and precipitation gradients in the Mongolian Plateau.
Figure 10.
Distribution of Growing season Length (GL) sensitivity to extreme weather events (EWEs) of different vegetation types along the temperature and precipitation gradients in the Mongolian Plateau.
Disclaimer/Publisher’s Note: The statements, opinions and data contained in all publications are solely those of the individual author(s) and contributor(s) and not of MDPI and/or the editor(s). MDPI and/or the editor(s) disclaim responsibility for any injury to people or property resulting from any ideas, methods, instructions or products referred to in the content. |
© 2025 by the authors. Licensee MDPI, Basel, Switzerland. This article is an open access article distributed under the terms and conditions of the Creative Commons Attribution (CC BY) license (http://creativecommons.org/licenses/by/4.0/).
Copyright: This open access article is published under a Creative Commons CC BY 4.0 license, which permit the free download, distribution, and reuse, provided that the author and preprint are cited in any reuse.


