Submitted:
17 March 2025
Posted:
18 March 2025
You are already at the latest version
Abstract
This paper addresses the critical challenge of evaluating the quality of Cyber Threat Intelligence (CTI) products, particularly focusing on their relevance and actionability. As organizations increasingly rely on CTI to make cybersecurity decisions, the absence of CTI quality metrics challenges the assessment of intelligence quality. To address this gap, the article introduces two innovative metrics. Relevance (Re) and Actionability (Ac), which are designed to evaluate CTI products in relation to organizational information needs and defense mechanisms. Using probabilistic algorithms and data structures, these metrics provide a scalable approach for handling large numbers of unstructured CTI products. Experimental findings demonstrate the effectiveness of metrics in filtering and prioritizing CTI products, offering organizations a tool to prioritize their cybersecurity resources. In addition, the study has identified certain limitations, which opens avenues for future research, including real-time integration of CTI into organizational defense mechanisms. This work significantly contributes to standardizing the quality evaluation of CTI products and enhancing the cybersecurity posture of organizations.
Keywords:
cyber threat intelligence
; information security
; quality measurement
; probabilistic algorithms
1. Introduction
Cyberattacks continuously threaten organizations worldwide, seeking to compromise their assets’ confidentiality, integrity, and availability. In the past decade, the majority of threat actors have become professionals, with ENISA distinguishing the majority of them into the following groups: state-sponsored actors, cybercrime actors, hacker-for-hire actors, and hacktivists [1]. At the same time, these actors can organize highly sophisticated and coordinated attacks such as disinformation attacks, distributed denial of service, and supply chain attacks.
This hazardous environment leads organizations to adopt new defense mechanisms with Cyber Threat Intelligence (CTI) to have a prominent role in their defense arsenal. CTI is the field where data from various sources is collected, analyzed, and assessed about threat actors and their motivation, attacks’ methodology, and victims to produce intelligence that helps organizations prevent or predict a cyberattack and follow intelligence-based decision making [2]. Although most cybersecurity specialists understand the importance of CTI and believe that the quality of CTI meets their standards, they are also concerned about missing actionable CTI due to the large scale of data that must be processed daily [3].
The large number of CTI sources and data that organizations use in their daily defense against threat actors make the identification of actionable and relevant CTI a problem that lies in the area of Big Data since the 5Vs (velocity, volume, value, variety, and veracity) differentiate the generated intelligence and its application within defense mechanisms. In addition, relevance and actionability are key quality factors of CTI, introducing the dimension of quality of CTI as an alternative point of view to manage this problem.
In general, the information within CTI encompasses both structured and unstructured data, serving as the input or output of a threat intelligence process [2]. Therefore, identifying the most relevant and actionable CTI products for an organization or a security analyst based on the CTI quality of a large-scale data flow is the problem that this work deals with. To formulate this problem, we have determined the following research questions.
- RQ1: In what ways can the relevance and actionability of unstructured CTI products be defined and quantitatively assessed?
- RQ2: What methodologies can be employed to rigorously assess the CTI products in relation to the organizations willing to use them?
- RQ3: In what manner can the proposed methodologies be systematically applied to extensive datasets?
To answer these questions, we have developed the Relevance () and Actionability (Ac) CTI quality metrics that leverage probabilistic data structures and algorithms to face the large scale of unstructured CTI products, which are the main contribution of this work. Toward the development of , we discuss the information needs of an organization in terms of CTI and introduce the concept of analyzing an organization as an open system in the context of CTI. Similarly, in the case of , we analyze the decision making process in the context of cybersecurity of an organization, and we propose an innovative modeling approach for it, which drives us in the definition of the metric in relation to the defense mechanisms of an organization. Finally, in the last part of this work, we implement the metrics and experimentally measure them against a dataset of CTI products.
The remainder of this paper is organized as follows. Section 2 presents the related work and alternative approaches in the bibliography. Section 3 presents the background of this work divided into three subsections; in Section 3.1, we present the key concepts and definitions related to this work; in Section 3.2, we formally define the problem described in the introduction; and in Section 3.3, we present the algorithmic and mathematical background of this work. The proposed metrics are presented in Section 4. In Section 5, we propose an implementation of the two metrics and explain the implementation assumptions. In addition, the experimental results of the application of the proposed metrics in unstructured CTI products are analyzed. Finally, in Section 6, we present our conclusions and future work.
2. Related Work
In the bibliography, few works deal with massive unstructured CTI data quality. There is a perplexity between the quality of CTI sources and the quality of the produced intelligence (CTI products). Moreover, the formal identification of actionable and relevant CTI quality factors remains a significant research challenge, due to the diverse methodologies employed by researchers. Only a part of the bibliography deals with CTI quality; for example, Tale et al. [4] discuss the quality of large unstructured data. They propose the construction of a data quality profile for a dataset using only a sample for their analysis that captures the general features such as type, format, and data domain. They use the data quality profile as input in their unstructured big data quality assessment model to evaluate the overall quality of the dataset. But, their work is domain-agnostic and does not focus on CTI.
Azevedo et al. [5] propose the PURE platform to generate enriched Indicators of Compromise (IoCs) that improve the quality characteristics of IoCs collected from different sources of OSINT. To succeed in the development of enriched IoCs, the authors combine filtering, deduplication, and clustering techniques based on the similarity of IoCs. However, PURE has been designed to handle average data volumes and the authors do not explain the cost of calculating the respective similarity indices.
Schaberreiter et al. [6] propose a methodology for evaluating the trust of CTI sources. Their method is based on the calculation of ten parameters (extensiveness, maintenance, false positives, verifiability, intelligence interoperability, compliance, similarity, timeliness, and completeness) on STIX objects and the continuous estimation of a trust indicator for each source. However, the authors follow a closed-word assumption, namely that the CTI shared by the sources comprises the entire worldview of threat intelligence, which is contrary to the belief of unknown unknowns in threat intelligence [7].
Zhang et al. [8] propose the Threat Intelligence Automated Assessment Model (TIAM), for the quality assessment of large-scale CTI. More specifically, they aggregate IoCs extracted from STIX objects and sparse text-based intelligence to assess the overall intelligence. Then, they correlate the IoCs with the ATT&CK knowledge base [9] to identify potential attack techniques. TIAM defines the alert level, the created time, the external references, and the Common Vulnerability Scoring System (CVSS) (only in the case of vulnerabilities) as the assessment features of IoCs and proposes weighted scores for each evaluation. However, the authors do not explore quality factors such as accuracy, timeliness, and completeness and how these quality factors can be measured in the case of large-volume CTI.
The rest of the related bibliography refers to the use of big data techniques to handle CTI.
Tao et al. [10] proposed a modified classified protection model based on CTI and big data analysis techniques, in which CTI is utilized in awareness and detection of the defense mechanism. However, the system that implements the modified model is based on the bulk consumption of CTI without evaluating the quality of the data. At the same time, no false-positive/negative detection statistics are presented.
Marchetti et al. [11] propose the AUSPEX framework for the detection of advanced persistent threats (APTs). AUSPEX utilizes internal and external sources of raw data (e.g., logs, OSINT) and CTI to detect APTs, which are then analyzed using big data techniques. However, CTI is used only in the form of blacklists without mentioning their effectiveness.
Wheelus et al. [12] propose a big data architecture specialized in collecting and analyzing CTI data by combining existing and widely used big data techniques. Moreover, they use the proposed architecture to demonstrate its capabilities in a series of CTI problems such as malware-type detection. However, they do not explore the quality of the results and how the latter can become part of CTI products.
Finally, Martins et al. [13] develop the Automated Event Classification and Correlation platform, which combines classification, trimming, enrichment, and clustering techniques to improve the quality of events on threat intelligence platforms. They propose a unified taxonomy that seeks to simplify the categorization of a threat. However, they do not explain what quality factors are intended to improve and how to measure this improvement.
Through a comprehensive review of the pertinent literature, we have identified several research gaps, resulting into the formulation of the research questions delineated in Section 1: (a) the CTI quality factors, particularly relevance and actionability, lack precise definitions, and the metrics used for quality evaluation are not explicitly correlated with these quality factors, (b) there is a tendency to evaluate the quality of CTI products interdependently of the consumer’s (e.g., organizations) characteristics that intends to use them, and (c) the employment of CTI quality measurement on large-scale datasets remains limited.
3. Background
3.1. Key Concepts
3.1.1. Unstructured CTI Products
The results of a threat intelligence process are called CTI products [2]. Those results can take a structured or unstructured format. Structured CTI products [14] are formatted following a standard such as STIX [15], whereas unstructured CTI products are written in natural language or do not follow a well-defined standard. For the remainder of this paper, we focus on unstructured CTI products and use unstructured text data that contain information about cybersecurity as our experimental base.
3.1.2. Relevance CTI quality factor
Relevance is a crucial CTI quality factor [16], which determines the level at which the content of a CTI product meets the informational needs of a specific CTI consumer [2] employing it in decision making. Pawlinski et al. [17] state that a piece of information (e.g., a CTI product) is considered relevant if it is "applicable" in the area of the one that uses it, where the term "area" describes the networks, software, and hardware comprising one’s systems. Moreover, Deliu et al. [18] stress that an effective CTI process should result in relevant CTI products. In summary, the relevance CTI quality factor reflects the level at which a CTI product is considered to have a cybersecurity impact on the CTI consumer. In this context, "impact" pertains to modifications within the system, which may manifest as alterations in the system architecture, implementation of security controls, and the commencement of cybersecurity protocols (e.g., incident management).
3.1.3. Actionability CTI Quality Factor
In general terms (that is, including system decisions, e.g., IDS detection and experts’ decisions), the actionability CTI quality factor expresses the immediacy of the use of a CTI product in a decision-making process[16]. In addition, actionability appears to be a compound quality factor that integrates other CTI quality factors such as relevance, completeness, ingestibility, accuracy, and timeliness [16,17,19]. In general, actionability reveals at what level a CTI product can initiate a decision by a CTI consumer at a given moment.
3.2. Problem Definition
Consider a set of CTI sources S, which produce a large number of unstructured CTI products that have the characteristics of big data 5Vs (velocity, volume, value, variety, and veracity). In this case, the fundamental research question is how we can evaluate the quality of those unstructured CTI products in reference to a given organization C that aims to use them as input to a decision making or a CTI process and wants to avoid investing resources in the analysis of unrelated data. In this context, we investigate the development of two metrics, and , to quantify the relevance and actionability CTI quality factors for unstructured CTI products, respectively.
3.3. Probabilistic Algorithms & Data Structures
Probabilistic algorithms and data structures have been proposed in the bibliography [20] to handle problems in the area of Big Data. Those algorithms, being nondeterministic by definition, utilize mainly hashing techniques, and their results include a "tolerable" error. Next, we present two categories of probabilistic algorithms and data structures: those focusing on the similarity problem, and those focusing on the membership problem. We use the first category of algorithms on the definition of the relevance metric (), and the second category of algorithms on the definition of the actionability metric ().
3.3.1. Probabilistic Algorithms and Data Structures of Similarity Category
Probabilistic algorithms and data structures in the similarity category handle problems such as finding the nearest neighbor for a given document, detecting duplicates, and clustering. This similarity category includes algorithms and data structures such as MinHash [21]. Similarity expresses the level of resemblance between two objects (for example, documents). To handle this problem numerically, objects are usually represented as sets of features called canonical forms in the case of documents. Then, the Jaccard similarity is used to calculate the percentage of their common features (i.e., similarity). Formally, the Jaccard similarity for two documents , is given by the formula: .
MinHash implements Locality Sensitive Hashing (LSH) [22]. The basic idea is that when similar documents are hashed with an LSH algorithm, they are highly likely to produce hash values in a close range. An LSH function generally ensures that the collision probability for similar documents is higher than for two irrelevant, random documents. An LSH algorithm combines two functions: Locality-Sensitive Bucketing, which maps documents in a hash table of buckets indexed by the hash values, and the Finding Similar Documents function, which searches the hash table for a given document d and returns its candidate documents, then calculates the similarity of d and the returned documents to find those that have a similarity above a certain threshold.
In the case of MinHash, let us consider a set of indexed features (words) that we are looking for in documents, and let us say that a document (d) contains a number of these features. If we construct a bit array for the indexes and set the indexes of the features of d to 1 and randomly permutate the indexes, then the minhash value of d is the position of the left-most set bit on the permutated bit array. If we choose k-random permutations, we construct the minhash signature for d by assigning each of the respective minhash values to a k-length vector. For a set of documents , MinHash creates the minhash signature matrix, where the rows correspond to permutations and the columns to documents. In its implementations, MinHash uses a random hash function. Moreover, it has been proven that for documents , the probability that their signatures on the MinHash signature matrix are equal is the Jaccard similarity of those documents .
3.3.2. Probabilistic Algorithms and Data Structures of Membership Problem Category
Probabilistic algorithms and data structures belonging to the category of the membership problem are tasked with deciding whether an element is a member of a dataset or not [20]. The category of membership problem includes algorithms and data structures like the Bloom filter [23] and the Cuckoo filter [24]. A Cuckoo filter is a data structure that leverages the Cuckoo hashing.
Hash functions, particularly cryptographic hash functions (e.g. SHA256), are widely used in cybersecurity and play a crucial role in probabilistic algorithms and data structures. Generally speaking, a hash function maps an arbitrary size of data to a fixed length hash value: -length. A hash table is a dictionary that comprises a m-length unordered array of k-buckets indexed by key . An element x is inserted in the bucket with the key , where h is a hash function of the range .
Cuckoo hashing utilizes two hash functions instead of one to index a new element to the cuckoo hash table, namely an array of buckets where an element has two candidate buckets, one for each hash function. A new element is inserted into one of these two buckets if it is empty; otherwise, the algorithm randomly selects one of the two occupied buckets and inserts the element, moving the existing element to its alternative candidate bucket. The process repeats until an empty bucket is found or until a maximum number of displacements is reached. Lookup and deletion are performed by determining the candidate buckets of an element by computing the two hashes.
A cuckoo filter is a variation of a cuckoo hash table, but instead of key-value pairs, it stores fingerprints (f) of a predefined length (p). A cuckoo filter consists of a hash table with a bucket capacity b. The indexes of the candidate buckets for an element x are calculated by applying the following three equations: , , and . The interesting characteristics of a cuckoo filter with respect to the membership problem are that false positives are possible with probability . In contrast, false negatives are impossible (that is, ). Moreover, cuckoo filters support dynamic addition and deletion.
4. Proposed Algorithms
4.1. Defining the Relevance CTI Quality Metric
To quantify the relevance of a CTI product, we need to determine the reference point to which we define and measure the CTI quality metric, which in our case is organization C (cf. Section 3.2). As discussed in Section 3.1, the relevance quality factor is related to the informational needs of C and the applicability and the potential impact of a CTI product on C. However, to define the Relevance quality metric, , we need to analyze in more detail what organization C is and how those abstract notions (i.e., informational needs, applicability, impact) are defined within C.
4.1.1. Determining Organization C
According to Scott and Davis [25], an organization can be described as an open system [26], meaning that it comprises parts that operate as one, interacting with the environment to achieve its goal. As a result, an organization is modeled as a system that receives input (i.e. materials, human resources, capital, technology, information), applies a transformation (i.e., work activities, management activities, technology, and operations methods) and generates output (i.e., products, information, financial, and human impact). The environment that affects an organization can be further divided into three layers [27]:
- the general environment,
- the task environment, and
- the internal environment.
The general environment affects all organizations almost equally and includes international, technological, natural, sociocultural, economic, and legal/political aspects. The task environment includes customers, competitors, suppliers, and the labor market, which interact directly with an organization. Finally, the internal environment includes the interorganizational aspects of employees, management, and culture, which handles the transformation of input to output.
4.1.2. Organization Aspects and the Relevance CTI Quality Metric
The environments described in Section 4.1.1 determine the information needs, the applicability, and the impact of a CTI product on an organization. The core idea of the proposed quality metric is the observation that an organization is interested in information that helps it survive (i.e. applicability and impact) and obtains this information as input from each of its environments. Information needs are usually expressed as questions, e.g., which vulnerabilities affect our information systems? Which business areas were attacked more last year?
At the same time, information applicability and impact can act as a filter for potential answers to information needs. For example, let us assume that an organization receives CTI products related to cyber attacks in business areas similar to those in which the organization operates; moreover, those cyber attacks are based on the exploitation of a specialized operating system. In this case, the organization needs to know about cyber attacks against the business areas in which it operates (information need). Consequently, it investigates the received CTI products, to determine whether the exploited operating system is part of its information systems (applicability) and whether the version of the operating system it uses can be exploited (impact).
To focus more on CTI, we identify the following relative aspects of each environment [27] that can be a source of threat information for an organization: international, technological, customers, competitors, suppliers, and employees. Each of these aspects can be related to the input, the transformation process, and the output of an organization. Hence, the fundamental question is: How can we use those environmental aspects to identify the potential relationship of a CTI product with an organization? To answer this question, we observe that a threat can impact the inputs, the transformation process, or the output of an open system. For this reason, we adopt and extend the notion of the information landscape [28] to combine the information needs of the organization related to a CTI product and the applicability and impact of the information that a CTI product delivers to an organization. For each organization, we propose three information landscapes: input landscape (), transformation process landscape (), and output landscape ().
Landscape includes the information needs related to the suppliers, competitors, and capital sources of an organization. Those needs arise from the potential later impact against suppliers, competitors, and capital sources that a cyber threat can cause to an organization.
Landscape includes those information needs related to an organization’s business activities (e.g., business areas that an organization operates), its internal operations (e.g., HRM) and its information systems (that is, the information needs of reflect the three risk assessment tiers described in NIST SP 800-30 [29]).
Finally, landscape includes information needs related to an organization’s products (e.g., does a threat actor focus against a specific brand product?) and providing services. In the context,Relevance metric these landscapes are materialized as unstructured text documents that contain detailed expressed information needs.
4.1.3. Relevance Metric Generic Calculation Mechanism
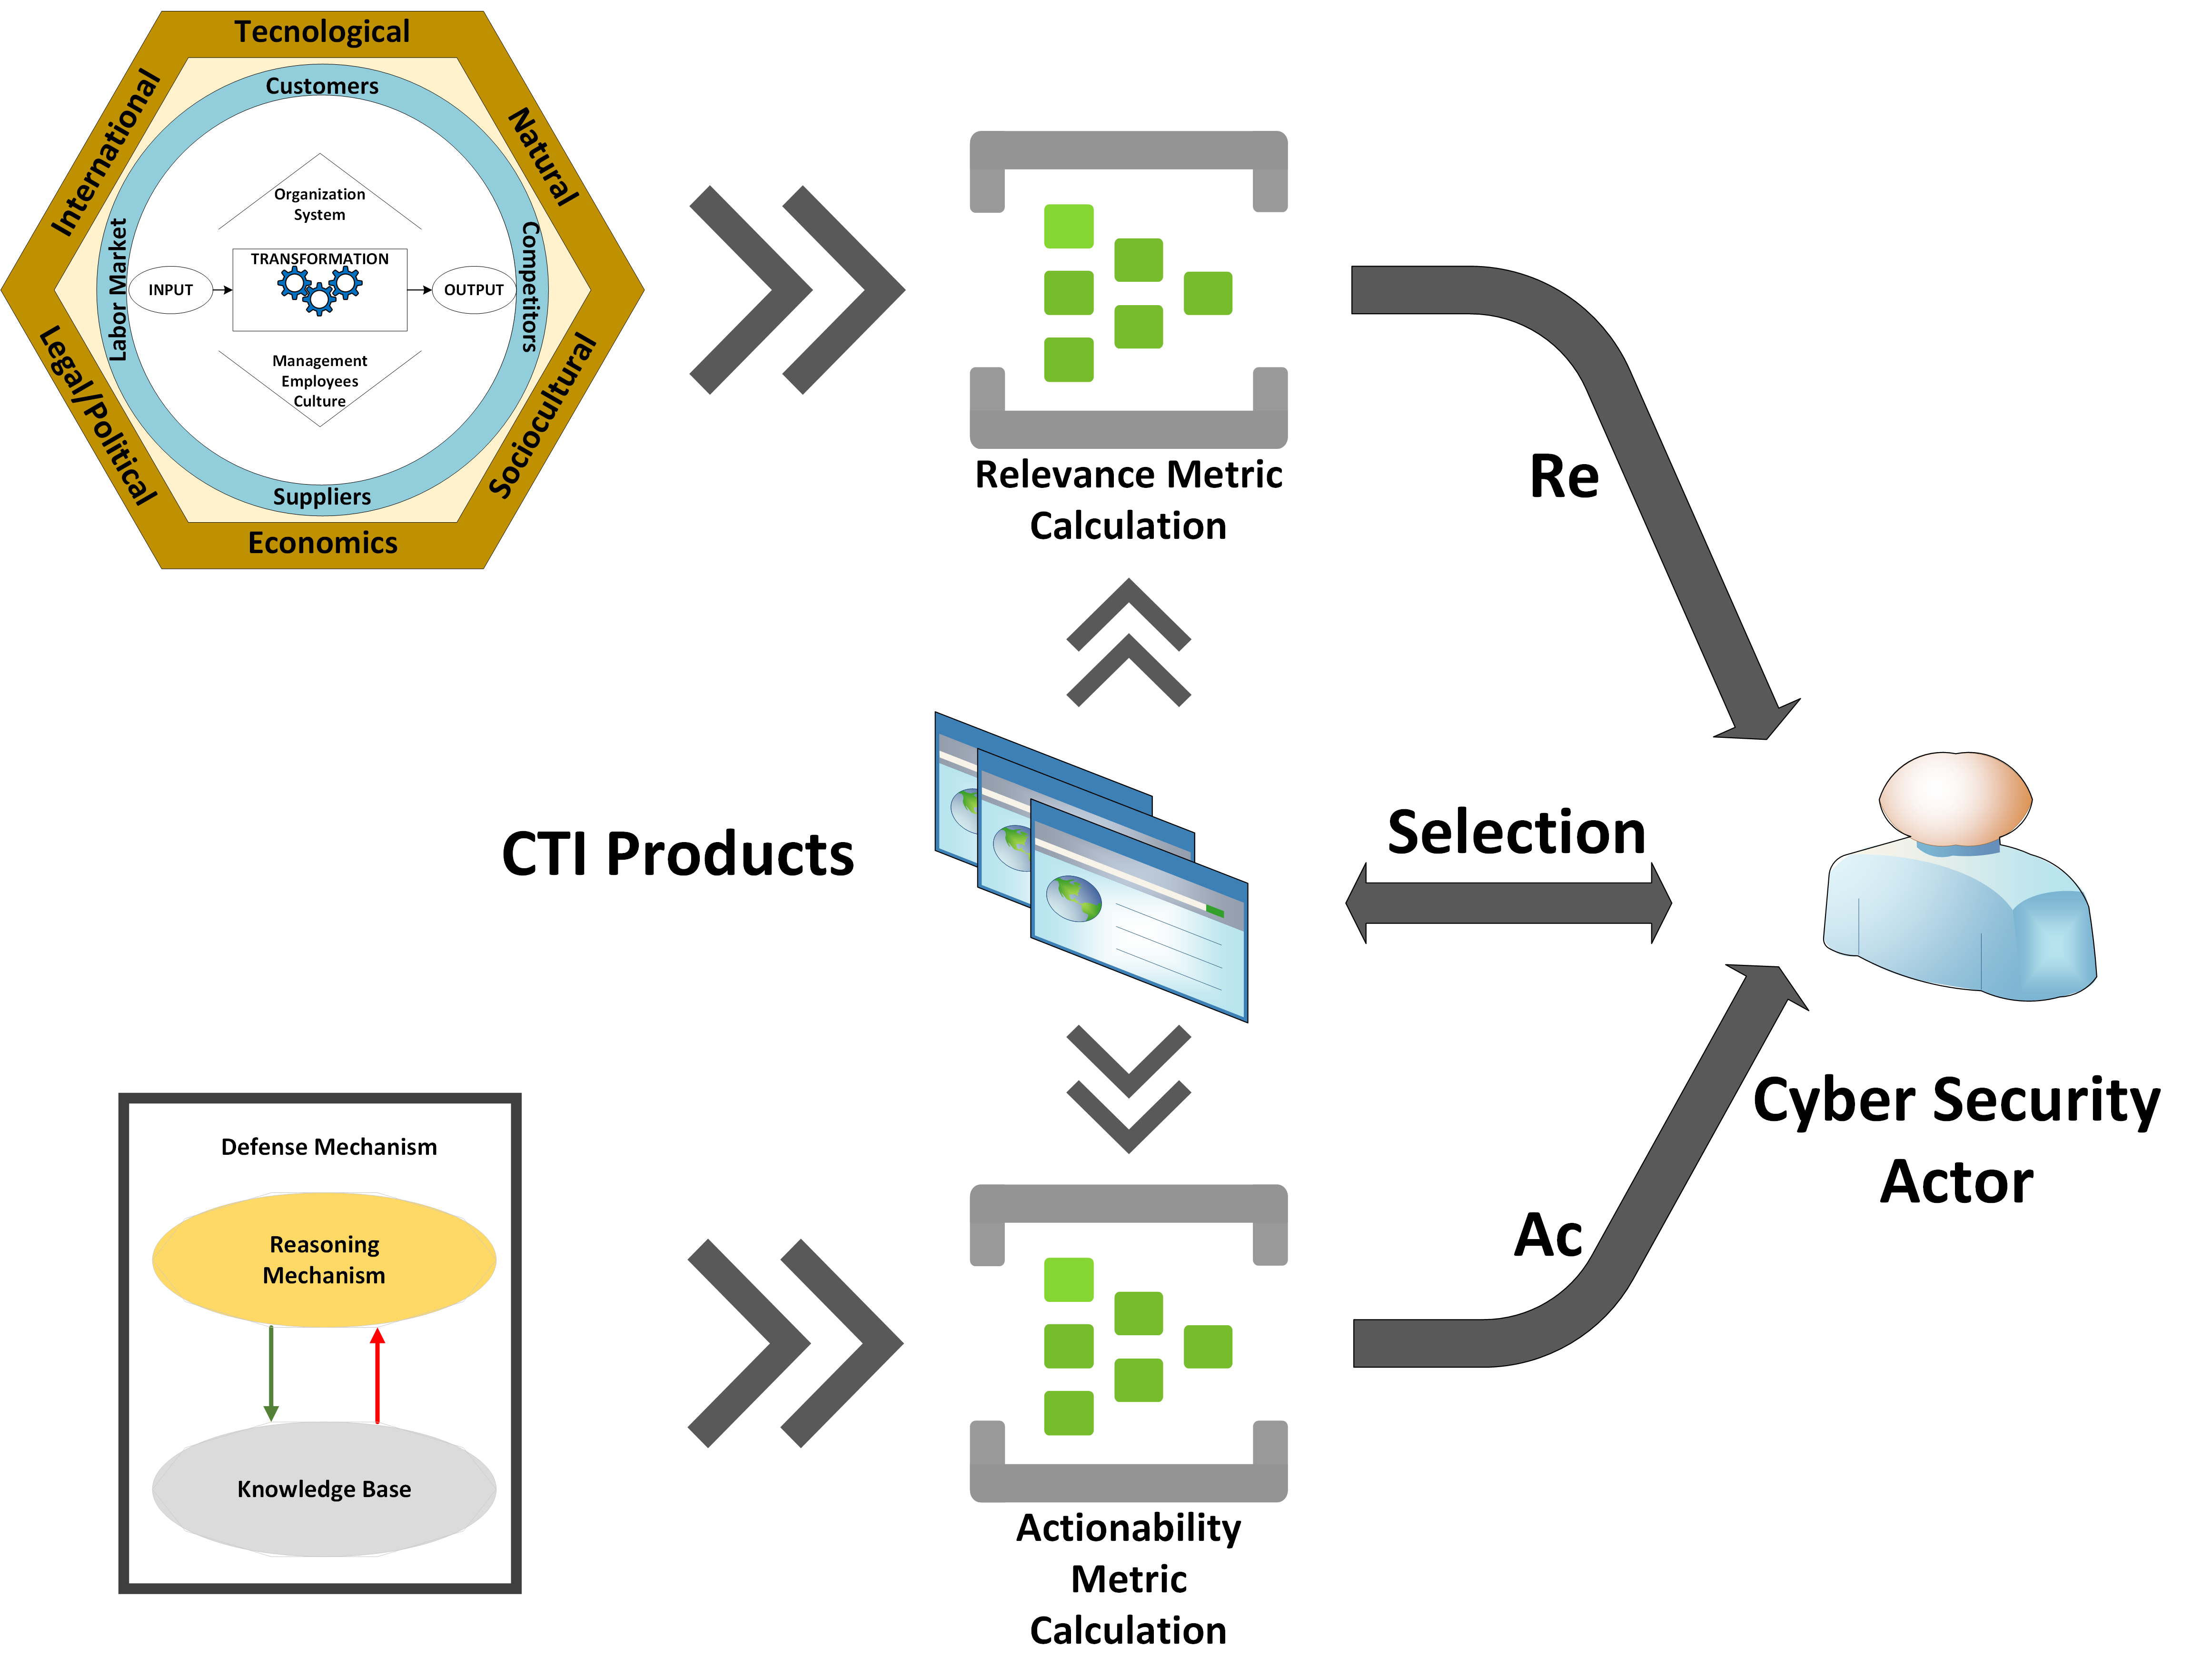
The generic idea of calculating the relevance metric is based on MinHash Signatures estimated between the information landscapes of an organization C and a CTI product. These probabilities represent the level at which a CTI product responds to the information needs of an organization. Then a weighted average of those probabilities is calculated, representing the metric. Figure 1 depicts the generic mechanism for calculating the metric.
To define in detail the proposed metric , we follow the eight-step methodology of [30] as outlined in Table 1.
STEP 1
As first step, we name the metric in development. According to our analysis in Section 4.1.1 and Section 4.1.2, we intend to develop a metric , which measures the relevance of the CTI product P with the organization C taking into account the information needs of C.
STEP 2
Having define the metrics name, we need to identify and determine the variables that contribute to the metrics calculation. So, we determine the set of variables X that calculate . Based on our analysis in Section 4.1.2, X includes the three landscapes , and , and the CTI product P. So,
At this point, we need to analyze in more detail what these variables contain and how they can be constructed. First, we turn our attention to the three proposed landscapes. Each of the variables , , and is the textual representation of the information needs of C. Therefore, should contain the textual description of the information needs of C about its suppliers, competitors, and capital sources. should contain the textual description of the information needs of C about its business activities, internal operations, and information systems. Finally, should contain the textual description of the information needs of C about its products and services. These variables can be constructed and updated using formal taxonomies (e.g., DIT [31]) that describe business activities, products, services, capital sources, etc., or C can construct them by writing its information in a text format (e.g., competitor A has the following business activities; we use version K of the information system B). Accurate determination of information needs in the context of CTI is a future research challenge. However, Section 5 presents an example of how organization C can construct them. Here, P represents the textual form of a CTI product.
STEP 3
Here, the methodology [30] focuses on the definition of the mathematical function that calculates the metric. So, in this step, we define a function F, which calculates the metric. As we have previously mentioned, the idea is that when we only have to select a few CTI products from a bunch of millions of CTI products, represented in text format, we select those that are close to the information needs of an organization. We calculate the value of by averaging the three MinHash values () of the CTI product P and the information landscapes of organization C. So, we define F as:
STEP 4
In this step, we determine the subjectivity and objectivity of , which is defined as in [30] and takes one of the values in . A metric is characterized as subjective or objective by examining two characteristics: the involvement or not of the human factor in the determination of its variables and the deterministic or non-deterministic characteristic of metric’s F. We observe that the human factor is involved in the determination of , , and because these variables express the information needs of an organization C. Therefore, is estimated from subjective data. Moreover, using the function in the calculation of introduces a non-deterministic component because it requires the selection of a number of random hash functions. So, we can say that is a subjective metric of subjective data. In summary, we infer that .
STEP 5
In this step, the methodology theoretically estimates the performance of metrics F, which is usually expressed as time complexity, by analyzing the algorithm that calculates F. We use Algorithm 1 to estimate the performance of , expressed as time complexity. As stated in [21], a algorithm that uses k hash functions has a time complexity of . The algorithm that calculates comprises the application of three functions and the calculation of the average value of their results. Therefore, the performance of calculating is because the three functions are applied independently, and the average value is calculated only once. In conclusion, we have the performance to be equal to for the metric, expressed in time complexity.
| Algorithm 1 Metric Calculation Algorithm |
|
STEP 6
In this step, the methodology theoretically analyzes the accuracy of F, which in simplicity explains how close to the real value of the metric is the calculated one. The calculation of includes a nondeterministic factor (that is, introduced by the use of ). Specifically, estimates the similarity of two given documents with an error probability related to the number of hash functions k. In simple words, the accuracy of increases as the number of hash functions used increases ([32]), with a cost on the storage space required for the calculation of . Consequently, the accuracy of depends on the errors of the functions of Algorithm 1 (). Thus, , where ( the Jaccard similarity of P and ), ( the Jaccard similarity of P and ), and ( the Jaccard similarity of P and ).
STEP 7
In this step, the methodology performs a sensitivity analysis of the metric’s F to theoretically determine how sensitive is F in changes of its input variables. We use the elementary effects method [33] to perform a theoretical sensitivity analysis of F. To apply the elementary effects method, we first identify the variables of X whose change organization C does not control. Of the four variables, , only P can be changed by actors that do not belong to C. On that note, we observe that P is the input of three different functions that comprise F, and each of these has one of the variables , as each second input. Applying the elementary effects method, we consider the t selected levels (a selected level represents a discrete value in which a variable can be set during the application of the elementary effects methods) at which P and (a new CTI product that is derived by randomly causing minor changes in P) can be set, where is their discretized input space. Then, the elementary effect of P, , is:
where and . Then the distribution of is derived by randomly sampling from . According to the elementary effects method, the sensitivity measures are the mean () and standard deviation () of the distribution , and the mean of the absolute values () of of the respective distribution . Here, assesses the influence of P in , again assesses the influence of P in simultaneously handling negative values of , and reveals the total effects of the interactions between the variable P and the variables , , and . Following the sampling approach proposed in elementary effects method [33], we conclude that for the distributions , derived from r samples, we calculate as follows:
To simplify the calculation, let us explore how a change in P affects the value of between P and . We consider that n-hash functions construct the signatures, (i.e. n-length signature). Then, is given by the formula:
where is Kronecker’s delta. Similarly, for , we calculate:
and we name the difference between the two values . Focusing on the effect of in MinHash calculation, we observe that it is only related to the probability of to affect the bitwise comparison of the two MinHash signatures. Specifically, if we define and , then always affects except for . This is equivalent to the probability that the MinHash value of P and Y is equal to one, , which is always almost one because Y derives from P by adding a small . This means that the value of is practically not affected by . It is only affected by the similarity estimation error of that absorbs the error introduced in by . Moreover, this error is related to the number of hash functions, n, used for the construction of MinHash signatures [20]. As a result, we can consider as -independent, becoming equal to zero for small values of deltas. Similarly to , we define , and . Hence, Equation 3 is transformed into:
In addition, for the calculation of and , we have:
In conclusion, from , we can infer that for small values of deltas regarding , , (Eq. 6) and (Eq. 7), P has a constant influence on , while for large values of deltas, the value of depends on the deviation of . Additionally, from (Eq. 8), we can infer that the interactions between P and variables , and depend on the magnitude of the change (). In simple words, for small changes, we expect , while for large changes, we expect . The threshold of needs to be determined experimentally, for it to be considered large enough.
Having performed the sensitivity analysis, we determine the behavior quality factor [30], as , for .
STEP 8
In summary, we define:
4.2. Defining the Actionability CTI Quality Metric
Similar to Section 4.1, to quantify the actionability of a CTI product, we set organization C as a reference point for the definition and measurement of . As mentioned in Section 3.1, actionability is related to decision-making processes, especially cybersecurity decision-making processes. As a result, to define the metric, we first need to analyze what a cybersecurity decision-making process is.
4.2.1. Cybersecurity Decision-Making Process and Actionability
The decision-making process has been analyzed in the literature in different contexts. However, from a cybersecurity perspective, Magna et al. [34] have modeled the decision-making process and analyzed the types of information needs that are required for a successful choice of action (decision). At the same time, Cotae et al. [35] distinguished three categories of decision-making in cybersecurity: decision-making (a) under-certainty, (b) under-risk, and (c) under-uncertainty. Those categories reflect the state of knowledge of a decision-making system at the moment when a decision is made. From this aspect, a CTI product is actionable when it transforms a decision-making process from an under-uncertainty to an under-risk or under-certainty process.
Furthermore, in the literature [29,36], the actions that a decision making process can result in are summarized in three capability categories: (a) prevention, (b) detection, and (c) response/recovery. Consequently, a CTI product is actionable when it leads to a state change of these capabilities (e.g., adding new rules to an IDS, which is part of the detection capability). In this study, we model these capabilities as cognitive agents, calling them defense mechanisms to define the quality metric of actionability of CTI products, .
4.2.2. Defense Mechanism Modeling
In this study, we define a defense mechanism as a cognitive agent [37,38]. This means that a defense mechanism comprises an inference engine and a knowledge base. In addition, a defense mechanism can receive input from the environment (by communicating), perceive the environment, and generate an output that affects its environment or updates its knowledge base (see Figure 2).
Consider a typical rule-based IDS as an example of how we can model a system with detection capability as a defense mechanism. This IDS consists of a knowledge base (i.e., the IDS’s ruleset), which stores the alert rules, and a reasoning mechanism that generates alerts. Furthermore, it receives input as new alert rules or network traffic. In the first case, the IDS updates its knowledge base, while in the second case, the IDS’s reasoning mechanism compares the network traffic with the alert rules and takes an action (e.g., generate an alert or not).
From a CTI quality perspective, the moment a defense mechanism receives a CTI product () as input, it has its knowledge base in a given state . Then we say that a CTI product causes an action (that is, it is actionable) when the defense mechanism updates its knowledge base to a new state . So, we can express the actionability of a CTI product in terms of a defense mechanism as the conditional probability of its knowledge base changes to the new state given the current state of the knowledge base and the input . In summary, we say .
4.2.3. Actionability Metric Generic Calculation Mechanism
In the case of an organization C, with a set of defense mechanisms , all of which have their knowledge base in a randomly defined state with , a CTI product independently of its other quality factors can be actionable if it leads to a decision that changes one or more of the states of the knowledge base of defense mechanisms.
We observe that to measure actionability, we must examine whether a CTI product finally leads to any knowledge base change. However, if we explore all the CTI products individually, we do not need to have a quality metric. So, in the case of the organization C, we propose an approximation of the overall actionability of a CTI product based on the observation that the states of knowledge base of the defense mechanisms are the result of decisions taken against CTI products that have previously appeared. So, we associate each knowledge base state () of the defense mechanism with the respective set of CTI products , which leads to this state. We estimate the actionability of a given CTI product in the organization C as the average probability that is a member of these sets . In the case of large amounts of unstructured CTI products, to estimate this probability, we propose the use of Cuckoo filters. Specifically, we construct a Cuckoo filter, , for each (that is, a Cuckoo filter for each defense mechanism) and calculate the actionability of a new CTI product, , based on the membership test of it against the Cuckoo filters. Figure 2(b) presents the generic calculation mechanism of the proposed actionability metric.
Similarly to Section 4.1.3, we apply the eight-step methodology of Table 1. For the shake of brevity, we avoid explaining the purpose of each step as we do in Section 4.1.3.
STEP 1
Based on our analysis in Section 4.2.1 and Section 4.2.2, we propose a metric , which measures the actionability of the CTI product P from the defense mechanisms of an organization C.
STEP 2
Following the previous discussion, we observe that the variables involved in the calculation of are the CTI product, P, for which we estimate its actionability and n Cuckoo filters (that is, equal to the number of defense mechanisms of organization C). So, the set of variables, X, used for the estimation of is: .
STEP 3
Base on the methodology of Table 1, we have to define the function F that computes the metric . As mentioned previously, the idea is to measure the actionability of a CTI product P in relation to the organization C, by testing the potential membership of P in the sets of CTI products that have contributed to the knowledge base state of each defense mechanism of C. So, we test P against each constructed Cuckoo filter and average the total score. Specifically, we define the function F as:
STEP 4
Similarly to Section 4.1.3, in this step we determine the objectivity and subjectivity, , of . We observe that none of the variables of F is affected by a human factor, so we infer that is calculated by objective data. On the other hand, the membership decision, that a Cuckoo filter provides, comes with a probability of false positive [20], which depends on the Cuckoo filters constructive characteristics. So, the decision part of the F is non-deterministic and we consider that F is a subjective function applied in objective variables. Hence, we infer that .
STEP 5
STEP 6
Although the characteristics of the Cuckoo filters, , introduce a nondeterministic bias, at the time that F computes the value of , are stable and do not change by F. So, based on Algorithm 2, we infer that F is deterministic and does not introduce bias in the computation of , thus the accuracy of, A, of Table 1 is equal to one,
| Algorithm 2 Metric Calculation Algorithm |
|
STEP 7
Similarly to Section 4.1.3, we apply the elementary effects method for the theoretical sensitivity analysis of F. Once again, only changes in the variable P of X are not controlled by C. Furthermore, we observe that P is tested against n Cuckoo filters regarding its potential membership in the set of CTI products that constructs each of those Cuckoo filters. In this case, we again assume the t selected levels and the elementary effect of P, , is:
where and . Then, the mean (), the mean of the absolute values (), and the standard deviation () of the distribution of , which is obtained by randomly sampling from , assess the influence of P in and reveal the total effects of the interactions between the variable P and the variables . So, we have for the calculation of :
We notice that and the two sums and are independent because they sum the membership decisions of the Cuckoo filters, which are based on hash functions; as a result, even a minor change can cause a different decision of the Cuckoo filters because the avalanche effect of the hash functions affects them. So we can consider the difference as a random value, which is independent of P. So, we have:
For the calculation of and , we have:
In conclusion, we can infer from (Eq. 13) and (Eq. 14) that P has an influence on which does not depend on the magnitude of change . Furthermore, (Eq. 15) reveals that the interactions between P and the variables does not also depend depend on the magnitude of the change ().
After performing the theoretical sensitivity analysis, we determine the behavior quality factor [30], as , for .
STEP 8
Finally, we define:
5. Implementation - Experiments
In this part,we implement the metrics proposed in Section 4 by developing experimental environments in parallel. In addition, we present a way of how an organization can adjust one of the proposed metrics to its own security and environmental requirements. For the rest of this section, we set the experimental environments of the two metrics in Section 5.1 and Section 5.2, and present the experimental results of them in Section 5.3.
5.1. Experimental Environment of Relevance Metric
An organization C is expected to define its information needs as part of its risk management process. For example, we can assume that an organization using Amazon Web Services S3 buckets to store its clients’ data needs information related to cybersecurity violations against S3 buckets. More specifically, assume that C has a supplier . In that case, the information needs of C regarding are not limited to, but can be expressed by the following queries:
- Does face any cyberattack?
- Are products affected by any vulnerability?
Obviously, to determine its information needs regarding , C needs to expand the previous list with queries related to the products, the business activities, etc. Moreover, the answer on some queries (for example, "What are the common cyber threats that affect the agricultural business area?") can result in more subqueries (for example, "What ransomware has been used against other agricultural companies?") whose answers should be added as responses to the information needs of C.
To simulate the definition of information needs as those distributed across the three landscapes, , , and , we emulate interorganizational processes utilizing artificial intelligence (AI) and business ontologies. So, in our experiments, we create random organizations and determine their functions by creating organizational profiles. Those profiles are constructed by randomly selecting entities (e.g., business areas) from ontologies and structured naming schemes. The use of ontologies ensures that the randomly created profiles follow a common logic. For example, when the information technology business area is selected, then the business activities or the products cannot belong to the agricultural business area. An organizational profile is a simplified textual description of an organization environment, and it is introduced here to overcome the need for detailed organizational description (e.g., operations, customers, suppliers, functions, business areas, products, etc.). For simplicity, we construct those profiles to match the three landscapes. Table 2 presents the utilization of the ontologies. Then, we use AI to develop the information needs, in the form of queries, for the three landscapes (see Figure 3(a)).
Furthermore, for the selection of CTI products, we have deployed an OpenCTI server [46], which collects various CTI products from many sources. In our experiments, we randomly select some of those products and calculate .
Details of those sources and the configuration of the OpenCTI server are available as part of the source code of this work. Figure 3(b) depicts the functionality of the experimental environment for .
5.2. Experimental Environment Actionability Metric
To implement and evaluate the experimental environment of , we consider an organization C, which has k defense mechanisms in place that are equally distributed in the three capability categories (that is, prevention, detection, and response / recovery).
In this case, we used the sources of an OpenCTI server to randomly collect t CTI products. We distributed the collected CTI products equally in k sets, each representing the knowledge base of a defense mechanism. Then, we used these k sets to construct the Cuckoo filter of each defense mechanism (see Figure 4(a)). Finally, we used these Cuckoo filters to calculate of different CTI products collected again from the OpenCTI server. Figure 4(b) depicts the experimental environment for the calculation of .
5.3. Analysis of Experimental Results
Following the assumptions made in the setup of the experimental environment of the metrics, in this section we present the results of the calculation of the metrics against CTI products collected from various sources (see Table 3). The source code and datasets of the experiments are available under a GNUv3 General Public License in the respective repository: https://github.com/geosakel77/s3
5.3.1. Relevance Metric Experimental Results Analysis
calculation quantifies the relationship between the content of a CTI product and the information needs of organizations. As explained in Section 5.1, we have constructed artificial organizations in order to evaluate the calculation of against their information needs, such as those expressed through the landscapes. In Figure 5(a), we present calculations distribution of one hundred CTI products randomly selected from the validation dataset against the ten artificial organizations. We observe that the distribution of the calculation of the metric varies between 0.001 and 0.20, with a mean value of approximately 0.025 for all organizations, which demonstrates the capabilities of as a filter for CTI products.
To better explain the previous conclusion, in Figure 6(b), we present the comparison of CTI products with the highest calculation of the metric against the artificial organizations of this experiment, in which we observe that only a small percentage of CTI products have higher than the mean value. So, to demonstrate how an organization can use the metric as a filter to decide which CTI products are worth further examination, let us assume that organization defines a threshold of for choosing CTI products as interesting. From this we can infer that in the case of our experiment, will have to examine two CTI products over the hundred for which has been calculated. Moreover, using the mean calculation of (see Figure 5(a)), can estimate the number of potential CTI products that require further examination and, by extension, the required resources.
In addition, an organization can assess the thoroughness of its information needs for each landscape by analyzing the way its landscape contributes to the overall calculation of the metric. In Figure 6(b), we present the average metrics calculations for each landscape per organization. Based on that, an organization can identify significant differences between landscapes (e.g., organization ), which can be an indicator of an insufficient definition of the information needs of a landscape.
5.3.2. Actionability Metric Experimental Results Analysis
The calculations of the CTI products against the artificial organizations of the experiment quantify the probability that a CTI product will change the state of their defense mechanisms. In Figure 5(b), we present calculations distributions of of one hundred CTI products across the organizations. We observe that most of the calculations are in the range of and which comes from the fact that each organization is represented by a number of defense mechanisms and their respective Cuckoo filters, which varies from five to twenty, whose knowledge bases have been formed by the limited amount of CTI products and sources mentioned in Table 3. However, can be applied as a filter for CTI products (e.g., setting a threshold on the mean value of each organization), and an organization can infer from these distributions how useful the CTI products consumed for them are and, by extension, evaluate the quality of the CTI sources.
Furthermore, in Figure 7(a), the calculations of the CTI products per defense mechanism in the organization . The diagram reveals whether a CTI product can affect the state of each defense mechanism. In that way, an organization can choose on which of its defense mechanisms a specific CTI product can be applied, minimizing the resources required for a more detailed examination of a CTI product.
Finally, in Figure 7(b), we present the comparison of the calculations of the CTI products between the different organizations. We observe that the calculation appears to follow a similar pattern between them, which is evident from the fact that the knowledge bases of their defense mechanisms have been created by randomly selecting CTI products from the same pool. However, even under this constraint, we observe how organizations with similar defense mechanisms can use the metric to select CTI products that are useful for their environment. For example, let us assume that two organizations with similar defense mechanisms participate in a CTI information sharing community, if the first organization calculates of one CTI product and shares this value within the community, then the second organization can use this information as a selection criterion for the CTI product.
5.3.3. Relevance and Actionability Metrics Experimental Results of an Organization
In this section, we examine the experimental results of the measurement of and of a number of selected CTI products for two of the organizations created randomly. Specifically, in Table 4 we present the profile of the organizations .
For simplicity, we give the numbers and an example of the different entities that comprise each landscape; however, the profile is available on this paper’s source code.
Furthermore, in Table 5 we present the structure of , particularly the number of defense mechanisms that comprise the and the number of CTI products assigned on their knowledge bases.
In Table 6, we present the CTI products for which and have calculated for and , respectively.
Finally, in Figure 8(a) and Figure 8(b), we present the measurement of and of the CTI products in Table 6 for organizations and , respectively.
In the case of organization , the organization’s experts can use to select the (Poll Vaulting Report) for further examination and analysis, between the five presented CTI products. By examining the profile of (e.g., offers "community services"), we can validate that is probably relevant to it. Similarly, in the case of , we observe that the organization’s experts can use the to select (NETBIOS Scanner Report), (Cross-Site Scripting Vulnerability Report), and (SQL Injection Attack Report) for further investigation regarding their applicability in the organization’s defense mechanisms. Moreover, we observe that the CTI products () have a high value and are related to web/network traffic, which is explained by the fact that the knowledge bases of ’s defense mechanisms consists of such type of information.
6. Conclusion
In this paper, we explore the aspects of CTI quality, focusing on the relevance and actionability of unstructured CTI products. The increasing reliance on CTI in cybersecurity and the necessity for organizations to evaluate the quality of the intelligence they consume have introduced significant challenges in evaluating the quality of these products. Organizations rely on relevant and actionable CTI products to make cybersecurity decisions, but the lack of standardized metrics complicates this process. This paper proposes two innovative metrics, Relevance () and Actionability (), to address these challenges.
The research questions posed in this study aimed to assess how the relevance and actionability of CTI products can be defined and quantitatively calculated. The main contribution of this paper is the proposal of two metrics: and . The proposed metrics are designed to incorporate the characteristics of organizations by evaluating the quality of CTI products in relation to organizations’ information needs and defense mechanisms, respectively. To answer the first and second research questions, we have introduced the concepts of informational landscapes, which is a notion introduced for the first time on CTI to the best of our knowledge, and the modeling of the organizations’ defense mechanisms as cognitive agents. Furthermore, by leveraging probabilistic algorithms and data structures, these metrics provide a scalable approach to assess the quality of CTI products, ensuring their applicability in large datasets of CTI products, and answering our third research question. Based on the information currently available to us, it is the first time that probabilistic data structures and algorithms are used in the context of CTI quality evaluation. In addition, the experimental findings indicate that these metrics can serve as effective filters for organizations seeking to prioritize their CTI analysis efforts, ensuring that only the most pertinent information is consuming their cybersecurity resources. Additionally, due to the abstract concepts on which the proposed metrics are based, they are resilient to the dynamic nature of cyber-threats. In summary, in this paper, we answer the RQ1 in Section 4.1 and Section 4.2, the RQ2 in Section 3.3, Section 4.1.2 and Section 4.2.2, and the RQ3 in the Section 4.1.3, Section 4.2.3 and Section 5.3.
Furthermore, at this point, we have to discuss the benefits of the proposed metrics in comparison with asking an AI model how relevant or actionable a CTI product is for an organization. First, we should recognize that the use of AI is possible to evaluate the relevance and actionability of CTI products. However, an AI model trained with organization’s classified data (e.g., models of IT systems, architecture of an organization’s IT environment, business activities, etc.) introduces a significant risk to an organization’s cybersecurity posture because an attacker capable of exploiting this model would identify and exploit the organization’s weaknesses. In addition, it is difficult for an organization to know the level of efficacy that an AI model has when it continuously handles a large number of CTI products. In comparison, the proposed metrics do not rely on any communication with models or algorithms hosted outside of the organization. At the same time, the proposed metrics use algorithms that are designed to handle a large number of data by definition.
Despite the contributions of this work, we need to recognize that our study faced several constraints, which are opening future research paths. First, the limited scope of the datasets used to validate the proposed metrics led us to make assumptions in the construction of the experimental organizations and to artificially create their information needs and the knowledge bases of the defense mechanisms, which may cause a limitation on what level the findings can be generalized. Second, the probabilistic nature of the proposed metrics introduces a tolerable margin of error, which may affect precision in certain cases; however, we have not addressed such cases in this paper for simplicity. Third, to keep the level of complexity low, we have kept the design and implementation of the experimental environments simple, but we have to recognize that the integration of the metrics to existing processes and systems of an organization may be challenging.
Looking ahead, several open research questions arise from our findings, i.e.,
- How can we leverage all the characteristics of the probabilistic data structures in the metrics’ calculation (e.g., Cuckoo filters dynamic update)?
- Can we formally and structured define the organizations information needs in the context of CTI?
- How can we utilize those metrics to integrate on real-time the selected CTI products in the knowledge bases of the organizations’ defense mechanisms?
Our future work will focus on the utilization of those metrics in real-time integration of CTI products in the defense of organizations. Our aim is to measure how the CTI quality can affect and improve the cybersecurity posture of an organization. We will focus on developing automated tools for real-time CTI evaluation and integration, integrating the metrics with existing cybersecurity frameworks, and exploring their application in collaborative environments such as threat-sharing platforms.
In summary, this study presents a novel approach to evaluating the quality of unstructured CTI products through the introduction of Relevance () and Actionability () metrics. These metrics provide a structured and scalable approach for evaluating CTI products, aligning them with the unique informational needs and defense mechanisms of organizations. Although the study acknowledges certain constraints, such as the limited scope of the datasets used, it provides a solid foundation for future research and practical applications. By addressing these limitations and exploring future research opportunities, this work establishes the foundations for more robust, adaptive, and automated cybersecurity solutions to enhance the utility of CTI in the ever-changing cybersecurity domain.
Author Contributions
Conceptualization, G.S. and P.F.; methodology, G.S.; validation, G.S., M.K. and P.F.; formal analysis, G.S.; investigation, G.S.; data curation, G.S.; writing—original draft preparation, G.S.; writing—review and editing, G.S, M.K., and P.F.; visualization, G.S, M.K., and P.F.; supervision, P.F. and M.K.; All authors have read and agreed to the published version of the manuscript.
Data Availability Statement
The source code and datasets of the experiments are available under a GNUv3 General Public License in the respective GitHub repository: Source Code
References
- ENISA. ENISA Threat Landscape 2022. Technical report, ENISA, Athens, 2022. [CrossRef]
- Sakellariou, G.; Fouliras, P.; Mavridis, I.; Sarigiannidis, P. A Reference Model for Cyber Threat Intelligence (CTI) Systems. Electronics 2022, Vol. 11, Page 1401 2022, 11, 1401. [Google Scholar] [CrossRef]
- MANDIANT. Global Perspectives on Threat Intelligence. Technical report, MANDIANT, Reston, 2023.
- Taleb, I.; Serhani, M.A.; Dssouli, R. Big Data Quality Assessment Model for Unstructured Data. In Proceedings of the Proceedings of the 2018 13th International Conference on Innovations in Information Technology, IIT 2018, Al Ain, United Arab Emirates, 2 2019. [CrossRef]
- Azevedo, R.; Medeiros, I.; Bessani, A. PURE: Generating quality threat intelligence by clustering and correlating OSINT. In Proceedings of the Proceedings - 2019 18th IEEE International Conference on Trust, Security and Privacy in Computing and Communications/13th IEEE International Conference on Big Data Science and Engineering, TrustCom/BigDataSE 2019, Rotorua, New Zealand; 8 2019; pp. 483–490. [Google Scholar] [CrossRef]
- Schaberreiter, T.; Kupfersberger, V.; Rantos, K.; Spyros, A.; Papanikolaou, A.; Ilioudis, C.; Quirchmayr, G. A quantitative evaluation of trust in the quality of cyber threat intelligence sources. In Proceedings of the ACM International Conference Proceeding Series, New York, NY, USA; 8 2019; p. 10. [Google Scholar] [CrossRef]
- Chismon, D.; Ruks, M. Threat intelligence: Collecting, analysing, evaluating. Technical report, MWR InfoSecurity, London, 2015.
- Zhang, S.; Chen, P.; Bai, G.; Wang, S.; Zhang, M.; Li, S.; Zhao, C. An Automatic Assessment Method of Cyber Threat Intelligence Combined with ATT&CK Matrix. Wireless Communications and Mobile Computing 2022, 2022, 12. [Google Scholar] [CrossRef]
- MITRE. MITRE ATT&CK®, 2021.
- Tao, Y.; Zhang, Y.x.; Ma, S.y.; Fan, K.; Li, M.y.; Guo, F.m.; Xu, Z. Combining the big data analysis and the threat intelligence technologies for the classified protection model. Cluster Computing 2017, 20, 1035–1046. [Google Scholar] [CrossRef]
- Marchetti, M.; Guido, A.; Pierazzi, F.; Colajanni, M. Countering Advanced Persistent Threats through security intelligence and big data analytics. In Proceedings of the International Conference on Cyber Conflict, CYCON, Tallinn, Estonia, 8 2016; Vol. 2016-August; pp. 243–261. [Google Scholar] [CrossRef]
- Wheelus, C.; Bou-Harb, E.; Zhu, X. Towards a big data architecture for facilitating cyber threat intelligence. In Proceedings of the 2016 8th IFIP International Conference on New Technologies, Mobility and Security, NTMS 2016, Larnaca, Cyprus; 12 2016; pp. 1–5. [Google Scholar] [CrossRef]
- Martins, C.; Medeiros, I. Generating Quality Threat Intelligence Leveraging OSINT and a Cyber Threat Unified Taxonomy. ACM Transactions on Privacy and Security 2022, 25, 39. [Google Scholar] [CrossRef]
- Fujii, S.; Kawaguchi, N.; Shigemoto, T.; Yamauchi, T. CyNER: Information Extraction from Unstructured Text of CTI Sources with Noncontextual IOCs. In Proceedings of the Advances in Information and Computer Security; Cheng, C.M.; Akiyama, M., Eds., Cham; 2022; pp. 85–104. [Google Scholar]
- Jordan, B.; Piazza, R.; Wunder, J. STIX v2.0 Specification, 2017.
- Watson, K. Assessing the Potential Value of Cyber Threat Intelligence (CTI) Feeds. Technical report, Johns Hopkins Applied Physics Laboratory, Laurel, 2020.
- Pawlinski, P.; Jaroszewski, P.; Kijewski, P.; Siewierski, L.; Jacewicz, P.; Zielony, P.; Zuber, R. Actionable information for security incident response. Technical report, ENISA, Athens, 2014.
- Deliu, I.; Leichter, C.; Franke, K. Collecting Cyber Threat Intelligence from Hacker Forums via a Two-Stage, Hybrid Process using Support Vector Machines and Latent Dirichlet Allocation. In Proceedings of the 2018 IEEE International Conference on Big Data (Big Data), Seattle; 12 2018; pp. 5008–5013. [Google Scholar] [CrossRef]
- Wagner, T.D.; Mahbub, K.; Palomar, E.; Abdallah, A.E. Cyber threat intelligence sharing: Survey and research directions. Computers & Security 2019, 87, 101589. [Google Scholar] [CrossRef]
- Gakhov, A. Probabilistic Data Structures and Algorithms for Big Data Applications, 1st ed.; BoD–Books on Demand: Norderstedt, 2022. [Google Scholar]
- Broder, A.Z. On the resemblance and containment of documents. In Proceedings of the Proceedings of the International Conference on Compression and Complexity of Sequences, Salerno, 1997. [CrossRef]
- Indyk, P.; Motwani, R. Approximate nearest neighbors: Towards removing the curse of dimensionality. In Proceedings of the Conference Proceedings of the Annual ACM Symposium on Theory of Computing, Dallas, Texas, USA, 1998.
- Bloom, B.H. Space/time trade-offs in hash coding with allowable errors. Communications of the ACM 1970, 13, 422–426. [Google Scholar] [CrossRef]
- Fan, B.; Andersen, D.G.; Kaminsky, M.; Mitzenmacher, M.D. Cuckoo filter: Practically better than bloom. In Proceedings of the CoNEXT 2014 - Proceedings of the 2014 Conference on Emerging Networking Experiments and Technologies, Sydney, Australia, 2014. [CrossRef]
- Scott, W.R.; Davis, G.F. Organizations and organizing: Rational, natural and open systems perspectives, 1st ed.; Routledge: New York, 2015. [Google Scholar] [CrossRef]
- Von Bertalanffy, L. The theory of open systems in physics and biology, 1950. [CrossRef]
- Daft, R.L. Management; Cengage Learning: Mason, 2015. [Google Scholar]
- Savolainen, R. Information landscapes as contexts of information practices. Journal of Librarianship and Information Science 2021, 53, 655–667. [Google Scholar] [CrossRef]
- Joint Task Force Transformation Initiative. NIST Special Publication 800-30 Revision 1 - Guide for Conducting Risk Assessments. Technical Report September, NIST, 2012.
- Sakellariou, G.; Fouliras, P.; Mavridis, I. A Methodology for Developing & Assessing CTI Quality Metrics. IEEE Access 2024, 12, 6225–6238. [Google Scholar] [CrossRef]
- RRDG. Domain Industry Taxonomy, 2022.
- Broder, A.Z.; Charikar, M.; Frieze, A.M.; Mitzenmacher, M. Min-wise independent permutations (extended abstract). In Proceedings of the Proceedings of the Thirtieth Annual ACM Symposium on Theory of Computing, Dallas, Texas, USA, 1998. [CrossRef]
- Saltelli, A. Sensitivity Analysis for Importance Assessment. Risk Analysis 2002, 22, 579–590. [Google Scholar] [CrossRef]
- M’manga, A.; Faily, S.; McAlaney, J.; Williams, C.; Kadobayashi, Y.; Miyamoto, D. A normative decision-making model for cyber security. Information and Computer Security 2019, 26, 636–646. [Google Scholar] [CrossRef]
- Cotae, P.; Kang, M.; Velazquez, A. A Cybersecurity Model for Decision-Making Problems under Uncertainty Using Game Theory. In Proceedings of the 2020 13th International Conference on Communications, COMM 2020 - Proceedings, Bucharest; 2020; pp. 15–22. [Google Scholar] [CrossRef]
- Jalali, M.S.; Siegel, M.; Madnick, S. Decision-making and biases in cybersecurity capability development: Evidence from a simulation game experiment. Journal of Strategic Information Systems 2019, 28, 66–82. [Google Scholar] [CrossRef]
- Sichman, J.S.a.; Demazeau, Y.; Boissier, O. When can knowledge-based systems be called agents. Proceedings of Simp{ó}sio Brasileiro De Intelig{ê}ncia Artificial, 9, Rio 1992, 9, 172–185. [Google Scholar]
- Akerkar, R.; Sajja, P. Knowledge-based systems; Jones & Bartlett Publishers: Burlington, 2009. [Google Scholar]
- BigPicture. Free Dataset - Companies | BigPicture Documentation, 2024.
- EDM Council. FIBO, 2020.
- EUROSTAT. Glossary:Statistical classification of economic activities in the European Community (NACE) - Statistics Explained, 2006.
- Fraunhofer ISC. General Process Ontology (GPO), 2021.
- NIST, C.F.P. Official Common Platform Enumeration (CPE) Dictionary, 2021.
- EBWSRG. The Product Types Ontology: Use Wikipedia pages for describing products or services with GoodRelations and schema.org, 2024.
- EU. ECCF Core Ontology - EU Vocabularies - Publications Office of the EU, 2021.
- Filigran. OpenCTI Documentation, 2024.
Figure 1.
Relevance Metric Generic Calculation Mechanism
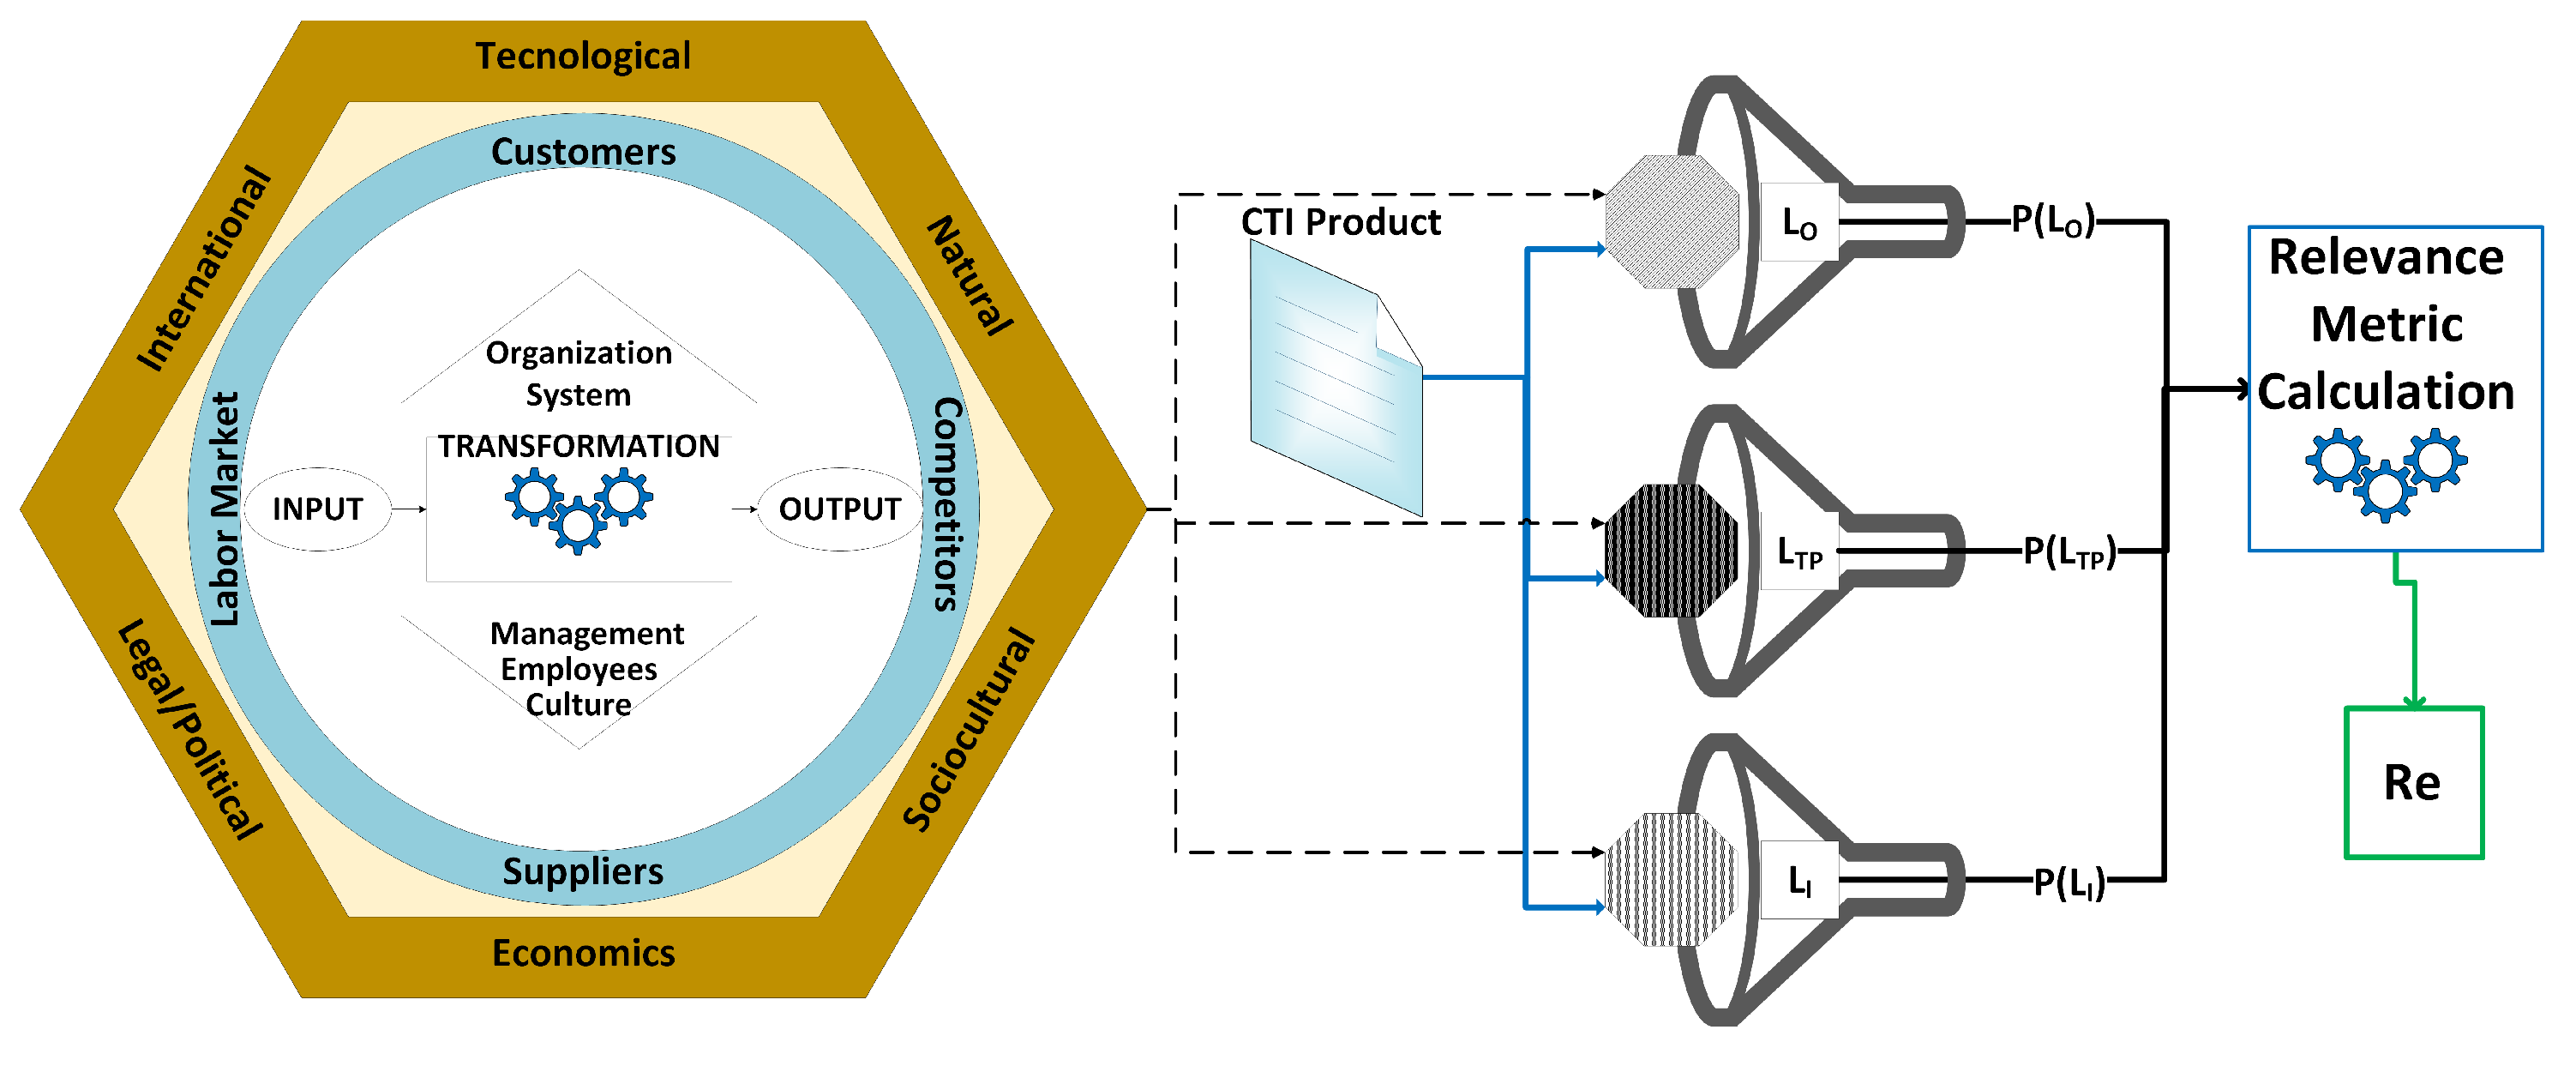
Figure 2.
Actionability Metric (a) Defense Mechanism and (b) Generic Calculation Mechanism.
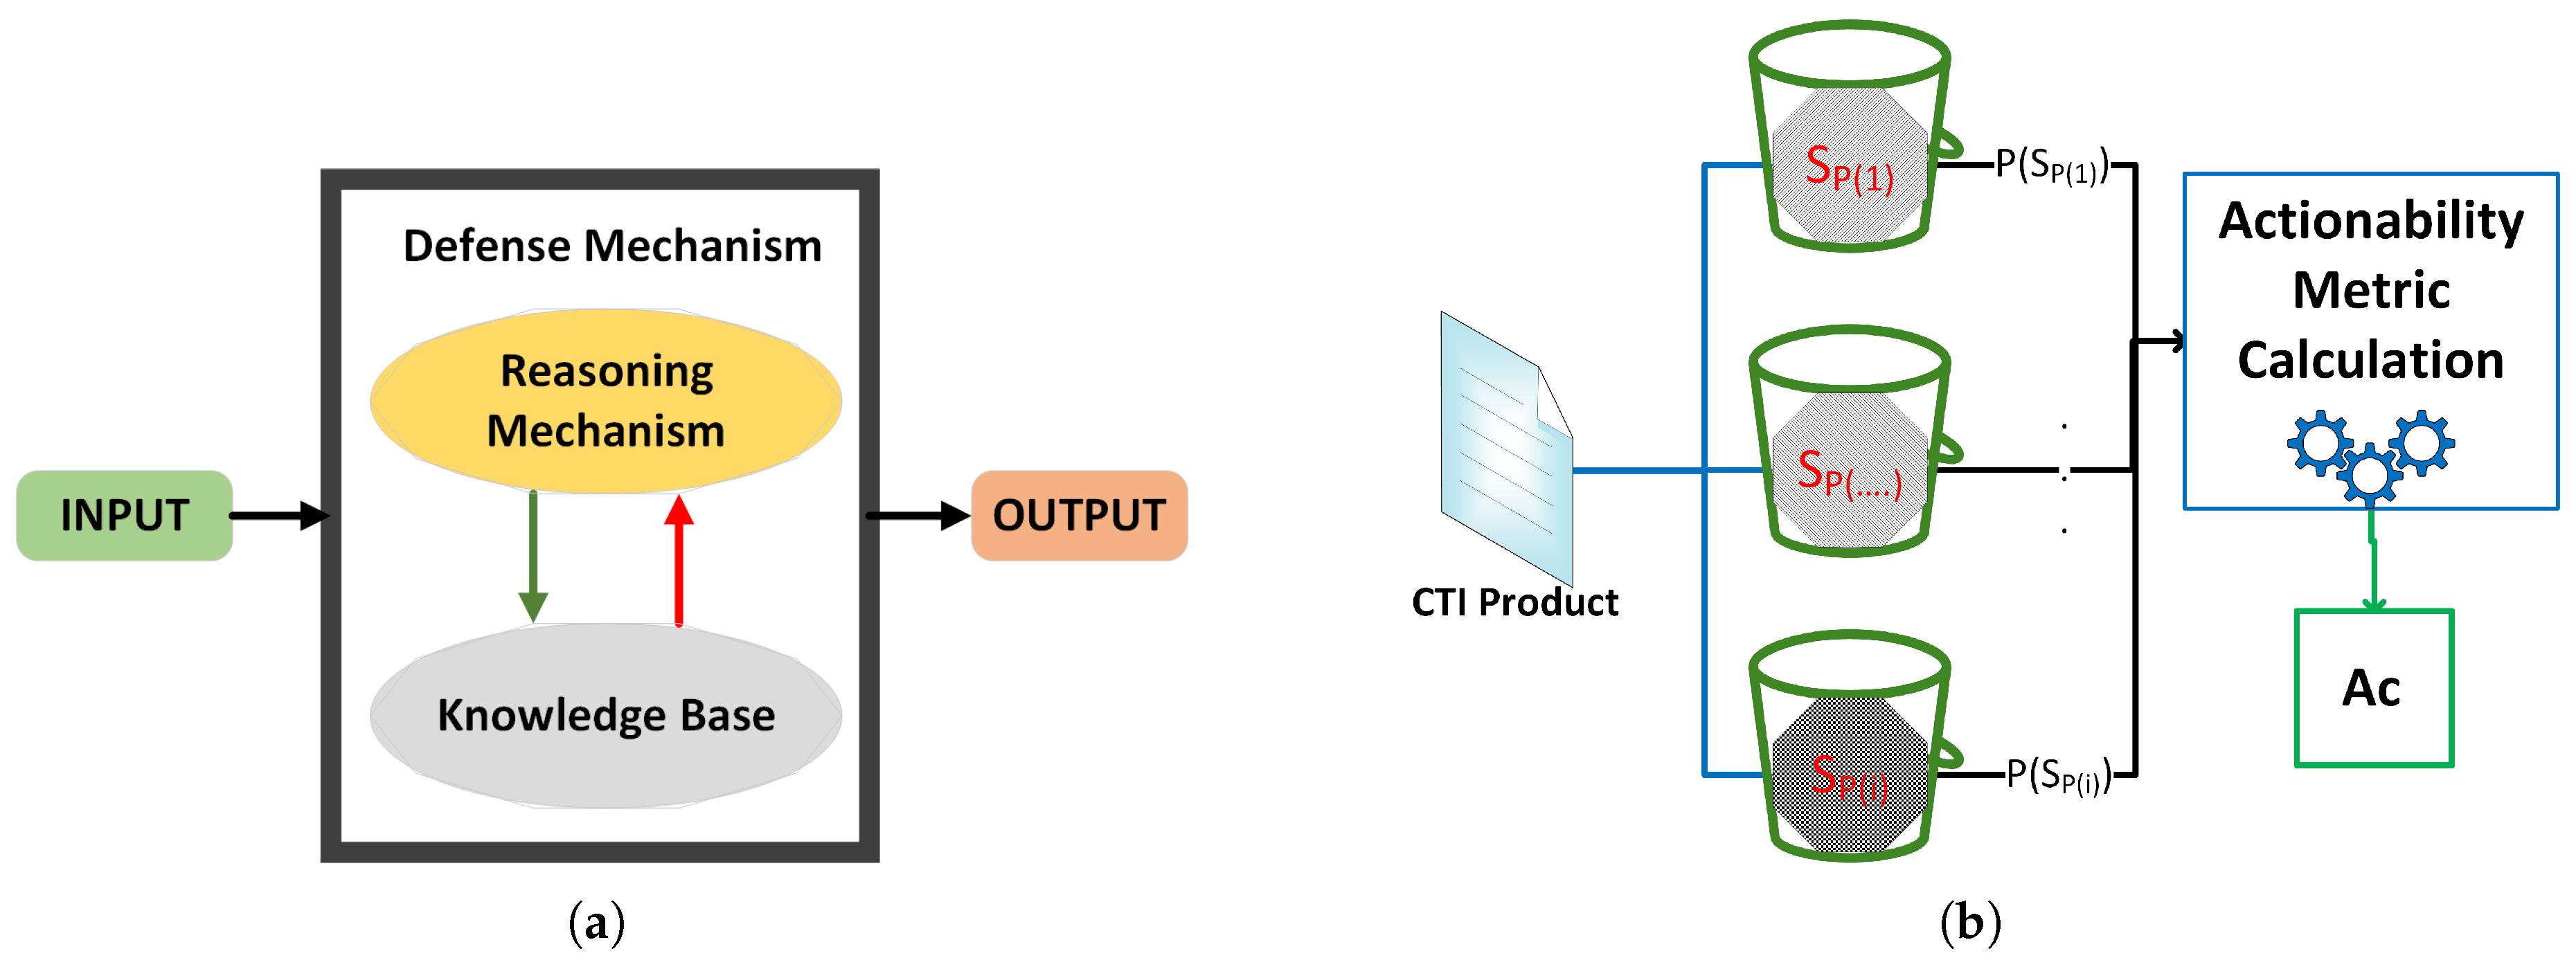
Figure 3.
Concepts of Metric Calculation Experimental Environment.(a) Process of Information Needs Creation. (b) Relevance Metric Experimental Environment.
Figure 3.
Concepts of Metric Calculation Experimental Environment.(a) Process of Information Needs Creation. (b) Relevance Metric Experimental Environment.
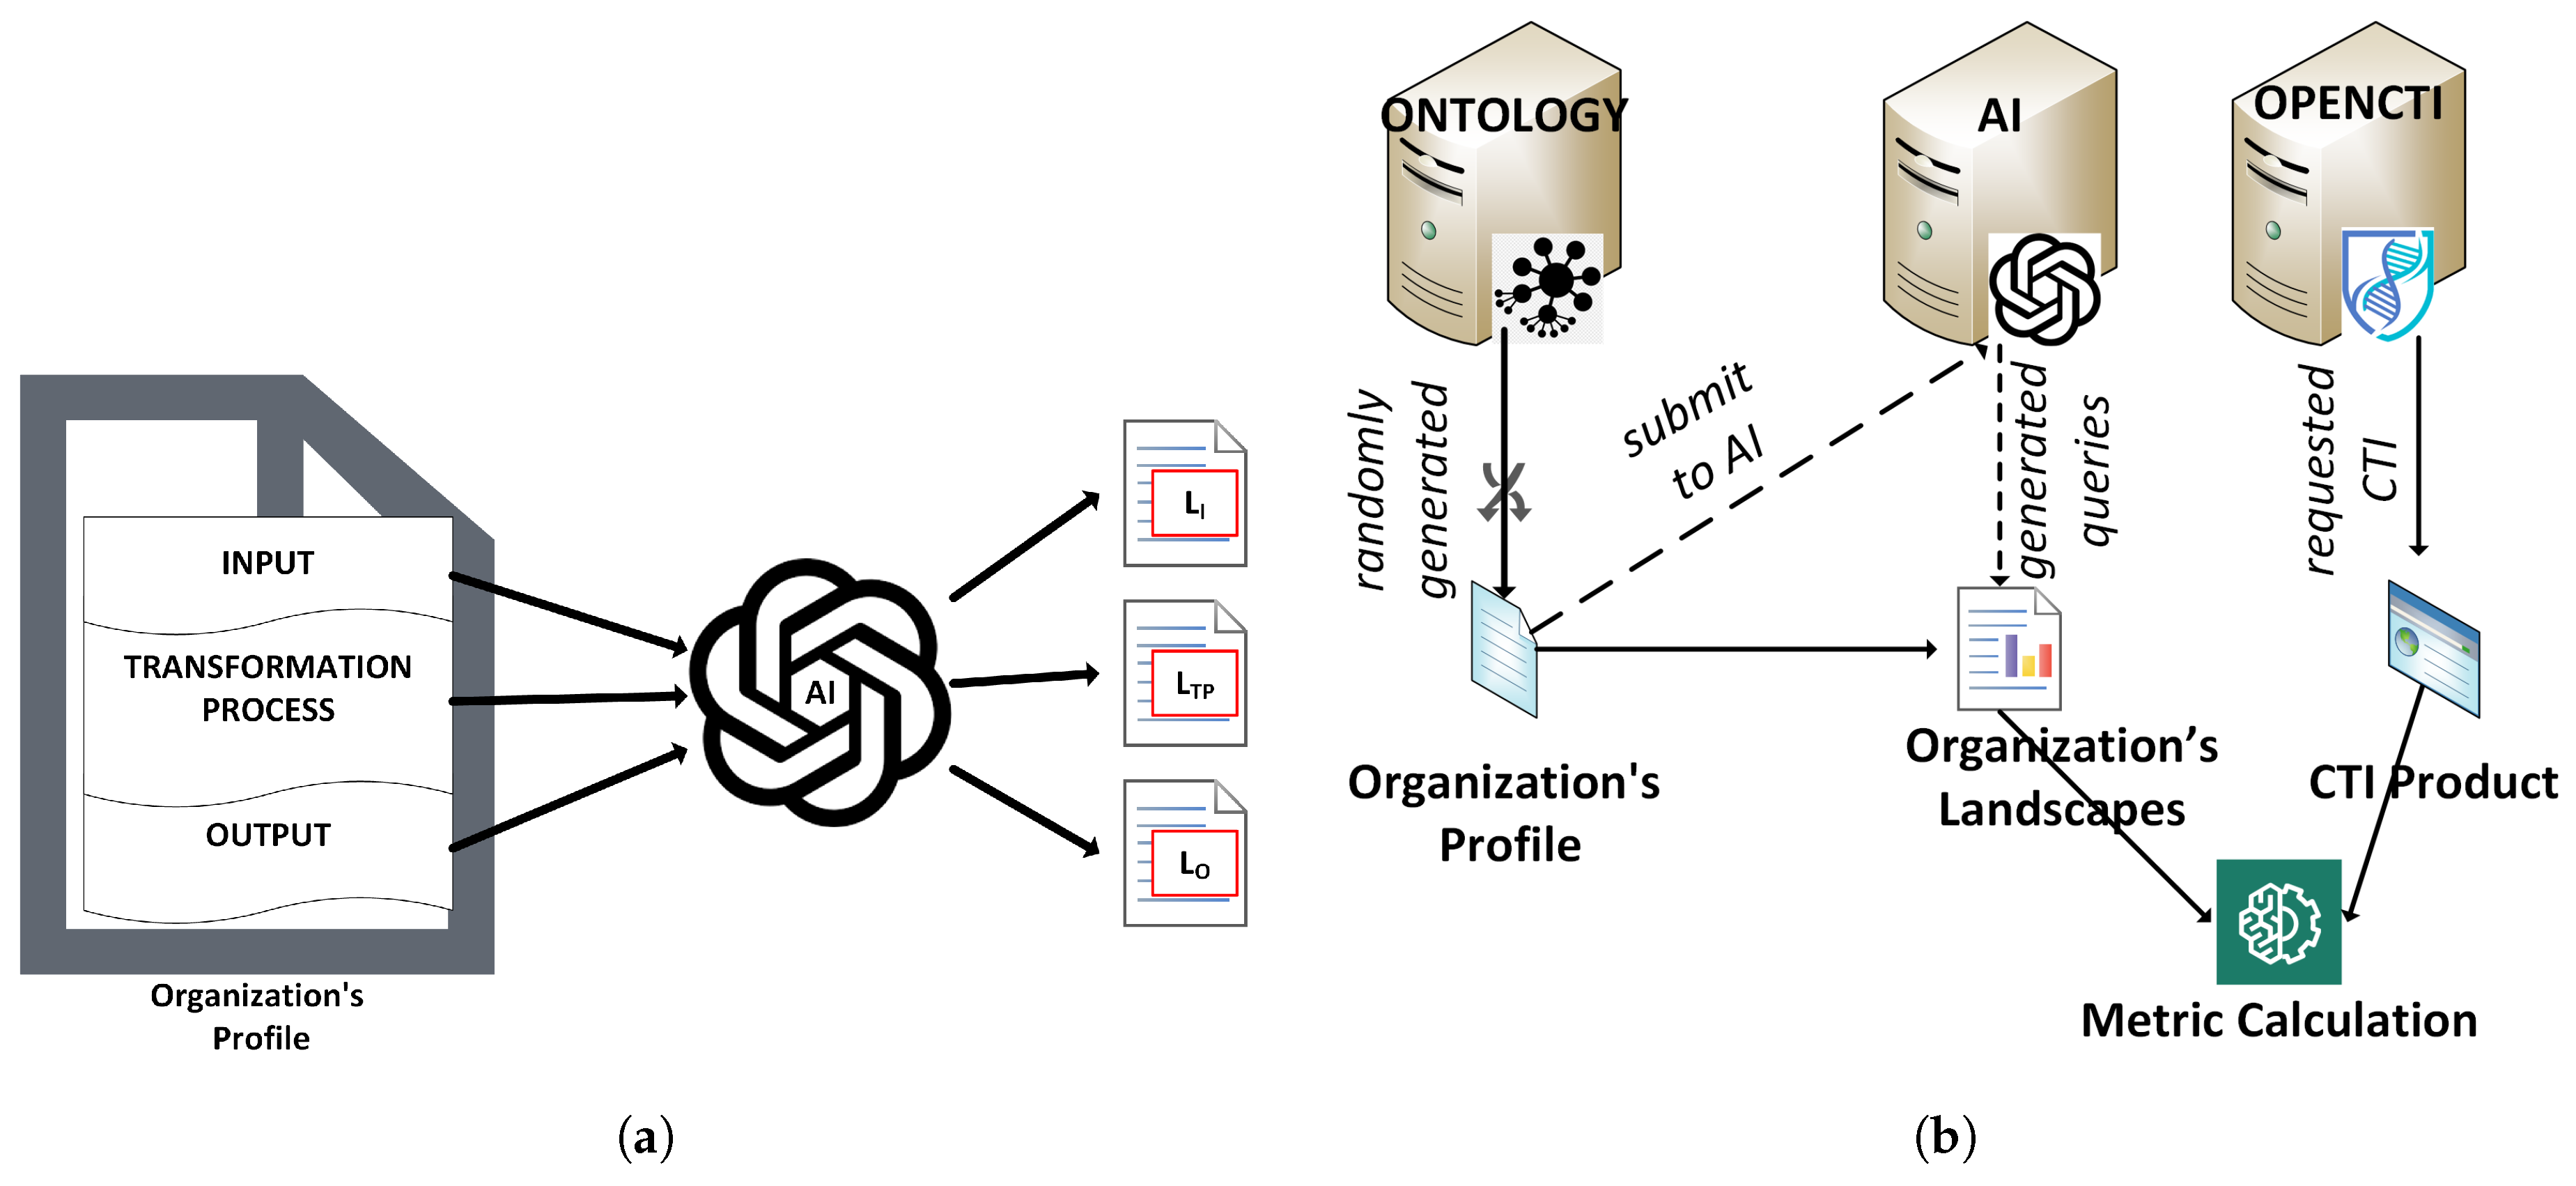
Figure 4.
Concepts of Metric Calculation Experimental Environment.a) Process of Cuckoo Filters Creation. (b) Actionability Metric Experimental Environment.
Figure 4.
Concepts of Metric Calculation Experimental Environment.a) Process of Cuckoo Filters Creation. (b) Actionability Metric Experimental Environment.
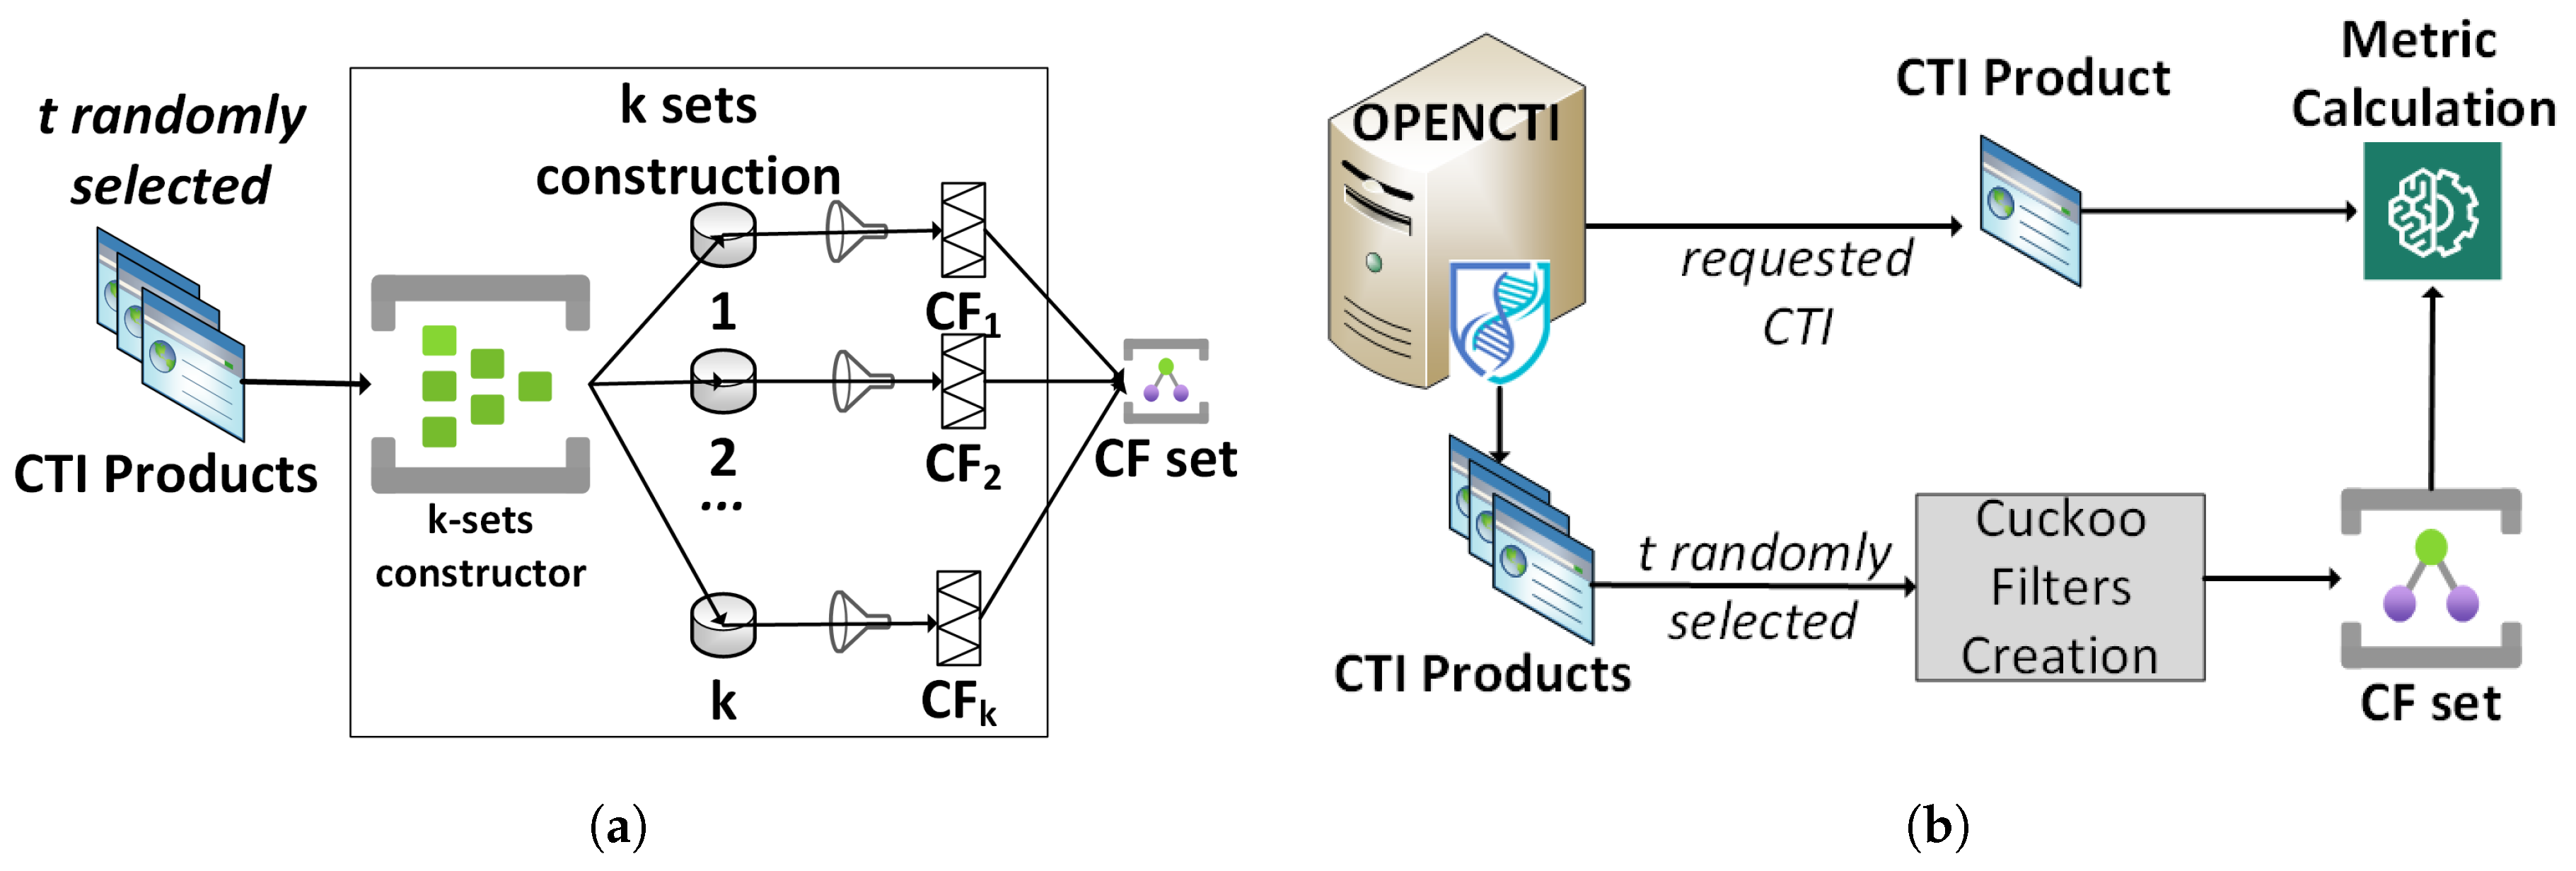
Figure 5.
CTI Products Metrics Calculation Distributions across Organizations. (a) Relevance Distribution. (b) Actionability Distribution.
Figure 5.
CTI Products Metrics Calculation Distributions across Organizations. (a) Relevance Distribution. (b) Actionability Distribution.
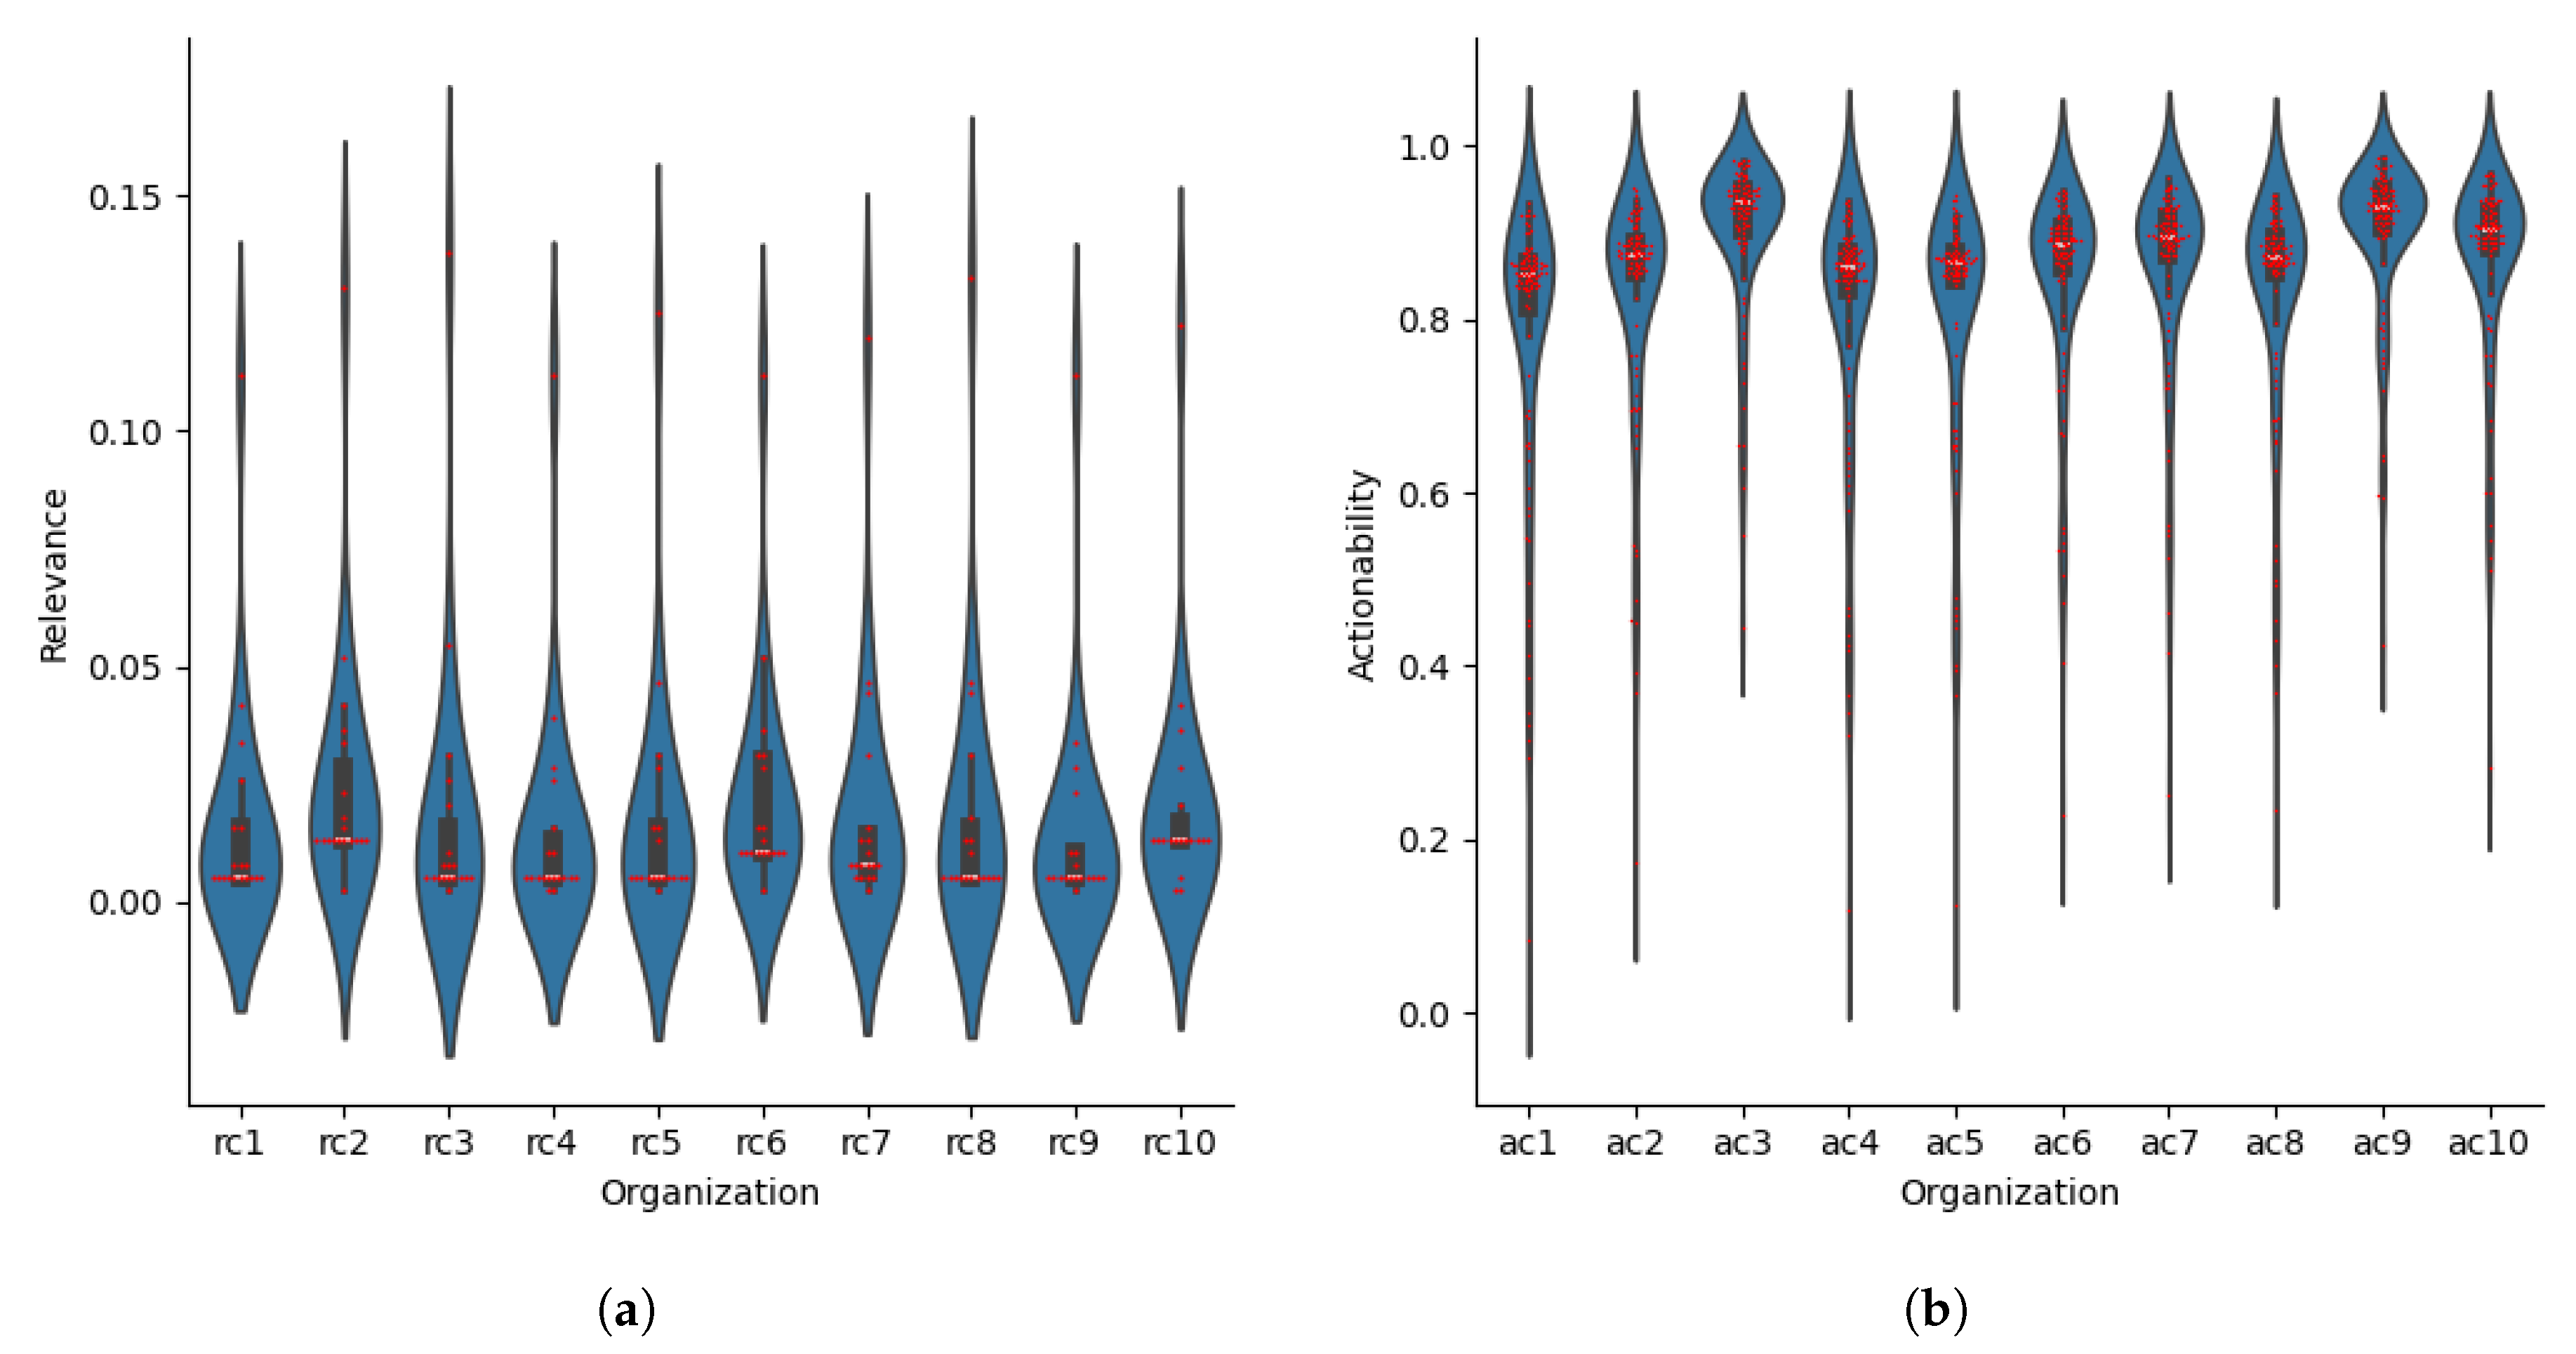
Figure 6.
Relevance Metrics Calculation. (a) Sample of Organizations’ Average Relevance Calculations per Landscape. (b) Comparison of CTI Products Relevance between sample of Organizations.
Figure 6.
Relevance Metrics Calculation. (a) Sample of Organizations’ Average Relevance Calculations per Landscape. (b) Comparison of CTI Products Relevance between sample of Organizations.
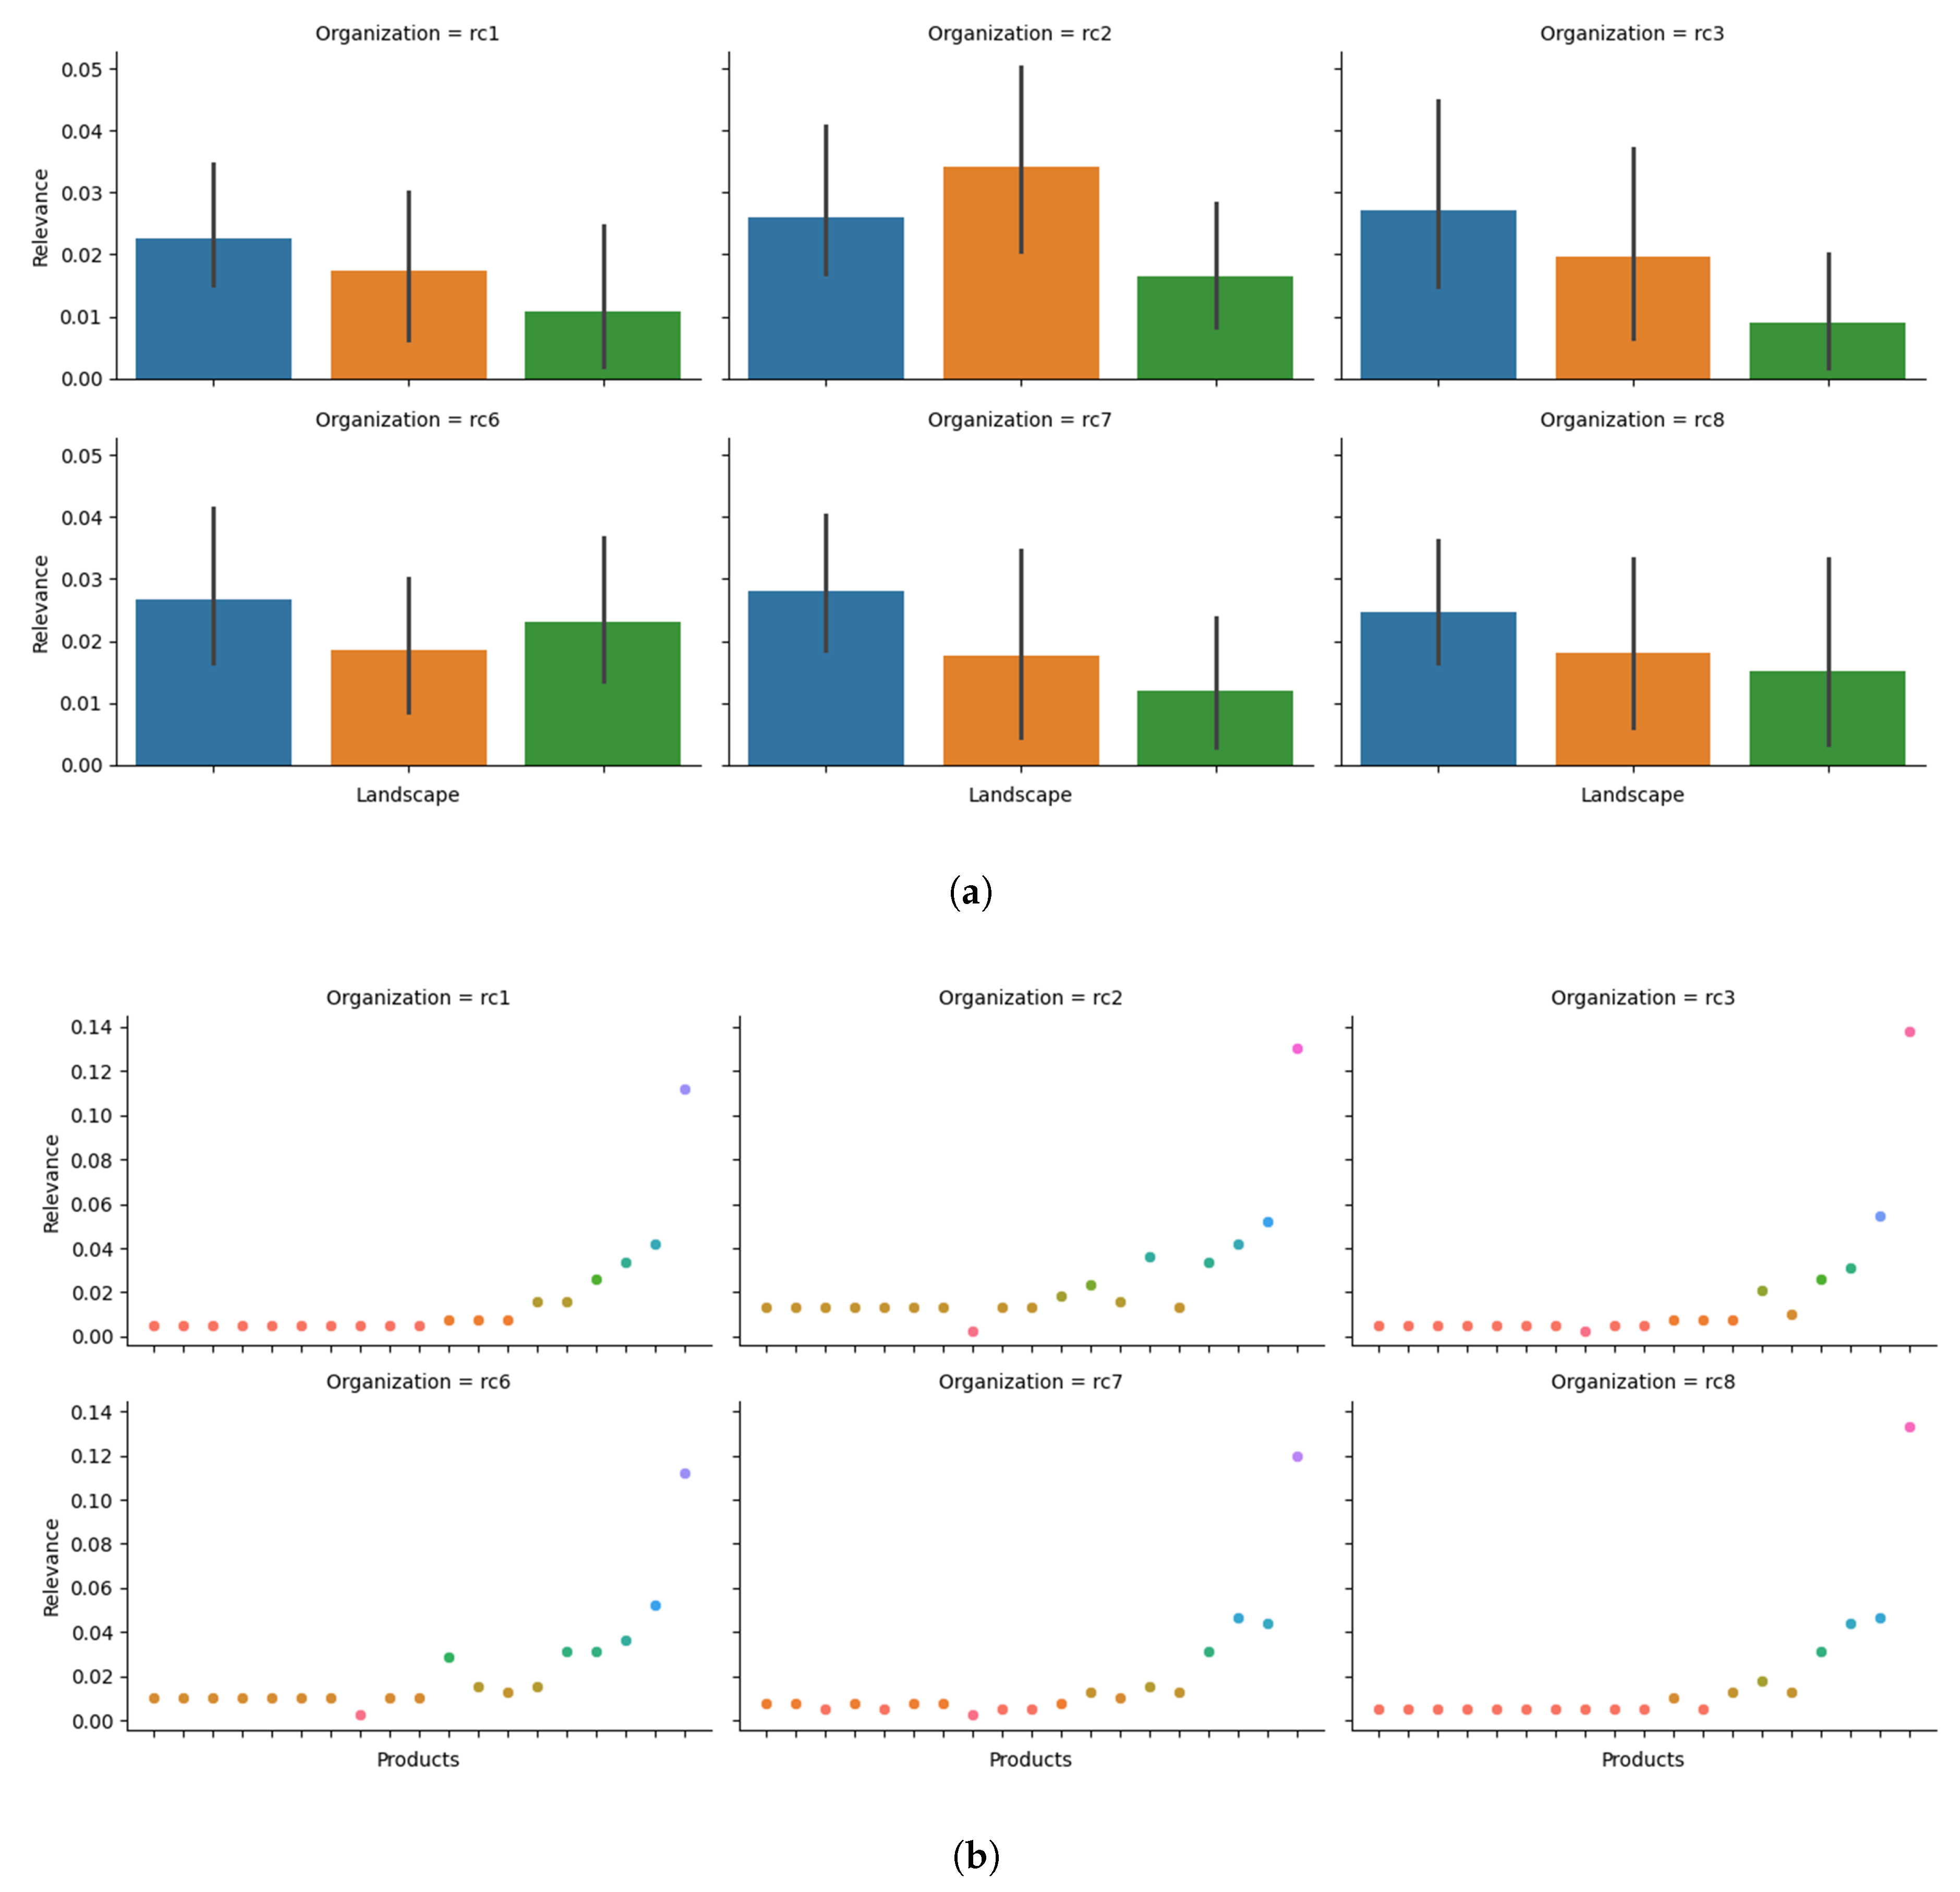
Figure 7.
Actionability Metrics Calculation. (a) CTI Products’ Actionability Calculation per Defense Mechanism of Org. . (b) Comparison of CTI Products Actionability between Organizations.
Figure 7.
Actionability Metrics Calculation. (a) CTI Products’ Actionability Calculation per Defense Mechanism of Org. . (b) Comparison of CTI Products Actionability between Organizations.
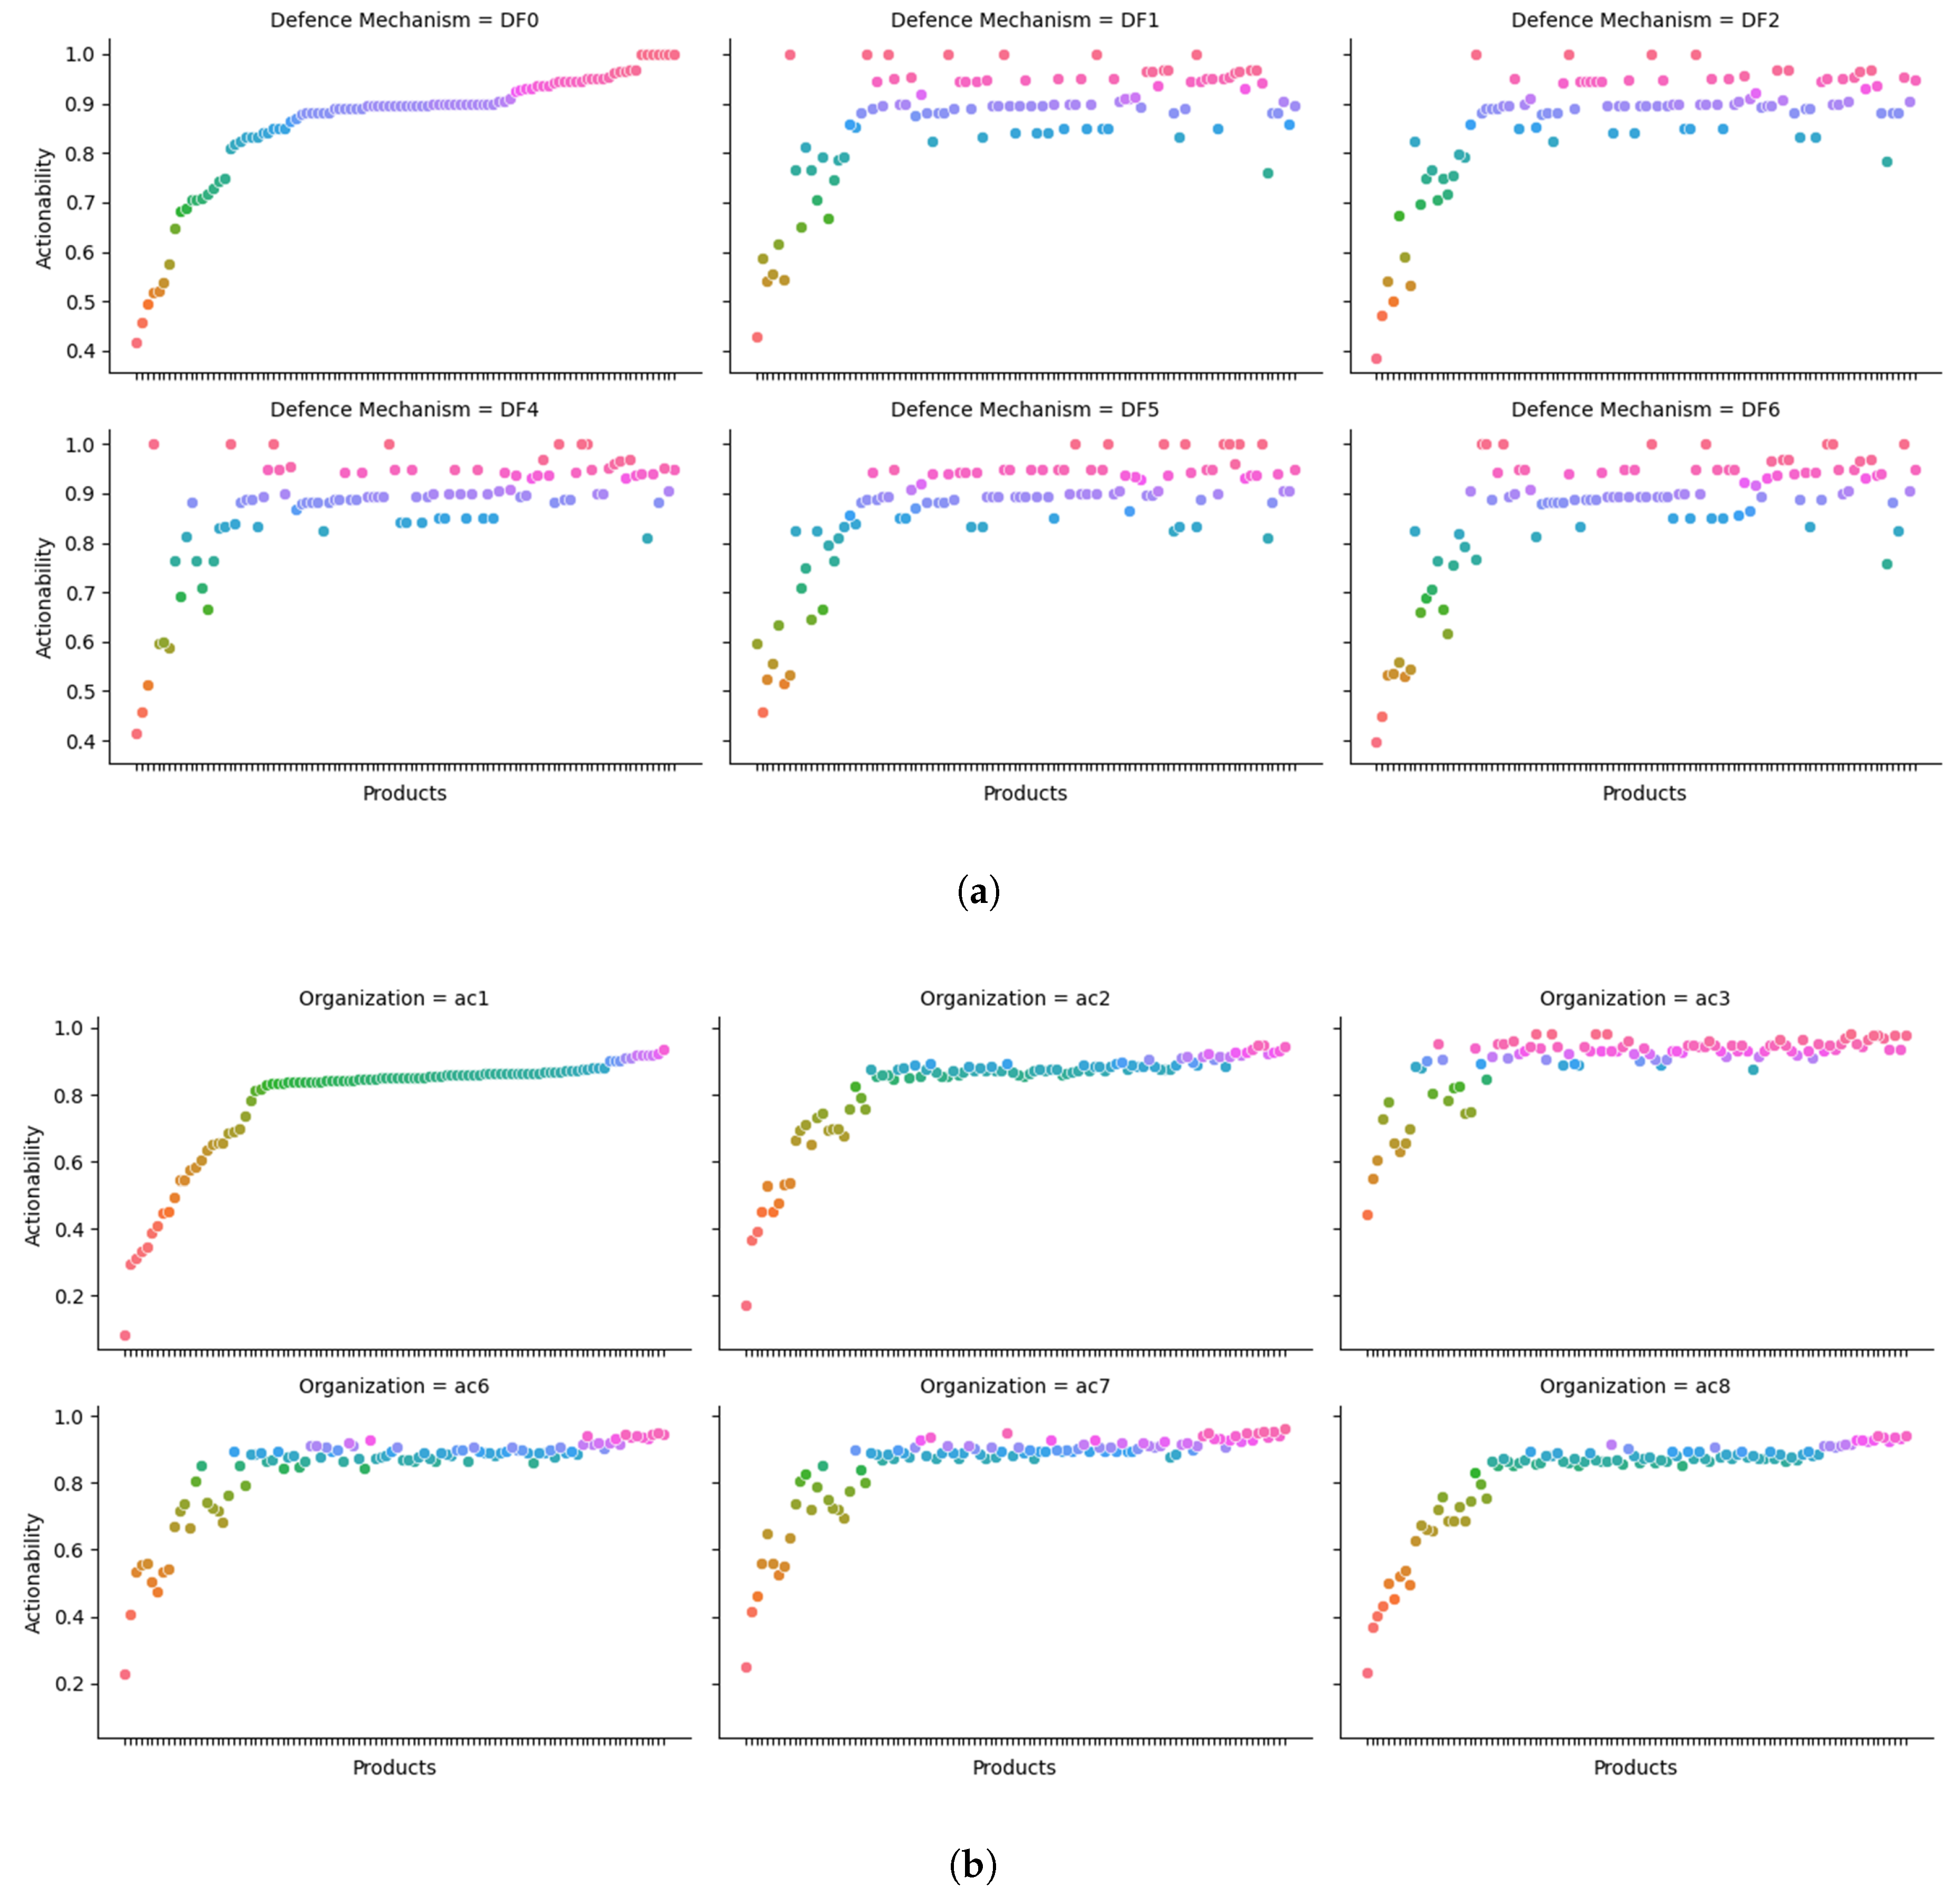
Figure 8.
CTI Products Metrics of Organizations and . (a) CTI Products Relevance Metric for . (b) CTI Products Actionability Metric Measurement for .
Figure 8.
CTI Products Metrics of Organizations and . (a) CTI Products Relevance Metric for . (b) CTI Products Actionability Metric Measurement for .
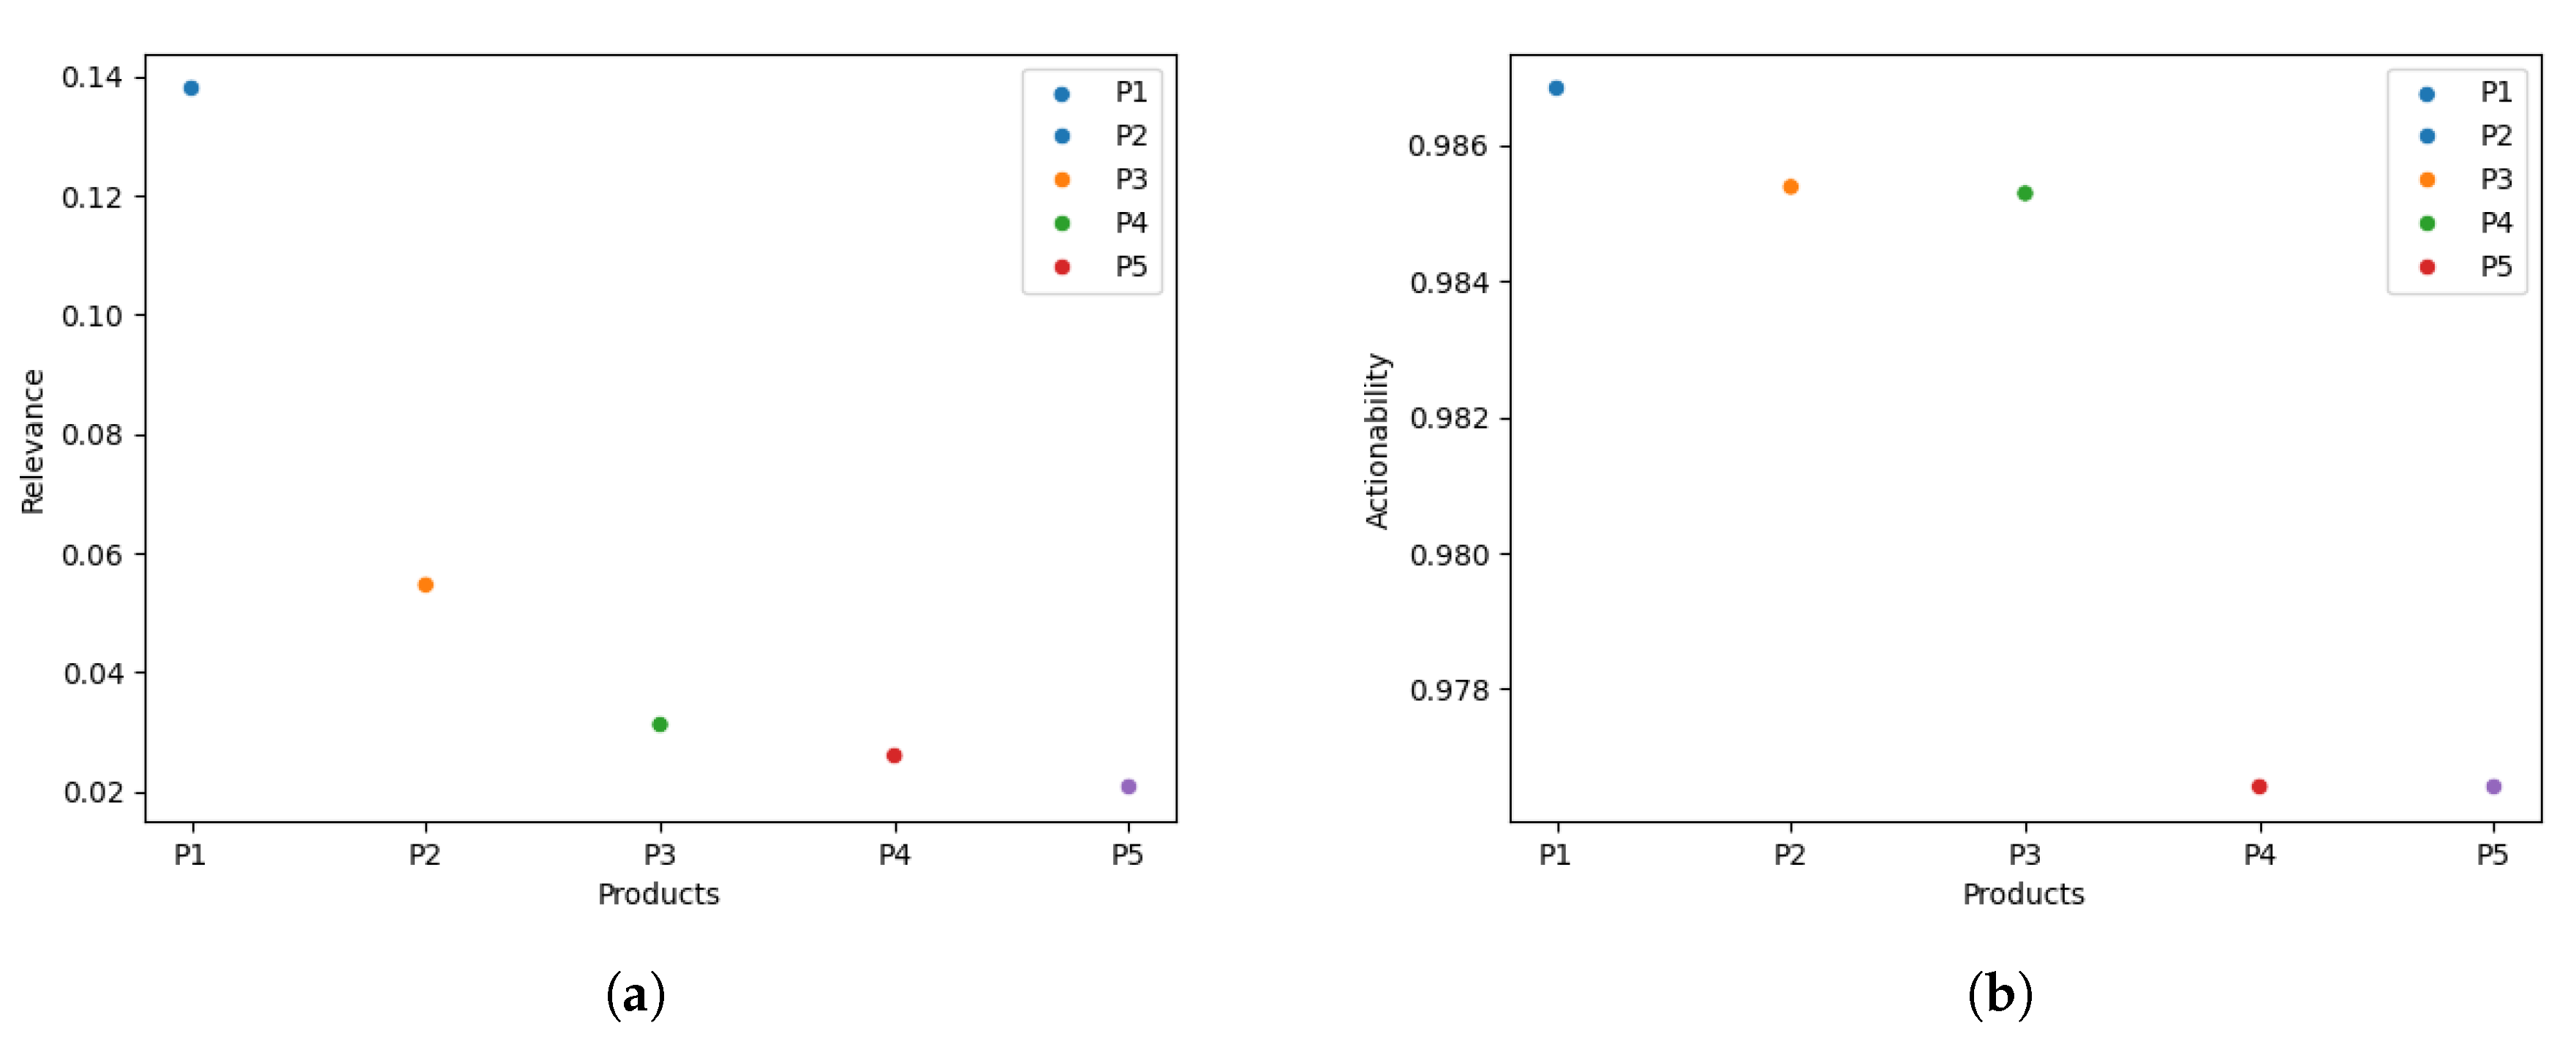

Table 1.
CTI Quality Metrics Development Methodology.
| Step | Description |
|---|---|
| 1 | Based on the CTI data or sources, try to identify what can better express their quality and name this metric M. |
| 2 | Determine the set of variables X necessary to calculate M. |
| 3 | Define function F, which computes metric M. |
| 4 | Analyze X and F to determine subjectivity and objectivity . |
| 5 | Analyze F to determine the performance of M (i.e., time complexity of M calculation), P. |
| 6 | Analyze F to determine the precision of M, A. |
| 7 | Conduct sensitivity analysis on M to determine B. |
| 8 | Construct metric |
Table 2.
Relevance Metric Landscapes’ Datasets.
| Landscape | Information Needs of | Ontology & Datasets |
|---|---|---|
| Input Landscape () | Suppliers | Companies [39] |
| Competitors | ||
| Capital Sources | FIBO [40] | |
| Transformation Process Landscape () | Business Activities | NACE [41], DIT [31] |
| Internal Operations | GPO [42] | |
| Information Systems | CPE [43] | |
| Output Landscape () | Products | FIBO [40], PTO [44], ECCF [45] |
| Services |
Table 3.
CTI Products Sources
| CTI Sources | Num. of CTI products in dataset | Num. of CTI products in validation dataset |
|---|---|---|
| MITRE ATT&CK, CISA KNOWN VULNERABILITIES, CVE, ALIENVAULT, FEEDLY, MALPEDIA, MISP FEEDS, MITRE ATLAS, TWEETFEED | 32012 | 5000 |
Table 4.
Organization Profile.
| Landscape | Profile |
|---|---|
| Input Landscape () | Num. of Suppliers: 14 (e.g., GRIVE) |
| Num. of Competitors: 19 (e.g., M.A.P.L.E) | |
| Num. of Capital Sources: 7 (e.g., SPDR S&P 500 ETF Trust) | |
| Transformation Process Landscape () | Num. of Business Activities: 12 (e.g., "auxiliary to financial services") |
| Num. of Internal Operations: 10 (e.g., Information Transport Process) | |
| Num. of Information Systems: 15 (e.g., XR3Player) | |
| Output Landscape () | Num. of Products: 5 (e.g., carpets, food products) |
| Num. of Services: 9 (e.g., community services) |
Table 5.
Organization Structure.
| Number of Defense Mechanisms | Number of CTI Products in Knowledge Base of a Defense Mechanism | Total Number of CTI Products in the Knowledge Bases of the Defense Mechanisms |
|---|---|---|
| 4 | 1917 | 7668 |
Table 6.
CTI Products used for the Measurement of and .
| Measurement of Metric | Measurement of | ||
|---|---|---|---|
| Product | Remark | Product | Remark |
| P1 | Poll Vaulting Report | P1 | NETBIOS Scanner Report |
| P2 | Wrong Sphere Vulnerability Report | P2 | Cross-Site Scripting Vulnerability Report |
| P3 | OT URL Activity Report | P3 | SQL Injection Attack Report |
| P4 | Linux Kernel Vulnerability Report | P4 | Wrong HTTP Header Encoding Report |
| P5 | Firmware Buffer Overflow Vulnerability Report | P5 | Wrong HTTP Header Encoding Report |
Disclaimer/Publisher’s Note: The statements, opinions and data contained in all publications are solely those of the individual author(s) and contributor(s) and not of MDPI and/or the editor(s). MDPI and/or the editor(s) disclaim responsibility for any injury to people or property resulting from any ideas, methods, instructions or products referred to in the content. |
© 2025 by the authors. Licensee MDPI, Basel, Switzerland. This article is an open access article distributed under the terms and conditions of the Creative Commons Attribution (CC BY) license (http://creativecommons.org/licenses/by/4.0/).
Copyright: This open access article is published under a Creative Commons CC BY 4.0 license, which permit the free download, distribution, and reuse, provided that the author and preprint are cited in any reuse.


