Submitted:
17 March 2025
Posted:
19 March 2025
You are already at the latest version
Preprints on COVID-19 and SARS-CoV-2
Abstract
In December 2019, the World Health Organization (WHO) reported an outbreak of pneumonia in Wuhan, China, caused by severe acute respiratory syndrome coronavirus 2. Computed tomography (CT) is the primary imaging modality used to diagnose and monitor severe acute respiratory syndrome caused by SARS-CoV-2. However, its routine use is expensive and produces large amounts of radiation. The aim of this study was to define chest radiography (CXR) patterns for COVID-19 and correlate them with clinical and outcome variables to achieve early and effective diagnosis using a cheaper and more accessible imaging method compared to CT. We analyzed CXR images and RT-PCR results of patients with COVID-19, categorizing them into typical, possible, atypical, or negative patterns. The results showed that CXR is effective and economical in evaluating COVID-19, with type 3 opacities associated with more severe outcomes and type 1 opacities with early stages of infection. Moreover, patients with comorbidities, age over 60 years, and the need for mechanical ventilation had worse outcomes. In conclusion, CXR can be an effective and inexpensive tool in the evaluation of COVID-19, especially in high-demand scenarios. Standardization of radiographic findings is also important for the improvement of diagnostic accuracy and clinical management of COVID-19.
Keywords:
Coronavirus
; radiography
; pneumonia
1. Introduction
In December 2019, the World Health Organization (WHO) was notified of an outbreak of pneumonia in the city of Wuhan, Hubei Province, People's Republic of China. The etiologic agent, a novel coronavirus named severe acute respiratory syndrome coronavirus 2 (SARS-CoV-2), was quickly identified [1]. On January 30, 2020, the WHO International Emergency Committee declared the outbreak of a "public health emergency of international concern." On March 11, 2020, the disease was declared a pandemic [2]. In Brazil, the first case of coronavirus disease 2019 (COVID-19) was confirmed on February 26, 2020 [3]. Within a few months, the COVID-19 pandemic had reached more than 200 countries worldwide. By June 2024, there were approximately 776 million cases and 7.1 million deaths.
SARS-CoV-2 is a beta coronavirus, similar to other coronaviruses that have caused outbreaks in the past, but with greater transmissibility and a higher prevalence of asymptomatic infections. SARS-CoV-2, which belongs to the order Nidovirales, has a genetic code consisting of single-stranded RNA and a large, glycoprotein-enveloped genome with the ability to infect a wide range of host species. The α and β coronaviruses infect only mammals [4]. The coronavirus is composed of four structural proteins, as follows: (1) spike (S); (2) membrane (M); (3) envelope (E); and (4) nucleocapsid (N). The spike protein is composed of a transmembrane trimeric glycoprotein that projects to the viral surface and determines coronavirus diversity and host tropism [5]. In cells, the angiotensin-converting enzyme 2 (ACE2) receptor also functions as a receptor for SARS-CoV-2. Structural and functional analyses have shown that the SARS-CoV-2 spike protein binds to ACE2 [6], and this receptor is present at high levels in the lung, heart, ileum, kidneys, and bladder.
Transmission of SARS-CoV-2 occurs through viral particles expelled by speaking, sneezing, and coughing, through direct contact with contaminated surfaces, and, to a lesser extent, through airborne particles in closed environments. The incubation period is typically three to seven days, after which symptoms such as fever and malaise may occur. Some symptoms, such as runny nose, nasal congestion, and odynophagia, may precede coughing and dyspnea. The latter is an indication of disease progression to the lower respiratory tract. Other commonly reported clinical include anosmia and ageusia. Gastrointestinal symptoms such as anorexia, abdominal pain, and diarrhea may also occur [7,8,9,10,11]. Patients with COVID-19 may present with mild to moderate respiratory illness and recover with symptomatic treatment alone. However, a significant proportion of patients remain asymptomatic. The diagnosis of COVID-19 can be confirmed by a positive reverse transcription-polymerase chain reaction (RT-PCR) test using samples obtained from nasal or oropharyngeal swabs, sputum, or bronchoalveolar lavage. More than half of the patients with a positive RT-PCR test result may be asymptomatic at the time of testing. The mortality rate of COVID-19 varies from 0.3% to 13.1% in some studies and depends on various factors such as demographic data, testing intensity, access to health care systems, and accuracy of epidemiologic data [7,8,9,10,11].
Although clinical presentation guides diagnosis and treatment, imaging modalities play an important role in these decisions and may be useful in the initial assessment and monitoring of pulmonary involvement caused by the disease. The virus can cause inflammatory lesions in the lungs leading to pneumonia. Therefore, radiology and its diagnostic modalities play a fundamental role in identifying the disease and assessing its extent. Lung ultrasound has proven useful as a bedside imaging modality, particularly in screening settings, offering several advantages such as portability, speed, and lack of radiation exposure. Findings include heterogeneous B-lines, subpleural consolidations, and thickened, irregular pleural lines, which may be suggestive of COVID-19 pneumonia [12,13]. However, these findings are not specific and require clinical correlation. Chest computed tomography (CT) is the primary imaging modality for the diagnosis and monitoring of patients with severe acute respiratory syndrome caused by SARS-CoV-2. Its high sensitivity and spatial resolution allow detection of early-stage lesions and monitoring of temporal changes in these lesions [14,15,16,17,18,19]. The most common tomographic findings include ground-glass opacity, which is the earliest finding, and consolidation patterns with bilateral, peripheral, and inferior lobe distribution. In addition, interlobular septal thickening may occur, resulting in a crazy-paving pattern, and to a lesser extent, vascular thickening, air bronchogram, and halo sign may be seen. However, a normal chest CT does not exclude the diagnosis of COVID-19 respiratory syndrome in symptomatic patients. Nevertheless, continuous and intensive use of CT requires more personal protective equipment and overwhelms the capacity of radiology services to efficiently meet all hospital needs [14,15,16,17,18,19,20].
Chest radiography (CXR) is an alternative method to CT [21,22,23]. Initial CXR often shows areas of ill-defined, focal, or multifocal opacities, unilateral, involving the middle and lower peripheral lung zones, with progressive multifocal consolidation over 6 to 12 days involving one or both lungs. Several studies have compared diagnoses based on CXR with RT-PCR or CT, while others evaluated the extent of parenchymal involvement using CXR [7,21,23,24,25,26]. However, research is needed due to the need to evaluate the usefulness of radiographic compatibility patterns for the diagnosis of COVID-19, similar to what has already been done with CT.
It should be noted that the clinical and epidemiologic context, in addition to the imaging findings, is important in differentiating COVID-19 from other diseases. Non-COVID viral pneumonias, such as those caused by influenza, may have similar findings on CT but usually have a different distribution [27]. Organizing pneumonia may mimic COVID-19, although it often presents with a central or diffuse distribution pattern [28]. Pulmonary edema, especially of cardiogenic origin, may be suggested by B-lines on ultrasound and septal thickening on CT [29]. Interstitial lung disease may present with ground-glass opacities, although they typically have a distinct reticular or honeycomb pattern [27]. Diffuse alveolar hemorrhage may present with diffuse ground-glass opacities, similar to COVID-19, but is usually associated with other clinical and laboratory findings [28]. Fungal and bacterial infections, such as pneumocystosis, may present atypical findings on CT, such as cavitations or tree-in-bud opacities, which are less common in COVID-19 [28,30].
Thus, the general objective of the present study is to define CXR patterns for COVID-19 and correlate them with clinical and outcome variables in order to achieve early and effective diagnosis using a more affordable and accessible imaging modality compared to CT. The specific objectives are to describe the radiographic changes in COVID-19 and classify the extent of parenchymal involvement as well as the probability patterns of the disease; and to correlate these radiographic changes and classifications with clinical, epidemiologic, and outcome parameters.
2. Methods
This is a retrospective, observational, and cross-sectional study of outpatients and inpatients with a confirmed diagnosis of COVID-19 by RT-PCR. The sample size was determined by convenience, and patients were selected consecutively. The researchers consulted electronic medical records and the Radiology Information System/Picture Archiving and Communication System (RIS/PACS) to analyze and compare clinical and imaging data.
The study was approved by the Research Ethics Committee of the Pedro Ernesto University Hospital, operated by the State University of Rio de Janeiro, in the city of Rio de Janeiro, Brazil, under protocol number CAAE-31363230.1.0000.5282.
In the Imaging Service of HUPE, chest X-rays (CXRs) were performed using a remote-controlled device (Flexavision, model SF, Shimadzu, Japan) in posteroanterior (PA) and lateral views in the upright position or anteroposterior (AP) view in the supine position when the patient was unable to stand upright. The distance from the X-ray emitter to the image receptor was 1.80 meters.
All patients in the sample underwent reverse transcription-polymerase chain reaction (RT-PCR) tests using nasopharyngeal swab samples.
The inclusion criteria were: age over 18 years, symptoms suggestive of respiratory infection as described by the WHO in "Clinical Management of COVID-19" (World Health Organization, 2020), contact with individuals with COVID-19 or a clinical presentation suggestive of the disease, and having undergone PCR testing for COVID-19. The exclusion criteria were absence of CXR or CXR with unacceptable technical quality for analysis, absence of PCR testing, and insufficient clinical data for comparison.
A descriptive analysis was conducted to present the collected data in the form of tables, expressed by measures of central tendency and dispersion appropriate for numerical data, and by frequency (n) and percentage (%) for categorical data. The data were distributed into the following categories:
- Clinical variables: Age group (< 60 years and ≥ 60 years), Gender (male and female), Classic symptoms, Mechanical ventilation, RT-PCR result (positive or negative), Smoking and former smoking, Presence of comorbidities, subdivided into the main conditions: diabetes mellitus, systemic arterial hypertension, obesity, and chronic obstructive pulmonary disease.
- Radiological findings: CXR pattern (positive or negative for COVID-19), Disease extent on CXR (mild/moderate or severe), Type of opacity found (type 1, 2, or 3), Pulmonary involvement (unilateral or bilateral), Symmetry (symmetric or asymmetric), Transverse axis alterations (peripheral or non-peripheral) and Longitudinal axis alterations (without or with predominance).
- Clinical outcome: Asymptomatic, Symptomatic and Death.
Subsequently, inferential analysis was employed, which is an exploratory data technique focused on making generalizations, predictions, and inferences about a population based on a sample of collected data. This analysis included the Chi-square test (χ²), Fisher's exact test, Mann-Whitney test, Kruskal-Wallis ANOVA, and Dunn's multiple comparisons test. All these tests are non-parametric, meaning they do not assume a specific distribution for the data and are useful when the data do not follow a normal distribution or when the sample size is small. The Chi-square test (χ²) and Fisher's exact test are hypothesis tests designed to find a dispersion value for two nominal variables, evaluating the association between the variables. These are non-parametric tests, meaning they do not depend on population parameters such as mean and variance and do not follow a normal distribution. The basic principle of these methods is to compare proportions, i.e., the possible divergences between observed frequencies. These tests were used to verify the existence of an association between clinical variables and radiographic findings among the subgroups of clinical outcomes. The significance level adopted was 5%. Statistical analysis was processed using SPSS software version 26.
Once a significant result was found, pairwise comparisons were performed to identify the pairs of subgroups that differed significantly, which are:
- Asymptomatic vs. symptomatic,
- Asymptomatic vs. death,
- Symptomatic vs. death.
For the analysis of age (in years) in relation to the outcome subgroups, the Shapiro-Wilk test was applied to assess the normality of a sample. In other words, it checks whether the data follow a normal (i.e., Gaussian) distribution. It is widely used due to its sensitivity and effectiveness in detecting deviations from normality, even in small samples. This test was applied to the age variable and did not show a modal (Gaussian) distribution (p = 0.031), but rather a bimodal distribution based on graphical analysis of the histogram. Therefore, the most appropriate measures for summarizing age were quartiles (median and interquartile range: Q1–Q3). The Kruskal-Wallis ANOVA is a technique that compares three or more groups and determines whether at least one is different from the others, thus not requiring assumptions about the distribution of the data. This test was used to compare age (in years) among the three outcome subgroups (asymptomatic, symptomatic, and deceased). After the Kruskal-Wallis ANOVA, Dunn's multiple comparisons test was applied to identify which subgroups differed significantly from each other at the 5% level. Dunn's multiple comparisons test is used after the Kruskal-Wallis test when a significant difference between groups is observed. It performs pairwise comparisons between groups to identify which specific groups differ from each other. The comparison of age (in years) between two outcome subgroups (alive and deceased) was performed using the Mann-Whitney test, which compares two independent samples. It evaluates whether there is a difference in the distribution of two populations. This test is an alternative to the independent samples t-test, especially when the assumptions of normality are not met.
2.1. Image Analysis
Two radiologists with over 10 years of experience evaluated the radiographic patterns compatible with COVID-19 and the extent of pulmonary parenchymal involvement. The results were issued consensually by both professionals. Neither of the readers had access to patient identifiers, clinical data, CT images, or reports. The co-supervisor of the study (R. M.) created a classification system for COVID-19 compatibility on CXRs and characterized the patterns as typical, possible, atypical, and negative for pulmonary diseases, similar to the Radiological Society of North America (RSNA) consensus for CT scans [28] (Figure 1, Figure 2, Figure 3 and Figure 4). The defined criteria were as follows:
- Typical: Multifocal peripheral or central areas without a clear definition of vascular structure contours (opacity type 1) or a significant and variable increase in parenchymal density with a hazy appearance (opacity type 2); consolidations (opacity type 3) may be present but are associated with one of the other opacities.
- Possible: Opacities without a multifocal pattern or opacities type 1 and 2 in only one lobe or the upper thirds of the lungs.
- Atypical: Absence of typical or possible patterns, along with the presence of one or more of the following findings: cavities or isolated lobar/segmental consolidation (resembling bacterial pneumonia); micronodules; signs of pulmonary congestion and pleural effusions; or extensive pleural effusions.
- Negative: No findings indicative of pulmonary diseases.
The readers assessed the extent of parenchymal involvement on CXRs by analyzing six zones on the PA or AP radiographs (Figure 5). Two lines located in the upper and lower regions of the hila delineated the six zones, a method used by Litmanovich and colleagues [24] and Toussie and colleagues [25]. As proposed by Litmanovich and colleagues [24], involvement of up to 2 zones was considered mild, 2 to 4 zones as moderate, and more than 4 zones as severe.
Typical and possible patterns were considered diagnostic indicators for COVID-19. According to our hospital's protocol, patients with these patterns were considered potential carriers of the disease and, therefore, isolated while awaiting laboratory test results.
3. Results
3.1. Associations Between Clinical and Radiographic Variables and Outcomes (Asymptomatic, Symptomatic, and Death)
There was a significant difference between the outcome subgroups for the variables age group (p = 0.001) and overall comorbidity (p = 0.010). The subgroup that progressed to death had a significantly higher proportion of individuals aged ≥ 60 years compared to the subgroups that progressed with or without symptoms. Additionally, this subgroup had a significantly higher overall comorbidity than the subgroup that progressed with symptoms. Patients who required mechanical ventilation showed a tendency to be associated with a worse outcome (death) (p = 0.065).
For radiographic data, there was a significant difference between the outcome subgroups only for type 3 opacities (p = 0.028). Patients who progressed without symptoms had fewer type 3 opacities compared to the subgroups that progressed with symptoms or to death. It can also be said that there was a tendency for type 1 opacities to be associated with better outcomes (p = 0.056). Table 1 and Table 2 present the clinical and radiographic variables for the total sample and according to the outcomes (asymptomatic, symptomatic, and death).
3.2. Influence of Comorbidities on Radiographic Changes
It was observed that the subgroup with comorbidities had significantly greater asymmetry of opacities (78.1%) compared to the subgroup without comorbidities (33.3%) (p = 0.046). Table 3 shows the variables analyzed in the radiographs for the total sample and according to the presence or absence of comorbidities.
3.3. Influence of Age on Outcome
A more detailed analysis of age groups was conducted with the three main outcomes (asymptomatic, symptomatic, and death). There was a significant difference in age (p = 0.001) among the outcome subgroups. The "asymptomatic" subgroup had a significantly lower age (median = 50 years) compared to the "symptomatic" subgroup (median = 58 years) and, especially, the "death" subgroup (median = 73 years). There was no significant difference between the "symptomatic" and "death" subgroups, which supports the inference drawn from the age group analysis in Table 1. The subgroup of patients who died had a significantly higher age (median = 73 years) compared to the subgroup of patients who survived (median = 52 years) (p = 0.0002). Table 4 shows the mean, standard deviation, median, and interquartile range of age (in years) for the total sample and the outcome subgroups.
4. Discussion
The SARS-CoV-2 pandemic brought health systems to the brink of collapse, necessitating resource management and even rationing in some countries. Although a significant proportion of patients remained asymptomatic, severe disease affected many individuals, often leading to rapid clinical deterioration [31]. In this context, the search for markers that could predict severe outcomes became paramount [31]. Although the RT-PCR test being is the gold standard for diagnosis, thoracic imaging studies were initially suggested when RT-PCR was not available or in cases of negative results despite high clinical suspicion [32]. The increased demand for CT as the primary imaging modality for diagnosis and monitoring of COVID-19 patients motivated the present study, which aimed to define radiographic compatibility patterns for COVID-19 and to correlate these patterns and the extent of parenchymal involvement on CXR with patient clinical outcomes.
In the analysis of possible associations between clinical variables and outcomes (asymptomatic, symptomatic, and death), a significant difference was found in age group and total comorbidity was found between the subgroups. The association between death and patients over 60 years of age is consistent with the study by Rosenthal and colleagues [33], in which hospital deaths were disproportionately higher in the group over 65 years of age, accounting for 75% of the reported deaths. This finding is consistent with that of Capone and colleagues [34], who demonstrated that older persons require special attention, particularly because they are more prone to developing comorbidities such as cardiovascular and cerebrovascular disease, cancer, and mental disorders, which increase the risk of death from COVID-19. Due to the heterogeneity of the elderly population, specific prevention protocols should be developed with a focus on this age group.
The finding that patients who died had significantly higher overall comorbidities than surviving patients is consistent with the same study by Rosenthal and colleagues [33]. These authors found that hospitalized patients had a higher frequency of comorbidities than outpatients. Feitoza and colleagues [35] also found that cardiovascular disease was the most common risk factor in COVID-19 patients. In addition, respiratory problems were highlighted among these comorbidities, especially in cases of chronic lung disease. It has been shown that the presence of comorbidities increases the risk of death by a factor of 9.44 compared to the previously healthy population [35]. The presence of chronic health problems prior to viral infection was also shown to be associated with worse outcomes in the MERS and SARS outbreaks [36].
Although the present study did not find any significant associations between the factor "smoking" and outcomes, some studies have indicated a worsening of the respiratory system in patients who were smokers [33,35]. In the literature, smoking is not directly associated with more severe outcomes. However, reduced respiratory capacity, a condition that can be caused by this habit, is directly related to comorbidities in COVID-19. Like other microbial infections, smoking is associated with endothelial dysfunction and increased levels of free radicals, making it plausible that COVID-19 could cause harm in smokers who already have endothelial damage. Therefore, smoking cessation is essential for significant improvement in endothelial function [37]. The association between the need for mechanical ventilation and progression to death can be justified by the severity of the clinical condition of patients who developed respiratory failure, which is supported by other studies in the literature [38].
Analysis of radiographic parameters such as pattern and extent of opacities, type of opacities (type 1, 2, and 3), lung involvement, symmetry, and changes in transverse and longitudinal axes showed significant associations with clinical outcomes in COVID-19. It was observed that the subgroup of asymptomatic patients had a significantly lower incidence of type 3 opacities (consolidations on CT) compared to the symptomatic subgroups and those who progressed to death. Type 3 ground-glass opacities were associated with more severe clinical conditions, suggesting a direct relationship with symptom progression and mortality.
With regard to type 1 opacities, which represent ground-glass opacities on CT, there was a tendency for them to be less present in patients who died. This makes sense, as severely ill patients tend to have more advanced disease, where consolidations predominate. Ground glass opacities are generally associated with the early stages of COVID-19 infection, reflecting fluid accumulation in alveolar areas without complete collapse of the alveolar walls. On the other hand, the lesser presence of type 1 opacities in deceased patients suggests that the absence of these changes may also indicate a more advanced stage of disease, with greater pulmonary involvement and reduced responsiveness to treatment. These findings are consistent with the pathophysiology of the disease, as the presence of pulmonary consolidations indicates a severe inflammatory response in the lung parenchyma, often resulting from severe viral infection and diffuse alveolar damage. The cytokine storm and influx of inflammatory cells lead to the formation of exudates and fibrosis, visualized as opaque areas on CXR and dense areas on CT. As the disease progresses, these areas may evolve, indicating more severe inflammation and structural damage to the lung [39].
Regarding the distribution of opacities in the parenchyma, the finding of greater asymmetry in patients with comorbidities can be understood as the heterogeneity of the disease when associated with other respiratory diseases due to comorbidities. In the imaging diagnosis of COVID-19 pneumonia, Capone and colleagues [34] emphasized that CXR typically showed findings of ground-glass opacities, consolidations, and multifocal bilateral linear opacities, with varying degrees of parenchymal involvement depending on the severity of the patient and the time course of the disease. In COVID-19 infection, the alveolar spaces are filled with cells, tissues, and even pathologic fluid, affecting blood vessels and bronchial margins, and initially appear as ground-glass opacities. Later, around the tenth day of progression, these opacities tend to evolve into consolidations with a distribution pattern similar to the initial opacities and are often associated with ground-glass opacities. They may also be located around the airways, forming the organizing pneumonia pattern.
Consolidations occur in 31.8% to 41% of cases, but their frequency varies, especially in reticular opacities. These changes are indicative of severity and may be associated with bacterial pneumonia, helping to identify necessary adjustments in treatment. Therefore, consolidations indicated by type 3 opacities are associated with a more severe clinical course and the occurrence of organizing pneumonia [32,34].
Although the sensitivity of CT is higher than that of CXR, the latter should be considered in the evaluation of suspected COVID-19 cases during a pandemic due to its greater accessibility, speed, lower cost, and reduced radiation exposure. In addition, the use of portable equipment reduces the risk of infection compared to situations in which hospitalized patients must be transported to the imaging department [21]. It is important to remember that asymptomatic patients can transmit the virus and that asymptomatic or minimally symptomatic patients may present with positive radiographs after 14 days of qua-rantine, even without RT-PCR testing. In addition, Wong and colleagues [40] reported that CXRs are useful for demonstrating pulmonary dysfunction in COVID-19 patients and for providing a parameter for other tests and for monitoring treatment response.
In the present study, as might be expected, no significant association was found between radiographic scores for COVID-19 and clinical or outcome parameters. However, Baratella and colleagues [41] suggested that a radiographic severity score could predict clinical outcomes in individuals with COVID-19 in the absence of lung injury or in more severe cases. However, the radiographic score alone is unable to predict clinical outcomes in individuals with mild to moderate parenchymal lesions. In these cases, the score must be correlated with clinical and laboratory information to identify individuals at the onset of symptoms who may require ventilatory support during hospitalization. The COVID-19 infection, which is novel and unique, has already resulted in several complex clinical syndromes. The consequences and sequelae of the infection will only become clear over time. It is critical that the healthcare community be prepared to identify and manage the long-term effects and have the resources to do so. As a result, standardization of imaging findings will become increasingly important to successfully identify parenchymal changes and initiate follow-up for these individuals. Only then will it be possible to track the progression of the disease pattern, both in the acute and chronic phases, in order to conserve valuable resources and minimize the long-term health impact associated with the complications of this devastating disease [42].
This study had several limitations. First, the small sample size due to the low number of X-ray requests at screening centers. Second, we studied CXR findings from both screening and hospitalized patients, and the inclusion of hospitalized patients with more severe conditions may have influenced the accuracy test results. The third limiting factor is inherent to the retrospective study design, with incomplete information in the electronic medical records consulted.
5. Conclusions
Radiographic changes in COVID-19 can be classified according to the types of opacities that correspond to the tomographic findings of ground-glass opacities, septal thickening, and consolidations. In more severe cases, the presence of type 1 opacities, corresponding to ground-glass opacities on CT, is less common, and type 3 opacities, represented by consolidations on CT, predominate. These consolidations may be secondary to conditions such as organizing pneumonia. In addition, asymmetry in the distribution of lesions may reflect the heterogeneity of the disease when associated with other respiratory diseases due to comorbidities. Age over 60 years, the presence of comorbidities and the use of mechanical ventilation are clinical parameters that should alert the attending physician to the possibility of worse outcomes.
Author Contributions
Conceptualization, G.A.P.S. and A.J.L.; methodology, G.A.P.S., H.S.B.C., and C.M.M.; software, G.A.P.S. and C.G.C.C.; validation, G.A.P.S., H.S.B.C., and R.M.; formal analysis, G.A.P.S. and A.J.L.; investigation, G.A.P.S., H.S.B.C., C.M.M., and C.G.C.C.; resources, G.A.P.S. and A.J.L.; data curation, G.A.P.S. and H.S.B.C.; writing—original draft preparation, G.A.P.S.; writing—review and editing, G.A.P.S., H.S.B.C., C.M.M., C.G.C.C., R.M., and A.J.L.; visualization, G.A.P.S. and A.J.L.; supervision, R.M. and A.J.L.; project administration, G.A.P.S. and A.J.L. All authors have read and agreed to the published version of the manuscript.
Funding
This research received no external funding.
Institutional Review Board Statement
The study was approved by the Research Ethics Committee of the Pedro Ernesto University Hospital (HUPE), operated by the State University of Rio de Janeiro, in the city of Rio de Janeiro, Brazil, under protocol number CAAE-31363230.1.0000.5282.
Informed Consent Statement
Not applicable.
Conflicts of Interest
The authors declare no conflicts of interest.
Abbreviations
The following abbreviations are used in this manuscript:
| AP | Anteroposterior |
| CAAE | Certificate of Presentation for Ethical Appreciation |
| COVID-19 | Coronavirus Disease 2019 |
| CT | Computed tomography |
| CXR | Chest X-ray |
| DM | Diabetes mellitus |
| HUPE | Pedro Ernesto University Hospital |
| IQR | Interquartile range |
| PA | Posteroanterior |
| RT-PCR | Reverse transcription-polymerase chain reaction |
| SAH | Systemic arterial hypertension |
| SARS-CoV-2 | Severe Acute Respiratory Syndrome Coronavirus 2 |
| WHO | World Health Organization |
References
- Pereira, I.D.R.; Soares, O.A.B. Análise de casos de COVID-19 no Hospital Central do Exército (HCE) durante a pandemia com ênfase nos aspectos tomográficos. Brasil, 2020. Trabalho de Conclusão de Curso (Curso de Aperfeiçoamento de Oficiais Médicos) – Escola de Saúde do Exército. Available online: http://bdex.eb.mil.br/jspui/handle/123456789/8160 (accessed on 2 July 2024).
- World Health Organization. Clinical Management of COVID-19. 2020. Available online: https://www.who.int/news-room/detail/29-06-2020-covidtimeline (accessed on 2 July 2024).
- Brasil. Ministério da Saúde. Protocolo de manejo clínico para o novo coronavírus (2019-nCoV). Brasília: MS, 2020. Available online: https://portaldeboaspraticas.iff.fiocruz.br/biblioteca/protocolo-de-manejo-clinico-para-o-novo-coronavirus2019-ncov/ (accessed on 2 July 2024).
- Perlman, S.; McIntosh, K. Mandell, Douglas and Bennett's principles and practice of Infectious Diseases. 2020, p. 2072–2080.
- Bosch, B.J.; Van Der Zee, R.; Haan, C.A.M.; Rottier, P.J.M. The coronavirus spike protein is a class I virus fusion protein: structural and functional characterization of the fusion core complex. J. Virol. 2003, 77, 8801–8811. [Google Scholar] [CrossRef] [PubMed]
- Chen, Y.; Liu, Q.; Guo, D. Emerging coronaviruses: genome structure, replication, and pathogenesis. J. Med. Virol. 2020, 92, 418–423. [Google Scholar] [PubMed]
- Giovagnoni, A.; Agostini, A. Diagnosi radiologica e prevenzione della diffusione di COVID-19 nei Dipartimenti di Radiologia. 2020. Available online: https://www.sirm.org/wp-content/uploads/2020/03/SIRM-Covid-19.pdf (accessed on 2 July 2024).
- Remuzzi, A.; Remuzzi, G. COVID-19 and Italy: what next? Lancet 2020, 395, 1225–1228. [Google Scholar] [CrossRef] [PubMed]
- Huang, C.; Wang, Y.; Li, X.; Ren, L.; Zhao, J.; Hu, Y.; et al. Clinical features of patients infected with 2019 novel coronavirus in Wuhan, China. Lancet 2020, 395, 497–506. [Google Scholar]
- Hui, D.S.; Azhar, E.I.; Madani, T.A.; Ntoumi, F.; Koch, R.; Dar, O.; et al. The continuing 2019-nCoV epidemic threat of novel coronaviruses to global health: The latest 2019 novel coronavirus outbreak in Wuhan, China. Int. J. Infect. Dis. 2020, 91, 264–266. [Google Scholar]
- Guan, W.J.; Ni, Z.Y.; Hu, Y.; Liang, W.H.; Ou, C.Q.; He, J.X.; et al. Clinical characteristics of coronavirus disease 2019 in China. N. Engl. J. Med. 2020, 382, 1708–1720. [Google Scholar]
- Pecho-Silva, S.; Navarro-Solsol, A.C.; Taype-Rondan, A.; Torres-Valencia, J.; Arteaga-Livias, K.; Herriman, D.A.; et al. Pulmonary ultrasound in the diagnosis and monitoring of coronavirus disease (COVID-19): a systematic review. Ultrasound Med. Biol. 2021, 47, 1997–2005. [Google Scholar] [CrossRef]
- Lopes, A.J.; Mafort, T.T.; Da Costa, C.H.; Rufino, R.; De Cássia Firmida, M.; Kirk, K.M.; et al. Comparison Between Lung Ultrasound and Computed Tomographic Findings in Patients With COVID-19 Pneumonia. J. Ultrasound Med. 2021, 41, 1391–1399. [Google Scholar]
- Zhao, Y.; Xiang, C.; Wang, S.; Peng, C.; Zou, Q.; Hu, J. Radiology department strategies to protect radiologic technologists against COVID-19: experience from Wuhan. Eur. J. Radiol. 2020, 127, 108996. [Google Scholar]
- Ai, T.; Yang, Z.; Hou, H.; Zhan, C.; Chen, C.; Lv, W.; et al. Correlation of Chest CT and RT-PCR Testing for Coronavirus Disease 2019 (COVID-19) in China: A Report of 1014 Cases. Radiology 2020, 296, E32–E40. [Google Scholar]
- Kim, H.; Hong, H.; Yoon, S.H. Diagnostic performance of CT and reverse transcriptase-polymerase chain reaction for coronavirus disease 2019: a meta-analysis. Radiology 2020, 296, E145–E155. [Google Scholar] [CrossRef]
- Song, F.; Shi, N.; Shan, F.; Zhang, Z.; Shen, J.; Lu, H.; et al. Emerging 2019 Novel Coronavirus (2019-nCoV) Pneumonia. Radiology 2020, 295, 210–217. [Google Scholar] [CrossRef]
- Pan, F.; Ye, T.; Sun, P.; Gui, S.; Liang, B.; Li, L.; et al. Time Course of Lung Changes at Chest CT during Recovery from Coronavirus Disease 2019 (COVID-19). Radiology 2020, 295, 715–721. [Google Scholar] [PubMed]
- De Jaegere, T.M.H.; Krdzalic, J.; Fasen, B.; Kwee, R.M. Radiological Society of North America Chest CT Classification System for Reporting COVID-19 Pneumonia: interobserver variability and correlation with reverse-transcription polymerase chain reaction. Radiol. Cardiothorac. Imaging 2020, 2, e200213. [Google Scholar]
- Hope, M.D.; Raptis, C.A.; Shah, A.; Hammer, M.M.; Henry, T.S. A role for CT in COVID-19? What data really tell us so far. Lancet 2020, 395, 1189–1190. [Google Scholar]
- Bandirali, M.; Sconfienza, L.M.; Serra, R.; Brembilla, R.; Albano, D.; Pregliasco, F.E.; et al. Chest radiograph findings in asymptomatic and minimally symptomatic quarantined patients in Codogno, Italy during COVID-19 pandemic. Radiology 2020, 295, E7–E8. [Google Scholar] [CrossRef] [PubMed]
- Choi, H.; Qi, X.; Yoon, S.H.; Park, S.J.; Lee, K.H.; Kim, J.Y.; et al. Extension of coronavirus disease 2019 (COVID-19) on chest CT and implications for chest radiograph interpretation. Radiol. Cardiothorac. Imaging 2020, 2, e200107. [Google Scholar] [CrossRef]
- Yoon, S.H.; Lee, K.H.; Kim, J.Y.; Lee, Y.K.; Ko, H.; Kim, K.H.; et al. Chest Radiographic and CT Findings of the 2019 Novel Coronavirus Disease (COVID-19): Analysis of nine patients treated in Korea. Korean J. Radiol. 2020, 21, 494–500. [Google Scholar]
- Litmanovich, D.E.; Chung, M.; Kirkbride, R.K.; Kicska, G.; Kanne, J.P. Review of chest radiograph findings of COVID-19 pneumonia and suggested reporting language. J. Thorac. Imaging 2020, 35, 219–227. [Google Scholar]
- Toussie, D.; Voutsinas, N.; Finkelstein, M.; Cedillo, M.A.; Manna, S.; Maron, S.Z.; et al. Clinical and chest radiography features determine patient outcomes in young and middle age adults with COVID-19. Radiology 2020, 297, E197–E206. [Google Scholar]
- Vancheri, S.G.; Savietto, G.; Ballati, F.; Maggi, A.; Canino, C.; Bortolotto, C.; et al. Radiographic findings in 240 patients with COVID-19 pneumonia: time-dependence after the onset of symptoms. Eur. Radiol. 2020, 30, 6161–6169. [Google Scholar]
- Parekh, M.; Donuru, A.; Balasubramanya, R.; Kapur, S. Review of the Chest CT differential diagnosis of ground-glass opacities in the COVID Era. Radiology 2020, 297, E289–E302. [Google Scholar] [PubMed]
- Simpson, S.; Kay, F.U.; Abbara, S.; Bhalla, S.; Chung, J.H.; Chung, M.; et al. Radiological Society of North America Expert Consensus Statement on Reporting Chest CT Findings Related to COVID-19. J. Thorac. Imaging 2020, 35, 219–227. [Google Scholar] [PubMed]
- Kirkpatrick, J.N.; Swaminathan, M.; Adedipe, A.; Garcia-Sayan, E.; Hung, J.; Kelly, N.; et al. American Society of Echocardiography COVID-19 Statement Update: Lessons Learned and Preparation for Future Pandemics. J. Am. Soc. Echocardiogr. 2023, 36, 1127–1139. [Google Scholar] [PubMed]
- Hochhegger, B.; Zanon, M.; Altmayer, S.; Mandelli, N.S.; Stüker, G.; Mohammed, T.L.; et al. COVID-19 mimics on chest CT: a pictorial review and radiologic guide. Br. J. Radiol. 2021, 94, 20200703. [Google Scholar]
- Torres, P.P.T.; Irion, K.L.; Marchiori, E. COVID-19: radiografia de tórax na predição de desfecho clínico. J. Bras. Pneumol. 2020, 46, e20200464. [Google Scholar]
- Alencar, J.R.M.; Taumaturgo, I.C.B. A importância da utilização de exames radiológicos no diagnóstico da Covid-19. Braz. J. Dev. 2021, 7, 66545–66554. [Google Scholar]
- Rosenthal, N.; Cao, Z.; Gundrum, J.; Sianis, J.; Safo, S. Risk factors associated with in-hospital mortality in a US National Sample of Patients with COVID-19. JAMA Netw. Open 2020, 3, e2020352. [Google Scholar]
- Capone, D.; Capone, R.; Pereira, A.C.H.; Bruno, L.P.; Visconti, N.R.G.R.; Jansen, J.M. Diagnóstico por imagem na pneumonia por COVID-19. Pulmão RJ 2020, 29, 22–27. [Google Scholar]
- Feitoza, T.M.O.; Chaves, A.M.; Muniz, G.T.S.; Da Cruz, M.C.C.; Junior, I.F.C. Comorbidades e COVID-19: uma revisão integrativa. Rev. Interfaces 2020, 8, 711–723. [Google Scholar]
- Abate, S.M.; Checkol, Y.A.; Mantefardoc, B. Prevalence and risk factors of mortality among hospitalized patients with COVID-19: A systematic review and Meta-analysis. Ann. Med. Surg. 2021, 64, 102204. [Google Scholar]
- Da Silva, A.L.O.; Moreira, J.C.; Martins, S.R. COVID-19 e tabagismo: uma relação de risco. Cad. Saúde Pública 2020, 36, e00072020. [Google Scholar]
- Mogami, R. Comparison between lung ultrasound and computed tomographic findings in patients with COVID-19 pneumonia. J. Ultrasound Med. 2021, 40, 1391–1399. [Google Scholar]
- Zhou, F.; Yu, T.; Du, R.; Fan, G.; Liu, Y.; Liu, Z.; et al. Clinical course and risk factors for mortality of adult inpatients with COVID-19 in Wuhan, China: a retrospective cohort study. Lancet 2020, 395, 1054–1062. [Google Scholar]
- Wong, H.Y.F.; Lam, H.Y.S.; Fong, A.H.; Leung, S.T.; Chin, T.W.; Lo, C.S.Y.; et al. Frequency and distribution of chest radiographic findings in COVID-19 positive patients. Radiology 2019, 296, E72–E78. [Google Scholar]
- Baratella, E.; Crivelli, P.; Marrocchio, C.; Bozzato, A.M.; Vito, A.; Madeddu, G.; et al. Gravidade do comprometimento pulmonar em radiografias de tórax de pacientes infectados por SARS-coronavirus-2 como possível ferramenta para prever a evolução clínica: análise retrospectiva observacional da relação entre dados radiológicos, clínicos e laboratoriais. J. Bras. Pneumol. 2020, 46, e20200226. [Google Scholar]
- George, P.M.; Barratt, S.L.; Condliffe, R.; Desai, S.R.; Devaraj, A.; Forrest, I.; et al. Respiratory follow-up of patients with COVID-19 pneumonia. Thorax 2020, 75, 1009–1016. [Google Scholar]
Figure 1.
Male, 40 years old, seven days after symptom onset. (a) Frontal radiograph with type two opacities (white arrows) in the lower thirds and type one opacities in the upper regions (black arrows). (b) Chest CT, parenchymal window, coronal reconstruction. Type two opacities in the lower thirds (gray arrows) and type one opacities in the right upper region (black arrows). (c) Chest CT, parenchymal window, level of the lower lobes. Multiple dense ground-glass opacities with associated reticulations (type two opacities).
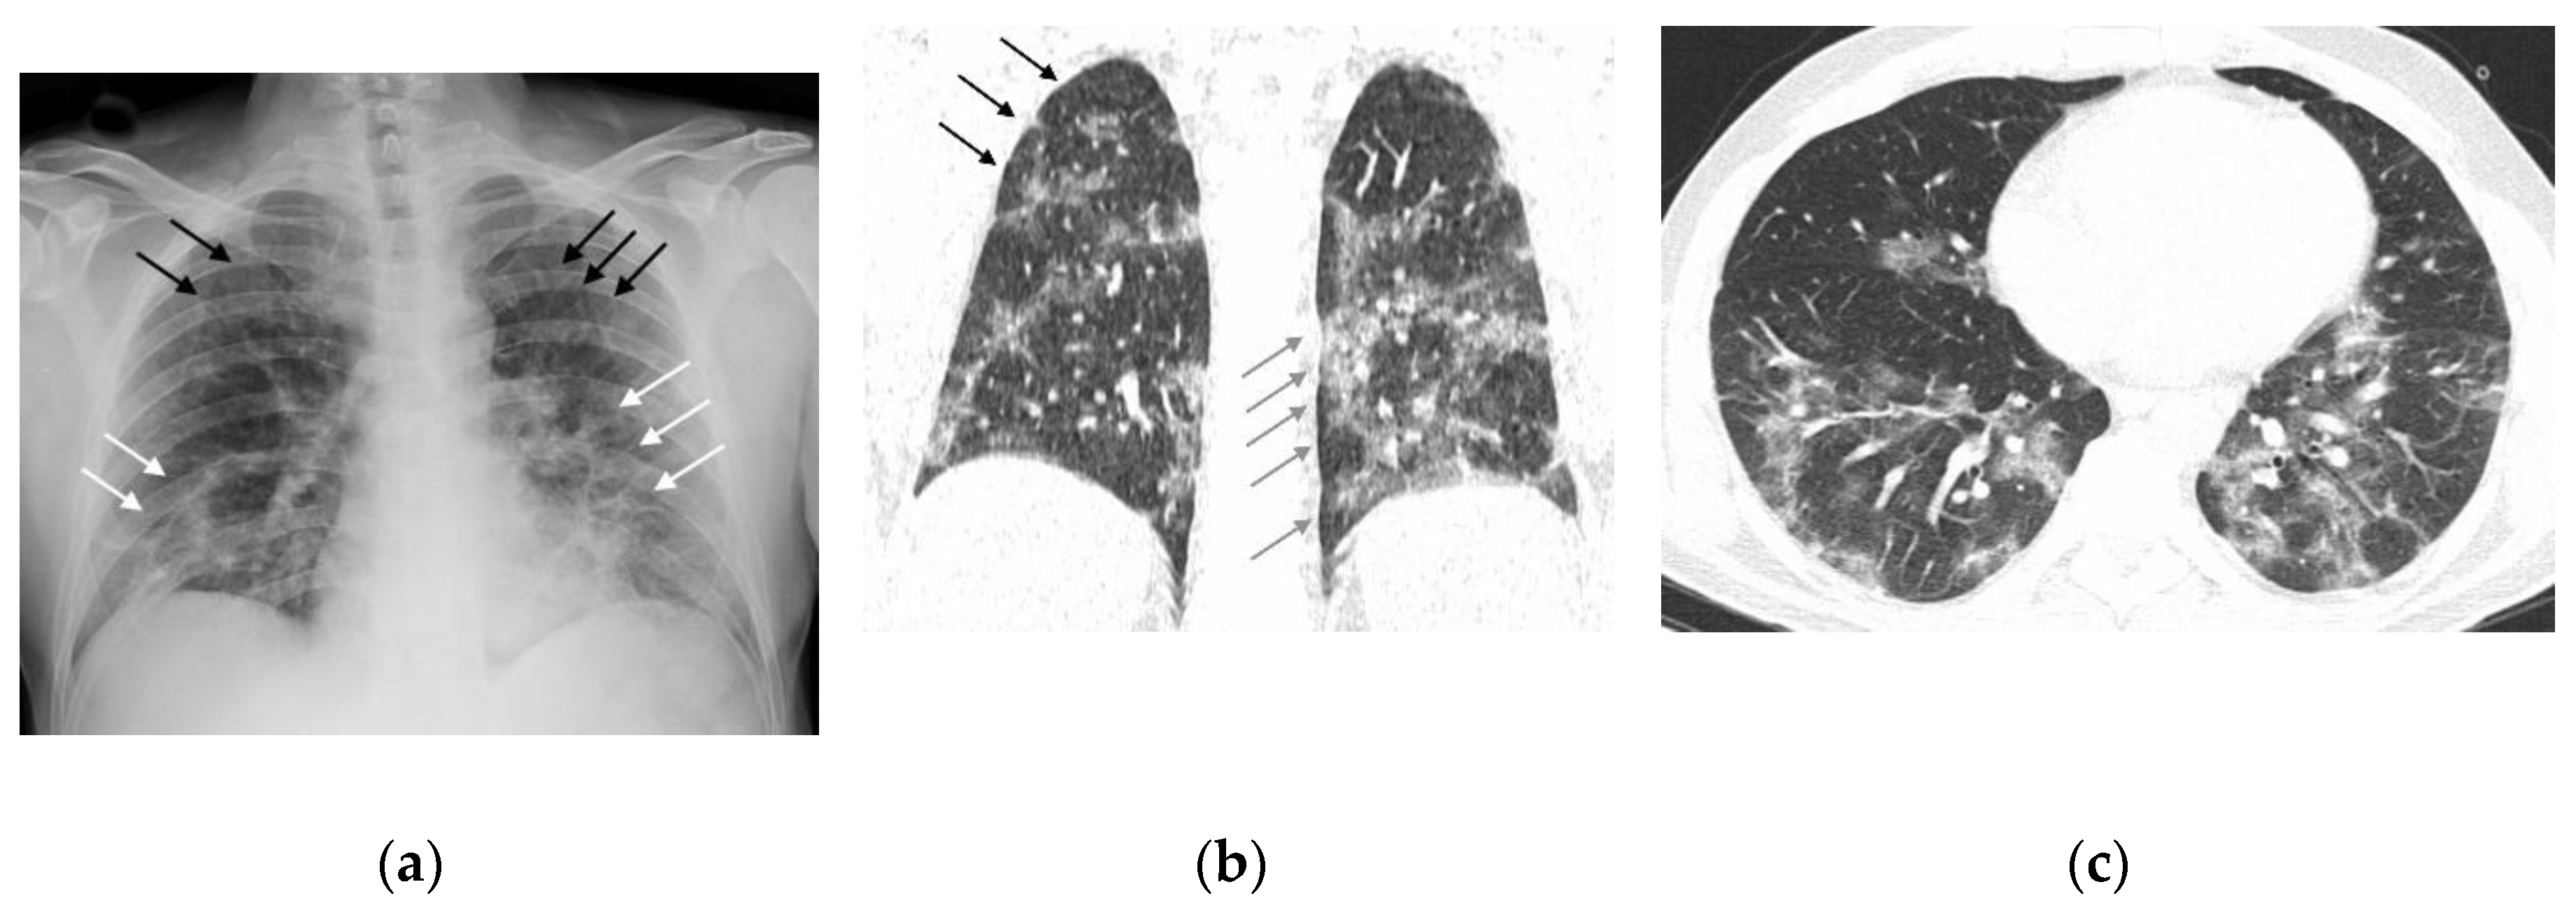
Figure 2.
Female, 82 years old, five days after symptom onset. (a) Frontal radiograph with symmetric distribution of type two opacities (white arrows) and type one opacities (black arrows). (b) Chest CT, parenchymal window, at the level of the upper lobes. Multiple ground-glass opacities (type one). (c) Chest CT, parenchymal window, at the level of the lower lobes. Multiple dense ground-glass opacities (type two).
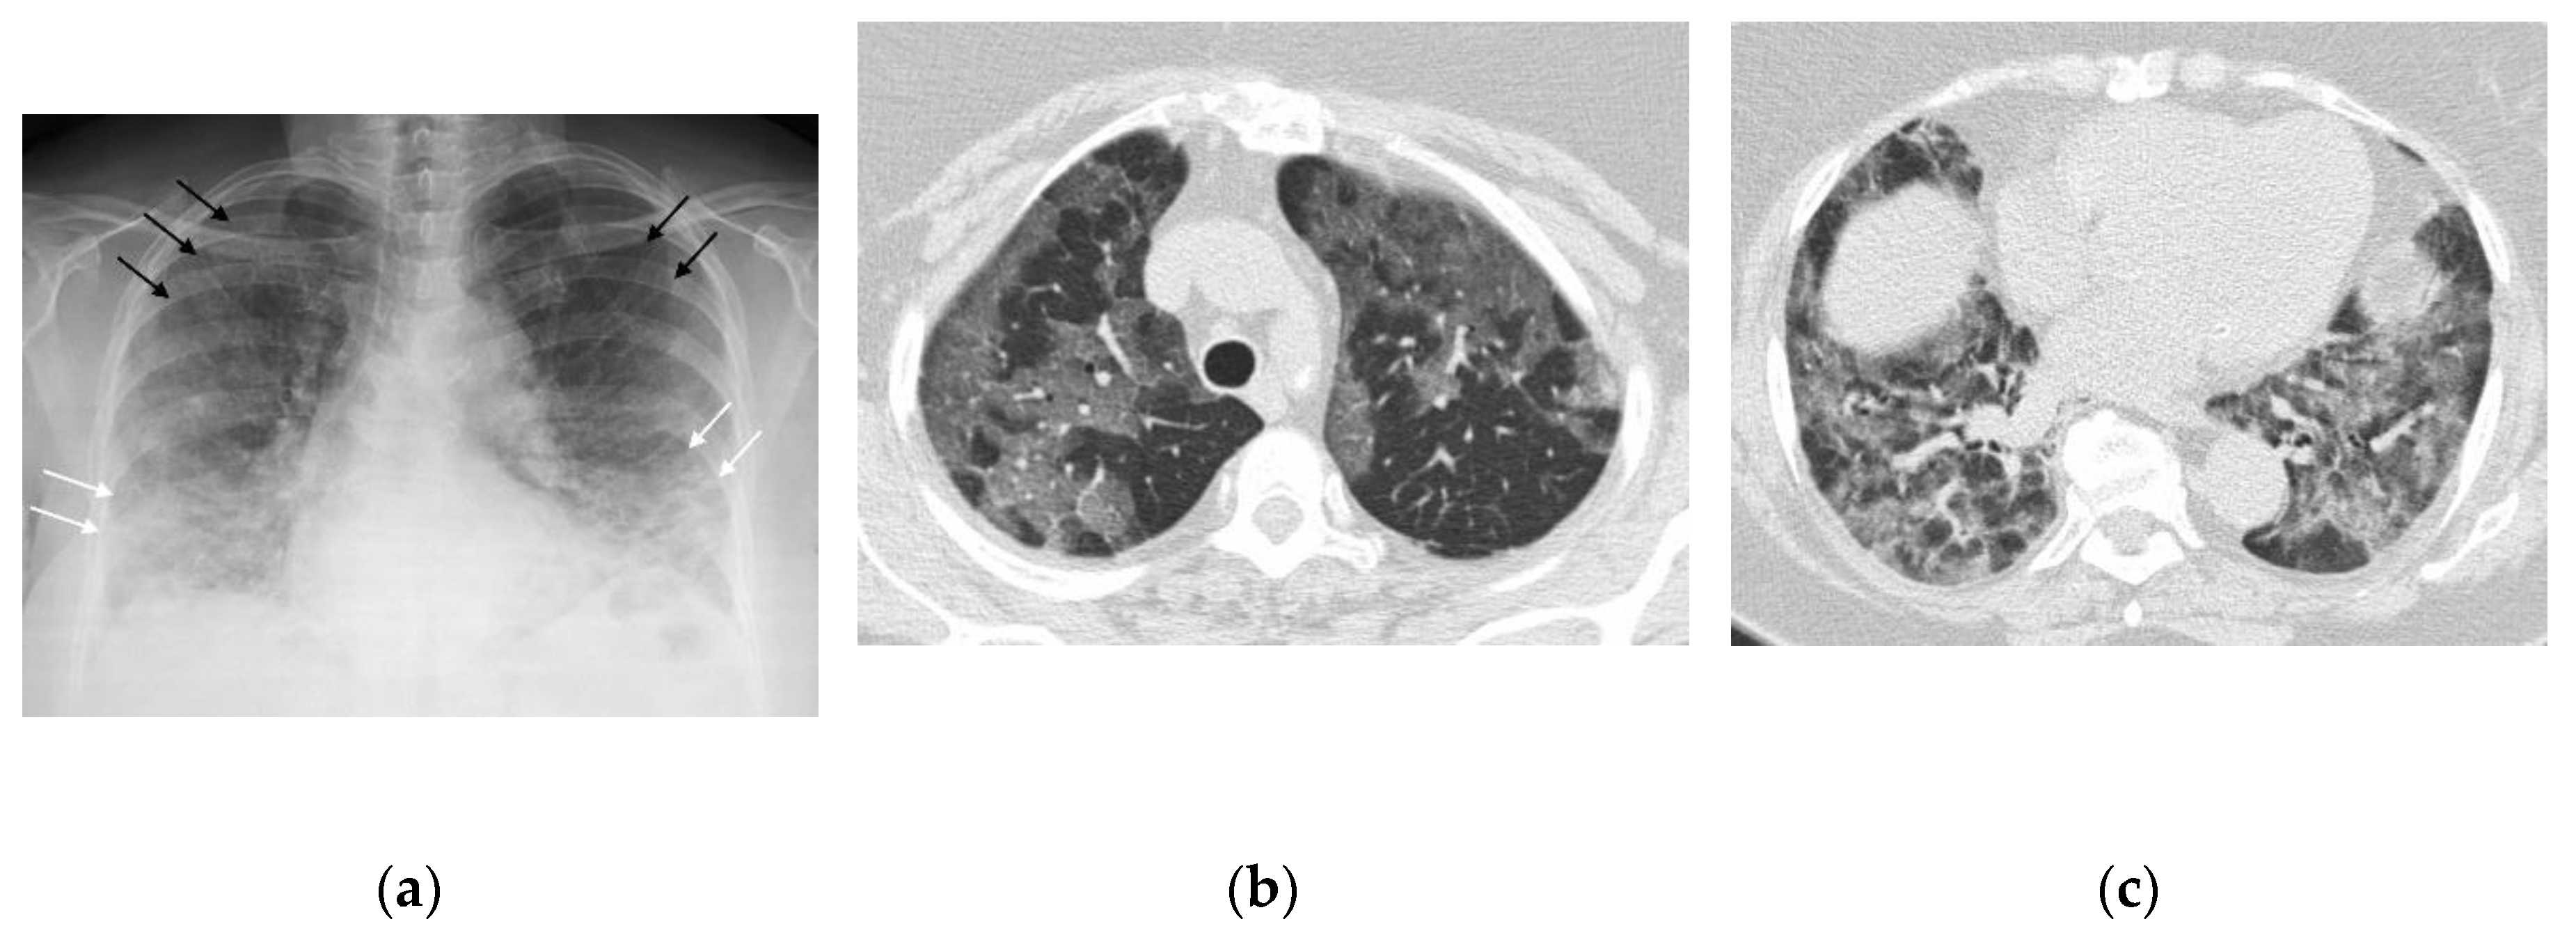
Figure 3.
Female, 33 years old, seven days after symptom onset. (a) The frontal radiograph shows focal areas of indistinct vascular structures (type one opacities) (arrows). (b) Chest CT, parenchymal window. Note the irregular distribution of nodular ground-glass opacities (type one opacities).
Figure 3.
Female, 33 years old, seven days after symptom onset. (a) The frontal radiograph shows focal areas of indistinct vascular structures (type one opacities) (arrows). (b) Chest CT, parenchymal window. Note the irregular distribution of nodular ground-glass opacities (type one opacities).
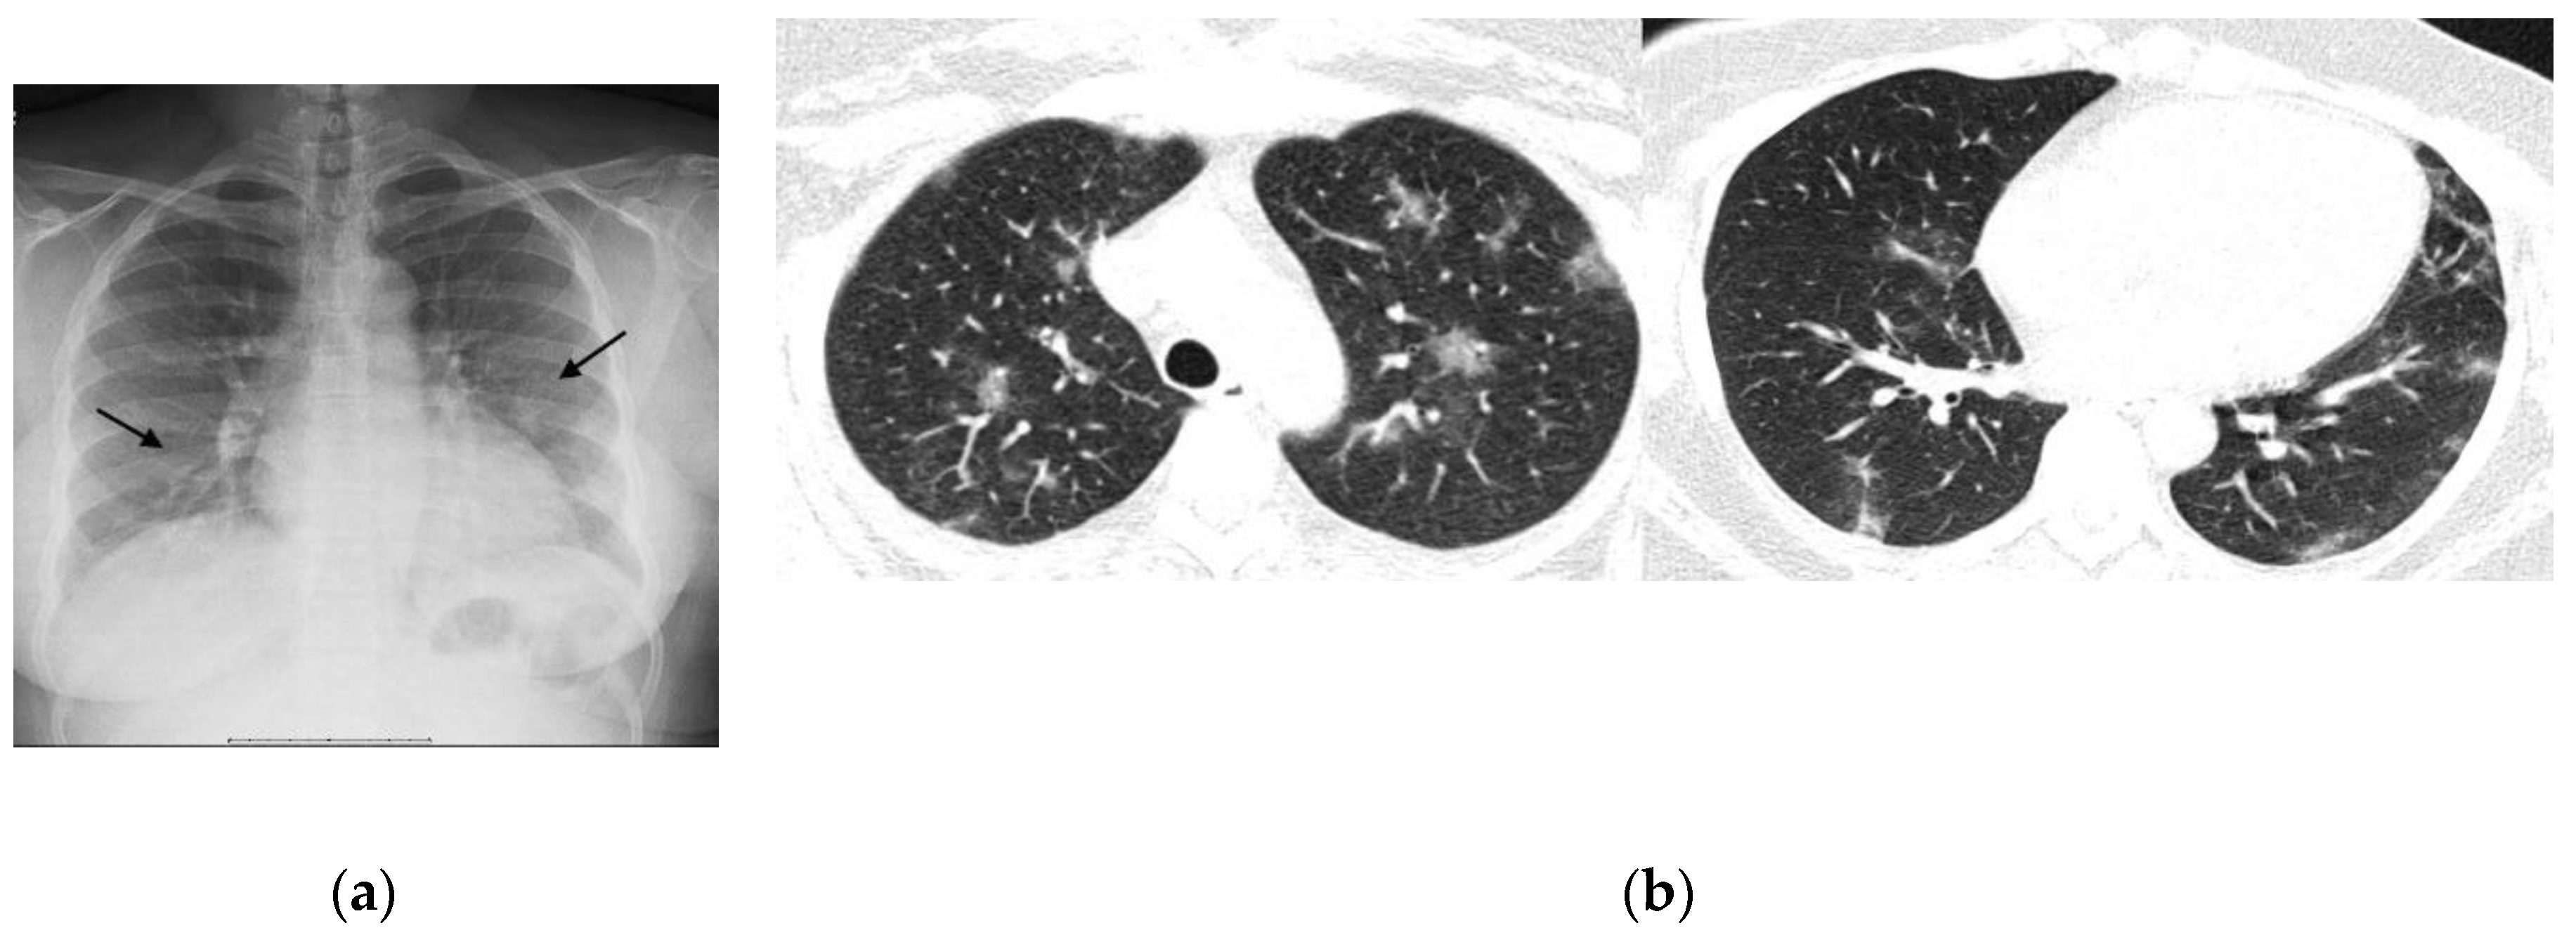
Figure 4.
Female, 54 years old, ten days after symptom onset. (a) Frontal radiograph with peripheral consolidations, type three opacities (arrows). (b) Chest CT, parenchymal window, at the level of the lower lobes. Extensive consolidations and some ground-glass opacities in both lungs (arrows).
Figure 4.
Female, 54 years old, ten days after symptom onset. (a) Frontal radiograph with peripheral consolidations, type three opacities (arrows). (b) Chest CT, parenchymal window, at the level of the lower lobes. Extensive consolidations and some ground-glass opacities in both lungs (arrows).
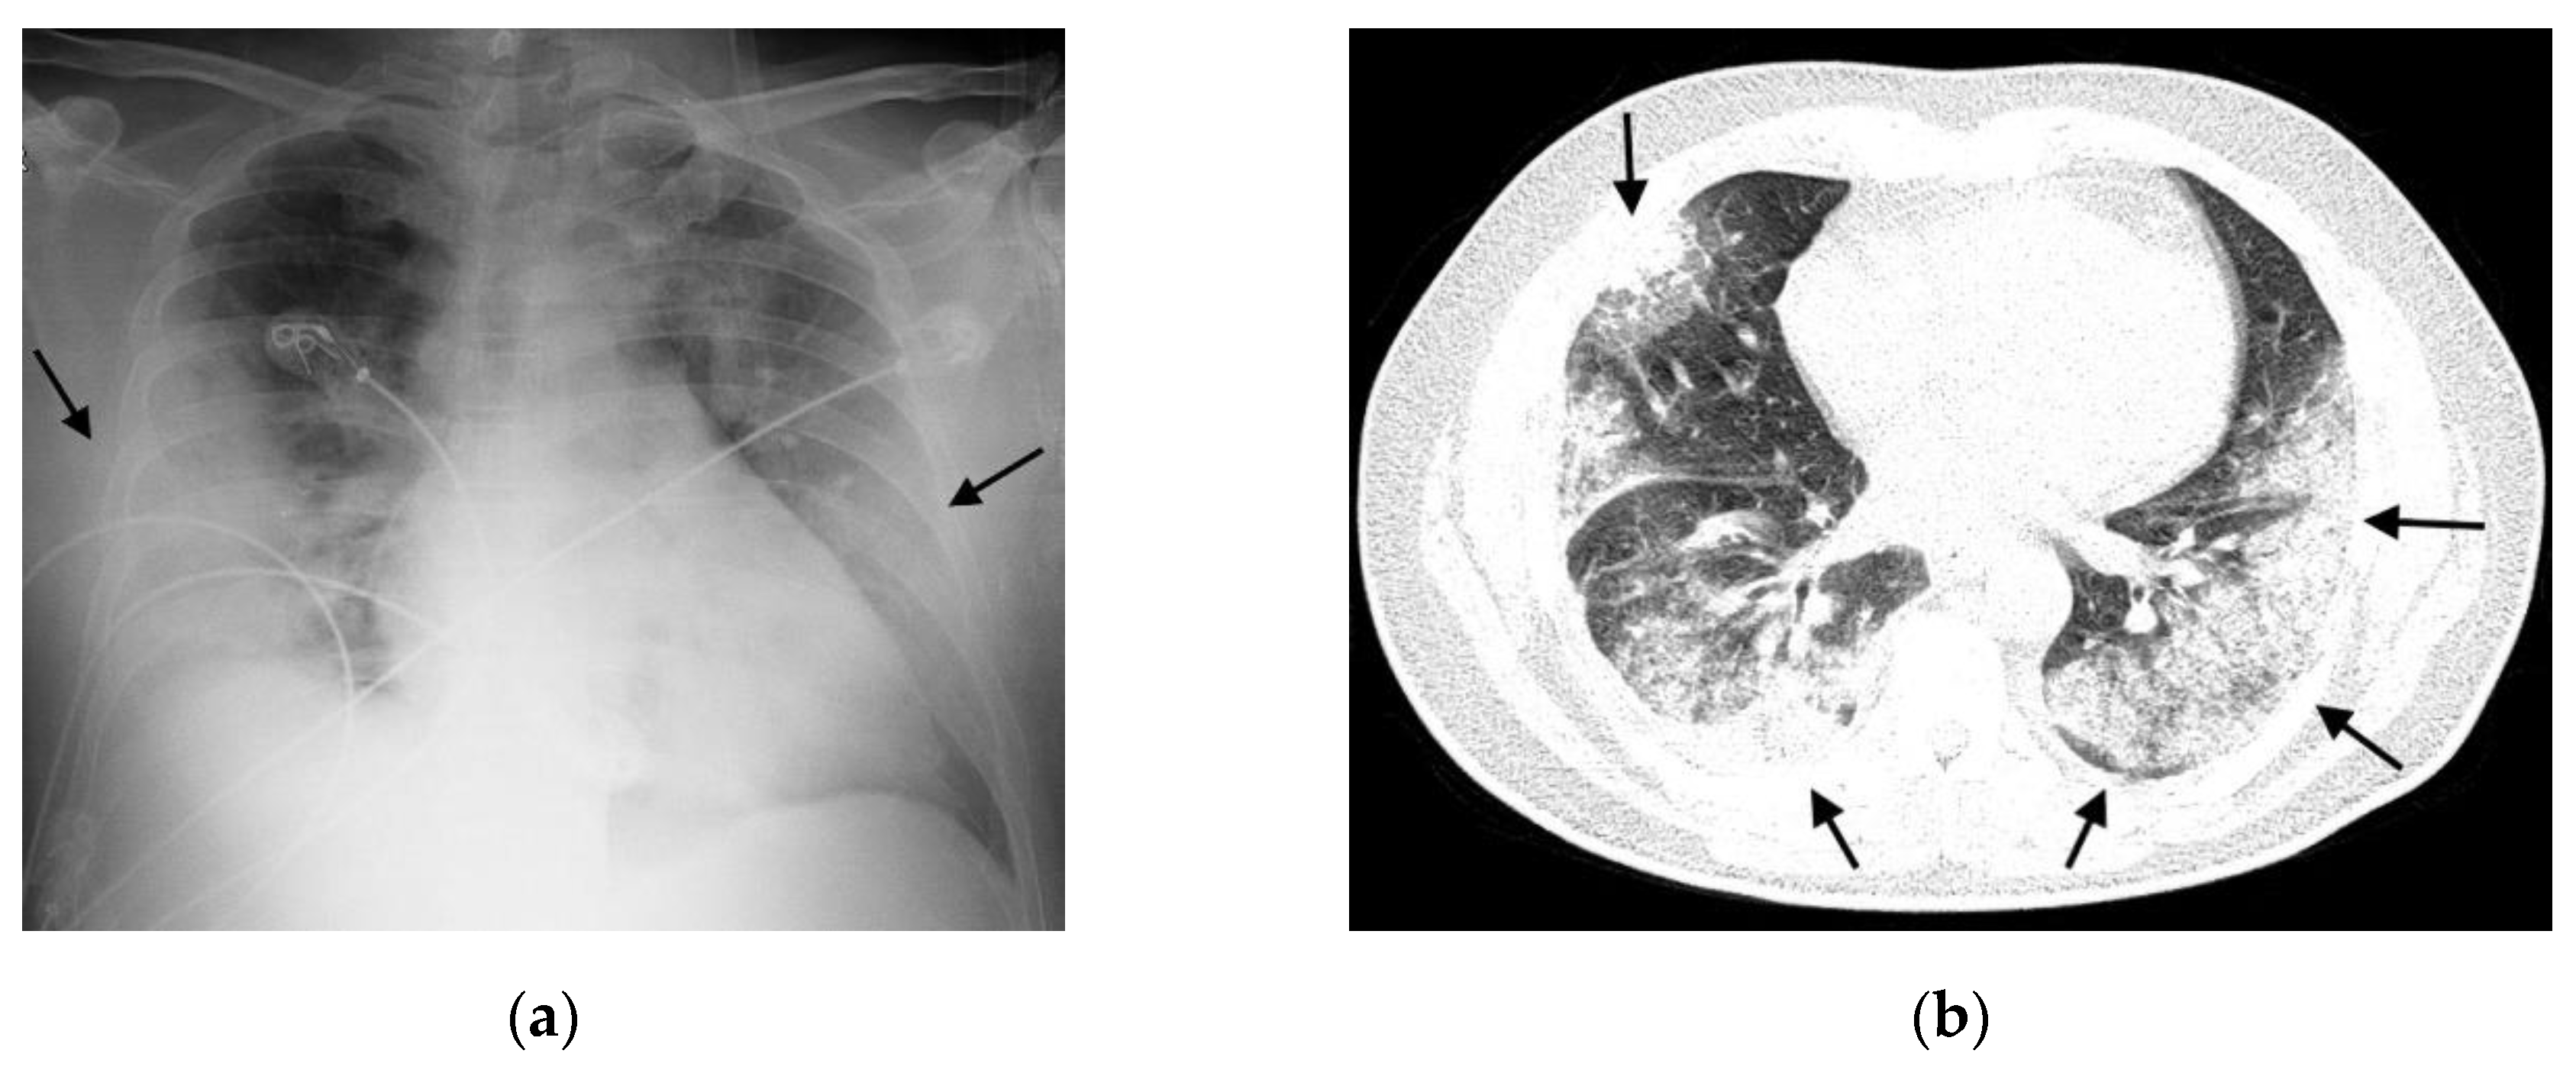
Figure 5.
Posteroanterior CXR. Black lines demarcate the boundaries of the six zones.
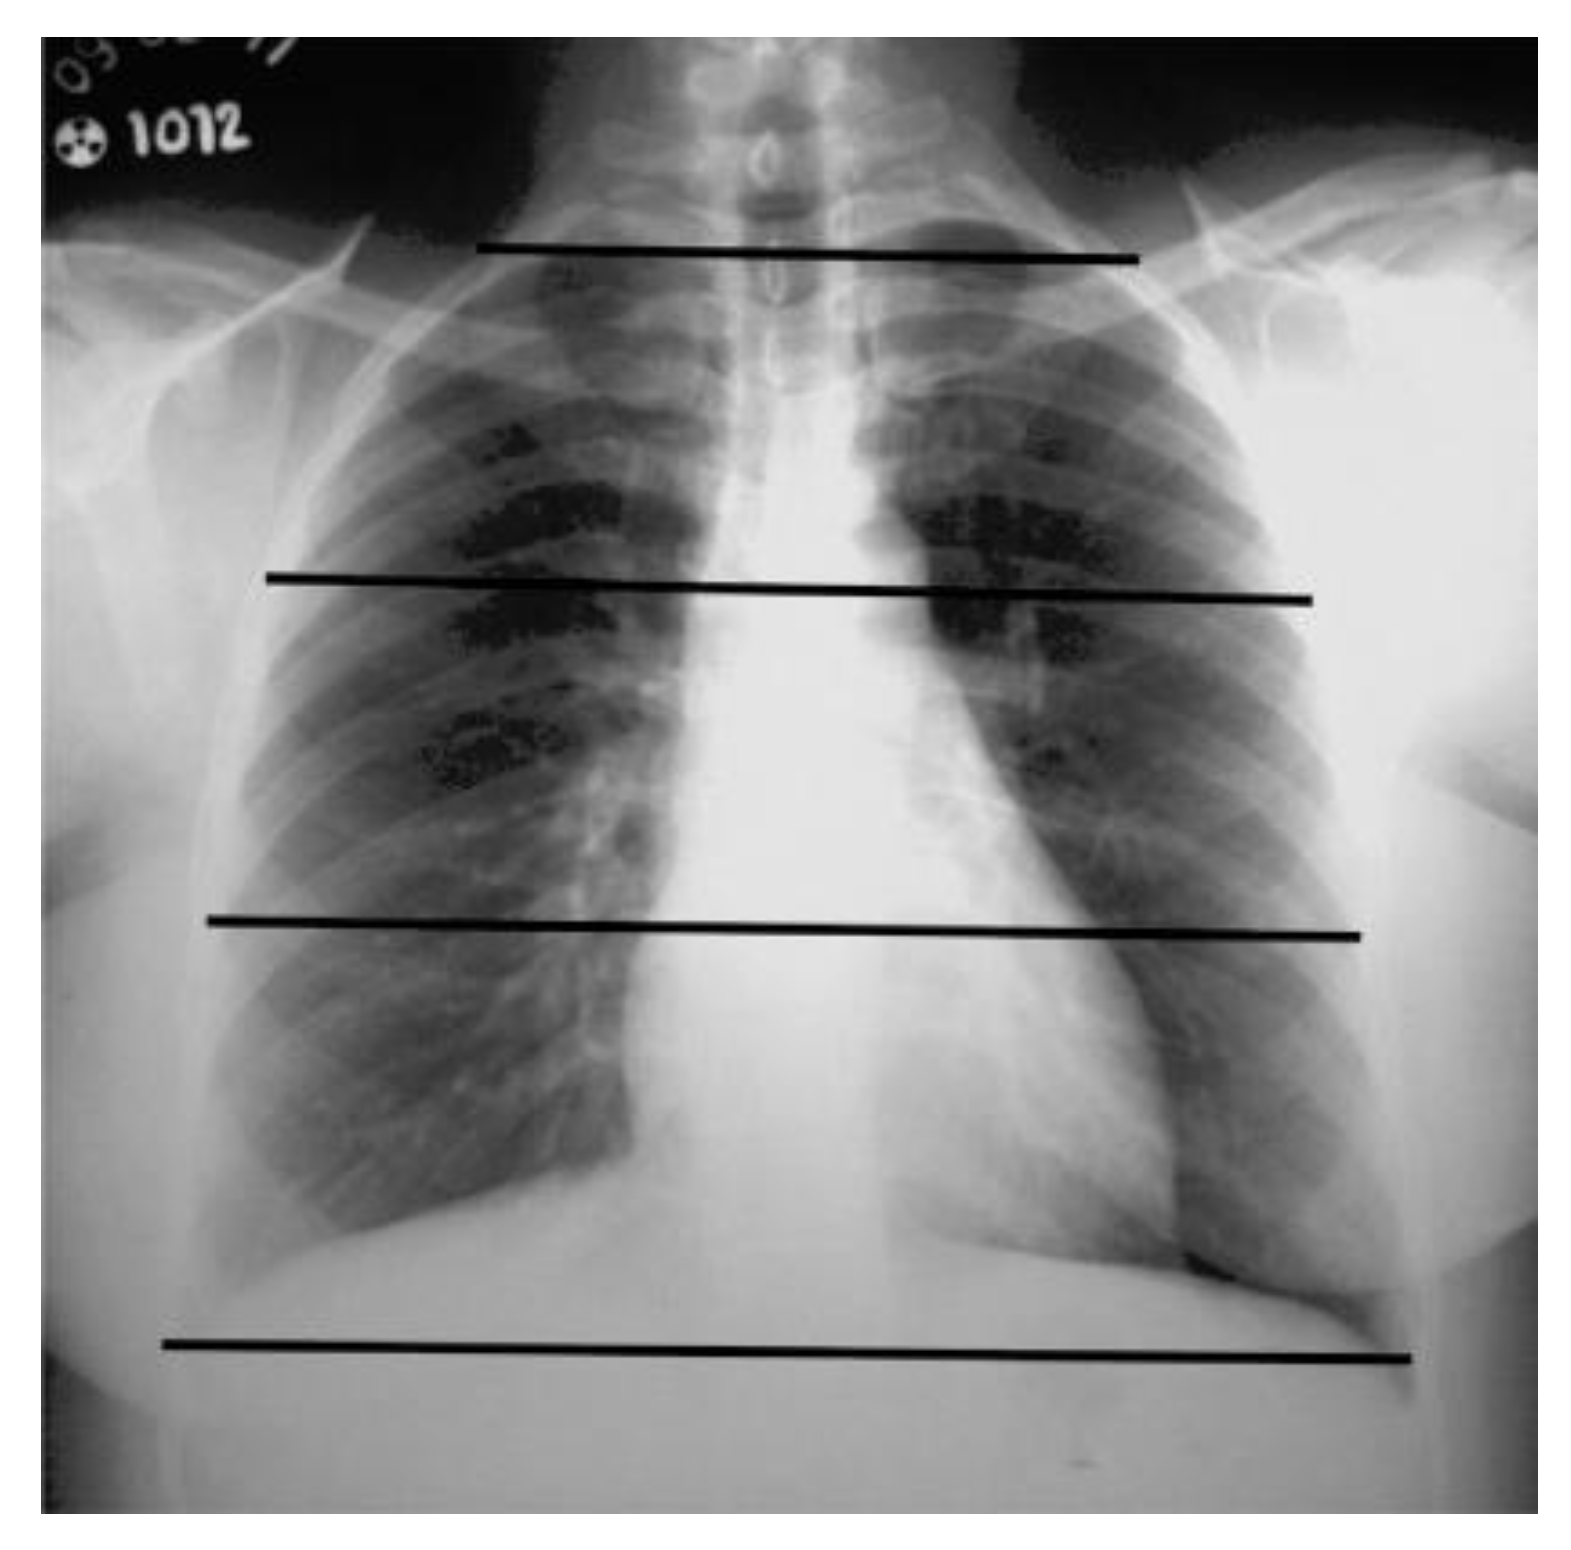

Table 1.
Clinical variables for the total sample and according to outcomes.
| Variable | Total Sample | Asymptomatic | Symptomatic | Death | p valor | ||||
|---|---|---|---|---|---|---|---|---|---|
| n | % | N | % | n | % | n | % | ||
| Age group | |||||||||
| ≥ 60 years | 35 | 54.7 | 8 | 33.3 | 8 | 44.4 | 19 | 86.4 | 0.001 |
| < 60 years | 29 | 45.3 | 16 | 66.7 | 10 | 55.6 | 3 | 13.6 | |
| Gender | |||||||||
| Male | 33 | 51.6 | 14 | 58.3 | 8 | 44.4 | 11 | 50 | 0.66 |
| Female | 31 | 48.4 | 10 | 41.7 | 10 | 55.6 | 11 | 50 | |
| Comorbidities | |||||||||
| Yes | 44 | 83 | 17 | 85 | 10 | 62.5 | 17 | 100 | 0.010 |
| No | 9 | 17 | 3 | 15 | 6 | 37.5 | 0 | 0 | |
| Diabetes mellitus | |||||||||
| Yes | 11 | 20.8 | 3 | 15 | 3 | 18.8 | 5 | 29.4 | 0.64 |
| No | 42 | 79.2 | 17 | 85 | 13 | 81.3 | 12 | 70.6 | |
| Obesity | |||||||||
| Yes | 3 | 5.7 | 1 | 5 | 1 | 6.3 | 1 | 5.9 | 0.99 |
| No | 50 | 94.3 | 19 | 95 | 15 | 93.8 | 16 | 94.1 | |
| Systemic arterial hypertension | |||||||||
| Yes | 23 | 43.4 | 7 | 35 | 6 | 37.5 | 10 | 58.8 | 0.29 |
| No | 30 | 56.6 | 13 | 65 | 10 | 62.5 | 7 | 41.2 | |
| Chronic obstructive pulmonary disease | |||||||||
| Yes | 1 | 1.9 | 0 | 0 | 0 | 0 | 1 | 5.9 | 0.62 |
| No | 52 | 98.1 | 20 | 100 | 16 | 100 | 16 | 94.1 | |
| Smoking | |||||||||
| Yes | 0 | 0 | 0 | 0 | 0 | 0 | 0 | 0 | NA |
| No | 53 | 100 | 20 | 100 | 16 | 100 | 17 | 100 | |
| Former smoking | |||||||||
| Yes | 0 | 0 | 0 | 0 | 0 | 0 | 0 | 0 | NA |
| No | 53 | 100 | 20 | 100 | 16 | 100 | 17 | 100 | |
| Classic symptoms | |||||||||
| Yes | 43 | 74.1 | 15 | 65.2 | 14 | 82.4 | 14 | 77.8 | 0.52 |
| No | 15 | 25.9 | 8 | 34.8 | 3 | 17.6 | 4 | 22.2 | |
| Mechanical ventilation | |||||||||
| Yes | 6 | 9.7 | 0 | 0 | 2 | 11.8 | 4 | 19 | 0.065 |
| No | 56 | 90.3 | 24 | 100 | 15 | 88.2 | 17 | 81 | |
| PCR result | |||||||||
| Yes | 42 | 65.6 | 14 | 58.3 | 14 | 77.8 | 14 | 63.6 | 0.41 |
| No | 22 | 34.4 | 10 | 41.7 | 4 | 22.2 | 8 | 36.4 | |
1 Chi-square test or Fisher's exact test. Significant difference between the following pairs: (a) asymptomatic vs symptomatic, (b) asymptomatic vs death, and (c) symptomatic vs death. DM: Diabetes Mellitus; COPD: Chronic Obstructive Pulmonary Disease; SAH: Systemic Arterial Hypertension. NA: not applicable.
Table 2.
Radiographic Changes vs. Outcomes.
| Variable | Total Sample | Asymptomatic | Symptomatic | Death | p valor | ||||
|---|---|---|---|---|---|---|---|---|---|
| n | % | n | % | n | % | n | % | ||
| CXR Pattern | |||||||||
| Positive | 44 | 68.8 | 18 | 75 | 10 | 55.6 | 16 | 72.7 | 0.36 |
| Negative | 20 | 31.3 | 6 | 25 | 8 | 44.4 | 6 | 27.3 | |
| Disease Extent on CXR | |||||||||
| Mild/Moderate | 20 | 42.6 | 10 | 55.6 | 2 | 20 | 8 | 42.1 | 0.21 |
| Severe | 27 | 57.4 | 8 | 44.4 | 8 | 80 | 11 | 57.9 | |
| Type 1 Opacities | |||||||||
| Yes | 18 | 37.5 | 11 | 57.9 | 3 | 30 | 4 | 21.1 | 0.056 |
| No | 30 | 62.5 | 8 | 42.1 | 7 | 70 | 15 | 78.9 | |
| Type 2 Opacities | |||||||||
| Yes | 34 | 70.8 | 10 | 52.6 | 9 | 90 | 15 | 78.9 | 0.099 |
| No | 14 | 29.2 | 9 | 47.4 | 1 | 10 | 4 | 21.1 | |
| Type 3 Opacities | |||||||||
| Yes | 18 | 37.5 | 3 | 15.8 | 6 | 60 | 9 | 47.4 | 0.028 |
| No | 30 | 62.5 | 16 | 84.2 | 4 | 40 | 10 | 52.6 | |
| Lung Involvement | |||||||||
| Unilateral | 4 | 8.5 | 3 | 16.7 | 0 | 0 | 1 | 5.3 | 0.42 |
| Bilateral | 43 | 91.5 | 15 | 83.3 | 10 | 100 | 18 | 94.7 | |
| Presence of Symmetry | |||||||||
| Symmetric | 14 | 29.8 | 5 | 27.8 | 3 | 30 | 6 | 31.6 | 0.99 |
| Asymmetric | 33 | 70.2 | 13 | 72.2 | 7 | 70 | 13 | 68.4 | |
| Transverse Axis Alterations | |||||||||
| Peripheral | 4 | 8.5 | 3 | 16.7 | 1 | 10 | 0 | 0 | 0.19 |
| Non-peripheral | 43 | 91.5 | 15 | 83.3 | 9 | 90 | 19 | 100 | |
| Longitudinal Axis Alterations | |||||||||
| Without predominance | 23 | 48.9 | 7 | 38.9 | 6 | 60 | 10 | 52.6 | 0.56 |
| With predominance | 24 | 51.1 | 11 | 61.1 | 4 | 40 | 9 | 47.4 | |
* Chi-square test or Fisher's exact test. Significant difference between the following pairs: (a) asymptomatic vs symptomatic, (b) asymptomatic vs death, and (c) symptomatic vs death.
Table 3.
Radiographic Changes vs. Presence/Absence of Comorbidities.
| Variable | Total Sample | With Comorbidities | Without Comorbidities | p valor | ||||
|---|---|---|---|---|---|---|---|---|
| n | % | n | % | n | % | |||
| CXR pattern | ||||||||
| Positive | 35 | 66 | 29 | 65.9 | 6 | 66.7 | 0.64 | |
| Negative | 18 | 34 | 15 | 34.1 | 3 | 33.3 | ||
| Disease extent on CXR | ||||||||
| Mild/Moderate | 17 | 44.7 | 13 | 40.6 | 4 | 66.7 | 0.23 | |
| Severe | 21 | 55.3 | 19 | 59.4 | 2 | 33.3 | ||
| Type 1 opacities | ||||||||
| Yes | 13 | 34.2 | 10 | 31.3 | 3 | 50 | 0.33 | |
| No | 25 | 65.8 | 22 | 68.8 | 3 | 50 | ||
| Type 2 opacities | ||||||||
| Yes | 28 | 73.7 | 23 | 71.9 | 5 | 83.3 | 0.49 | |
| No | 10 | 26.3 | 9 | 28.1 | 1 | 16.7 | ||
| Type 3 opacities | ||||||||
| Yes | 15 | 39.5 | 13 | 40.6 | 2 | 33.3 | 0.56 | |
| No | 23 | 60.5 | 19 | 59.4 | 4 | 66.7 | ||
| Lung involvement | ||||||||
| Unilateral | 3 | 7.9 | 3 | 9.4 | 0 | 0 | 0.59 | |
| Bilateral | 35 | 92.1 | 29 | 90.6 | 6 | 100 | ||
| Presence of symmetry | ||||||||
| Symmetric | 11 | 28.9 | 7 | 21.9 | 4 | 66.7 | 0.046 | |
| Asymmetric | 27 | 71.1 | 25 | 78.1 | 2 | 33.3 | ||
| Transverse axis alterations | ||||||||
| Peripheral | 4 | 10.5 | 4 | 12.5 | 0 | 0 | 0.49 | |
| Non-peripheral | 34 | 89.5 | 28 | 87.5 | 6 | 100 | ||
| Longitudinal axis alterations | ||||||||
| Without predominance | 18 | 47.4 | 15 | 46.9 | 3 | 50 | 0.62 | |
| With predominance | 20 | 52.6 | 17 | 53.1 | 3 | 50 | ||
* Fisher's exact test.
Table 4.
Descriptive statistics of age (in years) for the total sample and by outcome.
| Sample | n | mean | SD | Median | IQR | Minimum | Maximum |
|---|---|---|---|---|---|---|---|
| Total | 64 | 58.3 | 18.7 | 62 | 41 - 73 | 19 | 96 |
| Asymptomatic | 24 | 50.8 | 18.4 | 50 | 36 – 70 | 25 | 84 |
| Symptomatic | 18 | 55 | 18.8 | 58 | 39 – 70 | 19 | 96 |
| Death | 22 | 69 | 14.1 | 73 | 63 – 77 | 25 | 91 |
| Alive | 42 | 52.6 | 18.5 | 52 | 37 - 70 | 19 | 96 |
Disclaimer/Publisher’s Note: The statements, opinions and data contained in all publications are solely those of the individual author(s) and contributor(s) and not of MDPI and/or the editor(s). MDPI and/or the editor(s) disclaim responsibility for any injury to people or property resulting from any ideas, methods, instructions or products referred to in the content. |
© 2025 by the authors. Licensee MDPI, Basel, Switzerland. This article is an open access article distributed under the terms and conditions of the Creative Commons Attribution (CC BY) license (http://creativecommons.org/licenses/by/4.0/).
Copyright: This open access article is published under a Creative Commons CC BY 4.0 license, which permit the free download, distribution, and reuse, provided that the author and preprint are cited in any reuse.


